designing data marts for data warehouses - perso.liris.cnrs.fr · the design of the data mart...
TRANSCRIPT

Designing Data Marts for DataWarehouses
ANGELA BONIFATIPolitecnico di MilanoFABIANO CATTANEOCefrielSTEFANO CERIPolitecnico di MilanoALFONSO FUGGETTAPolitecnico di Milano and CefrielandSTEFANO PARABOSCHIPolitecnico di Milano
Data warehouses are databases devoted to analytical processing. They are used to supportdecision-making activities in most modern business settings, when complex data sets have tobe studied and analyzed. The technology for analytical processing assumes that data arepresented in the form of simple data marts, consisting of a well-identified collection of factsand data analysis dimensions (star schema). Despite the wide diffusion of data warehousetechnology and concepts, we still miss methods that help and guide the designer in identifyingand extracting such data marts out of an enterprisewide information system, covering theupstream, requirement-driven stages of the design process. Many existing methods and toolssupport the activities related to the efficient implementation of data marts on top ofspecialized technology (such as the ROLAP or MOLAP data servers). This paper presents amethod to support the identification and design of data marts. The method is based on threebasic steps. A first top-down step makes it possible to elicit and consolidate user requirementsand expectations. This is accomplished by exploiting a goal-oriented process based on theGoal/Question/Metric paradigm developed at the University of Maryland. Ideal data marts arederived from user requirements. The second bottom-up step extracts candidate data marts
The editorial processing for this paper was managed by Axel van Lamsweerde.Authors’ addresses: A. Bonifati, Politecnico di Milano, Piazza Leonardo da Vinci 32, I-20133Milano, Italy; email: [email protected]; F. Cattaneo, Cefriel, Via Fucini 2, I-20133 Milano,Italy; email: [email protected]; S. Ceri, Politecnico di Milano, Piazza Leonardo da Vinci 32,I-20133 Milano, Italy; email: [email protected]; A. Fuggetta, Politecnico di Milano andCefriel, Piazza Leonardo da Vinci 32, I-20133 Milano, Italy; email: [email protected]; S.Paraboschi, Politecnico di Milano, Piazza Leonardo da Vinci 32, I-20133 Milano, Italy; email:[email protected] to make digital / hard copy of part or all of this work for personal or classroom useis granted without fee provided that the copies are not made or distributed for profit orcommercial advantage, the copyright notice, the title of the publication, and its date appear,and notice is given that copying is by permission of the ACM, Inc. To copy otherwise, torepublish, to post on servers, or to redistribute to lists, requires prior specific permissionand / or a fee.© 2001 ACM 1049-331X/01/1000–0452 $5.00
ACM Transactions on Software Engineering and Methodology, Vol. 10, No. 4, October 2001, Pages 452–483.

from the conceptual schema of the information system. The final step compares ideal andcandidate data marts to derive a collection of data marts that are supported by the underlyinginformation system and maximally satisfy user requirements. The method presented in thispaper has been validated in a real industrial case study concerning the business processes of alarge telecommunications company.
Categories and Subject Descriptors: D.2 [Software]: Software Engineering; D.2.1 [SoftwareEngineering]: Requirements/Specifications—Methodologies (e.g., object-oriented, structured);D.2.2 [Software Engineering]: Design Tools and Techniques
General Terms: Design, Management
Additional Key Words and Phrases: Data warehouse, data mart, design method, conceptualmodeling, software quality management
1. INTRODUCTIONData warehouses are becoming an important asset of any modern businessenterprise, with classical applications in business planning and strategicanalysis. For example, sales departments use data warehouses to study thebuying profiles of their customers and decide their commercial and distri-bution strategies accordingly. The data warehouse component is a databasebuilt for analytical processing whose primary objective is to maintain andanalyze historical data.
In order to standardize data analysis and enable simplified usage pat-terns, data warehouses are normally organized as problem-driven, smallunits, called “data marts”; each data mart is dedicated to the study of aspecific problem. The data organization of a data mart, called a starschema, is very simple: the data being analyzed, or facts, constitute thestar’s center; around the center, other data describe the dimensions alongwhich data analysis can be performed. In the archetypical case, facts arethe sales of an organization, and dimensions enable the analysis byproduct, customer, point of sale, time of sale, and so on. In simplewarehouses, data marts may extract their content directly from operationaldatabases; in complex situations, the data warehouse architecture may bemultilevel, and the data mart content may be loaded from intermediaterepositories, often denoted as “operational data stores.”
This paper is concerned with the design of data marts starting from aconceptual description of the enterprisewide information system, or at leastof the schema fragment which is relevant for the data mart design. In ourexperience, many large organizations do have such a conceptual descrip-tion, because even before the development of data warehouses, an inte-grated schema is developed to enhance data interoperability at the opera-tional level. If an operational data store is available, we consider itsconceptual description.
Despite the existence of several methods and tools addressing the prob-lems related to the physical implementation of the data mart, or to thestatistical manipulation of its data, little attention has instead been paid tothe design of the data mart schema, probably assuming that the conceptual
Designing Data Marts for Data Warehouses • 453
ACM Transactions on Software Engineering and Methodology, Vol. 10, No. 4, October 2001.

simplicity of such a schema would make this phase a trivial problem.Actually, the definition of the schema is one of the most critical steps in theoverall data warehouse development process, and there are several ques-tions that must be correctly answered in order to adequately capture userrequirements and build an effective warehouse. A few of these questionsare: What are the data to be collected to address the business needs? Howmany dimensions should be present in order to facilitate their analysis?What is the level of granularity of the data to be stored in the data mart? Inpractice, these questions are approached nowadays by relying on theexperience of the designer.
This paper presents a method for identifying and building data marts.The basic principle underlying the proposed approach is that the design ofdata marts should be driven by the business needs that each data mart isexpected to address. As a consequence, the data mart design process mustbe based on a deep understanding of the users’ expectations.
The method proposed in this paper consists of three basic steps: top-downanalysis, bottom-up analysis, and integration. This method takes advan-tage of the two complementary perspectives of data mart design: top-downanalysis emphasizes the user requirements, while bottom-up analysisbrings to the surface the semantics of the existing operational databases.The final step integrates these two viewpoints, and thus generates afeasible solution (i.e., supported by the existing data sources) that bestreflects the user’s goal.
—In the first step, user requirements are collected through interviews. Thepurpose of interviews is to gather information from business analystsand/or managers about the company goals and needs. This is accom-plished by expressing user expectations through the Goal/Question/Metrics paradigm [Basili et al. 1994]. The goals obtained are aggregatedand refined, until a small number of goals subsume all the collectedinformation. Eventually, each aggregated goal is specified by means of anabstraction sheet, which expresses the goal characteristics in great detail.From abstraction sheets, it is possible to extract the specifications ofideal star schemas, i.e., fragments of the conceptual schema of the datawarehouse that reflect the user requirements in a way independent of theavailability of the underlying data. This phase is focused on the analysisof functional requirements, which correspond to entities in the concep-tual modeling. Other nonfunctional requirements, such as cost, perfor-mance, reliability, maintainability, and robustness of the software sys-tem, for example, are not considered, since they are mostly relevant tomeasure the quality of the system, but not to guide the abstract task ofconceptual design.
—The second step of the proposed method is devoted to examining theconceptual model of the operational databases, finding out candidate starschemas for the data warehouse. The approach is based on an exhaustivegraph analysis technique that exploits an entity-relationship representa-tion of the conceptual schema of the operational databases: from this
454 • A. Bonifati et al.
ACM Transactions on Software Engineering and Methodology, Vol. 10, No. 4, October 2001.

analysis, the candidate star schemas are structured as an aggregation ofdata around “additive” data items. Therefore, this step constitutes a sortof bottom-up approach to the definition of all the possible data marts.Although this step can generate a large number of candidates, theanalysis can be executed in a fully automatic manner.
—The third step matches each ideal star schema determined by the firststep with all the candidate star schemas produced by the second step,and ranks them according to a set of metrics. Then, it is the designer’sresponsibility to choose the candidates that best fit the ideal schema.
The proposed design method has been conceived and then validatedthrough real industrial experiments conducted by the authors during thepast couple of years. In particular, in this paper we will consider theprocesses related to service assurance, service delivery, and network cre-ation of a large telecommunications company. The main needs of theprocess owners are to study and analyze cost, duration, effort, performance,and quality perceived by customers.
The paper is organized in eight sections. Section 2 relates the proposedapproach to the state of the art in the field. Section 3 provides a briefpresentation of the case study that will be used in the paper to illustrateand discuss the different steps in the method. Section 4 discusses thetop-down phase by which an ideal star schema is derived from users’requirements. Section 5 introduces the analysis techniques used to extractcandidate star schemas from the operational database schema. Section 6presents the integration of the two techniques to derive the best-fit datamarts. Section 7 gives a summary description of the proposed method.Finally, Section 8 draws some conclusions and outlines future researchwork.
2. STATE OF THE ART IN DATA WAREHOUSE DESIGN
2.1 Basic Concepts in Data Warehouse Technology
Operational databases offer an integrated view of the application, so thateach entity of the real world is mapped to exactly one concept of theschema. Therefore, a complex reality is associated to complex schemas,which aim at capturing the complexity of the application domain. Schemasare often represented at an abstract level through an entity-relationshipdata model.
In contrast, data warehouses often master the complexity by offering avision where data are split in a number of simple schemas, called datamarts, each one specialized for a particular analysis activity. Each datamart, in turn, represents data by means of a star schema, consisting of alarge fact table as center and a set of smaller dimension tables placed in aradial pattern around the fact. The fact table contains numerical oradditive measurements used to compute quantitative answers about thebusiness. The dimension tables give the complete descriptions of thedimensions of the business.
Designing Data Marts for Data Warehouses • 455
ACM Transactions on Software Engineering and Methodology, Vol. 10, No. 4, October 2001.

Each fact table has a primary key that is composed of the keys of all thedimensions; this establishes a one-to-many mapping from each dimensiontuple to the (many) fact tuples which share the same value as thedimension’s key. Furthermore, in a star schema the fact table is at least inBoyce-Codd normal form, while the dimension tables are not normalized.Therefore, data inside a dimension may be functionally dependent on otherdata, and thus redundant. By applying the classical normalization process,each dimension may be turned into a hierarchy of tables, with a one-to-many mapping for each functional decomposition. This yields a morecomplex schema, called a snowflake schema, where each normalized dimen-sion corresponds to a hierarchy of tables. This approach makes it possibleto reduce data replication, but the schema is slightly more complicatedthan the pure star schema.
Data marts can be simple because each of them is focused on a singleaspect over the operational data [Kimball 1996]. Suitable mechanisms(called replication managers) populate the data marts from the operationaldatabases. Therefore, there can be multiple, possibly overlapping, datamarts over the same operational data; this situation may be efficientlymanaged by hierarchical warehouse architectures, in which data are ini-tially loaded into an operational data store and subsequently loaded intodata marts. The arbitrarily complex semantic relationships among data aremanaged at the operational level, while they are reduced to much simplerabstractions at the data warehouse level. The data warehouse schemadesign problem consists then in determining a suitable collection of starschemas (or, with slightly higher complexity, of snowflake schemas) thatenable the analysis activity and can be efficiently supported by the schemaof the operational database.
To assess the feasibility of implementing a data warehouse schema ontop of a specific operational database, it is necessary to study the underly-ing database and check whether the data required to create the datawarehouse are indeed available. This means that there must be somedescription of the schema of the operational database, possibly expressedthrough an entity-relationship diagram; this is the only prerequisite to theapplicability of our method. When the operational database is implementedacross several independent legacy systems, determining an integratedentity-relationship schema of its contents may indeed be difficult. Tradi-tional techniques of view integration and of reverse engineering can beapplied to this purpose (see, for example, Batini and Lenzerini [1984] andFrancalanci and Fuggetta [1997]); these are outside of the scope of thispaper.
2.2 Related Work
An overview of current data warehousing and OLAP technology and relatedresearch issues on multidimensional databases can be found in severalarticles and books [Chaudhuri and Dayal 1997; Inmon 1996; Jarke et al.1999; Kimball 1996; Widom 1995]. A comprehensive on-line bibliography on
456 • A. Bonifati et al.
ACM Transactions on Software Engineering and Methodology, Vol. 10, No. 4, October 2001.

this subject has been published by Mendelzon (available via http://www.cs.toronto.edu/˜mendel/dwbib.html).
An influential book, particularly from the practitioners’ viewpoint, isKimball [1996], which discusses the major issues arising in the design andimplementation of data warehouses. The book presents a case-based ap-proach to data mart design and suggests that each data mart should beindependently designed. The design process emphasizes the crucial impor-tance of interviewing the end users: the interviews introduce the datawarehouse team to the company’s core business and deepen the datawarehouse designer’s understanding of users’ expectations. Furthermore,the book discusses the suitability of mixing end-user interviews withdatabase administrator interviews, in order to collect information about thefeasibility and costs related to the gathering of data which are needed tomeet each of these expectations. Therefore, the book sets up a generalframework that is consistent with our method and that we found applicablein concrete experiences.
A significant amount of research in the database community has beendedicated to the physical and logical design of data warehouses. Some ofthe proposed approaches are related to the integration of heterogeneoussources and the selection of materialized views. Other approaches deal withextending the multidimensional data model [Calvanese et al. 1998a; 1998b;Ezeife 1997; Garcia-Molina et al. 1998; Gupta and Mumick 1999; Hari-narayan et al. 1996; Lehner 1998; Theodoratos and Sellis 1998; 1999;Wiener et al. 1997]. However, the issue of conceptual schema design isconsidered only in few recent works. A framework for multidimensionaldatabase design has been proposed by Agrawal et al. [1997], outlining adata model based on one or more hypercubes and a set of basic operationsdesigned to operate on it. A Multi-Dimensional Data Model has beendeveloped by Gyssens and Lakshmanan [1997], which aims at identifying aconceptual model and query language to support OLAP functionalities, i.e.,querying, restructuring, classification and summarization. Theodoratosand Sellis [1999] proposed a theoretical framework for the logical andphysical design problem. The approach is structured as a state searchproblem. In particular, the data warehouse is defined by selecting a set ofviews that fit the space available to the data warehouse, and minimize thetotal query evaluation and view maintenance cost.
An overall approach to modeling, design, implementation, and optimiza-tion of data warehouses has been developed as part of the “Foundations onData Warehouse Quality” (DWQ) research project and condensed in a book[Jarke et al. 1999]. In particular, the design method is based on thedevelopment of a Conceptual Data Warehouse Data Model (CDWDM),which describes the relevant aggregated entities and dimensions of thedomain [Franconi and Sattler 1999]. The CDWDM is able to capture thedatabase schemas expressed in the Extended Entity Relationship DataModel and is based on Description Logics, offering reasoning services, e.g.,implicit taxonomic links between entities. The final aim of that approach isto provide an extended modeling formalism. Our approach does not target
Designing Data Marts for Data Warehouses • 457
ACM Transactions on Software Engineering and Methodology, Vol. 10, No. 4, October 2001.

the formalization problem and is tailored to give methodological guidancespecifically focused on data mart identification; hence we see the twoapproaches as complementary.
In general, we found very few contributions in the literature specificallyconcerned with data mart design. The approaches presented in Cabibboand Torlone [1998] and Golfarelli et al. [1998] are perhaps the closest toours, in particular as far as the bottom-up phase of our method is con-cerned.
—Cabibbo and Torlone [1998] illustrate a method for developing datamarts out of conceptual operational schemas. Data marts are based ongraphs entailing F-tables, i.e., tables that serve as abstract implementa-tion of both relational databases and multidimensional arrays. Theproposed design method builds an MD scheme starting from an underly-ing operational database, where an MD scheme consists of a finite set ofdimensions, a finite set of F-tables, and a finite set of level descriptions ofthe dimensions. MD schemes are obtained through four steps: identifica-tion of facts and dimensions, restructuring of the entity-relationshipschema, derivation of a dimensional graph, and finally, translation intothe MD model, singling out the F-tables, i.e., combinations of dimensionlevels with the chosen fact node.
—Similarly, Golfarelli et al. [1998] propose a methodology for the transfor-mation of an entity-relationship schema in a tree-structured fact schema.This model represents the fact as the tree’s root and the dimensionattributes as the tree’s descendants. A query pattern corresponds to a setof markers placed on the tree nodes, and in each hierarchy, the markersindicate at which level fact instances must be aggregated.
Both above contributions are concerned with the investigation of datawarehouse conceptual design starting from the underlying operationalschemas (bottom-up phase). Still, they do not integrate this design phasewith a goal-driven analysis of user requirements (top-down phase). Inaddition, they identify a single “solution,” while our approach provides thedesigner with a set of ranked solutions.
There is a specific approach that exploits the GQM method to supportdata warehouse evaluation [Vassiliadi et al. 1999]. This approach exploitsGQM to identify the factors and metrics that make it possible to evaluatethe quality of a data warehouse, once it has been developed. Our approachuses GQM for making explicit user requirements in the upstream stage ofthe data warehouse design activity. Hence, the focus and final objective ofthe two contributions are different, even if both of them are based on thesame methodological approach (i.e., GQM).
As a final observation, it is important to clarify the relationship betweenour approach (based on GQM) and other goal-oriented techniques devel-oped in the past. Certainly, goal orientation has demonstrated to beparticularly effective in eliciting and structuring requirements [Anton andPotts 1998]. Consequently, several goal-oriented languages and methods
458 • A. Bonifati et al.
ACM Transactions on Software Engineering and Methodology, Vol. 10, No. 4, October 2001.

have been developed and applied in practice. The goal orientation of theseapproaches is justified and motivated by the nature of the information thatneeds to be described, i.e., the expectations that users have on the function-ality of the software system to be developed. For instance, KAOS [Darimontet al. 1997] makes it possible to describe “goals” and their relationshipswith actions, events, and constraints that characterize the applicationdomain being observed from a functional viewpoint. GQM is used todescribe different kinds of goals, i.e., those related to the evaluation of thequality aspects of the entity being observed. GQM is strongly oriented tosimplifying the process by which generic goals concerning an assessmentand evaluation activity are translated and articulated in specific qualityfactors and evaluation criteria. Therefore, even if these approaches are allbased on the same concept (i.e., goal orientation), they are structured andused for different purposes.
With respect to the method proposed in this paper, a possible replace-ment of GQM as a goal representation technique is the approach proposedby Mylopoulos et al. [1992]. The authors propose a formal technique tostructure nonfunctional requirements as a hierarchy of goals. Goals arerelated through different types of links such as AND/OR, goal inclusion,and positive/negative influences between goals. In our work, this approachcould have been used as an alternative to GQM, since it could be used toorganize the quality and variation factors of a GQM abstraction sheet. Weargue, however, that for our purposes GQM makes it simpler to elicitquantitative business aspects and to convert them into data mart schema,as will be illustrated in Section 4.
3. A MOTIVATING CASE STUDY
In this paper we will use an example derived from a real industrialexperiment carried out by the authors. The main needs of the companywere to study and analyze cost, duration, effort, performance, and qualityof significant company processes as perceived by customers. In particular,the company was interested in analyzing service assurance (“is the reliabil-ity and maintenance of the network coherent with the company goals?”),service delivery (“are customers’ requests correctly managed?”), and net-work creation (“is the deployment of new services and infrastructuresaccomplished according to the company’s strategic objectives?”).
The company has two main divisions, each one devoted to a specific classof customers (i.e., business and residential). Each division is geographicallystructured on multiple levels (region, subregion, small city, or part of amajor city). At the lowest level, each unit is composed of a maintenancework center, responsible for the maintenance process and deploymentactivities of the network resources located in its territory. The companycomprises around 200 work centers. Typically, a work center employsaround 50 technicians. Overall, this is a rich and complex environment,characterized by a great amount of data and a complex operational data-base schema. The data warehouse built for the case study eventually
Designing Data Marts for Data Warehouses • 459
ACM Transactions on Software Engineering and Methodology, Vol. 10, No. 4, October 2001.

includes a fact table and some dimension tables containing several millionsof tuples.1
Overall, the complete schema of the operational database used formanaging work centers amounts to several hundred entities and relation-ships, and a few thousand attributes. However, it was possible to single out“auxiliary tables,” supporting applications and not really related to storingpersistent data. In this way, we produced a more manageable conceptualschema, consisting of about 100 entities and relationships.
The data warehouse design project was carried out by a joint teamcomposed of the authors (acting as consultants and methodologists) and agroup of people from the Information Systems Department of the company.The project was conducted as part of a companywide initiative aiming tocreate new decision support systems for different management levels in theorganization. Eventually, the results of our activity have been turned into anew support system that is currently used throughout the company.
4. THE TOP-DOWN PHASE
The top-down phase of the data warehouse design method presented in thispaper is based on the GQM paradigm [Basili et al. 1994]. GQM has beendeveloped at the University of Maryland as a systematic approach for thedevelopment and exploitation of a software measurement program, i.e., aset of metrics and related procedures that provide a quantitative evalua-tion of a specific phenomenon concerning software development [Fuggettaet al. 1998]. The basic principle underlying GQM is that there is nouniversal measurement program that can fit any situation or measurementgoal. Rather, the metrics and the related procedures must be defined bycarefully considering the specific characteristics of the measurement prob-lem being addressed.
As discussed in the introduction, there are several similarities betweendesigning a data warehouse and creating a measurement program. For thisreason, we have borrowed and adapted several GQM ideas and concepts tocreate our data warehouse design method. The rest of the section illus-trates GQM main concepts and how they have been used in our approach.
4.1 A Quick Overview of GQM
GQM is composed of a process model, and a set of forms and guidelines. Theprocess model identifies the different activities that have to be carried outto create and operate a measurement program. The process starts byidentifying the context (i.e., the characteristics of the software factory)
2For the sake of precision, in this case we realized that the financial data are stored in adatabase that is under the control of a different division of the company. Therefore, theintegration of this information, even if certainly feasible from a technical viewpoint, wasconsidered too complicated at that stage of the project for organizational reasons.1The conceptual schema of the operational database was available as part of the company’sassets prior to the begin of the study and was made available to us as a collection of ERsubschemas created and managed through Cayenne Software Inc.’s GroundWorks.
460 • A. Bonifati et al.
ACM Transactions on Software Engineering and Methodology, Vol. 10, No. 4, October 2001.

where the measurement program has to be established. The next step is theidentification of the goals of the measurement activity. This is accom-plished by filling up two forms for each goal being identified.
(1) The first form is used to formulate the goal in abstract terms (goaldefinition). In particular, each goal is described through the followinginformation:—Object of study: the part of reality that is being observed and
studied.—Purpose: the motivations for studying the object.—Quality focus: the object characteristics that are considered in the
study.—Viewpoint: the person or group of people interested in studying the
object.—Environment: the application context where the study is carried
out.
(2) The second form (called abstraction sheet) is then used to enrich thegoal definition with more detailed information. In particular, the qual-ity focus is further refined by identifying the specific characteristics tobe observed and the related attributes. The additional information isprovided to identify the variation factors that might affect the identi-fied quality characteristics. Finally, the abstraction sheet lists thebaseline hypotheses of the organization about the quality factors beingobserved (i.e., the “values” of the metrics that people have in theirmind) and the estimated effect that variation factors might have on thebaseline hypotheses.
Once goals have been reasonably formulated, they are compared andassessed. This may lead to collapse different goals that overlap, to elimi-nate goals that are not considered important or relevant, and to sort outthe remaining goals according to some priority or criticality factor. All theactivities from the initial formulation of goals to the final consolidation ofthe relevant ones are accomplished by interacting with the different peopleinvolved in the process being observed.
The portion of the GQM process that has been described so far consti-tutes the core of the top-down approach presented in this paper. GQMincludes other phases for defining, collecting, and analyzing measures thatcan be used for validating goals. In the remainder of this section we willillustrate a revised GQM process and how we have applied it to the casestudy introduced in Section 3.
4.2 Goal Identification
The starting point in the adaptation of GQM to our problem is theconsideration that data warehouse design is a goal-driven process. For thisreason we use the goal definition forms of GQM to explicitly state thedifferent goals that people have in their mind about the data warehouse tobe developed.
Designing Data Marts for Data Warehouses • 461
ACM Transactions on Software Engineering and Methodology, Vol. 10, No. 4, October 2001.
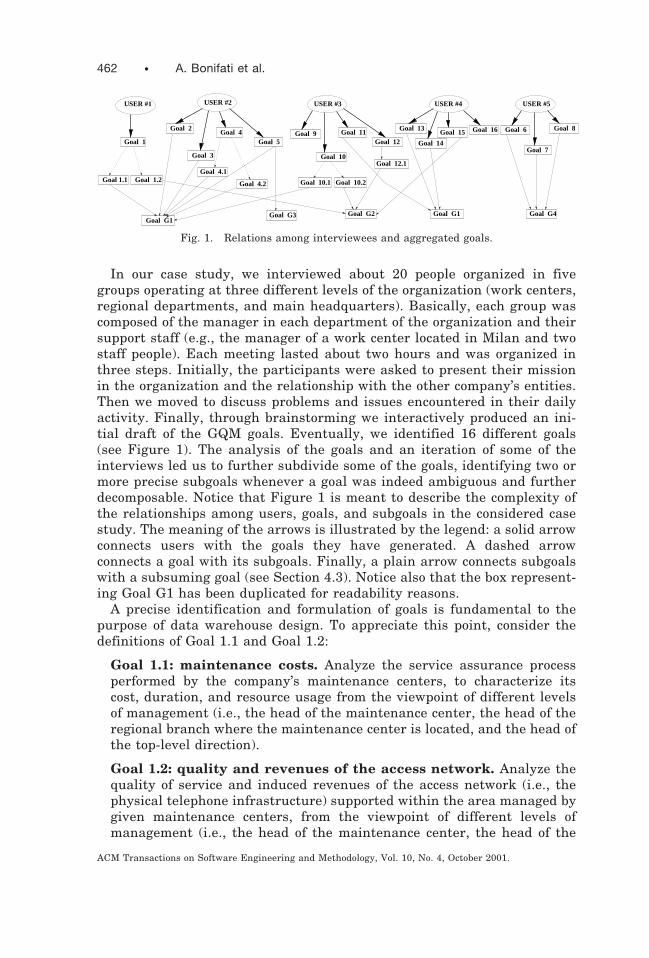
In our case study, we interviewed about 20 people organized in fivegroups operating at three different levels of the organization (work centers,regional departments, and main headquarters). Basically, each group wascomposed of the manager in each department of the organization and theirsupport staff (e.g., the manager of a work center located in Milan and twostaff people). Each meeting lasted about two hours and was organized inthree steps. Initially, the participants were asked to present their missionin the organization and the relationship with the other company’s entities.Then we moved to discuss problems and issues encountered in their dailyactivity. Finally, through brainstorming we interactively produced an ini-tial draft of the GQM goals. Eventually, we identified 16 different goals(see Figure 1). The analysis of the goals and an iteration of some of theinterviews led us to further subdivide some of the goals, identifying two ormore precise subgoals whenever a goal was indeed ambiguous and furtherdecomposable. Notice that Figure 1 is meant to describe the complexity ofthe relationships among users, goals, and subgoals in the considered casestudy. The meaning of the arrows is illustrated by the legend: a solid arrowconnects users with the goals they have generated. A dashed arrowconnects a goal with its subgoals. Finally, a plain arrow connects subgoalswith a subsuming goal (see Section 4.3). Notice also that the box represent-ing Goal G1 has been duplicated for readability reasons.
A precise identification and formulation of goals is fundamental to thepurpose of data warehouse design. To appreciate this point, consider thedefinitions of Goal 1.1 and Goal 1.2:
Goal 1.1: maintenance costs. Analyze the service assurance processperformed by the company’s maintenance centers, to characterize itscost, duration, and resource usage from the viewpoint of different levelsof management (i.e., the head of the maintenance center, the head of theregional branch where the maintenance center is located, and the head ofthe top-level direction).
Goal 1.2: quality and revenues of the access network. Analyze thequality of service and induced revenues of the access network (i.e., thephysical telephone infrastructure) supported within the area managed bygiven maintenance centers, from the viewpoint of different levels ofmanagement (i.e., the head of the maintenance center, the head of the
Goal 1
Goal 1.1 Goal 1.2
Goal 2Goal 4
Goal 5
Goal G3
Goal 9
Goal 10
Goal 11 Goal 6
Goal G4
Goal 8Goal 16
Goal G1
USER #1 USER #4 USER #5USER #2 USER #3
Goal 7Goal 12
Goal 10.1
Goal 15Goal 13
Goal 14
Goal 12.1
Goal G1
Goal 4.2
Goal 4.1
Goal 3
Goal 10.2
Goal G2
Fig. 1. Relations among interviewees and aggregated goals.
462 • A. Bonifati et al.
ACM Transactions on Software Engineering and Methodology, Vol. 10, No. 4, October 2001.
regional branch where the maintenance center is located, and the head ofthe top-level direction).
These two goals apply to the same context, i.e., a single maintenancecenter and the portion of the access network under its direct control. Theviewpoints are somehow similar. The real different factors are the object ofstudy and the quality focus. In the first goal, the focus is on studying cost,duration, and effort related to the service assurance process. In the secondgoal, the focus is on studying the portion of the access network under thecontrol of a maintenance center, to understand the relationship betweenquality of service and revenues for that geographic region.
As a general comment, we stress the importance of iterating on goals’definition until they become clear in all their aspects. Notice that the abovetwo goals were originated by the same person. At the beginning of theinterview, he expressed just a generic requirement about understandingcosts and revenues. Only by formalizing the goals we realized that inreality there were different expectations and criticalities to be addressed.
4.3 Goal Integration
The subsequent step is the analysis of similarities and implications be-tween goals, in order to reduce the number of identified goals to amanageable number. This result is achieved by suppressing goals that aresubsumed by other goals and by merging related goals. Let us considersome further examples. Goal 12.1 was identified by interviewing a poten-tial user of the data warehouse.
Goal 12.1: preventive maintenance. Analyze the access network tocharacterize the failure rate of network devices from the viewpoint of themanager of the regional branch and within the context of a singlemaintenance center.
This is a subgoal of Goal 1.2, since it aims at characterizing one aspect ofthe quality of service (failure rate) from the viewpoint of one of themanagers indicated in Goal 1.2 (the manager of the regional branch).Therefore, we can suppress Goal 12.1, and note that it is subsumed by Goal1.2.
As an additional example of goal formulation and restructuring, let usconsider now a goal derived from interviewing a third potential user of thedata warehouse:
Goal 9: perceived quality. Analyze the service assurance process tocharacterize the perceived quality from the viewpoint of the manager of amaintenance center and within the context of the same center.
This goal can be joined with Goal 1.1. Actually they are both related toproperties of the maintenance service process. Goal 9 focuses on theperceived quality, i.e., the quality of the service as perceived by the enduser, while Goal 1.1 considers other attributes of the maintenance processsuch as duration and cost of an intervention in field. Therefore, Goal 1.1
Designing Data Marts for Data Warehouses • 463
ACM Transactions on Software Engineering and Methodology, Vol. 10, No. 4, October 2001.

can encompass Goal 9 once we add perceived quality as a property of theservice process.
Application of goal integration, in our case, identified four goals, labeledin Figure 1 as goals G1, G2, G3, and G4, that summarize and subsume allother goals:
Goal G1: costs and quality for maintenance centers. Analyze costand quality factors, under direct control of maintenance centers, relativeto the processes of service assurance, service delivery, and networkcreation from the viewpoints of the managers of maintenance centers, ofregional branches, and of the top-level direction of the company.
Goal G2: incomes for maintenance centers. Analyze the income,under direct control of maintenance centers, relative to the processes ofservice delivery from the viewpoints of the managers of maintenancecenters, of regional branches, and of the top-level direction of the com-pany.
Goal G3: telephone traffic’s income and quality of services formaintenance centers. Analyze the access network, under direct controlof maintenance centers, for the purpose of characterizing the telephonetraffic’s income and the quality of the provided service, from the view-points of the managers of maintenance centers, of regional branches, andof the top-level direction of the company.
Goal G4: costs, use, and income for the top-level direction. Analyzethe access network, under direct control of maintenance centers, for thepurpose of characterizing the costs, use, and incomes, from the viewpointof the top-level direction of the company.
Due to space reason, in the remainder of the paper we will focus on goalG1 only.
4.4 Goal Analysis
The simple goal definition scheme used in the previous section is ofteninsufficient to properly describe a goal. In many situations, the comparisonof two goals can be accomplished only if they are described at a finer levelof detail. Most importantly, we need to analyze goals in a more detailedway to elicit the information needed to produce the ideal star schemas. Forthis reason, we collect additional information on the nature of goals anduse it to fill up GQM abstraction sheets. This additional information is onceagain elicited by carefully considering users’ answers and observationsduring the interviews. As discussed in the remainder of this section,abstraction sheets turned out to be essential in the process of translating aperceived goal into the facts and dimensions of an ideal star schema.
Table I shows the abstraction sheet for Goal G1. The upper-left part ofthe sheet contains a detailed description of the quality focus, i.e., thecharacteristics of the object of study that we want to refine. For instance, inTable I the quality focus concerns the different relevant properties and
464 • A. Bonifati et al.
ACM Transactions on Software Engineering and Methodology, Vol. 10, No. 4, October 2001.

Table I. Abstraction Sheet for Goal G1
Object of Study Purpose Quality Focus Viewpoint Environment
Processes ofservice,assurance,service,delivery, andnetworkcreation
To characterize Cost, duration,resource use,performance,quality forcustomer
Maintenancecenter manager,regional branchmanager, top-level directionmanager
Activitiesdeveloped by themaintenancecenter
Quality Focus Variation Factor
How can quality focus be detailed? What factors can influence quality focus?
QF1. Cost (all the processes) VF1. Type of service (service assurance,service delivery, network creation)QF1.1. Activity Cost
QF1.1.1. Work Cost VF2. Type of ActivityQF2. Duration (all the processes) VF3. Type of work (new plant, cessation,
removal, ISDN, etc.)QF2.1. Activity DurationQF2.1.1. Work Duration VF4. Type of customer
VF4.1. Expenditure class (total on phone bill)QF3. Resource Use (all the processes) VF4.2. Type of expenditure (subdivision
device, traffic)QF3.1. Activity Resource UseQF3.1.1. Work Resource Use VF4.3. Marketing sector
QF4. Resource Productivity (all the processes) VF5. Type of working objectQF4.1. Number of works per time unit VF6. Personnel executing the work (social or
industrial)QF5. Performance (all the processes) VF7. Enterprise that executes the work
QF5.1. Average time of work VF8. Work Center (Maintenance Center)QF5.2. Average time of requests’ stock VF8.1. DivisionQF5.3 Number of works per time unit VF8.1.1. Employee
QF6. Quality for the customer (serviceassurance)
VF9. Maintenance level (i.e., number ofmaintenance work hours in the past)
QF6.1. Response time VF10. Time of observationQF6.2. Resolution timeQF6.3. Number of complaintsQF6.4. Number of current worksQF6.5. Number of open indicationsQF6.6. Number of works within N days
Baseline Hypotheses Impact on Baseline Hypotheses
What are the values assigned to the qualityfocus of interest?
How do baseline hypotheses vary qualityfocus?
BH1. Average cost of service assurance IH1. Average cost of activities for TOPcustomers is more than the average cost forbusiness customers.
BH1.1. Average cost of activities of type Xis Y
BH1.1.1. Average cost of worksfor activities of type W is T IH2. Cost of activities of type A in
Maintenance center B is more than cost inMaintenance center C.
BH1.2. Average cost of activitiesof type U for clients V is ZBH1.3. ....... IH3. Average cost for business customer is
less than cost for residential customer.IH4. Cost depends on the enterprise thatexecutes the work.
Designing Data Marts for Data Warehouses • 465
ACM Transactions on Software Engineering and Methodology, Vol. 10, No. 4, October 2001.
characteristics of the service processes (e.g., cost, duration, resource used,performance, perceived quality,...). The upper-right part of the sheet con-tains the variations factors, i.e., those factors that are supposed to influ-ence the values of the attributes. For instance, in the example it wasobserved that the trends of attributes such as cost and performance of themaintenance process might depend on factors such as the type of thecustomer requesting the service (e.g., business or residential). Anotherdependency might be identified between costs and work centers (i.e.,different work centers have different productivity). The two lower parts ofthe abstraction sheet contain the baseline hypotheses and the impact ofvariation factors. Baseline hypotheses represent typical beliefs about thevalues of fact attributes (actual values for variables are not given in TableI, as they do not contribute insights to a reader). For instance, in Table I, abaseline hypothesis states the value estimated for the average cost of aservice. The impact of variation factors expresses users’ beliefs about theinfluence that variation factors have on the baseline hypotheses. Forinstance, often the cost of a maintenance activity for residential customersis higher than for business customers, since the location of the customermight be located in the country side or in other areas that are difficult toreach.
4.5 Deriving Ideal Schema Fragments
Abstraction sheets discussed in the previous section are extremely useful tocreate an effective characterization of goals. Indeed, filling up abstractionsheets is a fairly simple process, since it is based on refining and discussingthe information provided by data warehouse users. At the same time, oncecreated on the basis of user’s information, an abstraction sheet can berevisited and reinterpreted to derive ideal star schemas. To do so, thedifferent zones of the abstraction sheet are interpreted as descriptors of thefacts and dimensions that “ideally” should be part of the data mart; thesegenerate the “ideal” star schema. In particular, the items listed in thequality focus section are considered as quality measures, i.e., facts inthe ideal star schema. Then, the variation factors section defines thevariables that may cause changes to quality measures, i.e., dimensionanalysis in the ideal star schema. Once singled out and named, eachindividual quality measure contributes an attribute to the ideal facts, andeach variation factor contributes a dimension. Furthermore, the baselinehypotheses represent the expected queries that the data warehouse issupposed to manage. Then, these are verified “a posteriori” against theideal star schema, in order to check whether they can be expressed with thechosen fact and dimensions. The impact on baseline hypothesescorresponds to the expected query result that the data warehouse issupposed to produce once it has been created. They can be verified “aposteriori” on the running system implementing the data warehouse. Theprocess of extraction of information from abstraction sheets is accomplishedmanually, but the basic rules are straightforward and could be supportedby a tool.
466 • A. Bonifati et al.
ACM Transactions on Software Engineering and Methodology, Vol. 10, No. 4, October 2001.
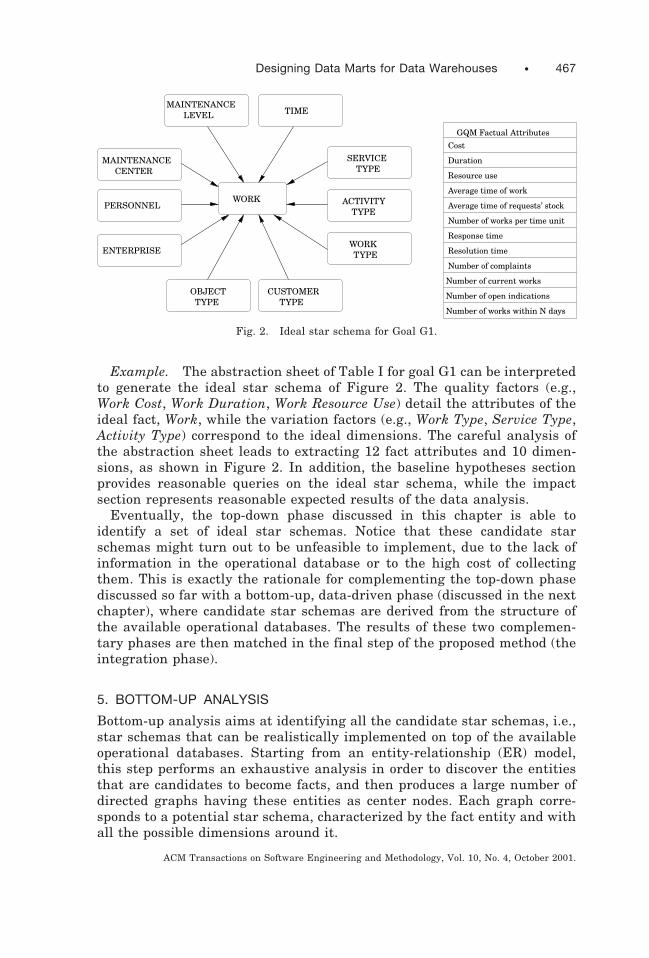
Example. The abstraction sheet of Table I for goal G1 can be interpretedto generate the ideal star schema of Figure 2. The quality factors (e.g.,Work Cost, Work Duration, Work Resource Use) detail the attributes of theideal fact, Work, while the variation factors (e.g., Work Type, Service Type,Activity Type) correspond to the ideal dimensions. The careful analysis ofthe abstraction sheet leads to extracting 12 fact attributes and 10 dimen-sions, as shown in Figure 2. In addition, the baseline hypotheses sectionprovides reasonable queries on the ideal star schema, while the impactsection represents reasonable expected results of the data analysis.
Eventually, the top-down phase discussed in this chapter is able toidentify a set of ideal star schemas. Notice that these candidate starschemas might turn out to be unfeasible to implement, due to the lack ofinformation in the operational database or to the high cost of collectingthem. This is exactly the rationale for complementing the top-down phasediscussed so far with a bottom-up, data-driven phase (discussed in the nextchapter), where candidate star schemas are derived from the structure ofthe available operational databases. The results of these two complemen-tary phases are then matched in the final step of the proposed method (theintegration phase).
5. BOTTOM-UP ANALYSIS
Bottom-up analysis aims at identifying all the candidate star schemas, i.e.,star schemas that can be realistically implemented on top of the availableoperational databases. Starting from an entity-relationship (ER) model,this step performs an exhaustive analysis in order to discover the entitiesthat are candidates to become facts, and then produces a large number ofdirected graphs having these entities as center nodes. Each graph corre-sponds to a potential star schema, characterized by the fact entity and withall the possible dimensions around it.
MAINTENANCECENTER
GQM Factual Attributes
Number of works within N days
Number of open indications
Number of current works
Number of complaints
Resolution time
Response time
Number of works per time unit
Average time of requests’ stock
Average time of work
Resource use
Duration
Cost
WORKTYPE
TYPECUSTOMEROBJECT
TYPE
ENTERPRISE
PERSONNEL
MAINTENANCE LEVEL TIME
TYPESERVICE
WORK ACTIVITY TYPE
Fig. 2. Ideal star schema for Goal G1.
Designing Data Marts for Data Warehouses • 467
ACM Transactions on Software Engineering and Methodology, Vol. 10, No. 4, October 2001.

Potential star schemas are produced by an algorithm exploring the ERmodel. The algorithm considers an ER schema as a graph; it initiallytransforms each n-ary (n . 2) or many-to-many relationship into one-to-many relationships, by adding suitable nodes and edges. Then, the algo-rithm assigns to each entity a numerical label equal to the number ofadditive attributes (attributes with a numeric or temporal interval type) ithas: potential fact entities are the ones having a nonnull label. Next, eachpotential fact entity is taken as the center node of a graph, produced byconsidering all possible dimensions reachable from the center throughone-to-many relationships or one-to-one relationships. The algorithm auto-matically produces all the possible snowflake schemas; it achieves a goodefficiency reusing in the computation the results of previous steps. Finally,snowflake schemas are reduced to star schemas, performing a step that canbe interpreted as a denormalization of relations.
We first describe how an entity-relationship schema (ER) is mapped to aConnectivity Graph (C-Graph) which synthesizes the information of theschema relevant for the analytical processings performed in a data ware-house. Next, we show the algorithm that extracts snowflake schemas fromthe C-Graph. Finally, we show how each snowflake schema is transformedinto a star schema. Each step is described by means of examples drawnfrom the considered case study.
5.1 Mapping an Entity-Relationship Schema into a Connectivity Graph
Let ER be an entity-relationship schema.
Definition 1. All the entities are potential dimensional entities (ordimensions).
Definition 2. A potential fact entity is an entity ej [ R such that ej hasat least one additive attribute a (i.e., an attribute with a numeric ortemporal interval type).
Definition 3. The C-Graph is a directed graph $V, E% constructed fromthe ER schema as follows.
—Each entity ei [ ER corresponds to a node vi [ V. Fact nodes arerepresented with boxes (called fact nodes), all other entities with circles.Each fact node ^ei, labelei& is labeled with the number of additiveattributes appearing in the entity.
—Each one-to-many relationship from entity ei to entity ej is mapped to adirected arc ^ei, ej& [ E.
—Each one-to-one relationship between entities ei and ej is mapped to abidirectional arc ^ei, ej& [ E.
—Each many-to-many relationship from entity ei to entity ej is converted intwo directed arcs originating from a new node ek and directed to thenodes ei and ej.
468 • A. Bonifati et al.
ACM Transactions on Software Engineering and Methodology, Vol. 10, No. 4, October 2001.
—Each n-ary relationship between entities e1, . . . , en introduces a newnode ek and n directed arcs originating from ek and directed to e1, . . . ,en.
—Each generalization hierarchy between an entity ei and its specializationentity ej is mapped into a directed dashed arc ^ei, ej& [ E.
The arcs are labeled with the name of the corresponding relationship inthe ER schema. To simplify the C-Graph, we omit to represent the labels,except when there is ambiguity because two or more arcs of the same kindconnect the same two entities.
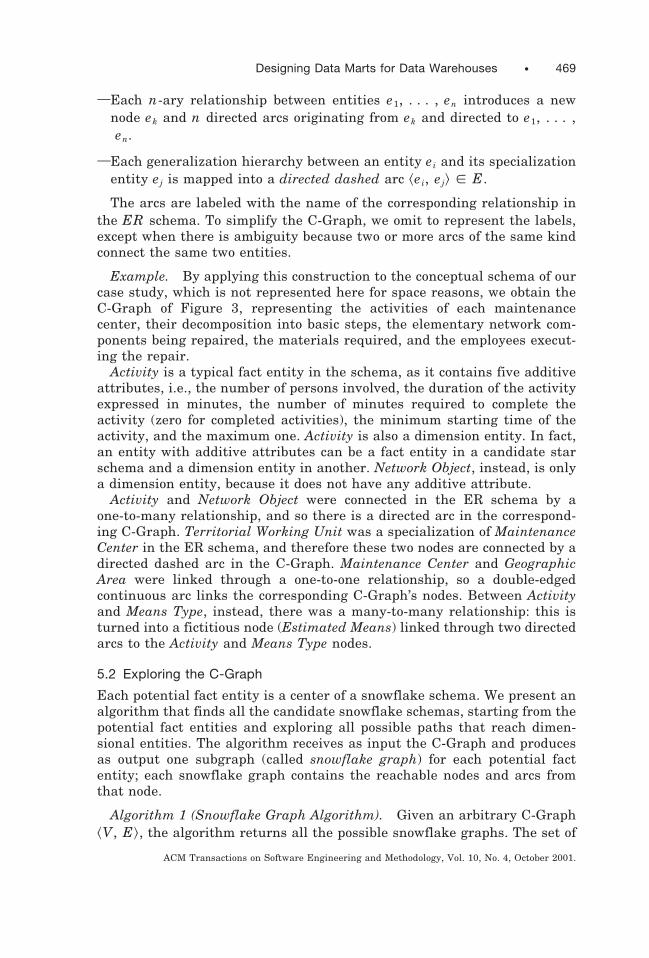
Example. By applying this construction to the conceptual schema of ourcase study, which is not represented here for space reasons, we obtain theC-Graph of Figure 3, representing the activities of each maintenancecenter, their decomposition into basic steps, the elementary network com-ponents being repaired, the materials required, and the employees execut-ing the repair.
Activity is a typical fact entity in the schema, as it contains five additiveattributes, i.e., the number of persons involved, the duration of the activityexpressed in minutes, the number of minutes required to complete theactivity (zero for completed activities), the minimum starting time of theactivity, and the maximum one. Activity is also a dimension entity. In fact,an entity with additive attributes can be a fact entity in a candidate starschema and a dimension entity in another. Network Object, instead, is onlya dimension entity, because it does not have any additive attribute.
Activity and Network Object were connected in the ER schema by aone-to-many relationship, and so there is a directed arc in the correspond-ing C-Graph. Territorial Working Unit was a specialization of MaintenanceCenter in the ER schema, and therefore these two nodes are connected by adirected dashed arc in the C-Graph. Maintenance Center and GeographicArea were linked through a one-to-one relationship, so a double-edgedcontinuous arc links the corresponding C-Graph’s nodes. Between Activityand Means Type, instead, there was a many-to-many relationship: this isturned into a fictitious node (Estimated Means) linked through two directedarcs to the Activity and Means Type nodes.
5.2 Exploring the C-Graph
Each potential fact entity is a center of a snowflake schema. We present analgorithm that finds all the candidate snowflake schemas, starting from thepotential fact entities and exploring all possible paths that reach dimen-sional entities. The algorithm receives as input the C-Graph and producesas output one subgraph (called snowflake graph) for each potential factentity; each snowflake graph contains the reachable nodes and arcs fromthat node.
Algorithm 1 (Snowflake Graph Algorithm). Given an arbitrary C-Graph^V, E&, the algorithm returns all the possible snowflake graphs. The set of
Designing Data Marts for Data Warehouses • 469
ACM Transactions on Software Engineering and Methodology, Vol. 10, No. 4, October 2001.

ME
AN
ST
YP
E
WO
RK
CA
RD
ES
TIM
ATE
DM
ATE
RIA
L
WO
RK
MAT
ER
IAL
WO
RK
DE
TAIL
MA
INT
EN
AN
CE
CE
NT
ER
3
WO
RK
HO
UR
S
MA
INT
EN
AN
CE
CE
NT
ER
HE
AD
TE
CH
NIC
AL
AS
SIS
TAN
T
VAR
2
VAR
3
TE
CH
NIC
AL
CH
IEF
VAR
1
LOC
AL
MA
NA
GE
-M
EN
T
MA
INT
EN
AN
CE
CE
NT
ER
GR
OU
P
TAR
IFF
CAT
EG
OR
Y
PLA
NT
CA
RD
MA
INT
EN
AN
CE
CO
NT
RA
CT
MA
RK
ET
ING
SE
CT
OR
CO
MP
LAIN
TO
BJE
CT
CO
NS
IST
EN
CY
TE
LEC
OM
DE
PA
RT
ME
NT
NE
TW
OR
KO
BJE
CT
CAT
EG
OR
Y
CO
NS
TR
AIN
TA
CT
IVIT
YE
OU
TR
AN
SM
ISS
ION
MO
DE
L
OT
HE
RLI
NE
SW
OR
K C
EN
TE
R
EN
TE
RP
RIS
EO
RD
ER
AC
TIV
ITY
TY
PE
TE
CH
NIC
AL
PE
RF
OR
MA
NC
E EN
TE
RP
RIS
EC
OM
PE
TE
NC
E
TE
CH
NIC
AL
PE
RF
OR
MA
NC
E
NE
T. O
BJE
CT
TE
RR
ITO
RIA
LD
ISLO
CAT
ION
NE
TW
OR
KO
BJE
CT
OU
TS
IDE
WO
RK
RE
QU
ES
T
pf
PLA
NT
CO
NS
IST
EN
CY
MAT
ER
IAL
WO
RK
US
E
RE
SO
UR
CE
DIS
P.
AG
EN
DA
CO
MM
IT-
ME
NT
EO
U
35
5C
ON
S.
WO
RK
ER
2
UN
IT
TE
RR
ITO
RIA
LW
OR
KIN
G
BR
AN
CH
GE
OG
RA
PH
ICA
RE
A
IND
ICAT
ION
TR
AF
FIC
BA
ND
STA
TIO
N
3
CLI
EN
TS
SE
GM
EN
T
PLA
NT
CO
NN
EC
TIB
I-LI
TY
& S
ER
VIC
ES
PR
OD
UC
TS
TAX
ED
MA
INT.
CE
NT
ER
CA
LEN
DA
RD
AY
TU
RN
MO
DIF
.
ES
TIM
ATE
DM
EA
NS
CLA
SS
IF.
OB
JEC
TN
ET
WO
RK
1
EN
TE
RP
RIS
E
AC
TIV
ITY
TY
PE
AC
TIV
ITY
PR
EP
AR
AT.
1
DE
PE
N.
Fig. 3. C-Graph of the case study.
470 • A. Bonifati et al.
ACM Transactions on Software Engineering and Methodology, Vol. 10, No. 4, October 2001.

snowflake graphs is contained in an array of graphs SF: the graph inposition i of the array SF@i# 5 ^Vi, Ei& represents the snowflake graphobtained starting the analysis from node ni. If a subgraph is entirelyincluded in another, and the first has already been computed, the methodavoids the recomputation of the subgraph.
beginfor each ni [ C-Graph
SF[i]:5 SF[i] ø ni;if not ni.visited then
nodesToAnalyze:5 {ni};Visit(ni, nodesToAnalyze, SF);
end for;end;
procedure Visit(ni: node; nodesToAnalyze: setOfNodes; SF: arrayOfGraphs)begin
ni.visited:5true;for each aj [ ni.outgoingArcs
nk:5 aj.endpoint;if not nk.visited then
for each nl [ nodesToAnalyzeSF[l]:5 SF[l] ø aj;SF[l]:5 SF[l] ø nk;
end for;nodesToAnalyze:5 nodesToAnalyze ø nk;Visit(nk, nodesToAnalyze, SF);
elsefor each nl [ nodesToAnalyze
SF[l]:5 SF[l] ø SF[k];end for;
end if;end for;
end;
The core of the algorithm is represented by the recursive procedure Visit.The procedure receives as input parameters the set of nodes currentlyanalyzed and extends the search in the direction of outgoing arcs. Proce-dure Visit actually implements a depth-first exhaustive exploration of thegraph. The procedure starts setting the value of a visited flag, associated tothe visited node ni, to true; this step guarantees that the procedure isexecuted only once for each node. The procedure then considers all the arcsexiting from node ni; for each node nk reached by the arc, if nk has alreadybeen visited, the snowflake graph associated to it is added to all thesnowflake graphs associated to the nodes currently being visited (those innodesToAnalyze); otherwise the search continues in a depth-first way,adding nk to nodesToAnalyze. The procedure is called by an externalprogram, which is simply responsible of invoking the procedure on all thenodes.
Designing Data Marts for Data Warehouses • 471
ACM Transactions on Software Engineering and Methodology, Vol. 10, No. 4, October 2001.

Complexity Analysis. The complexity of the algorithm is linear with thesize of the output, because at the innermost level there are operations thatcreate the output structure, and no redundant assignments are done. Sincethe algorithm is linear in the size of the output, the complexity of thealgorithm is optimal. The size of the output is quadratic on the number ofnodes and arcs of the graph: if n is the number of nodes and m the numberof arcs, the result will contain n snowflake graphs with at most n 1 mcomponents (nodes and arcs) in each of them. Since schemas have normallya limited number of potential fact entities and have a simple structure, theactual complexity of the algorithm is typically acceptable.
Example (Continued). From the ER schema of the case study we obtaineight snowflake graphs, whose center nodes are Activity, Work, WorkMaterial, Estimated Material, Plant Consistency, Plant Card, MaintenanceCenter, and Work Hours. The one centered on Work is shown in Figure 4:this snowflake graph (and the others not shown, due to space limitations) isquickly obtained from the C-Graph of Figure 3, starting from the potentialfact Work and yielding, through the algorithm, all the possible reachabledimensions.
LOCALMANAGE-MENT
MAINTENANCECENTERGROUP
ENTERPRISE
3
BRANCH
OUTSIDEWORKREQUEST
DISLOCATIONTERRITORIALNET. OBJECT NETWORK
OBJECT
CLASSIFIC.OBJECTNETWORK
CONNECTI-BILITY
NETWORKOBJECTCATEGORY
ORDERENTERPRISE
ACTIVITY
WORK CENTERLINESOTHER
RESOURCEACTIVITY
TYPE
GEOGRAPHICAREA
MAINTENANCECENTER
WORK
INDICATIONWORKCARD
Fig. 4. Example of snowflake graph.
472 • A. Bonifati et al.
ACM Transactions on Software Engineering and Methodology, Vol. 10, No. 4, October 2001.

5.3 Star Join Graph
Snowflake graphs are converted into simpler star join graphs. The ratio-nale of this conversion step is, that although snowflake graphs are a richand nonredundant representation of a data mart, the matching of ideal andcandidate data marts is eased if the dimension hierarchies are abstractedaway. In fact, this representation lets us focus on a direct one-to-onematching among the concepts identified by the top-down and bottom-upapproaches.
Definition (Star Join Graph). Let ^Vi, Ei& be an arbitrary snowflakegraph. A star join graph ^N, P& is derived from ^Vi, Ei& with the followingrules:
—ei [ Vi corresponds to f [ N (fact);
—all other nodes ek [ Vi correspond to dk [ N (dimensions);
—pi 5 ^ek, eh&; pi [ P; if ^ek, eh& is a directed arc or a directed pathbetween ek and eh, then ek is a fact entity and eh is a dimension entity.
Example (Continued). Eight snowflake graphs are extracted from theC-Graph of Figure 3, as shown in the previous example. Next, Definition 4is applied, and the snowflake graphs are converted into star join graphsillustrated in Figure 5 and Figure 6 flattening the dimension hierarchies.For each star, we list the fact attributes. Work Hours and MaintenanceCenter have a small number of dimensions, while Work or EstimatedMaterial are very rich in dimensions. Activity and Plant Card have severaladditive attributes, while Estimated Material has only one. The number ofdimensions and of aggregate attributes is summarized in Table II.
6. INTEGRATION
The top-down phase identifies the structure of the warehouse as it emergesfrom user requirements. The bottom-up phase returns all the possiblemultidimensional schemas that can be extracted from the existing informa-tion system. The crucial step is to integrate the two solutions, specifyinghow the ideal requirements can be mapped to the real system. Theintegration may also give the opportunity to consider new analysis aspects
Table II. Properties of Candidate Star Join Graphs Extracted from the C-Graph of Figure 3
Star Join Graph Number of Dimensions Number of Fact-Additive Attributes
Work Hours 9 3Activity 14 5Work 19 3Maintenance Center 4 2Estimated Material 16 1Work Material 21 1Plant Card 13 5Plant Consistency 14 3
Designing Data Marts for Data Warehouses • 473
ACM Transactions on Software Engineering and Methodology, Vol. 10, No. 4, October 2001.

NE
TW
OR
KO
BJE
CT
CAT
EG
OR
Y
CO
NN
EC
TI-
BIL
ITY
MA
INT
E-
NA
NC
EC
ON
TR
AC
T
TR
AF
FIC
BA
ND
TAX
ED
PR
OD
UC
TS
& S
ER
VIC
ES
TE
LEC
OM
DE
PA
RT-
ME
NT
MA
RK
ET
ING
SE
CT
OR
NE
T. O
BJE
CT
TE
RR
ITO
RIA
LD
ISLO
CAT
ION
PLA
NT
CO
NS
IST
EN
CY
STA
RT
_DAT
EE
XP
IRY
_DAT
E
NU
MB
ER
OF
SE
RV
ICE
PIE
CE
S
CLA
SS
IF.
CLI
EN
TS
SE
GM
EN
T
NE
TW
OR
KO
BJE
CT
OB
JEC
TN
ET
WO
RK
PLA
NTC
ATE
GO
RY
TAR
IFF
STA
TIO
N
3
GE
OG
RA
PH
ICA
RE
AM
AIN
TE
NA
NC
E
CE
NT
ER
MA
INT
EN
AN
CE
CE
NT
ER
GR
OU
P
LOC
AL
MA
NA
GE
-M
EN
T
FAIL
UR
ES
’ TH
RE
SH
OLD
NU
MB
ER
OF
FA
ILE
D T
ELE
PH
ON
EC
ALL
S
2B
RA
NC
H
MA
INT
EN
AN
CE
CE
NT
ER
GR
OU
PLO
CA
LM
AN
AG
E-
ME
NT
WO
RK
QU
AN
TIT
Y O
F M
ATE
RIA
L
MAT
ER
IAL
AC
TIV
ITY
OU
TS
IDE
WO
RK
RE
QU
ES
T OT
HE
RLI
NE
SW
OR
K C
EN
TE
R
GE
OG
RA
PH
ICA
RE
A
EN
TE
RP
RIS
EO
RD
ER
CO
NN
EC
TI-
BIL
ITY
NE
TW
OR
KO
BJE
CT
CLA
SS
IFIC
.
AC
TIV
ITY
TY
PE
WO
RK
MAT
ER
IAL
MA
INT
EN
AN
CE
CE
NT
ER
BR
AN
CH
EN
TE
RP
RIS
E
CAT
EG
OR
YO
BJE
CT
NE
TW
OR
K
DIS
LOC
ATIO
NT
ER
RIT
OR
IAL
NE
T. O
BJE
CT
OB
JEC
TN
ET
WO
RK
IND
ICAT
ION
1
RE
SO
UR
CE
ES
TIM
ATE
DM
ATE
RIA
L
LOC
AL
MA
NA
GE
-M
EN
TMA
INT
EN
AN
CE
CE
NT
ER
NE
TW
OR
KO
BJE
CT
WO
RK
CA
RD
QU
AN
TIT
Y O
F M
ATE
RIA
L
GE
OG
RA
PH
ICA
RE
A
AC
TIV
ITY
TY
PE
CO
NN
EC
TI-
BIL
ITY
NE
T. O
BJE
CT
TE
RR
ITO
RIA
LD
ISLO
CAT
ION
MA
INT
EN
AN
CE
CE
NT
ER
GR
OU
P
NE
TW
OR
KO
BJE
CT
CAT
EG
OR
Y
NE
TW
OR
K
CLA
SS
IFIC
.
1
IND
ICAT
ION
AC
TIV
ITY
OB
JEC
T
RE
SO
UR
CE
BR
AN
CH
MAT
ER
IAL
Fig. 5. Star join graphs (Part I).
474 • A. Bonifati et al.
ACM Transactions on Software Engineering and Methodology, Vol. 10, No. 4, October 2001.

GE
OG
RA
PH
ICA
RE
A
MA
INT
EN
AN
CE
CE
NT
ER
GR
OU
P
WO
RK
CA
RD
NE
TW
OR
KO
BJE
CT
CLA
SS
IFIC
.C
ON
NE
CT
I-B
ILIT
Y
MA
INT
EN
AN
CE
CE
NT
ER
NE
T. O
BJE
CT
TE
RR
ITO
RIA
LD
ISLO
CAT
ION
MA
INT
EN
AN
CE
CE
NT
ER
GR
OU
P
MA
INT
EN
AN
CE
CE
NT
ER
CLG
RA
CA
LEN
DA
RD
AY
GE
OG
RA
PH
ICA
RE
A
WO
RK
HO
UR
SM
AIN
TE
NA
NC
EC
EN
TE
RH
EA
DN
ET.
OB
JEC
TT
ER
RIT
OR
IAL
DIS
LOC
ATIO
N
LOC
AL
MA
NA
GE
-M
EN
T
MA
INT
EN
AN
CE
CE
NT
ER
GR
OU
P
NE
TW
OR
KO
BJE
CT
CAT
EG
OR
Y
CO
NN
EC
TI-
BIL
ITY
GE
OG
RA
PH
ICA
RE
A
AC
TIV
ITY
TY
PE
OT
HE
RLI
NE
SW
OR
K C
EN
TE
R
EN
TE
RP
RIS
EO
RD
ER
OU
TS
IDE
WO
RK
RE
QU
ES
T
MA
INT
EN
AN
CE
CE
NT
ER
WO
RK
CA
RD
TR
AVE
L T
IME
IN M
INU
TE
S F
OR
TH
E W
OR
KIN
G G
RO
UP
WO
RK
_EN
D_T
IME
WO
RK
_STA
RT
_TIM
E
PR
OP
OS
ED
OV
ER
TIM
EN
IGH
T O
VE
RT
IME
AG
RE
ED
OV
ER
TIM
E
MA
X_S
TAR
T_T
IME
EX
PE
CT
ED
DU
RAT
ION
RE
SID
UA
L D
UR
ATIO
N
NU
MB
ER
OF
PE
OP
LE
MIN
_STA
RT
_TIM
E
NE
TW
OR
KO
BJE
CT
CAT
EG
OR
Y
CO
NN
EC
TI-
BIL
ITY
MA
INT
EN
AN
CE
CO
NT
RA
CT
SE
GM
EN
TC
LIE
NT
ST
ELE
CO
MD
EP
AR
T-M
EN
T
MA
RK
ET
ING
SE
CT
OR
NE
TW
OR
KO
BJE
CT
NE
T. O
BJE
CT
TE
RR
ITO
RIA
LD
ISLO
CAT
ION
NE
TW
OR
KO
BJE
CT
CLA
SS
IF.
PLA
NT
CA
RD
STA
TIO
N
5
CAT
EG
OR
YTA
RIF
F
TR
AF
FIC
BA
ND
PLA
NT
NU
MB
ER
OF
INP
UT
LIN
ES
NU
MB
ER
OF
OU
TP
UT
LIN
ES
NU
MB
ER
OF
BI-
DIR
EC
TIO
NA
L LI
NE
SD
ATE
_EX
TE
RN
AL_
JUN
CT
ION
DAT
E_I
NT
ER
NA
L_JU
NC
TIO
N
5
3
NE
TW
OR
KO
BJE
CT
IND
ICAT
ION
LOC
AL
MA
NA
GE
-M
EN
T
RE
SO
UR
CE
BR
AN
CH
CAT
EG
OR
YO
BJE
CT
NE
TW
OR
K
AC
TIV
ITY
TY
PE
AC
TIV
ITY
3
ME
NT
MA
NA
GE
-LO
CA
L
TU
RN
WO
RK
ER
BR
AN
CH
IND
ICAT
ION
NE
TW
OR
KO
BJE
CT
CLA
SS
IFIC
.O
BJE
CT
NE
TW
OR
K
EN
TE
RP
RIS
E
AC
TIV
ITY
RE
SO
UR
CE
WO
RK
BR
AN
CH
Fig. 6. Star join graphs (Part II).
Designing Data Marts for Data Warehouses • 475
ACM Transactions on Software Engineering and Methodology, Vol. 10, No. 4, October 2001.

that did not emerge from user requirements, but that the system mayeasily make available.
Integration is carried out in three steps:
Terminology analysis: Before integration, top-down and bottom-upschemas have to be converted to a common terminological idiom: this isaccomplished defining how GQM terms are mapped to system’s terms.
Schema matching: After terminology mapping, candidate solutions arecompared one-by-one with ideal solutions representing GQM goals. Amatch occurs when the ideal and candidate solutions have the same fact;the metrics considers the number of their common fact attributes anddimensions.
Ranking and selection: Eventually, some of the candidate star sche-mas are selected, based on the goal’s priority as well as on the metrics ofthe matching.
Each step is detailed below and is applied to our case study.
6.1 Terminology Analysis
Terminology analysis is applied to all the terms of the ideal stars (GQMterms) and performs their mapping to the terms which appear in candidatestars. The mapping is direct when the GQM term corresponds to a conceptthat is also immediately available in the system; it is indirect when theGQM term corresponds to a concept that can be derived by computing afunction of several concepts that are available in the system; we say thatthe GQM term is computed. The same GQM term can be mapped to severalsystem terms, both directly and indirectly. It may also happen that a GQMterm is different from all the system terms, so that specific user require-ments cannot be satisfied. Initially, the mapping considers the facts thatare the centers of ideal and candidate stars, and extends subsequently totheir attributes and dimensions.
Example (Continued). For instance, let us consider the ideal star IG1 ofgoal G1 (Figure 2) and the eight candidate stars of Figure 5 and Figure 6.Let CG1 denote the Work candidate join graph and CG2 denote the Activityjoin graph. First of all, the term WorkIG1 (the name of the fact entity) isdirectly mapped to the terms WorkCG1 and ActivityCG2 (the names of thecentral nodes of the candidate star schemas CG1 and CG2).
Terminological investigation is then extended to the fact attributes anddimensions in CG1 and CG2. For example, attribute ResourceUseIG1 isdirectly mapped to NumberOfPeopleCG1, once it is understood that re-sources of the Work ideal schema are concerned only with personnel;Duration
IG1corresponds either to a direct mapping to Expected Duration
CG2 or to an indirect mapping to the difference function applied toWorkStartTime
CG1and WorkEndTimeCG1. The existence of alternatives in
the name mapping is an indicator of ambiguities in the requirements,
476 • A. Bonifati et al.
ACM Transactions on Software Engineering and Methodology, Vol. 10, No. 4, October 2001.

which need to be further clarified at this stage (e.g., by means of additionalinterviews with the users).
GQM attributes that count the fact instances typically do not have adirect mapping, but can be obtained indirectly as simple query manipula-tions of the instances of candidate schemas. An example is the AverageT-imeOfWorkIG1, that can be obtained by considering for each work thedifference between attributes WorkStartTimeCG1 and WorkEndTimeCG1,then counting the number of instances of WorkCG1, and finally applying theaverage operator.
In the end, terminology analysis terminates by building a thesaurus withthe correspondence between GQM terms and system terms. Table III showsa sketch of the thesaurus developed for IG1 in the case study.
6.2 Schema Matching
To assist the designer in the choice of the best system model, the idealGQM schemas are matched against the candidate star schemas. Thematching is based on the analysis of the number of elements of candidateschemas that correspond, via the terminology analysis, to elements of theideal GQM schema. We preliminarily require a correspondence between thefacts that are the centers of ideal and candidate stars; this correspondenceis mandatory (if it is not satisfied, the ideal and candidate schemas arefocused on different topics and therefore are not comparable). A set ofmetrics has been identified to compare and rank schemas, when severalcandidate schemas meet this criterion.
—The matching attributes metrics count the number of fact attributes in agiven candidate star schema that correspond to attributes in the idealstar schema.
—The matching dimensions metrics count the number of dimensions in agiven candidate star schema that correspond to dimensions in the idealstar schema.
Table III. Thesaurus for Goal G1 (Ideal Schema )
GQM Term Star Join Graph Term GQM Term Mapping
WorkIG1 WorkCG1 DirectActivityCG2 Direct
DurationIG1 Expected DurationCG2, DirectWorkStartTimeCG1, Indirect (difference)WorkEndTimeCG1
ResourceUseIG1 NumberOfPeopleCG1 DirectAverageTimeOfWorkIG1 WorkStartTimeCG1, Indirect (average)
WorkEndTimeCG1
ObjectTypeIG1 NetworkObjectCG1 DirectNumberOfCurrentWorksIG1 instances ofWorkCG1 Indirect (count)NumberOfWorksWithinNDaysIG1 instances of WorkCG1 Indirect (count)NumberOfWorksPerTimeUnitIG1 instances of WorkCG1 Indirect (count)... ... ...
Designing Data Marts for Data Warehouses • 477
ACM Transactions on Software Engineering and Methodology, Vol. 10, No. 4, October 2001.

—The additional attributes metrics count the number of fact attributes in agiven candidate star schema that do not correspond to attributes in theideal star schema. They represent additional observations that may beoffered to the analyst.
—The additional dimensions metrics count the number of dimensions of agiven candidate star schema that do not correspond to dimensions in theideal star schema. They represent additional dimensions that may beoffered to the analyst.
Note that the first two metrics are indeed the most important ones,because they measure how a candidate schema is capable of delivering theinformation that was identified during users interviews. The next twometrics are complementary, as they indicate additional observations thatmay or may not be relevant to users, but could be performed with relativelysmall overhead (because they are offered by the underlying data). In ourexperience, these metrics are indeed important. If the overhead induced byadding them is very small, users prefer to add facts and dimensions to theirspecifications in the expectation that they will become useful for theanalysis later on.
In some cases, one solution dominates the others, because it offers betterindexes for all the four metrics. In general, a solution which dominates allthe other ones according to the first two metrics is strongly advised.
Example (Continued). Table IV illustrates the indexes of the four met-rics relative to the ideal schema IG1. We observe that the second candidate(CG2, Activity) dominates the first (CG1, Work) according to the first twometrics, while the third candidate Work Material is dominated by CG1 andCG2 according to the first two metrics and indeed has no matching facts,and thus can be excluded at this stage.
6.3 Ranking and Selection
This phase completes the design process. At this stage, each goal is rankedaccording to its priority, as indicated by the users. Moreover, for each goala candidate star schema is selected. Then, the addition of facts anddimensions beyond the ones resulting from the requirements is decided.Finally, a decision is taken about the candidate star schemas, or datamarts, to be implemented. Ranking is accomplished according to the needsand constraints of users. In our case study this was accomplished throughinterviews and brainstorming meetings. We believe that this kind ofactivity can hardly be performed automatically, as the ranking is mainly
Table IV. Schema Matching for Goal G1 (Schema )
Ideal (GQM)Schema
CandidateSchema
MatchingAttributes
MatchingDimensions
AdditionalAttributes
AdditionalDimensions
WorkIG1 Work 5 7 1 12WorkIG1 Activity 6 7 3 9WorkIG1 Work Material 0 5 1 15
478 • A. Bonifati et al.
ACM Transactions on Software Engineering and Methodology, Vol. 10, No. 4, October 2001.

based on motivations that are usually identified and assessed by themanagers and owners of the process being studied. The selection of themost suitable candidate(s) can be based on cost modeling, on decision trees,or on other qualitative criteria. Other suitable criteria concern the opti-mized selection of views to be materialized in the data warehouse.
Example (Continued). In our case study, goal G1 was selected forimplementation using the data mart represented by the Activity schema.Out of the remaining three goals, G2 and G3 were found unfeasible (therewas no matching between the ideal facts and the real star schema facts),and G4 was found partially feasible (only partial coverage of the factattributes). In particular, the goal G4 was covered partially by the PlantCard schema, for the fact attributes concerning the network usage, but theother fact attributes (costs and incomes of the network) were not availablein the data marts extracted from the operational database.2
In order to complement the above decision process, we found useful theaddition of gross estimates of the cardinalities and sizes involved in thedata mart. Sizes are specified under the assumption of adding only thematching fact attributes. These estimates give a physical characterizationof the data mart, which complements the logical characterization summa-rized in Table IV. For instance, quantitative data relative to the samecandidates are reported in Table V. They give an additional motivation inselecting the Activity schema over the Work schema, because the former issmaller in size.
7. SUMMARY DESCRIPTION OF THE PROPOSED METHOD
The previous sections have introduced a method to design data warehouseschemas; this section will provide the reader with a summary description ofthe proposed method, meant to facilitate and support the application of theproposed method. We abstract out irrelevant details, emphasize the mainsteps and critical issues, and provide guidance and support to the datawarehouse designer; we also indicate when a specific activity can beaccomplished manually, automatically, or semiautomatically.
The method is structured in three steps: creation of ideal star schemas(top-down phase), derivation of candidate star schemas from databaseconceptual schemas (bottom-up analysis), and matching of the ideal sche-mas with star join graphs (integration and ranking).
Top-Down Phase.
(1) Collect user requirements through interviews (manual).
(2) Represent requirements as GQM goals:
Table V. Cardinalities and Sizes of Candidates Matching Goal G1
Candidate Cardinality Size
Work 10,000,000 5GBActivity 5,000,000 2GB
Designing Data Marts for Data Warehouses • 479
ACM Transactions on Software Engineering and Methodology, Vol. 10, No. 4, October 2001.

(a) For each goal, fill in the goal definition, i.e., define the object of thestudy, the purpose, the quality focus, the viewpoint, and the envi-ronment (manual).
(b) For each goal, detail the goal by filling in the abstraction sheet:define the quality focus, the variation factors, the baseline hypoth-eses, and the impact on baseline hypotheses (manual).
(c) Compare and assess the goals: identify similarities and implicationsamong goals to reduce them to a manageable number, i.e., mergerelated goals and drop goals that are subsumed by others (manual).
(3) Derive ideal schema fragments for each goal:(a) Map quality focus into the facts in the ideal star schema, i.e., its
components are the attribute of the fact (automatic).(b) Map variation factors into the star schemas dimensions (automat-
ic).(c) Use the baseline hypotheses to derive the queries onto the data
warehouse (semiautomatic). Notice that the impact on baselinehypotheses is the set of expected query results.
Bottom-Up Analysis.
(4) Obtain the Star Join Graphs:(a) Map the E/R schema into a connectivity graph (automatic).(b) Run the Snowflake Graph Algorithm, to find all the possible snow-
flake graphs (automatic).(c) Convert each snowflake graph into a star join graph (automatic).
Integration and Ranking.
(5) Match the ideal schema with the star join graphs:(a) Identify common terms between the ideal schema and the star join
graphs, through direct/indirect mapping (manual/semiautomatic,depending on the features of the dictionary used to perform thematch).
(b) Match ideal and candidate schemas, taking into account the match-ing attributes of the schemas, the matching dimensions, the addi-tional attributes, and the additional dimensions (semiautomatic).
(c) Rank the solutions (manual).
8. EVALUATIONS AND CONCLUSIONS
In conclusion, we examine the pros and cons of several features of theproposed method, and outline future directions of development.
First, we discuss formal versus informal aspects of our method. The firstphase (top-down) is based on an informal and conversational approach,while the second phase (bottom-up) is more formal and rigorous, and yieldsto an integration phase where a formal metric can actually be applied tomatch requirements against candidate solutions. The top-down phase dealswith distilling and consolidating user requirements; this activity is by itsnature a complex interpersonal process, where information is progressivelycollected and refined from inherently informal and incoherent sources.
480 • A. Bonifati et al.
ACM Transactions on Software Engineering and Methodology, Vol. 10, No. 4, October 2001.

Conversely, the second and third phases start from a formal and structuredinformation (i.e., the schema) and can therefore be supported by a rigorousand automatable technique. The choice of GQM as a guiding methodologyfor the top-down phase is justified by the need of exploiting a goal-orientedapproach to requirement elicitation. The advantage of GQM with respect toother goal-oriented techniques lies in the intrinsic orientation of GQMtoward eliciting qualitative and quantitative factors characterizing a com-plex phenomenon.
The interaction with the potential users of the data warehouse has beencarried out using interviews. Other approaches could be fruitfully appliedto collect information on users’ needs and expectations. We relied oninterviews for several reasons, including a limitation in the time andresources that we could invest in the study. We consider the application ofmore sophisticated techniques (such as in-field studies) as a promisingenhancement to the method proposed in this paper.
Another remark concerns the structure of the design process induced bythe proposed method. For the sake of simplicity, we presented it as asequence of steps, as in the waterfall lifecycle; but of course, a designercould proceed adopting a spiral lifecycle, as suggested by Boehm [1988];alternatively, one might decide to explore only a specific goal in detail, ifother goals are patently infeasible to achieve.
It is indeed essential to emphasize the role of domain analysis as animportant aid to achieve an effective goal characterization. As in anyrequirement engineering activity, users’ requirements can be properlycaptured if the software engineer has good knowledge of the concepts andprinciples of the domain being observed. In our approach, domain analysisplays an important role in the formalization of goals, in the construction ofthe thesaurus, and in the final ranking of the identified goals and solu-tions. We did not explore any specific techniques to represent and exploitdomain-specific information (except for the thesaurus). Therefore, anotherarea of further investigation is represented by the integration of ourapproach with specific techniques for domain knowledge representation.
An important factor that must be taken into account to evaluate theeffectiveness of the approach proposed in this paper is its ability to scale inthe context of real settings. Some steps can be completely automated, butcertainly others have necessarily to rely on human intervention, as thedesign requires the capture of users’ requirements or some decision-makingactivity. We argue that this does not represent a limitation to the applica-bility of the approach to large problems; indeed, the proposed method isinstrumental to master the complexity of large settings, as the adoption inthe top-down phase of GQM goals constitutes an effective means to orga-nize the problem space.
As for the duration and cost of applying the proposed method, in the casestudy the duration of the design activity was around three months. Theeffort requested was approximately 100 man/days, which included 60man/days spent by our team, and 40 man/days spent by data warehouseusers and the members of the company’s information system department.
Designing Data Marts for Data Warehouses • 481
ACM Transactions on Software Engineering and Methodology, Vol. 10, No. 4, October 2001.

In conclusion, the experience we have gathered by applying the proposedmethod in our case study is encouraging. The combination of top-down andbottom-up steps helps in coherently evaluating both the coverage of users’requirements and the feasibility of the data warehouse design. In the casestudy, we started from a situation where the size and complexity of theoperational database, and the ambiguity of users’ requirements, could leadto designing very different data warehouses. The proposed method wasindeed essential to direct the designer toward a solution that is bothefficient to implement and consistent with users’ critical requirements. Theusers’ feedback was very positive: the development of a coherent andcomprehensive design proved to be extremely useful to make their goalsexplicit, and to effectively guide the decision process of the companymanagement.
We plan for future work is to explore the problems and issues in datawarehouse design that have been discussed in this concluding section. Inaddition, we would like to extend the approach presented in this paper byconsidering richer criteria for the integration phase. Basically, at this stagewe compare the ideal and candidate schema by assuming that the topologyof the candidate schema can be manipulated and used only in a limited way(e.g., by computing counts and sums). Indeed, by applying classical rela-tional operations (e.g., joins) it would be possible to create new relation-ships that might increase the chances to find a candidate schema (e.g., aportion of a real database) that fits the needs of the data warehouse to becreated. We plan to study this issue further and to derive an enhanced setof criteria and guidelines to support the data warehouse designer in a moreeffective and comprehensive way.
REFERENCES
AGRAWAL, R., GUPTA, A., AND SARAWAGI, S. 1997. Modeling multidimensional databases. InProceedings of the 13th International Conference on Data Engineering (ICDE ’97, Birming-ham, UK, Apr. 7–11), A. Delis, C. Faloutsos, and S. Ghandeharizadeh, Eds. 232–243.
ANTON, A. I. AND POTTS, C. 1998. The use of goals to surface requirements for evolvingsystems. In Proceedings of the 20th International Conference on Software Engineering(ICSE ’98, Kyoto, Japan, Apr.). IEEE Press, Piscataway, NJ, 157–166.
BASILI, V., CALDIERA, G., AND ROMBACH, D. 1994. Goal/question/metric paradigm. InEncyclopedia of Software Engineering (vol. 1 A-N), J. J. Marciniak, Ed. Wiley-Interscience,New York, NY, 528–532.
BATINI, C. AND LENZERINI, M. 1984. A methodology for data schema integration in theentity-relationship model. IEEE Trans. Softw. Eng. 10, 6 (Nov.), 650–664.
BOEHM, B. W. 1988. A spiral model of software development and enhancement. IEEEComputer 21, 5 (May), 61–72.
CABIBBO, L. AND TORLONE, R. 1998. A logical approach to multidimensional databases. InProceedings of the International Conference on Extending Data Base Technology (EDBT ’98,Valencia, Spain, Mar.). 183–197.
CALVANESE, D., GIACOMO, G. D., LENZERINI, M., NARDI, D., AND ROSATI, R. 1998. Informationintegration: Conceptual modeling and reasoning support. In Proceedings of the 6th Interna-tional Conference on Cooperative Information Systems (CoopIS ’98, New York, NY,Aug.). 280–291.
CALVANESE, D., GIACOMO, G. D., LENZERINI, M., NARDI, D., AND ROSATI, R. 1998. Sourceintegration in data warehousing. In Proceedings of the 9th International Workshop onDatabase and Expert System Applications (DEXA Workshop ’98, Vienna, Austria, Aug.24–28). IEEE Computer Society Press, Los Alamitos, CA, 192–197.
482 • A. Bonifati et al.
ACM Transactions on Software Engineering and Methodology, Vol. 10, No. 4, October 2001.

CHAUDHURI, S. AND DAYAL, U. 1997. An overview of data warehousing and OLAP technology.SIGMOD Rec. 26, 1, 65–74.
DARIMONT, R., DELOR, E., MASSONET, P., AND VAN LAMSWEERDE, A. 1997. GRAIL/KAOS: anenvironment for goal-driven requirements engineering. In Proceedings of the 1997 Interna-tional Conference on Software Engineering (ICSE ’97, Boston, MA, May 17–23), W. R.Adrion, Chair. ACM Press, New York, NY, 612–613.
EZEIFE, I. 1997. A uniform approach for selecting views and indexes in a data warehouse. InProceedings of the International Database Engineering and Applications Symposium (IDEAS’97, Montreal, Canada, Aug.). 151–160.
FRANCALANCI, C. AND FUGGETTA, A. 1997. Integrating conflicting requirements in processmodeling: A survey and research directions. Inf. Softw. Technol. 39, 3, 205–216.
FRANCONI, E. AND SATTLER, U. 1999. A data warehouse conceptual data model for multidimen-sional aggregation. In Proceedings of the Workshop on Design and Management of DataWarehouses (DMDW ’99, Heidelberg, Germany, June).
FUGGETTA, A., LAVAZZA, L., MORASCA, S., CINTI, S., OLDANO, G., AND ORAZI, E. 1998. ApplyingGQM in an industrial software factory. ACM Trans. Softw. Eng. Methodol. 7, 4, 411–448.
GARCIA-MOLINA, H., LABIO, W. J., AND YANG, J. 1998. Expiring data in a warehouse. InProceedings of the 24th International Conference on Very Large Data Bases, A. Gupta, O.Shmueli, and J. Widom, Eds. Morgan Kaufmann, San Mateo, CA, 500–511.
GOLFARELLI, M., MAIO, D., AND RIZZI, S. 1998. Conceptual design of data warehouses from E/Rschemas. In Proceedings of the 31st Hawaii International Conference on System Sciences(HICSS ’98, Kona, Hawai).
GUPTA, H. AND MUMICK, I. 1999. Selection of views to materialize under a maintenance-timeconstraint. In Proceedings of the International Conference on Database Theory (ICDT ’99,Jerusalem, Israel).
GYSSENS, M. AND LAKSHMANAN, L. V. S. 1997. A foundation for multi-dimensional databases.In Proceedings of the 23rd International Conference on Very Large Data Bases (VLDB ’97,Athens, Greece, Aug.). 106–115.
HARINARAYAN, V., RAJARAMAN, A., AND ULLMAN, J. D. 1996. Implementing data cubesefficiently. SIGMOD Rec. 25, 2, 205–216.
INMON, W. H. 1996. Building the Data Warehouse. 2nd ed. John Wiley and Sons, Inc., NewYork, NY.
JARKE, M., LENZERINI, M., AND VASSILIOU, Y., EDS. 1999. Fundamentals of Data Warehousing.Springer-Verlag, Berlin–Heidelberg, Germany.
KIMBALL, R. 1996. The Data Warehouse Toolkit: Practical Techniques for Building Dimen-sional Data Warehouses. John Wiley and Sons, Inc., New York, NY.
LABIO, W. J., ZHUGE, Y., WIENER, J. L., GUPTA, H., GARCÍA-MOLINA, H., AND WIDOM, J. 1997.The WHIPS prototype for data warehouse creation and maintenance. SIGMOD Rec. 26, 2,557–559.
LEHNER, W. 1998. Modeling large-scale OLAP scenarios. In Proceedings of the InternationalConference on European Database Technology (EDBT ’98, Valencia, Spain). 153–167.
MYLOPOULOS, J., CHUNG, L., AND NIXON, B. 1992. Representing and using nonfunctionalrequirements: a process-oriented approach. IEEE Trans. Softw. Eng. 18, 6 (June), 488–497.
THEODORATOS, D. AND SELLIS, T. 1998. Data warehouse schema and instance design. InProceedings of the 17th International Conference on Conceptual Modeling (ER ’98,Singapore). 363–376.
THEODORATOS, D. AND SELLIS, T. 1999. Designing data warehouses. Data Knowl. Eng. 31, 3(June), 279–301.
VASSILIADIS, P., BOUZEGHOUB, M., AND QUIX, C. 1999. Towards quality-oriented data ware-house usage and evolution. In Proceedings of the International Conference on AdvancedInformation Systems Engineering (CAiSE ’99, Heidelberg, Germany). 164–179.
WIDOM, J. 1995. Research problems in data warehousing. In Proceedings of the 1995International Conference on Information and Knowledge Management (CIKM, Baltimore,MD, Nov. 28–Dec. 2), N. Pissinou, A. Silberschatz, E. K. Park, and K. Makki, Eds. ACMPress, New York, NY, 25–30.
Received: March 1999; revised: February 2000; accepted: April 2001
Designing Data Marts for Data Warehouses • 483
ACM Transactions on Software Engineering and Methodology, Vol. 10, No. 4, October 2001.