designing and implementing livestock value chain …designing and implementing livestock value chain...
TRANSCRIPT
guidelines
ISSN
181
0-07
08
10
FAO ANIMAL PRODUCTION AND HEALTH
DESIGNING AND IMPLEMENTING LIVESTOCK VALUE CHAIN STUDIES
A practical aid for Highly Pathogenic and Emerging Disease (HPED) control

Cover photographs:
Left and center: © FAO/Jan HinrichsRight: © FAO/Yves Froehlich
FAO ANIMAL PRODUCTION AND HEALTH
10
guidelines
DESIGNING AND IMPLEMENTING LIVESTOCK VALUE CHAIN STUDIES
FOOD AND AGRICULTURE ORGANIZATION OF THE UNITED NATIONSRome, 2012
A practical aid for Highly Pathogenic and Emerging Disease (HPED) control
Recommended citationFAO. 2012. Designing and implementing livestock value chain studies – A practical aid for Highly Pathogenic and Emerging Disease (HPED) control. FAO Animal Production and Health Guidelines No. 10. Rome.
The designations employed and the presentation of material in thisinformation product do not imply the expression of any opinion whatsoeveron the part of the Food and Agriculture Organization of the United Nations(FAO) concerning the legal or development status of any country, territory, cityor area or of its authorities, or concerning the delimitation of its frontiers orboundaries. The mention of specific companies or products of manufacturers,whether or not these have been patented, does not imply that these havebeen endorsed or recommended by FAO in preference to others of a similarnature that are not mentioned.
The views expressed in this information product are those of the author(s) anddo not necessarily reflect the views of FAO.
ISBN ISBN 978-92-5-107139-7
All rights reserved. FAO encourages reproduction and dissemination ofmaterial in this information product. Non-commercial uses will be authorizedfree of charge, upon request. Reproduction for resale or other commercialpurposes, including educational purposes, may incur fees. Applications forpermission to reproduce or disseminate FAO copyright materials, and allqueries concerning rights and licences, should be addressed by e-mail [email protected] or to the Chief, Publishing Policy and Support Branch,Office of Knowledge Exchange, Research and Extension, FAO,Viale delle Terme di Caracalla, 00153 Rome, Italy.
© FAO 2012
iii
Contents
Acknowledgements v
Purpose of the document 1
Overview: context of value chain studies 3
How value chain studies fit within the wider context of designing disease surveillance and control strategies 3
Definition of value chain and value chain study 4Value chains 4Value chain studies 4
An overview of the practical approach 6
Designing and implementing value chain studies 9
Decide objective and outputs 9Outputs required from value chain studies 10
Recommended data collection and storage methods 11Information to be collected 12Potential data sources 14Choosing the right data collection tool 15
Overview of data analysis and modelling techniques used with an assessment of their strength and weaknesses 23Choosing the right analysis tool / framework 23
Summary 27
Some examples of successful application of tools described in this document 29
Demand driven risk reduction – economic perspective in risk reduction approaches along the value chain 29Application of the methodology 29Discussion and conclusions 30
The value of the network analysis approach –Identifying control points linked with risk data 31Application of the methodology 31Results 32Conclusions 32
Integrating participatory and conventional data collection tools for understanding local chicken market chains 33Application of the methodology and results 33Discussion 34
iv
Cross border mapping with inclusion of cross-border price differentials 34
Value Chain mapping and subsequent risk assessment of cross-border chicken trade between Northern Vietnam and China 35Background 35Methodology 36Findings 36
The use of cross-border mapping and local interviewing of stakeholders to understand the unofficial cattle trade across South East Asia 37Context 37Application of the methodology 37Results 38Perspectives 38
Final words 41
Flexibility 41
Data sharing 42
ANNEX 1Glossary of technical and related terms in Value Chain and
Risk Analysis 43
v
Acknowledgements
The main authors of this document are Nick Taylor1 and Jan Hinrichs2.The authors would like to acknowledge the support of the FAO RAP staff in Bangkok
who worked hard to successfully implement the workshop from which this document is a direct result. Most importantly the authors acknowledge the hard work of all the partici-pants in the workshop. They all contributed their experience to this document and provided useful additional comments during the final drafting.
Likewise, the authors also acknowledge the European Union (EU) for providing full financial support to the development of this publication.
Several of the workshop participants made particular contributions in the chapter "Some examples of successful application of tools described in this document". These people are named within the headings of the sections they contributed.
1 Veterinary Epidemiologist. Veterinary Epidemiology and Economics Research Unit (VEERU) & PAN Livestock
Services Ltd., University of Reading, School of Agriculture, Policy and Development, Earley Gate, PO
Box 237, Reading RG6 6AR, UK. E-Mail: [email protected] 2 Animal Health Economist. FAO Regional Office for Asia and the Pacific (FAO-RAP), 39 Phra Atit Road,
Bangkok 10200,Thailand. E-Mail: [email protected]
1
Purpose of the document
Several production system and market chain studies have been conducted to support dis-ease control interventions in South East Asia. These value chain studies have been very use-ful to enhance understanding about the production system dynamics, product flows and the disease transmission impact of different actors’ incentive structures and behaviours. However, it is felt that more explicit integration of the value chain approach into epide-miologic risk assessments would be beneficial to support animal health decision makers in identifying efficient and equitable disease control interventions.
Some of the early, exploratory field applications of value chain approaches to under-standing disease epidemiology and risk assessment, with a focus on H5N1 HPAI, were used as a basis for the development of a FAO guidelines document (FAO, 20113 – hereafter referred to as “the FAO guidelines document”). The FAO guidelines document provides technical foundations of the value chain approach to management of disease risk and describes a practical approach for the incorporation of risk analysis with descriptive value chain mapping. Suggestions of field techniques are included.
This document is based on a consultative workshop on “The integration of livestock market chain analysis in the control of HPEDs in South and South East Asia”, held from 26 to 27 April 2011 in Bangkok, Thailand (for convenience this will be referred to as “the Bangkok workshop”). Based on the collective experience of the participants in the work-shop, this document sets out to prioritise the set of required data to be collected and to identify effective data collection and analysis techniques. After a brief overview to set the context of value chain studies in animal health decision support, the main body of the document consists of:
A chapter covering the practical aspects of value chain study design, implementation and analysis. This chapter presents an overview of available data collection and ana-lytical tools (a ‘toolbox’) with discussion of the appropriate use of the tools.A chapter describing some current regional experiences with value chain study approaches, containing brief examples of the successful application of different tools.
It is intended that as an adjunct to the FAO guidelines document this document will provide further practical advice that will encourage more effective use of value chain stud-ies in South and South East Asia as part of animal health decision support.
The target audience for this document includes:International and national organizations contracting national institutes to conduct value chain studies and/or organizing capacity building in this subject.Research institutes in ASEAN and SAARC countries conducting livestock sector value chain studies.
3 FAO. 2011. A value chain approach to animal diseases risk management – Technical foundations and practical
framework for field application. Animal Production and Health Guidelines. No. 4. Rome. ISBN 978-92-5-106861-8.
Designing and implementing livestock value chain studies2
Wider audiences include:in Africa AU-IBAR is actively seeking support for Value Chain approaches that will allow design of better, more standardised surveillance systems;there is private sector interest in data and analysis that is whole-chain or Critical Control Point focussed in nature.
This document, along with the more extensive FAO guidelines document, should be helpful as a reference document in the process of commissioning value chain studies for the purpose of supporting design of animal health strategies.
3
Overview: context of value chain studies
HOW VALUE CHAIN STUDIES FIT WITHIN THE WIDER CONTEXT OF DESIGNING DISEASE SURVEILLANCE AND CONTROL STRATEGIESDisease prevention, surveillance and control, whether at national or farm level, state or private resourced, must be planned and implemented in proportion to the risk associated with animal disease. It is unrealistic to implement a very costly programme against a disease hazard that has low risk. In current parlance, planning for disease prevention and control should be ‘risk-based’ and prevention and control measures should be ‘proportionate to the risk assessed’. Furthermore, it is recognised that in livestock production and market-ing systems there are many stakeholders (people, groups and organisations) with different perceptions of the same risk, that may affect, and be affected by, disease hazards in dif-ferent ways, and may face and accept different levels of risk. Different stakeholders may also be affected by prevention and control measures in different ways. Ideally, prevention and control measures should be ‘proportionate to the risk’ faced (and perceived) by each stakeholder, otherwise compensatory mechanisms may be needed to assure compliance and equity.
To achieve this goal requires that two technical issues are addressed together.1. Understanding the livestock production systems (including marketing and input sup-
ply) and the decisions stakeholders make within the livestock production systems in question.
2. Evaluation of disease risks within the livestock production systems in question and of measures to reduce risk.
The first issue falls within what in economics is called ‘value chain analysis’; the second falls within what in veterinary epidemiology is called ‘risk analysis’.
Value chain analysis provides a practical framework for disease risk assessment and ani-mal disease management. It is a tool that can be used to identify key constraints and oppor-tunities within a livestock production system, including possible risk for disease transmis-sion within a value chain and the people involved along the value chain. In turn where the risks are deemed to be high enough and the reduction of these risks is thought to create large impacts on society in general (externalities) public interventions may be appropriate.
Value chain analysis can be a useful tool in such planning insofar as it directs and iden-tifies people and organizations who need to be involved in order for an intervention to succeed. Used in a participatory way, for example, as part of a stakeholder consultation, value chain mapping acts as a focus for communicating knowledge, and can play a very important role in risk communication, thus leading to more transparent decision-making on animal disease management.
Designing and implementing livestock value chain studies4
It is important to remember that value chain analysis complements other tools and information:
Epidemiological information is essential – key activities in generating good epidemio-logical information are surveillance and outbreak investigation;Characterisation of pathogens and analysis of distribution – sample collection from outbreaks and as part of designed surveys with diagnostic testing and detailed char-acterisation of pathogens (e.g. molecular epidemiology) are important in this respect;Known risk factors should form part of the ‘knowledge base’ informing risk analysis in value chains – e.g. it is known that RNA viruses are more likely to emerge as new threats.
DEFINITION OF VALUE CHAIN AND VALUE CHAIN STUDYFor brief definitions of technical terms related to value chains and risk analysis, see Annex 1.
Value chainsValue chains are the linked groups of people and processes by which a specific commod-ity is supplied to the final consumer. These chains have inputs that are used to produce and transport a commodity towards a consumer; this is the supply chain. The value chain encompasses more than the production process; value chain as a term implies a flow of information and incentives between the people involved. Money is sent from the consumer to the different people in the chains to complete the value chain. Understanding the flow of materials through a value chain is important in understanding how risk of disease spread may be engendered in the chain, while understanding the flow and distribution of incen-tives is key to understanding how to manage those risks.
It is important to note that value chains may involve several products, including waste and by-products.
Value chain studies
DescriptionValue chain studies should firstly describe the processes through which livestock and other inputs pass during the production process4 together with the resulting variety of products at the end of the chain. The results often include a flow chart or process map for specific products. Value chain studies must also describe the places where each process occurs and the people involved, and therefore often include annotated maps.
Value chain descriptions provide a good starting point for risk analysis and can be used as part of a stakeholder consultation process to create useful discussions about risk issues and therefore promote good risk communication.
The first output of a value chain study is usually one or several diagrammatic value chain “maps” consisting of boxes representing different people, groups or organizations and/or production/marketing sites in the chain with lines or arrows between these boxes indicating flows of livestock and animal products. Information on seasonal patterns and longer-term
4 See A value chain approach to animal diseases risk management (FAO Animal Production and Health
Guidelines 4) pages 25 to 30.
5Overview: context of value chain studies
trends, product volumes and values, as well as numbers of enterprises or livelihoods sup-ported at each point in the chain, can be presented as seasonal calendars, linked to the charts and maps.
AnalysisValue chain analysis adds to the value chain description by analysing the internal and exter-nal environment of the chain or chains.
A complete value chain analysis would include information on the following:Identification of the products/by-products of interest; - Note that commercial interests focus on one or two products, while for animal
and public health purposes it is necessary to look at the full spectrum of products, including low-value ones such as waste products, cull animals, etc.;
who is involved in the value chain; physical location of activities and of the people in the chain;seasonality of supply and demand;appropriate analysis of profitability5 for different people at different points, including transaction costs between people and points; - It is important to have the units correct: per ton, per animal, etc. This in turn
requires that costs and revenues are, in fact, (i) able to be attributed and, (ii) able to be disaggregated into variable and fixed costs. The same goes for animal health costs and benefits.
- Note that public goods and dynamics are important: costs of disease prevention and control have long term benefits and these may be public in nature. Costs incurred in the value chain are private and pay short term dividends.
who sets regulations or conditions (pressures) for participation in the chain, who applies the rules and ensures compliance with them and/or provides assistance in meeting the conditions, i.e. who governs these chains; - public legislation that impacts on the functioning of the chain; this could include
regulations not directly related to animal health, such as tax regulations favouring different scales of operation;
- contractual arrangements (formal or informal); - private sector regulations;
who and what factors are driving developments or changes in a value chain; this implies a temporal factor for the analysis;a complete value chain analysis will allow an assessment of the equity (e.g. market power) across the chain and its efficiency to convert inputs into products demanded by consumers; - equity can be skewed by governance and poor distribution of information across
chains; for example, traders may have and retain better knowledge of consumer demands than producers so that traders can take advantage of premium markets without passing on benefits to producers;
- presence of disease in the chains will reduce efficiency of the chain.
5 i.e. gross margin analysis or enterprise budget.

Designing and implementing livestock value chain studies6
In the practical application there need to be trade-offs between precise detail and requirements of the users of the study for timely decision making. For the specific purposes of animal disease management and health planning it is important to focus on identifying how people influence risk and react to it in the chain. It is particularly important to describe how chains actually work, not how they ideally work; for example, it is common to find abuse of procedures both by people directly involved in market chains and by those in authority, and this leads to enterprises operating outside regulations. These defects in mar-ket chains can often cause serious animal and public health risks. In such cases it is useful to ask: “Where is the leverage to deliver compliance with measures necessary to reduce risk?”
AN OVERVIEW OF THE PRACTICAL APPROACHDuring the Bangkok workshop it was recognised that value chain analysis and other forms of socio-economic analysis are tools which can be used to support and inform disease control and risk analysis. The different components are linked as shown in Figure 1 below.
A critical issue is to determine where the entry points lie6. Establishing a clear disease control problem or question is an essential starting point and then value chain studies, analysis and other approaches can be selected and re-selected based on an ongoing analy-sis and prioritisation of requirements.
The FAO guidelines document describes a suggested stepwise approach to applying the combination of value chain and risk analysis to an animal health issue. Three steps are summarised as:
FIGURE 1Inter-linkage of disease control, risk assessment,
value-chain and socio-economic analysis
Value Chain Analysis and other socio-economic
analytical tools
Risk mitigation & strategic disease control
Risk Assessment
Animal health issue
6 This has been approached by ICRISAT, ILRI and others by “Innovation Platforms” which are ‘talking shops’ for
people involved in value chains who engage in a cycle of communication using value chain analysis as a
framework to refine problem and opportunity definitions, and help identify the entry points.
7Overview: context of value chain studies
Step 1. Situation analysis and preliminary risk analysisdescriptive epidemiology of the situation regarding the disease(s) of concerndescription of livestock value chains and identification of people and organizations involved in those chainsidentification and characterization of the risk issues7 and risk hotspots in value chains
Step 2. Detailed risk and value chain analysis leading to planning of risk manage-ment options
development of risk pathways and identification of potential risk mitigation measures development of options for inclusion in a risk management strategy
Step 3. Option appraisal and decision-makinganalysis of impacts on different stakeholders
Livestock value chain studies and the information they generate are needed at all three steps. Different specifications of study may be needed at different stages in the process – ‘quick and dirty’ at step (1) and more detailed, rigorous studies in the following steps.
The overall approach merges classical veterinary disease investigation and control measures with a range of socio-economic tools and includes participatory approaches to epidemiological analysis.
Particularly in the second and third steps, the different components of the approach are linked through a dynamic and iterative process, in that value chain analysis will identify priority areas for deeper risk analysis and risk analysis will in turn identify priority questions to be answered by value chain studies.
It was recognised that through the iterative approach some tools could be applied rapidly and give urgent information back to decision makers (e.g. focus group discussions). That information would be of variable quality but would permit timely feedback. Where initial data quality was of concern and/or the significance of the decision being based on the data was high then several tools could be utilized or implemented in greater detail (e.g. value chain analysis could be conducted rapidly to map and identify key stakeholders or could be done in great detail to provide more depth and higher quality of analysis).
7 Here it is only animal disease risk that is referred to. It is of interest to note that the concept of risk in value
chains may also be applied to risks of other kinds of hazard faced by people in value chains. Some are
related to disease risk (the weather) some are not (non-payment) and some have complex feedbacks (efficacy
of surveillance systems and the associated information transfer, and the responses of people to it). Essentially,
this issue places a probability on the profitability assessed.
9
Designing and implementing value chain studies
DECIDE OBJECTIVE AND OUTPUTSDuring the Bangkok workshop it was recognised that the first requirement in setting up a successful value chain study is to establish a clear understanding of the questions to be addressed by the study. Clearly stated questions in turn allow the expected value chain study results to be anticipated and specified.
In general, the combination of value chain mapping and economic analysis with epide-miological risk analysis is useful in Animal Health Planning to:
1. assess the epidemiological and socio-economic justification for different disease control strategies;
2. inform the stakeholders involved in the different disease control strategies;3. evaluate the socio-economic impact of contagious diseases and the socio-economic
sustainability of different control strategies on the different stakeholders affected;4. plan adjustments to control strategies based on both the epidemiological and socio-
economic assessments.In support of animal health planning, some of the key questions that may be addressed
using these techniques include:Which processes within different production and marketing systems carry risk for disease spread, and what are their relative contributions to overall risk? - Understanding role of movements of animals (+ products + inputs) in spread of
disease - implications for disease control? - In case of outbreaks... which markets should be closed etc.?
What are the structural, institutional and governance issues which underlie higher risk situations? - Infrastructure constraints and limitations on value chain operation (e.g. availability
of specialised transport, existence of slaughter facilities... etc. etc. ...). - Distribution of incentives in the chains. - Rules and agreements (state and local / written and unwritten) that dictate behav-
iour of people in the chains.Overall, which production systems carry more risk and therefore justify more regulation/intervention? [risk assessment in value chains] - For example, with respect to H5N1 HPAI, should the priority be to deal with back-
yard poultry or do some other commercial systems require urgent attention? - And, how do people within these systems influence the level of risk through their
behaviour? – which people have more influence than others?
Designing and implementing livestock value chain studies10
Who are affected by risky processes/points, and how much? - Who could be affected by any disease hazards (and how)... [impact assessment and
risk assessment in value chains]?Who has most to gain or lose through risk mitigation interventions? - Who could be affected by any proposed control measures (and how)... and what
are the alternatives [impact assessment and risk assessment in value chains]?How can the state and/or other stakeholders including the private sector, agribusiness and civil society, act to promote less risky operating environ-ments for livestock production? - What are the possible impacts / consequences of major re-structuring plans [dis-
ease risk changes; stakeholder socio-economic impacts]? - How can (disease free / controlled) compartments be defined / established? - What are the options for controlling / managing cross-border disease risk?
Where in a country are the ‘risk hotspots’ (for example, locations where there is higher risk of disease emergence and/or spread)?When in the year are the high risk times?Where and when should control measures be targeted (in other words, iden-tification of critical control points)?Where and when should surveillance be targeted?
Outputs required from value chain studiesWhen commissioning or designing value chain studies to support animal health planning it must be remembered that, whereas the original focus of value chain analysis is on improv-ing market efficiency, the focus for this purpose needs to be on risks of disease transmission in the production and market chain. Value chain studies can yield a mixture of quantitative and qualitative data:
Quantitative data on: animal origin areas, location and volume of movement cor-ridors, congregation points, processing points and consumption areas; price differ-entials and margins.Qualitative data on: practices of actors in the chain; governance, regulation and con-trol of the chains; regulation, linkages and trust; knowledge, skills, technology and support service options for risk reduction.
Step1. Outputs from situation analysis and preliminary risk analysisThe first step of a value chain study focused on disease risk must result in the following outputs:
Identified people, groups and organizations in the livestock value chain from the input supplier to the producer, trader, processor, retailer and through to the final consumer.Mapped routes to markets for specified livestock and livestock products, which could be what currently exists and what potentially is available or could be developed.Identified opportunities for disease transmission (the big ‘risk issues’) and hotspots.
11Designing and implementing value chain studies
Step 2. Outputs from detailed risk and value chain analysisAs a second step a more detailed risk and value chain analysis should lead to the following outputs:
Identified practices that tend to increase risk for disease transmission and the preva-lence of these practices;Developed practices (regulated or not) aimed at risk reduction (good production practices including bio-security) and compliance with these;Assessed resources and capability of people in the chains to react to disease challenges.
Step 3. Outputs from option appraisal and decision-makingA risk mitigation strategy is the required output for the last step in the process of analysing value chains. Risk mitigation approaches should be consistent with economic incentives across the supply chain. This requires the value chain analysis to consider the multiple fac-tors that affect economic behaviour and have implications for risk mitigation. These factors include basic market incentives, perception and beliefs about risk, institutions operating in the chain, and socio-economic factors affecting all the actors in the chain.
Consumer preferences for livestock products shape value chain structure and can either support or undermine efforts to control disease. Demand driven approaches8 to risk mitigation require both a clear understanding of consumer preferences and the economic behaviour of all actors in livestock market supply chains. Effective and credible tracing and certification systems need to be developed to utilize consumer willingness to pay for safe livestock products.
RECOMMENDED DATA COLLECTION AND STORAGE METHODSHere we summarise the prioritized information needed to answer questions such as those listed above and to produce the outputs as described above. The data collection process is following the suggested stepwise approach to value chain and risk analysis. Data collection tools are described that are among the most useful approaches to providing the required information.
Information to be collectedStep 1. Data for situation analysis and preliminary risk analysis:Information needs to be collected on the key people involved, the segmented markets supplying segments of consumer needs, how chains may change over time (seasonal) or regional (spatial) differences.
Key items of data to be collected are described below.
8 Demand driven approaches are approaches that rely on the consumer preferentially selecting products that
derive from chains that carry less disease risk.
Designing and implementing livestock value chain studies12
Description of the value chainWhat are the products?
TIP 1
It is useful to begin with a less detailed overview approach and then target the ‘hotspots’ or
‘risk issues’ for more detailed data collection. The important thing is that at the initial rough
overview stage all the areas of the value chain are covered, and all potentially useful data items
are at least briefly noted (perhaps just listing or cataloguing data items without collecting actual
data). In general, the aim should be for a comprehensive, if less detailed initial overview to be
followed by detailed focus on the high risk issues. The overview should be constantly referred
back to in order to ensure that in the detailed analysis stages, potentially important areas are
not forgotten or otherwise overlooked.
Who are the stakeholders? - How are they involved, what are their roles? - Connections/relationships between stakeholders - Level of influence of different stakeholders
What does the institutional landscape look like? - Which institutions are present, how strong are they, what relationships exist? - What institutional gaps might exist, what is the likely consequence?
Practices along the production and marketing chain (including payment methods) - Important in disease control as it means tracking when an animal changes hands
and who is left with the loss if it suddenly becomes ill/valueless or dies.Consumption trends: quantity and quality of meat demanded - Profiling of stakeholders and classification of consumer groups
Infrastructure in place
Details to be includedIdentify all products and characterise them.Identify all stakeholders (e.g. make sure those dealing with waste and by-products are included) – cover all branches of value chainSeasonal factors (production, demand, supply)Production, processing and distribution system analysis (characterisation of different systems) - Define production systems - Map production systems - Identify extant or possible collective action - this alters the cost landscape, particu-
larly where there are variable and fixed cost dichotomiesPerceptions of stakeholders (what is “acceptable” profit / risk (risk in both a disease and an economic sense), livelihoods / vulnerability, knowledge about disease)Movements of products - Patterns of trade - Geographic mapping of trade routes (local and international)
Links/crossing between value chains
13Designing and implementing value chain studies
TIP 2
To fully cover all areas of possible disease risk it is important to include non-monetary value
chains – one may need to include non-livestock chains if there are overlapping chains with
disease risk implications (e.g. forestry products – forest margin development / encroachment
alongside people with livestock).
TIP 3
There are significant challenges to be faced with data collection:
It is usually difficult to identify a sampling frame/sample for credible random sampling
because:
- categories of value chain actors are not always well-defined – individuals doing mul-
tiple functions or dealing with different products from day-to-day;
- traders especially are highly mobile and difficult to ‘catch’.
The nature of supply flows in informal markets are especially non-linear and dynamic –
changing from day-to-day, with many cases of non-repeated transactions/functions/activi-
ties.
It is difficult to get ‘representative’ budget information – highly variable given the non-
linearity of supply systems, lack of records to be able to evaluate variability over time.
In addition to ‘predictable’ seasonal variations, it is important to recognise and record daily
variability in quantities and values.
Socio-economic value chain dataThe collection of socio-economic data should provide understanding of the incentive struc-ture for stakeholders, for example to comply with risk reduction measures. We also need to know existing institutional arrangements and how they may interact on value chains.
Formal and informal contracts between stakeholders, including the credit and financ-ing arrangements in exchange of products and servicesWhat are their motivations for behaviour change (especially what factors might influ-ence behavioural changes and changes to practices)?Value, batch size and frequency of transactionsProfit margin and sales volume at different points in the chain Contribution of the value chain related activity to the household income of the stakeholdersRegulatory mechanisms (formal and informal) – Institutions (Including the potential geographical variation in the capacity and/or regulation of institutions, e.g. district veterinary offices)Certification / inspection / regulations – both the ‘written’ rules but also the practical credibility of certification
Designing and implementing livestock value chain studies14
Step 2. Data for the development of risk management optionsAt the stage of development of risk management options, value chain studies should provide information about:
Stakeholders’ attitude to disease (including different groups of consumers) - Self-coping methods in contrast to imposed control measures - information on compliance of actors towards possible interventions
What contributions do different groups make to the epidemiology of the disease (spread, maintenance, transmission) [value chain study combined with risk analysis]?.Information of particular stakeholders that can impact on control (e.g. remuneration).Temporary value changes when disease occurs - Stakeholders’ reaction to disease and control measures (e.g. selling sick livestock,
purposely infecting livestock or moving livestock to get compensation, smuggling to avoid quarantines)
Are (how are) stakeholders organised? Are there groups that can be worked with?Existing disease control policies - commitment of government at all levels to control diseases (level of response) - capacities, resources, etc. of the veterinary services – cost structure (institutions
and individuals)
Step 3. Data for option appraisal and decision makingThe data collected during step 1 and 2 represents the base for this step very few additional data might be required. However, in order to analyse the impact and feasibility of devel-oped risk management options further information from the affected stakeholders might be required. This would include:
What is expected to comply with control measures – how does this interact with the interests of specific value chain actors (budgets and margins, cultural beliefs or behaviours)?What has a chance to be implemented (e.g. in terms of capacity of specific value chain actors; backyard farmers may have lower or no interest to comply)?
Potential data sources
Primary sources (the people involved in value chains themselves)1. Individuals
Individual livestock input suppliers (different types / levels)Individual livestock producers (different types / levels)Individual livestock traders (different types / levels)Individual livestock product processors (different types / levels)Individual livestock product consumersIndividual livestock value chain infrastructure providers (e.g. market workers, trans-port drivers, veterinarians and animal health workers)
15Designing and implementing value chain studies
2. Groups and RepresentativesInput suppliers’ trade associationsProducers’ associationsTraders’ associationsProcessing and marketing associationsIndividual slaughterhouses’ and milk plants’Consumer groupsVeterinary associationsGovernment departments
Secondary sourcesExisting livestock sector reviewsCensus and other population statistics (human, livestock populations, income, con-sumption, productivity, market volumes)Market price monitoring databasesProject documents and reports‘Experts’ Baseline trade dataReview of existing disease prevalenceOutbreak investigations
TIP 4
Data about livestock movement can be obtained by following and directly observing:
Traders
- Traders will share price and trade volume data if trust is established and they are well
informed about what the information is used for.
- Traders & other market chain participants might not be willing to share their buying
prices /margins but generally will share selling prices. If all participants are interviewed
margins can accordingly be backed out from selling prices.
- Focus group discussion with traders might only work if participating traders are not
competitors.
Livestock in transit / transport
- The movement of livestock herds or trucks transporting livestock can be directly
observed and give an indication of volumes and directions.
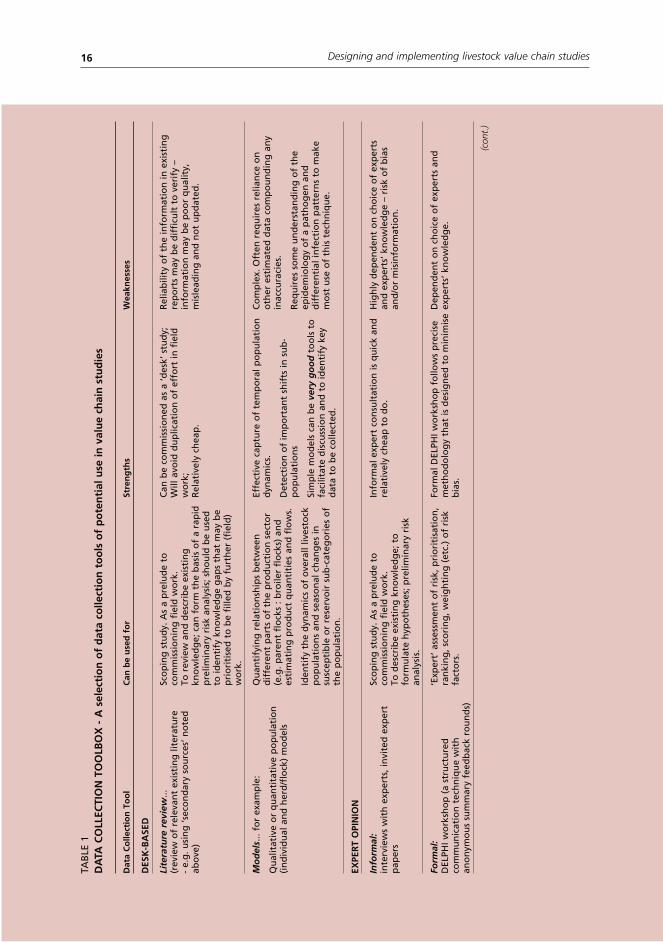
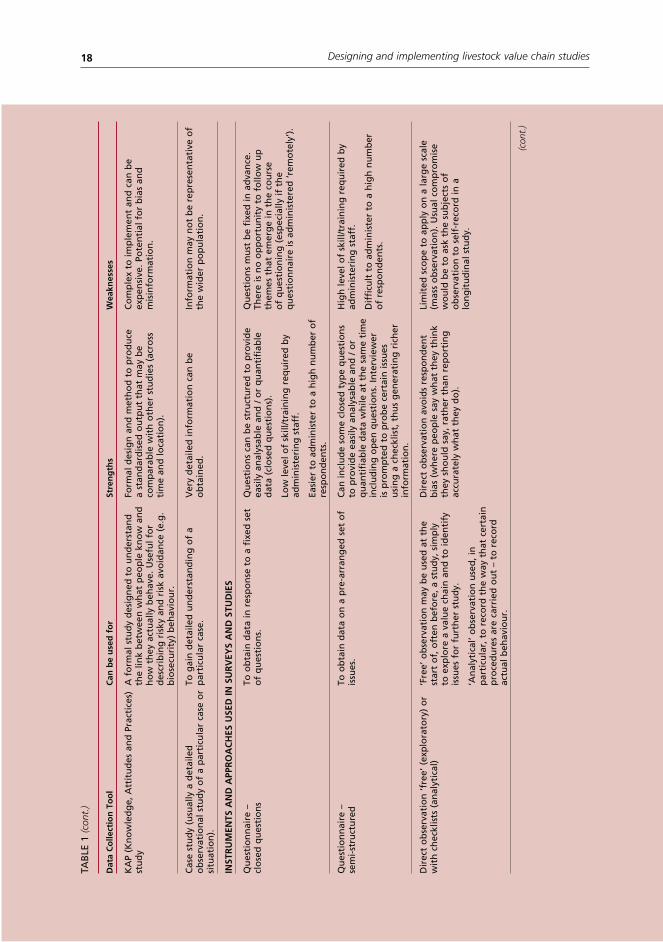
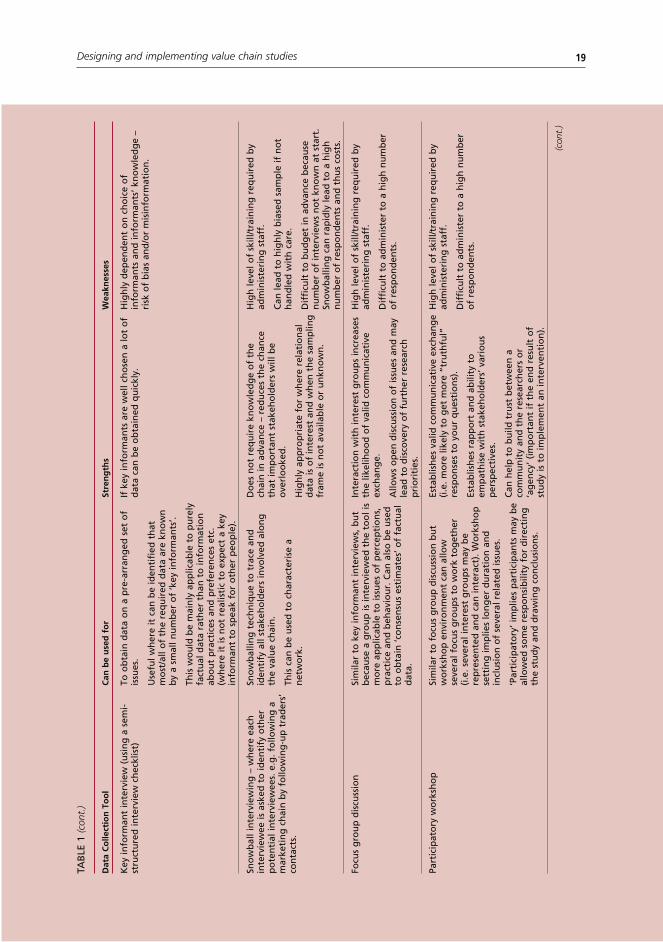
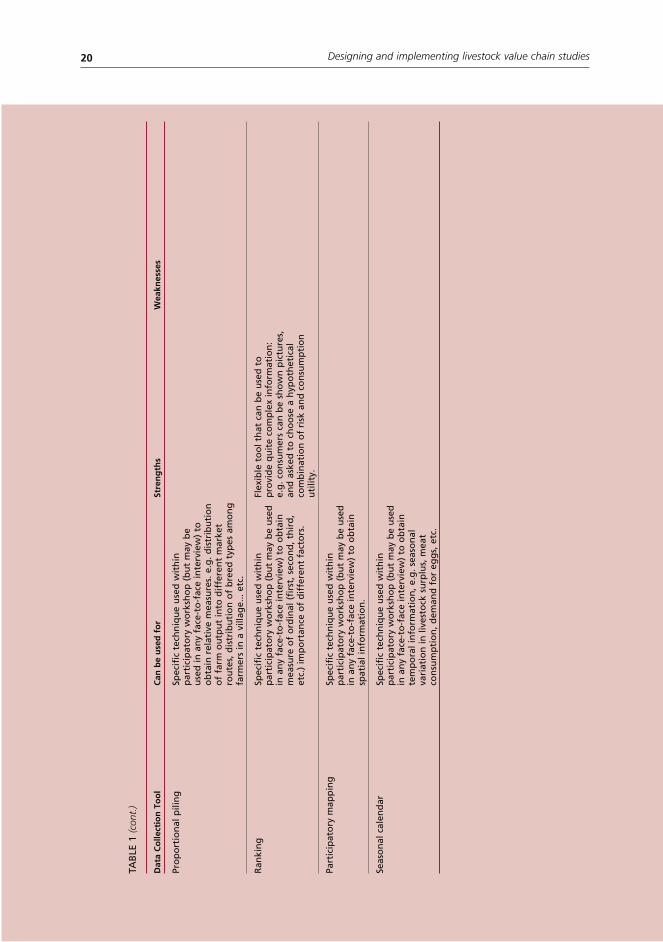
Choosing the right data collection toolDuring the Bangkok workshop the following data collection tools were identified and discussed (Table 1). This list is by no means exhaustive, and other tools may be useful in particular situations.
Designing and implementing livestock value chain studies16
TAB
LE 1
DA
TA C
OLL
ECTI
ON
TO
OLB
OX
- A
sel
ecti
on
of
dat
a co
llect
ion
to
ols
of
po
ten
tial
use
in v
alu
e ch
ain
stu
die
s
Dat
a C
olle
ctio
n T
oo
lC
an b
e u
sed
fo
rSt
ren
gth
sW
eakn
esse
s
DES
K-B
ASE
D
Lite
ratu
re r
evie
w...
(r
evie
w o
f re
leva
nt
exis
tin
g li
tera
ture
-
e.g
. usi
ng
‘sec
on
dar
y so
urc
es’ n
ote
d
abo
ve)
Sco
pin
g s
tud
y. A
s a
pre
lud
e to
co
mm
issi
on
ing
fie
ld w
ork
. To
rev
iew
an
d d
escr
ibe
exis
tin
g
kno
wle
dg
e; c
an f
orm
th
e b
asis
of
a ra
pid
p
relim
inar
y ri
sk a
nal
ysis
; sh
ou
ld b
e u
sed
to
iden
tify
kn
ow
led
ge
gap
s th
at m
ay b
e p
rio
riti
sed
to
be
fille
d b
y fu
rth
er (
fiel
d)
wo
rk.
Can
be
com
mis
sio
ned
as
a ‘d
esk’
stu
dy;
W
ill a
void
du
plic
atio
n o
f ef
fort
in f
ield
w
ork
; R
elat
ivel
y ch
eap
.
Rel
iab
ility
of
the
info
rmat
ion
in e
xist
ing
re
po
rts
may
be
dif
ficu
lt t
o v
erif
y –
info
rmat
ion
may
be
po
or
qu
alit
y,
mis
lead
ing
an
d n
ot
up
dat
ed.
Mo
del
s...
for
exam
ple
:
Qu
alit
ativ
e o
r q
uan
tita
tive
po
pu
lati
on
(i
nd
ivid
ual
an
d h
erd
/flo
ck)
mo
del
s
Qu
anti
fyin
g r
elat
ion
ship
s b
etw
een
d
iffe
ren
t p
arts
of
the
pro
du
ctio
n s
ecto
r (e
.g. p
aren
t fl
ock
s : b
roile
r fl
ock
s) a
nd
es
tim
atin
g p
rod
uct
qu
anti
ties
an
d f
low
s.
Iden
tify
th
e d
ynam
ics
of
ove
rall
lives
tock
p
op
ula
tio
ns
and
sea
son
al c
han
ges
in
susc
epti
ble
or
rese
rvo
ir s
ub
-cat
ego
ries
of
the
po
pu
lati
on
.
Effe
ctiv
e ca
ptu
re o
f te
mp
ora
l po
pu
lati
on
d
ynam
ics.
Det
ecti
on
of
imp
ort
ant
shif
ts in
su
b-
po
pu
lati
on
s
Sim
ple
mo
del
s ca
n b
e ve
ry g
oo
d t
oo
ls t
o
faci
litat
e d
iscu
ssio
n a
nd
to
iden
tify
key
d
ata
to b
e co
llect
ed.
Co
mp
lex.
Oft
en r
equ
ires
rel
ian
ce o
n
oth
er e
stim
ated
dat
a co
mp
ou
nd
ing
an
y in
accu
raci
es.
Req
uir
es s
om
e u
nd
erst
and
ing
of
the
epid
emio
log
y o
f a
pat
ho
gen
an
d
dif
fere
nti
al in
fect
ion
pat
tern
s to
mak
e m
ost
use
of
this
tec
hn
iqu
e.
EXPE
RT
OPI
NIO
N
Info
rmal
: in
terv
iew
s w
ith
exp
erts
, in
vite
d e
xper
t p
aper
s
Sco
pin
g s
tud
y. A
s a
pre
lud
e to
co
mm
issi
on
ing
fie
ld w
ork
. To
des
crib
e ex
isti
ng
kn
ow
led
ge;
to
fo
rmu
late
hyp
oth
eses
; pre
limin
ary
risk
an
alys
is.
Info
rmal
exp
ert
con
sult
atio
n is
qu
ick
and
re
lati
vely
ch
eap
to
do
.H
igh
ly d
epen
den
t o
n c
ho
ice
of
exp
erts
an
d e
xper
ts’ k
no
wle
dg
e –
risk
of
bia
s an
d/o
r m
isin
form
atio
n.
Form
al:
DEL
PHI w
ork
sho
p (
a st
ruct
ure
d
com
mu
nic
atio
n t
ech
niq
ue
wit
h
ano
nym
ou
s su
mm
ary
feed
bac
k ro
un
ds)
‘Exp
ert’
ass
essm
ent
of
risk
, pri
ori
tisa
tio
n,
ran
kin
g, s
cori
ng
, wei
gh
tin
g (
etc.
) o
f ri
sk
fact
ors
.
Form
al D
ELPH
I wo
rksh
op
fo
llow
s p
reci
se
met
ho
do
log
y th
at is
des
ign
ed t
o m
inim
ise
bia
s.
Dep
end
ent
on
ch
oic
e o
f ex
per
ts a
nd
ex
per
ts’ k
no
wle
dg
e.
(con
t.)
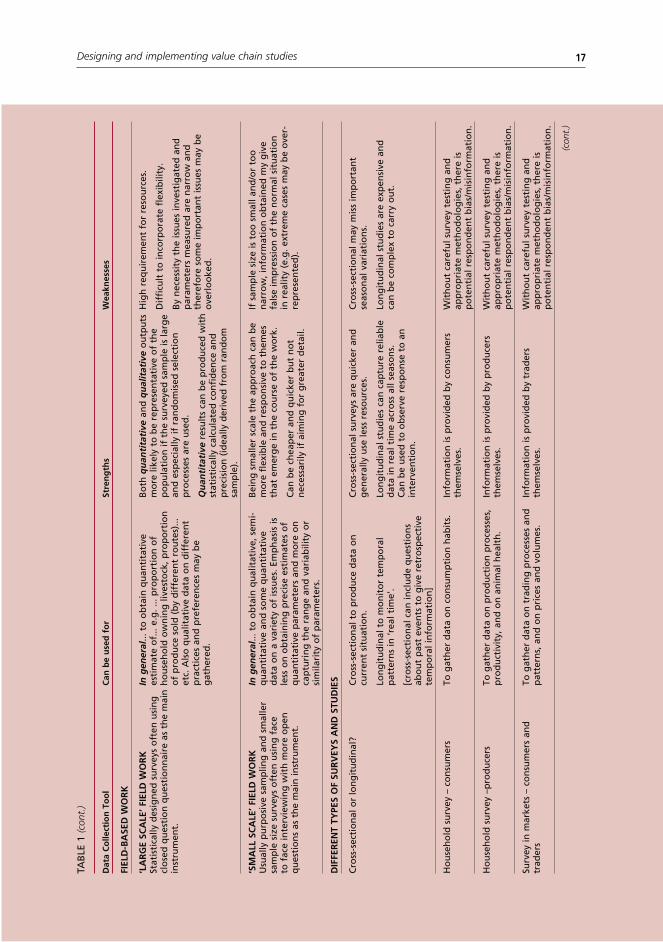
17Designing and implementing value chain studies
Dat
a C
olle
ctio
n T
oo
lC
an b
e u
sed
fo
rSt
ren
gth
sW
eakn
esse
s
FIEL
D-B
ASE
D W
OR
K
‘LA
RG
E SC
ALE
’ FIE
LD W
OR
K
Stat
isti
cally
des
ign
ed s
urv
eys
oft
en u
sin
g
clo
sed
qu
esti
on
qu
esti
on
nai
re a
s th
e m
ain
in
stru
men
t.
In g
ener
al...
to
ob
tain
qu
anti
tati
ve
esti
mat
e o
f...
e.g
. ...
pro
po
rtio
n o
f h
ou
seh
old
ow
nin
g li
vest
ock
, pro
po
rtio
n
of
pro
du
ce s
old
(b
y d
iffe
ren
t ro
ute
s)...
et
c. A
lso
qu
alit
ativ
e d
ata
on
dif
fere
nt
pra
ctic
es a
nd
pre
fere
nce
s m
ay b
e g
ath
ered
.
Bo
th q
uan
tita
tive
an
d q
ual
itat
ive
ou
tpu
ts
mo
re li
kely
to
be
rep
rese
nta
tive
of
the
po
pu
lati
on
if t
he
surv
eyed
sam
ple
is la
rge
and
esp
ecia
lly if
ran
do
mis
ed s
elec
tio
n
pro
cess
es a
re u
sed
.
Qu
anti
tati
ve r
esu
lts
can
be
pro
du
ced
wit
h
stat
isti
cally
cal
cula
ted
co
nfi
den
ce a
nd
p
reci
sio
n (
idea
lly d
eriv
ed f
rom
ran
do
m
sam
ple
).
Hig
h r
equ
irem
ent
for
reso
urc
es.
Dif
ficu
lt t
o in
corp
ora
te f
lexi
bili
ty.
By
nec
essi
ty t
he
issu
es in
vest
igat
ed a
nd
p
aram
eter
s m
easu
red
are
nar
row
an
d
ther
efo
re s
om
e im
po
rtan
t is
sues
may
be
ove
rlo
oke
d.
‘SM
ALL
SC
ALE
’ FIE
LD W
OR
K
Usu
ally
pu
rpo
sive
sam
plin
g a
nd
sm
alle
r sa
mp
le s
ize
surv
eys
oft
en u
sin
g f
ace
to f
ace
inte
rvie
win
g w
ith
mo
re o
pen
q
ues
tio
ns
as t
he
mai
n in
stru
men
t.
In g
ener
al...
to
ob
tain
qu
alit
ativ
e, s
emi-
qu
anti
tati
ve a
nd
so
me
qu
anti
tati
ve
dat
a o
n a
var
iety
of
issu
es. E
mp
has
is is
le
ss o
n o
bta
inin
g p
reci
se e
stim
ates
of
qu
anti
tati
ve p
aram
eter
s an
d m
ore
on
ca
ptu
rin
g t
he
ran
ge
and
var
iab
ility
or
sim
ilari
ty o
f p
aram
eter
s.
Bei
ng
sm
alle
r sc
ale
the
app
roac
h c
an b
e m
ore
fle
xib
le a
nd
res
po
nsi
ve t
o t
hem
es
that
em
erg
e in
th
e co
urs
e o
f th
e w
ork
.
Can
be
chea
per
an
d q
uic
ker
bu
t n
ot
nec
essa
rily
if a
imin
g f
or
gre
ater
det
ail.
If s
amp
le s
ize
is t
oo
sm
all a
nd
/or
too
n
arro
w, i
nfo
rmat
ion
ob
tain
ed m
y g
ive
fals
e im
pre
ssio
n o
f th
e n
orm
al s
itu
atio
n
in r
ealit
y (e
.g. e
xtre
me
case
s m
ay b
e o
ver-
rep
rese
nte
d).
DIF
FER
ENT
TYPE
S O
F SU
RV
EYS
AN
D S
TUD
IES
Cro
ss-s
ecti
on
al o
r lo
ng
itu
din
al?
Cro
ss-s
ecti
on
al t
o p
rod
uce
dat
a o
n
curr
ent
situ
atio
n.
Lon
git
ud
inal
to
mo
nit
or
tem
po
ral
pat
tern
s in
‘rea
l tim
e’.
[cro
ss-s
ecti
on
al c
an in
clu
de
qu
esti
on
s ab
ou
t p
ast
even
ts t
o g
ive
retr
osp
ecti
ve
tem
po
ral i
nfo
rmat
ion
]
Cro
ss-s
ecti
on
al s
urv
eys
are
qu
icke
r an
d
gen
eral
ly u
se le
ss r
eso
urc
es.
Lon
git
ud
inal
stu
die
s ca
n c
aptu
re r
elia
ble
d
ata
in r
eal t
ime
acro
ss a
ll se
aso
ns.
C
an b
e u
sed
to
ob
serv
e re
spo
nse
to
an
in
terv
enti
on
.
Cro
ss-s
ecti
on
al m
ay m
iss
imp
ort
ant
seas
on
al v
aria
tio
ns.
Lon
git
ud
inal
stu
die
s ar
e ex
pen
sive
an
d
can
be
com
ple
x to
car
ry o
ut.
Ho
use
ho
ld s
urv
ey –
co
nsu
mer
s To
gat
her
dat
a o
n c
on
sum
pti
on
hab
its.
Info
rmat
ion
is p
rovi
ded
by
con
sum
ers
them
selv
es.
Wit
ho
ut
care
ful s
urv
ey t
esti
ng
an
d
app
rop
riat
e m
eth
od
olo
gie
s, t
her
e is
p
ote
nti
al r
esp
on
den
t b
ias/
mis
info
rmat
ion
.
Ho
use
ho
ld s
urv
ey –
pro
du
cers
To g
ath
er d
ata
on
pro
du
ctio
n p
roce
sses
, p
rod
uct
ivit
y, a
nd
on
an
imal
hea
lth
.In
form
atio
n is
pro
vid
ed b
y p
rod
uce
rs
them
selv
es.
Wit
ho
ut
care
ful s
urv
ey t
esti
ng
an
d
app
rop
riat
e m
eth
od
olo
gie
s, t
her
e is
p
ote
nti
al r
esp
on
den
t b
ias/
mis
info
rmat
ion
.
Surv
ey in
mar
kets
– c
on
sum
ers
and
tr
ader
sTo
gat
her
dat
a o
n t
rad
ing
pro
cess
es a
nd
p
atte
rns,
an
d o
n p
rice
s an
d v
olu
mes
.In
form
atio
n is
pro
vid
ed b
y tr
ader
s th
emse
lves
. W
ith
ou
t ca
refu
l su
rvey
tes
tin
g a
nd
ap
pro
pri
ate
met
ho
do
log
ies,
th
ere
is
po
ten
tial
res
po
nd
ent
bia
s/m
isin
form
atio
n.
(con
t.)
TAB
LE 1
(con
t.)
Designing and implementing livestock value chain studies18
Dat
a C
olle
ctio
n T
oo
lC
an b
e u
sed
fo
rSt
ren
gth
sW
eakn
esse
s
KA
P (K
no
wle
dg
e, A
ttit
ud
es a
nd
Pra
ctic
es)
stu
dy
A f
orm
al s
tud
y d
esig
ned
to
un
der
stan
d
the
link
bet
wee
n w
hat
peo
ple
kn
ow
an
d
ho
w t
hey
act
ual
ly b
ehav
e. U
sefu
l fo
r d
escr
ibin
g r
isky
an
d r
isk
avo
idan
ce (
e.g
. b
iose
curi
ty)
beh
avio
ur.
Form
al d
esig
n a
nd
met
ho
d t
o p
rod
uce
a
stan
dar
dis
ed o
utp
ut
that
may
be
com
par
able
wit
h o
ther
stu
die
s (a
cro
ss
tim
e an
d lo
cati
on
).
Co
mp
lex
to im
ple
men
t an
d c
an b
e ex
pen
sive
. Po
ten
tial
fo
r b
ias
and
m
isin
form
atio
n.
Cas
e st
ud
y (u
sual
ly a
det
aile
d
ob
serv
atio
nal
stu
dy
of
a p
arti
cula
r ca
se o
r si
tuat
ion
).
To g
ain
det
aile
d u
nd
erst
and
ing
of
a p
arti
cula
r ca
se.
Ver
y d
etai
led
info
rmat
ion
can
be
ob
tain
ed.
Info
rmat
ion
may
no
t b
e re
pre
sen
tati
ve o
f th
e w
ider
po
pu
lati
on
.
INST
RU
MEN
TS A
ND
APP
RO
AC
HES
USE
D IN
SU
RV
EYS
AN
D S
TUD
IES
Qu
esti
on
nai
re –
cl
ose
d q
ues
tio
ns
To o
bta
in d
ata
in r
esp
on
se t
o a
fix
ed s
et
of
qu
esti
on
s.Q
ues
tio
ns
can
be
stru
ctu
red
to
pro
vid
e ea
sily
an
alys
able
an
d /
or
qu
anti
fiab
le
dat
a (c
lose
d q
ues
tio
ns)
.
Low
leve
l of
skill
/tra
inin
g r
equ
ired
by
adm
inis
teri
ng
sta
ff.
Easi
er t
o a
dm
inis
ter
to a
hig
h n
um
ber
of
resp
on
den
ts.
Qu
esti
on
s m
ust
be
fixe
d in
ad
van
ce.
Ther
e is
no
op
po
rtu
nit
y to
fo
llow
up
th
emes
th
at e
mer
ge
in t
he
cou
rse
of
qu
esti
on
ing
(es
pec
ially
if t
he
qu
esti
on
nai
re is
ad
min
iste
red
‘rem
ote
ly’)
.
Qu
esti
on
nai
re –
se
mi-
stru
ctu
red
To o
bta
in d
ata
on
a p
re-a
rran
ged
set
of
issu
es.
Can
incl
ud
e so
me
clo
sed
typ
e q
ues
tio
ns
to p
rovi
de
easi
ly a
nal
ysab
le a
nd
/ o
r q
uan
tifi
able
dat
a w
hile
at
the
sam
e ti
me
incl
ud
ing
op
en q
ues
tio
ns.
Inte
rvie
wer
is
pro
mp
ted
to
pro
be
cert
ain
issu
es
usi
ng
a c
hec
klis
t, t
hu
s g
ener
atin
g r
ich
er
info
rmat
ion
.
Hig
h le
vel o
f sk
ill/t
rain
ing
req
uir
ed b
y ad
min
iste
rin
g s
taff
.
Dif
ficu
lt t
o a
dm
inis
ter
to a
hig
h n
um
ber
o
f re
spo
nd
ents
.
Dir
ect
ob
serv
atio
n ‘f
ree’
(ex
plo
rato
ry)
or
wit
h c
hec
klis
ts (
anal
ytic
al)
‘Fre
e’ o
bse
rvat
ion
may
be
use
d a
t th
e st
art
of,
oft
en b
efo
re, a
stu
dy,
sim
ply
to
exp
lore
a v
alu
e ch
ain
an
d t
o id
enti
fy
issu
es f
or
furt
her
stu
dy.
‘An
alyt
ical
’ ob
serv
atio
n u
sed
, in
p
arti
cula
r, t
o r
eco
rd t
he
way
th
at c
erta
in
pro
ced
ure
s ar
e ca
rrie
d o
ut
– to
rec
ord
ac
tual
beh
avio
ur.
Dir
ect
ob
serv
atio
n a
void
s re
spo
nd
ent
bia
s (w
her
e p
eop
le s
ay w
hat
th
ey t
hin
k th
ey s
ho
uld
say
, rat
her
th
an r
epo
rtin
g
accu
rate
ly w
hat
th
ey d
o).
Lim
ited
sco
pe
to a
pp
ly o
n a
larg
e sc
ale
(mas
s o
bse
rvat
ion
). U
sual
co
mp
rom
ise
wo
uld
be
to a
sk t
he
sub
ject
s o
f o
bse
rvat
ion
to
sel
f-re
cord
in a
lo
ng
itu
din
al s
tud
y.
(con
t.)
TAB
LE 1
(con
t.)
19Designing and implementing value chain studies
Dat
a C
olle
ctio
n T
oo
lC
an b
e u
sed
fo
rSt
ren
gth
sW
eakn
esse
s
Key
info
rman
t in
terv
iew
(u
sin
g a
sem
i-st
ruct
ure
d in
terv
iew
ch
eckl
ist)
To
ob
tain
dat
a o
n a
pre
-arr
ang
ed s
et o
f is
sues
.
Use
ful w
her
e it
can
be
iden
tifi
ed t
hat
m
ost
/all
of
the
req
uir
ed d
ata
are
kno
wn
b
y a
smal
l nu
mb
er o
f ‘k
ey in
form
ants
’.
This
wo
uld
be
mai
nly
ap
plic
able
to
pu
rely
fa
ctu
al d
ata
rath
er t
han
to
info
rmat
ion
ab
ou
t p
ract
ices
an
d p
refe
ren
ces
etc.
(w
her
e it
is n
ot
real
isti
c to
exp
ect
a ke
y in
form
ant
to s
pea
k fo
r o
ther
peo
ple
).
If k
ey in
form
ants
are
wel
l ch
ose
n a
lot
of
dat
a ca
n b
e o
bta
ined
qu
ickl
y.H
igh
ly d
epen
den
t o
n c
ho
ice
of
info
rman
ts a
nd
info
rman
ts’ k
no
wle
dg
e –
risk
of
bia
s an
d/o
r m
isin
form
atio
n.
Sno
wb
all i
nte
rvie
win
g –
wh
ere
each
in
terv
iew
ee is
ask
ed t
o id
enti
fy o
ther
p
ote
nti
al in
terv
iew
ees.
e.g
. fo
llow
ing
a
mar
keti
ng
ch
ain
by
follo
win
g-u
p t
rad
ers’
co
nta
cts.
Sno
wb
allin
g t
ech
niq
ue
to t
race
an
d
iden
tify
all
stak
eho
lder
s in
volv
ed a
lon
g
the
valu
e ch
ain
.
This
can
be
use
d t
o c
har
acte
rise
a
net
wo
rk.
Do
es n
ot
req
uir
e kn
ow
led
ge
of
the
chai
n in
ad
van
ce –
red
uce
s th
e ch
ance
th
at im
po
rtan
t st
akeh
old
ers
will
be
ove
rlo
oke
d.
Hig
hly
ap
pro
pri
ate
for
wh
ere
rela
tio
nal
d
ata
is o
f in
tere
st a
nd
wh
en t
he
sam
plin
g
fram
e is
no
t av
aila
ble
or
un
kno
wn
.
Hig
h le
vel o
f sk
ill/t
rain
ing
req
uir
ed b
y ad
min
iste
rin
g s
taff
.
Can
lead
to
hig
hly
bia
sed
sam
ple
if n
ot
han
dle
d w
ith
car
e.
Dif
ficu
lt t
o b
ud
get
in a
dva
nce
bec
ause
n
um
ber
of
inte
rvie
ws
no
t kn
ow
n a
t st
art.
Sn
ow
bal
ling
can
rap
idly
lead
to
a h
igh
n
um
ber
of
resp
on
den
ts a
nd
th
us
cost
s.
Focu
s g
rou
p d
iscu
ssio
nSi
mila
r to
key
info
rman
t in
terv
iew
s, b
ut
bec
ause
a g
rou
p is
inte
rvie
wed
th
e to
ol i
s m
ore
ap
plic
able
to
issu
es o
f p
erce
pti
on
s,
pra
ctic
e an
d b
ehav
iou
r. C
an a
lso
be
use
d
to o
bta
in ‘c
on
sen
sus
esti
mat
es’ o
f fa
ctu
al
dat
a.
Inte
ract
ion
wit
h in
tere
st g
rou
ps
incr
ease
s th
e lik
elih
oo
d o
f va
lid c
om
mu
nic
ativ
e ex
chan
ge.
Allo
ws
op
en d
iscu
ssio
n o
f is
sues
an
d m
ay
lead
to
dis
cove
ry o
f fu
rth
er r
esea
rch
p
rio
riti
es.
Hig
h le
vel o
f sk
ill/t
rain
ing
req
uir
ed b
y ad
min
iste
rin
g s
taff
.
Dif
ficu
lt t
o a
dm
inis
ter
to a
hig
h n
um
ber
o
f re
spo
nd
ents
.
Part
icip
ato
ry w
ork
sho
pSi
mila
r to
fo
cus
gro
up
dis
cuss
ion
bu
t w
ork
sho
p e
nvi
ron
men
t ca
n a
llow
se
vera
l fo
cus
gro
up
s to
wo
rk t
og
eth
er
(i.e
. sev
eral
inte
rest
gro
up
s m
ay b
e re
pre
sen
ted
an
d c
an in
tera
ct).
Wo
rksh
op
se
ttin
g im
plie
s lo
ng
er d
ura
tio
n a
nd
in
clu
sio
n o
f se
vera
l rel
ated
issu
es.
‘Par
tici
pat
ory
’ im
plie
s p
arti
cip
ants
may
be
allo
wed
so
me
resp
on
sib
ility
fo
r d
irec
tin
g
the
stu
dy
and
dra
win
g c
on
clu
sio
ns.
Esta
blis
hes
val
id c
om
mu
nic
ativ
e ex
chan
ge
(i.e
. mo
re li
kely
to
get
mo
re “
tru
thfu
l”
resp
on
ses
to y
ou
r q
ues
tio
ns)
.
Esta
blis
hes
rap
po
rt a
nd
ab
ility
to
em
pat
his
e w
ith
sta
keh
old
ers’
var
iou
s p
ersp
ecti
ves.
Can
hel
p t
o b
uild
tru
st b
etw
een
a
com
mu
nit
y an
d t
he
rese
arch
ers
or
‘ag
ency
’ (im
po
rtan
t if
th
e en
d r
esu
lt o
f st
ud
y is
to
imp
lem
ent
an in
terv
enti
on
).
Hig
h le
vel o
f sk
ill/t
rain
ing
req
uir
ed b
y ad
min
iste
rin
g s
taff
.
Dif
ficu
lt t
o a
dm
inis
ter
to a
hig
h n
um
ber
o
f re
spo
nd
ents
.
(con
t.)
TAB
LE 1
(con
t.)
Designing and implementing livestock value chain studies20
Dat
a C
olle
ctio
n T
oo
lC
an b
e u
sed
fo
rSt
ren
gth
sW
eakn
esse
s
Pro
po
rtio
nal
pili
ng
Spec
ific
tec
hn
iqu
e u
sed
wit
hin
p
arti
cip
ato
ry w
ork
sho
p (
bu
t m
ay b
e u
sed
in a
ny
face
-to
-fac
e in
terv
iew
) to
o
bta
in r
elat
ive
mea
sure
s. e
.g. d
istr
ibu
tio
n
of
farm
ou
tpu
t in
to d
iffe
ren
t m
arke
t ro
ute
s, d
istr
ibu
tio
n o
f b
reed
typ
es a
mo
ng
fa
rmer
s in
a v
illag
e...
etc.
Ran
kin
gSp
ecif
ic t
ech
niq
ue
use
d w
ith
in
par
tici
pat
ory
wo
rksh
op
(b
ut
may
be
use
d
in a
ny
face
-to
-fac
e in
terv
iew
) to
ob
tain
m
easu
re o
f o
rdin
al (
firs
t, s
eco
nd
, th
ird
, et
c.)
imp
ort
ance
of
dif
fere
nt
fact
ors
.
Flex
ible
to
ol t
hat
can
be
use
d t
o
pro
vid
e q
uit
e co
mp
lex
info
rmat
ion
: e.
g. c
on
sum
ers
can
be
sho
wn
pic
ture
s,
and
ask
ed t
o c
ho
ose
a h
ypo
thet
ical
co
mb
inat
ion
of
risk
an
d c
on
sum
pti
on
u
tilit
y.
Part
icip
ato
ry m
app
ing
Spec
ific
tec
hn
iqu
e u
sed
wit
hin
p
arti
cip
ato
ry w
ork
sho
p (
bu
t m
ay b
e u
sed
in
an
y fa
ce-t
o-f
ace
inte
rvie
w)
to o
bta
in
spat
ial i
nfo
rmat
ion
.
Seas
on
al c
alen
dar
Spec
ific
tec
hn
iqu
e u
sed
wit
hin
p
arti
cip
ato
ry w
ork
sho
p (
bu
t m
ay b
e u
sed
in
an
y fa
ce-t
o-f
ace
inte
rvie
w)
to o
bta
in
tem
po
ral i
nfo
rmat
ion
, e.g
. sea
son
al
vari
atio
n in
live
sto
ck s
urp
lus,
mea
t co
nsu
mp
tio
n, d
eman
d f
or
egg
s, e
tc.
TAB
LE 1
(con
t.)
21Designing and implementing value chain studies
A common feature of many of the techniques listed above, in common with any field study technique, is that there is risk of so-called researcher bias or observer bias. In general the more flexible and open the approach, the greater the risk of bias and therefore the greater the need for skilled field workers to avoid bias.
Value chain studies that are targeted at supporting animal health planning are required to be relatively flexible and open and therefore do require high skill levels in the practition-ers. This in turn indicates a need for training in both the general semi-structured interview and other participatory methods, and also in the integration of risk analysis with value chain study and analysis.
Triangulation (collecting data on the same basic subject from different ‘view-points’) is another important tool to ensure good quality data.
Following are a series of data collection tips with suggestions for ensuring collection of good quality data
TIP 5
Strategies for minimising respondent bias include:
Asking a set of related questions so as to test for strategic responses.
Ask people what their neighbour does.
Structure questions so that the answer cannot be linked in the respondents’ minds to a cost
or benefit to them personally
TIP 6
Monitoring price-differentials for live animals at different trading points will add additional
value to observing direction and volume of trade movements.
As a driver for livestock movement it is adding additional information, since changes in
prices can quickly reverse observed movement streams of livestock; a Gravity model that
looks at consumption and production clusters may in many cases already give a good over-
view of the livestock trade flows.
Margins for traders and producers are essential to see incentives for compliance, power
distribution and investments in the chain.
A structured routine for price monitoring might be required for several input and output
commodities.
GIS-Flow-Tool on price differences (Cost-surface analysis) can be used to visualize and ana-
lyzed price differentials in maps.
Designing and implementing livestock value chain studies22
TIP 7
!Capacity and training of data collectors is a key success factor.
Experienced enumerators might have to be “retrained” depending on methodologies they
have previously used.
Consider tradeoffs between enumerators familiar with animal disease (potential bias) vs.
enumerators not familiar with animal disease (might not understand survey).
Carefully consider tradeoffs between enumerator incentives: per-survey payments require
random monitoring – but per-day payments could affect productivity or decrease flexibility.
TIP 8
!Piloting of questionnaires and testing of preliminary results are essential to ensure data quality.
Involve enumerators in survey testing and solicit their feedback.
Use back translation for project staff who are not native speakers (translate the survey
back to English to see if the translation is accurate).
TIP 9
Focus group discussions ...
... are useful and very cost-effective as a first step to get information on prices, trade vol-
umes and profiles of stakeholders ...
... involve less costs and training demands compared with questionnaire surveys.
TIP 10
A core value of participatory engagement approaches (such as Focus Groups Discussion) is build-
ing trust:
establishes rapport and ability to empathize with stakeholders’ various perspectives;
establishes valid communicative exchange (i.e. more likely to get more “truthful” respons-
es to your questions);
builds ownership in solutions developed.
Therefore, try to integrate participatory engagement approaches within all activities as
appropriate.
TIP 11
Sample selection is important in relation to the study objective. The sampling strategy (e.g.
representative sample, random sample, purposive sampling, snowballing) is usually a compro-
mise between obtaining statistical rigour and practicality. It is usually not possible to carry out
statistically representative surveys, but nor is it usually necessary for the purposes of effective
decision making.
23Designing and implementing value chain studies
OVERVIEW OF DATA ANALYSIS AND MODELLING TECHNIQUES USED WITH AN ASSESSMENT OF THEIR STRENGTH AND WEAKNESSESThe FAO guidelines document provides, in part two, a general guide to the practical organi-sation of value chain and risk analysis studies.
Here we briefly list analytical tools that are among the most useful approaches to providing the information needed to answer questions such as those listed above and to produce the outputs as described above.
Choosing the right analysis tool / frameworkDuring the Bangkok workshop the following data analysis tools were identified and discussed (Table 2). This list is by no means exhaustive, and other tools may be useful in particular situations.
TIP 12
Use the right tool for the job (select from Table 1 above and other available tools);
- ‘traditional’ participatory tools,
- ‘traditional’ survey tools,
- disease risk quantification tools.
Adapt study design to available human resources and organizational systems.
Minimize use of tools which provide cross-sectional data and those which quantify risk
based on opinion alone.
Stay focused on the question of interest.
TIP 13
It is important to set some quality standard for data and to include in the data collection proto-
col a system to monitor data quality.
Standards of data quality include:
level of precision
validity: is it true?
timeliness –things can change
consistency – need to be comparable = sharing is important
Another important question to address regarding the quality of data is: What are the needs
for either QUALITATIVE or QUANTITATIVE data?”:
depends on purpose, ‘fit for purpose’
Some level of quantification is needed – risk assessment is quantitative by nature
Qualitative data is valuable as well, sometimes more than quantitative.
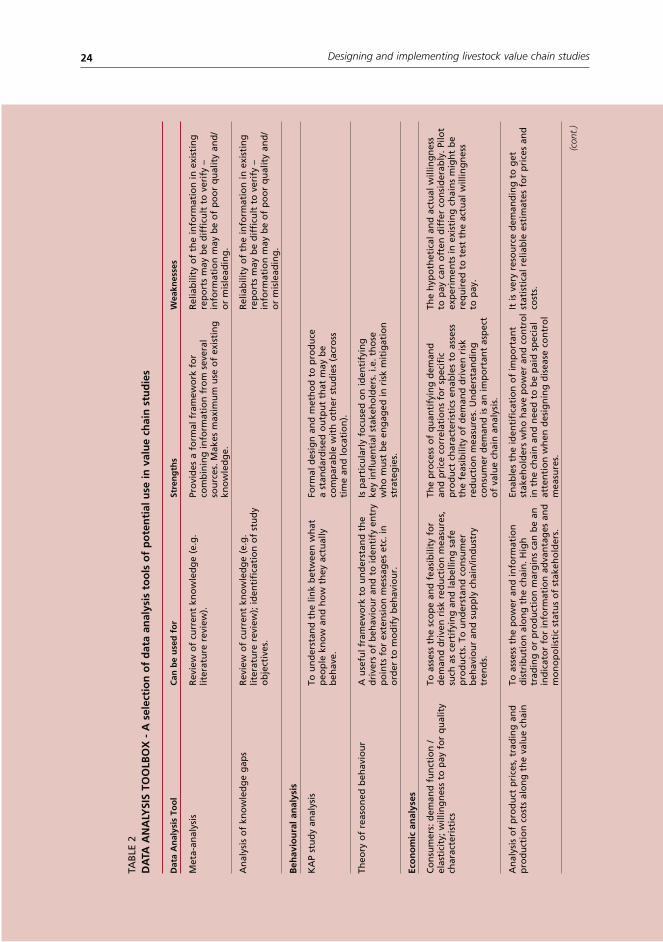
Designing and implementing livestock value chain studies24
TAB
LE 2
DA
TA A
NA
LYSI
S TO
OLB
OX
- A
sel
ecti
on
of
dat
a an
alys
is t
oo
ls o
f p
ote
nti
al u
se in
val
ue
chai
n s
tud
ies
Dat
a A
nal
ysis
To
ol
Can
be
use
d f
or
Stre
ng
ths
Wea
knes
ses
Met
a-an
alys
is
Rev
iew
of
curr
ent
kno
wle
dg
e (e
.g.
liter
atu
re r
evie
w).
Pro
vid
es a
fo
rmal
fra
mew
ork
fo
r co
mb
inin
g in
form
atio
n f
rom
sev
eral
so
urc
es. M
akes
max
imu
m u
se o
f ex
isti
ng
kn
ow
led
ge.
Rel
iab
ility
of
the
info
rmat
ion
in e
xist
ing
re
po
rts
may
be
dif
ficu
lt t
o v
erif
y –
info
rmat
ion
may
be
of
po
or
qu
alit
y an
d/
or
mis
lead
ing
.
An
alys
is o
f kn
ow
led
ge
gap
sR
evie
w o
f cu
rren
t kn
ow
led
ge
(e.g
. lit
erat
ure
rev
iew
); id
enti
fica
tio
n o
f st
ud
y o
bje
ctiv
es.
Rel
iab
ility
of
the
info
rmat
ion
in e
xist
ing
re
po
rts
may
be
dif
ficu
lt t
o v
erif
y –
info
rmat
ion
may
be
of
po
or
qu
alit
y an
d/
or
mis
lead
ing
.
Beh
avio
ura
l an
alys
is
KA
P st
ud
y an
alys
isTo
un
der
stan
d t
he
link
bet
wee
n w
hat
p
eop
le k
no
w a
nd
ho
w t
hey
act
ual
ly
beh
ave.
Form
al d
esig
n a
nd
met
ho
d t
o p
rod
uce
a
stan
dar
dis
ed o
utp
ut
that
may
be
com
par
able
wit
h o
ther
stu
die
s (a
cro
ss
tim
e an
d lo
cati
on
).
Theo
ry o
f re
aso
ned
beh
avio
ur
A u
sefu
l fra
mew
ork
to
un
der
stan
d t
he
dri
vers
of
beh
avio
ur
and
to
iden
tify
en
try
po
ints
fo
r ex
ten
sio
n m
essa
ges
etc
. in
o
rder
to
mo
dif
y b
ehav
iou
r.
Is p
arti
cula
rly
focu
sed
on
iden
tify
ing
ke
y in
flu
enti
al s
take
ho
lder
s. i.
e. t
ho
se
wh
o m
ust
be
eng
aged
in r
isk
mit
igat
ion
st
rate
gie
s.
Eco
no
mic
an
alys
es
Co
nsu
mer
s: d
eman
d f
un
ctio
n /
elas
tici
ty; w
illin
gn
ess
to p
ay f
or
qu
alit
y ch
arac
teri
stic
s
To a
sses
s th
e sc
op
e an
d f
easi
bili
ty f
or
dem
and
dri
ven
ris
k re
du
ctio
n m
easu
res,
su
ch a
s ce
rtif
yin
g a
nd
lab
ellin
g s
afe
pro
du
cts.
To
un
der
stan
d c
on
sum
er
beh
avio
ur
and
su
pp
ly c
hai
n/in
du
stry
tr
end
s.
The
pro
cess
of
qu
anti
fyin
g d
eman
d
and
pri
ce c
orr
elat
ion
s fo
r sp
ecif
ic
pro
du
ct c
har
acte
rist
ics
enab
les
to a
sses
s th
e fe
asib
ility
of
dem
and
dri
ven
ris
k re
du
ctio
n m
easu
res.
Un
der
stan
din
g
con
sum
er d
eman
d is
an
imp
ort
ant
asp
ect
of
valu
e ch
ain
an
alys
is.
The
hyp
oth
etic
al a
nd
act
ual
will
ing
nes
s to
pay
can
oft
en d
iffe
r co
nsi
der
ably
. Pilo
t ex
per
imen
ts in
exi
stin
g c
hai
ns
mig
ht
be
req
uir
ed t
o t
est
the
actu
al w
illin
gn
ess
to p
ay.
An
alys
is o
f p
rod
uct
pri
ces,
tra
din
g a
nd
p
rod
uct
ion
co
sts
alo
ng
th
e va
lue
chai
nTo
ass
ess
the
po
wer
an
d in
form
atio
n
dis
trib
uti
on
alo
ng
th
e ch
ain
. Hig
h
trad
ing
or
pro
du
ctio
n m
arg
ins
can
be
an
ind
icat
or
for
info
rmat
ion
ad
van
tag
es a
nd
m
on
op
olis
tic
stat
us
of
stak
eho
lder
s.
Enab
les
the
iden
tifi
cati
on
of
imp
ort
ant
stak
eho
lder
s w
ho
hav
e p
ow
er a
nd
co
ntr
ol
in t
he
chai
n a
nd
nee
d t
o b
e p
aid
sp
ecia
l at
ten
tio
n w
hen
des
ign
ing
dis
ease
co
ntr
ol
mea
sure
s.
It is
ver
y re
sou
rce
dem
and
ing
to
get
st
atis
tica
l rel
iab
le e
stim
ates
fo
r p
rice
s an
d
cost
s.
(con
t.)
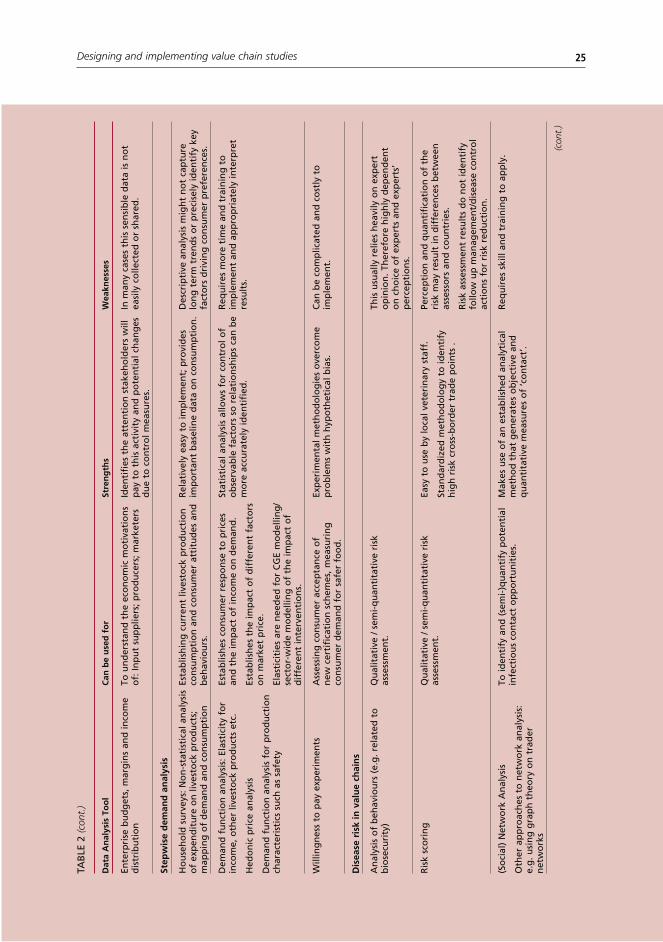
25Designing and implementing value chain studies
Dat
a A
nal
ysis
To
ol
Can
be
use
d f
or
Stre
ng
ths
Wea
knes
ses
Ente
rpri
se b
ud
get
s, m
arg
ins
and
inco
me
dis
trib
uti
on
To u
nd
erst
and
th
e ec
on
om
ic m
oti
vati
on
s o
f: In
pu
t su
pp
liers
; pro
du
cers
; mar
kete
rsId
enti
fies
th
e at
ten
tio
n s
take
ho
lder
s w
ill
pay
to
th
is a
ctiv
ity
and
po
ten
tial
ch
ang
es
du
e to
co
ntr
ol m
easu
res.
In m
any
case
s th
is s
ensi
ble
dat
a is
no
t ea
sily
co
llect
ed o
r sh
ared
.
Step
wis
e d
eman
d a
nal
ysis
Ho
use
ho
ld s
urv
eys:
No
n-s
tati
stic
al a
nal
ysis
o
f ex
pen
dit
ure
on
live
sto
ck p
rod
uct
s;
map
pin
g o
f d
eman
d a
nd
co
nsu
mp
tio
n
Esta
blis
hin
g c
urr
ent
lives
tock
pro
du
ctio
n
con
sum
pti
on
an
d c
on
sum
er a
ttit
ud
es a
nd
b
ehav
iou
rs.
Rel
ativ
ely
easy
to
imp
lem
ent;
pro
vid
es
imp
ort
ant
bas
elin
e d
ata
on
co
nsu
mp
tio
n.
Des
crip
tive
an
alys
is m
igh
t n
ot
cap
ture
lo
ng
ter
m t
ren
ds
or
pre
cise
ly id
enti
fy k
ey
fact
ors
dri
vin
g c
on
sum
er p
refe
ren
ces.
Dem
and
fu
nct
ion
an
alys
is: E
last
icit
y fo
r in
com
e, o
ther
live
sto
ck p
rod
uct
s et
c.
Hed
on
ic p
rice
an
alys
is
Dem
and
fu
nct
ion
an
alys
is f
or
pro
du
ctio
n
char
acte
rist
ics
such
as
safe
ty
Esta
blis
hes
co
nsu
mer
res
po
nse
to
pri
ces
and
th
e im
pac
t o
f in
com
e o
n d
eman
d.
Esta
blis
hes
th
e im
pac
t o
f d
iffe
ren
t fa
cto
rs
on
mar
ket
pri
ce.
Elas
tici
ties
are
nee
ded
fo
r C
GE
mo
del
ling
/se
cto
r-w
ide
mo
del
ling
of
the
imp
act
of
dif
fere
nt
inte
rven
tio
ns.
Stat
isti
cal a
nal
ysis
allo
ws
for
con
tro
l of
ob
serv
able
fac
tors
so
rel
atio
nsh
ips
can
be
mo
re a
ccu
rate
ly id
enti
fied
.
Req
uir
es m
ore
tim
e an
d t
rain
ing
to
im
ple
men
t an
d a
pp
rop
riat
ely
inte
rpre
t re
sult
s.
Will
ing
nes
s to
pay
exp
erim
ents
Ass
essi
ng
co
nsu
mer
acc
epta
nce
of
new
cer
tifi
cati
on
sch
emes
, mea
suri
ng
co
nsu
mer
dem
and
fo
r sa
fer
foo
d.
Exp
erim
enta
l met
ho
do
log
ies
ove
rco
me
pro
ble
ms
wit
h h
ypo
thet
ical
bia
s.C
an b
e co
mp
licat
ed a
nd
co
stly
to
im
ple
men
t.
Dis
ease
ris
k in
val
ue
chai
ns
An
alys
is o
f b
ehav
iou
rs (
e.g
. rel
ated
to
b
iose
curi
ty)
Qu
alit
ativ
e / s
emi-
qu
anti
tati
ve r
isk
asse
ssm
ent.
This
usu
ally
rel
ies
hea
vily
on
exp
ert
op
inio
n. T
her
efo
re h
igh
ly d
epen
den
t o
n c
ho
ice
of
exp
erts
an
d e
xper
ts’
per
cep
tio
ns.
Ris
k sc
ori
ng
Qu
alit
ativ
e / s
emi-
qu
anti
tati
ve r
isk
asse
ssm
ent.
Easy
to
use
by
loca
l vet
erin
ary
staf
f.
Stan
dar
diz
ed m
eth
od
olo
gy
to id
enti
fy
hig
h r
isk
cro
ss-b
ord
er t
rad
e p
oin
ts .
Perc
epti
on
an
d q
uan
tifi
cati
on
of
the
risk
may
res
ult
in d
iffe
ren
ces
bet
wee
n
asse
sso
rs a
nd
co
un
trie
s.
Ris
k as
sess
men
t re
sult
s d
o n
ot
iden
tify
fo
llow
up
man
agem
ent/
dis
ease
co
ntr
ol
acti
on
s fo
r ri
sk r
edu
ctio
n.
(So
cial
) N
etw
ork
An
alys
is
Oth
er a
pp
roac
hes
to
net
wo
rk a
nal
ysis
: e.
g. u
sin
g g
rap
h t
heo
ry o
n t
rad
er
net
wo
rks
To id
enti
fy a
nd
(se
mi-
)qu
anti
fy p
ote
nti
al
infe
ctio
us
con
tact
op
po
rtu
nit
ies.
Mak
es u
se o
f an
est
ablis
hed
an
alyt
ical
m
eth
od
th
at g
ener
ates
ob
ject
ive
and
q
uan
tita
tive
mea
sure
s o
f ‘c
on
tact
’.
Req
uir
es s
kill
and
tra
inin
g t
o a
pp
ly.
(con
t.)
TAB
LE 2
(con
t.)
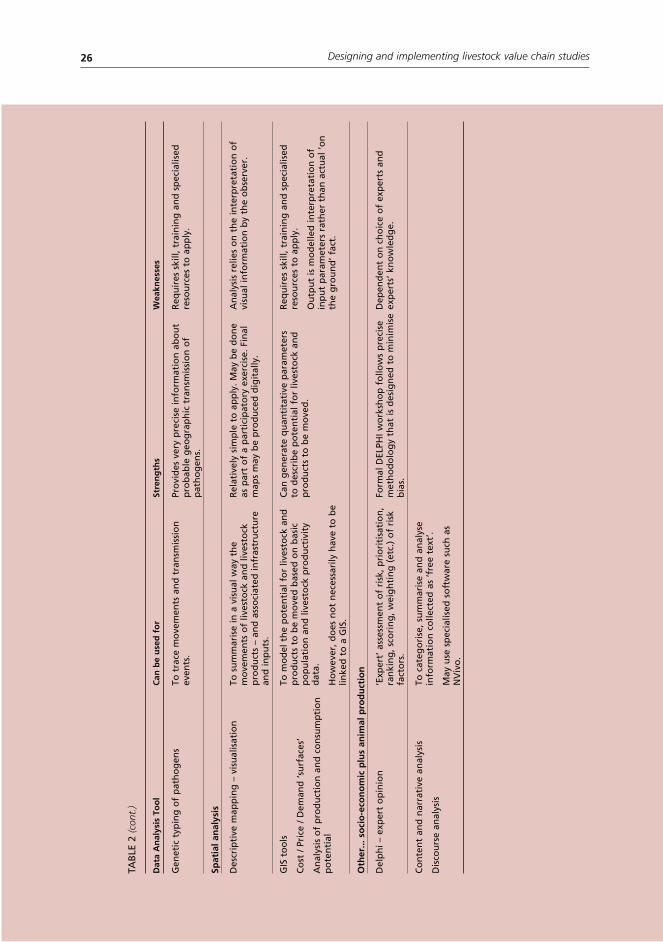
Designing and implementing livestock value chain studies26
Dat
a A
nal
ysis
To
ol
Can
be
use
d f
or
Stre
ng
ths
Wea
knes
ses
Gen
etic
typ
ing
of
pat
ho
gen
sTo
tra
ce m
ove
men
ts a
nd
tra
nsm
issi
on
ev
ents
.Pr
ovi
des
ver
y p
reci
se in
form
atio
n a
bo
ut
pro
bab
le g
eog
rap
hic
tra
nsm
issi
on
of
pat
ho
gen
s.
Req
uir
es s
kill,
tra
inin
g a
nd
sp
ecia
lised
re
sou
rces
to
ap
ply
.
Spat
ial a
nal
ysis
Des
crip
tive
map
pin
g –
vis
ual
isat
ion
To s
um
mar
ise
in a
vis
ual
way
th
e m
ove
men
ts o
f liv
esto
ck a
nd
live
sto
ck
pro
du
cts
– an
d a
sso
ciat
ed in
fras
tru
ctu
re
and
inp
uts
.
Rel
ativ
ely
sim
ple
to
ap
ply
. May
be
do
ne
as p
art
of
a p
arti
cip
ato
ry e
xerc
ise.
Fin
al
map
s m
ay b
e p
rod
uce
d d
igit
ally
.
An
alys
is r
elie
s o
n t
he
inte
rpre
tati
on
of
visu
al in
form
atio
n b
y th
e o
bse
rver
.
GIS
to
ols
Co
st /
Pric
e / D
eman
d ‘s
urf
aces
’
An
alys
is o
f p
rod
uct
ion
an
d c
on
sum
pti
on
p
ote
nti
al
To m
od
el t
he
po
ten
tial
fo
r liv
esto
ck a
nd
p
rod
uct
s to
be
mo
ved
bas
ed o
n b
asic
p
op
ula
tio
n a
nd
live
sto
ck p
rod
uct
ivit
y d
ata.
Ho
wev
er, d
oes
no
t n
eces
sari
ly h
ave
to b
e lin
ked
to
a G
IS.
Can
gen
erat
e q
uan
tita
tive
par
amet
ers
to d
escr
ibe
po
ten
tial
fo
r liv
esto
ck a
nd
p
rod
uct
s to
be
mo
ved
.
Req
uir
es s
kill,
tra
inin
g a
nd
sp
ecia
lised
re
sou
rces
to
ap
ply
.
Ou
tpu
t is
mo
del
led
inte
rpre
tati
on
of
inp
ut
par
amet
ers
rath
er t
han
act
ual
‘on
th
e g
rou
nd
’ fac
t.
Oth
er...
so
cio
-eco
no
mic
plu
s an
imal
pro
du
ctio
n
Del
ph
i – e
xper
t o
pin
ion
‘Exp
ert’
ass
essm
ent
of
risk
, pri
ori
tisa
tio
n,
ran
kin
g, s
cori
ng
, wei
gh
tin
g (
etc.
) o
f ri
sk
fact
ors
.
Form
al D
ELPH
I wo
rksh
op
fo
llow
s p
reci
se
met
ho
do
log
y th
at is
des
ign
ed t
o m
inim
ise
bia
s.
Dep
end
ent
on
ch
oic
e o
f ex
per
ts a
nd
ex
per
ts’ k
no
wle
dg
e.
Co
nte
nt
and
nar
rati
ve a
nal
ysis
Dis
cou
rse
anal
ysis
To c
ateg
ori
se, s
um
mar
ise
and
an
alys
e in
form
atio
n c
olle
cted
as
‘fre
e te
xt’.
May
use
sp
ecia
lised
so
ftw
are
such
as
NV
ivo
.
TAB
LE 2
(con
t.)
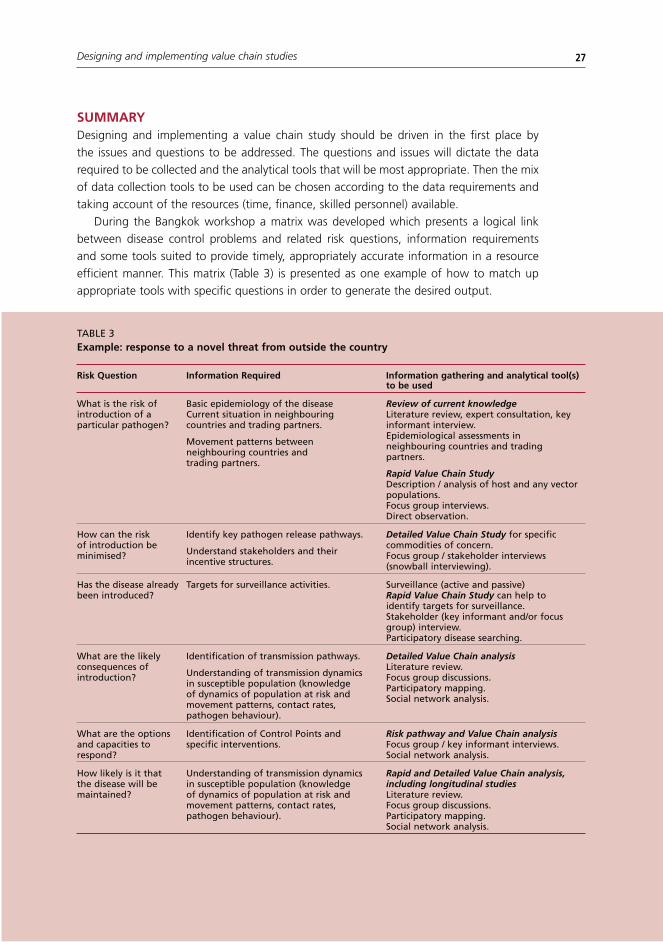
27Designing and implementing value chain studies
SUMMARYDesigning and implementing a value chain study should be driven in the first place by the issues and questions to be addressed. The questions and issues will dictate the data required to be collected and the analytical tools that will be most appropriate. Then the mix of data collection tools to be used can be chosen according to the data requirements and taking account of the resources (time, finance, skilled personnel) available.
During the Bangkok workshop a matrix was developed which presents a logical link between disease control problems and related risk questions, information requirements and some tools suited to provide timely, appropriately accurate information in a resource efficient manner. This matrix (Table 3) is presented as one example of how to match up appropriate tools with specific questions in order to generate the desired output.
TABLE 3Example: response to a novel threat from outside the country
Risk Question Information Required Information gathering and analytical tool(s) to be used
What is the risk of introduction of a particular pathogen?
Basic epidemiology of the disease Current situation in neighbouring countries and trading partners.
Movement patterns between neighbouring countries and trading partners.
Review of current knowledge Literature review, expert consultation, key informant interview. Epidemiological assessments in neighbouring countries and trading partners.
Rapid Value Chain Study Description / analysis of host and any vector populations. Focus group interviews. Direct observation.
How can the risk of introduction be minimised?
Identify key pathogen release pathways.
Understand stakeholders and their incentive structures.
Detailed Value Chain Study for specific commodities of concern. Focus group / stakeholder interviews (snowball interviewing).
Has the disease already been introduced?
Targets for surveillance activities. Surveillance (active and passive) Rapid Value Chain Study can help to identify targets for surveillance. Stakeholder (key informant and/or focus group) interview. Participatory disease searching.
What are the likely consequences of introduction?
Identification of transmission pathways.
Understanding of transmission dynamics in susceptible population (knowledge of dynamics of population at risk and movement patterns, contact rates, pathogen behaviour).
Detailed Value Chain analysis Literature review. Focus group discussions. Participatory mapping. Social network analysis.
What are the options and capacities to respond?
Identification of Control Points and specific interventions.
Risk pathway and Value Chain analysis Focus group / key informant interviews. Social network analysis.
How likely is it that the disease will be maintained?
Understanding of transmission dynamics in susceptible population (knowledge of dynamics of population at risk and movement patterns, contact rates, pathogen behaviour).
Rapid and Detailed Value Chain analysis, including longitudinal studies Literature review. Focus group discussions. Participatory mapping. Social network analysis.
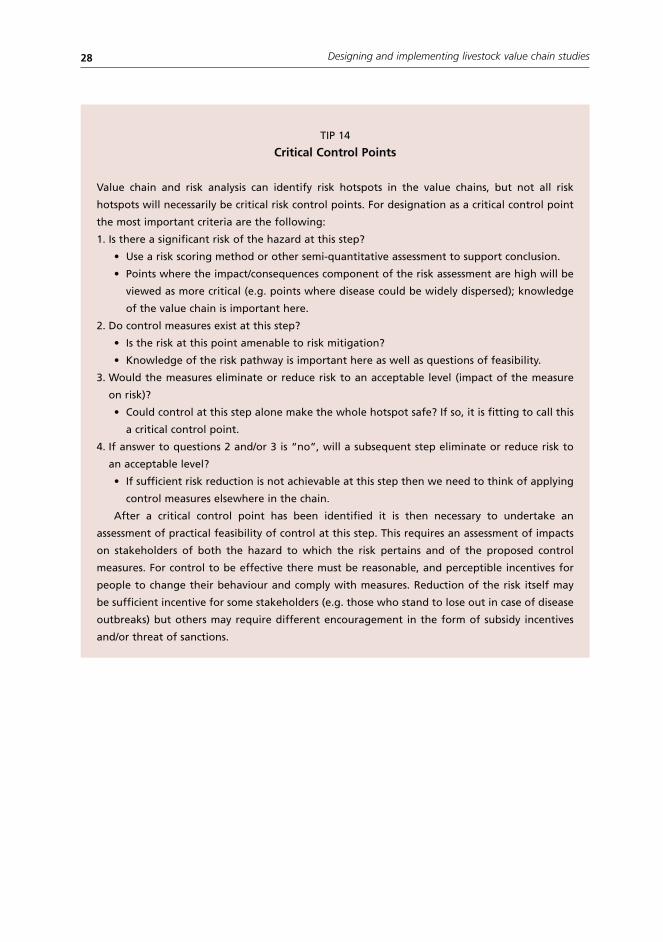
Designing and implementing livestock value chain studies28
TIP 14
Critical Control Points
Value chain and risk analysis can identify risk hotspots in the value chains, but not all risk
hotspots will necessarily be critical risk control points. For designation as a critical control point
the most important criteria are the following:
1. Is there a significant risk of the hazard at this step?
Use a risk scoring method or other semi-quantitative assessment to support conclusion.
Points where the impact/consequences component of the risk assessment are high will be
viewed as more critical (e.g. points where disease could be widely dispersed); knowledge
of the value chain is important here.
2. Do control measures exist at this step?
Is the risk at this point amenable to risk mitigation?
Knowledge of the risk pathway is important here as well as questions of feasibility.
3. Would the measures eliminate or reduce risk to an acceptable level (impact of the measure
on risk)?
Could control at this step alone make the whole hotspot safe? If so, it is fitting to call this
a critical control point.
4. If answer to questions 2 and/or 3 is “no”, will a subsequent step eliminate or reduce risk to
an acceptable level?
If sufficient risk reduction is not achievable at this step then we need to think of applying
control measures elsewhere in the chain.
After a critical control point has been identified it is then necessary to undertake an
assessment of practical feasibility of control at this step. This requires an assessment of impacts
on stakeholders of both the hazard to which the risk pertains and of the proposed control
measures. For control to be effective there must be reasonable, and perceptible incentives for
people to change their behaviour and comply with measures. Reduction of the risk itself may
be sufficient incentive for some stakeholders (e.g. those who stand to lose out in case of disease
outbreaks) but others may require different encouragement in the form of subsidy incentives
and/or threat of sanctions.
29
Some examples of successful application of tools described in this document
DEMAND DRIVEN RISK REDUCTION – ECONOMIC PERSPECTIVE IN RISK REDUCTION APPROACHES ALONG THE VALUE CHAINJenny IfftDemand driven risk reduction relies on the consumer preferentially selecting products that derive from chains that carry less disease risk.
Jenny Ifft has worked on the value chain that supplies poultry to the consumers of Hanoi in Vietnam. Jenny focused on the economic aspects of the chain that are important to assess when trying to develop demand driven (and funded) risk reduction interventions.
Hanoi consumers were studied to learn about preferences and knowledge of disease risks and willingness to pay (higher price) for ‘safe’ poultry. A trial was carried out using cheap, single-use tags for traceability of poultry.
The study showed that it could be possible to generate added value at the consumer end of a poultry chain that could be used to fund risk reduction measures further back in the chain (towards trader and producer).
The study used the following economic tools to carry out a stepwise demand analysis:Household surveys: Non-statistical analysis of expenditure on livestock products; mapping of demand and consumption; Demand function analysis: Elasticity for income, other livestock products etc., Demand function analysis for production char-acteristics such as safety; hedonic price analysis;Willingness to pay experiments.
Application of the methodologyHousehold surveys were the basis for all activities in this study. Representative sampling methods were used, as blocks were randomly selected for participation. All households in each block were identified, and then systematic sampling was used (every nth household was selected). The survey instrument had questions on average chicken consumption, recent chicken consumption, household demographics, meat consumption, attitudes towards meat quality and safety, and basic disease knowledge. The survey instrument was entirely quantitative, with no open-ended questions. Data from the survey provided an accurate picture of practices and beliefs relevant to poultry consumption.
Demand analysis was undertaken using two approaches. One approach estimated an incomplete demand system for chicken consumption, which provided price and income elasticities for the three main varieties of chicken purchased for home consumption in Ha Noi. Demand system can be estimated using a variety of methods which are well estab-
Designing and implementing livestock value chain studies30
lished in the agricultural economics literature; for example, simple log-log estimation, almost ideal demand system (AIDS), and incomplete demand system estimation. This study used the latter. Hedonic price analysis was also used, which involves linear regression of price on various factors that might impact price. Hedonic price analysis is straightforward to implement with standard statistical software and allows for identification of which factors have the strongest relationship with prices.
Willingness to pay experiments were also used to assess how much consumers would pay for safety labelled (or safety certified) free range chicken. The experiment was under-taken in conjunction with a pilot project, so we were able to used actual safety labelled chicken in our experiment. Pilot projects for safety certification of livestock projects provide an ideal opportunity for willingness to pay experiments, as several different types of willing-ness to pay experiments can be implemented if real certified products are available. Our experiment involved offering household survey participants a choice between 2 discount coupons with randomly determined discounts. 1 discount coupon was for safety-labelled chicken, and the other was for non-labelled (“regular”) chicken. The trade-offs made when households selected a coupon allowed us to calculate the average willingness to pay for safety labelled free range chicken.
Discussion and conclusionsDemand driven approaches to HPED risk reduction are underpinned by the principle that market incentives can induce behavioural change. If consumers demand safer livestock products, such approaches could be feasible. Consumer demand is also important for development of HPED control policies. Consumer preferences for livestock products shape market chain structure and can either support or undermine efforts to control HPEDs. Demand driven approaches to risk reduction require both a clear understanding of consum-er preferences and the economic behaviour of all actors in livestock market supply chains. In addition to consumer demand, market chain analysis should consider multiple factors that affect economic behaviour and have implications for risk reduction. These factors include basic market incentives, perception of risk, institutions, and socio-economic factors.
Demand for livestock products takes into account product quality, safety and price. All of these product characteristics can be related to HPED risk and should be included in demand analysis. Demand for quality can often be linked to certain sectors of the livestock industry or production methods. For example, consumer studies of the poultry sector in Mekong countries have established that consumers are willing to pay for product quality that is characterized by free range production methods. Demand for safety can be meas-ured using various methodologies. Studies in Viet Nam have found that poultry consum-ers in Viet Nam are also willing to pay at least a 10-15% premium for safety certification and support various efforts to develop this market. Consumer sensitivity to prices also has important policy implications.
The profit margins and sales volume of market chain actors can play a role in the spread of disease. Producers will decide whether or not to invest in livestock and risk prevention activities based on current prices and the importance of the enterprise to their own liveli-hood. Disease risk is another key factor in economic decision making, as it makes invest-ments in livestock more costly. Producer responses to risk and attitudes towards risk can
31Some examples of successful application of tools described in this document
be challenging to measure but can yield useful information and enhance epidemiological risk assessment.
Economic behaviour is also influenced by both formal and informal institutions. Insti-tutions define the “rules of the game” that govern transactions between actors. Market chain analysis should aim to establish what institutions govern behaviour. These can include uncovering what official regulations are enforced, relationship of local regulators and mar-ket actors, and unwritten rules between trading partners. A key institution in poultry supply chains in Viet Nam is that trading relationships throughout the supply chains are repeated (with the same individual(s)) and often involve provision of credit.
Socio-economic factors are important factors in value-chain analysis. Poverty and gen-der are in particular are important to policymakers and also have implications for economic behaviour. Poorer or highly diversified rural households might not have the capacity or incentives to invest in biosecurity. Gender can also play an important role, as woman often have primary responsibility for livestock. If specific groups are regularly socially excluded or vulnerable, HPED control policies need to take this into account. Market chain analysis should identify how vulnerable groups participate and any constraints that they might face.
THE VALUE OF THE NETWORK ANALYSIS APPROACH –IDENTIFYING CONTROL POINTS LINKED WITH RISK DATAVincent MartinAn established analytical framework used in other areas of social science, social network analysis, was applied to live bird market networks in South China in order to identify critical control points for control of HPAI. The study formed part of an ‘integrated risk management’ approach, following the underlying principle of HACCP applied in market-ing chains.
The study focused on live bird markets (LBMs), known to be risk points for transmission of HPAI. Visits to markets were carried out, with interviews of traders to establish sources and destinations of birds. Social network analysis was applied using UCINET software. The results quantify the ‘linked-ness’ of markets. Taken alongside information on stakeholder behaviour and geographic mapping of markets, markets that could contribute a high pro-portion of the risk of disease spread could be identified, allowing risk-based surveillance for avian influenza and targeted risk mitigation interventions to be planned.
Further economic studies were required since risk mitigation measures must take account of stakeholders’ incentives if they are to be successful.
Requires well trained staff to carry out interviews and ask the right questions. In China getting the full answers at interviews required repeated visits to the same markets and the same traders to build up trust.
Application of the methodologyStudy design and data needsThe study was carried out in three provinces of southern China. The value chains were initially mapped through group interviews. This mapping exercise was to:
Identify major stakeholders and trade patterns;Identify main market chains and volumes;
Designing and implementing livestock value chain studies32
Qualitative risk assessment;Select chains of interest for further studies.
The subsequent social network analysis study was carried out as a longitudinal study to:Describe market hygiene and trade practices at market level;Provide data on networks by interviewing 5-10 vendors in each market for trade pattern analysis.
In addition, during the longitudinal study samples were collected from birds for the detection of HPAI H5N1.
ResultsIn a first cross-sectional study implemented in 2009, a set of LBM network maps were produced and the associated risks of HPAIV H5N1 within LBMs and along poultry market chains were estimated, providing new insights into how live poultry trade and infection are intertwined. More specifically, the study provided evidence that several biosecurity fac-tors such as daily cage cleaning, daily cage disinfection or manure processing contributed to a reduction in HPAIV H5N1 presence in LBMs. The study also showed the association between social network indicators and the presence of HPAIV H5N1 in specific network configurations such as the one represented by the counties of origin of the birds traded in LBMs. This new information could be used to develop more targeted and effective control interventions.
In a second longitudinal survey implemented in 2010, four markets in Hunan province and Guangxi Autonomous region were surveyed monthly from January to April with the aim of investigating the association between network parameters and available epidemio-logical information regarding county’ s previous history of HPAI H5N1 poultry and human outbreaks. This study confirmed the results obtained in 2009 in terms of the contribution of source network in infection persistence, capturing at the same time the seasonal fluc-tuations associated to trade during this time of the year. In addition, investigation of the association between flock and network level attributes and the protection of flock tested at Wulitin market between January and April 2010 has shown that:
1. spent hens were less likely to be unprotected than broiler flocks during the study period;
2. poultry originating from smaller flocks (<5000 heads) are more likely to be unpro-tected compared to poultry originating from bigger flocks (>7000).
ConclusionsNetwork analysis can be a very powerful tool to identify highly connected markets (super spreaders if disease is present). The use of social network analysis in combination with epidemiological surveillance in South China identified areas where the success of strategies for HPAI control in the poultry production sector may benefit from better knowledge of poultry trading patterns and the LBM network configuration as well as their capacity for maintaining HPAIV H5N1 infection.
These studies shows the huge potential offered by social network analysis in guiding policy makers in their efforts of defining targeted and cost-effective based interventions for HPAI H5N1 control .
33Some examples of successful application of tools described in this document
INTEGRATING PARTICIPATORY AND CONVENTIONAL DATA COLLECTION TOOLS FOR UNDERSTANDING LOCAL CHICKEN MARKET CHAINSEric BrumThis study demonstrates the value of focus group discussion / semi-structured interviewing to get important detail on value chains.
Application of the methodology and resultsAn iterative investigation process was utilized to understand H5N1 risk to humans in Jakarta which was originating through the poultry market chain. A variety of tools were used to understand the nature of the risk and how it could be addressed.
First, observations were made of how risk was presenting to humans in Jakarta and to poultry found in Jakarta markets. When this study started there had been five human H5N1 cases within one week in the greater Jakarta area after a quiescent period. Although chick-ens appeared healthy in collector yards and markets, native chickens bought in Jakarta by the study team, and kept alive for observation, died within a day of being bought (chickens would normally have been slaughtered and consumed within this time).
The second step was to engage with key informants to rapidly assess the nature of the Jakarta poultry value chain. A semi-structured interview with a group of poultry collector yard traders was held, and proportional piling and participatory mapping tools were used to assess trading volume by bird type, and origins and destinations of birds traded through collector yards.
The third step was to conduct a poultry movement profiling and geo-referencing of markets and collector yards in the greater Jakarta area. A previously-conducted poultry value chain map of Jakarta was also consulted during this phase of the investigation. In addition to a geo-referenced database of all post-production marketing locations, the study also provided a cross-sectional view of poultry origins and destinations through each of the marketing locations and quantified the types of birds traded and the means of transport utilized.
The fourth step was to conduct surveillance at collector yards to identify high-risk poul-try movements. Live bird sampling, environmental sampling, and sentinel bird monitoring were conducted in collector yards in two districts of greater Jakarta. Despite the study being designed to determine the cost-effective longitudinal collector yard surveillance tech-nique, preliminary data from the sentinel bird monitoring component of the study identi-fied high risk native chickens originating from a site in Central Java. The site in Central Java was determined to be another collector yard which sources native chickens from villages in East Java, Central Java, and Yogyakarta for onward transport to Jakarta.
Once the upstream collector yard was confirmed as a critical control point (CCP) for the introduction of infected native chickens into the Jakarta markets, a small multi-disciplinary team utilizing participatory engagement tools conducted a rapid site assessment to develop a risk reduction recommendation for consideration by stakeholders. The objective was to develop a mutually beneficial plan that would be accepted by both government and private sector market stakeholders without the need for strong regulatory enforcement. An assess-ment of the collector yard’s organizational structure, infrastructure, marketing practices, cleaning and disinfection activities, and contribution to HPAI risk to humans in Jakarta
Designing and implementing livestock value chain studies34
was prepared and accepted by local government authorities. Efforts are now underway to develop a risk reduction plan to collaboration with private sector market stakeholders.
DiscussionRegarding the value of utilizing participatory approaches in addition to, or integrated with, other data gathering techniques, the core benefit appears to that participatory approaches build trust with stakeholders. This trust enables rapport and mutual understanding to be established more effectively, as well as increasing the likelihood of valid communicative exchange being established when data are being gathered. Thus, the question is not whether to choose participatory approaches over conventional approaches, but rather how the addition of participatory approaches can improve the overall quality of data gathered regardless of the specific tool used.
In summary, the basic inquiry process utilized to identify and address this critical control point along the Indonesia poultry market chain is as follows:1. Where is the problem (risk) being felt?2. Where can the problem (risk) be addressed (Where is a CCP)?
What product is being moved?Where is it coming from and where is it going?How is it moving?How long does it take?
3. How can one work with stakeholders at this CCP to fix the problem (reduce risk)?What’s the perspective of the stakeholder?What’s valuable and how is value determined?What knowledge gaps exist?How are decisions made?
CROSS BORDER MAPPING WITH INCLUSION OF CROSS-BORDER PRICE DIFFERENTIALSMohinder OberoiCross border mapping in South Asia with inclusion of cross-border price differentials lead to the acceptance by Bangladesh that the unofficial importing of eggs from India was una-voidable and therefore should be made official and managed. This opens the opportunity for a proactive risk management strategy rather than an ineffective official ban on imports that creates unknown and uncontrolled risk.
Bangladesh shares long and porous borders with limited number of border guards and custom officials with India. There exists formal border trading; however, poultry and poultry products are not incorporated in the trading items list. A large number of families living near the border area have family bondage with other side of the border. Under the cross-border project a study was conducted in six selected cross border corridors of Bang-ladesh with India. From each target location five rural poultry markets were selected. At each market four categories of respondents were identified. These included poultry seller/retailer, trader, community people engaged in poultry rearing practice and key informants. Data collection was done on two occasions within a period of three months. A blend of qualitative and quantitative data was obtained using a variety of techniques.

35Some examples of successful application of tools described in this document
The data were collected through interviews of 618 individual respondents, 110 focus group discussions (FGDs) and four larger group discussions (including all categories of respondents). ‘Price difference’ was a big factor for cross border illegal poultry trading. Findings specifically from the Comilla (Bangladesh) - Sonamura (India) corridor indicated huge volume of poultry and poultry products (chicks and eggs) transportation across bor-der into Bangladesh. In most of the markets in this border corridor, Indian farm produced eggs were being sold openly at a cheaper rate compared to the Bangladeshi products. Both farmed and native eggs of various quantities were coming on regular basis but the inflow was mainly of day old chicks (DOCs). Here, overall 50-70 percent DOCs come from India because price of chicks in Bangladesh was very high (approximately double the proce paid for Indian DOCs). Approximately 4-5 hundred white Indian eggs entered daily into Bangladesh. Some of the people directly or indirectly involved in unofficial trading included, people who were involved in the poultry business, traders (middle men, who make contract with both sides businessmen across border), syndicate of businessmen, disguised social workers, political leaders and law enforcement agency personnel. Some of the main rea-sons for cross border poultry and poultry products trading from India were higher demand in Bangladesh and lower price in India.
Partly on the basis of the information provided by this study, the Government of Bang-ladesh has decided to allow the official importation of 10 million eggs and day-old chicks (DOC) from India in 2010-11. This is basically a pragmatic decision in the face of an irresist-ible economic incentive for the trade to take place, officially or not. The decision opens the opportunity for a proactive risk management strategy rather than an ineffective official ban on imports that creates unknown and uncontrolled risk.
However, such a decision has triggered strong resentment among the local poultry farmers, because it effectively removes a protectionist mechanism and exposes them to international competition. They said this will cause widespread loss to them and lead to closure of thousands of small farms. Another interpretation could be that the Bangladeshi egg and DOC producers now have a strong incentive to improve their management stand-ards to the level of their Indian competitors: those who rise to this challenge will survive and be in a better position than before.
VALUE CHAIN MAPPING AND SUBSEQUENT RISK ASSESSMENT OF CROSS-BORDER CHICKEN TRADE BETWEEN NORTHERN VIETNAM AND CHINAAndrew BissonValue Chain mapping and subsequent risk assessment of cross-border chicken trade between Northern Vietnam and China prompted a review of trade policy to control move-ments and stronger collaborative links in considering an alternative managed cross-border trade mechanism.
BackgroundThe risks associated with movement of livestock and livestock products across the China-Vietnam border have been appreciated for some time. Spent hen trade in particular is driven by powerful economic drivers and it was recognised that preventing such trade with the available resources was not feasible. However identifying alternative solutions was a challenge.
Designing and implementing livestock value chain studies36
MethodologyIn order to develop more effective risk reduction strategies there was a need to better understand and characterise the cross-border trade. A range of participatory approaches including stakeholder interviews, seasonal calendars and supply chain mapping were used. The information gathered was very difficult to verify directly but through cross-checking by triangulation and consistency of information obtained from a number of key informants a clear pattern emerged and permitted a semi-quantitative description of the trade. This was combined with simple economic analysis.
FindingsStudies were able to document the scale and sophistication of unofficial cross-border poul-try trade as well as the intricacies of the unofficial system and the incentive structures for those involved. The emerging evidence base became a useful advocacy tool confirming that existing control approaches were not effective and encouraging a policy debate seeking alternative solutions.
The value-chain work also provided a foundation for further detailed risk assessment exercises. These highlighted the fact that the trade movements did not occur only at the border but were part of a wider trade system. This in turn helped identify transmission risks and to target potential control opportunities at a number of nodes along the supply chain including on both sides of the border as well as at the border.
With an improved understanding of the mechanisms of cross-border trade and the eco-nomics behind the movements, policy options to support carefully regulated trade (rather than prohibiting it) are being considered which have the potential for greater impact in reducing overall disease transmission risks. Preliminary risk reduction options identified include:
i. a HACCP-like approach applied at a number of control points along the chains;ii. certification of farms of origin on one side of the border supplying birds or poultry
products across the border;iii. the development of a dedicated supply chain to manage higher risk poultry trade by
excluding product (or pathogens) from leaving the specialised supply chain (so called dirty compartment approach).
For each of the options, alternative value chains need to be described and analysed for feasibility and appropriate incentive structures if trade is to be re-directed. Characterisation of the existing value chain provides important information on the current transaction costs of doing business unofficially and therefore helps to understand whether future re-designs of the value chain will be viable. Conventional quarantine and border policing systems may still be required to ensure transaction costs for undesirable channels remain higher than for managed commodity flows.
37Some examples of successful application of tools described in this document
THE USE OF CROSS-BORDER MAPPING AND LOCAL INTERVIEWING OF STAKEHOLDERS TO UNDERSTAND THE UNOFFICIAL CATTLE TRADE ACROSS SOUTH EAST ASIAAlexandre BouchotThe SEACFMD campaign used cross-border mapping and local interviewing of stakehold-ers to understand the unofficial cattle trade across South East Asia so that more effective Foot-and Mouth Disease (FMD) control options could be developed.
ContextAnimal movement is believed to be the predominant cause of new FMD outbreaks. This presents a difficult issue for all member countries of the SEACFMD campaign which is a long-run programme whose aim is to control Foot-and Mouth Disease in South East Asia by 2020. Given the importance of the livestock sector, including the economic value of the livestock trade, considerable animal movement is typical of the region. It is well recognized that changing economic circumstances in the region can cause fluctuations in the direction of animal movements. Amongst many other activities, ranging from transparency about disease information and regional commitment, it has been, and is still, very useful to for the SEACFMD members to have detailed information about stakeholders and transactions across the chain of trans-borders livestock transport so that attractive (from a cost/profit point of view) alternatives can be offered to producers, traders and buyers of these live-stock to work in a risk-managed chain (e.g. controlled trade in vaccinated and quarantined cattle).
Application of the methodologyDuring the last three years, with the assistance of member countries, the RCU has devel-oped notably through value chain analysis by semi-structured interviews or experts meet-ings a much better appreciation of the direction, nature, and extent of livestock movements in the region.
Semi-structured interviewing was the main methodology employed. Stakeholders meetings were also organised to cross-check some information, mainly through the use of participatory mapping, resulting in a set of peer-reviewed maps. The semi-structured interview methodology implemented to identify stakeholders and map the market chain of cross-border livestock movement was a non-probability sampling method known as Snowball Sampling. This is a sampling method in which initial respondents for the survey are first selected and, through their response to questions in the interview, they elect the subsequent respondents. Snowball Sampling has been used in public health studies and is highly appropriate for where relational data is of interest and when the sampling frame is not available or unknown as it the case here with limited centralised information on livestock traders; absent or incomplete trader registration systems and, also, occurrence of unofficial trade.
In each of the study sites, key traders or other entry points (identified from available information from veterinary authority or previous studies) were selected as the ‘initial respondent’ and interviewed using a participatory approach to data collection aimed to gather information on, inter alia: the movement pathways and its seasonal trends, market
Designing and implementing livestock value chain studies38
chains and trading behaviour and relationships. The information gathered from this inter-view was then used to identify secondary respondents who were linked, through trade movements of livestock, to the initial respondents. This method was continued as far as possible in both ‘upstream’ and ‘downstream’ directions until the source and destination of livestock (as far as possible) were reached.
ResultsAlthough the overall general movement pattern seems well established for cattle and buffalo, over shorter timeframes patterns can change rapidly in response to changes in demand and price signals. For pigs, patterns are more dynamic over short periods, often reflecting supply and demand imbalances due, sometimes, to disease outbreaks (e.g. PRRS). Recent years have seen a marked increase in movements of cattle into Vietnam and north into China. Such changes highlight the need for greater flexibility in developing a control strategy for the future. Although China, Vietnam, and Malaysia are likely to remain the major markets for cattle, buffalo and goats, and movements in these general directions can be anticipated with some confidence, prudence suggests undertaking periodic reviews of the trends that stimulate animal movement. For pigs, the dominant pathway is from Vietnam to Lao PDR, Cambodia and, sometimes, Thailand (frozen suckling piglets). Some pigs are moved for slaughter from Thailand to Cambodia and Lao PDR.
PerspectivesPatterns of animal movement remain a critical element in designing future strategy. Move-ments are exceptionally difficult to control, following as they do, well established demand and price gradients, and it now seems wiser and more appropriate to simply facilitate movements in the direction that market demands dictate. Trying to alter or slow livestock movements only encourages increasing rates of illegal movement. The best strategy, in seeking more effective controls of animal movement, is to reduce costs, improve the efficiency of legal animal movements, and encourage traditional movements to conform, at least in part, to some form of inspection. Reduced costs and free FMD vaccination for border traders or even at source would encourage more legal animal traffic. The range of animal movement management processes needs to be examined annually to identify risks and opportunities for a more efficient system. Traceability with the aid of ear tags, brands, and ear notches helps; and the growing popularity of such devices should be encouraged.
Control at source and improved inspection techniques are to be developed for livestock movements across the supply chain.
In this approach, a current partnership between private sector and public veterinary services of both Myanmar and Malaysia represents a pilot experience worth to be noted. In this case, a Malaysian private company has set up in Central Myanmar a private quarantine station, run by local management, where up to 400 cattle are gathered every month. Those animals are bought in the neighbourhood at usually a better price than the market price. Those animals are identified and individually vaccinated against FMD by a Myanmar Official soon after entering the station, are kept more than 21 days after the injection, and then sent accompanied by a certificate to Yangon by road and then straightforward to Malaysia
39Some examples of successful application of tools described in this document
by boat without any more quarantine delay at arrival. As trust increases, this mechanism is significantly increasing the security, the rapidity of the market chain, and as a consequence the value of the trade for all stakeholders.
Such an approach shall serve as an example when thinking about reducing administra-tive burdens along other trade pathways in the region. For instance, there are probably currently relative money losses at quarantine station at borders: it is well known that many traders are trying to avoid the attached taxes, fees, cost of use and loss of time by smug-gling their animals, infected or not, through the porous borders. As a consequence, this approach of quarantine stations at borders is considered more and more as inefficient. The money saved by reducing what finally appears as obstacles to trade could be usefully employed by vaccinating and holding identified animals closer to the source of produc-tion. This could be done first on a pilot basis and then become the rule for the ASEAN free trade agreement that is supposed to take place in 2015. For this approach to be suc-cessful requires precise knowledge of who are the stakeholders that are currently taking advantage, formally or informally, of the trade along the market chain. Then it would be necessary to propose to everyone (private sector [traders, smallholders, final buyers...], public sector [veterinary services, customs...]), through intense consultation and participa-tory approaches, an alternative that provides as much as possible to every one of them incentives to get involved in a safer trade. At least, the system proposed should not hamper anyone’s livelihood as it would even give them an incentive to block such a safer trade if it was the case.
41
Final words
FLEXIBILITYThe target of applying the combination of value chain and risk analyses described here is to address disease risk and contribute to disease control planning. Therefore the value chain analysis needs to focus on elements that either increase disease risk or are critical in disease risk management, which avoids the need to carry out a complete value chain analy-sis. Otherwise there is the danger that value chain mapping and analysis are carried out in unnecessary detail or with the wrong focus. The best way to achieve this is to ensure that veterinary epidemiologists and social scientists work together throughout the process at all levels and at all stages from design through to the field work to the analysis and reporting.
The methodological approach presented here should not be seen as a rigid prescription. The approach can be flexible: It is important to work at different levels of detail. An over-view is needed to ensure that no important risks in the value chains are omitted. Attention to detail is needed in identifying and appraising risk reduction measures. The amount of detailed data and detailed analysis required should be driven by the requirements of disease control decision making. The iterative nature of data gathering should be noted. It is not necessary or practical to get everything ‘perfect’ before making decisions. The value chain / risk analysis process will identify areas where better data are critically needed so that focus data collection efforts can be focused and prioritised.
The processes described may be carried out by a few experts working together or with full involvement of all stakeholders through series of workshops, discussions or personal interviews (often the choice here depends on availability of experts, time constraints and budget available).
The analyses and monitoring of risk in value chains should be carried out as an element of preparedness for disease, not only in response to outbreaks. Then, an understanding of the ‘usual’ patterns of movements of animals, products, materials, people and vehicles etc. would lead to better understanding of how disease could spread if introduced into the system at different places, which in turn allows for planning of strategies to reduce risks.
It is important for veterinary services to monitor changes in value chains and assess how these may change in time and space, e.g. reactions to market shocks, or long term trends in consumer preferences and supply. Variations in prices (short or longer term) between areas within a country or across national boundaries may affect flows and relative importance of different value chains, that in turn could affect disease risk. Risk factors can change season-ally and also change over long term as livestock sectors develop. Veterinary services need to monitor changes and be responsive to different risk levels.
Value chain and risk analysis can also be useful to permit advanced risk assessment or long-range forecasting and also help to guide decision makers in contingency planning and design of early warning systems.

Designing and implementing livestock value chain studies42
TIP 15
Pitfalls to be avoided
Cautionary tales.
Avoid collecting value chain information without focusing on the important data required
to explain disease spread;
Ensure that incentive structures are fully developed since these may be important in
designing implementable control strategies.
Avoid presentation of results from non-representative, often convenience sampling as
though they were randomly obtained. The sampling methodology should be clearly and
completely described when presenting results. Limitations and uncertainties MUST be
emphasised.
At a regional level it may be possible to apply the principles of this approach very quickly to rapidly assess production systems, epidemiological situation of disease and socio-political situation within several countries to identify countries where disease control interventions for specific diseases may be feasible or not feasible in the short or medium term.
DATA SHARINGIt is essential to ensure that concerned disease control decision makers have easy access to the generated value chain analysis results. Geographic Information Systems can be used to include a large amount of value chain information in maps. These maps would indentify production system clusters, value chain transaction routes and processing points. Market price information and differentials can be included as price surface layers. Tables with names, phone number and trade/collection patterns of traders would be of interest for sharing with public veterinary staff in the field for day to day surveillance and disease monitoring.
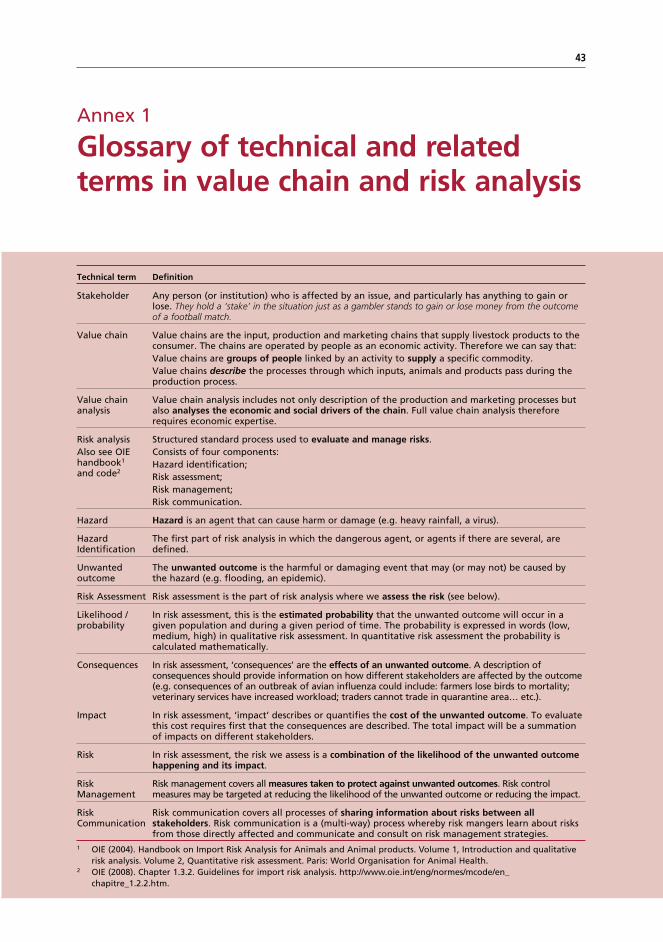
43
1 OIE (2004). Handbook on Import Risk Analysis for Animals and Animal products. Volume 1, Introduction and qualitative risk analysis. Volume 2, Quantitative risk assessment. Paris: World Organisation for Animal Health.2 OIE (2008). Chapter 1.3.2. Guidelines for import risk analysis. http://www.oie.int/eng/normes/mcode/en_ chapitre_1.2.2.htm.
Annex 1
Glossary of technical and related terms in value chain and risk analysis
Technical term Definition
Stakeholder Any person (or institution) who is affected by an issue, and particularly has anything to gain or lose. They hold a ‘stake’ in the situation just as a gambler stands to gain or lose money from the outcome of a football match.
Value chain Value chains are the input, production and marketing chains that supply livestock products to the consumer. The chains are operated by people as an economic activity. Therefore we can say that:Value chains are groups of people linked by an activity to supply a specific commodity.Value chains describe the processes through which inputs, animals and products pass during the production process.
Value chain analysis
Value chain analysis includes not only description of the production and marketing processes but also analyses the economic and social drivers of the chain. Full value chain analysis therefore requires economic expertise.
Risk analysisAlso see OIE handbook1 and code2
Structured standard process used to evaluate and manage risks.Consists of four components:Hazard identification;Risk assessment;Risk management;Risk communication.
Hazard Hazard is an agent that can cause harm or damage (e.g. heavy rainfall, a virus).
Hazard Identification
The first part of risk analysis in which the dangerous agent, or agents if there are several, are defined.
Unwanted outcome
The unwanted outcome is the harmful or damaging event that may (or may not) be caused by the hazard (e.g. flooding, an epidemic).
Risk Assessment Risk assessment is the part of risk analysis where we assess the risk (see below).
Likelihood / probability
In risk assessment, this is the estimated probability that the unwanted outcome will occur in a given population and during a given period of time. The probability is expressed in words (low, medium, high) in qualitative risk assessment. In quantitative risk assessment the probability is calculated mathematically.
Consequences In risk assessment, ‘consequences’ are the effects of an unwanted outcome. A description of consequences should provide information on how different stakeholders are affected by the outcome (e.g. consequences of an outbreak of avian influenza could include: farmers lose birds to mortality; veterinary services have increased workload; traders cannot trade in quarantine area… etc.).
Impact In risk assessment, ‘impact’ describes or quantifies the cost of the unwanted outcome. To evaluate this cost requires first that the consequences are described. The total impact will be a summation of impacts on different stakeholders.
Risk In risk assessment, the risk we assess is a combination of the likelihood of the unwanted outcome happening and its impact.
Risk Management
Risk management covers all measures taken to protect against unwanted outcomes. Risk control measures may be targeted at reducing the likelihood of the unwanted outcome or reducing the impact.
Risk Communication
Risk communication covers all processes of sharing information about risks between all stakeholders. Risk communication is a (multi-way) process whereby risk mangers learn about risks from those directly affected and communicate and consult on risk management strategies.
FAO ANIMAL PRODUCTION AND HEALTH GUIDELINES
1. Collection of entomological baseline data for tsetse area-wide integrated pest management programmes, 2008 (E)2. Preparation of national strategies and action plans for animal genetic resources, 2009 (E, F, S, R)3. Breeding strategies for sustainable management of animal genetic resources, 2010 (E, F, S, R**, Ar**)4. A value chain approach to animal diseases risk management – Technical foundations and practical framework for field application, 2011 (E)5. Guidelines for the preparation of livestock sector reviews, 2011 (E)6. Developing the institutional framework for the management of animal genetic resources, 2011 (E)7. Surveying and monitoring of animal genetic resources, 2011 (E)8. Guide to good dairy farming practice, 2011 (E)9. Molecular genetic characterization of animal genetic resources, 2011 (E)10. Designing and implementing livestock value chain studies, 2012 (E)
Availability: January 2012
Ar – Arabic Multil – Multilingual C – Chinese * Out of printE – English ** In preparationF – French e E-publicationS – SpanishR – Russian
The FAO Animal Production and Health Guidelines are available through the authorized FAO Sales Agents or directly from Sales and Marketing Group, FAO, Viale delle Terme di Caracalla, 00153 Rome, Italy.
Find more publications athttp://www.fao.org/ag/againfo/resources/en/publications.html
Value chain studies, including production system and market chain studies, are essential to value chain analysis, which when coupled with disease risk analysis is a powerful tool to identify key constraints and opportunities for disease control based on risk management in a livestock production and marketing system. Several production system and market chain studies have been conducted to support disease control interventions in South East Asia. This practical aid summarizes experiences and lessons learned from the implementation of such value chain studies in South East Asia. Based on these experiences it prioritizes the required data for the respective purpose of a value chain study and recommends data collection as well as data analysis tools.
This practical aid is intended as an adjunct to the FAO value chain approach and animal diseases risk management guidelines document. Further practical advice is provided for more effective use of value chain studies in South and South East Asia as part of animal health decision support.