design speed and design traffic concepts ce 453 lecture 11
TRANSCRIPT

Design Speed and Design Traffic Concepts
CE 453 Lecture 11
Objectives Get familiar with design
speeds for functional classes Describe traffic demand and
determine for roadway design Define ADT, AADT, DHV, D,
DDHV, K-Factor, and T
Posted speed = speed limit Operating speed = free flow (spot
speed) Running speed = length of
highway section ÷ running time Design speed = selected speed
used to determine geometric design features
Design Speed Design speed is defined by the AASHTO Green
Book as: ...the maximum safe speed that can be maintained over a specified section of highway when conditions are so favorable that the design features of the highway govern.
Design Speed should: 1) “…be consistent with the speed the driver is likely to expect.” and 2) “. . .fit the travel desires and habits of nearly all drivers.”
Not posted speed and not operating speed (but ALWAYS higher than both)
See first part of: http://www.fhwa.dot.gov/environment/flex/ch04.htm (Chapter 4 from FHWA’s Flexibility in Highway Design)
Design Speed Considerations Functional classification of the highway Character of the terrain Density and character of adjacent land
uses Traffic volumes expected to use the
highway Economic and environmental
considerations

Design Speed in Green Book (suggested minimum design speed) Rural Local Roads
Source: A Policy on Geometric Design of Highways and Streets (The Green Book). Washington, DC. American Association of State Highway and Transportation Officials, 2001 4th Ed.
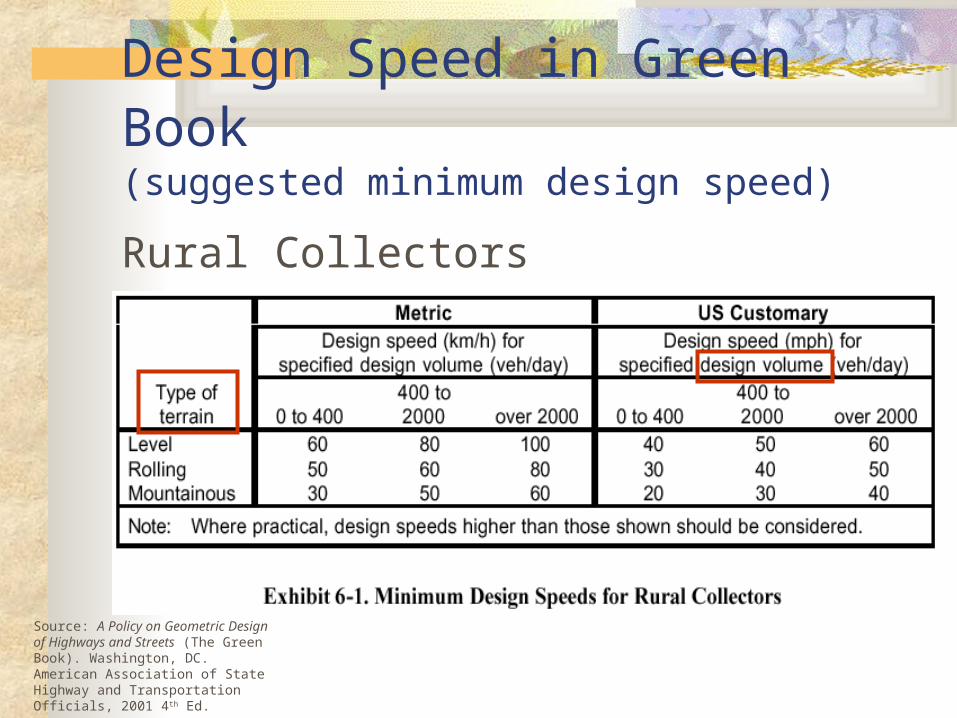
Design Speed in Green Book (suggested minimum design speed)
Rural Collectors
Source: A Policy on Geometric Design of Highways and Streets (The Green Book). Washington, DC. American Association of State Highway and Transportation Officials, 2001 4th Ed.
Design Speed in Green Book (suggested minimum design speed)
Rural Arterials 60 – 120 kph (40-75 mph) Depends on …
TerrainDriver expectancyAlignment (reconstruction)

Design Speed in Green Book (suggested minimum design speed)
Urban Locals 20-30 mph Collectors 30 mph+ Arterials 30-60 mph

Values represent the minimum acceptable design speeds for the various conditions of terrain and traffic volumes associated with new or reconstructed highway facilities

International

Design Traffic

Traffic Definitions
Volume: number of vehicles, pedestrians,
etc. passing a point during a specific period of time
for vehicles, usually expressed as veh/hour (vph) or veh/hour/lane (vphpl)
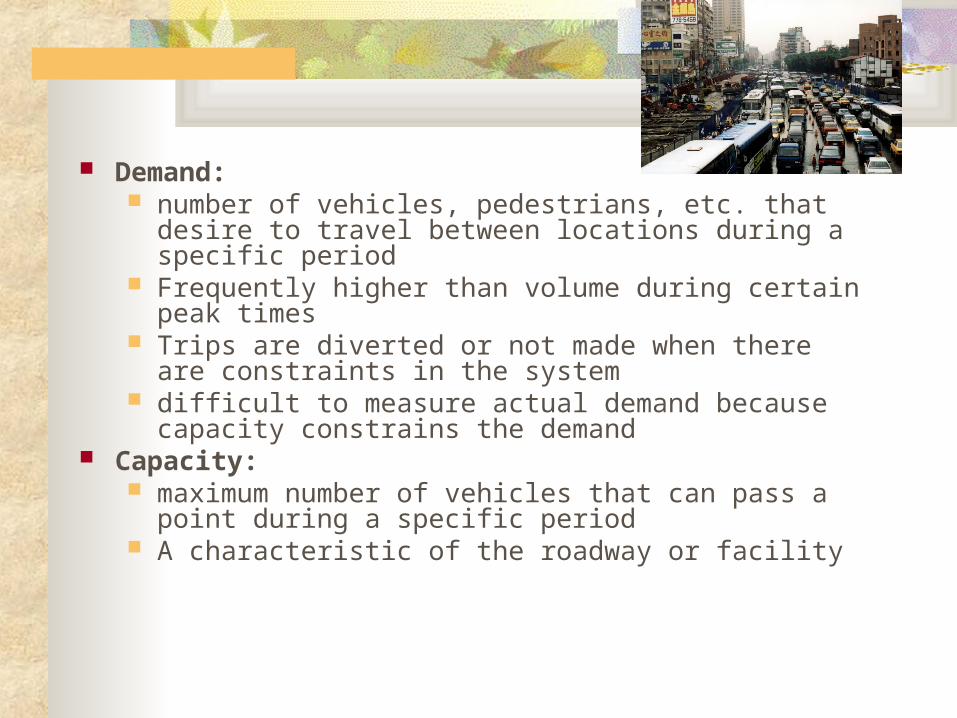
Demand: number of vehicles, pedestrians, etc. that desire to
travel between locations during a specific period Frequently higher than volume during certain peak
times Trips are diverted or not made when there are
constraints in the system difficult to measure actual demand because capacity
constrains the demand Capacity:
maximum number of vehicles that can pass a point during a specific period
A characteristic of the roadway or facility
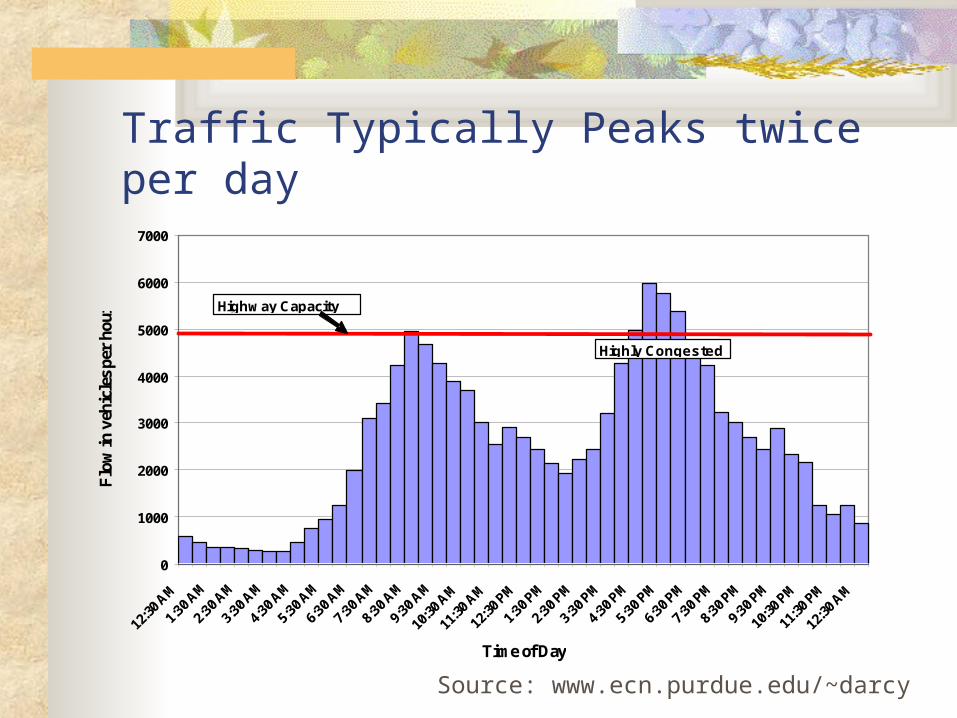
Characteristics of Traffic Flow Highly variable
Time of day Day of week Season Road characteristics Direction
0
1000
2000
3000
4000
5000
6000
7000
12:30
AM
1:30 A
M
2:30 A
M
3:30 A
M
4:30 A
M
5:30 A
M
6:30 A
M
7:30 A
M
8:30 A
M
9:30 A
M
10:30
AM
11:30
AM
12:30
PM
1:30 P
M
2:30 P
M
3:30 P
M
4:30 P
M
5:30 P
M
6:30 P
M
7:30 P
M
8:30 P
M
9:30 P
M
10:30
PM
11:30
PM
12:30
AM
Time of Day
Flo
w in
veh
icle
s pe
r ho
ur
Highway Capacity
Highly Congested
Traffic Typically Peaks twice per day
Source: www.ecn.purdue.edu/~darcy

Volume Studies AADT: Annual average daily
traffic (counted for 365 days) ADT: average daily traffic
(counted for > 1 day and < 365) PHV: peak hour volume Classification counts: fleet mix
Estimating AADT Annual Average Daily Traffic Use count station information Extrapolate to non-count locations Used to adjust ADT for
Seasons Daily variation

AADT Data Helps to: Estimate highway revenues Establish overall volume trends Establish annual accident rates Analyze benefits of road
improvements

Counting Program To satisfy the traffic volume data
needs for all roads under a particular jurisdiction, we establish a Counting Program
A systematic pattern of counting at different times and locations
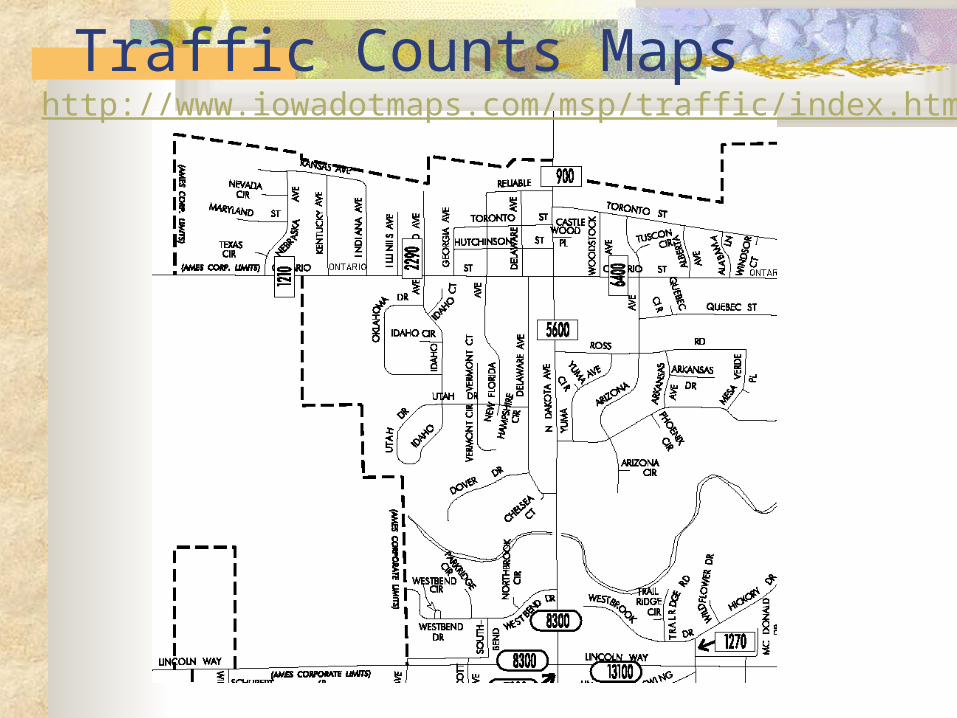
Traffic Counts Mapshttp://www.iowadotmaps.com/msp/traffic/index.html
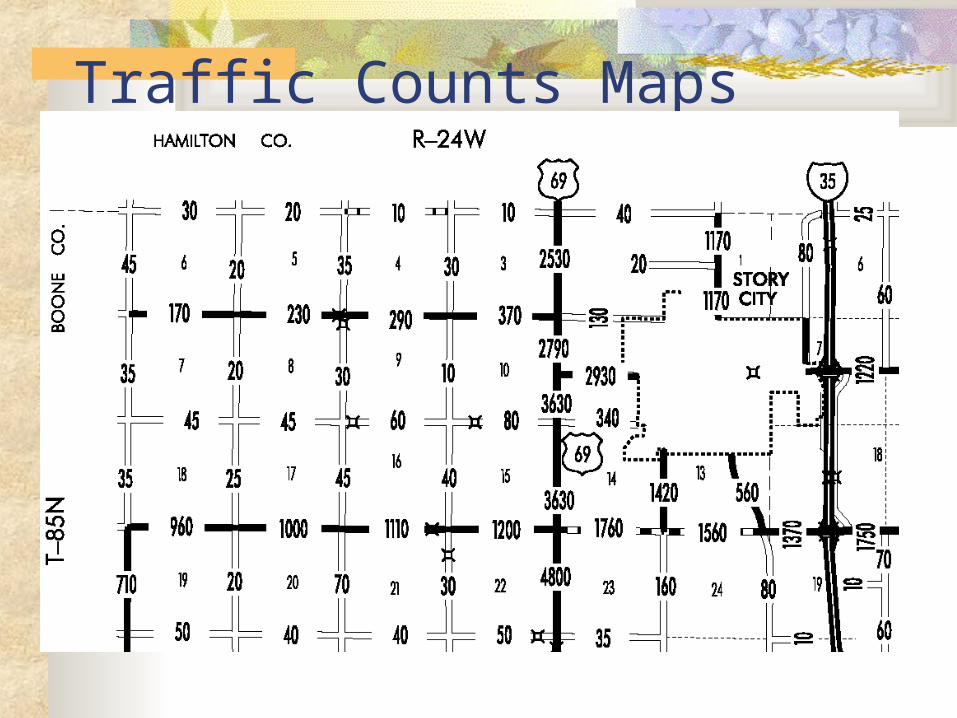
Traffic Counts Maps
Design Volume Usually hourly volume Which hour?
Average hourly volume – inadequate design
Maximum peak hour – not economical Hourly volume used for design should not
be exceeded very often or by very much Usually use 30th highest hourly volume of
the year On rural roads 30 HHV is ~ 15% of ADT Tends to be constant year to year
Traffic Demand Design Hourly Volume (DHV) – future hourly
volume (both directions) used for design - typically 30th HHV (highest hourly volume) in the design year
Why 30th HHV? Breakpoint of 2-28 Compromise: too high is wasteful, too low poor
operation Approximately median weekly peak hour volume
(top highest week peak hours)
(30th HHV exceed 29 times in year)
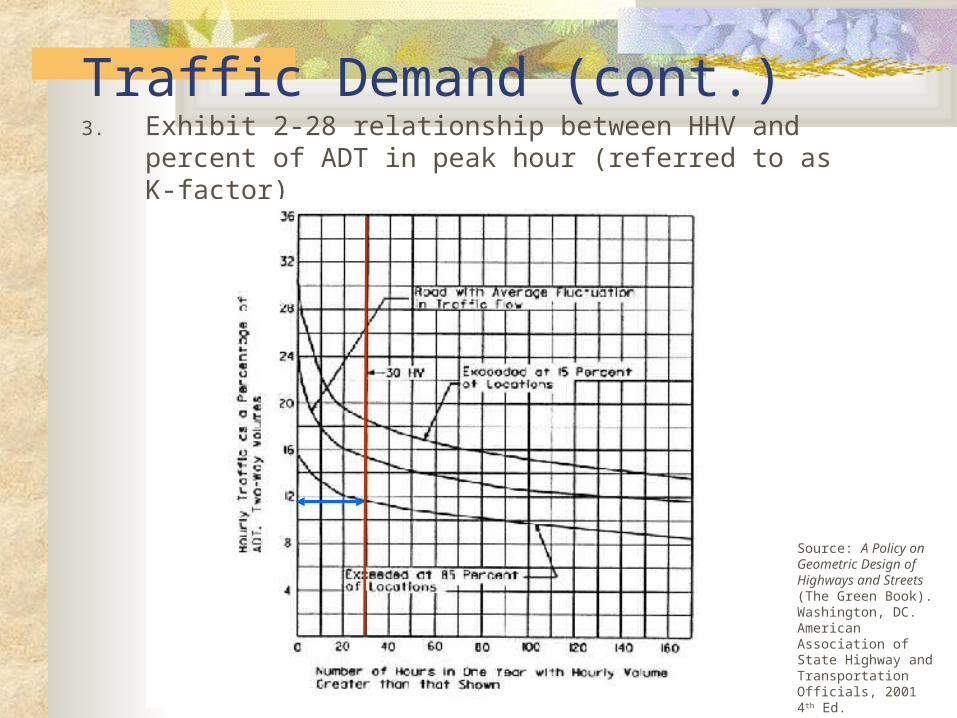
Traffic Demand (cont.)3. Exhibit 2-28 relationship between HHV and percent of
ADT in peak hour (referred to as K-factor)
Source: A Policy on Geometric Design of Highways and Streets (The Green Book). Washington, DC. American Association of State Highway and Transportation Officials, 2001 4th Ed.
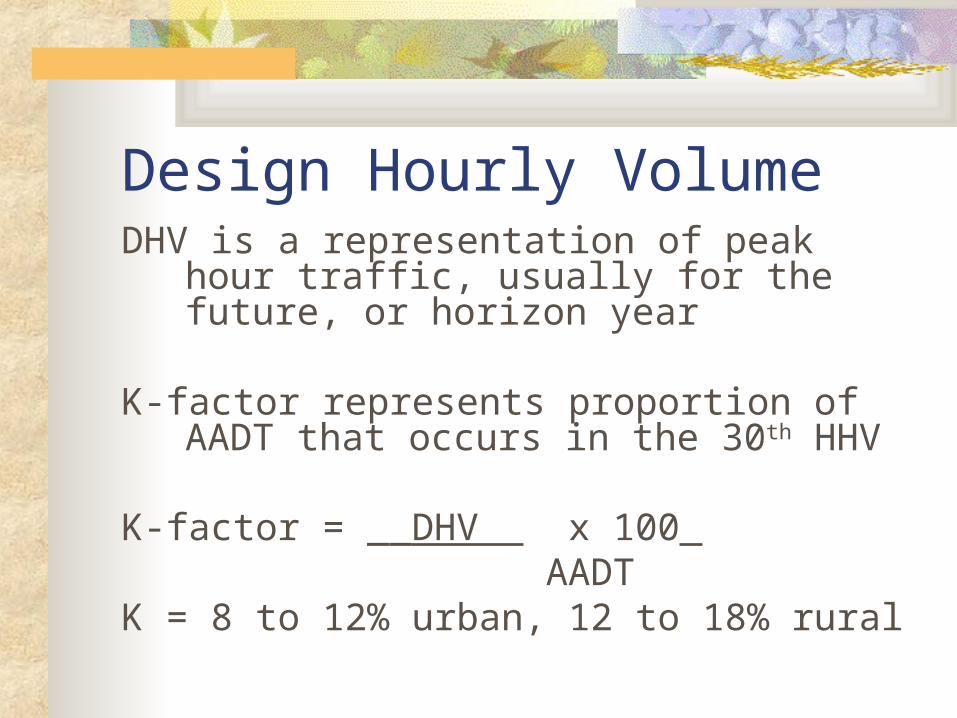
Design Hourly Volume DHV is a representation of peak hour
traffic, usually for the future, or horizon year
K-factor represents proportion of AADT that occurs in the 30th HHV
K-factor = __DHV x 100 AADT K = 8 to 12% urban, 12 to 18% rural
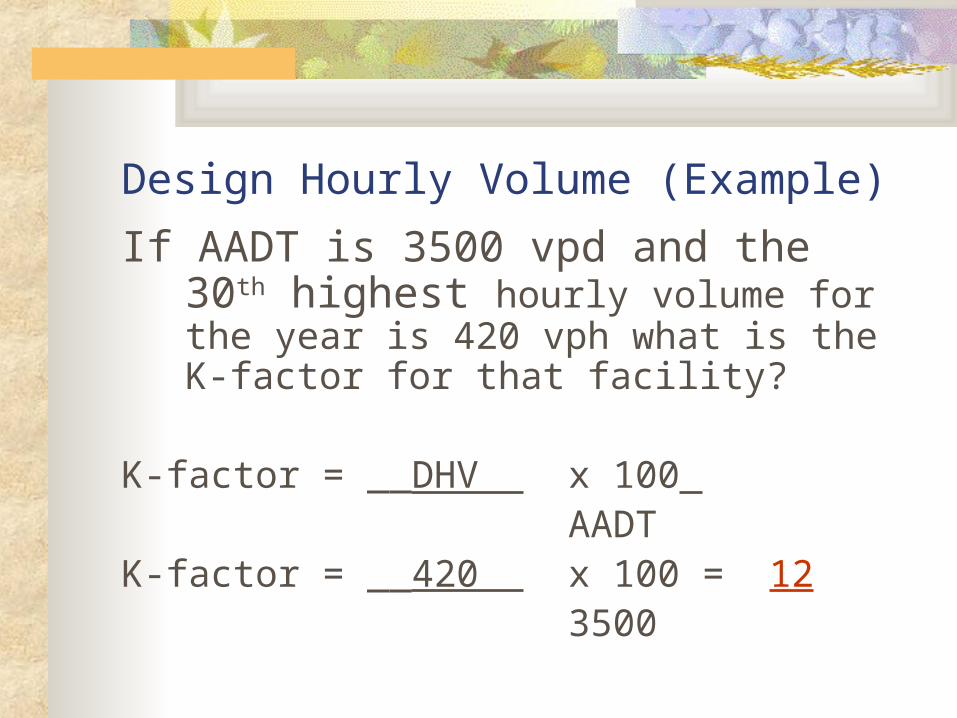
Design Hourly Volume (Example)
If AADT is 3500 vpd and the 30th highest hourly volume for the year is 420 vph what is the K-factor for that facility?
K-factor = __DHV x 100 AADT K-factor = __420 x 100 = 12 3500
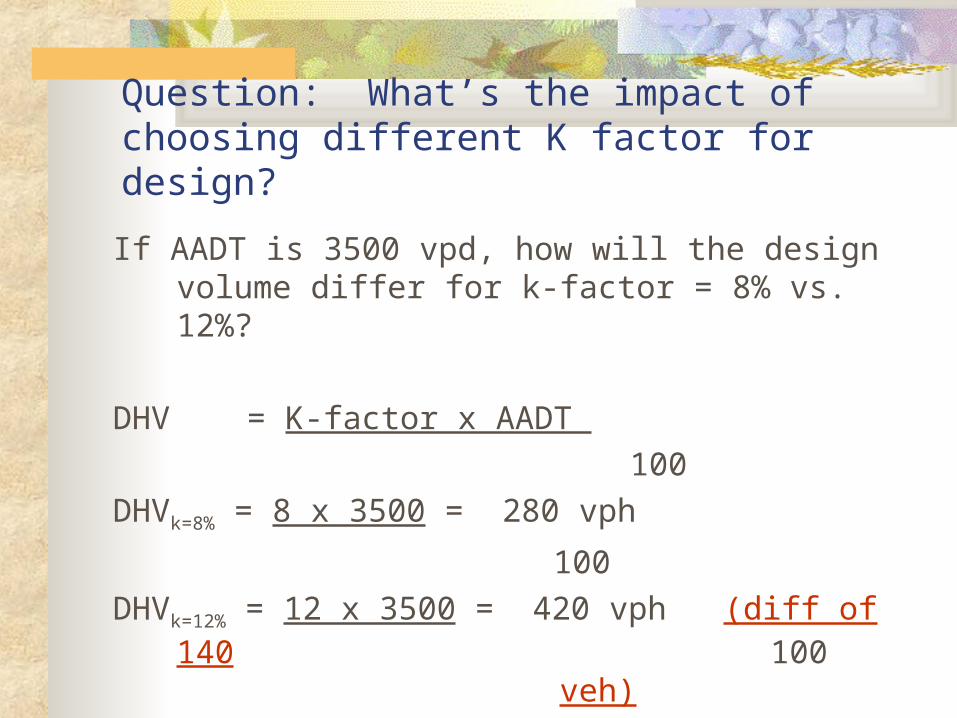
Question: What’s the impact of choosing different K factor for design?
If AADT is 3500 vpd, how will the design volume differ for k-factor = 8% vs. 12%?
DHV = K-factor x AADT 100DHVk=8% = 8 x 3500 = 280 vph
100DHVk=12% = 12 x 3500 = 420 vph (diff of 140
100 veh)
Traffic Demand (cont.)• D = directional distribution = one
way volume in peak direction (expressed as a percentage of two-way traffic) Rural 55 to 80%
• Can also adjust for how traffic is distributed between lanes (e.g., 3 lanes, highest/outside lane may be 40% of total directional flow)

Directional Distribution (example)
If traffic is directionally split 60/40, what is directional distribution of traffic for previous example (Design hourly volume = 420 veh/hr)?
Directional Design Hourly Volume (DDHV) =
0.6 x 420 = 252 veh/hr
Notice we use 0.6 not 0.4!!
Traffic Demand (cont.)• T = percentage of heavy vehicles
during design hour (Iowa interstate 35% plus)
• Affects capacity, ability to pass on two-lane rural roads, etc.
• Larger, occupy more space• Should determine % during design
hour (truck patterns may not be same as passenger vehicles)

PHF = peak-hour volume . 4(peak 15-min volume)
Flow is not uniform throughout an hourHCM considers operating conditions
during most congestion 15-minute period of the hour to determine service level for the hour as a whole
Peak Hour Factor (PHF)

Peak Hour Factor
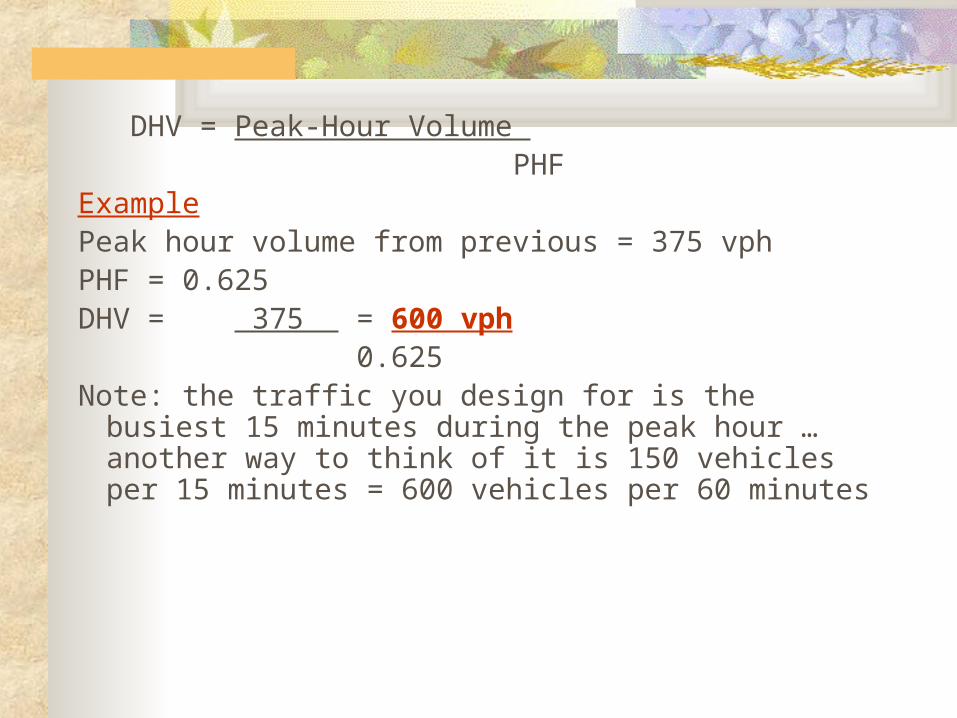
DHV = Peak-Hour Volume PHFExamplePeak hour volume from previous = 375 vphPHF = 0.625DHV = 375 = 600 vph 0.625Note: the traffic you design for is the busiest 15
minutes during the peak hour … another way to think of it is 150 vehicles per 15 minutes = 600 vehicles per 60 minutes