design principles for glass used structurally - · pdf filedesign principles for glass used...
TRANSCRIPT

Design Principles
For Glass Used
Structurally
Naimeh Khorasani
Rapport TABK–04/1025 Lund 2004
Department of Building Science

Building Science DepartmentLund UniversityBox 118221 00 LundSweden
ISRN LUTADL/TABK–1025–SEISSN 1103-4467ISBN2004 Naimeh Khorasani

TABLE OF CONTENTS
PREFACE..................................................................................................................................1ABSTRACT...............................................................................................................................2TABLE OF SYMBOLS.............................................................................................................3
1 ARCHITECTURAL GLASS
1.1 Introduction..........................................................................................................71.2 Glass as a load bearing component.........................................................................81.31.4
2 GLASS PROPERTIES
2.1 Introduction........................................................................................................172.2 Glass production methods................................................................................172.3 Strength characteristics.........................................................................................202.4 Static fatigue......................................................................................................232.5 Experiments on heat strengthened glass.............................................................25
3 FRACTURE MECHANICS
3.1 Introduction........................................................................................................293.2 Some historical notes..........................................................................................303.3 Linear fracture mechanics....................................................................................323.4 Fracture mechanics of glass windows..................................................................353.5 Analysis of beams...............................................................................................38
4 STOCHASTIC MECHANICS
4.14.24.34.44.5
5 CONCLUSIONS
5.15.25.35.45.5
APPENDIX A
APPENDIX B
Design aspects.................................................................. ................................12Reliability implications..................................................................................... 14
REFERENCES........................................................................................................................65
Introduction........................................................................................................42Some historical notes......................................................................................... 43
Failure prediction for glass windows................................................................48Stochastic mechanics for brittle materials.............................................................44
Analysis of beams.............................................................................................. 51
Introduction........................................................................................................58Design strategy...................................................................................................58Material strength.................................................................................................60Design methodology............................................................................................62Research trends and development.......................................................................63


11
Preface Mine is the first step and therefore a small one, though worked out with much thought and hard labour. You my readers or hearers of my lectures, if you think I have done as
much as can fairly be expected of an initial start…will acknowledge what I have achieved and will pardon what I have left for others to accomplish.
Aristotle ( 384-322 BC) At the start of this research project I thought that finding out the strength of glass and describing its behaviour during loading would be a very interesting and quiet easy challenge, regarding my background as a Civil Engineer. It would also give me the possibility of developing my skills as a design engineer and increase my self confidence. I must confess as the project has evolved I have had to question my knowledge and skills and what used to seem easy and understandable was now getting very complex and difficult to describe in one simple and easy way. There were many times when I could not see where all these new influences could be headed. The end of this project seemed VERY far away! So now when I am writing the last sentences of this report, I feel there are some people that I need to express my gratitude towards. These people have been backing me up and guided me through this journey. Their help and devotion have given me motivation to keep on going and enjoying my work meanwhile.
Professor Lars Sentler, my supervisor, who has been exposed to my up and down moods and believed in me when I did not. Lars this journey would certainly have not been as interesting and challenging without your motivations and high demands! I would also want to thank Professor Bertil Fredlund for listening to me and guiding me through this sometimes complex academic world.
In addition, the following people have contributed through discussions of the application of glass: Mr Anders Jacobsson, Pilkington, Mr Thomas Grange, MTK, who has also read through and given me comments on this thesis, Mr Tim MacFarlane, Dewhurst & Macfarlane, Mr Andrea Compagno, who has held very interesting courses and workshops about glass, Mr Anthony Smith Ove Arup and finally Mrs Saga Hellberg and Mr Mikael Ödesjö, Glasbranschföreningen, for being my face towards the industry and promoting my project.
As a researcher it is very difficult to set work limits and leave work at work. I am glad that my family and my friends have been around and at times forced me to take time off and focus on other matters of life. The joy which this thesis means to me I want to share with all of you!
1

2
Abstract
Glass is a material which is used in increasing demanding applications. This is notonly as structural glazing in facades but also as structural elements like beams andcolumns. In all these applications there is a need for a good understanding of thematerial glass. This concerns the strength properties which need to be characterizedappropriately to reflect the actual behaviour. Design principles should provide thenecessary reliability.
The response of glass is considered to be linearly elastic. This means that thetheory of elasticity is directly applicable to analyse the response of glass. But typicalfor structural units of glass plates is that the thickness is small compared to the inplane dimensions. This may result in structural complications. When a glass plate isloaded perpendicular to its plane there will be both bending and membrane responses.
The rupture strength of glass is complex. This reflects the influence of flaws,mainly in the surface regions, which will reduce the rupture strength to a fraction ofthe theoretical strength. In addition the rupture stress will exhibit dependencies wherein particular a size and a time dependence need to be addressed. This will furtherreduce the long term rupture stress of glass.
The analysis of the rupture behaviour of glass can be done based on fracturemechanics or the stochastic mechanics. This report summarizes and presents availableknowledge based on these add on theories to the theory of elasticity.
2

3
A Area
B Risk function
D0 reference duration
Etot Total energy
F Failure probability function
G Energy release rate
Kt Stress concentration factor
KI Stress intensity factor
KIC Critical stress intensity factor
L Length of the beam
M Moment
P Load acting on the body
Pf Probability of failure
Tmin
Time to failure
TABLE OF SYMBOLS
3 3

4
U Internal elastic strain energy
V Volume
V0 reference volume
W Work done
Ws Energy required to create a new crack surface
Y Dimensionless parameter dependent
on crack geometry
a Crack length
b Half crack width
b Thickness of the beam
c0 Normalization constant
e Distance between loads acting on the beam
h Weibull parameter, time dependence
h Height of the beam
m Weibull parameter, size dependence
n Number of elements
E Mean value of the stress
4

5
m Stress at the flaw tip
Var Variance of the stress
Displacement
Radius of the curvature of the flaw
u Elastic strain energy density
0 Stress far away from the flaw tip
0 minimum strength of a defective element
Poisson's ratio
Shear modulus of the material
Potential of the body
5 5

66

7
1 ARCHITECTURAL GLASS
1.1 Introduction
Glass is a material which has been favoured by architects from the time it wasintroduced in buildings. There are several reasons to this but the transparency ofglass is often presented as an important characteristic. Glass could not be producedin larger sizes of reasonable quality until the beginning of the 20th century. A newproduction technique was introduced at the turn of the century which was soonimproved to a continous production of drawn glass. This opened up new potentialswhich was soon realized by many architects. One of the first examples is the Fagusfactory by Walter Gropius of the Bauhaus group from 1911. In this building largeportions of the facade was completely covered by glass, something which was latertermed glass skin facades. This new architectural style opened up a building andgave it a new character.
Modern glass of high quality known as float glass from its production techniquewas introduced in the 1960th. This glass can be produced in very large sizes with anextremely high flatness. Within the production technique the surface finish isimproved and glass sections with visible internal defects are removed. Theproduction technique requires that residual stresses are introduced. This createscompressive stresses in surface regions which is an advantage in practical use. Floatglass has opened the possibility to use glass in new and demanding applications. Anew series of glass products known as structural glass has been introduced. Thistype of glass dominates completely today. Based on float glass various productshave been introduced in the market like:
• Laminated glass• Heat strengthened glass• Toughened glass• Insulating glass• Coated glass
and there is a continuous development regarding glass products to meet new needson the market. Some of the mentioned products have been on the market for longerperiod of time but not being used in structurally demanding applications.
Glass has traditionally not been seen as a structural material even if it has astructural function when used as a window pane. Glass producers traditionally havegiven recommendations for appropriate glass thicknesses of a pane given the overalldimensions. But the possibility to use very large window panes and glass inincreasing demanding applications raises the question of how glass should bedesigned. The thickness of glass is normally small in relation to length and width.Deformations can be large in relation to the thickness which requires more advancedcalculation methods than normally is used in structural designs. Glass is a true
7 7

8
Figure 1.1 Headquarter in Ipswich in England.
brittle material which fails suddenly when the failure stress is exceeded. There aremany questions which need to be addressed and given an appropriate answer, someof which will be addressed in this report.
1.2 Glass as a load bearing component
Architects soon found out the potential with the qualities of float glass. This togetherwith further developments within the glass industry, for instance heat strengthenedglass, have made it possible to use glass in increasing demanding applications.
For further dematerialisation of the support structure, it is possible to use thetransparent material itself as a load bearing component. This started with suspendedglass walls in the 1960th. The glass panes were fixed at the upper edge by means ofclamps attached to a horizontal beam. This technique was rapidly adoptedthroughout the world. Some examples have window panes which are 13 metres highlike in the new terminals at the airport Charles de Gaulle. The difficulties inmanufacturing, transporting and installing such oversized panes have led to moremanageable sizes.
Suspended glazing with bolted corner plate fixing points, called “patch fittings”was developed by Foster and Partners in the 1970th in connection with the design ofa headquarter in Ipswich in England, see Figure 1.1. The panes with the size 2 x 2,5m with 12 mm toughened glass are suspended from the corners of the panes aboveby means of brass patch fitting plates. The uppermost panes are connected to theroof structure along the top edge. The result is a facade with a height of 15 m whichis suspended from the roof. Lateral support against wind loads is achieved by meansof glass fins inside the building suspended from the intermediate floor. The glassfins will act as cantilevers affected by a point load at the free end when the buildingis subjected to wind loadings.
8

9
The patch fitting method was further developed during the 1980th with boltedfixing systems. Several different types of such systems were developed for differentprojects. For the most common system a hole was drilled at each corner of thewindow pane. To minimize the influence of bending and torsional stresses aroundthe holes, spherical bearings in plane with the glass had to be developed. Forhorizontal stabilization cable systems were introduced as trusses. In these trussesonly members in compression had to be designed for buckling. All other memberswere high strength cables to maximize the visibility.
During the 1980th glass started to be used in more demanding applications. Thiscan be seen as an extension of the fin principle visualised in Figure 1.1. A one storeyhouse was built in Almere in the Netherlands where walls are made up of 12 mmheat treated glass and stabilized by 15 mm thick fins of heat treated glass. The finsare fixed at the floor and the roof with aluminium shoes. The glass fins also serveas columns for a roof of low weight.
A more spectacular use of glass started to develop during the 1990th. This can beseen as a natural development but a new philosophy was also adopted about howglass should be used. When a solid glass pane failed it did so in a brittle manner andnormally no warning could be expected. Laminated glass where two or more glasspanes were glued together with a plastic membrane behaves differently. If one panebrakes in a laminated pane with two or more glass panes it can be expected that thiswill not lead to a complete failure for the whole system. It will lead to increaseddeflections and if no action is taken this might eventually lead to a creep failure.One of the pioneers in this development was Tim Macfarlane at Dewhurst,Macfarlane and Partners, a London based company which has specialised in glassapplications.
An impressive use of glass is the Local Authority Office in St-Germain-en-Layenear Paris where a glass roof is supported by glass columns. The architects were J.Brunet and E. Saunier. The 24 x 24 m glass roof is supported by 8 cross shapedcolumns 220 x 220 mm made up of three layers of laminated heat treated glass. Inone direction the panes are continuous while in the opposite direction they are spiltup and glued to the other panes. Only the inner panes of glass are intended tocontribute to the load bearing capacity and the outer panes act as a shield. The crossshaped columns are approved for a loading of 60 kN. Calculations indicate that theactual failure load is around 500 kN for the column as a whole. This gives a levelof safety of around 3 if only the inner panes are contributing. In reality the level ofsafety is higher. These columns represent the first structural units subject tosubstantial continuous high sustained loads.
Approximately at the same time the same architects as above created a glass roofwith glass beams for the Workshops at the Musée de Louvre in Paris. The roofcovers a three storey light-well which admits daylight into the undergroundextension of the museum. Laminated panes of four 15 mm heat treated glass paneswere used for the 4 x 16 m glass roof. Beams are 600 mm high and are made of four15 mm heat treated glass panes.
9 9

10
Figure 1.2 Local Authority Office in St-Germain-en-Laye.
Figure 1.3 Footbridge in Rotterdam.
Tests of the beams revealed that the failure load was 122 to 140 kN whichcorresponds to a maximum stress between 33,9 to 38,9 MPa. The required loadcarrying capacity was 50 kN which corresponds to a maximum stress of 13,9 MPa.A calculation shows that the dead load will give rise to a maximum stress of 0,42MPa. With a live load of 4 kN/m2 the maximum stress will be 1,96 MPa. Thesestress levels indicate that each of the four panes can carry both the dead load and thelive load. The actual safety level is extremely high.
In Rotterdam a foot bridge between two buildings built completely in glass waserected in 1993 which is shown in Figure 1.3. The 3,2 m long bridge consists ofpanes of laminated glass joined together with point fixings of stainless steel. Thefloor slab consists of 2 x 15 mm laminated together and the beams are made up of3 x 10 mm glass strips. The side walls and roofs are made of 10 mm toughened glassand 6 mm heat strengthened glass laminated together.
10

11
Figure 1.4 Canopy in Tokyo.
A calculation of the maximum stresses which will occur for the dead load alone isjust below 1,0 MPa and for a design load of 4,0 kN/m2 the maximum stress will be3,1 MPa. This indicates that each of the three glass panes can carry the design loadand there will still be a high degree of reliability for each glass pane. Because of theheight of the beam the deflection will be very small and hardly noticeable.
In 1996 a glass canopy at the entrance to the Yurakucho underground railwaystation was finished, see Figure 1.4. The design is by Rafael Viñoly architectstogether with Dewhurst Macfarlane and Partners. This cantilevered glass structureis 10,6 m long, 4,8 m wide and 4,8 m high at the apex. The support structureconsists of three parallel, cantilevered beams, composed of several triangular shapedlaminated 2x19 mm glass panes. The variously shaped blades are bolted to interlockwith each other with one blade at the apex and four blades at the bearing point. Theroof is made of 1,9 to 2,5 m long and 4,8 m wide laminated sheets. The thicknessis 2 x 15 mm toughened glass which are fixed at junctions with the cantileveredbeam.
This structure was a challenge for the engineering profession and the society. Thearchitectural design was made during a short period, roughly around a week. Thetechnical analysis and testing took half a year. The location of the canopy in Tokyomade it necessary to design it to withstand heavy earthquakes and high wind speedsfrom typhoons. Besides, the building authorities wanted a fail safe structure.
The canopy had to be put together in a number of pieces because it was notpossible to toughen larger lengths than around 5m . These pieces are put togetherwith bolts which will create stress concentrations. In this case the stressconcentrations are perpendicular to the main direction of tensile stresses. A numberof questions arose: How close to the surface could a hole be placed without creatingtoo much additional stresses? How should the details in the transfer zone betweenan axle and the hole be manufactured? To answer these questions Asahi Glass
11 11

12
Company started a project with tests to find the answers, (S. Wakui,1999). Threedifferent hole diameters were tested (36,5 mm, 55 mm and 68 mm) and the resultshowed that if the large hole was used there was no reduction if the distance fromthe centre to the edge was larger than 180 mm. It was known that from previousexperience that an aluminium ring was appropriate as a bezel. The actual functionincluding a plastic ring or an epoxy adhesive was tested. This information was usedin the design of the holes in the blades.
The most stressed glass blade was tested in full scale up to the design load todetermine the stress field around the hole subject to the highest force. The stressesaround the hole seem to have been only marginally higher than that caused bybending.
Before erection each glass blade was proof loaded up to the design load. Theactual failure load was estimated to be at least 2,6 times the design load, in realitymuch higher. To make the structure fail proof additional blades of plexiglass wasadded to the structure.
1.3 Design aspects
Glass is a material which has not been used in demanding structural applicationsuntil the last decades. The reason for this is that a failure almost always is initiatedby a tensile stress and this failure is brittle. No prior warning can be expected. Thisintroduces questions concerning how the design and the reliability should beconsidered.
Glass has been used in windows for a very long time. It was not until thebeginning of the 20th century before it was possible to produce glass panes in largersizes of good quality. Such windows had to be designed for wind loads. Fromproducers of glass, recommendations are given of the thicknesses needed for aspecific window size. Such recommendations can vary between producers. Thereason to this reflects the lack of codes for the design procedure of glass. Standardsavailable are mainly concerned with surface finish and flatness. It can be expectedthat most glass producers have carried out tests on glass to determine the rupturestrength. It is also very likely that such tests have revealed that the rupture strengthis both size and time dependent. The rupture strength will decrease for increasingsizes of a window pane and thickness. In the same way the rupture strength willdecrease for decreasing loading rates. This is not unique for glass but thesedependancies are more pronounced. It is not likely that two manufacturer of glasshave carried out their tests in the same way. The interpretation of the results mayalso differ. This can be one reason to explain differences in recommendations. Butthe manufacturers also have to consider the reliability or the consequences of afailure. It is reasonable to assume that glass manufacturers tend to be conservativein their evaluation of test results.
When new materials are introduced, like fibre reinforced plastics asreinforcement for concrete structures, or old materials are beginning to be used innew ways, like glass, there is a need to review the design process. This concerns
12

13
• material properties• design methodology• failure mode analysis
where it is often necessary to provide information for end users. Often the intentionwith the new or improved material is to meet certain demands or requirements onthe market. In the case of glass as a construction material the need reflectsarchitectural design ideas of creating transparent structures. There is no obvioustechnical advantage. On the contrary, ordinary glass is a material which can be fairlystrong during short durations of a load application. But the long term properties fora sustained load are poor.
Since there was a need on the market for structural use of glass it was necessaryfor the glass industry to make further developments. Heat strengthened glass is sucha development. Heat strengthened glass was developed to avoid the risk ofspontaneous granulation because of uneven temperatures. Such glass has beenavailable for several decades but only for special applications at high price levels.An improved production technique was necessary and new control methods toreveal impurities which could generate delayed failures. Laminated glass is also away to improve structural characteristics which alters the over all failure behaviour.
Glass is not a material which is included in codes as a structural material. Hence,there is no information about how the design should be made. For other structuralmaterials like steel, concrete, wood and masonry information is readily availableabout design principles and strength values which can be used in applications.
It is not obvious that a design of a glass structure should be made in the same wayas for ordinary structural materials. On the contrary, designs made in the failure statebased on the partial safety factor methodology is not directly applicable unlesscertain modifications are added. For loads exceeding a certain threshold stress creepwill be initiated which eventually will lead to a failure. This can be considered in asimilar manner as for structural wood where loads are graded in relation to theirduration.
Given the knowledge that a glass failure will be initiated by a flaw in relation toa stress field there is a possibility to use other design techniques. Fracture mechanicswas developed to analyse the influence of flaws in glass fibres. During the 1950th
fracture mechanics evolved as a potential analysis technique for glass but inparticular for steel in mechanical applications. For steel subject to fatigue stressesfracture mechanics is an established technique to estimate the time to failure. Duringthe 1990th a number of persons have advocated the use of fracture mechanics for theanalysis of glass (Jacob et al, 1997).
Another analysis technique is based on stochastic mechanics. The original theory(Weibull, 1937) makes the rupture strength size dependent. This theory can easilybe extended to include a time dependence which will be conditional on the sizedependence. The complexity in analysing thin plates where both the bending theoryand the membrane theory have to be considered has made this technique too
13 13

14
complex until the introduction of computers and finite element programs. Today thistechnique has been used in USA to produce design charts for any window panegeometry (Beason, 2002).
The basic failure mode of glass is brittle failure. This is hardly a desirablesituation in a structural design but this situation is not unique. There are severalways to solve this situation which was demonstrated in the previous section. Themost direct way is to use a high factor of safety. But this is not enough. Given thepronounced time dependence of the rupture load it is necessary to limit themaximum stress. The solution depends on the strategy chosen.
Laminated glass gives the potential to alter the over all failure mode from beingbrittle. If two or three glass panes are laminated together, where each pane can carrythe design load there will not be a brittle failure if one of the panes fail.Deformations would increase and the failed unit had to be replaced.
Tempered glass where the residual stresses have been substantially increased isan alternative where no failure should be expected as long as stresses from designloads are kept below the compressive residual stress in the surface region. But thisrequires that no internal inclusion of foreign material is present in the interior wherehigh tensile stresses are present.
Laminated tempered glass seems to be the ultimate solution. This makes itpossible to utilize relatively high tensile stresses under long term loading conditions.Should one pane fail it is not likely that this will lead to a total failure.
The strategy which is chosen to handle the failure mode analysis cannot be seenindependent from information about the properties of glass and how the design ismade. It is the total strategy which will determine the reliability conditions. Each ofthese aspects: material information, design methodology and failure mode analysiswill be presented in the following chapters in relation to available information.
1.4 Reliability implications
The statistically based design procedure was introduced mainly because of tworeasons: (1) there was no realistic way to determine the actual reliability with thesafety factor principle and (2) there was a general belief that most structures wereover designed. To introduce a complete statistical design procedure was notpossible because of the complexity this would have lead to. Instead the partialsafety factor method was introduced as a compromise. In large this designprocedure has lead to several improvements and most structures are moreeconomical than if the old design procedure had been used. Glass used as windows will be subject to wind loads and when used in roofs it hasto be designed for the dead load and eventual snow loads. In these applications theduration of high wind loads is short, snow loads will have a longer duration and thedead load will be permanent. The size and time dependence of the rupture loadtherefore has to be dealt with separately. Besides, a window glass failure will notaffect the reliability of the building itself. It may, of course, be a hazard to thesurroundings where people and property may be affected in a negative way.
14

15
The examples which were presented in the section 1.2 show that glass has startedto be used in structural demanding applications. Since glass is an appreciatedmaterial among architects it can be expected that this trend will continue. Glass isnot a material which is included in codes as a structural material. Hence, there is noinformation about how the reliability should be considered. For other structuralmaterials like steel, concrete, wood and masonry information is readily availableabout strength values which can be used in applications. The reliability is obtainedwith statistically based principles known as the partial safety factor system.
There are discrepancies with respect to size and time aspects betweenstandardized tests and real structural members. Standardized tests are performed onwell prepared small specimens in a ramp loading test. Real members are larger andin some cases extremely much larger and this will cause the rupture strength to belower than assumed. Long term loading will cause creep to take place which insome cases is of secondary type. This will further reduce the rupture strength. Thisis not included properly in the present version of the partial safety factor method.So, even if a structural unit is designed in accordance with the partial safetyprinciple, a failure may occur because of creep to failure. This latter problem canbe resolved by using an appropriate statistical distribution to characterize thestrength where the size and time dependencies are included. This results in ananalysis based on the theory of stochastic mechanics.
There are in principle three different ways to analyse a structural member. Inaddition to an ordinary design based on the partial coefficient method an analysiscan be made based on fracture mechanics or a stochastic mechanics. In the first casethe reliability analysis is based on a fail-safe concept. By limiting the maximumstress to a level where cracks will not grow and cause a failure the structuralmember will be safe. In the second case the reliability is based on an allowablestress which is determined from a predetermined failure probability where size andtime aspects are included. These two different principles will be applied on a beamof glass subject to four point bending to show how a design is made in each case andthe result.
The question concerning brittle failure versus ductile failure will be discussed andanalysed in Chapter 5 where the results from the two design principles arecompared.
15 15

1616

17
GLASS PROPERTIES
2.1 Introduction
Glass is a uniform material, a liquid that has solidified by cooling to a rigid statewithout crystallizing, which means that the molecules are in a completely randomorder and hence do not form a crystal lattice. It is a solid with an amorphous, non-crystalline structure and it is far too rigid to flow at normal temperatures as woulda supercooled liquid do. This explains why glass is transparent. The materialconsists of a combination of various bonds, and hence there is no specific chemicalformula. There is no melting point but instead, upon applying heat, the materialgradually changes from a solid state to a plastic-viscous and finally to a liquid state.The glass used today for building purposes is a soda-lime-silica glass.
The theoretical strength of a glass is determined by the strength of the bondsbetween the individual components. The strength of a piece of flat glass should onatomic bond strength calculations be around 21 GPa, (Pilkington,1993). Windowglass usually fails at stress levels less than 100 MPa, (Pilkington,1993). In practice,therefore, the amount of stress needed to start a crack growth in glass is very muchless than expected considering the forces needed to break the interatomic bonds.
2.2 Glass production methods
There are two main flat glass manufacturing methods for producing the basic glassfrom which all processed glass products are made: the drawn glass process and thefloat glass process. Since the introduction of the float process in 1959 by Pilkingtonit has gradually replaced other processing techniques.
More than 90% of the world’s flat glass is now made by the float process, wheremolten glass, at approximately 1000oC, is poured continuously from a furnace onto a large shallow bath of molten tin. The liquid glass floats on the tin, spreads outand forms a level surface. Since the melting point of the tin is much less than thatfor glass, the glass solidifies as it slowly cools on top of the molten tin. Thicknessis controlled by the speed at which the solidifying glass ribbon is drawn off the bath.Once the glass solidifies, it is fed into an annealing lehr where it is slowly cooled ina process where the residual stresses are controlled. This process results in theproduction of an annealed float glass with residual compressive stresses around 8MPa in the surface. After annealing the glass emerges as a “fire” polished productwith virtually parallel surfaces. This method, in which the glass pane is formed byfloating the melt on a bath of liquid tin, revolutionized the manufacture of high-quality glass and large sizes. Float glass is available in thicknesses ranging from 2mm up to 25 mm.
Primary processing is a treatment of the basic glass after its manufacture. Sincesurface flaws only lead to fracture when a tensile stress opens them, any method ofputting the glass surface into permanent compression is advantageous. An appliedtensile stress would have to overcome this built-in compression before it begins to
17 17

18
Figure 2.1 Stress distribution across the thickness of toughenedglass.
open up a flaw and hence the glass would be able to resist higher loads. Toughenedglass and heat strengthened glass use this principle. The stress distribution intoughened glass enables it to withstand tensile stresses of much higher levels thanordinary annealed glass. Annealed glass has a residual surface compression stressof around 8-10 MPa, (Sobek and Kutterer, 1999), because of production reasons.Any external stress level has to exceed this threshold stress to cause a failure whichwill be time and size dependent. The thickness of the glass may influence the actualresidual compressive stress. Toughened glass, or tempered glass as it is also knownas, is first cut to its final size and it is edge treated and drilled if required. Afterwardsthe glass pane is heated to approximately 650oC, at which point it begins to soften.Its outer surfaces are then cooled rapidly, creating in them a high compressionstress, where the rate of the cooling will determine the amount of built-incompression stress and hence the final strength of that glass. Its bending strengthis usually increased by a factor of 4 or 5 to that of annealed glass and hence a newand raised threshold stress has been achieved. The maximum tensile stress in themiddle is half of the surface compressive stress. When broken, it fractures into smallharmless dice and it is known as safety glazing material. Heat strengthened glass issimilarly produced, but with strengths approximately half that of toughened glassand without the safety glazing characteristic. Toughened glass cannot besubsequently surface or edge worked or cut because this would initiate a failure.Figure 2.1 shows the stress distribution across the thickness of toughened glass.
Toughened glass offers an advantage because an external stress can be muchhigher than for annealed glass. As long as the sum of the compressive residual stressand the tensile stress from an external load is less than zero no failure is possible.At least in theory, see Figure 2.2. In reality the situation is more complex because
18

19
Figure 2.2 Summation of stresses in bending in toughened glass.
of the presence of impurities in the interior. Most well known is NiS which existsin two forms, or phase. When a transition takes place from an phase to a phase there will be an expansion. If this expansion takes place where tensile stressesdominate this will lead to a failure, often delayed in time. Such failures can beforced by increasing the temperature to a certain level for a certain amount of timein what is called as a Heat Soak Test, HST, where a failure is forced at an elevatedtemperature. But NiS is not the only impurity which can create problems in termsof delayed failures. There could be other forms of impurities or processes involvedwhich could cause a failure. The knowledge about this is far from complete. It canbe anticipated that the “static fatigue” phenomenon which is characterized by thetime dependence might be slower within a glass plate because it takes place withoutany influence of water.
Chemically toughened glass is an alternative to heat treated glass. This techniqueto achieve higher strength in glass is based on the chemical exchange of largerradius K+ ions, (potassium), for Na+ ions, (sodium), in the surface of a sodiumcontaining silicate glass. The compressive stress of the silicate network at the thintop layer produces a product known as chemically strengthened glass, wherecompressive stresses of up to 300 MPa, can be reached at the surface. However, thisis only in a very thin boundary layer which is easily penetrated by scratches. Theimmersion procedure also strengthens the edges of the pane. Chemicallystrengthened glass exhibits a high resistance to mechanical and thermal loads. Itsfracture behaviour corresponds to that of float glass and it may be cut, however, acut edge only has the strength of normal glass.
The elastic modulus, E, of glass will not be affected by any surface treatment. Asa consequence, deformation characteristics will not be influenced.
19 19
20
The edges of glass may be finished in a variety of ways. The normal cut edgerepresents the simplest form. Such edges are used whenever the edge of the glass isplaced in a frame and there is no danger of being injured by the sharp edge. Theedges of glass members are usually ground to remove major flaws and reduce thevariation in crack size along the cut edges.
Laminated glass is produced by bonding two or more panes of glass together witha plastic material, polyvinyl butyral (PVB) or in some cases the use of liquid resins.When a PVB interlayer is used, the foil is placed between the panes and the wholeunit pressed together in an autoclave under the action of heat and pressure.Laminates can incorporate most thicknesses of glass and plastics to give a selectionof products with a range of mechanical, fire resistant and optical properties. Whena laminated glass is broken the interlayer tends to hold the fragments of broken glassin place, and it may be named a safety glazing material. Examples of laminated glassare anti-vandal, anti-intruder and bullet-resistant glazing.
2.3 Strength characteristics
The strength of any structural material will exhibit size, time, temperature andsometimes humidity dependencies. This is explained by the presence of varioustypes of defects which are present in all materials. Glass is no exception, on thecontrary, flaws in the surface of glass will have a pronounced influence on thestrength of glass. The size and time dependancies can be illustrated as is shown inFigure 2.3. For glass the size dependence is better explained with an areadependence instead of a volume dependence. The reason is the existence of defectsin the surface region.
For an increasing size or area or increasing duration of a stress the failure stresswill decrease. The dotted line reflectss a threshold below which no failure will takeplace. For annealed glass this will correspond to approximately 8 MPa and for heatstrengthened glass the compression stress in the surface. The shaded area is thestrength behaviour in time for a given volume under stress. The result given infigure 2.3 is in relative values.
The reason to why the strength decrease with increasing area is normallyexplained as that there will be an increased possibility of the existence of a majordefect with increasing area. The time dependence reflect the time for a defect, orcrack, to grow to a critical level which will cause a failure. This crack growth willbe discussed in subsequent sections.
In (Weissman, 1997) it has been proposed that the mechanical strength isdetermined by micro flaws in the surface. These flaws act as stress concentrators andthe critical breaking stress depends on the depth of the flaws. Flaws are createdduring the forming, cooling and final handling processes. The main source is thecontact of the freshly produced glass with other materials. During the formingprocess float glass has no contact with solid materials. By that reason, freshlyproduced float glass has a higher strength compared with ground and polished plate
20

21
Figure 2.3 The rupture stress as a function of volume andduration of a stress.
glass. The grinding process simply reduces the depth of flaws but do not completelyremove them.
The flaw distribution function, n(s), is the mean number of flaws per unit area,that are acting as fracture origins at stresses < s, where s is the stress at the crack tip.Fig 2.4 shows the variation of n(s) for the two float glass surfaces in comparisonwith polished plate glass. The results verify the higher density of surface flaws ofthe polished plate. Moreover the tin and atmosphere sides show a slight differencein their strength that comes from the contact of the tin side with transport rollers,(Weissmann, 1997).
The strength of glass can be based on the well-known Griffith’s flaw theory(Jacob, 1999). This gives an interpretation of experimental data on the strength ofglass. According to these ideas, the observed strength is always reduced below atheoretical strength by the presence of flaws and the measured strength isdetermined by the stress concentration acting on the “worst” suitably oriented flawat its apex. This accounts directly for the wide variation in experimental values ofstrength obtained under any given condition (since all flaws will not be equallydangerous) and must obviously be considered in the interpretation of all the strengthphenomena.
It is simply stated here that the factor by which the “theoretical” strength exceedsthe ordinary experimental values is usually considered to be in the order of 500.
21 21

22
Figure 2.4 Number of surface flaws/m2. 1-polished plate glass, 2-float glass tin side, 3-atmosphere side.
The Griffith flaws, which have a strong influence on the strength of glass, areassumed random in size, distribution and orientation. The only way to establish avalue for the strength of glass is to mechanically load the glass to breakage. Thisestablishes the strength of that piece, tested at that time and in that particular way.Statistical analysis of a set of scattered values of glass strength measurements allowsthe derivation of a value below which there will be relatively few failures. Statisticaltreatment of test results can be used to obtain a design value at which there issufficiently low risk of the glass being weaker than that design value. This value canbe used to select a glass thickness for a given situation.
Tests are made to gather information regarding a variable, which in this casewould be the strength of glass. This information would then indicate the strengthof that “test package”. Different methodologies can be utilised for further analysis,see chapter 3 and 4.
The strength of glass is also modified by the presence of larger surface flaws.Under stress these can be the origin of cracks since the glass may be unable toaccomodate the local stress concentrations they cause. The presence of major flaws,for example scratches, on the surface or the edges of the glass can generate localstress concentrations when the glass is put under strain, which may lead to crackformation. It is however not easy to predict whether any individual flaw is likely todo this. Small defects in the glass are likely starting points for crack propagation asthey produce unacceptable stress concentrations. The presence of large flaws is onereason why the edge region of a piece of glass is usually weaker than the surface,where it is much more prone to damage from accidental contact with thesurroundings. Methods of cutting glass and edge finishing may also lead to thepresence of flaws at the edge.
22

23
( )D D n
1
Figure 2.5 The time dependence of the strength.
Figure 2.6 Delayed failure curves for soda-limeglass at different temperatures.
glassf D V T RF( ) ( , , , )Duration,Size,Temperature,Relative Humidity
Since time duration of loading is important in determining the failure load for agiven glass panel, it is essential that loadings be defined in a time-dependent, ratherthan static form. Experimental data, (Minor, 1974), which highlights this phenomenare presented in Fig 2.5.
The temperature dependence was analysed by (Charles, 1958) And the result ispresented in Figure 2.6. It can be seen that the strength will decrease with increasingtemperatures. Below a certain temperature where no moisture is present there seemto be no or very little time dependence. The influence of the humidity or water onthe rupture behaviour is often termed static fatigue for glass. This will be analysedseparately in chapter 2.4. Hence the stress will depend on the following externalfactors:
23 23

24
Figure 2.8 A break in the network.Figure 2.7 Crack growth bychemical breaking of oxidenetwork.
2.4 Static fatigue
Ceramics and glasses can demonstrate a loss of strength over time. This degradationof the strength can take place under constant stress conditions. In the glasscommunity this phenomena is often termed static fatigue and it is a sensitivefunction of the environment. Chemical attack by water vapour permits a pre-existingflaw to grow to critical dimensions and bring about spontaneous crack propagation.Depending on environmental conditions, glass exhibits time-delayed failure wherefracture may occur some time after the initial application of a load. Static fatigue isbasically caused by the subcritical crack growth that can take place in glass, evenin a weak tension field.
Small amounts of water vapour, normally found in the atmosphere will react withglass under stress to cause a time-dependent reduction in strength. By chemicallyreacting with the silicate network, an H2O molecule generates two Si-OH units. Thehydroxyl units are not bonded to each other, leaving a break in the silicate network.When this reaction occurs at the tip of a surface crack, the crack is lengthened byone atomic-scale step, see Figure 2.7 and 2.8.
Static fatigue results from a stress-dependent chemical reaction between watervapour and the surface of glass. The rate of reaction depends on the state of stressat the surface and the temperature. The rate increases mainly with increasing stress.The stress is greatest at the root of small cracks and consequently the reactionproceeds at its greatest rates from these roots. Since the reaction products do nothave the strength of the unreacted glass, the small cracks gradually lengthen andfailure occurs when the cracks are long enough.
It seems well established that the general failure of glass is determined by surfaceflaws. Stress fields around a flaw in conjunction with corrosion mechanisms
24

25
Figure 2.9 Crack velocity versus load.
dependent on stress provide a ready answer to the question of how a flaw may growin an isotropic material, such as glass, and bring about delayed failure. The amountof growth is determined by the stress concentration that is necessary to bring theapplied stress up to a critical value whereas the differential rate of growth isdependent on the stress distribution around the flaw at any instant and thecomposition, pressure, and temperature of the surrounding atmosphere.
Figure 2.9 shows the effect of water vapour on crack motion in glass at roomtemperature (Wiederhorn, 1970). When the loading is at low levels the combinationof load and moisture affect the strength, whereas at high levels of loading, around1,0 kg, the moisture has almost no effect on the strength. The crack velocity isdivided into three different regions. According to Wiederhorn these conclusionswere made:
• In region I crack propagation is due to corrosive attack of water vapour on theglass at the crack tip.
• In region II the crack velocity is nearly independent of the applied force, and theposition of each curve shifts to lower velocities as the water in the environmentdecreases.
• In region III the crack velocity is again exponentially dependent on the appliedforce , however, the slope of the curve is considerably greater than in region I, 3times. This change in slope leads to the conclusion that a third crack propagationmechanism occurred.
The fact that the curves of region I and II blend to form a single curve in region IIIindicates that this new mechanism is independent of water concentration in the
25 25

26
environment.The load below which glass would be free of fatigue is not well known and
moreover, static fatigue which is very sensitive to the environment is accelerated bytemperature and atmospheric humidity, (Charles, 1958).
It was suggested (Preston, 1942, Orrowan,1941) that cracks might be assisted tospread slowly in a prolonged test by atmospheric action of the types alreadydiscussed. Baker and Preston have shown that glass specimens baked and testedin vacuum show practically no reduction in strength under prolonged loading.
2.5 Experiments on glass beams
There are two interesting reports on tests of glass used structurally. In both casesit concerns beams and the time behaviour. In Carré, (1996) a large number of beamshave been tested to failure in ramp loading tests with different rates of loading. Thesurface treatment of the edge in tension has been what is considered the normalpreparation but there is also a new improved preparation. Each beam had a free spanof 230 mm, a height of 37,5 mm and a thickness of 19 mm. The loadingarrangement was a symmetric four point loading scheme. The sample size is 28beams for a loading rate of 0,5 MPa/s and two sets of 14 beams with a loading rateof 0,05 MPa/s respectively 5 MPa/s. In both cases the predicted failure behaviourbased on a Weibull distribution is in good agreement with the obtained actual failurebehaviour.
The main result is summarized in Table 2.1. It can be seen that both for thenormal surface treatment and the improved surface treatment the rupture stress willincrease with increasing rates of loading. With increasing loading rates the durationof a test will decrease.
In the report by Carré (1996), there is also an analysis of the effect of heattreatment made in a finite element analysis. The conclusion is that no failure couldtake place for bending tensile stresses from external load which were less than thecompressive residual stresses in the surface.
Table 2.1 The main result from tests of beams
Failure stress Normal surface Improved surfaceMPa treatment treatment
Rate of loading 0,05 0,5 5,0 0,5 5MPa/sMean value 41,2 45,4 50,1 54,7 56,1MPa
Based on the information from (Carré, 1996) a sustained load test was carried on aheat treated beam out by Saint Gobain (Gy, 1999). In this case the beam was
26

27
Figure 2.10 Deformation versus time.
substantially larger, 4 m long, the height 621 mm the width 19 mm. Also in thiscase a four point bending arrangement was used. The residual compressive stresseswas determined to be around 120 MPa. The applied load resulted in around 80 MPain tensile stresses which is less than the residual stress at the edges. (According tothis calculation, the glass weight plus an external applied load of 4000 N, lead to amaximum tensile stress of 72 MPa. This is below the residual compressive level andhence it should prevent the beam from suffering from static fatigue during a longexperiment). In addition to direct deformation at loading the creep deformation inthe middle of the beam was measured during 1 year. This deformation is shown inFigure 2.10. It seems as if the creep deformation reflects primary creep which canbe seen as a delayed elastic response. But primary creep is associated with what istermed a subcritical crack growth. There is an indication that there could be a startof secondary creep which reflects a crack growth. Such a crack growth can takeplace internally where large tensile stresses exist. This could be because of theexistence of some impurity. It could also be an edge crack growth. After 1 year thebeam was unloaded and the deformation recovery was continued to be measuredover another year. Most of the delayed deformation was recovered during thisperiod but a small deformation still remained. No explicit information was givento this. Personal communication indicated that this most likely was a measuringerror or deformation of the supports.
The remaining deformation after the test was completed indicates that somedamage accumulation may have taken place. Damage accumulation may reflect acrack growth in the bottom tensile face of the glass beam. This will be analysed and
27 27

28
explained in more detail in chapter 3, fracture mechanics. If this damageaccumulation really takes place there is a potential problem with heat strengthenedglass.
28

29
FRACTURE MECHANICS APPROACH
3.1 Introduction
Fracture mechanics is the theory about how solids rupture, primarily structuralcomponents of different types. Such ruptures can take place in several differentways. Typical for these ruptures are that one or a few cracks propagate through thematerial and finally results in a rupture. Fracture mechanics deals with themechanisms involved and methods to characterize them. Fractures are found tooriginate at flaws or cracks of finite size, most of which are at the surface. Themechanism, crack propagation, begins when the local stress at the crack exceeds aminimum value. Dependent on material behaviour and the type of loading fracturemechanics can be represented in three main categories.
Linear elastic fracture mechanics deals with existing cracks which, at a criticalstress, grow momentarily which results in a brittle rupture. Typical is that therupture planes do not deform and the broken parts can be put together again wherethe rupture line may not be directly visible. This is a common failure behaviourfor glass and ceramics. But also steel may rupture in this manner, especially at lowtemperatures. The additional energy needed to cause the crack to grow is normallyvery limited.
Non-linear fracture mechanics also deals with an existing crack but the crackgrowth takes place in a plastic zone. Also in this case the crack growth can bemomentarily if the applied stress is sufficiently high or the initial crack is large. Butit is more common that the crack growth is slow and accompanied with plasticdeformation. This failure behaviour is associated with metallic materials subject torelatively steady state loading conditions.
Fatigue initiated fracture mechanics cause existing cracks to grow in relation tothe load spectrum which affects the component with a crack. This crack growth caninitially be extremely slow and start at cracks which are not easily detectable. Allstructural elements contain defects in terms of cracks already after production. Ina surface of a material there is likely to be irregularities between groups of atoms ormolecules. This might be sufficient to start a crack growth. This type of crackgrowth is mainly associated with non-linear fracture mechanics. But there areexamples where a crack growth takes place for a brittle material response. Crackscan grow in a slow manner in glass under certain loading conditions. Fracture mechanics is a powerful tool in many applications. It can answer thefollowing questions:
• How large a crack can be tolerated for a specified stress condition before a failurecan be anticipated?
• How fast will a crack grow when subject to fatigue for a specified load spectrum?
Dependent on the answer the structural part can be modified, the stress field alteredor some type of regular inspection procedure can be introduced to detect cracks
29 29

30
Kt
a
b
a
m 0a
b
Figure 3.1 Half ellipticalflaw.
before they will cause a failure. In many advanced applications where materials areused to their limit, for instance turbines, regular inspections is part of themaintenance scheme.
3.2 Some historical notes
Problems with unexpected failures due to crack growths, especially in connectionwith stress concentrations, was recognized already in the 19th century. Sharp cornersand defects in form of different types of cracks were often associated with theinitiation of a failure. The first published theoretical article on this subject is byInglis (1913). For a flaw which is represented by half an ellipse with opening 2b
and depth a, see Figure 3.1, the stress at a flaw tip is given as
(3.1)
where m is the concentrated stress at the flaw tip, 0 is applied stress. For a circularflaw, a = b, the stress increase is 3. When a increases or b decreases m willapproach infinity. This is not possible in reality so instead there will be a crackgrowth. The same stress intensity increase is obtained also for a whole ellipticallyflaw in the surface.
The expression within the parenthesis in (3.1) can be seen as a stress concentrationfactor Kt. This can be generalized as
(3.2)
where = b2/a is the radius of curvature of the ellipse at the vortex. This expressioncan be applied to other shapes than circular or elliptical flaw tips if the curvature isknown. When goes towards zero Kt will approach infinity.
Equation 3.1 is applicable to an analysis of the influence of flaws on the strengthof glass. This was demonstrated by Charles (1958,1) in an analysis of the conditionsfor a crack growth. He assumed that for a theoretical strength of glass of 14·103
MPa a ratio a/b = 40 is necessary for a failure at an applied stress of 172 MPa (Notethat this high stress level refers to small bars of glass subject to bending). This will
= 1 +
= 1 + = 1 + 2
2
30

31
U
V
u dV
V
ij ij
2dV
U
V
1
4 µ ij ij ij ijdV
U P U W
Etot s
dEtot
dA
d
dA
dWs
dA0
ij
1
2 µ ij ij ij
alter the initial crack relations and make the ratio a/b to continuously increase.
The theory of brittle fractures was extended by Griffith (1920) who made use ofInglis stress concentration expression around a crack. The novelty in Griffith´swork is that he made an attempt to formulate a linear elastic theory for crackpropagation based on considerations of the global balance of energy in a body.
For an linear elastic body the internal elastic strain energy U is
(3.3)
where u is the elastic strain energy density, and and are stress and strainrespectively and the indices refers to x and y in a Cartesian system. With Hooke´slaw
(3.4)
modulus and is Poisson´s ratio. Combining (3.3) and (3.4) the elastic strain energyis given by
(3.5)
This is the total elastic strain energy stored in a loaded body made of linear elasticmaterial.
For a body subject to a prescribed load P, where P can be any type of loadingsuch as force, moment or distributed force, the potential of the body is defined as
(3.6)where is the displacement if P is a force, and is rotation if P is a moment.For a fracture to occur, the energy stored in a body including the work done by theforces acting on the body, must be sufficient to overcome the surface energy neededto create a new crack surface. The total energy is given by
(3.7)
s s
crack area and ws is the surface energy per unit area. When a crack propagates nonet change in the total energy takes place, thus
(3.8)
Based on his experiments there is a critical value of a/b 200, Charles(1958, 1).~~
= =
= =
where µ is the shear modulus of the material, µ = E/2(1 + ), E is the elastic
1 +
==1 +
= =- -
= +W
where W = 2Aw is the energy required to create a new crack surface. Here A is the
= =+
31 31

32
d
dA
dWs
dA
G Gcritical
Gc
dWs
dA
Figure 3.2 Crack loadedin Mode 1.
Figure 3.3 Crack loadedin Mode 2.
Figure 3.4 Crack loaded inMode 3.
f
E
c
2
0
This results in the condition
(3.9)
which must be met to make the crack propagation possible. Crack growth ispossible when the energy release rate G reaches a critical value
(3.10)
The parameter Gc is a measure of the fracture toughness of the material. This is alsoknown as the Griffith criterion and can be expressed as
(3.11)
where is the and c0 is theIt is often considered a material property. In reality it will be temperature dependentand in the case of glass also humidity dependent.
3.3 Linear fracture mechanics
Stresses and deformations in a body in front of a crack tip depends on how the bodyis loaded. The crack may be affected in three different ways or modes which areillustrated in Figures 3.2 - 4.
The analysis of stresses and deformations around the crack tip is normally made ina polar coordinate system which is defined in Figure 3.5. Mode 1 and Mode 2solutions can be found with the help of the Airy stress function (Timoshenko, 1959).Mode 3 solutions are based on equilibrium, deformation and constitutive equations.Solutions result in series expansions which can be found in books dealing with in
- =
= = =
32

33
xx rr( 0)
KI
2 x
yy( 90)
KI
2 x
xy r( 0) 0
uy
u ( ± ) ±2µ
KI
x
2
xx yy0
xy r( 0)
KII
2 x
ux
ur( 0) ±
1
2µK
II
x
2
Figure 3.5 Polar coordinatesystem and stress components.
depth analysis of fracture mechanics. Most available fracture mechanics solutionsare based on Mode 1 failures. This is natural when stresses from bending momentsdominate. Mode 2 and 3 failures are hardly dealt with in practice. But it cannot beruled out that the crack growth process which takes place in static fatigue isinfluenced by Mode 2 or Mode 3 stress conditions. The main results which are usedin research can be summarized in the following expressions (Dahlberg, et al, 2002):
Mode 1:(3.12)
(3.13)
(3.14)
(3.15)
Mode 2:
(3.16)
(3.17)
(3.18)Mode 3:
= = =
= = =
= = =
= = =+1 -
= =
= =
= = = + -
33 33

34
xz rz( 0) 0
yz z( 0)
KIII
2 x
uz
ur( ± ) ±
1
2µK
III
x
2
3
1for plane stress
3 4 for plane strain
KI y,0 a f K
II xy,0 a g KIII yz,0 a h
KI
KIc
(3.19)
(3.20)
(3.21)
where(3.22)
(3.23)
Plane stress is expected for a thin plate where the stress component perpendicularto the plane is zero, i.e. zz = 0 and rz = z = 0. For a plate which is not very thinthe stress zz will not necessarily be zero. If the lateral strain zz is prevented at thecrack tip then zz = 0 and rz = z = 0. This condition is termed plane strain. Even if a glass plate can be considered thin there will be significant stressesperpendicular to the plane. There will always be residual stresses which indicate thata plane stress assumption might not be the most optimal solution for glass. Still, thisis the general assumption made in all publications available. This is a simplificationwhich need to be analysed in a more objective way.
The factors KI, KII and KIII give a measure of the strength of the stress singularitiesat the crack tips. These factors are called stress intensity factors and play animportant role in fracture mechanics. These factors can be expressed as
(3.24a, b, c)
where a is the crack length and the index 0 refers to stresses far away (compareFigure 3.1). The functions f, g and h will depend on the geometry and the type ofloading. Values of f, g and h can be found in handbooks dealing with fracturemechanics (Lawn,1995).
The fracture criterion is normally defined for plane strain conditions. Since Mode1 normally is most dangerous a failure is expected when
(3.25)
where KIc is the fracture toughness of the material. This fracture toughness isdetermined experimentally. There are three conditions which have to be met:
= = =
= = =
= = =+ -
=
=
-
-
+
= = =
=
34
Mode 3:

35
2,5K
Ic
y
2
KI c
v vK
K
I
IC
n
0
(3.26)
where t is the thickness of the plate, a is the crack depth and W is the height of themember in the same direction as the flaw.
In the case of plane stress the failure condition is written(3.27)
where Kc is determined experimentally.Failure occurs when the stress intensity factor reaches a critical value, KIC. This
critical stress intensity factor is a constant for glass and provides a fixed basis onwhich to conduct design, rather than using an allowable stress which has to varywith time. The loss in strength over time is a result of slow crack growth whichoccurs when the stress intensity factor is less than the critical value. There is athreshold stress intensity factor limit below which no slow crack growth occurs.
Glass fails when the stress intensity factor reaches the critical stress intensityfactor. This failure is sudden and results in very rapid crack growth leading usuallyto loss of structural integrity. If the stress intensity factor is less than the criticalvalue then the crack grows. The speed of this growth is given by
(3.28)
where n is the static fatigue constant and has a value between 12 and 20, but a oftenused value is 16 and it depends on environmental conditions.
3.4 Fracture mechanics of glass windows
The fracture of glass is associated with the existence of flaws. Griffith advanced atheory that brittle bodies fail under a relatively low nominal stress because of thepresence of flaws or cracks which have the characteristics of extreme narrownesswith respect to their length or depth. Consequently they produce high local stressconcentrations when oriented at right angles to a tensile component of stress.
There are two ways of looking at crack growth for glass. First, from the point ofview of the stress intensity factor, KI, which acts as a resistance to cracking and it iscalled fracture toughness. The crack can grow when its stress intensity factorreaches the fracture toughness of the material. A typical value for soda-lime glassis 0,78 MPa m1/2.
A series of 3 point bending tests were conducted on 70mm x 40mm x 6mm thickglass samples consisting of annealed, tempered and laminated glass (Jacob, 1999).Control samples without any surface damage was used to compare the magnitudeof strength reduction caused by the application of surface scratches on the glasssamples. Figures 3.6 to 3.8 demonstrate the impact a small scratch has on thereduction in the bending strength.
(t,a,W - a)
= K
35 35

36
Figure 3.6 Fracture stress versusscratch depth for annealed glass.
Figure 3.7 Fracture stress versusscratch depth for tempered glass.
Figure 3.8 Failure stress versus scratchdepth for laminated glass.
Surface scratches to glass up to 0,008 mm in depth were found to be the limitingscratch. Using this as a limiting scratch, the fracture stress can be determined fromeq 3.11. In this analysis the fracture toughness is assumed to be KIC = 0,851MPam1/2.
The following conclusions were made from the analysis:
• the limiting flaw based on a permissible design stress of 15,7 MPa is 0,745 mm• the limiting stress based on a maximum flaw depth of 0,008 mm is 47,9 MPa• using a safety factor of 2,5 for permissible glass design, the design stress will be
19,16 MPa.These conclusions seem somewhat arbitrary. From reality it is known that the
failure stress is both size and time dependent. The safety factor principle is hardlyused within building component designs any more. It has been replaced by thestatistically based partial safety factor method. It had been possible with a moreadvanced analysis where the permissible stress had been determined in a statisticalanalysis.
36

37
T K AY na IC a p
n
min( / ) / )2 2
2 2 2
Failures in glass panels generally start from the surface or the edge depending on theloading and support conditions. The environmental contribution to crack growthresults in a time dependence of strength known as static fatigue. Static fatigue onlyoccurs in the presence of water, which reacts chemically with the strained bonds atthe crack tip causing bond rupture. The rate of crack growth is determined by therate of chemical reaction, and the time to failure is determined by the time requiredfor the crack to grow from a sub-critical to a critical size, at which point fracture willbe immediate. Once the crack growth has been characterised then the time to failurecan be calculated provided the size of the critical flaw can be determined.
It was suggested purely on grounds of geometry (Littleton and Preston, 1922)that surface flaws can be roughly twice as dangerous as internal flaws of the sameshape and orientation. Upon exceeding a “critical (tensile) stress” the crack beginsto grow at the tip of a notch or crater. In some circumstances this growth only takesplace in small steps, coming to a halt in between. In fracture mechanics this slow or“stable” crack growth is regarded as sub-critical, and is primarily determined by theduration of the load. Short-term loads lead to higher allowable stresses than long-term loads. The sub-critical crack growth is influenced by chemical reactions at thetip of the crack. Once the critical crack growth velocity has been exceeded, a crackbecomes “unstable”, i.e. the widening process accelerates rapidly. This then leadsto sudden failure of the glass element.
For an applied stress which leads to a stress intensity factor KI < KIC, a crackgrowth may still be possible due to the effect of the environment. Crack growthunder these conditions is called “sub-critical crack growth” or “static fatigue”, seeChapter 2.4, and may ultimately lead to fracture some time after the initialapplication of the load. The growth of the crack over the lifetime of the structureis modelled based on the expected stresses, and the time to failure can be estimatedas:
(3.29)
where Y is a dimensionless parameter, see Appendix A, that depends on both thespecimen and crack geometry and sigma is an applied stress and a is crack length.The exponent n determines the time dependence.
According to (Fischer-Cripps and Collins, 1995) the minimum strength of glassis related to a threshold stress intensity factor, rather than a unique minimum stress.If the initial crack size is known then a minimum long-term stress strength can bedetermined. If, however, during the loading history of the member this stress isexceeded, then cracks will grow resulting in a lower subsequent minimum strength,even if the stress then reverts to its initial value.
When the deformation of the pane exceeds around 75% of its thickness the actionof membrane stresses come to affect the total stress distribution on the surface. Themembrane stresses grow towards the middle section of the pane. The extracontribution of shear stresses leads to a maximum stress that is some distance away
37 37

38
VmaxP
2
MmaxP
2
L e
2
Wb h 2
6
M
W
3P(L e)
2bh 2
M
W
3 6(2,000 0,500)
2 0,006 0,400214,06 103 kPa
Figure 3.9 Beam loaded with two pointloads and the resulting shear and momentdiagrams.
from the middle. The effect of membrane stresses depend upon the supportingsolution.
3.5 Analysis of beams
Beams and other structural elements subject to tensile stresses can be analysed witha fracture mechanics approach. In this analysis only beams subject to four pointsymmetric bending is dealt with. Such a beam is shown in Figure 3.9. Between thetwo point loads the maximum bending stress will occur and this is most likely toresult in a Mode I failure. Between the supports and each point load the maximumshear stress will occur and this may result in a Mode II failure. In all normalanalysis a Mode I failure will be the dominant failure mode. This failure mode isthe only one dealt with in the literature dealing with fracture mechanics of glass.
The maximum load effects are given by
and with the bending resistance W
the maximum stress can be derived as
As an example, assume the following values for the beam L= 2 m, h = 0,400 m andb = 0,006 m. It is subject to two point loads with e = 0,500 m. The total load is P= 6 kN. This will result in a maximum stress of
which is a stress that should not cause a direct failure. Because of a crack, real orassumed, in the section of maximum stress there will be stress increase which canbe analysed with eq. 3.11. Values of KI as well as additional informationconcerning calculation of KI can be found in Appendix A. The value of KI can beexpressed as:
=
= . -
=
= =-
= = =.
. ..-
38

39
Figure 3.10 A crack.
K a fa
w
fa
w
I 0
=K
a0
I
K a fa
wK
fa
wf
K
K K
OK
I IC
I
I IC
0
0
3
6 3
6 6
14 10 14
0 008
400112
14 10 0 00810 112
0 0786 10 0 851 10
( )
,,
, ,
, ,
kPa MPa
K a fa
wK
fa
wf
K
K K
OK
I IC
I
I IC
0
0
3
6 3
6 6
14 10 14
0 01
400112
14 10 0 110 112
0 278 10 0 851 10
( )
,,
, ,
, ,
kPa MPa
where o is the stress at the tip of the crack. Assume that KIC6 1/2.
For a crack depth of a = 0,008 mm, which seems to be the smallest crack depthwhich can be measured directly in a sheet of glass, the following calculation can bemade
For a crack depth of a = 0,1 mm
= 0,851.10 Pam
39 39

40
aK
fa
w
c
I
0
2
K a fa
H
fa
H
K
MPa
aK
fa
w
I
IC
IC
0 6
6
0
0
2
3
6
2
3
1122
0 851
20
1 0 851 10
20 10 1122
10 4578 10
,
,
,
,,
0
0
0
50 0 073246
100 0 018311
150 0 000812
MPa
MPa
MPa
a mm
a mm
a mm
,
,
,
K a fa
wK
fa
w
K a fa
wK
critical cracksize
I IC
I IC
0
0
3
6 6
14 10 14
14 10 0 851 10
( )
?
,
?
kPa MPa
Obviously the initial size of a crack is a very important factor for the failurestress. Another way to address the problem is to find the critical crack size. Thismethod will be an iterative process, since when the crack length, a, is explicit it willstill be a function of itself and hence a non-explicit solution will be obtained.Because the crack depth, a, does not affect the height of the structure, w, to anylarger extent until it reaches about 30% of w, this iterative process can be donequickly.
(3.30)
For the following stresses in the crack tip the critical crack depth will be
40

41
Figure 3.11
m m
a
a2
1
2
1
270 10
0 264 10
1 1057 09
9
6
,, MPa
Example: A glass plate contains an atomic-scale surface crack. (Take the crack tipradius diameter of an O2- ion). Given that the crack is 1 µm long and thetheoretical strength of the defect-free glass is 70,0 GPa, calculate the breakingstrength of the plate.Solution:
Table, (see Appendix):
( ) ( ) , ,O r O nm nm2 22 2 0 132 0 264
~~
41 41

41
STOCHASTIC MECHANICS APPROACH
4.1 Introduction
Stochastic mechanics is the theory about how to consider the uncertainty in therupture strength of materials. Such uncertainty concerns both the magnitude of arupture and the variability. The reason to this uncertainty reflects the presence offlaws in a material. An analysis of the rupture strength can be done in twoprincipally different ways. It can be based on the influence of flaws or theconsequence of flaws. In the latter case it is more adequate to term it a statisticalanalysis.
All materials contain flaws. They can be a natural part of a material or aconsequence of the production, handling and use. In theory the tensile strength ofglass is around 20 000 MPa. In reality the rupture strength of window panes is inthe range of 30 - 80 MPa. This dramatic reduction of the rupture strength is notunique for glass. Similar reductions can be found for any type of structural material.
If a material had been perfect, i.e. all internal components were in perfect order,then a tensile failure had been expected for a tensile stress. With internal disruptionsbetween the components there will be a new failure mode, a shear failure modewhich can take place for an external tensile stress. This has been studied extensivelyfor metallic materials where this shear behaviour is associated with viscous creep.For other materials where this type of creep is not possible a crack growth takesplace instead. For glass and other ceramics this crack growth seems to be associatedwith primary creep which can be seen as a delayed elastic response.
Flaws are often assumed to be random in size and orientation. A consequence ofthis assumption is that there is an increasing probability of finding a more dangerousflaw for increasing volumes under stress. This introduces a size dependence of therupture strength. A size dependence of the rupture load is a well knownphenomenon for structural materials as well as for glass.
Existing flaws can grow in time or new flaws can be created. This alters theoriginal flaw characteristics and thus the failure stress, which in turn introduces atime dependence of the rupture stress. Such a time dependence of the rupture loadis of concern if a material is subject to a high sustained stress, for instance pre-stressing tendons in concrete beams. For glass there is a noticeable time dependencewhich needs to be considered.
The environment in terms of the humidity also has a pronounced effect on thestrength of glass. Cracks will grow in size faster when water molecules are present,something which is termed static fatigue for glass.
Stochastic mechanics is also a powerful tool in many applications. It can answerthe following questions:
• What is the failure probability for a structural unit subject to specified stresscondition?
42

42
d
dVF
n
Fnv
v
ln( )11 1
• How will the rupture strength decrease for an increasing volume under stress?• How will the rupture strength decrease for an increasing duration of a stress?
Dependent on the answer the structural part can be modified or the stress fieldaltered.
4.2 Some historical notes
The presence of a size dependence of the rupture stress was first noticed byLeonardo da Vinci for wrought iron in the 15th century. This does not seem to havegiven rise to any practical use. In the beginning of the 20th century it wasrecognized that it was necessary to standardize test methods in terms of specimensize and rate of loading to make fair comparisons possible.
For brittle materials Weibull(1939) introduced a theory that could characterizethe size dependence of the rupture load. He assumed that a bar subject to a tensilestress can be split up in a large number of units or volumes. For each such volume,Vi, there is a probability density function, pdf, giving the probability of failure. Thenecessary condition for the occurrence of fracture in the body at a certain definiteload is that the ultimate strength shall be exceeded at a single point/element, i.e. theweakest element. This probability is equal to the product of the probabilities inevery elementary volume of the body that fracture will occur. If two independentelements are put in series, the new failure probability, P, will be
P(system fails) = 1- (1- F1)·(1- F2) = {F1= F2}= 1 - (1 - F1)2 (4.1)
This can be done for n elements which results in the following failure probabilitydistribution
P(system with n elements fail) = Fnv = 1 - (1 - F1)n (4.2)
After taking the logarithm and differentiating, the result will be
Fnv = 1- (1 - F1)n (4.3)
1- Fnv = (1 - F1)n
(4.4)ln(1 - Fnv) = n ln (1 - F1)
(4.5)
43 43

43
g ( )c
o
m
d Fn
FdVnv
v
ln( )11 1
ln( )11 1
Fn
FdVnv
v
1 F env
F env
n
FvdV
1 1 1
F env
g dV1
( )
(4.6)
(4.7)
(4.8)
(4.9)
The failure probability function will be:
(4.10)
For the stress function g( ) Weibull suggested
(4.11)
where co is a normalization constant. The exponent m is often referred to as a sizeparameter since it determines the size dependence. It reflects the influence ofvarious types of defects where cracks is one type. It can also be irregularities in theatomic structure which are not directly measurable. The statistical distribution (4.10)with eq. (4.11) is the well known two parameter Weibull distribution.
4.3 Stochastic mechanics for brittle materials
There are various approaches to the statistical theory of brittle fracture. These differin the method of reasoning and the assumption of the postulated form of thedistribution function of the strength of the primary elements. It is also possible tostart with a hazard function, which is the probability of failure given that no failurehas taken place before. A solution based on an asymptotic distribution for minimumvalues of sufficiently large sets will be given below. This approach is ageneralization of the Weibull method, being at the same time justifiable from atheoretical point of view. Weibull apparently proposed the distribution function outof convenience to fit available experimental information, which has been avulnerable spot in his theory.
The principle utilized in section 4.2 can be applied for any type of statisticaldistribution and when n goes towards infinity this will lead to an extreme valuestatistical distribution. Based on the original distribution there are three possibleextreme value distribution alternatives, type 1, type 2 and type 3. For each of themthere is a distribution for a minimum and a maximum value. This theory ofstatistical distributions of extreme value was not available at the time when Weibull
44
n
FvdV
1 1

44
F( ) 1 exp[ knV ( 0)m ]
kn1
V0 cm
0
F( ) 1 expV
V0
0
c0
m
knD
D0
m
h 1
V0 cm
0
F( ) 1 expV
V0
D
D0
m
h 0
c0
m
developed his statistical distribution.If the original distribution cannot take negative values, i.e. the breaking tensile
stress is positive. The tail of the distribution will to some extent reflect stressesbetween the components in the material which often are represented with ahyperbolical expression. With these two conditions it can be expected that theextreme value distribution is of type 3 and minimum value. This statisticaldistribution can be expressed as
(4.12)where 0 is a minimum strength of a defective element. For nV sufficiently large theapproximate sign can be substituted with an equal sign. When 0 = 0 the result isthe same statistical distribution proposed by Weibull. The conditions for eq. (4.12)to hold are fairly general and a broad class of initial statistical distributions can beutilized. With a change of the constants k and m it is possible to obtain a statisticaldistribution with a wide variety of form and scale. The Weibull distribution hasmany interesting features which has made it attractive in many fields of application.If a reference volume V0 and a constant c0 are introduced as
(4.13)
then eq. (4.12) can be expressed as
(4.14)
which is common way to express the Weibull distribution in structural applications.But since it is known that the failure stress also is time dependent the constant kn
can be chosen to take this into account. From the information given in Chapter 2this time dependence is also hyperbolical in terms of the mean value. To obtain thisresult the constant kn is chosen as
(4.15)
where D is an effective duration and D0 is a reference duration. This will result in
(4.16)
Equation (4.16) can be applied both for loading directly to failure or creep to failure.The effective volume under stress and the effective duration of stress need attention
~~
45 45

45
F( ) 1 exp1
V0
1
D0
m
hp
i
Vi
q
j
D
m
h
j
(x,y,z, t) 0
c0
m
F( ) 1 exp1
V0
1
D0
m
h
(V)
xyz
(t)
t
m
h(x,y,z, t) 0
c0
m
dVdt
E[ ] 0 o
V0
V
1
mD0
D
1
h 11
m
Var[ ] c2o
V0
V
2
mD0
D
2
h 12
m
2 11
m
under non uniform stress or not constant stress conditions in time. Any volume canbe split up in small units as well as a duration in time units and the evaluation of eq.(4.16) can be expressed as
(4.17)
which is how the analysis will take place in a computer evaluation based forinstance on the finite element method. When p and q goes towards infinity thesummations can be replaced by integrals which results in
(4.18)
analytically. If desirable the reference volume V0 and reference duration D0 can begiven the value 1.
The mean value of (4.16) is obtained by means of variable transformations andintegrations. For the simplest load case of uniform stress which is constant in timethe mean value can be derived as
(4.19)
and the variance as
(4.20)
where is the gamma function which can be evaluated from a series expansion,from tables or mathematical computer programs. The choice of constants wasmotivated by a desire to obtain eq. (4.19) as a mean value. A similar technique canbe utilized to include the temperature dependence found in (Charles, 1958), seeChapter 2. The size and time dependencies of the rupture stress of brittle materialslike glass found in experimental information are characterized well with eq. (4.20).No other statistical distribution has this ability to include dependencies in this way.The result of eq. (4.19) can be visualized as a stress failure surface in a size - timedomain which is presented in Figure 4.1. The dotted line reflect the minimumstrength 0. The marked area reflects the time dependence of the rupture strength fora given volume under stress. For increasing volumes under stress and increasingdurations the rupture stress will go towards 0.
The coefficient of variation, c.o.v., which is the square root of eq. (4.20) dividedby eq. (4.21) can in the case when 0 = 0 be expressed as
+ c +
+ +
where it can be expected that only very simple stress conditions can be evaluated
46

46
2m 6
F( ) 1 expA
A0
D
D0
mA
h 0
c0
mA
F( ) 1 expL
L0
D
D0
mL
h 0
c0
mL
V
V
f(x,y,z)mdxdydz
(4.21)
which provides a means to estimate the size parameter m if the mean value andstandard deviation are known from experiments. The accuracy of eq. (4.21)depends on the relation between 0 and c0 and m. The approximation given in eq.(4.21) is acceptable for values of m > 4 - 5. The variability in experiments may beaffected by external sources which means that eq. (4.21) can only give guidance ina possible value of the size parameter.
For ordinary plate glass it is normally not the defects within the volume whichare of main concern. Instead it is surface defects or edge defects which will causea rupture to occur. For glass it seems reasonable to substitute V with the surfacearea under stress, A, or the edge length, L, under stress. This leads to the followingexpressions for glass strength evaluations
(4.22)
(4.23)
where A0 and L0 are reference values. The exponent mA is in the range 7 - 9 and theexponent mL is in the range 3 - 4 (Ontario Research Foundation, 1981). Thethreshold stress 0 reflects residual compressive stresses in the surface region whichare introduced during the production because the surface cools down faster then theinterior. In the float glass production the cooling is controlled and 0 will be around8 MPa. Along the edge it is likely that 0 is close to zero. For heat strengthenedglass 0 will correspond to the compressive stress introduced in the surface whichcan be well over 100 MPa.
In an evaluation of the effective volume under stress and an effective duration ofstress by hand it is an advantage to disregard the threshold stress. In the evaluationof the volume under stress the influence of existing defects are taken into account.Then the evaluation can be seen as the evaluation of a “reduced volume” and“reduced time”. This can be expressed as
(4.24)
The time dependence reflects the growth of existing defects with time and the stresslevel. This “reduced time” is evaluated from
~~- 1c.o.v. =(1 + 2/m)
(1 + 1/m)
=
=
- --
- --
* =
47 47

47
D
D
f(t)h dt
Figure 4.1 The rupture stress as a function of volume and duration of a stress.
(4.25)
where f(t) describes the stress variation in space or in time for a body subject tostress. The resulting mean value and variance are given by eqs (4.19) and (4.20)with 0 = 0 which is an acceptable approximation in most applications. With 0 = 0a linear stress variation over a body can be evaluated analytically. An example ofsuch a calculation will be given in the last section of this Chapter. For a stresswhich is increasing continuously until a failure occurs eq. (4.25) gives the result thatthe reduced time is D* = t/(h + 1). For glass where h 16 the reduced time is 1/17of the actual time. This can be interpreted as that only the time spent on a highstress level will be of importance. This implies strongly that eq. (4.24) and eq.(4.25) can be used together with eq. (4.19) and eq. (4.20) without any loss ofaccuracy even if the threshold stress is important.
4.4 Failure prediction for glass windows
A glass window will normally be subject to wind loads acting perpendicular to itsplane. For a glass pane which is simply supported along its edges this will createbending stresses and membrane stresses. For small deformations, less than thethickness of the glass plate, bending stresses will dominate. For larger deformationsmembrane stresses will increase in importance. Modern analysis with finite elementanalysis (FEM) shows that at failure bending tensile stresses and membrane stresseswill have approximately the same magnitude. The maximum tensile stress will not
* =
~~
48

48
d
n
d
=(t)
tdt
n1/
occur at the centre of a plate but at four points some distance away towards thecorners. Many old stress analysis of glass plates seem to have been based onassumptions which do not account for the membrane stresses. This isunderstandable if calculations had to be made by hand since this leads to extensiveevaluations.
A wind load which is acting on a window pane is complex. During shorterperiods of time it can be assumed to have a stationary component and a fluctuatingcomponent. There will also be a random fluctuation of the wind over a glass area.For increasing durations of a wind loading the importance of the fluctuatingcomponent will decrease. The optimal design duration of a wind load is not easyto define in a consistent way. Besides, the building itself will affect the windstructure and create turbulence which will also be influenced by the wind directionand surrounding buildings. Therefore the design wind speed is assumed to be theaverage wind speed during a short duration, normally related to available windstatistics. In the United States the duration is 1 minute. In Sweden the duration is 10minutes but this value is adjusted to account for a dynamic influence.
When glass plates are tested the load is increased slowly until a failure occurs.It was realized by (Brown, 1974) that the failure stress depended on the rate ofloading or the duration of a test. To account for this discrepancy the followingexpression was proposed to normalize the rupture stress result
(4.27)
where (t) is the failure stress in an experiment with duration t and n is a constantchosen as 16 from experiments.
A large research project started in Lubbock, Texas, in the 1970 to analysewindow glass failures and to develop a rational tool for the design of windows. Thefirst aspect was a consequence of glass failures in connection with tornados. It wasnot just high wind speeds but the debris following a tornado which could increasethe flaw density of widows and make them rupture at a lower wind speed thanotherwise would be the case. The second aspect reflected a need for a new designguide for window glass. The increasing use of large glass windows in tall buildingsmade this desirable. Existing design guides were not consistent and there had alsobeen a transition from plate glass to float glass with different strengthcharacteristics.
The desired final result was to obtain a failure probability for a given windowsize and thickness subject to certain wind load with 1 minute duration. This madeit suitable with a statistical approach. To include a known size and timedependence of the rupture load a Weibull distribution was chosen. The failureprobability was initially expressed as
49 49
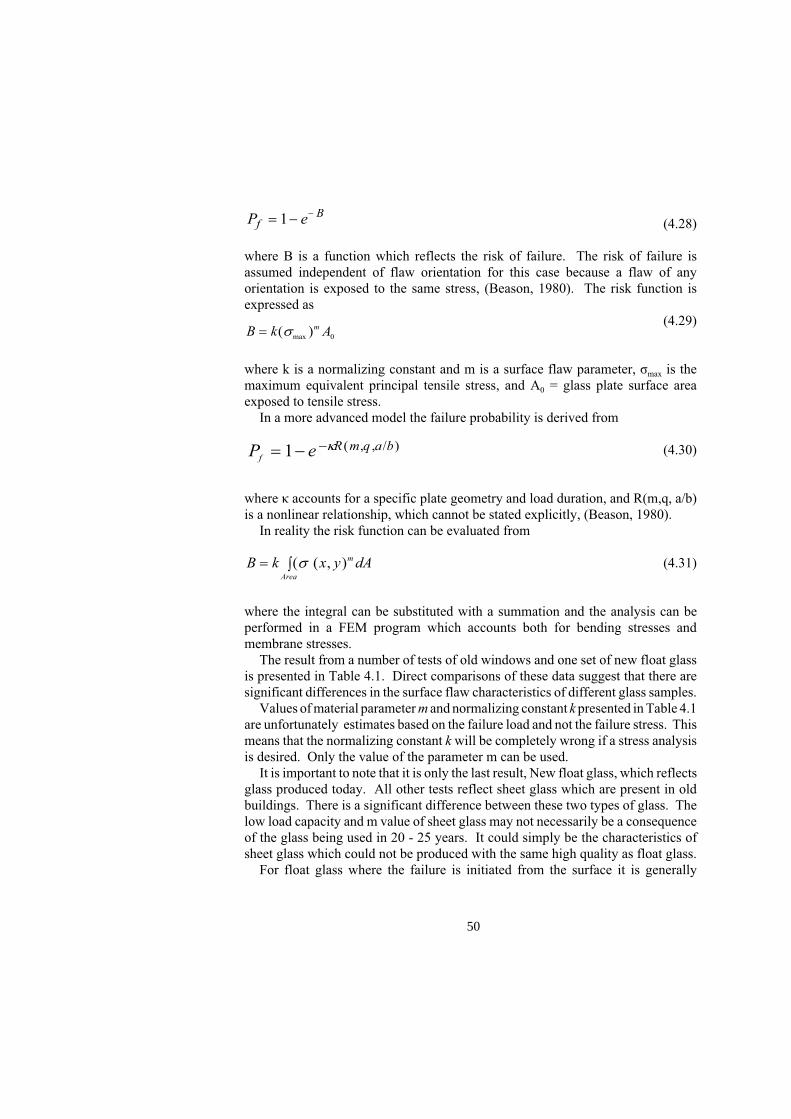
49
P efB1
B k x y dAm
Area
( ( , )
P ef
R m q a b1 ( , , / )
B k Am( )max 0
(4.28)
where B is a function which reflects the risk of failure. The risk of failure isassumed independent of flaw orientation for this case because a flaw of anyorientation is exposed to the same stress, (Beason, 1980). The risk function isexpressed as
(4.29)
where k is a normalizing constant and m is a surface flaw parameter, max is themaximum equivalent principal tensile stress, and A0 = glass plate surface areaexposed to tensile stress.
In a more advanced model the failure probability is derived from
(4.30)
where accounts for a specific plate geometry and load duration, and R(m,q, a/b)is a nonlinear relationship, which cannot be stated explicitly, (Beason, 1980).
In reality the risk function can be evaluated from
(4.31)
where the integral can be substituted with a summation and the analysis can beperformed in a FEM program which accounts both for bending stresses andmembrane stresses.
The result from a number of tests of old windows and one set of new float glassis presented in Table 4.1. Direct comparisons of these data suggest that there aresignificant differences in the surface flaw characteristics of different glass samples.
Values of material parameter m and normalizing constant k presented in Table 4.1are unfortunately estimates based on the failure load and not the failure stress. Thismeans that the normalizing constant k will be completely wrong if a stress analysisis desired. Only the value of the parameter m can be used.
It is important to note that it is only the last result, New float glass, which reflectsglass produced today. All other tests reflect sheet glass which are present in oldbuildings. There is a significant difference between these two types of glass. Thelow load capacity and m value of sheet glass may not necessarily be a consequenceof the glass being used in 20 - 25 years. It could simply be the characteristics ofsheet glass which could not be produced with the same high quality as float glass.
For float glass where the failure is initiated from the surface it is generally
50

50
accepted that the m value should be in the range 7-9. The most commonly usedvalue is m=8. For failures which are initiated from an untreated edge the m valuewill be reduced to roughly half of that for a surface failure.
Table 4.1 Tests of old and new window glass.
Location of
windowSize in mm
Number
of
specimens
Mean
kPa
Stand. dev
kPam k
Great Plains LifeBuilding (GPL)in Lubbock,Texas1975;20 years ofexposure of sheetglass
724x1540x5,56
20 3,78 0,88 6 6,33x10⁻¹⁵ mm10N-6
724x724x5,56
20 8,05 1,80
JohnsonChevroletBuilding, Dallas1980; 20 years ofexposure of sheetglass
413x502x3,18
22 10,99 2,97 6 3,01x10⁻¹⁵ mm10N-6
Public School inAnton, Texas1980; 25 years ofexposure of sheetglass
356x921x3,18
132 6,43 1,61 5 9,60x10⁻¹⁴ mm8N-5
New Float Glassfrom PPG inLubbock, Texas
413x502x3,18
20,49 3,71 9 1,32x10⁻²¹ mm16N-9
4.5 Analysis of beams
Structural elements like beams can be analysed with the stochastic mechanicsapproach. As a comparison the same type of beam as was used in the fracturemechanics approach will be utilized here. Also the loading conditions will be thesame with two symmetric point loads.
The analyses can be made in several ways. Flaws exist both in the interior asinclusions of foreign material and as surface scratches. The importance of such
51 51

51
Figure 4.2 The loading conditions for thebeam.
B x y z dxdydz b x y dxdyM x y y
Idxdy
V
m m
m
( , , ) ( , )( , )
MPx
M
M
Iy
Px
Iy
Px
bhy
P
bhxy
MPx P
xl e P
l e
M
Iy
P l e
bhy
P l e
bhy
x x
x
x
x
1 3
1
1
3 3 3
2
2
2
3 3
2
2
12
2
6
2 2 2 4
12
4
3
flaws will depend on the tensile stress field around the flaw.The moments and corresponding stresses which act on the beam are shown in
Figure 4.2 and are given below.
where the indices 1, 2 and 3 refer to the different sections indicated in Figure 4.2.The maximum stress occurs between the two point loads where flaws will have themost pronounced influence. Between the supports and the point loads the momentwill increase from zero to its maximum value. This will give flaws a lesserinfluence based on the moment curve. But still it will influence the failureprobability.
The volume under stress is obtained from integrating the stress variation in space.First, the risk function will be
where a derivation is performed in Appendix B and the final result can be expressedas:
52

52
B bhLc
e
Lm bhL
P L e
c bh
e
Lm
V
m m
0 0
21
3
21...
( )
Figure 4.3 Beam under evaluation.
MP L e P
L e
Wbh
M
W
P L e
bh
P L e
bh
2 2 2 4
6
4
6 3
2
2
2 2
P kN
MPa
6
3 10 6
2
2 0 5
0 006 0 414 1
3
2
,
, ,,
P F ef
B( ) 1
An estimate of the value of k or c0 can be obtained from the results given in(Carré, 1996) which were presented in Chapter 2. For the lowest loading rate, 0,05MPa/s the mean value rupture strength was 41,2 MPa for an ordinary surfacetreatment. The effective duration based on eq. (4.19) with h = 16 is 48 seconds.The normalization constant in eq. (4.10) can now be determined as c0 = 17,74 MPafor 0 = 0 MPa. With this choice of the value of c0 the tests carried out by (Carré,1996) will be established as a reference volume under stress with a correspondingmean value rupture stress.
In this first example the following dimensions are assumed: L = 2 m, e = 0,5 m,h = 0,400 m and b = 0,006 m. The external load is P = 6 kN. This will result in astress of 14 MPa. Just to show the influence of different parameters the width isaltered, the distance between the loads and the load level. The results are presentedlater in Table 4.2.
It can be seen from the tables the probability of failure will decrease withincreasing value of e. As the distance between the forces increase the momentdecreases and hence the stress is decreasing. When the width is increased thebending stiffness increases which results in reduced failure probability. As it would
53 53

53
be expected when the load is increases so is the failure probability.
Table 4.2 Results for failure analysis of beams where the failure probability has avolume dependence.
P= 6 kN B Pf
e=0,5 m b=6 mm 0,0023 23,0x10⁻⁴
e=0,5 m b=8 mm 0,00030 3,0x10⁻⁴
e=1,0 m b=6 mm 0,00015 1,5x10⁻⁴
e=1,0 m b=8 mm 0,000019 0,19x10⁻⁴
e=1,5 m b=6 mm 0,00000080 0,008x10-4
e=1,5 m b=8 mm 0,00000011 0,0011x10⁻⁴
P= 12 kN B Pf
e=0,5 m b=6 mm 0,575 4370x10-4
e=0,5 m b=8 mm 0,0767 740x10-4
e=1,0 m b=6 mm 0,0374 370x10-4
e=1,0 m b=8 mm 0,00499 49,8x10⁻⁴
e=1,5 m b=6 mm 0,000204 2,04x10⁻⁴
e=1,5 m b=8 mm 0,0000273 0,273x10-4
P= 18 kN B Pf
e=0,5 m b=6 m 14,730 0,9999
e=0,5 m b=8 mm 1,966 0,860
e=1,0 m b=6 mm 0,9579 0,616
e=1,0 m b=8 mm 0,1279 0,12
e=1,5 m b=6 mm 0,00524 0,00523
e=1,5 m b=8 mm 0,000699 0,0007
54

54
B x y dxdy x z dxdzA
m m
, ,
P B
B
f0 05 0 0513
2 0 0 4 0 00617 74
10 5
2 08
20 79
8
, ,
, , ,,
,
,
,
MPa
B hLc
e
Lm
A
m
2 10
0
BP l e
bh
m
mb l e m eb m h l e hm e m
cA
m
m
ATOT
3
2 21
1 21 1 2 1 1
1
0
1
1 2
( )( )( ) ( ) ( ) ( )
BP l e
bh cA
m
b l e m eb m h l e hm e m
Pf
eB
B Pf
ATOT
ATOT
ATOT
3
2 20
1 1 2 1 1
1 1
( )( )( ) ( ) ( ) ( )
ln
P the fractile required ef
B 1
A fractile value can be obtained from:
Often a lower 5% fractile value is used as a characteristic value. This is obtainedfor b=0,006 m; e=0,5 m:
An evaluation of the surface area under tensile stress can be evaluated as
where the first part reflects the sides and the last part the bottom side. This is shownand evaluated further in Appendix 2. For the first term, which is dominating, the risk function is
55 55

55
3
2 20
1 1 2 1 1 1
35 30
P l e
bh cA
m
b l e m eb m h l e hm e m Pf
c MPaA
( )( )( ) ( ) ( ) ( ) ln( )
................. ,
Example on the same beam again but this time with the area under stress:
Table 4.3 Results for failure analysis of beams where the failure probability has aarea dependence.
P= 6 kN BATOT Pf
e=0,5m and b= 6 mm 679,0x10⁻⁶ 6300,0x10-6
e=0,5m and b=8 mm 65,6x10⁻⁶ 65,6x10⁻⁶
e=1,0 m and b=6 mm 23,3x10⁻⁶ 23,3x10⁻⁶
e=1,0 m and b=8 mm 2,78x10⁻⁶ 2,78x10⁻⁶
P=12 kN BATOT Pf
e=0,5m and b= 6 mm 0,15023 1390,0x10-4
e=0,5m and b=8 mm 0,01679 166,0x10⁻⁴
e=1,0 m and b=6 mm 5,97x10⁻³ 57,7x10⁻⁴
e=1,0 m and b=8 mm 7,12x10⁻⁴ 7,12x10⁻⁴
The result will be different when the volume under stress is compared with thearea under stress. In the mean value sense the result will be similar for the beamtests carried out in (Carré, 1996) because this is the reference results used. When alarger beam is evaluated the scale factor will be different for the volume under stress
56

56
D
D DExample years
h
0
1 1
16
1
16
1100
1
100 365 24 600 329
* *
,
and the area under stress. Therefore it cannot be expected that the results of thefailure probability are different.
A comparison of the results in Table 4.2 or Table 4.3 show what can be expected.When the distance e increases the volume or area under stress will increase. At thesame time the maximum moment will decrease faster and the resulting failureprobability will decrease. Differences between Table 4.2 and Table 4.3 are aconsequence of different scale factors for volume and area respectively.
With a knowledge of the parameters c0 and m it is possible to establish the failuredistribution for any type of beam. If the loading condition is a uniformly distributedload it is not possible to make the calculations by hand. Instead the evaluation ismade with the help of some suitable computer software.
The result in Table 4.2 is supposed to be the failure load for a sustained stresswith a duration of 48 seconds, let´s say approximately 1 minute. For longerdurations the failure stress will be reduced. If it is assumed that the time parametern = 16, which is a value often found in the literature, this reduction can be evaluatedfrom eq. (4.26) for a constant stress. For a variable stress which can be expressedin mathematical terms eq. (4.27) can be used. In Table 4.4 are some reductionvalues given for different durations of a constant stress that would cause a failure.
Table 4.4 The reduction of the failure stress for different durations of a stress.
Duration Relative reduction
1 minute 11 hour 0,9961 day 0,6351 year 0,43910 years 0,380100 years 0,329
As an example, the mean rupture stress for sustained stress over 100 years will bereduced to:
57 57

-57-
CONCLUSIONS
5.1 Introduction
Glass is a material which is used in increasing more complex and demandingapplications. This in spite of a lack of official codes which can give guidance aboutproper design procedures and material strength characteristics. Glass as a materialhas many characteristics in common with ordinary structural materials. But thereare also differences which need attention. Glass will fail in a brittle manner whichis considered unacceptable in most applications. The use of glass in structuralapplications therefore need special attention concerning
• Design strategy/reliability• Material strength characterization• Design methodology
where each aspect can be analysed separately but there will be a connection betweenthem. Design strategy and reliability has been discussed in connection withapplication in Chapter 1. Material strength characterization was presented inChapter 2. Design methodology as extensions to normal design was given inChapters 3 and 4. A synthesis of this information is presented below.
5.2 Design strategy
The oldest design principle is based on the safety factor principle. This means thatthe allowable stress is determined as the mean rupture stress divided by a safetyfactor. This design principle has been used since formal designs of structuralmembers started during the 18th century. The safety factor was initially chosenarbitrarily to be large enough. The first person who made a scientific analysis ofthis safety factor was a French engineer, Vicat (1828), at the French RoadAdministration. The background was the continuous increasing deflections of steelhangers in an arch bridge. He performed creep tests where the applied stressescorresponded to 25%, 50% and 75% of the failure stress of a rod hanger. After anumber of years he noticed that it was only for a stress of 25% of the failure stressthat the increase of the deflection decreased with time. For a stress level of 75% ofthe failure stress the deflection increased linearly in time. For a stress level of 50%of the failure stress the deflection still increased with time but not as fast as linearwith time. Results of this type and the consequences were not analysed andmathematically described until almost 100 years later. In view of this it was naturalfor Vicat to draw the conclusion that it was not appropriate to use more thansomething between 25% and 50% of the rupture stress in an application. Hesuggested a safety factor of 3. Even if this experiment reflects very special loadingconditions with a sustained stress this proposal for a safety factor had a pronouncedinfluence on the engineering profession. For this reason a safety factor of 3 has
58

-58-
been in use since then until the introduction of the statistically based designprocedure.
One of the most well known designers in the field of glass is Tim McFarlane. Indesigns he uses an admissible design stress which is determined from an experimentwhere the mean failure stress is divided with a safety factor of 3. This seems naturalin view of the result of Vicat. The factor 3 is not a universal figure even if it seemsas if it has been applied in this way. It has to be material dependent and as suchspecific to a material composition and manufacturing. It may also be influenced intime by the environment.
The result obtained by Vicat shows that there is a threshold stress between safeand unsafe use. This threshold stress reflects the dividing line between two differentmaterial responses. Below the threshold stress the initial deformation is followedby primary creep which can be seen as a delayed elastic response. Above thethreshold stress the deformation will end in secondary creep which can be seen asa damage accumulation in terms of a shearing deformation between atomic planes.Secondary creep will eventually lead to a failure. This is a typical behaviour formetallic materials subject to a constant stress.
For a material which will fail in a sudden and brittle manner when it isoverstressed there is a fundamental problem. But this is not unique for glass. Othermaterials like concrete, steel and wood can fail in a similar manner under certaincircumstances. The notion of a preferable ductile failure instead of a brittle failureis perhaps more emotional than connected to reality. Ductile failures can beexperienced in deformation controlled laboratory experiments. Even anunreinforced concrete beam can exhibit large ductility in a very stiff testingmachine. The final failure will be brittle. Steel subject to low temperatures or fastloading situations may also fail in a brittle manner. In reality when a load exceedsthe load carrying capacity there will be an instantaneous failure where it often is notpossible to distinguish between ductile and brittle characteristics.
It is common knowledge that when glass fails it will rupture in a number ofpieces which can be a hazard for people in the vicinity. This has to be consideredin a design strategy. The rupture strength of glass has a pronounced size and timedependence. This can be influenced by the environment where especially staticfatigue play an important role. These dependencies are not unique for glass but theyhave a pronounced influence on the rupture strength. Therefore the influence needto be addressed.
From the examples in Chapter 1 it can be seen that several strategies have beenutilized in applications. Lamination where two or three glass panes are gluedtogether offers at least two advantages. When two glass panes are laminatedtogether and a failure occurs in one pane it can be assumed that the other pane willtake over the load carrying capacity while the broken pieces from the ruptured panestill will be glued to the unbroken pane. This will give time to make the necessaryrepair. If three panes are glued together the pane in the middle will to a large extent
59 59

-59-
be protected from surface damage. No or little deterioration with time can beexpected. If this is done for a beam the outer panes can have an overlap and thespace in between can be filled a transparent sealant which will also protect the edgefrom deterioration.
In many applications annealed glass is substituted with heat treated glass. Thisintroduces high compressive stresses in the surface region. As long as the externallyintroduced bending tensile stress is smaller than the compressive residual stress itis impossible for a crack growth from the surface area. But a breakage is stillpossible because of the existence of impurities in the region of high tensile stresses,(Jacob, 2003). Such impurities will act as stress racers and this can result in adelayed creep failure. Even if the most dangerous impurities are removed duringthe production there is no guarantee that these glass plates will last forever. So alsoin this case a lamination of two or three panes together is necessary.
It can be expected that structural units of glass will not exhibit any creep withvisible deformation before a failure. The creep phenomenon static fatigue willreduce the height of a section locally and increase the local stress. It is possible thatthis can be measured by high performance fibre optical strain gauges. If this ispossible a continuos surveillance could be used. There is no information availableconcerning this possibility.
The present design strategy for normal construction materials is that the strengthof a material is characterized by a statistical distribution. A characteristic strengthis defined as a lower 5% fractile value for a certain confidence level. The statisticaldistribution used is a normal statistical distribution out of convenience even if thereis evidence that some other statistical distribution makes more sense. Theconfidence level reflects the influence of the sample size. In Figure 5.2 this isillustrated for a statistical distribution which is skew to the left. This is of similartype as a Weibull distribution with m = 8.
For glass the strength properties with a size and time dependence is wellestablished. Because of this it is not equally important to use a confidence criteria.The lower 5% strength can be established with the methodology presented inChapter 4.5 with great accuracy.
5.3 Material strength
The allowable strength of glass in structural applications is in general very low.This is understandable and it reflects a natural conservatism among designers. Thisshould also be seen in the light of the lack of long term experience from thestructural use of glass. In annealed glass there are residual compressive surfacestresses of around 8 MPa. The mean rupture strength can be expected to be around40 - 75 Mpa,(Compagno, EN1288). But this strength is easily reduced by a size anda time dependence. For a beam subject to a uniformly distributed load the heighthas to be doubled if the length is doubled .If a beam length is doubled its height alsohas to be doubled to give the same formal load carrying capacity according to the
60

-60-
ff
d
k
m n
Figure 5.1 Definition of the lower 5% characteristic value.
theory of elasticity. The width is kept constant. But the size dependence willdecrease the real rupture load to approximately R = Ro(1/4)1/8 0,84·Ro.
Sustained stresses will introduce a time dependence of the rupture load. Suchstresses will mainly occur for the dead load which can be a substantial part of thetotal load. If it is assumed that in an ordinary test of a glass beam where the load isincreased continuously from zero to failure takes about 5 minutes the effectiveduration will be Do = 5/(16+1) 0,3 minutes or 2,0·10-4 days. For a structure witha design life of 50 years the reduction of the rupture stress will be R = Ro {2,0·10-4
/(50·365)}1/16 0,32·Ro. This indicates that only one third of the mean rupturestress, which will be in the range of 13 - 15 MPa, can be utilized when the timedependence is considered.
In reality there should also be a safety margin. With the exponent m = 8 thecoefficient of variability will be cov /(m 6) 0,16. Based on the normaldistribution a lower 5% fractile can be established as
Rk = (1 - k5·cov)m = (1 - 1,64·0,16)0,32·Ro = 0,24·Ro
where only the time dependence is considered. In reality it may be necessary toinclude the size dependence as well. With the example given previously this wouldreduce the original mean failure stress to about one fifth of the original mean failurestress. This will result in a design stress of 8 - 9 MPa which should be divided withappropriate partial safety factors.
The choice of safety factor, R, depends on well Rk has been established andreliability class. In Sweden this is split up in n which reflect the consequences of
~~
~~
~~
~~ ~~
61 61

-61-
a failure with respect to human life and m which reflect the confidence inestablishing Rk. In view of the fact that Rk will come close to the level of residualstresses introduced during the manufacturing of annealed glass indicates that
Rd = Rk/( n m) 6 - 7 MPa
for the dead load. For other loads with shorter duration a higher stress level can beacceptable. This load level can be established in a similar manner as above. Thisis a similar strength characterization as is used for wood.
For heat strengthened glass it may seem reasonable to assume that Rd should beclose to the compressive stress introduced in the surface region. But this is far fromobvious. If foreign inclusions are present, which can be assumed, there is likely tobe a delayed failure if the internal compressive stress is too high. The knowledgeof such failures is at present very limited. There is definitely a need for moreknowledge of a possible time dependence of heat strengthened glass.
It seems to be possible to modify the surface characteristics of glass and increaseits initial strength without heat strengthening. Certain chemical compounds canreact with the glass surface and reduce the flaw density. This may turn out to be analternative to heat strengthening in the future.
5.4 Design methodology
Glass behaves basically as an elastic material. This means that the theory ofelasticity is directly applicable for determining stresses and strains. It can beexpected that all calculations also in the future will be based on the theory ofelasticity. This theory is derived for small strains and corresponding stresses.Consequently this theory cannot be expected to give information about the failurestress. Information about the failure stress for structural materials show that thefailure stress is size, time and temperature dependent. In some cases there will alsobe other dependancies like a humidity dependence. It is therefore natural to expectthat the failure stress for glass exhibit dependencies. These dependencies need tobe addressed if they have a pronounced influence in the failure stress.
Fracture mechanics and stochastic mechanics are methodologies which can beseen as “add on” theories to the theory of elasticity to explain the failure behaviourof glass. Both theories have their advantages as well as drawbacks. This is naturalsince it cannot be expected that there is a “universal” solution which is acceptableto everyone,. In a comparison between fracture mechanics and stochastic fracture mechanics itwill not be possible to present an absolute truth. The question is which theory givesadequate information about how dependencies can be accounted for in a proper way.Modern design philosophy is based on statistical principles where the goal is thatthe failure stress should reflect a certain failure probability. It is therefore anadvantage if appropriate information concerning this issue also can be obtained.
~~
62

-62-
Fracture mechanics is a deterministic method which gives the stress concentrationat the tip of a crack as a function of geometry and loading conditions. This can becompared with a critical value to establish whether a crack will grow or not. Thebasic theory of fracture mechanics assumes that a critical crack exist perpendicularto a tensile stress field. No explicit consideration of a possible size and timedependence is included in the theory.
Cracks in glass are measurable down to a certain level with appropriateequipment. The size and orientation of these flaws can be assumed to be random.For increasing areas which are analysed it can be expected that there will be anincrease in size of these defects. This can of course be accounted for by makingflaw characteristics size dependent. It is very possible that this flaw information canbe characterized with a statistical distribution, perhaps a Weibull distribution. Withthis technique it is possible to estimate the influence of a size dependence. The timedependence can be introduced in a similar way as the size dependence. This wouldreflect a growth of flaws with time which will alter the flaw statisticscharacterization. Alternatively as was done in Chapter 3 where the time dependencewas introduced as an “add on” term. This should make it possible to establishestimates of a “characteristic” value which could be used for design purposes. Instochastic mechanics it is initially assumed that flaw characteristics are size and timedependent and the result is that the failure stress can be characterized with aWeibull distribution. Besides the influence of these flaws depend on the total stressfield within a body or acting on surfaces. The result is directly applicable to bodyshape and loading conditions.
5.5 Research trends and development
During the last 25 years or so there has been an increasing demand for using glassin structural applications. This also include structural glazing where new techniqueshave changed the normal function. Therefore glass manufacturers and other partiesinvolved with the use of glass have been forced to improve their knowledge. Thisis accompanied with the development of new technique to make the supportingstructure to a glass surface as invisible as possible. Some implications are of thisare presented below.
Float glass have properties which seem to be extremely good. At least when itis used as ordinary window panes. The possibility to heat strengthen glass makesit possible to use it in applications where fairly high tensile stresses are present. Butthe existence of impurities within a glass body can cause a delayed failure.
Glass can be surface treated. This is done on a regular basis to improve the u-value. But is also possible to apply surface deposits to improve the strength ofglass. Experiments done at Philips in the Netherlands have revealed that the shortterm strength can be doubled with what seems to be fairly simple methods. This canbe an alternative to heat strengthening. This might affect both the size and timedependence and improve the conditions for structural use of glass.
63 63

-63-
Glass panes with holes seem to be increasingly more popular. Theoreticalsolutions are available but it is not obvious that the basic assumptions are valid fora specific application. The available knowledge has primarily been obtained inconnection with structural applications. The authorities have required full scaletesting which has given information for certain conditions. There is a need for moregeneral knowledge of the influence of bezels of different materials and its influenceon the contact pressure.
Glass which is glued against a steel frame and glass panes with holes willsometimes be subject shear stresses in addition to bending stresses and membranestresses. This is stress conditions which have not been addressed in the analysis ofglass.
Many spectacular projects which have been undertaken over the last decade havein themselves given rise to several questions. It seems as if there is a desire to findnew designs which require new solutions or the development of existing solutions.This will also create new research concerning the structural use of glass.
Above all there is a need for codes to address the question of how a proper designshould be made. Such a code should preferably be a European Code (EC code) toharmonize designs within the common market. This may also require CENstandards to establish strength characteristics of glass. Such a code and CENstandards will require more knowledge of how glass behaves in differentapplications during both short term and long term loading conditions.
64

65
References
Adamsson, B. and Backman, H.E., 1975. Glass in houses (in Swedish), EsselteStudium.
Beason, W.L. and Morgan, J.R, 1980. Glass Failure Prediction Model, Texas TechUniversity.
Carlsson, J., 1982. Fracture mechanics (Brottmekanik in Swedish), IngenjörsförlagetAB, Sweden.
Charles, R. J., Nov 1958. Static Fatigue of Glass I, Journal of Applied Physics, Vol29, No 11, pp. 1549-1553.
Charles, R. J., 1958. Static Fatigue of Glass II, Journal of Applied Physics, Vol 29,No 11, pp. 1559-1560.
Chaunac, M. and Serruys, F., 1997. Glass as a Structural Element, Glass ProcessingDays.
Dahlberg, T., and Ekberg, A., 2002. Failure fracture fatigue.
Elinder, C. and Hellers, B.G., 1994. Glas som konstruktionsmaterial, Avdelningenför konstruktionslära, Arkitektur och stadsbyggnad, KTH.
Fischer-Cripps A.C and Collins R.E, 1995. Architectural Glazing: Design standardsand failure models, Building and environment, Vol. 30, No. 1, pp. 29-40.
Griffith, A.A., 1920. The phenomena of rupture and flow in solids, Phil. Trans.Royal Society of London, Series A, 221.
Gumbel, E.J., 1966. Statistics of extremes, Columbia University Press.
Hassanzadeh, M., 1992. Behaviour of fracrure process zones in concrete influencedby simultaneously applied normal and shear displacements, Division of buildingmaterials, Lund Institute of Technology.
Irwin, G.R., 1957. Analysis of stresses and strains near the end of a crack traversinga plate, Journal of Applied Mechanics.
65

66
Jacob, L., 1997. Factors That Influence Spontaneous Failure in Thermally TreatedGlass-Nickel Sulphide, Glass Processing days.
Jacob, L., 1999. A New Model for the Design of Window Glass Plates UsingFracture Mechanics Concept, Glass Processing days.
Jacob, L., 1999. The designers perspective on NiS inclusions, Glass ProcessingDays.
Jacob, L., 2003. Nickel sulphide inclusions - important issues for the designer, GlassProcessing Days.
Jones, G.O., 1941. The Interpretation of the Experimental data on the Strength ofGlass, The Clarendon Laboratory, Oxford.
Khorasani, N., 2002. Infästning av glasfasader, Bygg och teknik.
Lawn, B., 1995. Fracture of brittle solids, Cambridge Solid State Science Series.
Porter, M., 199. The application of the Crack Size Design method to edge loadedstructural glass members with corner cracks, The University of Oxford.
Porter, M.I. and Houlsby G.T., 2001. Development of crack size and limit statedesign methods for edge-abraded glass members. The Structural Engineer, Vol. 79,No. 8, pp. 29-35.
Minor, J. E., 1974. Window Glass in Windstorms, Civil Engineering Report.
Minor, J. E., 1981. Window Glass Design Practice: A Review, Journal of theStructural Division, vol. 107, No. 1, pp. 1-12.
Norville, S., 2001. Simplified design procedure for blast resistance glazing, GlassProcessing Days.
Norville, S., 2001. Strain measurements in laminated glass, Glass Processing Days.
Ontario Research Foundation, 1981. National Research Council Canada, Ottawa,Ontario. Department of glass and ceramics.
Pilkington,Button, D., Colvin J., Cunliffe, J., Inman, C., Jackson, K., Lightfoot, G.,Owens, P., Pye, B., Waldron, B., 1993. Glass In Building.
66

67
Pittsburg Plate Glass, (PPG), 1979. Glass Thickness Recommendations to MeetArchitects Specified 1-Minute Wind Load, Flat Glass Division.
Ritter, J.E., 1985. Strength and fatigue parameters for soda-lime glass, GlassTechnology, Vol. 26, No. 6.Sentler, L., 1987. A strength theory for viscoelstic materials, Swedish Council forBuilding Research, Stockholm, D9.
Sentler. L., 1997. Reliability of high performance fibre composites, ReliabilityEngineering and Systems Safety, 56, pp. 249 - 256.
Shand, E.B., 1954. Experimental study of fracture of glass: II, Experimental data,Journal of the American Ceramic Society.
Sobek W and Kutterer M, 1999. Designing with glass-strength and loadbearingbehaviour in Glass Construction Manual, Birkhauser.
Stansfield, K., 1999. Glass as a structural engineering material, The StructuralEngineer, Vol. 77, No. 9, pp. 12-14.
Timoshenko, S.P. and Woinowsky-Krieger, S., 1959. Theory of plates and shells,McGraw-Hill.
Timoshenko, S.P. and Goodier, J.N., 1970. Theory of elasticity, McGraw-Hill.
Weibull, W., 1939, A statistical theory of strength of materials, Proceedings RoyalSwedish Institution of Engineering Research, No. 153.
Weibull, W., 1952. A survey of statistical effects in the field of material failure,Applied Mechics Review, No. 5.
Weissmann, R., 1997. Fundemental Properties of Float Glass Surfaces, GlassProcessing Days.
Wiederhorn, S.M., 1967. Influence of Water Vapour on Crack Propagation in Soda-Lime Glass, Journal of the American Ceramic Society, Vol 50, No 8, August.
Wiederhorn, S.M., and Boltz L.H, 1970. Stress corrosion and static fatigue of glass,American Ceramic Society, pp. 543-548.
67

68
7068

1
I IC
t
a
w a
KIC
Y( )
,2 5
2
K KI C
Appendix A
A.1 General
Stress concentration will appear if a local change of dimension takes place forexample when a notch or a crack is present. This means that the stress close to thenotch is larger, and in some cases much larger, than the nominal stress. The stressintensity factor, K, give a measure of the stress singularities at the crack tips. Thefactor f is a function of geometry, (for example the crack length a) and the type ofloading.
In a fracture mechanics experiment, a cracked structure is loaded with anincreasing force until fracture occurs. The value of the stress intensity factor whenthe fracture occurs is supposed to be a material property, i.e. the critical value of thestress intensity factor is considered a material parameter. This parameter is calledthe fracture toughness of the material. Depending on the conditions at the crack tip(plane stress or plane strain) different fracture toughnesses will be obtained.With a known fracture toughness of the material, a fracture criterion can beformulated. Under certain conditions , fracture is expected when
where KIC is the fracture toughness of the material. The above fracture criterion maybe used only when plane deformation (plane strain), exists at the crack tip. Othercriterion that must be fulfilled to ensure plane strain criterion are:
where t is the thickness of the plate containing the crack, a is the crack length and(W-a) is the length of the area connecting the upper and lower part of the crackedstructure. The stress Y is the yield strength of the material.
The condition on plate thickness t is to ensure that the crack tip is loaded in planestrain. The plate must be thick enough so that stress zz can be built up giving strain
zz =0 at the crack tip. The conditions on a and (W-a) are to ensure that only thesingular stress terms dominate at the crack tip.
If the plate thickness t is very small, so that the crack is loaded under plane stressconditions (i.e. zz=0, xx= yz=0), then a fracture criterion may be formulated as:
where KC is the fracture toughness of the material under plane stress conditions.Note that KC KIC.
K K
7169

2
K a f
f
w
a
a
w
a
w
a
w
a
w
I
aw
aw
0 5
5
3
2
0 752 2 02 0 37 12
tan
cos
, , , sin
A.2 Edge crack in a plate in uniaxial tensionThe following relations are valid for uniaxial tension.
7270

3
fa
w
M
tw
fa
w
w
a
a
w
a
w
a
w
0 6
0 2
6
3
6
2
2
2
0 923 0 199 12
t is the thickness of the plate
tan
cos
, , sin
A.3 Edge crack in a plate in bendingThe following relations are valid for bending.
KI
a
71

4
K a f s
sa
r a
f s s s
I 0 3
3
3
0 5 3 1 1 243 1
( )
( ) , ,
A.4 Cracks at a hole in an infinite plateThe following relations are valid for a hole in an infinite plate.
7472

1
Figure B.1 The loading conditions for thebeam.
S e B1
B f dV( )
Appendix B
B.1 General
The “weakest link theory” of strength implies that the strength of a large memberloaded in tension would be equal to the strength of the weakest of small pieces cutfrom the large member.
In the statistical strength theory, the cumulative frequency distribution of strengthis assumed to be a special type - one which lends itself to mathematical developmentof equations for predicting average strengths and standard deviations of strengths.In equation form, the theoretical cumulative frequency curve is expressed as
where S is the theoretical cumulative frequency and B is given by
which is the function of stress, f( ) integrated over the volume element dV on whichit acts. The function of stress f( ) is a function expressing the local probability offailures. This is dependent on the local stress level and hence varies throughout thevolume of a bending member.
B.2 Volume under stress in bending
73
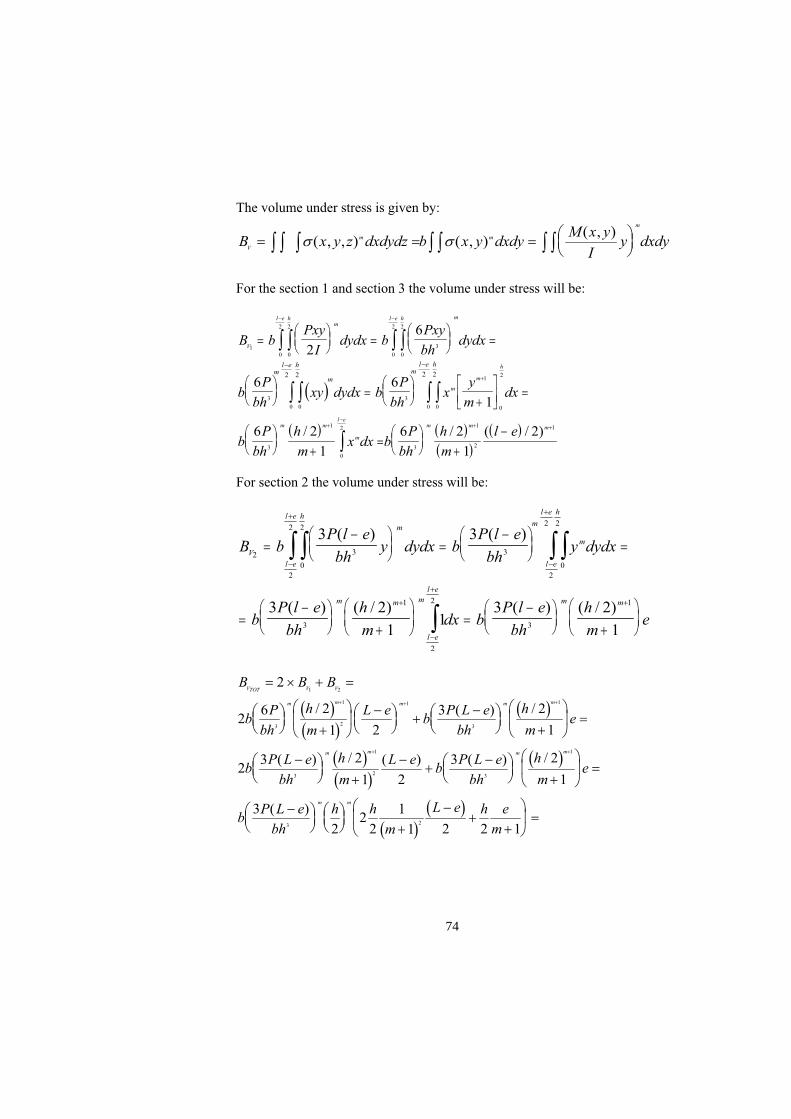
2
B x y z dxdydz b x y dxdyM x y
Iy dxdy
V
m m
m
( , , ) ( , )( , )
B bPxy
Idydx b
Pxy
bhdydx
bP
bhxy dydx b
P
bhx
y
mdx
bP
bh
h
mx dx b
V
mhl e hl e m
mhl e
mm
m
m
hhl e
m m
m
l e
10
2
0
2
3
0
2
0
2
3
0
2
0
2
3
1
0
2
0
2
0
2
3
1
0
2
2
6
6 6
1
6 2
1
6/ P
bh
h
m
l em m m
3
1
2
12
1
2/ ( / )
B bP l e
bhy dydx b
P l e
bhy dydx
bP l e
bh
h
mdx b
P l e
bh
h
m
V
m
h
l e
l em
m
h
l e
l e
m m m
l e
l e
m m
2 3
0
2
2
2
3
0
2
2
2
3
1
2
2
3
1
3 3
3 2
11
3 2
1
( ) ( )
( ) ( / ) ( ) ( / )e
B B B
bP
bh
h
m
L eb
P L e
bh
h
me
bP L e
bh
h
m
L eb
P L e
bh
h
m
VTOT V V
m m m m m
m m m m
2
26 2
1 2
3 2
1
23 2
1 2
3 2
1
1 2
3
1
2
1
3
1
3
1
2 3
1
/ ( ) /
( ) / ( ) ( ) /e
bP L e
bh
h h
m
L e h e
m
m m
3
22
2
1
1 2 2 13 2
( )
The volume under stress is given by:
For the section 1 and section 3 the volume under stress will be:
For section 2 the volume under stress will be:
7674

3
Figure B.2
3
2 1 2
1
2
3
2 1 2
3
2 1 21
3
2 1 21
2 2
2 2
2 2
2 2
P L e
bh
b
mh
L e h me
P L e
bh
b
m
hL e e m e
P L e
bh
b
m
hL e
L
e m
L
e
L
P L e
bh
b
m
hL e
Lm
m
m
m
m
( )
( )
( )
( )
BbhL
m
e
Lm
P L e
bh
P L e
bh
m c
B bhLc
e
Lm
m
m
m
2 11
3
2
3
21
2 1
1
1
2 2
2
2
0
0
Further evaluation will simplify the obove expression to:
B.3 Evaluation of results from Carré (1996)
Test results from Helène Carré:
75

4
Figure B.3
B
P
Load stress
B
P
f
f
2 0 0 4 0 00614
17 741
0 5
28 0 002
0 002
2
2 0 0 4 0 00628
17 741
0 5
28 0 55
0 426
8
8
, , ,,
,,
,
,
, , ,,
,,
,
P e e e
B Bc
c MPa
f
BVTOT BVTOT BVTOT
VTOT VTOT
1 0 5 1 0 5
0 5 0 230 0 0375 0 019418
11
28 0 695
17 74
0
8
0
, ,
ln , , , ,,
,
,
e m
B
P
Load
B
P
f
f
1
2 0 0 4 0 00614
17 741
1
28 0 0036
0 0036
3
2 0 0 4 0 00642
17 743 14 21
1 000
8
8
, , ,,
,
,
, , ,,
,
,
The example of beam in chapter 4:
Calculation techniques for failure probabilities:
7876

5
B x z dzdxM x
I
hdzdx
Px
I
hdzdx
Px
bh
hdzdx
Px
bhdzdx b
P
bh
x
m
b
A
b
l e m
b
l e m
b
l e m
b
l e m
b
l e mm
ml e
100
2
00
2
00
2
3
00
2
2
00
2
2
1
0
2
2 2 2
2
12
2
3 3
1
3
*( , )
( )
P
bh
l e
mb
P
bh
l e
m
m
m
m m
2
1
2
1
2
1
3
2
1
1
P B
B
f0 05 0 0513
2 0 0 4 0 00617 74
3
20 79
8
, ,
, , ,,
,
MPa
B x y dydxM x
Iy dydx
Px
Iy dydx
P
Ix dx y dx
P
I
x
m
y
m
P
I
A
hl e m hl e m hl e m
m
m m
hl e
m ml e
mh
10
2
0
2
0
2
0
2
0
2
0
2
0
2
0
2 1
0
2
1
0
2
2
2 2 1 1 2
** ( ,( )
m
m m
m
m m
m
m
m
l e
m
h
m
P
bh
l e
m
h
m
P
bh
l e h
m
P
bh
l eh
2
1
2
1
2
12 2
1
2
1
6 2 2
1
6 4
1 1
3
1 1
2
1
2 2
m
m
1
21
B.4 The area under stress
The area under stress is evaluated for each section and area under tensile stress. Forthe sections 1 and 3 this can be expressed as
where the notation * refers to the the bottom and ** refers one side. Theseexpressions are valid for 0 x (l - e)/2 and (l + e)/2 x l. The correspondingexpressions for section 2 are
77

6
B x y z dxdzP l e
bhe b
A
b
l e
l e mm
22
02
2
2
3
2*( , , ) ..... *
B x y z dxdyP l e
bh
h e
mA
h
l e
l e m
m m
20
2
2
2 1
3
3 2 1**( , , ) .....
( )
B B BATOT A A* * *
21 2
B B BATOT A A** ** **
2 21 2
B B BATOT ATOT ATOT
* **
BP l e
bh mb l e m eb m h l e h e m
c m
BP l e
bh cb l e m eb m h l e h e m
P e B
ATOT
m
m
A
m
ATOT
A
m
m
f
BATOT
ATOT
3
2
1
11 1 1
1 1
1
3
21 1 1
1
2 2
2 1
0
2
2
0
2 1
( )( )( ) ( ) ( ) ( )
( )( )( ) ( ) ( ) ( )
ln
( )( )( ) ( ) ( ) ( ) ln( )
................. ,
1
3
21 1 1 1
35 3
2
0
2 1
0
P
P l e
bh cb l e m eb m h l e h e m P
c MPa
f
A
m
m
f
A
where * refers to the bottom and ** refers to a side. The expression is valid for (l -e)/2 x (l + e)/2. The total area under stress is derived from
This results in the following expression for the total area under stress
8078

7
P l e
bh cb l e m eb m h l e h e m
A
m
m3
21 1 1
2
0
2 1( )( )( ) ( ) ( ) ( )
3 6 10 2 0 5
2 0 006 0 400 35 3 100 006 2 0 5 8 1 0 50 0 006 8 1 0 400 2 0 5 0 400 0 5 8 1
3
2 6
8
2 8 1( , )
, , ,, ( , )( ) , , ( ) , ( , ) , , ( )
B
P e e
ATOT
f
BATOT
6 79 10
1 1 0 00063
4
6 79 10 4
,
,( , )
B
B
ATOT
ATOT
79

8280