design of reactor for modeling of heat transfer and ...720776/fulltext01.pdf · design of reactor...
TRANSCRIPT

Design of Reactor for Modeling of Heat
Transfer and Kinetics in Biomass Tar
Reforming
SEYEDEH ZAHRA MUSAVI
Master of Science Thesis in Chemical Engineering
Stockholm, Sweden 2013

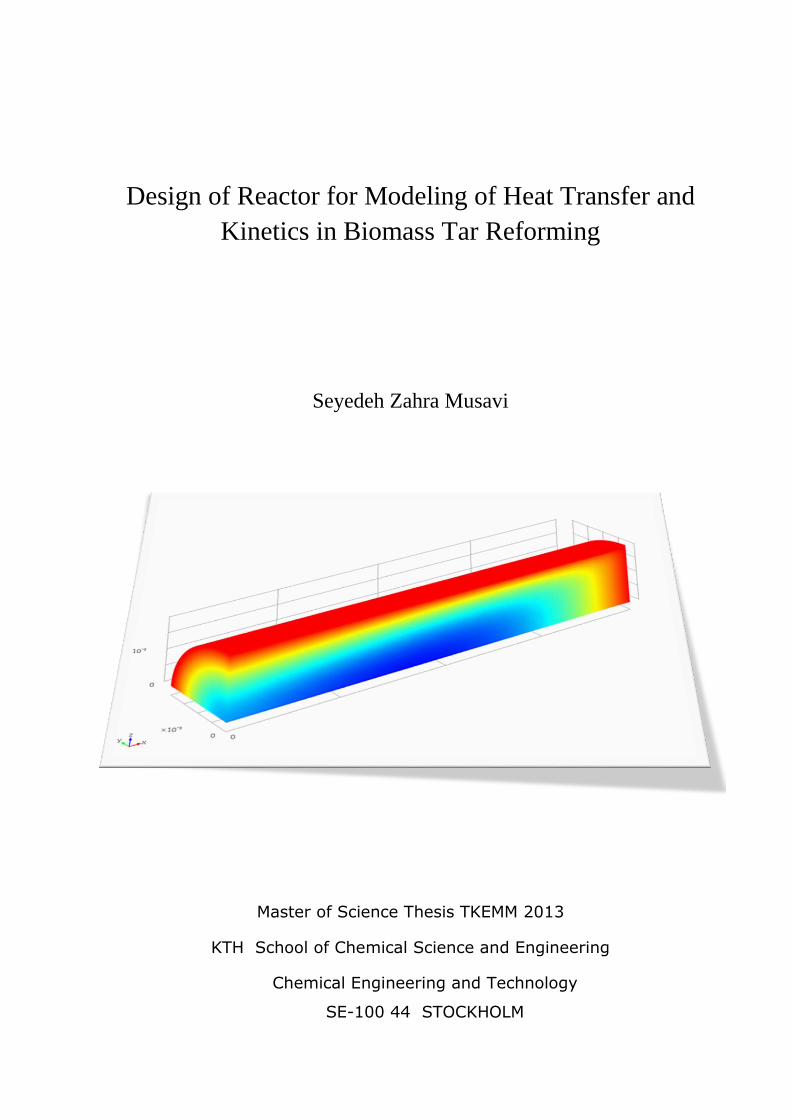
Design of Reactor for Modeling of Heat Transfer and
Kinetics in Biomass Tar Reforming
Seyedeh Zahra Musavi
Master of Science Thesis TKEMM 2013
KTH School of Chemical Science and Engineering
Chemical Engineering and Technology
SE-100 44 STOCKHOLM


Abstract The presence of tar or heavy hydrocarbons in biomass gasification product gas may cause
several problems for downstream equipment. Therefore, removal of tars or conversion to lighter
components such as H2 and CO is one of the most important processes in the cleaning-up of
gasification product gas. One effective method for accomplishing this is by steam reforming of
the product gas over a proper catalyst like Ni-based catalysts.
Conventional catalysts for steam reforming of hydrocarbons are pellets with several holes inside.
In recent years, much research has focused on the application of monolithic catalysts for biomass
gas tar reforming because monoliths have shown successful performance for automobile exhaust
gas catalytic cleaning purposes and have several advantages compared to packed beds.
Monoliths have a more mechanically-stable structure, lower pressure drop and therefore lower
energy loss and higher conversion, do not have channeling problems that may occur in packed
bed reactors, have a higher porosity, and they offer less weight which enables faster warm-up of
the catalyst.
In the present study, the kinetics and heat transfer features of tar reforming reactors are modeled.
The work was carried out at the Dept of Chemical Engineering and Technology, at KTH. This
work is performed by Seyedeh Zahra Musavi as her final project work toward Master of Science
diploma (MSc).
In the modeling work, the compound naphthalene was chosen as the model component for tar.
By applying an overall naphthalene conversion model and temperature drop behavior, the effects
of empirical and design parameters on kinetics, tar conversion, and temperature profile in the
whole reactor were studied.
The modeling was performed in two parts. The first part focused on kinetic studies, investigating
effect of inlet gas temperature and kinetic constant on the overall conversion. Then the
conversion equation was combined with a pressure drop equation in the packed bed (to evaluate
the higher pressure drop effect) that reduces the naphthalene conversion at the reactor outlet. The
first study also suggested an inter-stage heating design to compensate for the heat loss of the
process due to the endothermic nature of reforming reactions. The equations of the first part were
solved using MATLAB programming.
A three dimensional monolithic reactor was modeled in the second part of the report, combining
all transport phenomena and applying them for one fourth of the reactor as input geometry.
Initially, adiabatic cases were modeled and the results compared to existing empirical data,
showing good prediction for conversion, but lower temperature drop results. Then effect of two
different heat generations: (1) heating from the outer wall of the reactor and (2) heat generation
at the center of the monolith were studied. Metal and ceramic monolith materials were used. The
results showed a better heat distribution with metal. However, cold points were found at the
middle of the reactor in this case. Heating from the center of the monolith was more effective on
the uniformity of conversion at reactor outlet and on preventing formation of cold points in the
reformer. Model 2 was simulated using the COMSOL Multiphysics program.
Results showed that more than 70 % tar conversion could be achieved with monolith reactors.
Metallic monoliths give a more uniform distribution of heat in the reactor. Applying heat at the
center of the monolith could maintain temperature above 800°C to reduce or avoid the formation
of Whisker-type coke.


Acknowledgements
I would like to express my very great appreciation to Professor Klas Engvall and Professor Lars
J. Petterson, my supervisors that patiently supervised this project, encouraged me in all steps and
made constructive suggestions during the planning and development of this research work.
My special thanks are extended to academic staff at Chemical Engineering and Technology
division that helped me with different parts of the thesis. I am particularly grateful for the
assistance given by Truls Liliedahl on kinetic studies. I would also appreciate the help that the
technical staff at gasification center, especially Christer Rosén, assisted me with previous
gasification gas analysis results and discussions on process design.
I would like to thank KTH’s PDC ‘Center for High Performance Computing’ for access to their
Ferlin parallel computers.
My special thanks are extended to COMSOL Group for their support service and two workshops
I attended in Stockholm.
I also appreciate my friends and classmates; I would especially thank Bahareh Farahani, Pirouz
Shahkarami, Hugo Royen, Ramiar Sadegh Vaziri, and Stephen Darling who spend time for
discussions at different parts of my work.
Finally I wish to thank my husband, Taghi Akbari for his support and encouragement throughout
my thesis.
Seyedeh Zahra Musavi
Stockholm, March 2013


Notations
Symbol Description Unit
Kinetic constants in different kinetic models , s-1
, s-1
A Cross sectional area m2
a1 – a7 Polynomial coefficients given for each specie to
calculate its thermodynamic properties
Tar concentration at inlet mg m
-3
Average heat capacity of the gas J kg-1
K-1
Cp,i Heat capacity of specie i J mol-1
K-1
, Naphthalene concentration, H2 concentration mol m
-3
Diffusivities m2 s
-1
Dp Diameter of particle in packed bed mm
Initial molar flow of component A mol s-1
Initial total molar flow mol s-1
Molar flow rate of specie i mol s-1
G Superficial mass velocity (ρu) kg m-2
s-1
hi The species’ molar enthalpy J mol-1
Heat of reaction j J mol-1
Keq Equilibrium constant
Kf Equilibrium constant for forward reaction (Table 7)
Equivalent thermal conductivity of solid-gas W m-1
K-1
, , and Thermal conductivity of monolith, fluid gas and
wall material, respectively
W m-1
K-1
Rate coefficient for different kinetic models as defined in Table 6
M Molecular weight of species g mol-1
Total gas mass flow rate kg h-1
ndry Total molar flow dry gas mol s-1
ni Molar flow rate of component i
i= CO2, CO, H2, etc
mol s-1
nwet Total molar flow rate of wet gas mol s-1
The species’ molar entropy J mol-1
K-1
Heat due to chemical reaction J m-3
s-1
Inlet gas flow rate m3 h
-1
Heat added to the system per unit volume J m-3
s-1
R Ideal gas constant J K−1
mol−1
Net reaction rate of specie i mol m-3
s-1
Reaction rate mol m-3
s-1

Symbol Description Unit
Reaction rate for reaction mol m-3
s-1
, Reaction rates as defined with related coefficients
given in the Table 7
mol kg-1
s-1
T Temperature K
Temperature at inlet K
Parameter as defined in Equation 9 K
u Superficial velocity m s-1
V Channel/reactor volume m3
W Weight of the monolith kg
X , Tar conversion 1
yi Fraction of component i in the gas flow 1
Fraction of component i reacts in the jth reaction 1
z Length down the bed m
Z Parameter used in Keq equation (a function of
temperature)
1
Constants defined in Ergun equations
Void fraction 1
σ Characteristic Lennard-Jones length °A
Porosity of solid 1
Characteristic Lennard-Jones energy
μ Viscosity of gas kg m-1
s-1
Collision integral function of
Gas density, solid catalyst particles density kg m
-3
Space time of the gas in monolith=
kg h m
-3
Abbreviations
1D, 2D, 3D One, two, and three dimensional
AC(s) Activated Carbon(s)
CPSI, cpsi Cell per square inch
GHSV Gas Hours Space Velocity
GSA Geometric Surface Area
IC Internal combustion engines
O&M Operation and Maintenance
OFA Open Frontal Area
WGS Water-Gas Shift reaction

Table of Contents
1 Introduction 1
1.1 Tar 1
1.2 Tar Control Technologies 3
1.3 Catalytic Steam Reforming 3
1.3.1 Catalytic Steam Reforming of Biomass Tars 4
1.4 Reaction Mechanism and Kinetics 5
1.5 Purpose 10
1.6 Delimitation 10
2 Method 11
2.1 Model 1- Kinetic Reaction Modeling 12
2.1.1 Input Gas Composition 12
2.1.2 Governing Equations 13
2.2 Model 2-Whole Monolithic Reactor Modeling 17
2.2.1 Model Geometry and Input Data 20
2.2.2 Thermodynamic and Transport Properties of Material 21
2.2.3 Governing Equations 23
2.2.3.1 Mass Transport 23
2.2.3.2 Flow Transport 24
2.2.3.3 Heat Transport 24
3 Results and Discussion 26
3.1 Model 1-Results and Discussion 26
3.1.1 Conversion and Temperature Profiles along Bed 26
3.1.2 Pressure Drop 28
3.1.3 Multi-stage Monolithic Reactor Set-Up 29
3.2 Model 2-Results and Discussion 31
3.2.1 Case 1-Adiabatic,Steady State Monolith 31
3.2.2 Case 2-Heating from Reactor Wall 34
3.2.3 Case 3-Metal Monolith Support 37
3.2.4 Case 4-Heating from the Center of the Reactor 39
4 Conclusions and Future Work 42
4.1 Conclusions 42
4.2 Future work 43
5 References 44 6 Appendices 47
Appendix I- Existing Pilot Plant Tar Reformers 47
Appendix II- Kinetic Study Results with Three Reactions 50
Appendix III- Polynomial Coefficients Data 51
Appendix IV- Properties of Metallic Monolith Material 52
Appendix V-Heating from Half of the Reactor 53
Appendix VI-Digital Appendices 54


1
1 Introduction
Biomass gasification is a route to convert solid feedstock such as plant matter, grasses and
agricultural crops into energy gas mixtures. It is in line with the global sustainable technology
developments since the energy content of biomass is a potential renewable energy source and
also attracts more attention when the prices of the fossil fuels and even biofuels rise. (Devi,
Ptasinski, & Janssen, 2003).
The gasification of biomass follows a thermo-chemical partial oxidation process at elevated
temperatures in the presence of a gasifying agent (air, oxygen, steam, CO2, or mixtures of these
components) and produces a combustible gas mixture called product gas. The product gas is
mainly a mixture of CO, CH4, H2, CO2, H2O, N2 (when air is used as the gasifying agent), and
some higher hydrocarbons (C2-C4, etc.). But it also contains other products and pollutants that
need to be cleaned and treated to satisfy the requirements of the desired clean gas application.
Figure 1 shows the basic process steps of the complete gasification system consisting of fuel
pretreatment, gasification process, product gas cleaning, and gas utilization units. The main
contaminants of the product gas are nitrogen, alkali metals, particulates and tars (Abdul Salam,
Kumar, & Siriwardhana, 2010).
Figure 1.Basic process steps of a multi-stage gasification system (Richardson, Blin, & Julbe, 2012)
1.1 Tar
As a definition on tar measurement protocol, agreed in the EU/IEA/US-DOE meeting in Brussels
in 1998, tar is a mixture of the all organic contaminants with a molecular weight higher than
benzene (Knoef, 2005). Tar is a mixture of various hydrocarbons and in most of the research
studies one component is selected as the model tar compound. Benzene, toluene, phenol, and
naphthalene have been considered as model component in the research. Table 1 shows the
properties of these model tar components.

2
Table 1. Properties of the common model tar components (Xu, Donald, Byambajav, & Ohtsuka, 2010)
Component Properties
Benzene A stable aromatic structure, formed in high-temperature processes
Toluene A stable aromatic structure, formed in high-temperature processes, less severe
catalyst deactivation due to charring and much higher hydrocarbon conversion
Phenol The major tar compound from processes at temperatures lower than 800°C
Naphthalene The major single compound in tars at a temperature of 900°C.
Tars are unwelcome because they can cause several problems in the process equipment, as well
as engines and turbines used in the application of the produced clean syngas. They can
condensate in the cold spots and compressors of downstream applications, block pipelines, foul
engines and turbines, clog filters and valves, and polymerize to complex structures. All this can
lead to operation and maintenance (O&M) problems and increase the O&M costs. Tars are also
dangerous because of their carcinogenic nature. Moreover they contain a considerable amount of
energy that can be utilized after transferring to the fuel gas as hydrogen, methane, carbon
monoxide, etc. (El-Rub, Bramer, & Brem, 2004).
The tar content of product gas depends on the type of gasifier, gasification temperature, and
feedstock composition. Generally, it is in the range of 0.5 to 100 g Nm-3
in various gasification
systems.
The tar tolerance limits are very dependent on the final application of the gas. For instance, gas
engines require fuel with tar content of less than 5 mg Nm-3
(Richardson, Blin, & Julbe, 2012),
while internal combustion (IC) engines can tolerate up to 100 mg Nm-3
(Anis & Zainal, 2011).
Tables 2 and 3 give some examples of tar tolerance and tar content values for different
applications and gasifier types (Basu, 2010).
Table 2.Upper limits of biomass gas tar
Application Tar (mg Nm-3
)
Direct combustion No limit specified
Syngas production 0.1
Gas turbine 0.05–5
IC engine 50–100
Pipeline transport 50–500 for compressor
Fuel cells <1.0
Table 3.Typical levels of tar in biomass gasifier by type
Gasifier Type Average Tar Concentration
in Product Gas (g Nm-3
)
Downdraft <1.0
Fluidized bed 10
Updraft 50
Entrained flow Negligible

3
1.2 Tar Control Technologies
Gasification tar removal options may be divided into two broad categories: (1) the primary (or
in situ), and (2) secondary (post-gasification) methods, as shown in Figure 2a and b,
respectively. Primary methods are the management of tars during gasification to limit tars
formation or to convert them in the gasifier. It can be done by proper design of the gasifier, use
of a bed additive or catalyst and optimizing the operation conditions of gasification (Devi,
Ptasinski, & Janssen, 2003). Primary methods could be ideal solutions but they are not fully
understood or commercialized. They were not fully successful in practice, because they made the
gasifier operation more complex and had low tolerance for feedstock flexibility and scale-up.
Secondary tar removal methods are those employed after the gasification. This group could be
divided into the following treatment methods (Anis & Zainal, 2011):
Physical/mechanical treatments like cyclones, scrubbers, filters, granular beds, rotating
particle separators, and electrostatic precipitators
Thermal treatment including thermal cracking and plasma cracking
Catalytic cracking/reforming
Figure 2.(a) In situ tar reduction. (b) Post-gasification tar reduction
Physical methods attract less interest since they transfer tars to another liquid or solid phase
which requires a further purification step. In addition, the chemical energy of the tars is not
recovered in this way. Thermal treatment methods have a lower overall process efficiency
because of high temperature requirements (higher than 1000°C), long residence time and soot
formation. On the other hand, catalytic reforming can effectively reduce the tar content of the
product gas in temperatures close to gasification temperature. It also converts the energy content
of tars into valuable synthesis gas components (Richardson, Blin, & Julbe, 2012).
1.3 Catalytic Steam Reforming
Catalytic steam reforming is widely used to produce hydrogen from light hydrocarbons, naphtha,
alcohols, and other fossil based materials. It consists of reactions with steam, over a proper
catalyst, at elevated temperatures and pressures. The temperature ranges from 200 to 900°C and
the pressure between 1 and 30 atm. The product is a stream of gas containing H2, CO, and CO2.
The early study works, patenting, and detailed publications were done between 1817 and 1930,
when the first industrial plant for steam reforming of natural gas commissioned at Baton Rouge,
Louisiana, USA. The world’s first large scale pressurized steam reformer with naphtha feed
started in 1962 by ICI Corp. It included two tubular reformers operating at around 15 atm. The
technology was licensed and developed at around 400 other plants worldwide. Other

4
technologies for naphtha reforming are the Topsoe reformers that operate at higher pressures
(20 atm) and British Gas Council that reforms naphtha adiabatically (the CRG process). Lurgi
and JPC developed similar adiabatic technologies (Rostrup-Nielsen, 1984). However, most of
the reformers in the past 30 years were designed to reform methane (Taskın, 2007). Today,
nearly 90 % of the global hydrogen is produced by steam reforming of natural gas and light
hydrocarbons.
The process reforms a liquid stream of hydrocarbons to produce a gaseous mixture consisting of
CO2, CO, CH4, and H2. The conversion takes place on surface of solid catalyst (usually Ni based
supported on aluminum oxide with alkali metal additives).
Typically, catalysts are in the form of cylindrical pellets, tablets, or spheres that been placed in
the reformer tube which is called fixed bed or packed bed reformer. Since the catalysts are
dumped randomly into the reactor, there is a relatively high pressure drop as the gas flows
through the reformer. The catalyst tubes were usually heated up by huge top-/side-fired furnaces
(Chen, Xu, Wang, & Xiong, 2006).
The problem with the process is the carbon formation and catalyst deactivation which depend on
the kinetics of the reactions and affected by the hydrocarbon type, operating parameters, and the
catalyst characteristic. That is why the characteristics of catalyst in this process should have the
following properties: high mechanical and thermal stability, high catalytic activity and selectivity
towards preferred products, and high resistance to carbon formation (Melo & Morlane´s, 2005).
Steam is needed not only for reaction, but also to prevent the conversion of carbon monoxide to
coke:
2CO ↔ CO2 + C Boudouard’s equilibrium (1)
This is then replaced by the water-gas shift (WGS) reaction.
Although thermodynamically, reactions are favored at low pressure, but to obtain high hydrogen
purity the process is normally carried out at high pressure. Typical Operating Conditions are:
Steam /carbon ratio: 2 to 4 (2-3 times higher than the stoichiometry)
Temperature: 850 – 940°C
Pressure: 15-40 atm
1.3.1 Catalytic Steam Reforming of Biomass Tars
Most of the tar reforming studies have been done in very small laboratory scale fixed bed or
packed bed tube reactors under very low gas space velocities and without investigation of the
bed pressure drop, temperature profile, nor the mechanical properties of the catalyst (Xu,
Donald, Byambajav, & Ohtsuka, 2010). There are some pilot plant Ni-monolith tar reformers
(Knoef, 2005) in Germany, Finland and the Netherlands. Appendix I summarizes the existing
information on these plants.
There are different types of catalysts used for tar removal. One could classify them as the
following (Xu, Donald, Byambajav, & Ohtsuka, 2010):
Dolomite catalysts like un-calcined and calcined dolomites (MgO–CaO) are inexpensive
catalysts which have shown very good tar removal efficiency in several experiments.
They have also shown better performance when modified by adding Fe2O3 powder. The
drawbacks of using these catalysts are their low mechanical strength in fluidized bed
reformers and the poor reforming ability for complex poly-aromatic hydrocarbons
(PAHs) formed in air-blown gasifiers. The mechanical strength could be improved by
using the catalysts on monolith support materials.

5
Iron-based catalysts such as olivine (a natural mineral containing magnesium, iron, and
silicon in the form of either Fe2SiO4 or Mg2SiO4), limonite (a natural iron ore with a high
iron content), iron oxides (FeO, Fe2O4, Fe3O4, and Fe2O3), ankerite (CaFe(CO3)2 as a
ferrous dolomite), sintered iron ore, and pelletized iron ore have been investigated in
different studies, displaying different levels of tar reforming.
Nickel and other noble metal based catalysts (Ni, Ru, Rh, Pd, or Pt on CeO2, SiO2 and
Al2O3 supports), nickel based catalysts have been employed in petrochemical plants and
shown a very good tar and ammonia decomposition performances. Ni/Al2O3 is compared
with other catalysts in some experiments and has shown nearly full reforming results for
tar and light hydrocarbons at higher than 800°C. The only problem is the fouling of
catalyst by carbon and H2S decomposition deactivating the catalyst. To prevent this,
steam could be added to the product gas to gasify the accumulated coke/carbon that is the
basis of catalytic steam reforming processes. Whisker carbons also form by dissociation
of carbon monoxide, methane and higher hydrocarbons over metals (Helveg, Sehested, &
Rostrup-Nielsen, 2011).
Carbon supported catalysts, activated carbons (ACs), have been widely used as catalyst
supports for tar and hydrocarbon reforming purposes. AC has very high adsorption
selectivity to some heavy hydrocarbons like toluene. They are also very resistant to
deactivation by deposition of coke and heavy metals.
Catalysts could be produced as traditional cylindrical pellets, tablets and spheres, or as more
recent forms called monoliths. Monolithic catalysts consist of uniform parallel channels made of
a support material like ceramics that been coated by active catalyst. Flow through these
structured channels reduces the pressure drop and prevents the “short circuiting” or “channeling”
of gas flow which is a problem in the conventional catalysts. Monolithic catalysts have been
used successfully in automotive industry for exhaust gas treatment purposes. There are no
references showing the use of these catalysts in steam reforming of methane or naphtha.
However research in this field is growing (Mathure, Patwardhan, & Saha, 2012).
1.4 Reaction Mechanism and Kinetics
The reaction sequence based on the adsorption-dissociation of hydrocarbons and steam like the
general catalytic reactions mechanism that is shown in Table 4 and Figure 3.
Table 4. Steps in a catalytic reaction (Fogler, 2011)
1. Mass transfer (diffusion) of the reactant(s) (e.g., species A) from the bulk fluid to the
external surface of the catalyst pellet
2. Diffusion of the reactant from the pore mouth through the catalyst pores to the immediate
vicinity of the internal catalytic surface
3. Adsorption of reactant A onto the catalyst surface
4. Reaction on the surface of the catalyst (e.g., A → B)
5. Desorption of the products (e.g., B) from the surface
6. Diffusion of the products from the interior of the pellet to the pore mouth at the external
surface
7. Mass transfer of the products from the external pellet surface to the bulk fluid

6
Figure 3. Steps in a heterogeneous catalytic reaction (Fogler, 2011)
Because of the complexity of the gasification product gas, several sequential and parallel
reactions may occur. For instance, the following Table 5 shows some possible reactions in a
biomass tar steam reforming with toluene as the model component:
Table 5. Possible reactions of hydrocarbons in gasification gas clean-up using toluene as a model hydrocarbon
(Rönkkönen, Simell, Reinikainen, Krause, & Niemelä, 2010)
Reaction Equation (kJ mol
-1)
Steam reforming C7H8 + 7H2O → 7CO + 11H2
C7H8 + 14H2O → 7CO2 + 18H2
927
695
Steam dealkylation C7H8 + H2O → C6H6 + CO + 2H2
C7H8 + 2H2O → C6H6 + CO2 + 3H2
175
142
Hydrocracking C7H8 + 10H2 → 7CH4 -653
Hydrodealkylation C7H8 + H2 → C6H6 + CH4 -54
Dry reforming C7H8 + 7CO2 → 14CO + 4H2
C7H8 + 11CO2 → 18CO + 4H2O
1159
1291
Thermal cracking nC7H8 → mCxHy + pH2 -
Carbon formation C7H8 →7C + 4H2 -23
Partial oxidation C7H8 + 5.5O2 → 7CO + 4H2O -1810
Oxidation 2CO + O2 → 2CO2
2H2 + O2 → 2H2O
C7H8 + 9O2 →7CO2 + 4H2O
-564
-498
-3783
Water–gas shift CO + H2O ↔ CO2 + H2 -33

7
Reaction Equation (kJ mol
-1)
Methanation
(homogeneous)
CO + 3H2 ↔ CH4 + H2O -227
Water gas C + H2O ↔ CO + H2
C + 2H2O ↔ CO2 + 2H2
136
103
Boudouard CO2 + C ↔ 2CO 168
Methanation
(heterogeneous)
C + 2H2 ↔ CH4 -91
Ammonia synthesis N2 + 3H2 ↔ 2NH3 -112
General form of reforming reactions for hydrocarbons over Ni- catalysts could be formulated as
the following three reactions (Wang, Wang, Ma, Gao, & Wu, 2010):
CnHm + nH2O → nCO + (n+
)H2 Steam reforming (2)
CnHm + nCO2 → 2nCO +
H2 Dry reforming (3)
CnHm + 2nH2O → nCO2 + (2n +
)H2 Steam reforming (4)
The desired steam reforming reaction for naphthalene as the tar component is:
C10H8 + 10H2O → 10CO + 14H2 (5)
It should be noted that this is not a real reaction but a result of many sequences of reactions
written in this way to simplify the understanding. For instance, naphthalene is first converted to
lower hydrocarbons and then cracked to products, as it is seen from the following Figure 4.
Figure 4. Naphthalene conversion path (Wang, Wang, Ma, Gao, & Wu, 2010).
Other reactions, such as water gas shift (WGS) and CO-methanation (6, 7), could also occur at
the same time.
CO + H2O ↔ CO2 + H2 (6)
CO + 3H2 ↔ CH4 + H2O (7)
Reaction 5 is a strongly endothermic and irreversible reaction. Reactions 6 and 7 are exothermic
reversible reactions.

8
The composition of the product gas is affected by thermodynamic equilibrium according to the
operating parameters like pressure, temperature, space velocity, and steam/carbon ratio.
The principals of kinetic analysis are the same for monolith and packed bed reactors. However,
because of the higher reaction rates in the monolithic structures, the reactions are mass transfer
controlled; that is the transfer of reactants from the flowing gas to the monolith wall is the
limiting factor.
Most of the kinetic studies and experimentation reported in scientific articles use an overall
kinetic model for tar conversion, including the effect of the all other reactions and parameters.
The following Table 6 lists three rate equations proposed for naphthalene steam reforming.
Table 6. Summary of some kinetic models reported for naphthalene steam reforming process
Model reference Kinetic expression
Jess (Jess, 1996)
Catalyst: Ni-MgO
CN =naphthalene concentration
(
)
Devi (Devi, Ptasinski,
& Janssen, 2005)
Catalyst: olivine
(
)
Correla (Corella,
Toledo, & Padilla,
2004)
Catalyst: Ni/α-Al2O3
(
)
(depends on the specific
catalyst used and process conditions)
Separately, the kinetics of other reactions could be found from other studies, as summarized for
the WGS and the CO-methanation reactions, as shown in Table 7.

9
Table 7. Summary of some kinetic models reported for WGS and CO-methanation reactions
CO + H2O ↔ CO2 + H2 (6)
CO + 3H2 ↔ CH4 + H2O (7)
Ni based catalysts of
Holder Topsoe for
steam reforming
methanation (Said
Elnashaie, 2007)
(mol kg
-1 s
-1)
(mol kg
-1 s
-1)
(kmol.kPa-1
kg-1
h-1
)
(kmol.kPa0.5
kg-1
h-1
)
dimensionless
(kPa2)
(kPa-1
)
(kPa-1
)
(kPa-1
)
(kPa-1
)
Moe Kinetic Model,
(Byron Smith,
Muruganandam, &
Murthy Shekhar,
2010)
WGS
r = k PCO PH2O [1– (PCO2 PH2 / Keq PCO PH2O)](mol g-1
min-1
)
Equilibrium Constant, Keq =exp (4577.8 / T - 4.33)
Rate constant k =A2 exp(12.88 -1855.5 / T) (mol g-1
min-1
)
A2=1.85 10-5
Pi is partial pressure of species (bar)
Equilibrium constants
(Falbe, 1977)
WGS:
Kf = exp(Z(Z(0.63508 - 0.29353Z) + 4.1778) + 0.31688)
CO-methanation:
Kf = exp(Z(Z(Z(0.2513Z - 0.3665) - 0.58101) + 27.1332) - 3.277)
Z = (1000 / T)-1
T = temperature (K)

10
1.5 Purpose
This report aims at design of a reforming reactor for tar by modeling the kinetics and heat
transfer of a catalytic steam reforming reactor for biomass gasification product gas. Typical inlet
gas composition was taken from an analysis of product gas from tests in a fluidized-bed
gasification plant at KTH where birch was used as a fuel. Steam/oxygen and nitrogen was used
as gasifying and fluidizing agent, respectively. Gas compositions from published references have
been considered for comparison reasons too.
According to the available kinetics reviewed in the previous part, it can be seen that the existing
models are based on the naphthalene overall conversion (Table 6) without details about the
ongoing reactions. Among those models, Corella’s model was chosen to be used because besides
including an overall naphthalene conversion equation, it also suggests an overall temperature
drop model that could be used for modeling of the temperature profile.
It should be mentioned that during this project, several designs were developed based on
combining group of reactions together, but because there were no kinetic model for such a group
of reactions, based on naphthalene and Ni based catalysts, the obtained results were not reliable
and the results are not included in the report. An example of such modeling could be found in
Appendix II, where three reactions (5-7) are used for kinetic studies: Devi’s kinetic model from
Table 6 was used for naphthalene steam reforming reaction and equilibrium constants (Falbe,
1977) from Table 7 were used for WGS and CO-methanation reactions.
1.6 Delimitation
Since the kinetic model does not describe the concentration of other components in the gas, the
composition of gas at the reactor outlet could not be predicted with this method. Nevertheless, it
can be used to predict the overall naphthalene conversion.
Catalyst deactivation mechanism was not studied separately, however the applied kinetic claims
that the effect of any catalyst deactivation on naphthalene conversion is reflected in the model.
Furthermore, the monolith wall were considered as porous catalytic media, then a separate layer
(a washcoat layer) was not presented in the geometry of the 3D modeling and detailed modeling
at catalyst layer was not the objectives of this model.

11
2 Method
Reactor modeling studies could be performed by using one-, two-, or three-dimensional models.
The different models can also be classified as washcoat/catalyst level, channel level, or reactor
level models. Washcoat scale models aim at helping in catalyst design related studies, evaluation
of the catalyst performance, and investigations of the effect of monolith geometry. Channel level
models are proper for temperature and concentration profiles by using a single channel and
assuming that it represents the entire reactor. Finally, reactor level modeling gives the
temperature and concentration profile taking into account the properties of the monolith wall,
heat transfer between channels, and heat loss effects. It is also a useful tool for reactor
performance evaluation and optimization studies. Results from studies indicate that one-
dimentional modeling is useful for evaluation of the experimental kinetic parameters and also to
model the effect of some variables on reactor performance (Jinwen Chen, 2008). In this report,
first the overall kinetic and heat transfer coefficients are been used to model the reactor as
channel level (Model 1). Second, modeling at reactor level is done by combining heat, mass, and
momentum balances for an entire monolithic reactor (Model 2).
As mentioned previously, naphthalene is chosen as a model component for tar in this report. It is
claimed that naphthalene is the most difficult tar component to decompose (Devi, Ptasinski, &
Janssen, 2005), (Coll, Salvado, Farriol, & Montane, 2001). The best catalysts for steam
reforming of naphthalene are Ni- catalysts since it has been shown that Ni is an effective
selective opener of the aromatic ring of naphthalene. Ni loading up to 15 % favors a better
naphthalene conversion. MgO and La2O3 promoters doped on γ-alumina supports improve the
performance and give higher catalyst stability. Addition of La2O3 affects the better dispersion of
nickel and also decreases the coke formation (Bangala, Abatzoglou, & Chornet, 1998).
Apart from MATLAB, that is a general mathematical programing tool, there are other modeling
and simulation tools specialized for reactor engineering. Some examples of such software tools
are as following:
Aspen-Hysys, contains a module (Refsys) for reforming processes modeling
COMSOL Multiphysics, includes a chemical reaction engineering module
Ansys Fluent & Ansys-CFX, fluid dynamics with chemical reaction multi-physics
enabled modeling
SuperPro, design of plug flow, equilibrium, and rigorous reactors
CPFD, computational particle-fluid dynamics in gasifier, deep-bed reactors, liquid-solid
flows
FEMLAB®, transport phenomena simulator
VGM Sim, process simulator with an built-in dynamic thermodynamic calculator
DETCHEM, modeling and simulation of reacting flows, in particular for heterogeneous
systems; DETCHEMMONOLITH was especially developed for simulating catalytic monoliths
in 2D and 3D
MATLAB and COMSOL Multiphysics were employed in the present work. They are both
available for students at KTH. COMSOL Multiphysics designed by a Swedish provider company
called COMSOL for experimentation with problems (Edsberg, 2008). COMSOL gives control
over definitions and use of material properties through the Model Builder and Material Browser.
The Material Library of COMSOL contains data for 2500 materials including the elements,
minerals, metal alloys, thermal insulators, semiconductors, and piezoelectric materials.
Properties of each material (up to 24 key properties) are given as functions of some variables,
typically temperature (COMSOL, 2012).

12
In the first modeling attempts, a one dimensional model was created where temperature profiles
were studied only in the direction of reactor length. The radial direction was neglected. Using a
first order simplified kinetic and energy balance, a 1D plug flow reactor model including the tar
conversion, temperature profile and pressure drop curves along the reactor bed was modeled. A
heat compensation system, a multistage inter-bed heating, is suggested and sketched according to
the results of the temperature plots.
In the second modeling attempts, a more complex three-dimensional model was applied,
requiring more computer time. The effects of parameters like insulated boundaries, ceramic or
metallic monolith wall materials, and heating from reactor wall or center of the monolith were
studied in Model 2.
2.1 Model 1- Kinetic Reaction Modeling
Model l is based on the simplified equations reported by UCM (Universidad Complutense of
Madrid) (Corella, Toledo, & Padilla, 2004) that is mentioned in Table 5.
The tar elimination reaction is assumed to be a first order reaction, without considering the
complexity of different reaction systems. It assumes that the kinetic constant k includes all
different affecting parameters like thermal cracking and catalytic reforming of tar, the effects of
Ni impregnated and un-impregnated parts of catalyst and the effect of coke deposition on
reaction rate decrease.
(1)
r = tar conversion reaction rate
= effective kinetic constant
= naphthalene concentration
2.1.1 Input Gas Composition
A typical product gas from biomass gasification process with a volumetric flow rate of 10 Nm3/h
has been considered as the inlet to the reformer reactor.
Six GC analysis data (fluidized bed gasification of birch biomass), including tar measurement
data, were averaged to calculate the inlet product gas composition. Since the GC results are on a
dry basis, the water-gas-shift reaction equilibrium was used to calculate the water content of the
gas. Twigg’s equation (Byron Smith, Muruganandam, & Murthy Shekhar, 2010) was used to
calculate the equilibrium constants:
CO + H2O ↔ CO2 + H2
Keq= (pCO2 pH2) /(pCO pH2O)
Keq = exp (Z (Z (0.63508 - 0.29353Z) + 4.1778) + 0.31688)
Z = (1000 / T) - 1, T: temperature in Kelvin
Using the average gasification temperature of 890°C for the above six performed experiments,
the equilibrium constant Keq equaled to 0.775 was calculated. Then, from Keq and partial
pressure of the other components of the WGS reaction, the water content of the product gas was
calculated.

13
Keq= (yCO2 yH2)/(yCO yH2O)
yH2O= (yCO2 yH2)/(yCO Kp)
nH2O= (nCO2 nH2)/(nCO Kp)
nH2O= ndry (yCO2 yH2 / nCO)dry / (Kp)
ndry = nwet - nH2O
nwet calculated from having 10Nm3 h
-1 and the ideal gas law
nwet = total molar flow wet gas, equal to 10Nm3 h
-1 446.38
p (atm) 1
R (dm3 atm mol
-1 K
-1) 0.08206
T (K) 273
The dry and wet basis composition of gas is summarized in Table 8.
Table 8.Gas composition (dry and wet basis)
Dry gas Wet gas
Species Vol % Molar flow mol h-1
Vol % Molar flow mol h-1
N2 58 213 48 213
CO2 16 59 13 59
CO 10 36 8 36
H2 10 37 8 37
CH4 5 19 4 19
C2H6 1 5 1 5
Tar 0.03 0.09 0.02 0.09
H2O 0 0 18 79
total 100 368 100 446
As calculated from the wet gas composition, the H2O/carbon-atom ratio equals 0.67, which is
lower than the recommended ratio (>2), applied to prevent catalyst deactivation by coking. This
is one of the issues that directly affect catalyst life time and then a flow of steam should be added
to gasification gas for balancing the steam/carbon-atom ratio.
2.1.2 Governing Equations
Mass balance for tar considering piston flow in the monolith and supposing that the total volume
of the gas is almost unchanged:
∫
(2)
Or:
∫
(3)
W= weight of the monolith, kg , = inlet gas flow rate, m3 h
-1
= tar inlet concentration, mg m-3
, X= tar conversion
= space time of the gas in monolith,
, kg h m
-3, = effective kinetic constant

14
To find how the kinetic constant depends on temperature, several experiments were done by the
UCM group. They implemented different test runs, changing gas face velocity (effecting the
density and viscosity and Reynolds number), having naphthalene diffusion coefficient in the gas
mixture, and measuring the tar concentration. The following dependency of temperature was
found for :
(
)
Kinetic constant keff,tar,900C is for tar reforming at 900°C . It was calculated by experimental work
and varied from 0.5 to 4.7 s-1
for different catalysts and test conditions. Its average equaled
2.22 s-1
(Corella, Toledo, & Padilla, 2004).
Writing an energy balance for adiabatic PFR and arranging it toward temperature equation gives
this equation:
∑ ∑ ( ) ∑ (5)
Or
∑ ∑ (6)
is the total gas mass flow rate and denotes to average heat capacity of the gas, is the
fraction of component i that reacts in the jth reaction.
After integrating:
∑ ∑
(7)
For one reaction and one reactant:
Where ‘i' represents species in the gas, including methane, naphthalene, carbon monoxide, etc.
Since the gas mixture includes several species and also many possible reactions occur in the
reactor, it was very difficult to find what fraction of each species reacted in each reaction For
instance, if i = methane, then temperature drop is 135°C when reacting with CO2, 112°C when
reacting with H2O, and 41°C for thermal decomposition. For i = naphthalene as model
component of tar, the temperature drop was 14.6°C when using the reforming reaction:
C10H8 + 10H2O → 10CO + 14H2, = 1164.8 (kJ mol
-1)
However the total conversion of species could be measured, but it is not possible to know the
exact value of or which fraction of each component reacted in each reaction. In other word,
measuring or calculating the conversion of each ingredient due to each reaction is difficult.
Therefore a simpler equation was used as:
could be calculated in each experiment by having and Texit and Xtar, using the above
temperature relation for the whole reactor.
The experimental data for and Texit and Xtar for 12 tests (Corella, Toledo, & Padilla, 2004)
gave an average of 290 K for and it varied between 208 and 342 K for different
monoliths and tests.

15
Now it was possible to combine the above equations to find the following differential equation
between and conversion:
∫
∫
(
)
∫
(
)
(11)
Using above equations, overall conversion profiles could be drawn versus .
Temperature profile over the reactor length could also be plotted by re-arranging the equations
for a function between T and .
Combining with equations 4 and 9, = (
)
, and :
(
)
(
)
(
)
(12)
Next, the pressure drop through monolith reactor has to be considered since it affects the reactor
performance. Since the packed bed reactor filled with catalyst pellets has a higher pressure drop
than monolith catalysts, calculations of pressure drop in pellet catalyst packed bed were used
here to consider the more risky situation for a pressure drop case. It should be noted that the
pressure drop equation of the packed bed reactor were combined with space time-conversion
equations of monolithic reactor means that the results are not very accurate. However, they can
give an approximate view of the design. The pressure drop may be estimated by using the Ergun
equation.
Here the properties of an industrial steam reforming catalyst, NIAP-03-01, was used (Table 9).
Table 9. Properties of an industrial steam reforming catalyst (Matros Technologies, 2005)
Number of holes 7
Nickel oxide catalyst supported on α-alumina
for higher hydrocarbon steam reforming
Carrier α-alumina
Size, mm (D×d×h) 16.5 × (7)3 × 14
Bulk density, kg dm-3
0.93
Ni content, % wt. > 12
Bed void fraction, m3
m-3
0.55
Bed surface area, m2 m
-3 410

16
Using an alternative version of the Ergun equation from Fogler’s book (Fogler, 2011), based on
the dependency of the density of gas to temperature and pressure:
(13)
Where: y = P / P0
p = pressure, P0 = pressure of gas at reactor inlet
is a constant and depends only on the properties of the packed bed ( ) and the fluid
properties at the entrance conditions
[
]
μ = viscosity of gas passing through the bed, calculated at 855°C as 4.28∙10-5
(kg m-1
s-1
)
ρ= gas density calculated at 855°C as 0.28 kg m-3
u = superficial velocity = volumetric flow rate / cross sectional area of reactor (m s-1
) Dp = diameter of particle in the bed and is equivalent spherical diameter, i.e. the diameter the
particle would have if it was a sphere. Estimation of Dp is given (Nauman, 2002) as:
G = ρu = superficial mass velocity (kg m-2
s-1
)
A= cross sectional area
= density of the solid catalyst particles
= void fraction
Temperature (T) in equation 13 is replaced as a function of conversion from equation 9:
Or
(
)
A new attribution of equation 3 also gave a function between X and W, as:
(
)
These two differential equations were solved together to show the effect of a pressure drop on a
conversion profile.
Drawings and more equation arrangements are presented in results and discussion section for
Model 1.

17
2.2 Model 2-Whole Monolithic Reactor Modeling
In the previous model, the reactor was considered as a plug flow reactor and the 1D kinetic study
was applied for overall temperature and conversion profiles using expressions from the empirical
kinetic studies. In the following sections, the second modeling tool, COMSOL Multiphysics and
a new design approach were applied. This was developed to set up and solve a 3D model of the
entire monolith reactor including mass transport, heat transfer, and fluid flow.
Monolith refers to a structure containing several parallel channels or cells. Most common
monolith materials for high temperature applications are ceramic and metallic ones as shown in
Figure 5a, 5b. Ceramic monoliths are being used in vehicles from mid-1970s as engine emission
converters and their successful operation in this industry encouraged research for use of other
materials like metallic monoliths from 1990s and to investigate monolith application in other
processes such as catalytic combustion, methanation and catalytic oxidation. When a honeycomb
structure is used as catalyst support, an active catalyst phase can be prepared by using different
technologies. One typical way is to prepare a catalyst carrier (ex. γ-Al2O3 as carrier dispersed
with metal catalyst oxides like Ni-oxides) and mill it in an aqueous media to very small particle
sizes (less than 10 microns) and then dip the monolith structure in the produced catalyst slurry,
dry and sometimes perform calcination on the dried structure in air to obtain better carrier-
monolith bonding. For the metallic monolith structures, because metals have higher expansion
coefficient, they required an extra bonding technique like pre-coat of an inorganic oxide to make
the washcoat bond well to the wall.
The applied catalyst phase is called catalyst washcoat when it is deposited on the monolith walls.
The reactant gas flows through the channels, reacts on the channel walls and the products
continue to flow and exit from the channel. A schematic structure of the monolith wall is shown
in the below Figure 5c:
a b c
Figure 5.a, b: Ceramic and metallic monoliths; c. Reaction in an idealized monolith channel (Heck, Gulati, &
Farrauto, 2001)
One of the main important advantages of the monoliths is their low pressure drop and hence low
energy loss. This advantage comes from the high geometric surface area they provide on catalyst
walls of channels. Therefore, this area could be very high according to the diameter and wall
thickness of the channel (expressed as the term cpsi, cell per square inch). For instance, an open
frontal area (OFA) of around 90 % is achievable for metallic monoliths since they can be
manufactured with thinner walls. The high geometric area also results in relatively lighter weight
that leads to faster catalyst warm-up and higher conversion for the same period of time. The
relatively higher conversion is also favored in cases when bulk mass transport is the controlling
parameter of the reaction rate. Therefore, monoliths can handle higher flow rates. The following
Figure 6 compares cpsi of commercial monoliths and particle diameter of standard spherical
particulates at equal GSA. It shows an exponential decrease of particle diameter. The porosity of
the pellets in packed beds is generally around 40 % while the monolith’s could be up to about
80 % (Heck, Gulati, & Farrauto, 2001).
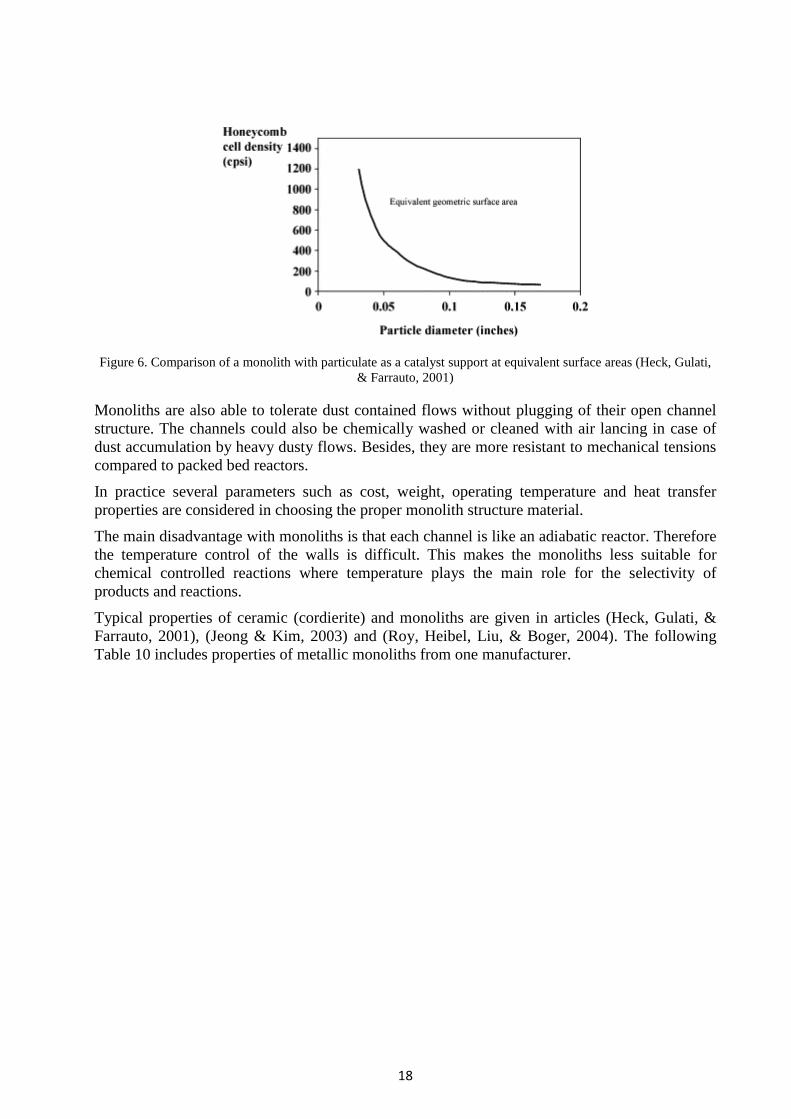
18
Figure 6. Comparison of a monolith with particulate as a catalyst support at equivalent surface areas (Heck, Gulati,
& Farrauto, 2001)
Monoliths are also able to tolerate dust contained flows without plugging of their open channel
structure. The channels could also be chemically washed or cleaned with air lancing in case of
dust accumulation by heavy dusty flows. Besides, they are more resistant to mechanical tensions
compared to packed bed reactors.
In practice several parameters such as cost, weight, operating temperature and heat transfer
properties are considered in choosing the proper monolith structure material.
The main disadvantage with monoliths is that each channel is like an adiabatic reactor. Therefore
the temperature control of the walls is difficult. This makes the monoliths less suitable for
chemical controlled reactions where temperature plays the main role for the selectivity of
products and reactions.
Typical properties of ceramic (cordierite) and monoliths are given in articles (Heck, Gulati, &
Farrauto, 2001), (Jeong & Kim, 2003) and (Roy, Heibel, Liu, & Boger, 2004). The following
Table 10 includes properties of metallic monoliths from one manufacturer.

19
Table 10. Properties of typical cordierite monolith converters (Hayes, Fadic, Mmbaga, & Najafi, 2012)
Property Standard Thin
wall
Thin
wall
Ultrathin
wall
Ultrathin
wall
Ultrathin
wall
Cells per square inch, cpsi 400 400 600 400 600 900
Wall thickness, mil (milli-inch) 7 4.3 4.3 2.5 3.5 2.5
Wall thickness, mm 0.1778 0.1092 0.1092 0.0635 0.0889 0.0635
Substrate channel size, mm 1.092 1.161 0.928 1.207 0.948 0.783
Substrate volume fraction 0.260 0.165 0.200 0.097 0.164 0.144
Washcoat volume fraction 0.12 0.12 0.12 0.12 0.12 0.12
Open Frontal Area (OFA) 0.620 0.715 0.680 0.783 0.716 0.736
Average washcoat thickness, µm 46.26 43.30 36.18 41.54 35.34 28.50
Hydraulic diameter, Dh, mm 1.000 1.074 0.855 1.123 0.877 0.726
Geometric surface area, GSA, m2 m
-3 2479 2664 3182 2786 3264 4052
Bulk density substrate, kg m-3
424.5 268.3 325.3 158.9 267.5 235.3
Bulk density final, kg m-3
556.5 400.3 457.3 290.9 399.5 367.3
Axial permeability, m2 10
-8 1.94 2.6 1.6 3.1 1.7 1.2
Axial thermal conductivity, W m-1
K-1
0.611 0.419 0.489 0.285 0.418 0.379
Radial thermal conductivity, W m-1
K-1
0.383 0.269 0.310 0.194 0.269 0.246
Some properties of metallic monolith walls together with ceramic ones are listed in the following
Table 9 from another manufacturer.
Table 11. Physical Properties of some commercial catalyst monoliths (uncoated) (Nett_Technologies)
Property Metallic (M-Series) Ceramic (D-Series)
Cell Density, cpsi 160 240 320 200 300 400
Wall Thickness, mm 0.05 0.05 0.05 0.3 0.21 0.18
Geometric Surface Area, cm2 cm
-3 19 23 26 18.5 23.6 27.2
Open Frontal Area, % 94 92 91 69 74 74
Bulk Density, g cm-3
0.43 0.53 0.59 0.53 0.45 0.45
The channels of monoliths may have circular, square or triangular cross-sections.

20
2.2.1 Model Geometry and Input Data
A quarter of the monolith (90° slice) was chosen as the model geometry and was designed as
shown in Figure 7. Symmetry was defined in two sides of the slice to cover effect of the
remaining part of the reactor. The following domains and boundaries were also defined on the
geometry.
Domains: supporting walls, channel blocks
Boundaries: inlet, outlet, symmetry, inlet walls, outlet walls, monolith surface (outer
wall).
Figure 7. Geometry and definition for domains and boundaries
Outlet
Inlet
Monolith surface
Symmetry
Channel blocks
Monolith walls

21
To have an accurate computation results for all domains, the above geometry must be partitioned
into small elements. This was done by creating triangular ‘mesh’ at inlet-end of reactor and
distributing the meshes along the reactor. The number of the elements for the entire geometry
was around 476 thousand after meshing. Figure 8 shows the geometry after meshing.
Figure 8. Geometry after meshing
2.2.2 Thermodynamic and Transport Properties of Material
Accurate thermodynamic data is required as input to the energy balance equations. The
CHEMKIN or NASA format of thermodynamic properties was used in the model (McBride,
Gordon, & Reno, 1983). The following set of polynomials was used as default expressions
describing species thermodynamic properties:
(16)
(17)
(18)
Here, Cp,i denotes the species’ heat capacity (J mol-1
K-1
), T the temperature (K), and R the ideal
gas constant, 8.314 (J mol-1
K-1
). Further, hi is the species’ molar enthalpy (J mol-1
), and si
represents its molar entropy (J mol-1
K-1
). A set of seven coefficients per species are taken as
input for the polynomials above. The coefficients a1 through a5 relate to the species heat
capacity, the coefficient a6 is associated with the species enthalpy of formation (at 0 K), and the
coefficient a7 comes from the species entropy of formation (at 0 K).
There are two sets of numerical coefficients supplied in NASA thermodynamic files, the first
seven coefficients (a1 through a7, respectively) are for the high-temperature range (above
1000 K), and the second seven coefficients (a1 through a7, respectively) for the low-temperature
range (below 1000 K). Then the property, for example molar enthalpy, in the above equation is
defined as:
H(T) = Delta Hf(298) + [ H(T) - H(298) ]

22
So that, in general, H(T) is not equal to Delta Hf(T) and one needs to have the data for the
reference elements to calculate Delta Hf(T). Coefficients were collected in a text file as
CHEMKIN format and imported when COMSOL settings are being done from the file
‘THERM.DAT’ as the attached data in Appendix III.
To set up expressions for transport properties such as diffusivities, viscosity, and thermal
conductivity as functions of temperature, pressure, and composition, the
and μ, the
characteristic Lennard-Jones energy, length, and dipole moment respectively, were used. For
instance, the diffusivities (m2 s
-1) were calculated using the formula:
√
(19)
Where is a collision integral:
These data were also collected in a text file as CHEMKIN format and imported when COMSOL
settings were being done from the file ‘Transport.DAT’.
The data parameters used for this model are summarized below, Table 12:
Table 12. Transport properties of species
Species N2 H2O CO2 CO H2 CH4 C10H8
M [g mol-1
] 28.01 18.02 44.01 28.01 2.02 16.04 128.17
σ [°A] 3.798 2.641 3.941 3.690 2.827 3.758 5.349
71.4 809.1 195.2 91.7 59.7 148.6 412.3
µ [debyes] 0 1.8 0 0.1 0 0 0
In addition to the fluid gas in the channel, three solid materials were also used in the mode1.
Two of them are the options for the monolith support and the last is for the reactor wall.
Solid material 1- Ceramic monolith support: Cordierite material that are mixture of silica,
magnesia, alumina (typically with ratios of 3:2:2) which is the most common ceramic
monolith material used. Here it was also chosen as the monolith wall material for some
studies. With higher wall thickness, ceramic monoliths have lower open frontal area than
metallic monoliths.
Solid material 2- Metallic monolith support: FeCrAl alloys were used in most other
studies as the metallic monolith wall and specially a product of Sandvik called OC404
with 20 Cr and 5Al was more frequently used. Here properties of a similar FeCrAl alloy
product ‘Sandvik Kanthal A-1 Resistance Strip’ was used as the metallic monolith
support (MatWeb, 2013).
Solid material 3- Reactor wall: The chosen metal is a grade of an alloy called
INCONEL® alloy HX, equal to UNS N06002, that is known as ‘Inconel HX UNS
N06002’ in COMSOL Multiphysics material library. This alloy is for high temperature
applications up to 1100°C. Composition of the alloy is: Ni 47.0, Cr 22.0, Fe 18.0, Mo
9.0, Co 1.5, and W 0.6. Density, heat capacity and kappa of this alloy from the COMSOL
library were used.
Appendix IV also includes further specifications of some metallic monolithic material from other
commercial producers.

23
2.2.3 Governing Equations
In COMSOL, one channel was first modeled in 1D and then the whole geometry was modeled as
3D. To model one channel, a plug flow reactor approach and the following mass balance
equation was used assuming steady state:
(20)
Where is the molar flow rate of each species (mol s-1
), V presents the channel/reactor volume
(m3), and is the net reaction rate of species (mol m
-3 s
-1).
The energy balance for the ideal reacting gas is:
∑
(21)
Here, is the species molar heat capacity (J mol-1
K-1
), is the heat added to the system
per unit volume (J m-3
s-1
) considered zero for the first run as the adiabatic reactor model and
denotes the heat due to chemical reaction (J m-3
s-1
):
∑ (22)
Where is the heat of reaction (J mol-1
), and the reaction rate for reaction (mol m-3
s-1
).
Since an overall kinetic model was used in this report, regardless of the complexity of reaction’s
set, and also since an overall model for temperature was attached to this kinetic model, an overall
enthalpy for the whole reacting system could be considered. By using reported equation 5 to 8,
this overall enthalpy could be calculated and multiplied by the reaction rate to have the overall
heat of reactions.
Ordinary differential equations for one channel were solved by the COMSOL solver and can be
found in COMSOL model files (Appendix VI) under the section named ‘Study 1’.
The whole heterogeneous monolith was then modeled in which heat, mass, and momentum
balances worked together to plot the 3D temperature and concentration profiles. Mass transport
in each channel was considered as a 1D model, since no mass transport occurs between channels.
Gas flow in channels was considered as a laminar flow, as has been shown previously by several
studies. The energy transfer occurs in different ways: by fluid along the channels, conductive
heat transfer through monolith structure, and supporting walls. The governing equations for these
3D mode comes bellow.
2.2.3.1 Mass Transport
Mass balance equation includes diffusion convection equation at steady state in the channel:
(23)
: Diffusion coefficient : Concentration of the species : Velocity
: Rate expression for each species (that comes from kinetic studies for one channel, done first).
The mass transport equation is reflected under the ‘transport of diluted species’ physics in the
model.
In direction of reactor length(x) the equation is:
(
)
(24)
This equation is connected to the reactor’s model by the heat transfer equation.

24
2.2.3.2 Flow Transport
The fluid flow equation is derived from laminar flow conditions in the channel in which the
average flow field is proportional to the pressure drop across the reactor. Darcy’s Law describes
the model:
(25)
(26)
is the effective permeability (m2) of the monolith (like a porous matrix) , and are the
density (kg m-3
), and viscosity (Pa s) of the gas, varying with the temperature.
Allowable pressure drop across the reactor is considered to be 0.065 bar (6500 Pa) that is 5 % of
the inlet gas pressure (1.3 bar).
Permeability is the ability of the fluid to flow through the porous catalyst. The permeability is
dependent on the properties of the medium, viscosity, and density of the fluid. The unit for
permeability is m2 in the International System of Units (SI) and Darcy in the centimeter–gram–
second (cgs) units. It could be calculated from Darcy’s law by performing experiments to
measure the pressure drop of a flow passing across the monolith. When knowing the volumetric
flow rate and viscosity of the flow, length and overall cross sectional area of monolith, Q, , L
and A, respectively, the permeability were calculated.
For ceramic monoliths, к is in the range of 10-14
- 10-10
m2 (Fletcher,, Haswell, He, Kelly , &
Mansfield, 2010), and for metal foam monoliths ranged between 2.7 and 9.1 × 10⁻⁸
from
(Thomas, 2011).
2.2.3.3 Heat Transport
Heat transports can occur in two main ways in the reactor:
First, through the fluid along the channels in the porous structure of monolith (convection and
conduction):
Heat transfer equation for the fluid domain in the porous structure of monolith is:
( )
( ) (27)
The first term is eliminated for the steady state case and the equation simplified to:
( ) (28)
Assuming the heat transfer by flow in x direction:
(
) (29)
Here (J kg-1
K-1
) is the heat capacity of gas, (W m-1
K-1
) is the equivalent thermal
conductivity of solid-gas, and (W m-3
) is the heat source from chemical reactions:
could be calculated form the porosity ( ) of solid, multiplied in thermal conductivity of
monolith and fluid gas, and :
(30)

25
Typical thermal conductivity is around 0.8 to 5 W m-1
K-1
for ceramic monoliths, about 25
W m-1
K-1
for metal monoliths, and 0.02 to 0.005 W m-1
K-1
for gases (Geus & van Giezen,
1999). Porosity of 0.8 was considered for the porous monolithic walls (Maestri, Beretta, Groppi,
Tronconi, & Forzatti, 2005).
The second possible heat transfer is conductive heat transfer through the supporting walls (in
radial and axial direction):
(31)
here is the thermal conductivity of the wall material.
Partial differential equations (PDE) of this part are solved by COMSOL PDE solvers. Results
and settings could be found under section ‘Study 2’ in the COMSOL model files (Appendix VI).
The 3D model file contains fine meshed geometry and so many elements that all equations
should be solved for them and this requires a powerful computer with a high memory RAM. For
this reason, facilities of Parallel Computer Systems at KTH were used for computation. By
getting an account from PDC, obtaining credits to use the computers, and installing Xming
server program, Network Identity Manager, SecureCRT, SecureFX, and OpenAFS programs, it
was possible to do the calculation on the PDC computers. It was also possible to do calculations
on multi-node computers of PDC. Usually two and four nodes were used for the 3D models.

26
3 Results and Discussion
3.1 Model 1-Results and Discussion
3.1.1 Conversion and Temperature Profiles along Bed
Since values of and are known, could be calculated for different inlet
temperatures (850 to 1050°C) by integration for required conversion. The equation (11) could
also be used in differential problem solving method and then tar conversion could be graphed
versus space time of gas for different inlet temperatures, as shown in Figure 9. Values
s-1
and K were taken from the experiment number N84 of the
reference model. N84 had a similar inlet gas composition to our gasification gas data and flow
rate (9.6 Nm3
h-1
). Tar content of the inlet gas was 5230 mg Nm-3
(dry basis). A conversion of
more than 0.90 was achieved.
Figure 9. Tar conversion for different inlet temperatures
Conversion is very dependent on the rate constant, the following Figure 10 shows how
conversion changes with using different values in a range of rate constants from 2 to
5 s-1
. Inlet temperature was considered 912°C as the reference experiment N84.

27
Figure 10. Tar conversion with different overall kinetic rate constants
The temperature profile, displayed in Figure 11, was plotted together with conversion for the
same parameters as N84 and the conversion of 0.95 was companied with around 200°C
temperature drop. The values for , , and inlet temperature were applied as
above.
Figure 11. Temperature profile for different inlet temperatures
Note that for this adiabatic endothermic reaction, the outlet temperature should be kept above
750°C to prevent whisker-type coke formation in the reactor.

28
3.1.2 Pressure Drop
Considering the pressure drop along the bed, equations 14 and 15 could be solved
simultaneously. Because the reactor should be able to operate with both catalyst types, i.e.
monolith and conventional cylindrical catalysts like the Haldor Topsoe’s steam reforming
catalyst with 16 mm diameter, a reactor diameter of 16 cm was considered as appropriate for
both catalyst types.
Inlet gas composition and conditions similar to N84 and the catalyst properties from Table 9
were considered.
kg m
-3 P0 = 1.3bar = 100kPa,
[
] , µ = 0.00004kg m
-1 s
-1, ρ = 0.27 kg m
-3
G = 10.5 (kg h-1
) / 0.02 (m2) / 3600 (s h
-1) = 0.1452kg m
-2 s
-1
(
was calculated to 5.6 using the changes in
total number of moles from all possible reactions for naphthalene, as the listed reactions in
Table 5. Because of a very low fraction of naphthalene at inlet gas (
), was
calculated to a very small value.)
Differential equations 14 and 15 were solved together and gave the graph illustrated in Figure
12 showing P/P0 and conversion versus reactor volume.
Figure 12.Simultaneous pressure drop and conversion at reactor diameter 16cm
29
A lower conversion is obtained when a pressure drop is considered in the bed. For instance, if the
acceptable pressure drop is 0.05 bar or 5 kPa, for P0 = 100 kPa (1.3 bar), the P/P0 ratio is equal to
0.95, then the conversion is 0.60. The total pressure drop in the reformer is around 23 % which is
very high. This is however not strange in view of combining the pressure drop equation of a
packed bed reactor with space time-conversion equation of monolithic reactor, i.e. the results are
therefore not accurate but provide with an approximate view of a worst case scenario.
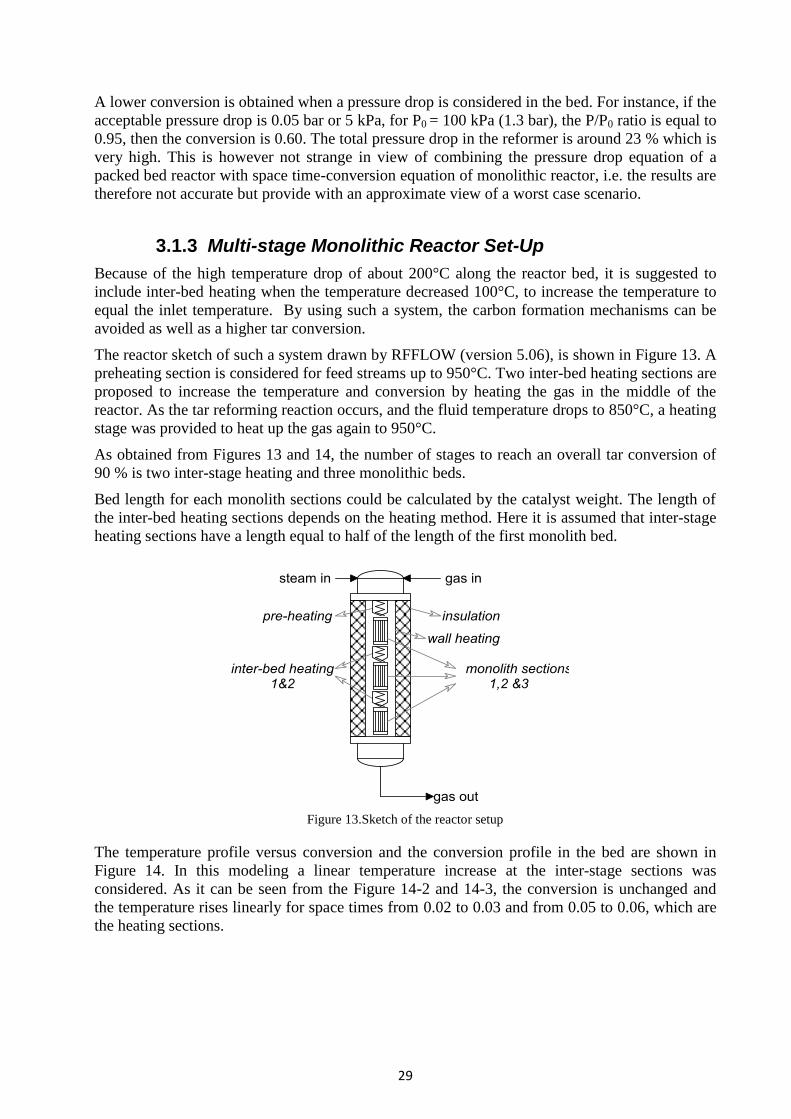
3.1.3 Multi-stage Monolithic Reactor Set-Up
Because of the high temperature drop of about 200°C along the reactor bed, it is suggested to
include inter-bed heating when the temperature decreased 100°C, to increase the temperature to
equal the inlet temperature. By using such a system, the carbon formation mechanisms can be
avoided as well as a higher tar conversion.
The reactor sketch of such a system drawn by RFFLOW (version 5.06), is shown in Figure 13. A
preheating section is considered for feed streams up to 950°C. Two inter-bed heating sections are
proposed to increase the temperature and conversion by heating the gas in the middle of the
reactor. As the tar reforming reaction occurs, and the fluid temperature drops to 850°C, a heating
stage was provided to heat up the gas again to 950°C.
As obtained from Figures 13 and 14, the number of stages to reach an overall tar conversion of
90 % is two inter-stage heating and three monolithic beds.
Bed length for each monolith sections could be calculated by the catalyst weight. The length of
the inter-bed heating sections depends on the heating method. Here it is assumed that inter-stage
heating sections have a length equal to half of the length of the first monolith bed.
Figure 13.Sketch of the reactor setup
The temperature profile versus conversion and the conversion profile in the bed are shown in
Figure 14. In this modeling a linear temperature increase at the inter-stage sections was
considered. As it can be seen from the Figure 14-2 and 14-3, the conversion is unchanged and
the temperature rises linearly for space times from 0.02 to 0.03 and from 0.05 to 0.06, which are
the heating sections.

30
Figure 14.Temperature and conversion profiles in multi-stage reactor design

31
3.2 Model 2-Results and Discussion
In this chapter three cases were calculated to compare the results from the developed model and
the experimental data in (Section 3.2.1). In the calculations, some parameters like heating from
reactor wall, monolith material, and heating from middle of the wall were investigated in
separate cases (Sections 3.2.2-4).
3.2.1 Case 1-Adiabatic,Steady State Monolith
To validate the outcomes of the developed monolith 3D model, conditions and input data similar
to one of the reference experiments, N84 (Corella, Toledo, & Padilla, 2004), were chosen and
fed into the model. Table 13 shows the input data for this Case.
Table 13. Model input data and parameters, Case 1-N84
Expression Value
Inlet temperature, °C 912
Inlet pressure, atm 1.03
Monolith diameter, cm 16
Monolith length, cm 35
Channel size, mm 1.09
Channel wall thickness, mm 0.18
Inlet flow rate, Nm-3
h 9.6
Fraction of N2 at the reactor inlet (yN2) 0.44
Fraction of CO2 at the reactor inlet (yCO2) 0.09
Fraction of CO at the reactor inlet (yCO) 0.10
Fraction of H2 at the reactor inlet (yH2) 0.07
Fraction of CH4 at the reactor inlet (yCH4) 0.04
Fraction of H2O at the reactor inlet (yH2O) 0.26
Fraction of C10 H8 at the reactor inlet (yC10H8) * 6.831 10-4
Kinetic constants , s-1 4.7
, K 208
*Tar content at inlet = 5230 mg Nm-3
(dry basis)
A cell density (cpsi) and an open frontal area of 400 and 74 % were calculated for the monolith,
respectively. The GHSV for this case was 1630 Nm3 h
-1 mcat
-3, the velocity at front of the
monolith was 46 cm s-1
, and the steam to carbon ratio was 1.1.
The modeling was carried out at adiabatic steady state conditions with the input data presented in
Table 13. The naphthalene conversion was calculated to be 0.90 and the obtained temperature at
outlet about 800°C (Figure 15 and Figure 16).

32
Figure 15. Naphthalene conversion at adiabatic condition for a ceramic monolith, Case 1
Figure 16. Temperature at adiabatic conditions in a ceramic monolith, Case 1
The same gas composition, inlet flow rate, and temperature was tested with the same reactor
volume with a catalyst from BASF (test number N-84, (Corella, Toledo, & Padilla, 2004)) with a
resulting conversion and outlet temperature of 0.95 and 714°C, respectively. The difference
between results is more considerable for the temperature at outlet, 800°C from 3D model and
714°C from the experiment. Some possible reasons for this difference are the difference in the
monolith material and channel sizes that were not published for the experiments, although the 3D
model employed some typical sizes for ceramic monoliths as it was mentioned in Table 13. In
addition, the permeability coefficient and porosity of the porous layer were set at typical values
(3 10-9
m2 and 0.8, respectively) and as no information for these parameters was published,
they may also potentially influenced the results as well. Furthermore, the effective kinetic rate
has a temperature dependency with a power of 2.75 ± 1 (as it was defined in equation 4) and
using the average value 2.75 in the model has also caused variance in results.

33
Two other comparisons were made by using the inlet gas composition and conditions similar to
reference experiments N-90 and N-87 (Corella, Toledo, & Padilla, 2004) with the parameters as
listed in Table 14.
Table 14. Model input data and parameters, Case 1-N90 and Case 1-N87
Expression N-90
Value
N-87
Value
Inlet temperature, °C 875 854
Inlet pressure, atm 1.03 1.03
Monolith diameter, cm 13 16
Monolith length, cm 35 35
Channel size, mm 1.09 1.09
Channel wall thickness, mm 0.18 0.18
Inlet flow rate, Nm-3
h 12.3 9.7
Fraction of N2 at the reactor inlet (yN2) 0.27 0.38
Fraction of CO2 at the reactor inlet (yCO2) 0.06 0.06
Fraction of CO at the reactor inlet (yCO) 0.06 0.07
Fraction of H2 at the reactor inlet (yH2) 0.05 0.05
Fraction of CH4 at the reactor inlet (yCH4) 0.02 0.02
Fraction of H2O at the reactor inlet (yH2O) 0.54 0.41
Fraction of C10 H8 at the reactor inlet (yC10H8) 1.832 10-4
2.1801 10-4
Tar content at inlet, mg Nm-3
4280 5000
Kinetic constants , s-1 4.7 2.6
, K 208 340
GHSV, Nm3 h
-1 mcat
-3 3580 1740
Superficial gas velocity at inlet, cm s-1
102 56
Steam to carbon atom ratio 3.7 2.7
As it can be seen from the table, the steam to carbon atom ratio for these cases was higher (3.7
and 2.7) and then the main component of the inlet gas was steam instead of nitrogen as in Case 1.
The modeling was carried out at adiabatic steady state conditions with the input data in Table 14.
For the Case N-90, naphthalene conversion was calculated as 0.71 and with a temperature at
outlet of about 790°C, compared to the experimental measurements of 0.69 and 715°C,
respectively. Again, the conversion has shown better results for the model calculation compared
to the experiment data. The files were named Case1-N84, Case1-N90, and Case1-N87 and the
report for the above adiabatic cases is attached in Appendix VI.
For the Case N-87, a conversion and a temperature at monolith outlet of 0.78 and 728°C was
obtained, respectively. Since, the temperature in the monolith should be kept above 800°C to
prevent coking; different heat compensation systems could be proposed. Results from simulation
of heating from the reactor wall are presented in the next Case where its effectiveness on
temperature profiles was investigated.

34
3.2.2 Case 2-Heating from Reactor Wall
For this Case, a heat source around the monolith wall Case N-87, as it could maintain the
temperature of the reactor wall constant and equal to the temperature of inlet gas (854°C for this
Case), is assumed. A new layer for the reactor wall was added to the geometry, thickness 0.5 cm,
and the reactor wall material was set to Solid material 3 (INCONEL® alloy HX, UNS N06002).
A new physics for heat transfer in solid wall of the reactor was also added to the model to
consider the related equations of heat conduction in solids. Figure 17 illustrates the new
geometry drawn for this Case.
Figure 17. Geometry showing the reactor wall domain, Case 2
The results are presented in Figures 18 to 21 for the conversion, temperature, temperature profile
in radial direction of reactor, and iso-surface temperatures. The average conversion of gas at the
outlet increased to 0.80 and the average temperature of gas at outlet is 772°C. However, there are
points with higher and lower results such as the highest conversion of 0.84 and the lowest
temperature 730°C. Figure 21, plotting the surfaces with the same temperature, shows that two
surfaces close to the center of the reactor have temperatures lower than 750°C.
Outlet
Inlet

35
Figure 18. Naphthalene conversion, constant reactor wall temperature, ceramic monolith, Case 2
Figure 19. Temperature, constant reactor wall temperature, ceramic monolith, Case 2

36
Figure 20. Temperature at radial direction, constant reactor wall temperature, ceramic monolith, Case 2
Figure 21. Iso-surface temperatures, constant reactor wall temperature, ceramic monolith, Case 2
It should be mentioned that the monolith and reactor walls are connected in the model and no
gap or welding material are included. However in practice, if the monolith has been placed in a
real reactor, there should be a space left in-between and it can be predicted that the overall
thermal conductivity would be lower. Effects from such a space is neglected in this model.
In next modeling, Case 3, the monolith material is changed to a metal to investigate the effect of
a better wall conductivity of the monolith.

37
3.2.3 Case 3-Metal Monolith Support
The same conditions were used as in Case 2, but with a changed monolith material to ‘Solid
material 2- Sandvik Kanthal A-1’, were applied in the modeling. The modeling results in a very
high uniformity in conversion, with an average of 0.83 at the outlet and a highest conversion of
0.84, as shown in Figure 22. The temperature is also better distributed in the monolith, with the
lowest temperature of 809°C in the center of the reactor, as illustrated in Figure 23. The average
temperature at the outlet is calculated to 840°C. Since the reaction rate is significantly lower at
the exit part of the reactor, the conducted heat has not been consumed at this point, resulting in
the observed higher temperature at the outlet of the reactor. This can also be seen in the radial
and iso-surface temperature plots in Figures 24 and 25 illustrating a well distributed supplied
heat from the reactor wall through the metal monolith. The cold spots disappeared in this Case,
ensuring of better catalyst life time.
Figure 22. Naphthalene conversion, constant reactor wall temperature, metal monolith, Case 3
Figure 23. Temperature, constant reactor wall temperature, metal monolith, Case 3

38
Figure 24. Temperature at radial direction, constant reactor wall temperature, metal monolith, Case 3
Figure 25. Iso-surface temperatures, constant reactor wall temperature, metal monolith, Case 3
It is also possible to apply the heat from different position rather than Case 3. Next Case 4 in
Chapter 3.2.4 was developed to examine the heating from the middle of the reactor, as it is
common in industrial hydrocarbon reforming processes.
One more configuration was examined with heating from half of the reactor outer wall. The
reason for this is that the gas temperature at the first half of the reactor is normally high and heat
is only needed for the second half of the reactor. This case is not included in the report but
results can be found in Appendix V.

39
3.2.4 Case 4-Heating from the Center of the Reactor
In Case 4, a tube with a diameter of 1 cm was added to the middle of the reactor to enable heat
management setting from the center. The geometry for this Case is presented in Figure 26.
Figure 26. Geometry showing a tube at middle of the reactor, Case 4
The temperature of the wall of the heating tube was set to a constant value equal to the inlet gas
temperature. The heating method inside the tube was not specified and only the heating effect
was considered. Results are illustrated in Figures 27 to 30.
Figure 27. Naphthalene conversion, constant heating tube temperature, Case 4
a quarter of the
heating tube

40
Figure 28. Temperature, constant heating tube temperature, Case 4
Figure 29. Temperature at radial direction, constant heating tube temperature, Case 4
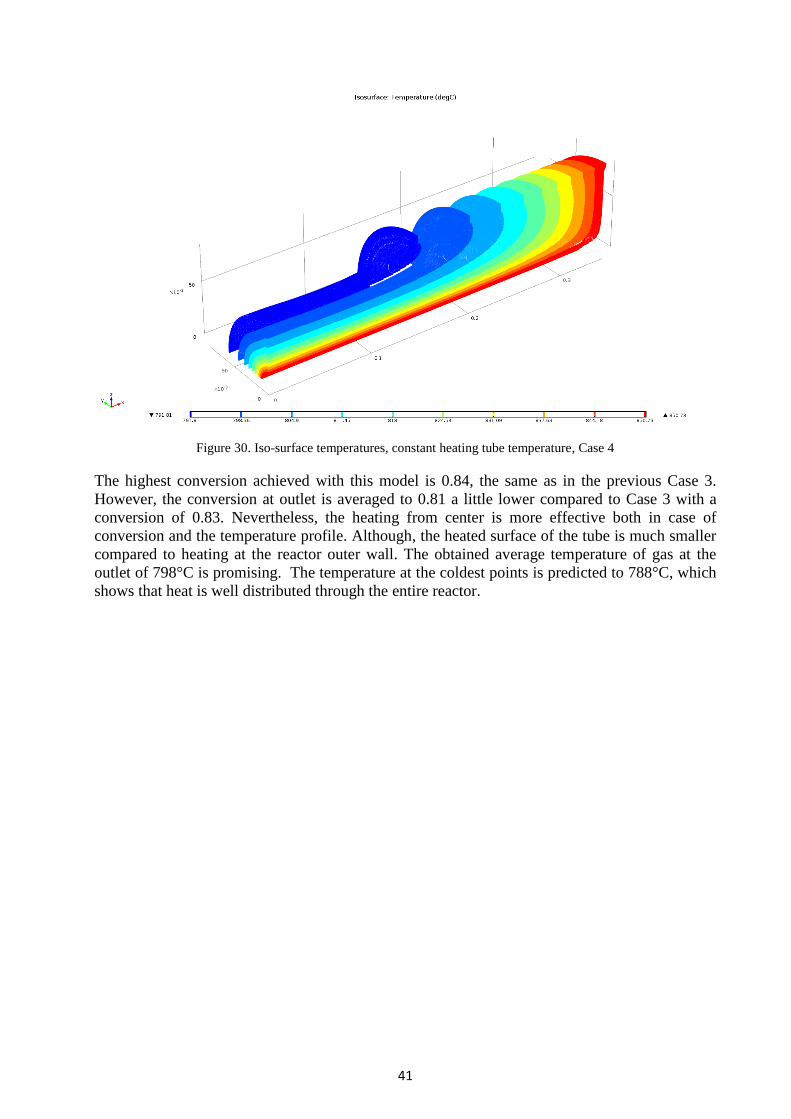
41
Figure 30. Iso-surface temperatures, constant heating tube temperature, Case 4
The highest conversion achieved with this model is 0.84, the same as in the previous Case 3.
However, the conversion at outlet is averaged to 0.81 a little lower compared to Case 3 with a
conversion of 0.83. Nevertheless, the heating from center is more effective both in case of
conversion and the temperature profile. Although, the heated surface of the tube is much smaller
compared to heating at the reactor outer wall. The obtained average temperature of gas at the
outlet of 798°C is promising. The temperature at the coldest points is predicted to 788°C, which
shows that heat is well distributed through the entire reactor.

42
4 Conclusions and Future Work
In this report, a modeling of a reactor for reforming of biomass tars was implemented in two
modes. Here follows some conclusions made from results of the modeling and also some
recommendations for future work were suggested at the end.
4.1 Conclusions
In the first mode, Model 1, an existing overall kinetic rate and overall temperature drop model
was applied for a one-dimensional model of the reactor assuming an ideal plug flow reactor.
MATLAB’s ordinary differential equation solving coding was used for this mode. Naphthalene
was chosen as the model component and empirical coefficients from published results of
research on series of experiments with the similar conditions were employed for modeling. This
one- dimensional model gave the naphthalene conversion and temperature profiles along the bed.
Conversion and temperature were plotted for different gas inlet temperature and kinetic constant
values. Results showed a high temperature drop for the gas in the reformer, therefore, a multi-
stage reactor set-up including inter-stage heating of gas in the reactor was suggested as a solution
for this problem. Furthermore, applying Ergun’s equations, the effect of pressure drop was also
combined with conversion. The calculation of pressure drops showed how conversion decreased
if the packed bed pressure drop equation was added to the model.
Results from the first mode modeling showed that for an inlet gas with a 10 Nm3 h
-1 flow rate, an
inlet temperature of 950°C, and inlet pressure of 1.3 bar, it is achievable to reform at least 70 %
of the tar in a reactor with an approximate size of 16 cm (diameter) × 40 cm (length). The kinetic
model includes a kinetic constant values and this constant is different for each catalyst and test
conditions. Results of experimentation with different Ni based catalysts from Sud-Chemie AG
and BASF AG showed different kinetic constants from 1 to 4.7 s-1
. Effect of a kinetic constant
value on the conversion graphs plotted in this mode showed similar results, as expected; the
value of the kinetic constant was shown to have a considerable effect on the conversion
Furthermore, the temperature dropped dramatically in the reactor because of the highly
endothermic nature of reforming reactions. For the above system, the temperature difference
between the inlet and outlet of the reactor was around 150 to 250°C, depending on the catalyst
type and tar content. The results of the last part of the first model suggested that an inter-stage
heating system would improve the conversion. Two heating stages improved the conversion of
naphthalene from 60 % to 90 %. It is necessary to note that heating method was not suggested
and only a heating effect was reflected in modeling results. Moreover, the reactor length would
be increased when the heating stages were added.
In the second modeling mode, Model 2, a COMSOL Multiphysics modeling tool was used to
study the three- dimensional model of a reforming reactor with a monolith catalyst. First, one
channel of the monolithic catalyst was considered as a plug flow reactor. Then mass, heat, and
momentum transport equations were combined and solved on a drawn geometry of a one-fourth
slice of the reactor. Applying different scenarios, four cases were studied.
In the first Case adiabatic, steady state conditions and three experimental conditions were
modeled. Comparing results showed a good prediction for conversion but lower temperature
drop calculated in the models compared to experimental results. The potential causes of this
difference can come from the properties of the monolith (material, dimension, porosity) and
kinetic rate dependency of temperature.
The second Case modeled was the effect of heating from reactor wall on conversion and
temperature distribution in the monolith. Setting the outer wall of the reactor at a constant

43
temperature equal to the temperature of inlet gas, improved the average conversion and
temperature at outlet. Although the average temperature at the outlet was 772°C (50°C higher
than the same Case without heating from the wall), there were still some points in the reactor
with temperatures lower than 750°C. The temperature distribution was better when a metallic
monolith support was used in Case 3 compared to a ceramic support. A more uniform conversion
and temperature were obtained, 5 % higher conversion and all temperatures were above 800°C.
Since, the colder points appeared at center of the monolith; a fourth Case was modeled to
investigate the effect of heating from the middle of the reactor. In the Case 4, the effect of
heating from the center of the reactor was simulated. The results showed a better heat
distribution in the reactor and almost the same conversion comparing to the previous Case 3 that
employed heating from the reactor wall. In practice heating at the reactor wall might lead to
increased heat losses to the surroundings, though these were not addressed in this model.
4.2 Future Work
Since the modeling was performed on a reactor level, typical catalyst specifications and catalytic
layer properties were used. It is needed to specify accurate data for specific modeling case and
also to model the reactor at catalyst level. The catalyst life time, which could be shortened by
poisoning with sulfur containing feeds and coke formation reactions, was not studied specifically
in the project. As long as the temperature is kept high to prevent coking and the feed is assumed
to be desulfurized before entering the reformer this is not a major issue, but detailed
consideration might be useful as forthcoming projects. Of course, the kinetic model that was
applied in this project is claimed to account for the effect of poisoning on the tar conversion rate.
The model was based on overall kinetic and thermal coefficients obtained empirically, and it was
not possible to predict the reaction mechanism and conversion for other components like
methane. It might be useful to model a group of reactions and to study the activity of all
components present in the biomass gas.

44
5 References
Abdul Salam, P., Kumar, S., & Siriwardhana, M. (2010). The status of biomass gasification in Thailand and
Cambodia. AIT, Asian Institute of Technology.
Anis, S., & Zainal, Z. (2011). Tar reduction in biomass producer gas via mechanical, catalytic and thermal
methods: A review. Renewable and Sustainable Energy Reviews(15), 2355–2377.
Bangala, D., Abatzoglou, N., & Chornet, E. (1998). Steam reforming of naphthalene on Ni-Cr/Al2O3
catalysts doped with MgO, TiO2 and La2O3. AIChE J., 44(4), 927-936.
Basu, P. (2010). Chapter 4 – Tar production and destruction. In Biomass gasification and pyrolysis (pp.
97-116). Boston: Academic Press.
Byron Smith, R. J., Muruganandam, L., & Murthy Shekhar, S. (2010). A Review of the water gas shift
reaction kinetics. The Berkeley Electronic Press.
Chen, Y., Xu, H., Wang, Y., & Xiong, G. (2006). Hydrogen production from the steam reforming of liquid
hydrocarbons in membrane reactor. Catalysis Today, 118, 136-143.
Coll, R., Salvado, J., Farriol, X., & Montane, D. (2001). Steam reforming model compounds of biomass
gasification tars: conversion at different operating conditions and tendency towards coke
formation. Fuel Processing Technology, 74(1), 19-31.
COMSOL. (2012). Retrieved from COMSOL Mutiphysics: http://www.comsol.com/products/material-
library/
Corella, J., Toledo, J. M., & Padilla, R. (2004). Catalytic Hot Gas Cleaning with Monoliths in Biomass
Gasification in Fluidized Beds. 1. Their Effectiveness for Tar Elimination. Ind. Eng. Chem. Res., 43,
2433-2445.
Corella, J., Toledo, J. M., & Padilla, R. (2004). Catalytic Hot Gas Cleaning with Monoliths in Biomass
Gasification in Fluidized Beds. 2. Modeling of the Monolithic Reactor. Ind. Eng. Chem. Res., 43,
8207-8216.
Devi, L., Ptasinski, K. J., & Janssen, F. J. (2003). A review of the primary measures for tar elimination in
biomass gasification processes. Biomass and Bioenergy(24), 125 – 140.
Devi, L., Ptasinski, K. J., & Janssen, F. J. (2005). Pretreated olivine as tar removal catalyst for biomass
gasifiers: investigation using naphthalene as model biomass tar. Fuel Processing Technology , 86,
707– 730.
Edsberg, L. (2008). Inroduction to Computation and Modeling for Differential Equations. Stockholm: John
Wiley & Sons, Inc.
El-Rub, Z., Bramer, E., & Brem, G. (2004). Review of catalysts for tar elimination in biomass gasification
processes. Ind. Eng. Chem. Res.(43), 6911-6919.
Falbe, J. (1977). Chemierohstoffe aus Kohle. Stuttgart: Georg Thieme Verlag.
Fletcher,, P., Haswell, S., He, P., Kelly , S., & Mansfield, A. (2010). Permeability of silica monoliths
containing micro- and nano-pores. Journal of Porous Materials.

45
Fogler, H. (2011). Essentials of chemical reaction engineering. Upper Saddle River, NJ: Prentice Hall.
Geus, J., & van Giezen, J. (1999). Monoliths in catalytic oxidation. Catalysis Today(47), 169-180.
Hayes, R., Fadic, A., Mmbaga, J., & Najafi, A. (2012). CFD modelling of the automotive catalytic
converter. Catalysis Today, 188(1), 94-105.
Heck, R., Gulati, S., & Farrauto, R. (2001). The application of monoliths for gas phase catalytic reactions.
Chemical Engineering Journal, 82(1-3), 149–156.
Helveg, S., Sehested, J., & Rostrup-Nielsen, J. (2011). Whisker carbon in perspective. Catalysis Today,
178(1), 42–46.
Jeong, S.-J., & Kim, W.-S. (2003). A study on the optimal monolith combination for improving flow
uniformity and warm-up performance of an auto-catalyst. Chemical Engineering and Processing:
Process Intensification, 42(11), 879-895.
Jess, A. (1996). Catalytic upgrading of tarry fuel gases: A kinetic study with model components. Chemical
Engineering and Processing:Process Intensification, 35(6), 487-494.
Jinwen Chen, H. Y. (2008). Mathematical modeling of monolith catalysts and reactors for gas phase
reactions. Applied Catalysis A: General, 345(1), 1-11.
Knoef, H. (2005). Handbook of biomass gasification. Meppel, Netherlands: BTG biomass technology
group.
Maestri, M., Beretta, A., Groppi, G., Tronconi, E., & Forzatti, P. (2005). Comparison among structured
and packed-bed reactors for the catalytic partial oxidation of CH4 at short contact times.
Catalysis Today(105), 709–717.
Mathure, P. V., Patwardhan, A. V., & Saha, N. R. (2012). Steam Reforming of Methane in a Novel Meso-
Scale Reactor. International Journal of Engineering and Physical Sciences, 6 .
Matros Technologies, I. (2005). Steam Reforming Catalysts. Missouri.
MatWeb. (2013). MatWeb material property database. Hämtat från
http://matweb.com/search/DataSheet.aspx?MatGUID=2c0dce8bf5d64d3eb824852cdb9252d2
McBride, B. J., Gordon, S., & Reno, M. A. (1983). Coefficients for Calculating thermodynamic and
transport properties of individual species. NASA.
Melo, F., & Morlane´s, N. (2005). Naphtha steam reforming for hydrogen production. Catalysis Today,
107-108, 458-466.
Nauman, E. B. (2002). Chemical Reactor Design, Optimization, and Scaleup. McGraw-Hill Professional.
Nett_Technologies. (u.d.). Diesel exhaust catalytic converters. Hämtat från
http://www.nettinc.com/docs/nett_factsheet_diesel_oxidation_catalyst.pdf
Richardson, Y., Blin, J., & Julbe, A. (2012). A short overview on purification and conditioning of syngas
produced by biomass gasification: Catalytic strategies, process intensification and new concepts.
Progress in Energy and Combustion Science(38), 765-781.

46
Rostrup-Nielsen, J. (1984). Catalytic steam reforming. Berlin: Springer-Verlag.
Roy, S., Heibel, A., Liu, W., & Boger, T. (2004). Design of monolithic catalysts for multiphase reactions.
Chemical Engineering Science, 59(5), 957-966.
Rönkkönen, H., Simell, P., Reinikainen, M., Krause, O., & Niemelä, M. V. (2010). Catalytic clean-up of
gasification gas with precious metal catalysts – A novel catalytic reformer development. Fuel,
89, 3272–3277.
Said Elnashaie, F. U. (2007). Chapter 7- Industrial Problems. i Numerical Techniques for Chemical and
Biological Engineers Using MATLAB® A Simple Bifurcation Approach. New York: Springer.
Schulzke, T. (2009). Syngas cleaning with catalytic tar reforming. Gasification. Stockholm.
Taskın, M. (2007). CFD simulation of transport and reaction in cylindrical catalyst particles. WORCESTER
POLYTECHNIC INSTITUTE.
Thomas, E. A. (2011). Characterization of thermo-fluid transport properties of coated and uncoated
open-cell metal foam monoliths. Ontario, Canada: Queen’s University.
Wang, C., Wang, T., Ma, L., Gao, Y., & Wu, C. (2010). Steam reforming of biomass raw fuel gas over NiO–
MgO solid solution cordierite monolith catalyst. Energy Conversion and Management, 51(3),
446-451.
Xu, C., Donald, J., Byambajav, E., & Ohtsuka, Y. (2010). Recent advances in catalysts for hot-gas removal
of tar and NH3 from biomass gasification. Fuel(89), 1784–1795.

47
6 Appendices
Appendix I- Existing Pilot Plant Tar Reformers
Table 15. Pilot plant Ni-monolith tar reformers
Name Fraunhofer
UMSIGHT
Skive BGGE-
Plant
Fraunhofer
UMSIGHT
Location Oberhausen,
Germany
Skive Fjernvarme,
Denmark
Güssing, Germany Netherland
Developed by Fraunhofer
UMSIGHT
VTT and Condens
Oy, Finland
Fraunhofer
UMSIGHT
BTG
Install date 2005
Gasifier type CFB gasifier with
primary monolith
catalyst
A CHP plant
an integrated gasification
unit with a chicken manure
gasifier (the DUIS
demonstration plant)
Reformer and
catalyst type
Fixed bed monolith
tar reformer (Fig.
31)
Ni(0) supported on
Al2O3 ceramic
monolith
nickel monolith
catalytic reformer
2 layers 2 × 2 Ni-
monolith (Fig. 32)
Reverse-Flow Tar Convertor
(RFTC) on packed bed
reactor
Ni catalyst, steam reformer
(Fig. 33)
Plant capacity
/input
Input 0.5 MW
Producer gas
≈ 250 Nm3 h
-1
5.5 MW
electricity and
11.5 MW district
heat
100 Nm3 h
-1 slip
stream
Tin: 350- 650°C
Tout 650°C
T RTFC: 900-950°C (heated)
treats about 200 Nm3/hr
producer gas
output High quality
syngas,
tar level behind
reformer: 150 mg
tar level at entry of
engine: < 50 mg
Tar levels:
at raw gas: 10 – 20
g Nm-3
at Clean gas
1 – 3 g Nm-3
Conversion >
80 %
Component Conversion%
Benzene 82
Naphthalene 99
Phenol 96
Total aromatic 94
Total phenol 98
Total tar 96
Total ammonia 99
notes Technical devices
required for a
constant result:
1- De-dusting the
reactor e.g by a jet
puls
2- Controlling the
temperature of the
product gas at
constant level e.g
by controlled air
injection for partial
combustion
3- Regenerating the
catalyst by
controlled and well
distributed injection
of a regeneration
gas
Details of the
design are not
published. The
complexity of the
system limits the
practical
application of this
technology.
Dust removal by
pulse cleaning
Air injection for
temperature
control
Small amount of air (about
5 % of the producer gas
flow) is added to
counterbalance the
endothermic reactions
6000hr test shown no
catalyst deactivation
Benefits of the RFTC
(periodic reversal of the feed
flow direction):
high energy efficiencies from
high degree of heat
integration (the chemical
reactor and heat exchanger
are both included in a single
apparatus)
simple construction
compared to conventional
reactor/heat exchanger
systems (reduced costs)

48
Figure 31. The catalytic tar converter developed by Fraunhofer UMSICHT (Schulzke, 2009)
Two layers 3 × 3 of Ni-monolith, laminar flow in channels (u < 1.5 m s-1
), residence time
≈ 0.4s
Pulse cleaning for dust removal: 1 sec N2-pulse every 1.5 hour, spatially distributed over time
Air addition between both layers, temperature control (inlet of second layer above 900°C)
Air treatment between experimental runs, regeneration (sulfur and coke removal)
Sulfur poisoning and coke deposition appear, but are reversible
Fast decrease of catalytic activity with respect to lower hydrocarbons (< 1 h)
Slow decrease of catalytic activity with respect to tars (≈ 1 week)
Regeneration by cautious air treatment (2-4 h) ⇒ in-situ, on-line
Activation with producer gas very fast, no pre-treatment is necessary

49
Figure 32. Test installation at Güssing
Figure 33. Reverse Flow Tar Converter (RFTC) developed by BTG, the Netherlands

50
Appendix II- Kinetic Study Results with Three Reactions
Devi kinetics has been used for the naphthalene steam reforming reaction, the second and third
reactions (WGS and methane reforming reactions) been considered as reversible reactions with
the following equilibrium constants:
Z = (1000 / T)-1
Kf2 = exp(Z (Z (0.63508 - 0.29353Z) + 4.1778) + 0.31688)
Kf3 = exp(Z (Z (Z (0.2513Z - 0.3665) - 0.58101) + 27.1332) - 3.277)
To check the accuracy of calculations for constants Kf2 and Kf3, once the model has been run for
temperatures between 800 and 1300°C and calculated results for Keq_2 and Keq_3 (WGS and
methane reforming reactions) were compared with reference data as shown in the table below
presenting data from the model and reference data.
Temperature Source Keq2 Keq3
800°C (Falbe, 1977) 1.04
1.0363255913764564
5.92e-3
0.0059430287284941204
1300°C (Falbe, 1977) 0.333
0.33070906606797285
1.82e-6
1.821547957484568E-6
The received temperature profile unexpectedly looked like in the Figure 34.
Figure 34. Temperature profile modeled with three reactions
It is known that kinetics of these three reactions did not come from same research references and
the naphthalene steam reforming reaction kinetics came from studies that considered an overall
model for tar reforming. For this reason, the published kinetics for the first reaction was used in
the modeling.
51
Appendix III- Polynomial Coefficients Data
THERMO ALL
200.000 1000.000 6000.000
H2O L 5/89H 2O 1 0 0G 200.000 6000.000 1000. 1
0.26770389E+01 0.29731816E-02-0.77376889E-06 0.94433514E-10-0.42689991E-14 2
-0.29885894E+05 0.68825500E+01 0.41986352E+01-0.20364017E-02 0.65203416E-05 3
-0.54879269E-08 0.17719680E-11-0.30293726E+05-0.84900901E+00-0.29084817E+05 4
CO RUS 79C 1O 1 0 0G 200.000 6000.000 1000. 1
0.30484859E+01 0.13517281E-02-0.48579405E-06 0.78853644E-10-0.46980746E-14 2
-0.14266117E+05 0.60170977E+01 0.35795335E+01-0.61035369E-03 0.10168143E-05 3
0.90700586E-09-0.90442449E-12-0.14344086E+05 0.35084093E+01-0.13293628E+05 4
CO2 L 7/88C 1O 2 0 0G 200.000 6000.000 1000. 1
0.46365111E+01 0.27414569E-02-0.99589759E-06 0.16038666E-09-0.91619857E-14 2
-0.49024904E+05-0.19348955E+01 0.23568130E+01 0.89841299E-02-0.71220632E-05 3
0.24573008E-08-0.14288548E-12-0.48371971E+05 0.99009035E+01-0.47328105E+05 4
CH4 RRHO g 8/99C 1.H 4. 0. 0.G 200.000 6000.000 1000. 1
1.91178600E+00 9.60267960E-03-3.38387841E-06 5.38797240E-10-3.19306807E-14 2
-1.00992136E+04 8.48241861E+00 5.14825732E+00-1.37002410E-02 4.93749414E-05 3
-4.91952339E-08 1.70097299E-11-1.02453222E+04-4.63322726E+00-8.97226656E+03 4
H2 REF ELEMENT tpis78H 2. 0. 0. 0.G 200.000 6000.000 1000. 1
2.93286575E+00 8.26608026E-04-1.46402364E-07 1.54100414E-11-6.88804800E-16 2
-8.13065581E+02-1.02432865E+00 2.34433112E+00 7.98052075E-03-1.94781510E-05 3
2.01572094E-08-7.37611761E-12-9.17935173E+02 6.83010238E-01 0.00000000E+00 4
C10H8 Naphthalene T 7/98C 10H 8 0 0G 200.000 6000.000 1000. 1
1.86129884E+01 3.04494175E-02-1.11224825E-05 1.81615474E-09-1.09601281E-13 2
8.91578988E+03-8.00230396E+01-1.04919475E+00 4.62970781E-02 7.07591636E-05 3
-1.38408111E-07 6.20475407E-11 1.59848987E+04 3.02121626E+01 1.81107678E+04 4
N2 REF ELEMENT G 8/02N 2. 0. 0. 0.G 200.000 6000.000 1000. 1
2.95257637E+00 1.39690040E-03-4.92631603E-07 7.86010195E-11-4.60755204E-15 2
-9.23948688E+02 5.87188762E+00 3.53100528E+00-1.23660988E-04-5.02999433E-07 3
2.43530612E-09-1.40881235E-12-1.04697628E+03 2.96747038E+00 0.00000000E+00 4

52
Appendix IV- Properties of Metallic Monolith Material
Monolith wall material, metallici:
Type Thickness(mm) Width (mm)
Tolerance (mm)
Max temperature Melting point
0Cr15Al5 0.03 - 0.11 10 - 300 0.005 1100 1250 0Cr20Al5 0.03 - 0.11 10 - 300 0.005 1200 1350 0Cr21Al6 0.03 - 0.11 10 - 300 0.005 1400 1540
The chemical composition in w-% of different FeCrAl alloys from Thermo Alloys
Company is shown in the table belowii:
Trade Mark % Cr % Al Scaling temp in air, at constant temperature, degrees C
Kanthal APM 22 5.8 1425 Kanthal A-1 22 5.8 1400 Kanthal AF 22 5.3 1300 Kanthal D 22 4.8 1300 Alkrothal 15 4.3 1100
Material from INCONEL® alloy HXiii
Ni 47.0, Cr 22.0, Fe 18.0, Mo 9.0, Co 1.5, W 0.6
This so-called ‘super-alloy’ has a very high strength and oxidation-resistance up to
(1100°C).
It is equal to standard specification UNS N06002 that can be found in COMSOL material
library under Ni alloy category, named ‘Inconel HX UNS N06002’
i http://www.alloypersistence.com/productshow/?64-3-Metal-substrate.html ii http://www.thermalloys.com/index.php/en/alloys/fecralalloys.html
iii http://www.specialmetals.com/documents/gas%20turbines.pdf

53
Appendix V-Heating from Half of the Reactor
A heating source was added to the second half of the reactor wall (outlet half). A new geometry
presenting the reactor wall in two parts was introduced as it can be shown in Figure 34. It was
then possible to set different boundary conditions for each part of the wall.
Figure 35. Geometry, reactor wall divided in two parts
The first half of the wall was considered insulated and a heat flux equal to 5 kW (5/4 kW for the
modeled geometry) added to the second half of the reactor wall. The resulting temperature
profile of such heating is illustrated below (Figure 35).
Figure 36. Temperature plot, first half of the reactor wall insulated, second half with 5kW heating for whole reactor
This model came from a set of another series of simulations having different input data.
Therefore, the results from this model should not be compared accurately with Cases in the body
of report. Of course, the overall temperature profile could be used.
Outlet
Inlet
Reactor wall
First half Reactor wall
Second half,
Heated

54
Appendix VI-Digital Appendices
The following files have been attached to the report:
Case1-N84
Case1-N90
Case1-N87
Case2- Heating from Reactor Wall
Case3- metal Monolith Support
Case4-Heating from Monolith Center