design of optimal storage and recovery strategies of ... · design of optimal storage and recovery...
TRANSCRIPT
Centre for Petroleum Studies
Design of Optimal Storage and Recovery Strategies of Carbon Dioxide using the
Wytch Farm Reservoir Model
By
Oseme Ugochukwu Daniel
A report submitted in partial fulfilment of the requirements for the MSc and/or the DIC.
September 2011


i
DECLARATION OF OWN WORK
I declare that this thesis Design of Optimal Storage and Recovery Strategies of Carbon Dioxide using the
Wytch Farm Reservoir Model is entirely my own work and that where any material could be construed as
the work of others, it is fully cited and referenced, and/or with appropriate acknowledgement given.
Signature: .................................................................................
Name of student: Oseme Ugochukwu Daniel
Names of supervisors: Prof M. Blunt
ii [Design of Optimal Storage and Recovery Strategies of Carbon Dioxide using the Wytch Farm Reservoir Model]
ABSTRACT
Carbon dioxide (CO2) injection into hydrocarbon reservoirs to achieve Enhanced Oil Recovery (EOR)
and Carbon Capture and Sequestration (CCS) is one of the main challenges faced by the oil industry. The
effective implementation of this process in oil reservoirs will provide both the environmental advantage
of reductions in CO2 emissions while maximizing oil recovery. The objective of this study is to find
injection strategies that would achieve optimum CO2 storage and oil recovery in the reservoir.
We perform compositional simulations for a section of a reservoir model representing the Wytch Farm
oilfield which is the Europe’s largest onshore field. This involved analyzing the candidate reservoir for
CO2 flooding and comparing different injection strategies which were gas injection after water flooding
(GAW) and water alternating gas (WAG) while testing the effect of nitrogen in the injection stream and
the mass evaluation of the net CO2 stored, to determine the different trapping mechanisms in various
phases.
The results show that CO2 CCS and EOR process is a possibility for the reservoir and that optimal
storage and recovery strategies of CO2 for the reservoir model are based on the availability of the
injection gas and the objective of the injection process. The GAW process involves re-cycling due to CO2
breakthrough. The WAG process would give long-term CO2 storage mechanisms and reduce the risk of
mobile CO2 leakage to the surface.

iii
ACKNOWLEDGEMENTS
I would like to express my gratitude to my supervisor, Professor Martin Blunt, for his invaluable
support, encouragement, supervision and useful suggestions throughout the research work. I am also
extremely thankful to my mother Mrs Helen Eteimua Oseme for her encouragement during difficult times
of the project period. Furthermore, I would like to thank SPDC Nigeria for sponsoring my MSc course at
Imperial College London. God bless you all.
.

iv [Design of Optimal Storage and Recovery Strategies of Carbon Dioxide using the Wytch Farm Reservoir Model]
TABLE OF CONTENTS ABSTRACT................................................................................................................................................................................ ii ACKNOWLEDGENTS .............................................................................................................................................................iii TABLE OF CONTENTS ........................................................................................................................................................... iv LIST OF FIGURES .................................................................................................................................................................... v LIST OF FIGURES IN APPENDICES ...................................................................................................................................... v LIST OF TABLES ..................................................................................................................................................................... vi Introduction................................................................................................................................................................................ 1 Reservoir Model Description and Fluid Properties .............................................................................................................. 3 Methodology.............................................................................................................................................................................. 5 Results and Discussion ........................................................................................................................................................... 7 Conclusions ............................................................................................................................................................................. 14 Acknowledgements ................................................................................................................................................................ 14 Nomenclature.......................................................................................................................................................................... 14 Conversion Factors & Units .................................................................................................................................................. 15 References .............................................................................................................................................................................. 15 Appendix .................................................................................................................................................................................. 17 APPENDIX A: CRITICAL LITERATURE REVIEWS .......................................................................................................... 18 APPENDIX B: CRITICAL MILESTONES TABLE .............................................................................................................. 26 APPENDIX C: CO2 STORAGE INCREASE WITH TIME ................................................................................................ 27 APPENDIX E: PVT TUNNING AND REGRESSION RESULTS...................................................................................... 31 APPENDIX E: DESCRIPTION OF THE POROSITY AND PERMEABILITY DISTRIBUTION .................................... 36

v
LIST OF FIGURES
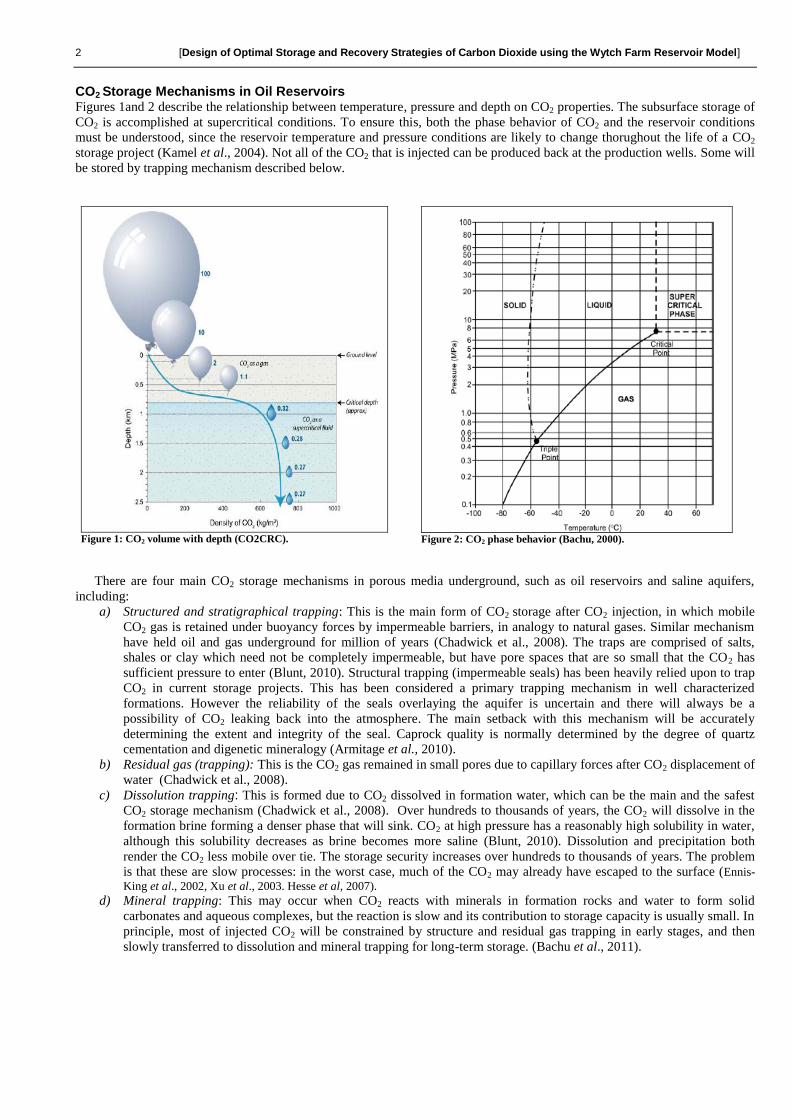
Figure 1: CO2 volume with depth (CO2CRC). ............................................................................................................................... 2
Figure 2: CO2 phase behavior (Bachu, 2000). ................................................................................................................................ 2
Figure 3: The side view presentation of the facies of the model indicating heterogeneity. ............................................................ 4
Figure 4: The oil-water and gas-oil relative permeabilities. ........................................................................................................... 4
Figure 5: Plot of phase behavior. .................................................................................................................................................... 6
Figure 6: Plot of constant composition expansion for relative volume. ........................................................................................ 6
Figure 7: View of the model and well locations. ........................................................................................................................... 7
Figure 8: Mass evaluation of the trapping mechanisms. ................................................................................................................. 8
Figure 9: A 2D slice view of CO2 saturation during injection from field scale. ............................................................................. 8
Figure 10: Plot of cumulative production for the injection strategies and their respective CO2 breakthrough times. .................... 9
Figure 11: Plots showing the cumulative production for pure and contaminated CO2 injection and the resulting amount of CO2
dissolved in oil. ............................................................................................................................................................................... 9
Figure 12: Plots showing the trend of the amount of CO2 dissolved in water for different cases. ................................................ 10
Figure 13: Plots showing the trend of the amount of CO2 trapped in gas phase for different cases. ............................................ 10
Figure 14: Plots showing the trend of the amount of CO2 mobile in gas for different cases. ....................................................... 10
Figure 15: Plots showing the trend of the amount of CO2 dissolved in oil for different cases. .................................................... 11
Figure 16: Plots showing the cumulative production and CO2 stored for all cases. ..................................................................... 12
Figure 17: Amount of CO2 trapped for the designed of same amount of CO2 for storage for the WAG and GAW cases. .......... 13
LIST OF FIGURES IN APPENDICES Figure C 1: CO2 storage security increase with time (IPCC, 2005). ................................................................................... 27 Figure C 2: Correlation for CO2 minimum pressure as a function of temperature (Mungan, 1981). ............................. 27 Figure 1: Porosity distribution of the reservoir model. .......................................................................................................... 36 Figure 2: Permeability distribution of the reservoir model. ................................................................................................... 36 Figure 3: Description of the edges of the reservoir model. .................................................................................................. 36

vi [Design of Optimal Storage and Recovery Strategies of Carbon Dioxide using the Wytch Farm Reservoir Model]
LIST OF TABLES
Table 1: Initial oil composition and the reservoir rock properties. ................................................................................................. 5
Table 2: Screening criteria for CO2 flooding. ................................................................................................................................. 5
Table 3: Summary of component properties and Peng-Robinson parameters used to describe the fluid model. ........................... 6
Table 4: The compostion of the oil and injection stream. ............................................................................................................... 7
Table 5: Evaluation of storage capacities for the injection strategies after 12,000 days. .............................................................. 11
Table 6: Strategies table for storage of CO2 with the same storage amount target. ...................................................................... 13
Design of Optimal Storage and Recovery Strategies of Carbon Dioxide using the Wytch Farm Reservoir Model
Oseme Ugochukwu Daniel
Imperial College supervisor: Prof. Martin J. Blunt
Abstract
Carbon dioxide (CO2) injection into hydrocarbon reservoirs to achieve Enhanced Oil Recovery (EOR) and Carbon Capture and
Sequestration (CCS) is one of the main challenges faced by the oil industry. The effective implementation of this process in oil
reservoirs will provide both the environmental advantage of reductions in CO2 emissions while maximizing oil recovery. The
objective of this study is to find injection strategies that would achieve optimum CO2 storage and oil recovery in the reservoir.
We perform compositional simulations for a section of a reservoir model representing the Wytch Farm oilfield which is the
Europe’s largest onshore field. This involved analyzing the candidate reservoir for CO2 flooding and comparing different
injection strategies which were gas injection after water flooding (GAW) and water alternating gas (WAG) while testing the
effect of nitrogen in the injection stream and the mass evaluation of the net CO2 stored, to determine the different trapping
mechanisms in various phases.
The results show that CO2 CCS and EOR process is a possibility for the reservoir and that optimal storage and recovery
strategies of CO2 for the reservoir model are based on the availability of the injection gas and the objective of the injection
process. The GAW process involves re-cycling due to CO2 breakthrough. The WAG process would give long-term CO2
storage mechanisms and reduce the risk of mobile CO2 leakage to the surface.
Introduction
Carbon Capture and Storage (CCS), the collection of CO2 from industrial sources and its injection underground, could
contribute significantly to reductions in atmosphere emissions of greenhouse gases (IPCC, 2005). Possible sites for injection
include coalbeds, deep saline aquifers, and depleted oil and gas reservoirs. Although aquifers have the greatest storage
potential, injecting CO2 into depleted oil and gas reservoirs can provide additional hydrocarbon production and improve storage
security (Qi et al., 2008).
Carbon dioxide has been injected for Enhanced Oil Recovery (EOR) since the 1970s. The main factor impacting the
efficiency of EOR with CO2 injection is the miscibility of CO2 in the oil phase (Orr and Taber, 1989, Blunt et al., 1993, Orr et
al., 1995). At pressures greater than the minimum miscibility pressure (MMP), oil and CO2 are mutually soluble. The dissolved
CO2 reduces the viscosity of oil and causes the swelling of the oil phase, hence improving the ability to flow through the
reservoir rock. Screening criteria for selecting reservoirs where CO2 may sustain or increase the production have been
proposed. To date, CO2 injection projects have focused on oil with densities ranging from 29 to 48 o API ( 855 to 711 kg/m
3 )
and reservoir depths from 760 to 3700 m (2600ft to 12000ft) (Taber et al., 1997). To date, injection processes have been
designed to minimize the amount of CO2 injected per barrel of oil produced, thereby minimizing the purchased cost of CO2.
However, when the goal is to store carbon dioxide, the design question changes significantly (Kovscek, 2002). The design for
oil recovery should achieve maximum emplacement of the injected CO2 as well as to maximize oil recovery.
CO2 flooding has the disadvantage that the unfavorable mobility ratio between the oil and CO2 can result in early CO2
breakthrough because of channeling of CO2 through the reservoir fluids. Water alternating gas (WAG) injection can be
successfully applied to improve sweep efficiency and delay CO2 breakthrough. Injecting CO2 into depleted oil and gas
reservoirs for EOR results in additional hydrocarbon recovery generating revenue to off-set the cost of capture and storage
(Lake, 1989).
This paper will focus on the optimal storage and recovery injection strategies for carbon dioxide in a section of the Wytch
Farm reservoir. The Sherwood reservoir is a heterogeneous arkosic fluvio-lactustrine deposit which is capped by the Mercia
mudstone group believed to represent an extensive playa deposit. Dip closure to the east and west and sealing faults along the
northern and southern boundaries of the reservoir provide the trap. The Wytch Farm oilfield is located in Poole, south coast
UK, in Dorset, and extends offshore beneath Poole Harbour and the Isle of Purbeck. It is Europe’s largest onshore oilfield. The
Sherwood reservoir stretches both onshore and offshore with one third of the reservoir offshore (McKie et al., 1998). The
reservoir model and fluid are summarized, the results of the various injection and optimization methods, the storage capacity
are analyzed using compositional simulation to account for recovery and storage potential of the model.
Imperial College London
2 [Design of Optimal Storage and Recovery Strategies of Carbon Dioxide using the Wytch Farm Reservoir Model]
CO2 Storage Mechanisms in Oil Reservoirs Figures 1and 2 describe the relationship between temperature, pressure and depth on CO2 properties. The subsurface storage of
CO2 is accomplished at supercritical conditions. To ensure this, both the phase behavior of CO2 and the reservoir conditions
must be understood, since the reservoir temperature and pressure conditions are likely to change thorughout the life of a CO2
storage project (Kamel et al., 2004). Not all of the CO2 that is injected can be produced back at the production wells. Some will
be stored by trapping mechanism described below.
There are four main CO2 storage mechanisms in porous media underground, such as oil reservoirs and saline aquifers,
including:
a) Structured and stratigraphical trapping: This is the main form of CO2 storage after CO2 injection, in which mobile
CO2 gas is retained under buoyancy forces by impermeable barriers, in analogy to natural gases. Similar mechanism
have held oil and gas underground for million of years (Chadwick et al., 2008). The traps are comprised of salts,
shales or clay which need not be completely impermeable, but have pore spaces that are so small that the CO2 has
sufficient pressure to enter (Blunt, 2010). Structural trapping (impermeable seals) has been heavily relied upon to trap
CO2 in current storage projects. This has been considered a primary trapping mechanism in well characterized
formations. However the reliability of the seals overlaying the aquifer is uncertain and there will always be a
possibility of CO2 leaking back into the atmosphere. The main setback with this mechanism will be accurately
determining the extent and integrity of the seal. Caprock quality is normally determined by the degree of quartz
cementation and digenetic mineralogy (Armitage et al., 2010).
b) Residual gas (trapping): This is the CO2 gas remained in small pores due to capillary forces after CO2 displacement of
water (Chadwick et al., 2008).
c) Dissolution trapping: This is formed due to CO2 dissolved in formation water, which can be the main and the safest
CO2 storage mechanism (Chadwick et al., 2008). Over hundreds to thousands of years, the CO2 will dissolve in the
formation brine forming a denser phase that will sink. CO2 at high pressure has a reasonably high solubility in water,
although this solubility decreases as brine becomes more saline (Blunt, 2010). Dissolution and precipitation both
render the CO2 less mobile over tie. The storage security increases over hundreds to thousands of years. The problem
is that these are slow processes: in the worst case, much of the CO2 may already have escaped to the surface (Ennis-
King et al., 2002, Xu et al., 2003. Hesse et al, 2007). d) Mineral trapping: This may occur when CO2 reacts with minerals in formation rocks and water to form solid
carbonates and aqueous complexes, but the reaction is slow and its contribution to storage capacity is usually small. In
principle, most of injected CO2 will be constrained by structure and residual gas trapping in early stages, and then
slowly transferred to dissolution and mineral trapping for long-term storage. (Bachu et al., 2011).
Figure 1: CO2 volume with depth (CO2CRC).
Figure 2: CO2 phase behavior (Bachu, 2000).
[Design of Optimal Storage and Recovery Strategies of Carbon Dioxide using the Wytch Farm Reservoir Model] 3
The mass of CO2 in place before injection for the reservoir can be estimated using (Bachu et al., 2011):
122
-S× h×× A R×= ρM wfrCOCO (1)
Converting the hydrocarbon pore volume, PV (A×h ) of the hydrocarbon to mass of CO2 based on the reservoir properties and
density of CO2 injected as a supercritical fluid of density 710 kg/m3(Figure 1)
the
storage capacity is 16×10
8 kg ( 16×10
5
tonnes).
For a flooded reservoir with aquifer influx and water injection, we have;
122
+V-V-S× h×× A R×= ρM pw injwfrCOCO (2)
where rCOρ2
is the CO2 density at reservoir (kg/m3), Rf is the recovery factor which is 45% for the wytch farm model, A is area,
h is thickness, ɸ is porosity, Sw is the water saturation in the reservoir, is the volume of injected, gas or solvent (for flooded
reservoirs) and Vpw is the volume of produced water. The volumes of injected and/ or produced water, solvent or gas are
calculated from production records. The total theoretical storage capacity of CO2 in a combined reservoir can be divided into
two parts, respectively contributed by the oil reservoir and its associated aquifers (see Eq. (3)) (Zhang et al., 2011):
aquiferinMoilin= MM COCOCO 222
(3)
where2COM is the theoretical storage capacity of CO2 in the combined reservoir (million ton), oilinMCO
2is the theoretical
storage capacity in the oil reservoir (million tonnes), and aquiferinMCO 2
is the theoretical storage capacity in the
associated aquifer (million tonnes). As the aquifer is weak, we ignore the mass of CO2 dissolved in aquifer and focus on the
amount in oil reservoir and inject into the oil column and the main drive mechanism is compaction drive due to the continuous
impermeable layer at the base Sherwood. The theoretical storage capacity in oil reservoirs can be calculated by the following
Equation (Zhang et al., 2011). oil
eral
oil
waterindisolution
oil
oilinndissolutiodisplacedCO MMMMOilinM min2 (4)
The composition of CO2 is 0.17% of the hydrocarbon component and there is CO2 initially in place. CO2 will be produced
with the oil during primary and secondary production. The above equation can be modified by adding the amount of CO2
present at the start of CO2 injection.
)( min22
oil
eral
oil
waterindisolution
oil
oilinndissolutiodisplacedpresentCOCO MMMMMOilinM (5)
MCO2present is the storage capacity present in the reservoir at the start of CO2 injection. This is possible due to presence of CO2
in the original oil composition, displacedM is the storage capacity provided by the voided space due to water or CO2 flooding in
the reservoir (million tonnes), in this case, the mobile CO2 in gas phase falls under the displacedM which represent the fraction
of CO2 injected that will displace oil and could be trapped by impermeable barriers. oil
waterindisolutionM is the storage capacity
by dissolution in formation water in the oil reservoir (million ton),oil
oilinndissolutioM is the storage capacity by dissolution in the
remaining oil of the oil reservoir (million tonnes) andoil
eralMmin is the storage capacity by mineral trapping in the oil reservoir
(million tonnes). These values are calculated from the compositional simulation.
Reservoir Model Description and Fluid Properties
The depth of the top of the reservoir is 1585 m . The permeability range is 0.1-1.5×10⁻¹²
m2. The sand porosity is roughly 0.2
(Figure E 1). In addition, the reservoir pore volume is about 30 × 106 m
3 and the initial average oil saturation is 0.64 with 19
million sm3 of oil in place. The reservoir model chosen is based on the actual offshore section of the Wytch Farm producing
field containing 20×18× 40 grid blocks with 14,380 active cells. The x and y dimensions of each grid block are 180m. The
model is divided into 5 layers vertically with facies distribution from top to bottom as a result of the depositional environment
(Figure 3). The model was chosen instead of the full field model because of the time constraint in running the full model. The
model rock characterization is based on well log data and history matched analysis made in imperial college with the
permission of the British Petroleum.
4 [Design of Optimal Storage and Recovery Strategies of Carbon Dioxide using the Wytch Farm Reservoir Model]
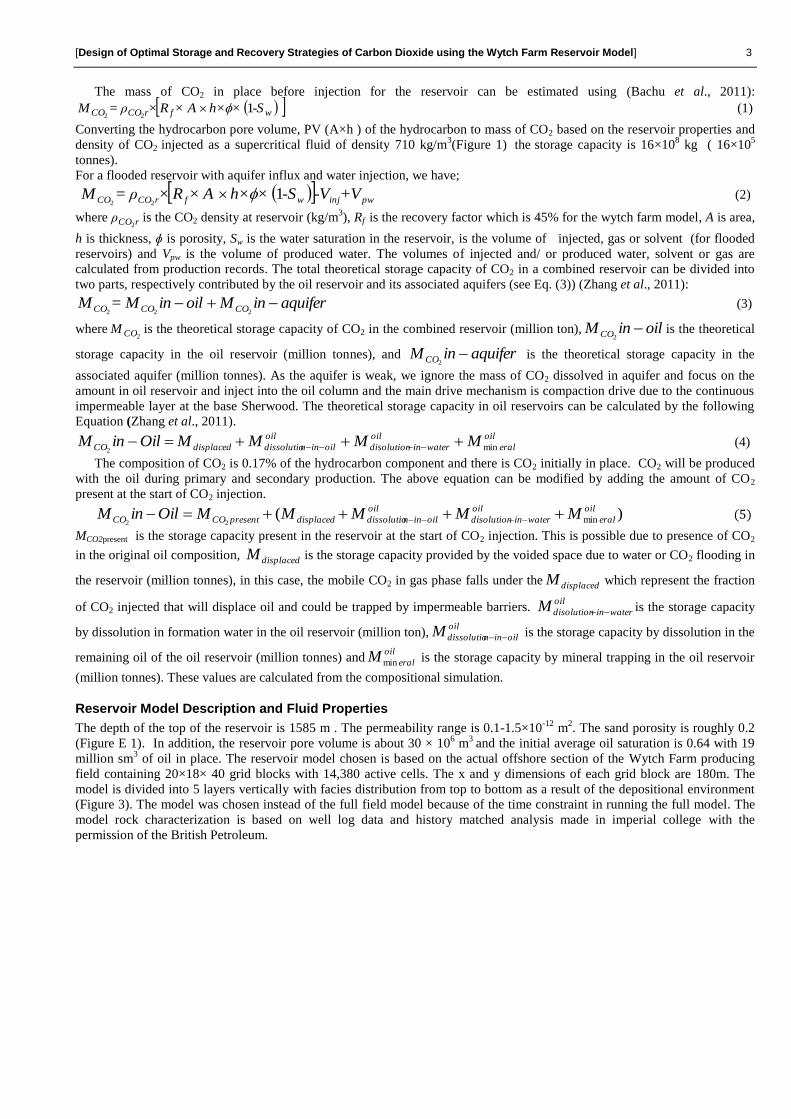
Figure 3: The side view presentation of the facies of the model indicating heterogeneity.
The boundary conditions for the model are the faults at the edges, the anticlinal structure, and the continuous shale at the
base of the Sherwood sandstone and the water bottom at the base of the model as shown in Figure 3. Hence, it is a fully
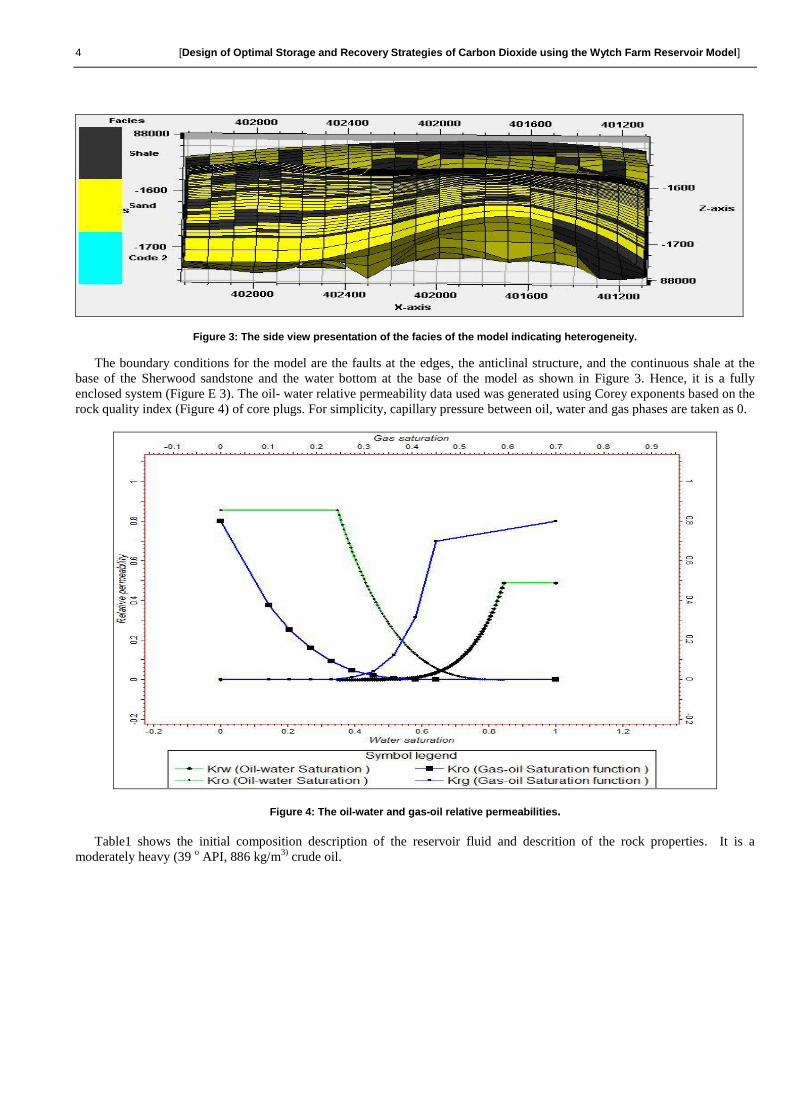
enclosed system (Figure E 3). The oil- water relative permeability data used was generated using Corey exponents based on the
rock quality index (Figure 4) of core plugs. For simplicity, capillary pressure between oil, water and gas phases are taken as 0.
Figure 4: The oil-water and gas-oil relative permeabilities.
Table1 shows the initial composition description of the reservoir fluid and descrition of the rock properties. It is a
moderately heavy (39 o API, 886 kg/m
3) crude oil.

[Design of Optimal Storage and Recovery Strategies of Carbon Dioxide using the Wytch Farm Reservoir Model] 5
Table 1: Initial oil composition and the reservoir rock properties. Initial fluid composition
Component Mole fraction Frac of C7+ MW Reservoir description
CO2 0.0017
Property Value
Porosity 20%
Permeability 100mD
Depth 1585m
Thickness 30m
Salinity 35,000 mg/l
Temperature 50oC
Pressure (datum depth 1585m) (168 bar)
Model Size 20 × 18 × 40
Grid block sizes 180m × 180 m
Rock Compressibility, Cr 0.0003 bar-1
N2 0.0267
C1 0.1472
C2 0.0706
C3 0.1004
IC4 0.0256
NC4 0.0692
IC5 0.0294
NC5 0.0385
C6 0.0529
C7 0.0617 0.14098193 14.09319
C8 0.0672 0.15348475 17.49840
C9 0.0489 0.11169484 14.29694
C10 0.0378 0.08634079 12.26039
C11 0.0258 0.05915943 9.282887
C12+ 0.1963 0.44837825 195.4929
Reservoir model
Depth, m 1585 Oil API gravity 39 Oil viscosity, cp 0.34 Oil saturation,% 0.36
Molecular weight of C12+ in reservoir fluid= 436kmol/kg Specific gravity of C12+ in stock tank = 0.886 Molecular weight of reservoir fluid= 139.8kmol/kg
Methodology
Screening criteria
Reservoir depth, reservoir pressure oil density, reservoir temperature and oil composition were the screening criteria used to
determine the possibility for CO2 flooding for the reservoir. These values were used to determine the miscibity pressure for
conducting CO2-EOR. It has been recognized that not all oil reservoirs are suitable for CO2 EOR. Zhao, (2001) presented
screening criteria (Table 1) which considers various characteristics of oil fields in terms of miscible gas flooding for EOR.
Table 2: Screening criteria for CO2 flooding. Reservoir Parameters Range
Depth, m >762 Oil API gravity >22 Oil viscosity, mPa.s <10 Remaining Oil saturation, % >20
The comparsion of Table 2 with Table 1 shows that the Wytch Farm reservoir is a candidate for the CO2 – EOR process.
The boundary conditions of cap rock, faults and bottom water body-aquifer are also present to make the model a structurally
realistic field. Pure CO2 and the reservoir fluid are not miscible at the reservoir pressure. The minimum miscible pressure
(MMP) of pure CO2 is estimated to be in excess of 270 bars using the Cronquist correlation (Mungan, 1981). This determines
MMP based on reservoir temperature (T,oK) and molecular weight of the heavier fractions (MW C5+) of the reservoir oil,
without considering the mole fraction of methane with the assumption that most of the methane would have been produced
during primary recovery (Figure C 2). The Cronquist correlation is stated below: )5001038.0744206.0(988.15 MWCTMMP (6)
The initial pressure of the reservoir is 168 bars at a datum depth of 1585m. Miscible injection can be achieved with addition
of solvent into the gas stream during gas flooding for Minimum Miscibility Enrichment,MME and injecting either pure CO2 or
solvent at pressure above MMP. Solvent is usually designed to develop miscibility. The injection pressure is calculated such
that it is expected to be more than the MMP for miscible gas injection but less than the fracture pressure. At cases where
injection pressure is lower than MMP, there would be immiscible gas injection. The miscibility pressure of 270 bars is taken.
6 [Design of Optimal Storage and Recovery Strategies of Carbon Dioxide using the Wytch Farm Reservoir Model]
Injection scenarios
The main goal is to find injection scenarios leading to maximum oil recovey and maximum storage of CO2 in the reservoir. To
achieve this goal, reservoir flow simulation was performed in EclipseTM
300, a fully compositional three dimensional finite-
difference reservoir simulator with PETRELTM
RE 2010 to visualize the model in three dimensions. The code for a WAG case
is found in Appendix D. For ease of simulation, eleven components were used for tuning and regression of the PVT properties
using a three-parameter Peng Robinson equation of state to give the resulting compositional description of the fluid model with
the variables (critical pressure, critical temperature, critical compressibility factor, and volume shift). As shown in Table 3 and
Appendix E.
Table 3: Summary of component properties and Peng-Robinson parameters used to describe the fluid model.
Comp. Mol. Weight
Critical pres. (bar)
Critical Temp
(K)
Critical z- factor
Critical Volume
(m3/kg-mole)
Omega A Omega B Acentric Factor
Volume Shift
CO2 44.010 74 304.26 0.27408 0.0940 0.45723553 0.007796074 0.2250 -0.06956031
N2 28.013 34 126.48 0.29115 0.0900 0.45723553 0.007796074 0.0400 -0.18058376
C1 16.043 45 190.92 0.28473 0.0980 0.45723553 0.007796074 0.0130 -0.16160171
C2 30.070 49 305.37 0.28463 0.1479 0.45723553 0.007796074 0.0986 -0.12529310
C3 44.097 43 369.26 0.27748 0.2000 0.45723553 0.007796074 0.1524 -0.69866000
IC4 58.124 36 407.59 0.28274 0.2630 0.45723553 0.007796074 0.1848 -0.02734491
NC4 58.124 38 424.84 0.27386 0.2550 0.45723553 0.007796074 0.2010 -0.04196900
IC5 72.151 33 460.40 0.26823 0.3080 0.45723553 0.007796074 0.2223 -005700060
NC5 72.151 34 469.60 0.26884 0.3110 0.45723553 0.007796074 0.2539 -0.03891151
C6 84.000 33 512.00 0.27537 0.3510 0.45723553 0.007796074 0.2500 -0.01463601
C7+ 218.000 17 744.92 0.23425 0.8499 0.45723553 0.007796074 0.70397 0.13459234
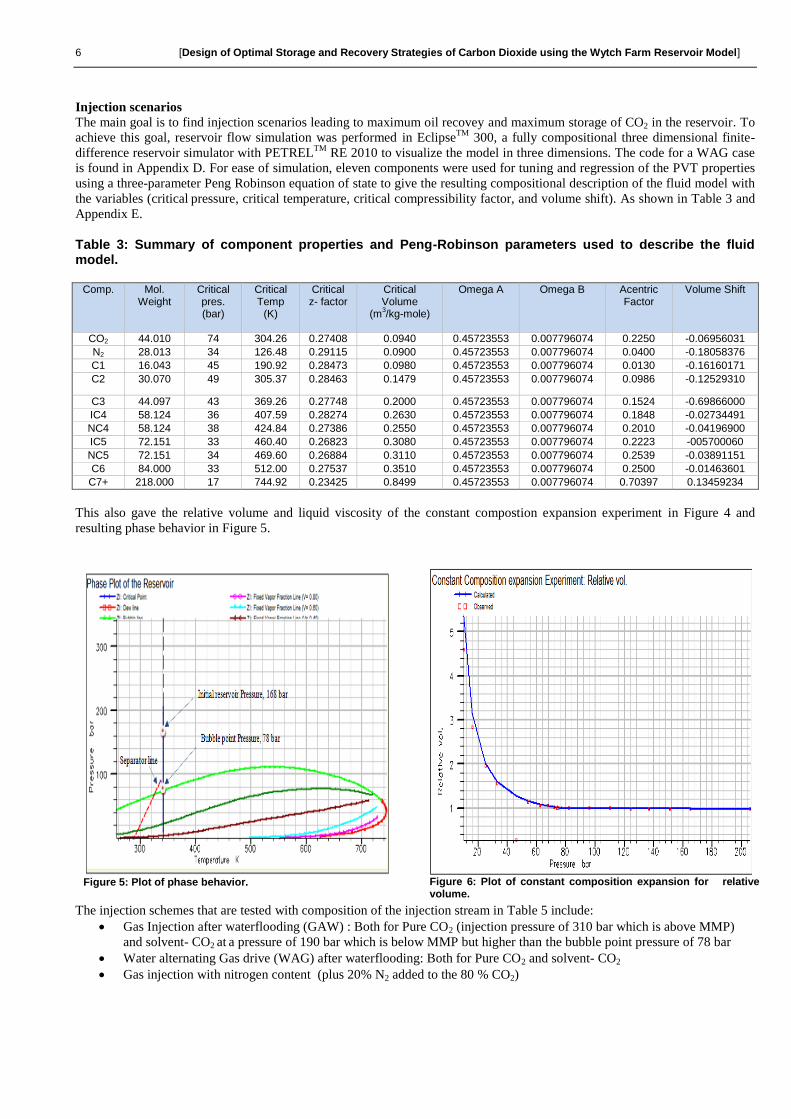
This also gave the relative volume and liquid viscosity of the constant compostion expansion experiment in Figure 4 and
resulting phase behavior in Figure 5.
The injection schemes that are tested with composition of the injection stream in Table 5 include:
Gas Injection after waterflooding (GAW) : Both for Pure CO2 (injection pressure of 310 bar which is above MMP)
and solvent- CO2 at a pressure of 190 bar which is below MMP but higher than the bubble point pressure of 78 bar
Water alternating Gas drive (WAG) after waterflooding: Both for Pure CO2 and solvent- CO2
Gas injection with nitrogen content (plus 20% N2 added to the 80 % CO2)
Figure 5: Plot of phase behavior.
Figure 6: Plot of constant composition expansion for relative volume.
[Design of Optimal Storage and Recovery Strategies of Carbon Dioxide using the Wytch Farm Reservoir Model] 7
Table 4: The composition of the oil and injection stream.
Component Reservoir oil Pure CO2 stream Solvent Contaminated stream
CO2 0.0017 1.0000 0.9000 0.8000
N2 0.0267 0.0000 0.0000 0.2000
CH4 0.1472 0.0000 0.0500 0.0000
C2 0.0706 0.0000 0.0500 0.0000
C3 0.1004 0.0000 0.0000 0.0000
IC4 0.0256 0.0000 0.0000 0.0000
NC4 0.0692 0.0000 0.0000 0.0000
IC5 0.0294 0.0000 0.0000 0.0000
NC5 0.0385 0.0000 0.0000 0.0000
C6 0.0529 0.0000 0.0000 0.0000
C7+ 0.4377 0.0000 0.0000 0.0000
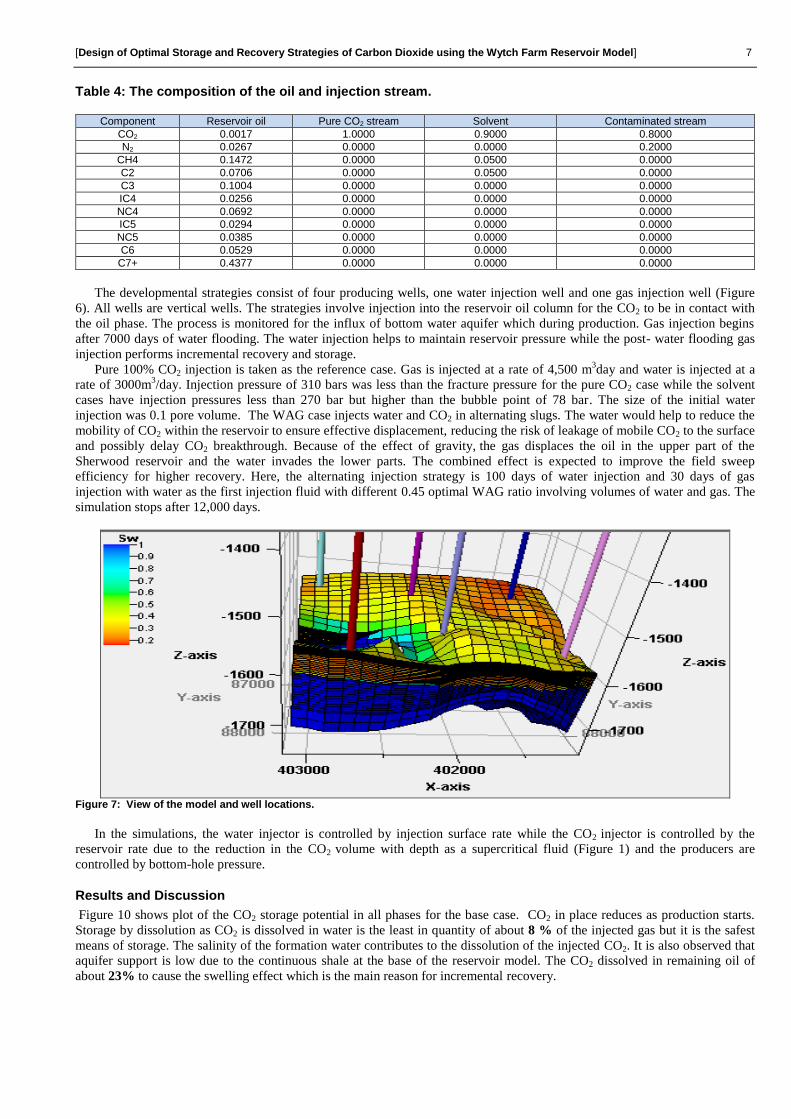
The developmental strategies consist of four producing wells, one water injection well and one gas injection well (Figure
6). All wells are vertical wells. The strategies involve injection into the reservoir oil column for the CO2 to be in contact with
the oil phase. The process is monitored for the influx of bottom water aquifer which during production. Gas injection begins
after 7000 days of water flooding. The water injection helps to maintain reservoir pressure while the post- water flooding gas
injection performs incremental recovery and storage.
Pure 100% CO2 injection is taken as the reference case. Gas is injected at a rate of 4,500 m3day and water is injected at a
rate of 3000m3/day. Injection pressure of 310 bars was less than the fracture pressure for the pure CO2 case while the solvent
cases have injection pressures less than 270 bar but higher than the bubble point of 78 bar. The size of the initial water
injection was 0.1 pore volume. The WAG case injects water and CO2 in alternating slugs. The water would help to reduce the
mobility of CO2 within the reservoir to ensure effective displacement, reducing the risk of leakage of mobile CO2 to the surface
and possibly delay CO2 breakthrough. Because of the effect of gravity, the gas displaces the oil in the upper part of the
Sherwood reservoir and the water invades the lower parts. The combined effect is expected to improve the field sweep
efficiency for higher recovery. Here, the alternating injection strategy is 100 days of water injection and 30 days of gas
injection with water as the first injection fluid with different 0.45 optimal WAG ratio involving volumes of water and gas. The
simulation stops after 12,000 days.
Figure 7: View of the model and well locations.
In the simulations, the water injector is controlled by injection surface rate while the CO2 injector is controlled by the
reservoir rate due to the reduction in the CO2 volume with depth as a supercritical fluid (Figure 1) and the producers are
controlled by bottom-hole pressure.
Results and Discussion
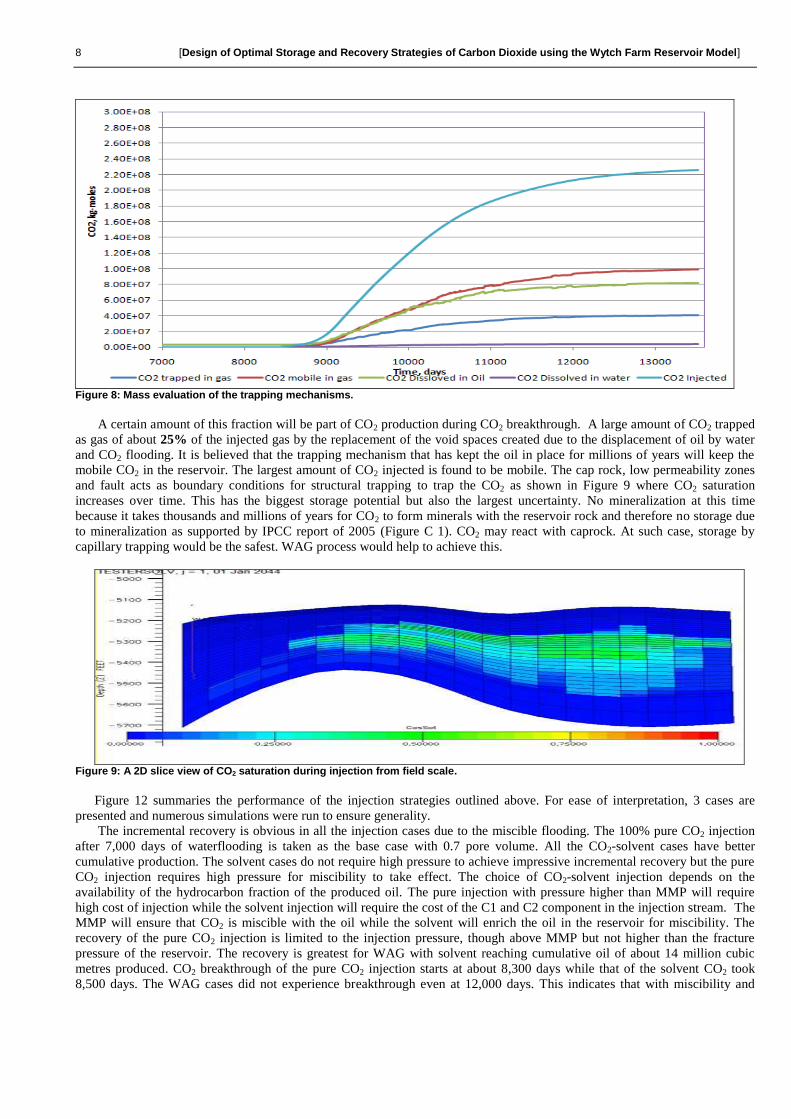
Figure 10 shows plot of the CO2 storage potential in all phases for the base case. CO2 in place reduces as production starts.
Storage by dissolution as CO2 is dissolved in water is the least in quantity of about 8 % of the injected gas but it is the safest
means of storage. The salinity of the formation water contributes to the dissolution of the injected CO2. It is also observed that
aquifer support is low due to the continuous shale at the base of the reservoir model. The CO2 dissolved in remaining oil of
about 23% to cause the swelling effect which is the main reason for incremental recovery.
8 [Design of Optimal Storage and Recovery Strategies of Carbon Dioxide using the Wytch Farm Reservoir Model]
Figure 8: Mass evaluation of the trapping mechanisms.
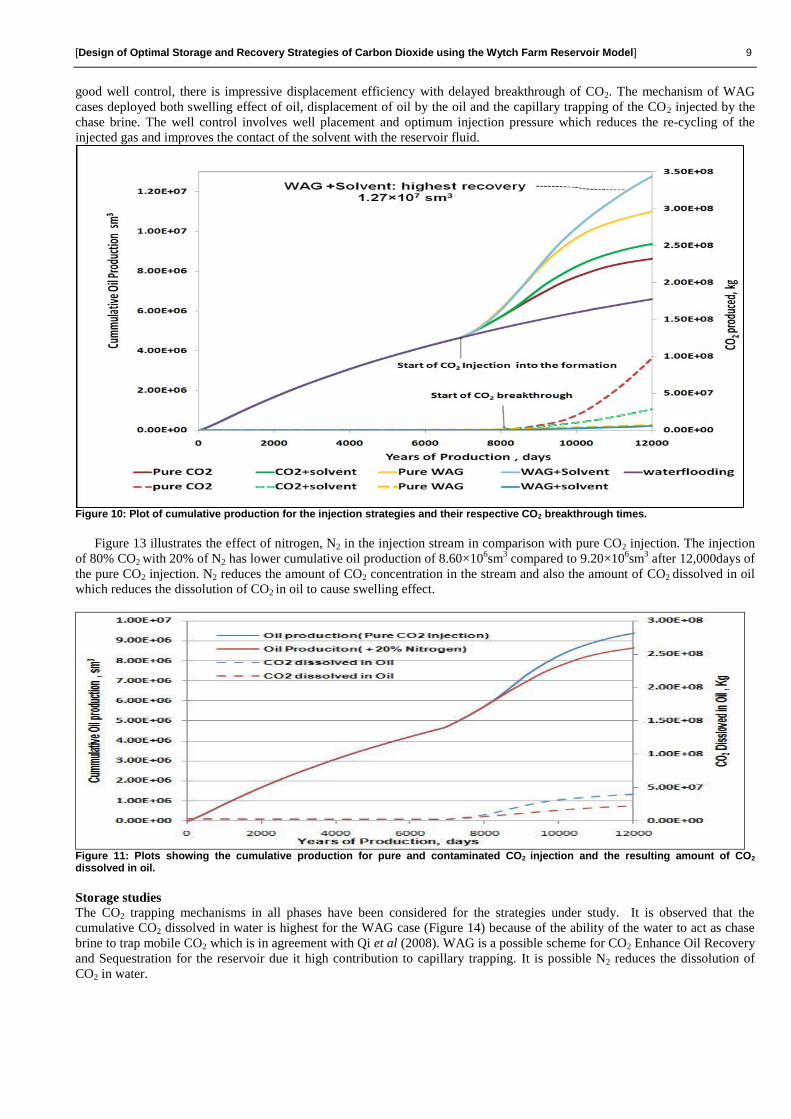
A certain amount of this fraction will be part of CO2 production during CO2 breakthrough. A large amount of CO2 trapped
as gas of about 25% of the injected gas by the replacement of the void spaces created due to the displacement of oil by water
and CO2 flooding. It is believed that the trapping mechanism that has kept the oil in place for millions of years will keep the
mobile CO2 in the reservoir. The largest amount of CO2 injected is found to be mobile. The cap rock, low permeability zones
and fault acts as boundary conditions for structural trapping to trap the CO2 as shown in Figure 9 where CO2 saturation
increases over time. This has the biggest storage potential but also the largest uncertainty. No mineralization at this time
because it takes thousands and millions of years for CO2 to form minerals with the reservoir rock and therefore no storage due
to mineralization as supported by IPCC report of 2005 (Figure C 1). CO2 may react with caprock. At such case, storage by
capillary trapping would be the safest. WAG process would help to achieve this.
Figure 9: A 2D slice view of CO2 saturation during injection from field scale.
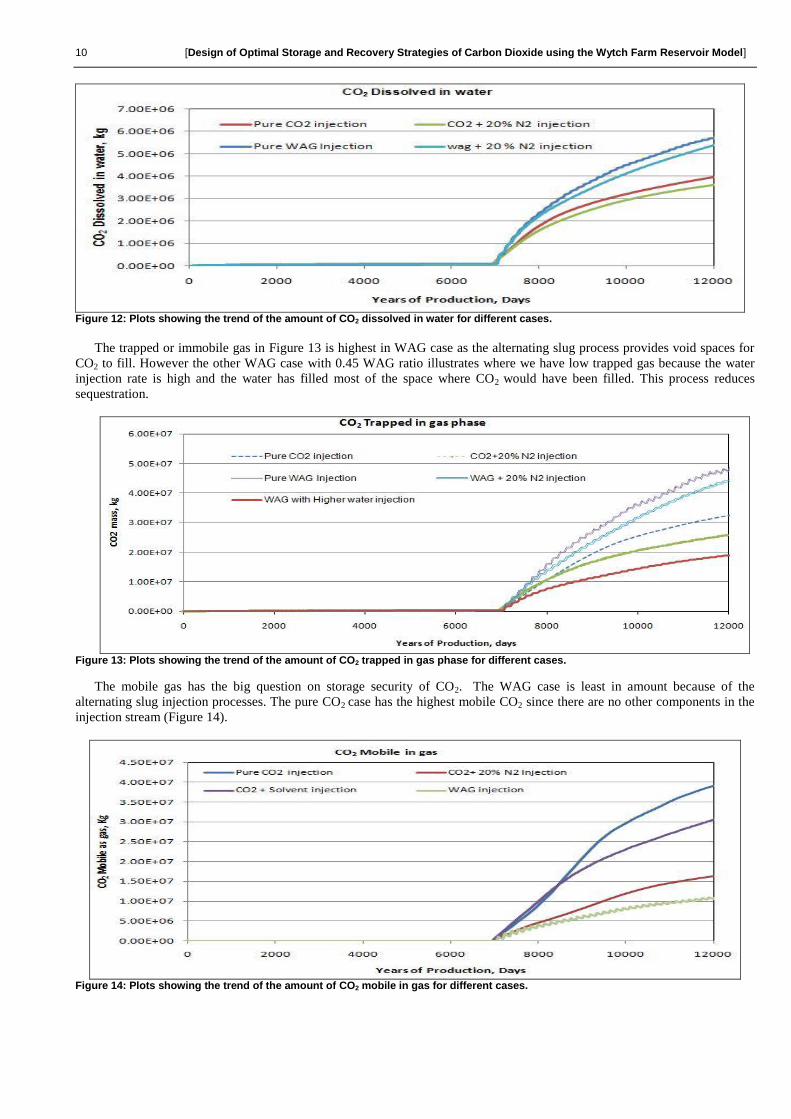
Figure 12 summaries the performance of the injection strategies outlined above. For ease of interpretation, 3 cases are
presented and numerous simulations were run to ensure generality.
The incremental recovery is obvious in all the injection cases due to the miscible flooding. The 100% pure CO2 injection
after 7,000 days of waterflooding is taken as the base case with 0.7 pore volume. All the CO2-solvent cases have better
cumulative production. The solvent cases do not require high pressure to achieve impressive incremental recovery but the pure
CO2 injection requires high pressure for miscibility to take effect. The choice of CO2-solvent injection depends on the
availability of the hydrocarbon fraction of the produced oil. The pure injection with pressure higher than MMP will require
high cost of injection while the solvent injection will require the cost of the C1 and C2 component in the injection stream. The
MMP will ensure that CO2 is miscible with the oil while the solvent will enrich the oil in the reservoir for miscibility. The
recovery of the pure CO2 injection is limited to the injection pressure, though above MMP but not higher than the fracture
pressure of the reservoir. The recovery is greatest for WAG with solvent reaching cumulative oil of about 14 million cubic
metres produced. CO2 breakthrough of the pure CO2 injection starts at about 8,300 days while that of the solvent CO2 took
8,500 days. The WAG cases did not experience breakthrough even at 12,000 days. This indicates that with miscibility and
[Design of Optimal Storage and Recovery Strategies of Carbon Dioxide using the Wytch Farm Reservoir Model] 9
good well control, there is impressive displacement efficiency with delayed breakthrough of CO2. The mechanism of WAG
cases deployed both swelling effect of oil, displacement of oil by the oil and the capillary trapping of the CO2 injected by the
chase brine. The well control involves well placement and optimum injection pressure which reduces the re-cycling of the
injected gas and improves the contact of the solvent with the reservoir fluid.
Figure 10: Plot of cumulative production for the injection strategies and their respective CO2 breakthrough times.
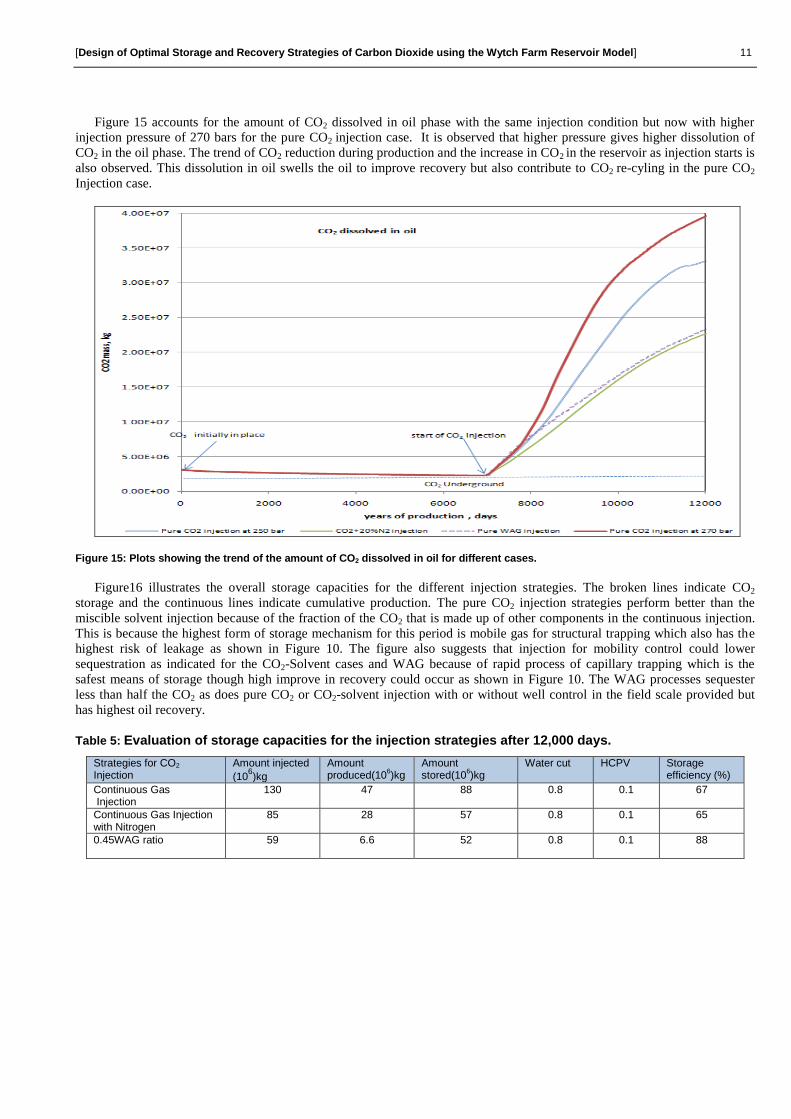
Figure 13 illustrates the effect of nitrogen, N2 in the injection stream in comparison with pure CO2 injection. The injection
of 80% CO2 with 20% of N2 has lower cumulative oil production of 8.60×10⁶sm
3 compared to 9.20×10
6sm
3 after 12,000days of
the pure CO2 injection. N2 reduces the amount of CO2 concentration in the stream and also the amount of CO2 dissolved in oil
which reduces the dissolution of CO2 in oil to cause swelling effect.
Figure 11: Plots showing the cumulative production for pure and contaminated CO2 injection and the resulting amount of CO2 dissolved in oil.
Storage studies
The CO2 trapping mechanisms in all phases have been considered for the strategies under study. It is observed that the
cumulative CO2 dissolved in water is highest for the WAG case (Figure 14) because of the ability of the water to act as chase
brine to trap mobile CO2 which is in agreement with Qi et al (2008). WAG is a possible scheme for CO2 Enhance Oil Recovery
and Sequestration for the reservoir due it high contribution to capillary trapping. It is possible N2 reduces the dissolution of
CO2 in water.
10 [Design of Optimal Storage and Recovery Strategies of Carbon Dioxide using the Wytch Farm Reservoir Model]
Figure 12: Plots showing the trend of the amount of CO2 dissolved in water for different cases.
The trapped or immobile gas in Figure 13 is highest in WAG case as the alternating slug process provides void spaces for
CO2 to fill. However the other WAG case with 0.45 WAG ratio illustrates where we have low trapped gas because the water
injection rate is high and the water has filled most of the space where CO2 would have been filled. This process reduces
sequestration.
Figure 13: Plots showing the trend of the amount of CO2 trapped in gas phase for different cases.
The mobile gas has the big question on storage security of CO2. The WAG case is least in amount because of the
alternating slug injection processes. The pure CO2 case has the highest mobile CO2 since there are no other components in the
injection stream (Figure 14).
Figure 14: Plots showing the trend of the amount of CO2 mobile in gas for different cases.
[Design of Optimal Storage and Recovery Strategies of Carbon Dioxide using the Wytch Farm Reservoir Model] 11
Figure 15 accounts for the amount of CO2 dissolved in oil phase with the same injection condition but now with higher
injection pressure of 270 bars for the pure CO2 injection case. It is observed that higher pressure gives higher dissolution of
CO2 in the oil phase. The trend of CO2 reduction during production and the increase in CO2 in the reservoir as injection starts is
also observed. This dissolution in oil swells the oil to improve recovery but also contribute to CO2 re-cyling in the pure CO2
Injection case.
Figure 15: Plots showing the trend of the amount of CO2 dissolved in oil for different cases.
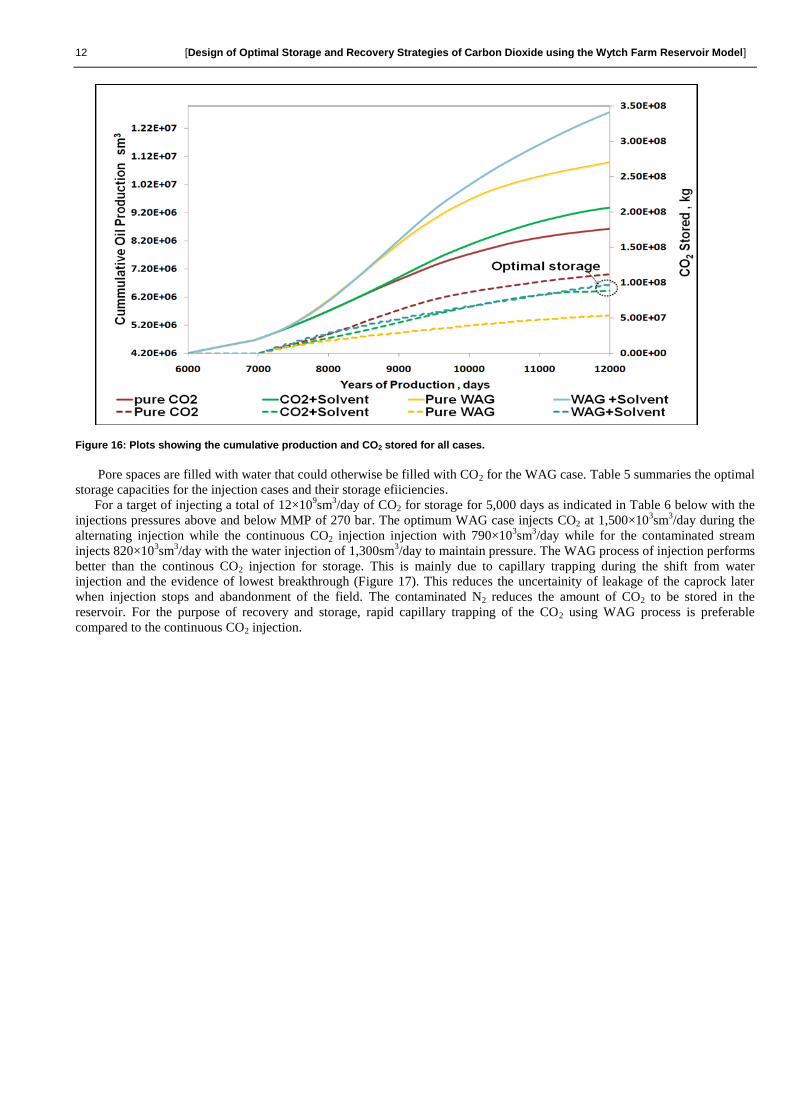
Figure16 illustrates the overall storage capacities for the different injection strategies. The broken lines indicate CO2
storage and the continuous lines indicate cumulative production. The pure CO2 injection strategies perform better than the
miscible solvent injection because of the fraction of the CO2 that is made up of other components in the continuous injection.
This is because the highest form of storage mechanism for this period is mobile gas for structural trapping which also has the
highest risk of leakage as shown in Figure 10. The figure also suggests that injection for mobility control could lower
sequestration as indicated for the CO2-Solvent cases and WAG because of rapid process of capillary trapping which is the
safest means of storage though high improve in recovery could occur as shown in Figure 10. The WAG processes sequester
less than half the CO2 as does pure CO2 or CO2-solvent injection with or without well control in the field scale provided but
has highest oil recovery.
Table 5: Evaluation of storage capacities for the injection strategies after 12,000 days.
Strategies for CO2 Injection
Amount injected
(106)kg
Amount produced(10
6)kg
Amount stored(10
6)kg
Water cut HCPV Storage efficiency (%)
Continuous Gas Injection
130 47 88 0.8 0.1 67
Continuous Gas Injection with Nitrogen
85 28 57 0.8 0.1 65
0.45WAG ratio 59 6.6 52 0.8 0.1 88
12 [Design of Optimal Storage and Recovery Strategies of Carbon Dioxide using the Wytch Farm Reservoir Model]
Figure 16: Plots showing the cumulative production and CO2 stored for all cases.
Pore spaces are filled with water that could otherwise be filled with CO2 for the WAG case. Table 5 summaries the optimal
storage capacities for the injection cases and their storage efiiciencies.
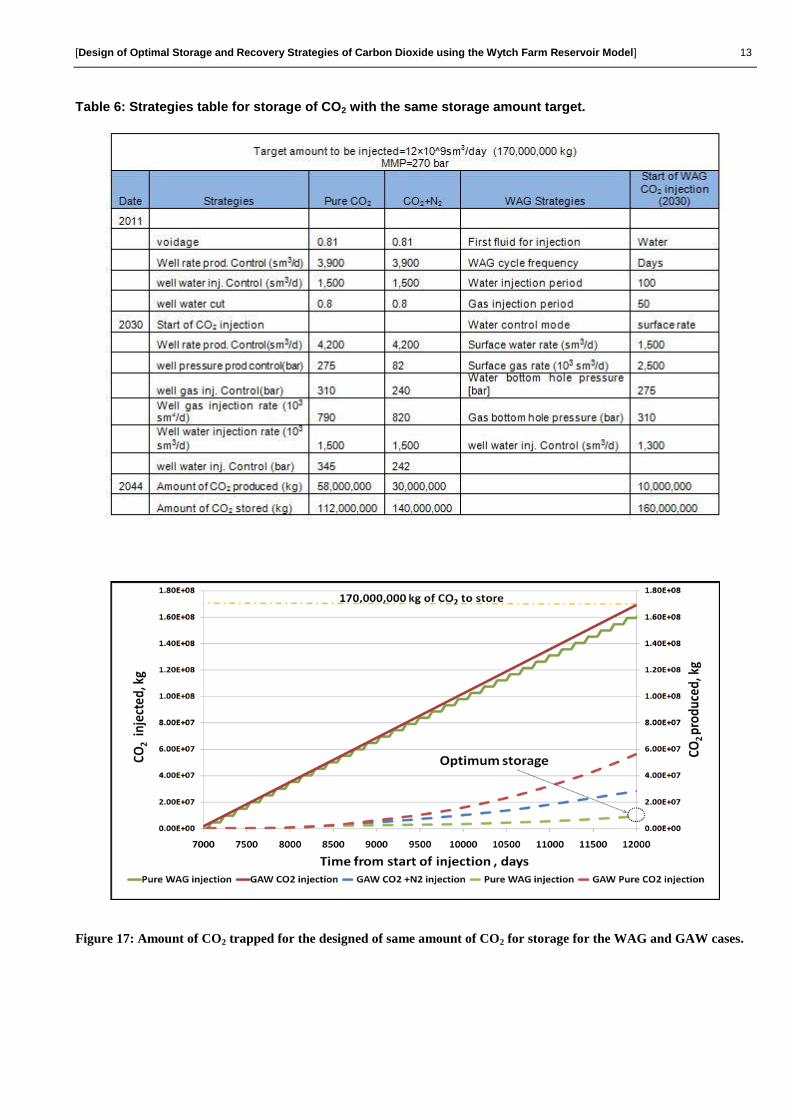
For a target of injecting a total of 12×109sm
3/day of CO2 for storage for 5,000 days as indicated in Table 6 below with the
injections pressures above and below MMP of 270 bar. The optimum WAG case injects CO2 at 1,500×103sm
3/day during the
alternating injection while the continuous CO2 injection injection with 790×103sm
3/day while for the contaminated stream
injects 820×103sm
3/day with the water injection of 1,300sm
3/day to maintain pressure. The WAG process of injection performs
better than the continous CO2 injection for storage. This is mainly due to capillary trapping during the shift from water
injection and the evidence of lowest breakthrough (Figure 17). This reduces the uncertainity of leakage of the caprock later
when injection stops and abandonment of the field. The contaminated N2 reduces the amount of CO2 to be stored in the
reservoir. For the purpose of recovery and storage, rapid capillary trapping of the CO2 using WAG process is preferable
compared to the continuous CO2 injection.
[Design of Optimal Storage and Recovery Strategies of Carbon Dioxide using the Wytch Farm Reservoir Model] 13
Table 6: Strategies table for storage of CO2 with the same storage amount target.
Figure 17: Amount of CO2 trapped for the designed of same amount of CO2 for storage for the WAG and GAW cases.
14 [Design of Optimal Storage and Recovery Strategies of Carbon Dioxide using the Wytch Farm Reservoir Model]
Conclusions
CO2 storage and Enhanced Oil Recovery is a possibility for the Wytch Farm oil field. The hydrocarbon reservoir optimum
recovery and storage of CO2 which demands the maximum incremental recovery and maximum emplacement of CO2 can
be achieved based on the degree of the objective function. WAG strategy for this study indicated maximum recovery with
good storage efficiency for rapid trapping of CO2 injected reducing the uncertainty of mobile CO2 in the reservoir and CO2
production is the best way to illustrate the amount of CO2 stored for every one barrel of oil produced. The continuous CO2
injection could store more of its CO2 as mobile gas and increase the risk of leakage to the surface.
It was also observed that the presence of nitrogen as a contaminant reduces the miscibility of CO2 in oil which could
affect recovery. This is because CO2 recovery depends on the oil composition with CO2 injection stream. The continuous
flooding after water injection requires re-cycling cost due early breakthrough and to high amount of CO2 injection. WAG
process could give little or no CO2 breakthrough. The mass evaluation of the CO2 storage implemented helps to quantify
the amount of CO2 sequestered better due to the complex volumetric behavior of the CO2 in the reservoir with temperature
and pressure. For the same amount of CO2 for storage, the WAG process is the most desirable.
Further work can be carried out on the geology of the formation to account for the storage security while considering
uncertainties in the model parameters. Thermal flooding with CO2 injection can also be studied in the future on this field
for enhance oil recovery. Other areas for further research are the carbon tax on emission and crude oil price to help
determine the best injection strategy to implement.
Acknowledgements
I would like to express my gratitude to my advisor, Professor Martin Blunt, for his invaluable support, encouragement,
supervision and useful suggestions throughout the research work. I am also extremely thankful to my mother Mrs Helen
Eteimua Oseme for her encouragement during difficult times of the project period. Furthermore, I would like to thank SPDC
Nigeria for sponsoring my MSc course at Imperial College, London. God bless you all.
Nomenclature
k = permeability, m2 [Darcy]
krg = relative permeability of gas, dimensionless
kro = relative permeability of oil, dimensionless
krw = relative permeability of water, dimensionless
MW = molecular weight
= porosity, fraction
Sw = water saturation, fraction
T = temperature, K (Kelvin)
V = block pore volume, m3
Vinj = volume of water injected
Vpw = volume of water produced
Rf = recovery factor
A = area, m2
h = reservoir thickness
m = mass, kg
Superscripts Inj = injection of water
pw = produced water
CO2 = carbon dioxide
Acronyms CCS = carbon capture and storage
CO2CRC= cooperative research centre for greenhouse gas technologies
EOR = enhanced oil recovery
GAW = gas injection after waterflooding
HCPV = hydrocarbon pore volume
MMP = minimum miscibilty pressure
[Design of Optimal Storage and Recovery Strategies of Carbon Dioxide using the Wytch Farm Reservoir Model] 15
MME = minimum miscibilty enrichment
SM3
= standard cubic metres
PV = pore volume
WAG = water-alternating-gas
Conversion Factors & Units
Bbl x 0.1589873 = Cubic Metres (ms)
ToC+273.15 = T (K)
Bar ×105 = Pascal (Pa)
Ton×103 = Kilogram (kg)
Lbm/ft×16.01846 = Kg/m3
References
Armitage, D., Berkes, F., Arthur, R.I., Charles, A.T., Davidson-Hunt, I.J., Diduck, A.P., Doubleday, N.C., Johnson, D.S., Marschke, M.,
McConney, P., Pinkkerton, E.W., Wollenberg, E.K.: “Adaptive co-management for social- ecological complexity”. Frontiers in Ecological
Environments 7(2), 95e102 (2009).
Batycky, R.P., Blunt, M.J., Thiele, M.R.: “A 3D Field-scale Streamline-based Reservoir Simulator”. SPE Reservoir Engineering, 12, 246–
254 (1997).
Bachu, S.: “Sequestration of CO2 in geological media: criteria and approach for site selection in response to climate change”. Energy
Conversion and Management, vol. 41 (9), 953-970. (2000).
Bachu, S., J.C. Shaw, and R.M. Pearson.: “Estimation of Oil Recovery and CO2 Storage Capacity in CO2 EOR Incorporating the Effect of
Underlying Aquifers”. SPE Paper 89340. SPE/DOE Fourteenth Symposium on Improved Oil Recovery, Tulsa, Oklahoma, U.S.A., 13 17–21
April (2004).
Blunt M.J., Fayers, F. J., and Orr, F. M. Jr.: “Carbon Dioxide in Enhanced Oil Recovery”. Energy Conversion and Management. 34, 1197-
1204 (September- November 1993).
Blunt, M.J.: “Carbon dioxide storage”. Presented at the Grantham Institute for Climate Change Imperial College London (December 2010).
Buchanan, J. G., “The exploration history and controls on hydrocarbon prospectivity in the Wessex basins, southern England, UK” Special
publications, London, Geological society, 19-37 (1998)
Colter, V. S. and Havard, D. J.: “The Wytch Farm Oil Field, Dorset.” In: Illing, L. V. and Hobson, G. D. (eds) Petroleum Geology of the
Continental Shelf of North- West Europe. Heyden, London, 494-503(1981).
Ennis-King, J. and Paterson, L.: “Engineering Aspects of Geological Sequestration of Carbon Dioxide,” SPE 77809, Proceedings of the Asia
Pacific Oil and Gas Conference and Exhibition, Melbourne, Australia, October 8-10 (2002).
ECLIPSE User’s Manual. Schlumberger Information Systems (2010).
Gibson-Poole, C.M., Edwards, S., Langford, R.P., Vakarelov, B.: “Review of Geological Storage Opportunities for Carbon Capture and
Storage (CCS) in Victoria.” The Cooperative Research Centre for Greenhouse Gas Technologies (C02CRC), Australian School of
Petroleum, The University of Adelaide, Adelaide. ICTPL Consultancy Report Number ICTPL-RPT06-0506. (2006).
Hamid R., Dongxiao Z.: “Optimization of Carbon Dioxide Sequestation and Enhanced Oil Recovery in Oil Reservoir”. SPE 13594,
Proceedings of the Western North America Regional Meeting, Califonia, USA, May 8-10 (2010).
Hesse, M. A., Tchelepi, H. A., Cantwell, B. J. and Orr F. M. Jr.: “Gravity Currents in Horizontal Porous Layers: Transition from Early to
Late Self-Similarity.” J. Fluid Mech. 577, 363–383(2007).
Herzog, H., Eliasson, B. and Kaarstad, O.: “Capturing Greenhouse Gases” Scientific American, 72-79, February (2007).
Kamel B., Mike M., Neeraj G., Steve W.Trygev R., Shinchi S., Ramakrishnana T.: “CO2 Capture and Storage- A Solution Within”.
16 [Design of Optimal Storage and Recovery Strategies of Carbon Dioxide using the Wytch Farm Reservoir Model]
Schlumberger, (2004).
Kovscek, A.R.: “Screening Criteria for CO2 in Oil Reservoirs.” Petroleum Science and Technology, (2002).
Kovscek, A.R., Cakici, M.D.: “Geologic storage of carbon dioxide and enhanced oil recovery. II. Cooptimization of Storage and Recovery,”
Energy Conversion and Management, 46, 1941–1956 November (2005).
Intergovernmental Panel on Climate Change, Special Report on Carbon Dioxide Capture and Storage, B. Metz et al.,editors, ( 2005).
http://www.mnp.nl/ipcc/pages_media/SRCCS-final/ccsspm.pdf
Lake, L.W.: “Enhanced Oil Recovery.” Prentice-Hall, Inc. (1989).
Malik, Q.M., Islam, M.R.: “CO2 Injection in the Weyburn field of Canada: Optimization of Enhanced Oil Recovery and Greenhouse Gas
Storage with Horizontal Wells,” SPE 59327, Proceedings of the SPE/DOE Improved Oil Recovery Symposium, Tulsa, Oklahoma, 3-5 April
(2000).
McKie et al.: “Reservoir architecture of the upper Sherwood Sandstone Wytch Farm field, southern England”, Geological Society, London,
Special Publications, v. 133, p. 399-406 (1998).
Mungan, N.: “Carbon dioxide flooding fundamentals,” Journal of Canadian Petroleum Technology, 87 (January-March, 1981).
Orr, F. M., Jr. and Taber, J.J.: “Displacement of Oil by Carbon Dioxide,” Annual Report, Rep. No. DOE/BC/10331-9, June (1983).
Orr, F. M., Jr., Dindoruk, B., and Johns, R.T.: “Theory of Multicomponent Gas/Oil Displacements.” Ind. Eng. Chem. Res., 34 (1995).
PETREL RE 2010 User’s Manual. Schlumberger Information Systems (2010).
Span, P., and W. Wagner.: “A New Equation of State for Carbon Dioxide Covering the Fluid Region from the Triple-Point Temperature to
1100 K at pressures up to 800 MPa. Journal of Chemical Reference Data, Vol. 25, No. 6: 1509-1596 (1996).
Qi, R., LaForce, T.C., Blunt, M.J.: “Design of Carbon Dioxide Storage in Oilfields,” SPE 115663, Proceedings of the SPE Annual Technical
Conference and Exhibition, Denver, CO, USA, September 21–24 (2008).
Xu, T., Apps J. A. and Pruess, K.: “Reactive Geochemical Transport Simulation to Study Mineral Trapping for CO2 Disposal in Deep Saline
Arenaceous Aquifers.” J. Geophys. Res. 108(B2), 2071 (2003).
Zhang, L., et al.: “Assessment of CO2 Storage Capacity in Oil Reservoirs Associated with Large Lateral/Underlying Aquifers: Case Studies
from China,” International Journal of Greenhouse Gas Control, doi:10.1016/j.ijggc.2011.02.004 (2011).
Zhao, F.L.: “The Principle of EOR.” Petroleum University Press, Dongying in Chinese (2001).

[Design of Optimal Storage and Recovery Strategies of Carbon Dioxide using the Wytch Farm Reservoir Model] 17
Appendix
18 [Design of Optimal Storage and Recovery Strategies of Carbon Dioxide using the Wytch Farm Reservoir Model]
APPENDIX A: CRITICAL LITERATURE REVIEWS
SPE 59327 (2000)
CO2 Injection in the Weyburn Field of Canada: Optimization of Enhanced Oil Recovery and Greenhouse
Gas Storage with Horizontal Wells
Authors: Qamar M. Malik, SPE, and M.R. Islam, SPE, university of Regina, Saskatchewan, Canada
Contribution to the understanding of CO2 storage and EOR
Significant because this paper demonstrated key parameters of contaminated gas stream and the use of
horizontal wells for CO2 injection for miscible CO2 flooding in the Weyburn Field of Canada.
Objective of the paper:
To observe the contaminated gas and horizontal wells as key parameters controlling miscible CO2
flooding
Methodology used:
A series of simulations of post- waterflooding, post primary – CO2 injection schemes were performed
with pure and contaminated gas stream using a fully compositional model for a reservoir with and without
bottom waters (aquifers).
Conclusion reached:
1. Nitrogen contamination in the gas stream has an impact in the tertiary recovery. The presence of
contaminants decreases the solubility and diffusivity of CO2 into oil subsequently leading to reduction in
swelling of oil by carbon dioxide.
2. The size of bottom waters has significant impact on the oil production and CO2 storage capacity.
Comment:
Horizontal wells were observed during the simulation for a real reservoir model and edge water drive was
not considered.
[Design of Optimal Storage and Recovery Strategies of Carbon Dioxide using the Wytch Farm Reservoir Model] 19
Energy Conversion and Management 46 1941-1956 (2005)
Geological storage of carbon dioxide and Enhance oil recovery. II. Cooptimization of storage and
recovery
Aurthors: A.R Kovscek, M.D Cakici
Contribution to the understanding of CO2 storage and EOR
Important, because the boundary condition such as aquifer are considered. Conditions for miscible and
immiscible gas injection were also considered.
Objective of the paper:
To develop carbon dioxide injection strategies leading to cooptimization of CO2 storage and oil recovery
for a given three dimensional reservoir model using compositional simulation assuming the sequestration
services provide significant revenue.
Methodology used:
Compositional modeling was performed testing variety of injection schemes with pure CO2 and solvent
gas injection. Weighting factors were considered to determine the aim of maximum recovery and
maximum storage.
Conclusions reached:
1. The goal to sequester maximum carbon dioxide while maximizing oil recovery rate from an oil
reservoir is largely different from the goal of oil recovery alone.
2. An effective process for cooptimzation of CO2 sequestration and oil recovery is a kind of well
control that constrains the rate of injection and production.
Comments:
The crude oil CO2 composition is zero.
20 [Design of Optimal Storage and Recovery Strategies of Carbon Dioxide using the Wytch Farm Reservoir Model]
SPE 115663 (2008)
Design of Carbon Dioxide Storage in Oilfields
Authors: Ran Qi, Tara C. Laforce and Martin J. Blunt, SPE, Imperial College London.
Contribution to the understanding of CO2 storage and EOR
This study extends the design of carbon dioxide storage in aquifers to oilfields.
Objective of the paper:
To demonstrate the effectiveness of pore-scale capillary trapping to immobilize CO2 in oil reservoirs
using analytical solutions to the transport equations, accounting for relative permeability hysteresis.
The paper studies field-scale oil production and CO2 storage using streamline-based simulator that
captures dissolution, dispersion, gravity and rate-limited reactions in three dimensions.
Methodology used:
A series of fine-grid 3D simulations of CO2 and trapping were perfomed with varying CO2 reservoir-
volume fractional flows. CO2 is injected after a period of waterflood at different scenarios.
Conclusion reached:
1. CO2 storage and tertiary recovery in a heterogeneous oilfield was studies
2. To retain the CO2 in the reservoir, an injection strategy where CO2 and water are injected
simultaneously at a higher water alternating gas WAG ratio (more water) than the optimum value was
proposed
3. Where there are concerns over long-term storage security, a brief period of chase brine injection was
sufficient to render more than 90% of the CO2 underground trapped or dissolved with an overall storage
efficiency of approximately 17%
Comments

[Design of Optimal Storage and Recovery Strategies of Carbon Dioxide using the Wytch Farm Reservoir Model] 21
International Journal of Greenhouse Gas Control 3 195 – 205 (2009)
Design of Carbon Dioxide Storage in Aquifers
Authors: Ran Qi, Tara C. Laforce and Martin J. Blunt, SPE, Imperial College London.
Contribution to the understanding of CO2 storage and EOR
Demonstrated optimal CO2 injection strategies by injecting CO2 mixed with brine at reservoir volume
fraction between 85-100% followed by a short period of chase brine by a process called capillary
trapping. This becomes important where the top seal of geological formations could leak or have gaps or
penetrated by well through which CO2 could escape to the atmosphere.
Objective of the paper:
To design injection strategies that maximizes storage efficiencies in aquifers and minimizes the total
amount of brine injected using stream-line based simulation that captures the effect if reservoir
heterogeneity.
Methodology used:
A series of simulations where the amount of trapping is given by Land (1986) model is being compared
with a base case.
Conclusion reached:
1. The injection of CO2 and brine together mitigates the mobility contrast between injected and displaced
fluids, leading to higher storage efficiencies than injecting CO2 alone.
2. The chase brine renders the CO2 trapped and relatively short period of injection is sufficient to trap the
vast majority of the CO2. Once trapped the CO2 may slowly dissolve or react but cannot escape.
22 [Design of Optimal Storage and Recovery Strategies of Carbon Dioxide using the Wytch Farm Reservoir Model]
Computational Geosciences 13: 493-509 (2009)
A three-phase four component stream-line based simulator to study carbon dioxide storage
Authors: Ran Qi, Tara C. Laforce and Martin J. Blunt
Contribution to the understanding of CO2 storage and EOR
This paper shows the possibility of CO2 storage in aquifer and oilfields and the dissolution of CO2 in
other phases (gas, oil and water).
Objective of the paper:
To extend an existing streamline simulator (Batycky et al., SPE Reservoir Engineering 12 (4): 246-254,
(1997) that considered two phases (aqueous and hydrocarbon) and two components (water and oil) to
handle three-phase (aqueous, hydrocarbon, and solid), four component (water, oil, CO2, and salt) transport
applied to CO2 injection.
Methodology used:
Simulations were conducted on a North Sea reservoir description. Design of CO2 injection strategies in
aquifers to maximize CO2 storage and in oil reservoirs to optimize both CO2 storage and oil recovery was
conducted.
Conclusion reached:
1. The solution of CO2 transport in aquifers and oilfields was verified by comparing one- dimensional
numerical simulation with analytical solutions.
2. A carbon storage strategy where CO2 and brine injection alone, which can trap the majority of the CO2
in residual phase was proposed.

[Design of Optimal Storage and Recovery Strategies of Carbon Dioxide using the Wytch Farm Reservoir Model] 23
SPE 132795 (2010)
Optimizing Oil Recovery and Carbon Dioxide Storage in Heavy Oil Reservoir
Authors: L. Sobers, Tara C. Laforce and Martin J. Blunt
Contribution to the understanding of CO2 storage and EOR
This paper shows the possibility of CO2 injection into heavy oil reservoirs which involve significant
recycling of injected with as much of the CO2 injected being emplaced underground.
Objective of the paper:
To study the design of enhanced oil recovery in heavy oil reservoirs combined with CO2 storage using
field-scale reservoir simulation.
Methodology used:
Injection into heavy oil reservoirs through the mechanisms of crude viscosity reduction, oil welling and
immiscible gas drive was adopted with tuning a three-parameter Peng-Robinson equation of state to
match measured PVT data
Conclusion reached:
1. This study indicated that satisfactory enhanced heavy oil recovery and carbon storage may be achieved
simultaneously.
2. Successive WAG cycles allow for greater capillary trapping, at the same time oil viscosity decreases as
more carbon dissolves into the crude.
Comment
The reservoir description is a section of homogenous unconsolidated sand and thermal flooding with CO2
injection was not considered.
24 [Design of Optimal Storage and Recovery Strategies of Carbon Dioxide using the Wytch Farm Reservoir Model]
SPE 133594 (2010)
Optimization of Carbon Dioxide Sequestration and Enhanced Oil Recovery in Oil Reservoir
Aurthors: Hamid Reza Jahangiri, Dongxiao Zhang
Contribution to the understanding of CO2 storage and EOR
Significant, because this paper utilizes compositional simulation and determines the storage potential and
incremental recovery of the reservoir model.
Objective of the paper:
To develop carbon dioxide injection strategies leading to cooptimization of CO2 storage and oil recovery
for a given three dimensional reservoir model using compositional simulation
Methodology used:
Reservoir simulations were performed with ECLIPSETM
300, a fully compositional, finite difference
based reservoir simulator considering continuous gas injection, gas injection after water flooding and
water alternating gas drive as injection scenarios.
Conclusions reached:
1. The goal to sequester maximum carbon dioxide while maximizing oil recovery rate from an oil
reservoir is largely different from the goal of oil recovery alone.
2. An effective process for cooptimzation of CO2 sequestration and oil recovery is a kind of well
control that constrains the rate of injection and production.
Comments:
The study is based on PUNQ-S3, a synthetic reservoir developed on the basis of an actual producing field
using a North Sea crude oil as the reservoir fluid.

[Design of Optimal Storage and Recovery Strategies of Carbon Dioxide using the Wytch Farm Reservoir Model] 25
International Journal of Greenhouse Gas Control G Model IJGGC-396 (2011)
Assessment of CO2 storage capacity in oil reservoirs associated with large lateral/underlying aquifers:
Case studies from China
Authors: Liang Zhang, Sharon Ren, Bo Ren, Weidong Zhang, Qing Guo, Li Zhang
Contribution to the understanding of CO2 storage and EOR
This paper illustrate the advantages of lower geological leakage risk associated with oil and gas traps
during CO2 injection into oil and gas reservoirs associated with large aquifers, and large storage capacity
of their connected aquifers.
Objective of the paper:
This paper studies and discusses the various storage mechanisms of CO2 in oil reservoirs and their
associated saline aquifers.
Methodology used:
A calculation method for CO2 storage capacity in the combined reservoirs was developed based on
material balance for different trapping mechanisms of CO2 for miscible flooding.
Conclusion reached:
1. A simplified material balance method to calculate the storage capacity of CO2 in combined oil
reservoirs and aquifers, which has considered various CO2 trapping mechanisms in place, and it is useful
and sufficient for primary site screening of storage projects.
2. This paper shows that associated aquifers can provide much larger storage capacity than that in oil
reservoirs, and CO2 trapping and dissolution trapping are the major contributors. In oil reservoirs alone,
the storage capacity is mainly contributed by oil and water displacement, while CO2 dissolution in
remaining oil can be also significant especially when oil reservoirs have low oil recovery factor.
Comment:
The methodology of this paper is applied to five typical oil reservoirs associated with aquifers in china as
case studies. The potentials of CO2 EOR and storage deserve further detailed studies
26 [Design of Optimal Storage and Recovery Strategies of Carbon Dioxide using the Wytch Farm Reservoir Model]
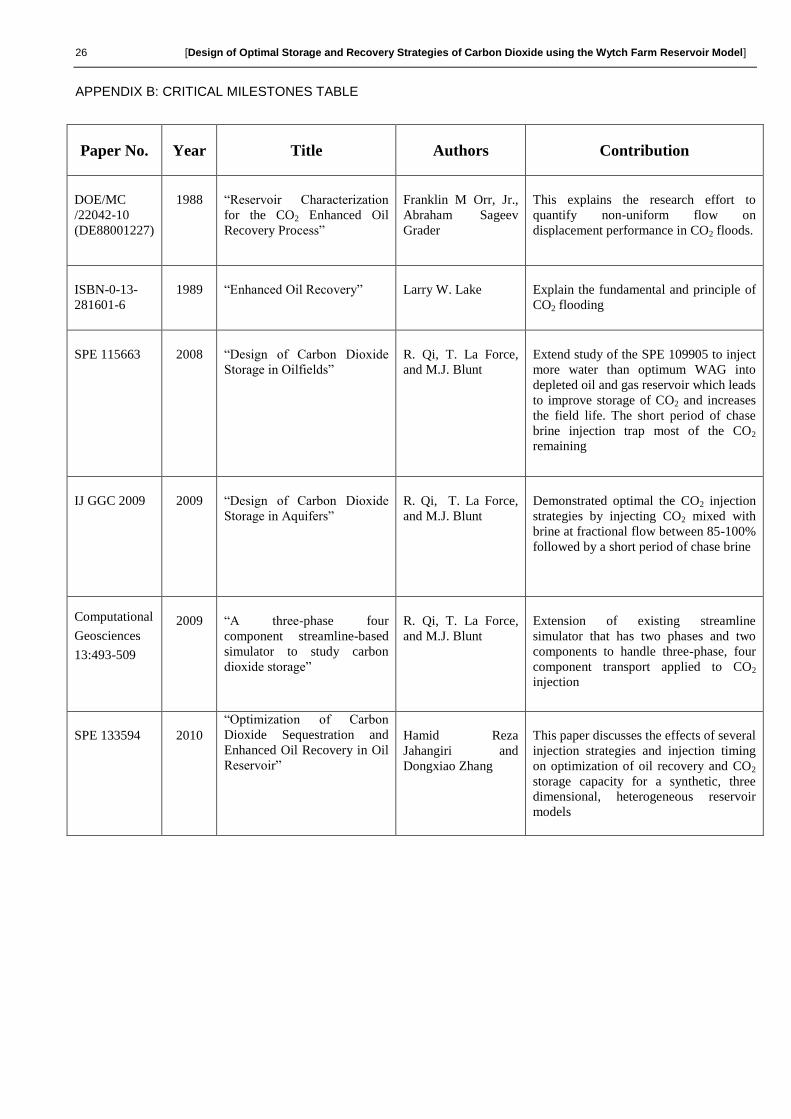
APPENDIX B: CRITICAL MILESTONES TABLE
Paper No. Year Title Authors Contribution
DOE/MC
/22042-10
(DE88001227)
1988 “Reservoir Characterization
for the CO2 Enhanced Oil
Recovery Process”
Franklin M Orr, Jr.,
Abraham Sageev
Grader
This explains the research effort to
quantify non-uniform flow on
displacement performance in CO2 floods.
ISBN-0-13-
281601-6
1989 “Enhanced Oil Recovery” Larry W. Lake Explain the fundamental and principle of
CO2 flooding
SPE 115663 2008 “Design of Carbon Dioxide
Storage in Oilfields”
R. Qi, T. La Force,
and M.J. Blunt
Extend study of the SPE 109905 to inject
more water than optimum WAG into
depleted oil and gas reservoir which leads
to improve storage of CO2 and increases
the field life. The short period of chase
brine injection trap most of the CO2
remaining
IJ GGC 2009 2009 “Design of Carbon Dioxide
Storage in Aquifers”
R. Qi, T. La Force,
and M.J. Blunt
Demonstrated optimal the CO2 injection
strategies by injecting CO2 mixed with
brine at fractional flow between 85-100%
followed by a short period of chase brine
Computational
Geosciences
13:493-509
2009 “A three-phase four
component streamline-based
simulator to study carbon
dioxide storage”
R. Qi, T. La Force,
and M.J. Blunt
Extension of existing streamline
simulator that has two phases and two
components to handle three-phase, four
component transport applied to CO2
injection
SPE 133594 2010
“Optimization of Carbon
Dioxide Sequestration and
Enhanced Oil Recovery in Oil
Reservoir”
Hamid Reza
Jahangiri and
Dongxiao Zhang
This paper discusses the effects of several
injection strategies and injection timing
on optimization of oil recovery and CO2
storage capacity for a synthetic, three
dimensional, heterogeneous reservoir
models
[Design of Optimal Storage and Recovery Strategies of Carbon Dioxide using the Wytch Farm Reservoir Model] 27
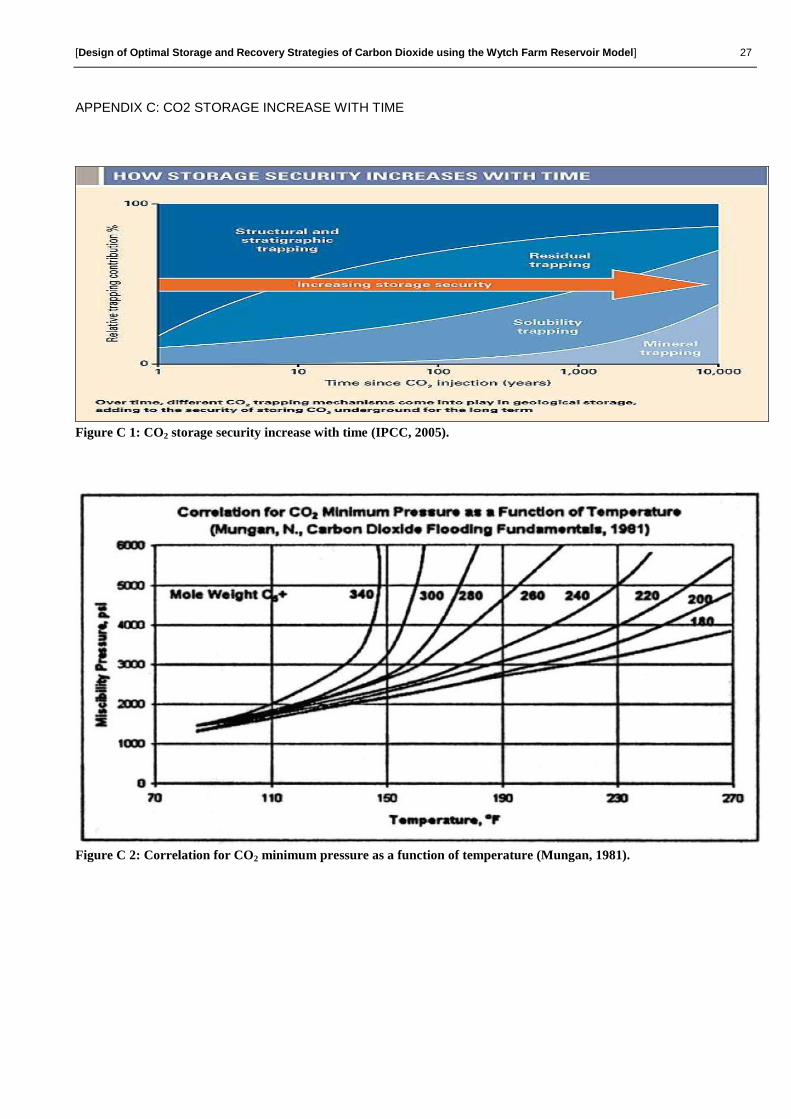
APPENDIX C: CO2 STORAGE INCREASE WITH TIME
Figure C 1: CO2 storage security increase with time (IPCC, 2005).
Figure C 2: Correlation for CO2 minimum pressure as a function of temperature (Mungan, 1981).

28 [Design of Optimal Storage and Recovery Strategies of Carbon Dioxide using the Wytch Farm Reservoir Model]
APPENDIX D: SIMULATION DATASET
Simulation Run with Eclipse E300 from PETREL RE 2010 Simulation Case for the WAG process . The PVT properties from
Eclipse PVTi is found in Appendix E.
The common input files are: AINE_SPE_COMPS_2.DATA, PERMX.GRDECL, PERMY.GRDECL, PERMZ.GRDECL,
PORO.GRDECL, PROPS.INC, SUM.INC and finally FLUID_DATA_3.PVO
RUNSPEC
TITLE
WAGNEW4
WELLDIMS
7 34 2 7 /
START
1 JAN 2011 /
WATER
GAS
OIL
CO2SOL
PETOPTS
INITNNC /
MONITOR
MULTSAVE
-1 /
MULTOUT
FIELD
DIMENS
20 18 40 /
COMPS
11 /
TABDIMS
1 1 206 5* 1 1* 1* 1* 1 /
EQLDIMS
1 /
GRID
INCLUDE

[Design of Optimal Storage and Recovery Strategies of Carbon Dioxide using the Wytch Farm Reservoir Model] 29
'WAGNEW4_GRID.INC' /
NOECHO
INCLUDE
'WAGNEW4_GRID.GRDECL' /
INCLUDE
'WAGNEW4_PROP_PERMX.GRDECL' /
INCLUDE
'WAGNEW4_PROP_PERMY.GRDECL' /
INCLUDE
'WAGNEW4_PROP_PERMZ.GRDECL' /
INCLUDE
'WAGNEW4_PROP_PORO.GRDECL' /
ECHO
EDIT
PROPS
INCLUDE
'WAGNEW4_PROPS.INC' /
REGIONS
NOECHO
INCLUDE
'WAGNEW4_PROP_EOSNUM.GRDECL' /
INCLUDE
'WAGNEW4_PROP_PVTNUM.GRDECL' /
INCLUDE
'WAGNEW4_PROP_EQLNUM.GRDECL' /
INCLUDE
'WAGNEW4_PROP_ROCKNUM.GRDECL' /
INCLUDE
'WAGNEW4_PROP_SATNUM.GRDECL' /
ECHO
SOLUTION
INCLUDE
'WAGNEW4_SOL.INC' /
SUMMARY
INCLUDE
'WAGNEW4_SUM.INC' /
SCHEDULE

30 [Design of Optimal Storage and Recovery Strategies of Carbon Dioxide using the Wytch Farm Reservoir Model]
INCLUDE
'WAGNEW4_SCH.INC' /
[Design of Optimal Storage and Recovery Strategies of Carbon Dioxide using the Wytch Farm Reservoir Model] 31
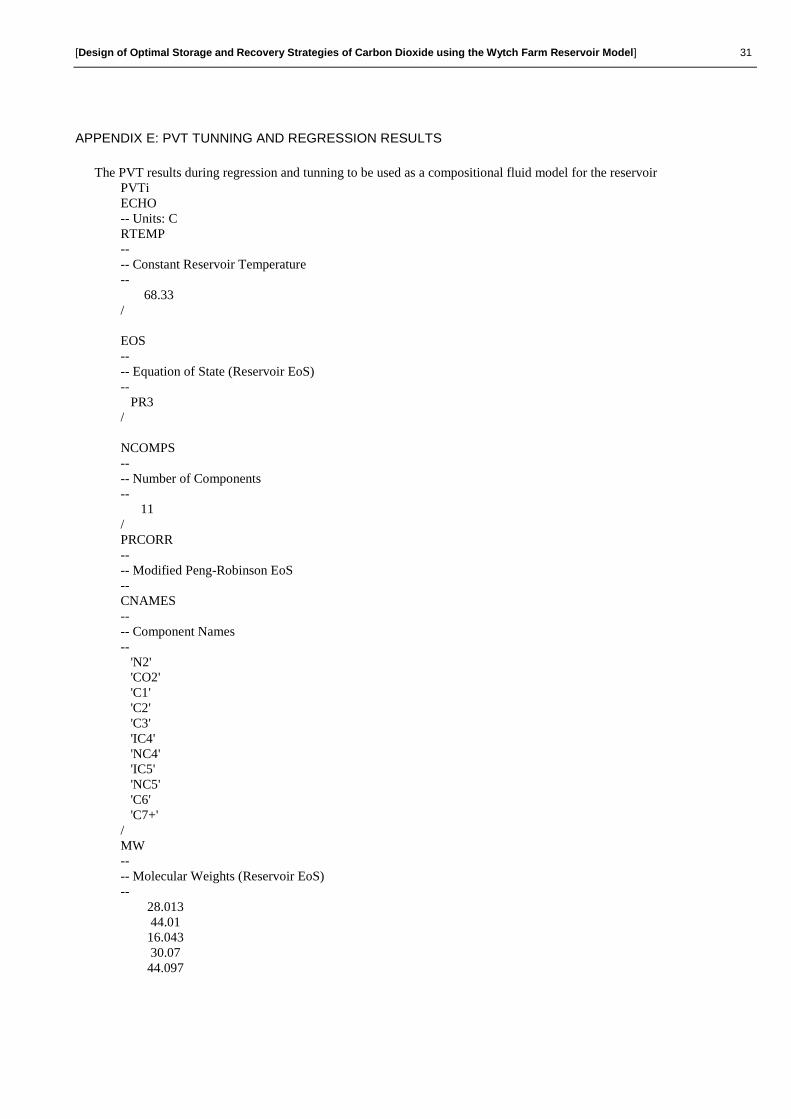
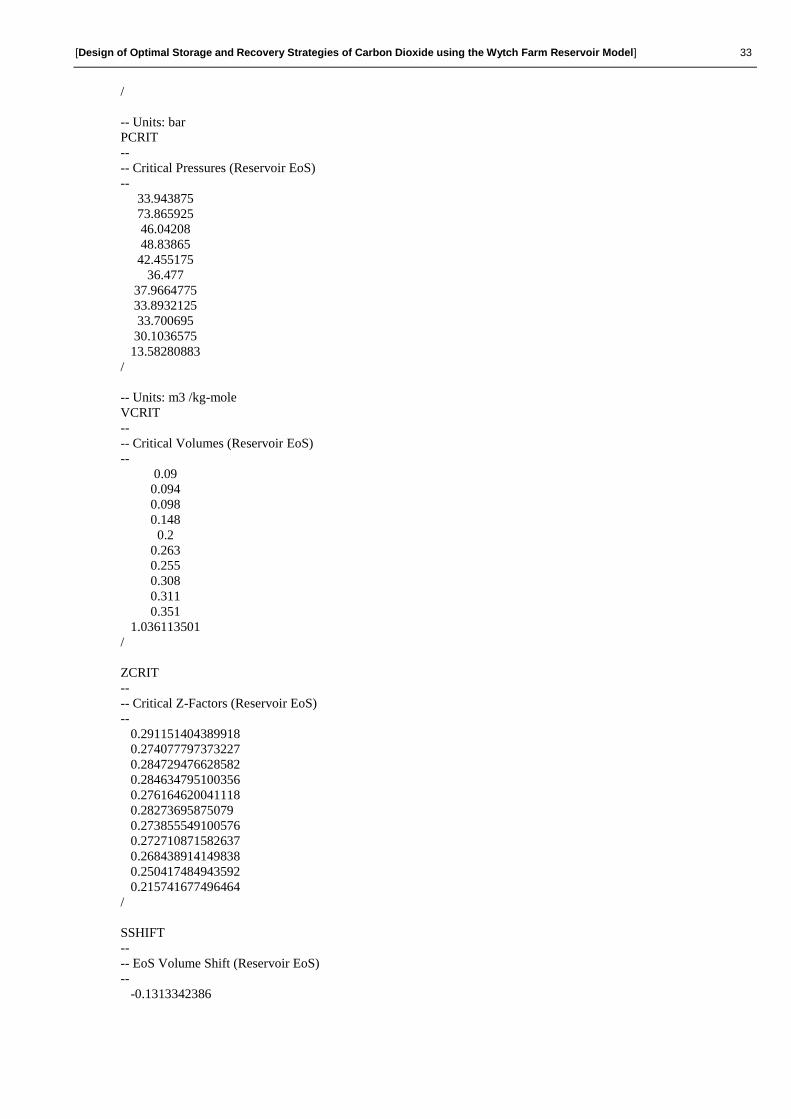
APPENDIX E: PVT TUNNING AND REGRESSION RESULTS
The PVT results during regression and tunning to be used as a compositional fluid model for the reservoir
PVTi
ECHO
-- Units: C
RTEMP
--
-- Constant Reservoir Temperature
--
68.33
/
EOS
--
-- Equation of State (Reservoir EoS)
--
PR3
/
NCOMPS
--
-- Number of Components
--
11
/
PRCORR
--
-- Modified Peng-Robinson EoS
--
CNAMES
--
-- Component Names
--
'N2'
'CO2'
'C1'
'C2'
'C3'
'IC4'
'NC4'
'IC5'
'NC5'
'C6'
'C7+'
/
MW
--
-- Molecular Weights (Reservoir EoS)
--
28.013
44.01
16.043
30.07
44.097

32 [Design of Optimal Storage and Recovery Strategies of Carbon Dioxide using the Wytch Farm Reservoir Model]
58.124
58.124
72.151
72.151
84
262.5460323
/
OMEGAA
--
-- EoS Omega-a Coefficient (Reservoir EoS)
--
0.457235529
0.457235529
0.457235529
0.457235529
0.457235529
0.457235529
0.457235529
0.457235529
0.457235529
0.457235529
0.457235529
/
OMEGAB
--
-- EoS Omega-b Coefficient (Reservoir EoS)
--
0.077796074
0.077796074
0.077796074
0.077796074
0.077796074
0.077796074
0.077796074
0.077796074
0.077796074
0.077796074
0.077796074
/
-- Units: K
TCRIT
--
-- Critical Temperatures (Reservoir EoS)
--
126.2
304.7
190.6
305.43
369.8
408.1
425.2
460.4
469.6
507.5
784.5799132
[Design of Optimal Storage and Recovery Strategies of Carbon Dioxide using the Wytch Farm Reservoir Model] 33
/
-- Units: bar
PCRIT
--
-- Critical Pressures (Reservoir EoS)
--
33.943875
73.865925
46.04208
48.83865
42.455175
36.477
37.9664775
33.8932125
33.700695
30.1036575
13.58280883
/
-- Units: m3 /kg-mole
VCRIT
--
-- Critical Volumes (Reservoir EoS)
--
0.09
0.094
0.098
0.148
0.2
0.263
0.255
0.308
0.311
0.351
1.036113501
/
ZCRIT
--
-- Critical Z-Factors (Reservoir EoS)
--
0.291151404389918
0.274077797373227
0.284729476628582
0.284634795100356
0.276164620041118
0.28273695875079
0.273855549100576
0.272710871582637
0.268438914149838
0.250417484943592
0.215741677496464
/
SSHIFT
--
-- EoS Volume Shift (Reservoir EoS)
--
-0.1313342386

34 [Design of Optimal Storage and Recovery Strategies of Carbon Dioxide using the Wytch Farm Reservoir Model]
-0.04273033674
-0.1442656189
-0.103268354
-0.07750138148
-0.06198372515
-0.05422489699
-0.04177245672
-0.03027789648
-0.007288775999
0.2681964164
/
ACF
--
-- Acentric Factors (Reservoir EoS)
--
0.04
0.225
0.013
0.0986
0.1524
0.1848
0.201
0.227
0.251
0.299
0.8525617652
/
BIC
--
-- Binary Interaction Coefficients (Reservoir EoS)
--
-0.012
0.1 0.1
0.1 0.1 0
0.1 0.1 0 0
0.1 0.1 0 0 0
0.1 0.1 0 0 0 0
0.1 0.1 0 0 0 0 0
0.1 0.1 0 0 0 0 0 0
0.1 0.1 0.0279 0.01 0.01 0 0 0 0
0.1 0.1 0.05198 0.01 0.01 0 0 0 0 0
/
PARACHOR
--
-- Component Parachors
--
41
78
77
108
150.3
181.5
189.9
225
231.5
271
674.2804214

[Design of Optimal Storage and Recovery Strategies of Carbon Dioxide using the Wytch Farm Reservoir Model] 35
/
-- Units: m3 /kg-mole
VCRITVIS
--
-- Critical Volumes for Viscosity Calc (Reservoir EoS)
--
0.09
0.094
0.098
0.148
0.2
0.263
0.255
0.308
0.311
0.351
1.036113501
/
ZCRITVIS
--
-- Critical Z-Factors for Viscosity Calculation (Reservoir EoS)
--
0.291151404389918
0.274077797373227
0.284729476628582
0.284634795100356
0.276164620041118
0.28273695875079
0.273855549100576
0.272710871582637
0.268438914149838
0.250417484943592
0.215741677496464
/
LBCCOEF
--
-- Lorentz-Bray-Clark Viscosity Correlation Coefficients
--
0.1023 0.023364 0.058533 -0.040758 0.0093324
--
-- Overall Composition
--
0.02667980213
0.001698713993
0.1470886469
0.07054659289
0.10032405
0.02558063425
0.06914765197
0.02937775965
0.03847087573
0.05285998249
0.43822529 /

36 [Design of Optimal Storage and Recovery Strategies of Carbon Dioxide using the Wytch Farm Reservoir Model]
APPENDIX E: DESCRIPTION OF THE POROSITY AND PERMEABILITY DISTRIBUTION
Figure E-1: Porosity distribution of the reservoir model.
Figure E-2: Permeability distribution of the reservoir model.
Figure E-3: Description of the edges of the reservoir model.