design of novel dme/methanol synthesis plants … afhandling - lasse...the objective of this study...
TRANSCRIPT

General rights Copyright and moral rights for the publications made accessible in the public portal are retained by the authors and/or other copyright owners and it is a condition of accessing publications that users recognise and abide by the legal requirements associated with these rights.
Users may download and print one copy of any publication from the public portal for the purpose of private study or research.
You may not further distribute the material or use it for any profit-making activity or commercial gain
You may freely distribute the URL identifying the publication in the public portal If you believe that this document breaches copyright please contact us providing details, and we will remove access to the work immediately and investigate your claim.
Downloaded from orbit.dtu.dk on: Mar 31, 2020
Design of novel DME/methanol synthesis plants based on gasification of biomass
Clausen, Lasse Røngaard
Publication date:2011
Document VersionPublisher's PDF, also known as Version of record
Link back to DTU Orbit
Citation (APA):Clausen, L. R. (2011). Design of novel DME/methanol synthesis plants based on gasification of biomass. Kgs.Lyngby, Denmark: Technical University of Denmark. DCAMM Special Report, No. S123
Design of novel DME/methanol synthesis plants based on gasifi cation of biomass
Ph
D T
he
sis
Lasse Røngaard ClausenDCAMM Special Report no. S123 February 2011


Design of novel DME/methanol synthesis plants based on gasification of biomass
by
Lasse Røngaard Clausen
A thesis submitted in partial fulfillment of the requirements for the degree of
DOCTOR OF PHILOSOPHY
at the TECHNICAL UNIVERSITY OF DENMARK
2011

Lasse Røngaard Clausen Design of novel DME/methanol synthesis plants based on gasification of biomass Technical University of Denmark Department of Mechanical Engineering Section of Thermal Energy Systems Ph.D. Thesis ISBN: 978-87-90416-44-7 DCAMM Special report no.: S123 © Copyright by Lasse Røngaard Clausen 2011 All rights reserved

I
Preface This thesis is submitted as a partial fulfillment of the requirements for the PhD degree at the Technical University of Denmark. The study was carried out at the Department of Mechanical Engineering, Section of Thermal Energy Systems from May 2007 to February 2011 under the supervision of Associate Professor Brian Elmegaard and co-supervision of Niels Houbak from DONG Energy. An external research stay was conducted from August 2008 to November 2008 in Golden, Colorado, USA, at Colorado School of Mines (CSM). Supervisor at CSM was Assistant Professor Robert Braun, Division of Engineering. The PhD study was funded by the Technical University of Denmark and included membership of the research school DCAMM (Danish Center for Applied Mathematics and Mechanics). The thesis is written as a monograph, but it also includes a number of papers based on the work in this research study.

II
Abstract A way to reduce the CO2 emissions from the transportation sector is by increasing the use of biofuels in the sector. DME and methanol are two such biofuels, which can be synthesized from biomass, by use of gasification followed by chemical synthesis. This method of producing biofuels is shown to be more cost-effective, less energy consuming and less CO2 emitting, when considering the total well-to-wheel processes, than first generation biofuels and second generation ethanol produced by biological fermentation. It is also shown that trustworthy sources in literature (the IPCC and IEA Bioenergy) estimate the global biomass resource to be sufficiently great to allow the use of biomass for fuels and chemicals production. IEA Bioenergy even indicate that it might be more appropriate to use biomass for fuels and chemicals production than for electricity production because few and expensive renewable alternatives exists for biomass in the fuels and chemicals sector, but many cost effective renewable alternatives exists for biomass in the electricity sector. The objective of this study was to design novel DME and methanol plants based on gasification of biomass, with a main focus on improving the total energy efficiency of the synthesis plants, and lowering the plant CO2 emissions - but also try to improve the DME/methanol yield per unit biomass input, and integrate surplus electricity from renewables in the production of DME/methanol. This objective lead to the design of the following plants: 1. Large-scale DME plants based on gasification of torrefied biomass. 2. Small-scale DME/methanol plants based on gasification of wood chips. 3. Alternative methanol plants based on electrolysis of water and gasification of biomass. The plants were modeled by using the component based thermodynamic modeling and simulation tools Aspen Plus and DNA. The large-scale DME plants based on entrained flow gasification of torrefied wood pellets achieved biomass to DME energy efficiencies of 49% when using once-through (OT) synthesis, and 66% when using recycle (RC) synthesis. If the net electricity production was included, the total energy efficiencies became 65% for the OT plant, and 71% for the RC plant (LHV). By comparing the plants based on the fuels effective efficiency, it was concluded that the plants were almost equally energy efficient (73% for the RC plant and 72% for the OT plant). Because some chemical energy is lost in the biomass torrefaction process, the total efficiencies based on untreated biomass to DME were 64% for the RC plant and 59% for the OT plant. CO2 emissions could be reduced to 3% (RC) or 10% (OT) of the input carbon in the torrefied biomass, by using CO2 capture and storage together with certain plant design changes. Accounting for the torrefaction process, which occurs outside the plant, the emissions became 22% (RC) and 28% (OT) of the carbon in the untreated biomass.

III
The estimated costs of the produced DME were $11.9/GJLHV for the RC plant, and $12.9/GJLHV for the OT plant, but if a credit was given for storing the bio-CO2 captured, the cost became as low as $5.4/GJLHV (RC) and $3.1/GJLHV (OT) (at $100/ton-CO2). The small-scale DME and methanol plants achieved biomass to DME/methanol efficiencies of 45-46% when using once-through (OT) synthesis, and 56-58% when using recycle (RC) synthesis. If the net electricity production was included, the efficiencies increased to 51-53% for the OT plants (LHV) - the net electricity production was zero in the RC plants. The total energy efficiencies achieved for the plants were 87-88% by utilizing plant waste heat for district heating. The reason why the differences, in biomass to DME/methanol efficiency, between the small-scale and the large-scale plants, showed not to be greater, was the high cold gas efficiency of the gasifier used in the small-scale plants (93%). By integrating water electrolysis in a large-scale methanol plant, an almost complete conversion of the carbon in the torrefied biomass, to carbon in the produced methanol, was achieved (97% conversion). The methanol yield per unit biomass input was therefore increased from 66% (the large-scale DME plant) to 128% (LHV). The total energy efficiency was however reduced from 71% (the large-scale DME plant) to 63%, due to the relatively inefficient electrolyser.

IV
Resumé Titel: Design af nye DME/metanol-anlæg baseret på forgasning af biomasse En måde hvorpå CO2-udslippet fra transportsektoren kan reduceres er ved at øge brugen af biobrændstoffer i sektoren. DME og metanol er begge biobrændstoffer, som kan produceres ud fra biomasse ved hjælp af forgasning og kemisk syntese. Ved at producere biobrændstoffer på denne måde opnås lavere omkostninger, mindre energiforbrug og lavere CO2-emissioner, for hele well-to-wheel cyklussen, sammenlignet med første generation biobrændstoffer og anden generation bioetanol. Troværdige kilder i litteraturen (IPCC og IEA Bioenergy) estimerer at den globale biomasse-ressource er tilstrækkelig stor til at tillade brugen af biomasse til produktion af biobrændstoffer og kemikalier. IEA Bioenergy indikerer endda, at det måske er mere fordelagtigt at bruge biomasse til produktion af biobrændstoffer og kemikalier, frem for el-produktion. Det skyldes at der kun eksisterer få og dyre bæredygtige alternativer til biomasse, når det gælder produktion af biobrændstoffer og kemikalier, hvorimod mange omkostningseffektive og bæredygtige alternativer til biomasse eksisterer for el-produktion. Formålet med dette studie var at designe nye DME- og metanol-anlæg baseret på forgasning af biomasse, med et hovedfokus på at forbedre den totale energivirkningsgrad for anlæggene, samt sænke CO2-emissionerne fra anlæggene. Formålet var dog også at forsøge at øge udbyttet af DME/metanol per biomasseenhed, og integrere overskudselektricitet fra vedvarende energikilder i produktionen af DME/metanol. Disse formål førte til at følgende anlæg blev designet: 1. Store centrale DME-anlæg baseret på forgasning af torreficeret biomasse. 2. Decentrale DME/metanol-anlæg baseret på forgasning af træflis. 3. Alternative metanolanlæg baseret på elektrolyse af vand og forgasning af biomasse. Anlæggene blev modeleret ved hjælp af de komponentbaserede termodynamiske modelleringsværktøjer Aspen Plus og DNA. De store centrale DME-anlæg baseret på entrained flow forgasning af torreficerede træpiller opnåede energivirkningsgrader, fra biomasse til DME, på 49% ved once-through (OT) syntese, og 66% ved syntese med recirkulering af ukonverteret syntesegas (RC). De totale energivirkningsgrader, som inkluderer nettoproduktionen af elektricitet, blev 65% for OT-anlægget og 71% for RC-anlægget (LHV). Ved at sammenligne anlæggene på basis af en effektiv brændselsvirkningsgrad blev det konkluderet, at anlæggene var næsten lige energieffektive (73% for RC-anlægget og 72% for OT-anlægget). Hvis tabet af kemisk energi i biomasse-torreficeringen inkluderes, opnås totale energivirkningsgrader på 64% for RC-anlægget og 59% for OT-anlægget.
V
CO2-emissionerne fra anlæggene kunne reduceres til 3% (RC) eller 10% (OT) af kulstofindholdet i den tilførte torreficerede biomasse ved at bruge CO2 capture and storage og udføre visse ændringer af anlægsdesignet. Hvis CO2-emissionen fra biomassetorreficeringen, som forekommer decentralt, inkluderes, opnås CO2-emissioner på 22% (RC) og 28% (OT) af kulstofindholdet i den tilførte biomasse. Produktionsomkostningerne blev estimeret til $11.9/GJDME-LHV for RC-anlægget og $12.9/GJDME-LHV for OT-anlægget, men hvis der gives en kredit for lagring af bio-CO2 på $100/ton-CO2, reduceres omkostningerne til $5.4/GJDME-LHV (RC) og $3.1/GJDME-LHV (OT). De decentrale DME/metanol-anlæg, baseret på forgasning af træflis, opnåede energivirkningsgrader, fra biomasse til DME/metanol, på 45-46% ved once-through (OT) syntese, og 56-58% ved syntese med recirkulering af ukonverteret syntesegas (RC). Hvis nettoproduktionen af elektricitet inkluderes, opnås energivirkningsgrader på 51-53% for OT-anlæggene – nettoproduktionen af elektricitet var nul i RC-anlæggene. Anlæggene opnåede totale energivirkningsgrader på 87-88%, ved at udnytte den producerede spildvarme til fjernvarme. Grunden til at forskellen mellem energivirkningsgraderne for de centrale og decentrale anlæg viste sig ikke at være større, var på grund af den høje koldgasvirkningsgrad for forgasseren i de decentrale anlæg (93%). Ved at integrere elektrolyse af vand i et stort centralt metanolanlæg, kunne næsten alt kulstoffet i biomassen konverteres til kulstof lagret i den producerede metanol (97% konvertering). Metanoludbyttet per biomasseenhed kunne derfor øges fra 66% (DME-anlægget ovenfor) til 128% (LHV). Den totale energivirkningsgrad blev dog reduceret fra 71% til 63%, på grund af den relativt ineffektive elektrolyse.

VI
Acknowledgements I would like to thank my supervisor Brian Elmegaard for fruitful discussions and guidance during my study. Especially your comments and advice concerning the paper writing process was most beneficial. I would also like to thank co-supervisor Niels Houbak from DONG Energy, Senior Scientist Jesper Ahrenfeldt and PostDoc Christian Bang-Møller for useful discussions from time to time. A special thanks goes to Assistant Professor Robert Braun from Colorado School of Mines in the USA, for his supervision during my stay at the university, and for interesting discussions. I hope we can continue exchanging research ideas and results. Last and most importantly, I wish to thank my sweet Dorthe for her love and patience. I know that I have been much occupied with writing the thesis in the final part of the study.
VII
List of publications The PhD thesis includes three journal papers and one conference paper. The papers can be found in Appendix A to Appendix D. I. ISI Journal Paper Clausen LR, Houbak N, Elmegaard B. “Technoeconomic analysis of a methanol plant based on gasification of biomass and electrolysis of water”. Energy 2010;35(5):2338-2347. II. Proceedings Paper - Peer Reviewed Manuscript Clausen LR, Elmegaard B, Houbak N, Braun RJ. “Zero-dimensional model of a dimethyl ether (DME) plant based on gasification of torrefied biomass”. Proceedings of SIMS 50; Modeling of Energy Technology, 2009, ISBN 978-87-89502-88-5. III. ISI Journal Paper Clausen LR, Elmegaard B, Houbak N. “Technoeconomic analysis of a low CO2 emission dimethyl ether (DME) plant based on gasification of torrefied biomass”. Energy 2010;35(12):4831-4842. IV. ISI Journal Paper Clausen LR, Elmegaard B, Ahrenfeldt J, Henriksen U. “Thermodynamic analysis of small-scale DME and methanol plants based on the efficient Two-stage gasifier”. Submitted to Energy (manuscript number: EGY-D-11-00180). Notes Paper I is in part based on results from my master thesis [Clausen LR, 2007]. Paper III is a more elaborated and updated study based on the same model as used in paper II.
Co-authorship statement All four papers have been planned and written by the author of this thesis. The co-authors have contributed with academic discussions, as well as linguistic and academic comments to the draft of the paper.

VIII
Table of Contents
Preface ........................................................................................... I
Abstract ......................................................................................... II
Resumé ......................................................................................... IV
Acknowledgements ...................................................................... VI
List of publications ....................................................................... VII
Table of Contents ....................................................................... VIII
List of figures .............................................................................. XIII
List of tables ............................................................................. XVIII
1. Introduction ...................................................................... 1
1.1 Objectives ....................................................................................... 2
1.2 Methodology .................................................................................. 2
1.3 Thesis outline ................................................................................. 2
2. Background ....................................................................... 4
2.1 The global biomass potential .......................................................... 4
2.1.1 Summary ...................................................................................................... 7
2.2 Well-to-wheel analysis ................................................................... 8
2.2.1 Summary .................................................................................................... 14
2.3 Production of DME and methanol from biomass .......................... 15
2.3.1 Gasification ................................................................................................. 16 2.3.1.1 Gasifier types suited for syngas production ................................................................17 2.3.1.2 Entrained flow gasification of biomass ........................................................................20
2.3.2 Gas cleaning and conditioning ................................................................... 22 2.3.2.1 Gas cleaning requirements ..........................................................................................22 2.3.2.2 Gas cleaning methods (incl. CO2 removal) ..................................................................23 2.3.2.3 Conditioning by the water gas shift (WGS) reaction....................................................25
2.3.3 Synthesis of methanol and DME ................................................................ 26 2.3.3.1 DME/methanol separation and purification ................................................................31
2.4 Previous work within the field by others ...................................... 33
3. Investigated plant designs ............................................... 37

IX
3.1 Large-scale DME plant .................................................................. 37
3.2 Small-scale DME/methanol plant ................................................. 40
4. Modeling of components and processes ......................... 43
4.1 Pretreatment of biomass .............................................................. 45
4.1.1 Milling of torrefied biomass ....................................................................... 45
4.2 Gasification of biomass ................................................................. 45
4.2.1 Entrained flow gasification of torrefied biomass ....................................... 45
4.2.2 Two-stage gasification of wood chips ........................................................ 48
4.3 Gas cleaning and conditioning ...................................................... 49
4.3.1 Water gas shift reactor ............................................................................... 49
4.3.2 Rectisol ....................................................................................................... 49
4.3.3 Gas cleaning for the small-scale plant ....................................................... 52
4.4 Synthesis of DME and methanol ................................................... 52
4.5 DME/methanol separation and purification ................................. 56
4.6 Electricity production ................................................................... 57
4.6.1 Gas turbine operating on unconverted syngas .......................................... 57
4.6.2 Gas engine operating on unconverted syngas ........................................... 57
4.6.3 Integrated steam plant ............................................................................... 58
4.7 Modeling tools.............................................................................. 59
4.7.1 Aspen Plus .................................................................................................. 59
4.7.2 DNA............................................................................................................. 59
4.8 Endnote on modeling of synthesis plants ..................................... 60
5. Large-scale DME production plants ................................. 61
5.1 Designing the integrated steam plants ......................................... 66
5.2 Process simulation results ............................................................ 70
5.2.1 Heat integration ......................................................................................... 75
5.2.2 Coproduct electricity .................................................................................. 76 5.2.2.1 Electricity production in the RC plant ..........................................................................76 5.2.2.2 Electricity production in the OT plant ..........................................................................78 5.2.2.3 On-site electricity consumptions .................................................................................80
5.2.3 Energy efficiencies ...................................................................................... 82 5.2.3.1 Chemical energy flows .................................................................................................83
5.2.4 Carbon analysis........................................................................................... 84
5.2.5 The assumption of chemical equilibrium ................................................... 86
5.2.6 Comparing with other plants ..................................................................... 89 5.2.6.1 Comparing with plants venting CO2 ............................................................................89

X
5.2.6.2 Comparing with literature ...........................................................................................91
5.3 Cost estimation ............................................................................ 94
5.3.1 Plant investment ........................................................................................ 94
5.3.2 Levelized cost calculation ........................................................................... 97
5.4 WTW study revisited .................................................................... 99
5.5 Summary .....................................................................................101
6. Small-scale DME/methanol production plants .............. 103
6.1 Designing the heat integration ....................................................105
6.2 Process simulation results ...........................................................108
6.2.1 Heat integration and district heating production .................................... 115 6.2.1.1 Heat integration ........................................................................................................ 115 6.2.1.2 District heating production ....................................................................................... 115
6.2.2 Coproduct electricity ................................................................................ 117 6.2.2.1 On-site electricity consumptions .............................................................................. 117
6.2.3 Energy efficiencies .................................................................................... 119 6.2.3.1 Chemical energy flows .............................................................................................. 121
6.2.4 Comparing with other plants ................................................................... 122 6.2.4.1 Comparing with the reference plants ....................................................................... 122 6.2.4.2 Comparing with the large scale DME plants ............................................................. 124
6.3 Summary .....................................................................................126
7. Alternative designs of DME/methanol synthesis plants 128
7.1 Methanol synthesis based on gasification of biomass, electrolysis of water and steam reforming of a hydrocarbon gas ......................129
7.2 Methanol production based on gasification of biomass and electrolysis of water ....................................................................132
7.2.1 Energy efficiencies .................................................................................... 136 7.2.1.1 Chemical energy flows .............................................................................................. 137
7.2.2 Carbon analysis......................................................................................... 138
7.2.3 Comparing with other plants ................................................................... 139 7.2.3.1 Comparing with other synthesis plants using water electrolysis ............................. 139 7.2.3.2 Comparing with the large-scale DME plant .............................................................. 140
7.3 Summary .....................................................................................141
8. Concluding remarks ....................................................... 142
8.1 Summary of findings ....................................................................142
8.1.1 Large-scale DME plants based on torrefied biomass ............................... 143
8.1.2 Small-scale DME/methanol plants based on wood chips ........................ 143
XI
8.1.3 Alternative methanol plants .................................................................... 144
8.2 Further work ................................................................................145
8.2.1 Large-scale liquid fuels plants based on biomass .................................... 145
8.2.2 Small-scale DME/methanol plants based on wood chips ........................ 145
8.2.3 Alternative DME/methanol plants based on biomass ............................. 146
8.3 Final statement ............................................................................147
References ................................................................................. 148
Appendix A. Paper I ..................................................................................................... 156
Appendix B. Paper II .................................................................................................... 167
Appendix C. Paper III ................................................................................................... 175
Appendix D. Paper IV ................................................................................................... 188
Appendix E. Scenarios from IPCC ................................................................................ 205
Appendix F. A fossil free scenario ............................................................................... 206
Appendix G. WTW analysis in detail ............................................................................ 209
Appendix H. Methanol pathways: Me-FW, Me-WW, Me-BL and Me-FW-W ............. 217
Appendix I. Methanol pathway Me-FW-W: Cost of methanol .................................. 219
Appendix J. Methanol pathway Me-FW-W: WTT Energy consumption and GHG emission .................................................................................................. 221
Appendix K. Electricity pathway: BEV ......................................................................... 222
Appendix L. Basic gasifier types .................................................................................. 224
Appendix M. Oxygen production.................................................................................. 230
Appendix N. Existing biomass gasifiers suited for syngas production ........................ 234
Appendix O. Demonstrated biomass gasifiers............................................................. 241
Appendix P. The Two-Stage Gasifier ........................................................................... 243
Appendix Q. Commercial coal gasifiers used for syngas production .......................... 246
Appendix R. Slag formation in entrained flow gasification of biomass ...................... 251
Appendix S. Torrefaction of biomass .......................................................................... 253
Appendix T. Gas composition for a fluidized bed biomass gasifier ............................ 255
Appendix U. The Rectisol process ................................................................................ 256
Appendix V. Synthesis reactors for DME/methanol synthesis .................................... 260
Appendix W. By-product formation in DME/methanol synthesis ................................ 267
Appendix X. Fractional distillation .............................................................................. 268
Appendix Y. Purity requirements for DME/methanol products ................................. 269
XII
Appendix Z. DNA code for the two-stage gasification of wood chips ........................ 271
Appendix AA. Further improvements to the Rectisol process ...................................... 285
Appendix BB. Modeling the distillation of DME/methanol ........................................... 286
Appendix CC. Energy and exergy efficiencies for the large scale DME plants .............. 289
Appendix DD. DME pathway: DME-FW-CCS .................................................................. 290
Appendix EE. Q-T diagram for the small-scale methanol plant using recycle (RC) synthesis .................................................................................................. 292
Appendix FF. Syngas conversion for DME/methanol synthesis in the small-scale OT plants ....................................................................................................... 293
Appendix GG. Modeling the methanol synthesis plant based on biomass gasification and electrolysis of water ................................................................................ 295

XIII
List of figures Figure 2.1. The world’s technical and sustainable biomass potential in 2050 together with the current and
projected world energy demand and world biomass demand [IEA Bioenergy, 2009]. ....................6
Figure 2.2. The WTW GHG emissions and the WTW energy consumption for the selected pathways (Table 2.1). .................................................................................................................................................10
Figure 2.3. The cost of CO2 avoided and the WTW energy consumption for the selected pathways (Table 2.1). .................................................................................................................................................11
Figure 2.4. The potential fraction of the road fuels market in the EU-25 that can be replaced and the WTW energy consumption for the selected pathways (Table 2.1). ..........................................................11
Figure 2.5. Simplified flow sheet for DME/methanol production from biomass. .........................................15
Figure 2.6. A comparison of the three main gasifier types (operating on coal) [EPRI, 2004]. ......................17
Figure 2.7. Gas composition from a DME synthesis reactor as a function of the H2/CO ratio in the syngas [Joensen et al., 2007]. .....................................................................................................................25
Figure 2.8. Equilibrium CO conversion as a function of the reactor outlet temperature and the reactor pressure. ..........................................................................................................................................28
Figure 2.9. Equilibrium conversion of a syngas to either DME or methanol (H2/CO = 2 for methanol, H2/CO = 1 for DME). ...................................................................................................................................29
Figure 2.10. Theoretical energy efficiencies (LHV) for the conversion of a syngas, containing only CO and H2, to either DME or methanol. ......................................................................................................30
Figure 2.11. Flow sheet of a DME plant showing how the product gas from the DME reactor is separated and purified [Yagi et al., 2010]. .......................................................................................................32
Figure 3.1. Simplified flow sheet for DME/methanol production from biomass. .........................................37
Figure 4.1. Simplified flow sheet for DME/methanol production from biomass. .........................................43
Figure 4.2. Flow sheet of the modeled gasification part, including heat outputs and electricity inputs. .....46
Figure 4.3. Flow sheet of the modeled Two-Stage Gasifier, including heat input/output. ...........................48
Figure 4.4. Flow sheet of the acid gas removal (AGR) step based on the Rectisol process (showing electricity consumptions and heat transfer). ..................................................................................51
Figure 4.5. CO conversion for methanol synthesis as a function of the reactor outlet temperature and the reactor pressure. .............................................................................................................................53
Figure 4.6. CO conversion for DME synthesis as a function of the reactor outlet temperature and the reactor pressure. .............................................................................................................................54
Figure 4.7. Synthesis loop for the large-scale DME plant using recycle synthesis. .......................................55
Figure 5.1. Simplified flow sheet of a DME plant model using recycle (RC) synthesis. .................................61
Figure 5.2. Simplified flow sheet of a DME plant model using once-through (OT) synthesis. ......................62
Figure 5.3. Simplified flow sheet of a DME plant model using recycle (RC) synthesis. .................................64
Figure 5.4. Simplified flow sheet of a DME plant model using once-through (OT) synthesis. ......................65
Figure 5.5. Q-T diagram of the main sources of waste in the recycle plants (Figure 5.1 and Figure 5.3). ....67
Figure 5.6. Q-T diagram of a simple steam cycle based on using the waste heats shown in Figure 5.5. Note: a conventional Q-T diagram would balance heat release and heat consumption. This is not done

XIV
here because it would greatly complicate the diagram, with no (or limited) benefit for the reader. .........................................................................................................................................................68
Figure 5.7. Q-T diagram of the main sources of waste in the once-through plants (Figure 5.2 and Figure 5.4). .................................................................................................................................................69
Figure 5.8. Q-T diagram of two simple steam cycles based on using the waste heats shown in Figure 5.7. 70
Figure 5.9. Flow sheet of the recycle (RC) DME plant model using CO2 capture and storage. .....................72
Figure 5.10. Flow sheet of the once-through (OT) DME plant model using CO2 capture and storage. ........74
Figure 5.11. Flow sheet of the power production part in the RC plant (Figure 5.9) - showing mass flows, electricity production and heat transfer. ........................................................................................77
Figure 5.12. Flow sheet of the power production part in the OT plant (Figure 5.10) - showing mass flows, electricity production and heat transfer. ........................................................................................79
Figure 5.13. On-site electricity consumptions for both the RC and the OT DME plant (Figure 5.9 and Figure 5.10). ...............................................................................................................................................81
Figure 5.14. On-site electricity consumptions grouped by technology for both the RC and the OT DME plant (Figure 5.9 and Figure 5.10). ..................................................................................................82
Figure 5.15. Energy efficiencies for the conversion of torrefied or untreated biomass to DME and electricity for the two plants (LHV). ................................................................................................83
Figure 5.16. Chemical energy flows (LHV) in the two DME plants - including conversion heat losses. ........84
Figure 5.17. Carbon flows in the two DME plants. Updated figure compared to the figure in paper III. .....85
Figure 5.18. Energy efficiencies for the two plants when assuming either chemical equilibrium or an approach to equilibrium (LHV). .......................................................................................................87
Figure 5.19. Energy efficiencies for the two DME plants when either storing CO2 or venting CO2 to the atmosphere (LHV). ..........................................................................................................................90
Figure 5.20. Cost distribution for the two DME plants. ................................................................................94
Figure 5.21. DME production costs as a function of the credit given for bio-CO2 storage. ..........................98
Figure 5.22. DME production cost as a function of the electricity sales price. .............................................99
Figure 5.23. DME production cost as a function of the price of torrefied biomass pellets. .........................99
Figure 6.1. Simplified flow sheet of a small-scale DME plant using once-through (OT) synthesis. ............ 103
Figure 6.2. Simplified flow sheet of a small-scale methanol plant using once-through (OT) synthesis. .... 104
Figure 6.3. Q-T diagram of the main sources of waste heat in the DME plants together with the main streams needing heating (Figure 6.1)........................................................................................... 106
Figure 6.4. Q-T diagram of the designed heat integration in the DME plants. .......................................... 106
Figure 6.5. Q-T diagram of the main sources of waste heat in the methanol plants together with the main streams needing heating (Figure 6.2)........................................................................................... 107
Figure 6.6. Q-T diagram of the designed heat integration in the methanol plant using once-through (OT) synthesis (Figure 6.9). .................................................................................................................. 107
Figure 6.7. Flow sheet of the DME plant model using once-through synthesis (DME-OT). ....................... 109
Figure 6.8. Flow sheet of the DME plant model using recycle synthesis (DME-RC). .................................. 111
Figure 6.9. Flow sheet of the methanol plant model using once-through synthesis (MeOH-OT). ............ 112

XV
Figure 6.10. Flow sheet of the methanol plant model using recycle synthesis (MeOH-RC). ..................... 114
Figure 6.11. District heating production in the DME/methanol plants. ..................................................... 116
Figure 6.12. Electricity production in the DME/methanol plants. ............................................................. 117
Figure 6.13. Electricity consumptions in the DME/methanol plants. ......................................................... 118
Figure 6.14. The electricity consumption of the syngas compressor in the MeOH-OT plant as a function of the polytropic efficiency. .............................................................................................................. 119
Figure 6.15. Energy efficiencies for the conversion of biomass to DME/methanol, net electricity and heat for the four small-scale plants. ..................................................................................................... 120
Figure 6.16. Chemical energy flows (LHV) in the small-scale DME/methanol plants - including conversion heat losses. ................................................................................................................................... 122
Figure 6.17. Energy efficiencies for the conversion of biomass to DME/methanol and net electricity for the four small-scale plants modeled (“original”) compared with the reference plants (“reference”). ...................................................................................................................................................... 124
Figure 6.18. Energy efficiencies for the conversion of biomass to DME/methanol and electricity for the four small-scale plants compared with the two large-scale DME plants. .................................... 125
Figure 6.19. Chemical energy flows (LHV) in the small-scale DME/methanol plants - including conversion heat losses. ................................................................................................................................... 126
Figure 7.1. Simplified flow sheet for a DME/methanol synthesis plant based on biomass gasification and electrolysis of water. .................................................................................................................... 128
Figure 7.2. H2 conversion for DME (left) and methanol (right) synthesis as a function of the reactor outlet temperature and the reactor pressure. ....................................................................................... 129
Figure 7.3. Simplified flow sheets of the syngas production in the six methanol plants. .......................... 130
Figure 7.4. Methanol exergy efficiencies for the six plants. ....................................................................... 131
Figure 7.5. The methanol production cost for the six plants as a function of the electricity price............ 131
Figure 7.6. Simplified flow sheet for a methanol synthesis plant based on biomass gasification and electrolysis of water. .................................................................................................................... 133
Figure 7.7. Simplified flow sheet for a methanol synthesis plant based on biomass gasification and electrolysis of water. .................................................................................................................... 134
Figure 7.8. Detailed flow sheet for a methanol synthesis plant based on biomass gasification and electrolysis of water. .................................................................................................................... 135
Figure 7.9. On-site electricity consumptions in the methanol plant, including the electricity production of the integrated steam cycle. .......................................................................................................... 137
Figure 7.10. Chemical energy flows (LHV) in the methanol plant. ............................................................. 138
Figure 7.11. Carbon flows in the methanol plant. ...................................................................................... 138
Figure 7.12. Biomass to fuel efficiencies for the two synthesis plants. ..................................................... 140
Figure 7.13. Net energy efficiencies for the two synthesis plants. ............................................................ 141
Figure F.1. The world fossil fuel usage in 2007 distributed on six different sectors [IEA, 2007] together with the estimated amounts of biomass energy needed to replace fossil fuels in three of these sectors. ...................................................................................................................................................... 207

XVI
Figure L.1. An updraft gasifier [GEK, 2010]. ............................................................................................... 224
Figure L.2. A downdraft gasifier [GEK, 2010]. ............................................................................................ 225
Figure L.3. A fluidized bed gasifier. ............................................................................................................ 226
Figure L.4. An entrained flow gasifier (modified from [NETL, 2010]). ........................................................ 227
Figure M.1. The most economic oxygen production method based on the needed oxygen purity and flow rate [GRASYS, 2010]. .................................................................................................................... 231
Figure M.2. A sketch of a generic cryogenic air separation plant. ............................................................. 232
Figure M.3. Integration options for IGCC power plants [Karg, 2009]......................................................... 233
Figure N.1. The low temperature gasifier (NTV) and the high temperature gasifier (Carbo-V-gasifier or HTV) from CHOREN. ..................................................................................................................... 236
Figure N.2. The Carbo-V process from CHOREN [CHOREN, 2008-1]. ......................................................... 237
Figure N.3. The GTI gasifier used in the Skive CHP plant [Carbona, 2006]. ................................................ 238
Figure P.1. The 700 kWth Two-Stage Gasifier with steam drying. ............................................................. 244
Figure Q.1. The Shell entrained flow gasifier [NETL, 2010]. ....................................................................... 247
Figure Q.2. The total coal gasification system from Shell [Shell, 2005]. .................................................... 248
Figure Q.3. A typical energy balance for the Shell coal gasifier system [Shell, 2006]. ............................... 249
Figure Q.4. The GE Energy (previously Chevron-Texaco) coal gasifier (modified from [NETL, 2010]). ...... 250
Figure R.1. Slagging behavior of clean wood and for clean wood with fluxing agents (silica and alumina) as a function of the gasification temperature [Van der Drift, 2010]. ............................................... 252
Figure R.2. Slagging behavior of clean wood with fluxing agents (silica, alumina and calcium) at a gasification temperature of 1300°C [Van der Drift, 2010]. .......................................................... 252
Figure S.1. Power consumption for milling as a function of final particle size (torrefaction conditions in 253
Figure U.1. Absorption coefficient α of various gasses in methanol (partial pressure: 1 bar) [Lurgi, 2010]. ...................................................................................................................................................... 256
Figure U.2. Basic flow sheet of a Rectisol process (Rectisol wash) [Linde, 2010]. ..................................... 257
Figure U.3. CO2 bulk removal capacity of different types of solvents [Lurgi, 2010]. ................................. 259
Figure V.1. A sketch of a boiling water reactor (BWR). .............................................................................. 261
Figure V.2. Conversion profile and equilibrium curve for methanol synthesis in a boiling water reactor (BWR). .............................................................................................................................. 261
Figure V.3. A sketch of a liquid/slurry phase reactor (this particular illustration is of the liquid phase reactor) [Larson et al., 2009-1]..................................................................................................... 262
Figure V.4. Methanol synthesis loop with three adiabatic reactors [Hansen et al., 2008]. ....................... 263
Figure V.5. Conversion profile and equilibrium curve for methanol synthesis in three adiabatic reactors in series (Figure V.4). ...................................................................................................... 264
Figure V.6. Flow sheet for DME synthesis by dehydration of product methanol [Haldor Topsøe, 2010-9]. ...................................................................................................................................................... 265
Figure V.7. The “hybrid” DME synthesis process by Haldor Topsøe. ......................................................... 266
Figure X.1. Flow sheet of a fractional distillation column. ......................................................................... 268
XVII
Figure BB.1. Flow sheet of the modeled topping column used in all DME/methanol plants. ................... 287
Figure BB.2. Flow sheet of the modeled DME column in the large-scale DME plants. .............................. 288
Figure EE.1. Q-T diagram of the designed heat integration in the methanol plant using recycle (RC) synthesis. ...................................................................................................................................... 292
Figure FF.1. Syngas conversion for methanol synthesis in the small-scale MeOH-OT plant as a function of the reactor outlet temperature and the reactor pressure. .......................................................... 293
Figure FF.2. Syngas conversion for DME synthesis in the small-scale DME-OT plant as a function of the reactor outlet temperature and the reactor pressure. ................................................................ 294

XVIII
List of tables Table 2.1. Selected WTW pathways for a number of transportation fuels. Data from [JRC et al., 2007]. ......9
Table 2.2. Recommendations for the short-, mid- and long-term for the replacement of fossil fuels in the transportation sector. .....................................................................................................................14
Table 2.3. A comparison of the basic gasifier types based on the four characteristics of a gasifier suited for syngas production (listed above). ...................................................................................................19
Table 2.4. Maximum allowable concentration of impurities in syngas. ........................................................23
Table 2.5. Impurities in the gas from two different gasifiers. .......................................................................23
Table 2.6. Overview of biofuel plants modeled at the Princeton Environmental Institute at Princeton University. .......................................................................................................................................35
Table 2.7. Overview of biofuel plants modeled at the Department of Science Technology and Society at Utrecht University. ..........................................................................................................................36
Table 3.1. The design of a large-scale DME plant. ........................................................................................38
Table 3.2. A comparison of gasifier types suited for large-scale syngas production, based on the four characteristics of a gasifier suited for syngas production (listed above Table 2.3).........................39
Table 3.3. The design of a small-scale DME/methanol plant. .......................................................................41
Table 4.1. Process design parameters set in the modeling of the large-scale DME plants. ..........................44
Table 4.2. Process design parameters set in the modeling of the small-scale DME/methanol plants. ........45
Table 4.3. Operating temperatures used in the modeled DME/methanol reactors. ....................................54
Table 4.4. Operating parameters used for the modeled gas turbine operating on unconverted syngas [Kreutz et al., 2008]. ........................................................................................................................57
Table 4.5. Operating parameters used for the modeled turbocharged gas engine operating on unconverted syngas [Ahrenfeldt, 2010]. .........................................................................................58
Table 4.6. Parameters used in the modeling of the integrated steam plants. ..............................................58
Table 4.7. Isentropic efficiencies of the steam turbines used in the modeling of the integrated steam plants. ..............................................................................................................................................59
Table 5.1. Stream compositions for the recycle (RC) DME plant model using CO2 capture and storage. ....73
Table 5.2. Stream compositions for the once-through (OT) DME plant model using CO2 capture and storage. ...........................................................................................................................................73
Table 5.3. Stream compositions for the recycle (RC) DME plant model using CO2 capture and storage. ....88
Table 5.4. Stream compositions for the once-through (OT) DME plant model. ...........................................89
Table 5.5. Comparison of the modeled DME plants with the two DME plants from literature. ...................92
Table 5.6. Cost estimates for plant areas/components in the DME plants. .................................................95
Table 5.7. Comparison of the DME plant costs with literature. ....................................................................97
Table 5.8. Twenty-year levelized production costs for the modeled DME plants. .......................................97
Table 5.9. Well-to-wheel energy consumption, GHG emissions, cost of CO2 avoided and potential in the EU-25 for selected WTW pathways. ............................................................................................. 101
Table 6.1. Stream compositions for the DME plant model using once-through synthesis (DME-OT). ...... 110

XIX
Table 6.2. Stream compositions for the DME plant model using recycle synthesis (DME-RC). ................. 110
Table 6.3. Stream compositions for the methanol plant model using once-through synthesis (MeOH-OT). ...................................................................................................................................................... 113
Table 6.4. Stream compositions for the methanol plant model using recycle synthesis (MeOH-RC). ...... 113
Table 7.1. Advantages and disadvantages with the six plant concepts. .................................................... 132
Table 7.2. Stream compositions for the methanol plant shown in Figure 7.8.* Liquid ............................. 136
Table 7.3. Energy efficiencies for the methanol plant based on either the torrefied biomass input or untreated biomass. ...................................................................................................................... 136
Table 7.4. Key parameters of the modeled methanol plant compared with two other methanol plants using water electrolysis. ............................................................................................................... 140
Table G.1. Well-to-wheel energy consumption, GHG emissions, cost of CO2 avoided and potential in the EU-25 for selected WTW pathways for a number of transportation fuels. ................................. 210
Table G.2. The tank-to-wheel (TTW) energy consumption for a number of power trains. Data from [JRC et al., 2007]. ...................................................................................................................................... 210
Table L.1. A comparison of the three main gasifier types (the fixed bed gasifier is split into: updraft and downdraft). .................................................................................................................................. 229
Table N.1. Typical dry gas composition from the CHOREN gasifier (oxygen-blown) [Rudloff, 2003]. ....... 236
Table N.2. Measured gas composition from a pressurized oxygen blown GTI gasifier [Rollins et al., 2002]. ...................................................................................................................................................... 239
Table N.3. Modeled gas composition (after tar cracker) of a pressurized (30 bar) oxygen-blown GTI gasifier [Larson et al., 2009-1]. ................................................................................................................. 239
Table P.1. Typical dry gas composition from the Two-stage gasifier (the Viking Gasifier) [Ahrenfeldt et al., 2006]. ........................................................................................................................................... 244
Table Q.1. Typical gas composition from a Shell coal gasifier. ................................................................... 247
Table S.1. Fluidization behavior of coal, willow and torrefied willow [Bergman et al., 2005] (dp is the mean particle size). ................................................................................................................................ 254
Table T.1. Typical gas composition (dry basis) for gasification of wood (15% moisture) at 850°C in an atmospheric air-blown CFB gasifier [Boerrigter et al., 2004]. ...................................................... 255
Table W.1. By-product formation in methanol synthesis for two different syngasses [Hansen et al., 2008]. ...................................................................................................................................................... 267
Table Y.1. Specification of different methanol products [Hansen et al., 2008]. ........................................ 269
Table Y.2. Specification of different methanol products [Uhde, 2010]. .................................................... 269
Table Y.3. A suggestion for a fuel grade DME specification made by IEA in 2000 [RENEW, 2008]. ........... 270
Table BB.1. The parameters set for the modeled topping columns (Figure BB.1). .................................... 287
Table BB.2. The parameters set for the modeled DME column in the large-scale DME plants (Figure BB.2). ...................................................................................................................................................... 288
Table GG.1. Parameters used in the modeling of the methanol synthesis plant....................................... 295

1
1. Introduction Today, fossil fuels play a very important role in the society. Fossil fuels are used primarily for heat and power production, but also for production of chemicals and liquid fuels for the transportation sector. The conventional use of fossil fuels for these purposes eventually results in CO2 emission to the atmosphere, which has been shown to cause climate change. Another important issue relating to the use of fossil fuels – and especially oil - is security of supply. This is primarily because the fossil fuel resources are unequally distributed around the globe, but also because the fossil fuel resources are limited. Finally, conventional combustion of fossil fuels results in pollutants such as NOX, SOX and particulates. Because of these problems concerning the use of fossil fuels many alternatives are investigated. One of the alternatives is biomass. Biomass can be used for production of heat and power, but also for production of chemicals, and liquid fuels for the transportation sector. Because biomass absorbs CO2 from the atmosphere during growth, the combustion of biomass is associated with a much lower net CO2 emission than fossil fuels. And because biomass is a renewable resource that is available almost all over the globe, the security of supply is also much higher than for fossil fuels. For the production of heat and power, other alternatives to fossil fuels exist, but for production of hydrocarbon chemicals, no realistic alternative exists, besides biomass1
. Alternatives to biomass for replacing fossil fuels in the transportation sector are available, yet limited and at a high cost – this is especially true for long-distance transport, shipping and aviation.
One of the most common and basic hydrocarbon chemicals produced today is methanol. Methanol can also be used as a liquid fuel in the transportation sector; either blended with e.g. gasoline, to enable the use in existing power trains, or as a neat fuel for dedicated methanol power trains (e.g. internal combustion engines or fuel cells) [MI, 2010] [Larson et al., 2003]. Dimethyl ether (DME) is also a hydrocarbon chemical/fuel. DME is today used as a replacement for LPG for cooking and heating purposes, but also as an aerosol propellant in spray cans. DME is however also a diesel fuel that generates lower NOx emissions than combustion of diesel, with no particulate matter or SOx [IDA, 2010] [Larson et al., 2003]. Because of the reasons listed above the production of methanol and DME from biomass was investigated.
1 A hydrocarbon chemical could be produced from CO2 extracted from the atmosphere, and hydrogen generated by electrolysis of water.
2
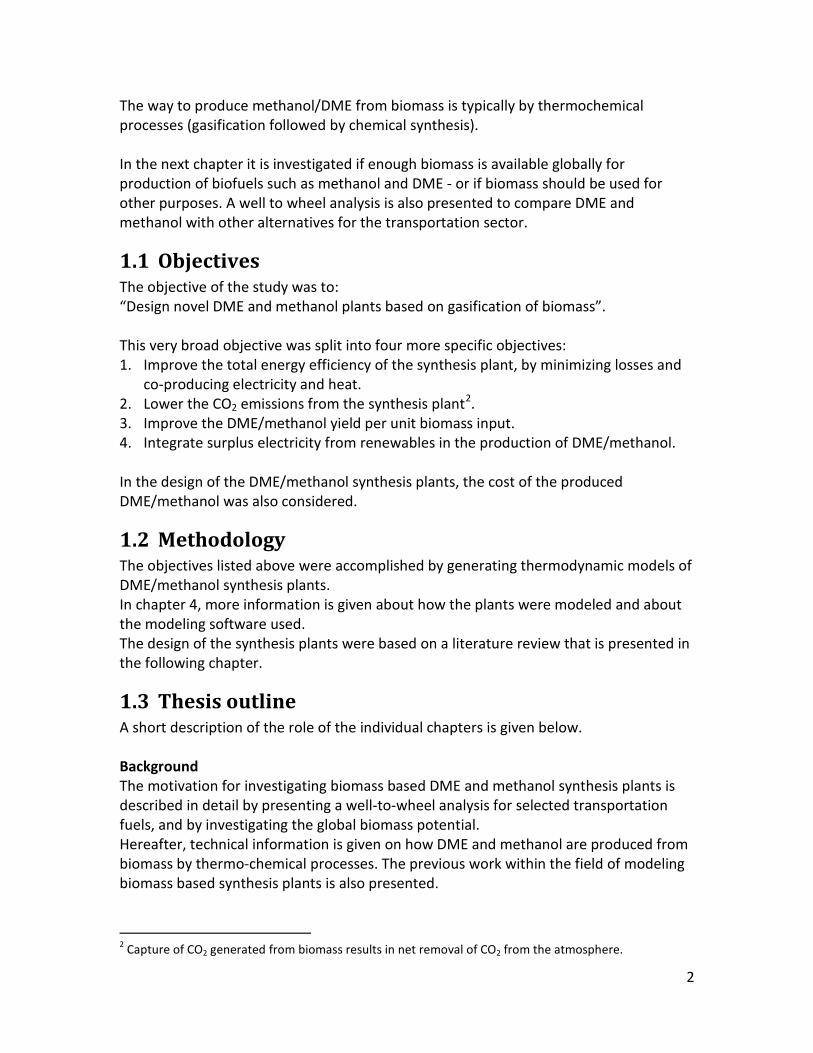
The way to produce methanol/DME from biomass is typically by thermochemical processes (gasification followed by chemical synthesis). In the next chapter it is investigated if enough biomass is available globally for production of biofuels such as methanol and DME - or if biomass should be used for other purposes. A well to wheel analysis is also presented to compare DME and methanol with other alternatives for the transportation sector.
1.1 Objectives The objective of the study was to: “Design novel DME and methanol plants based on gasification of biomass”. This very broad objective was split into four more specific objectives: 1. Improve the total energy efficiency of the synthesis plant, by minimizing losses and
co-producing electricity and heat. 2. Lower the CO2 emissions from the synthesis plant2
3. Improve the DME/methanol yield per unit biomass input. .
4. Integrate surplus electricity from renewables in the production of DME/methanol. In the design of the DME/methanol synthesis plants, the cost of the produced DME/methanol was also considered.
1.2 Methodology The objectives listed above were accomplished by generating thermodynamic models of DME/methanol synthesis plants. In chapter 4, more information is given about how the plants were modeled and about the modeling software used. The design of the synthesis plants were based on a literature review that is presented in the following chapter.
1.3 Thesis outline A short description of the role of the individual chapters is given below. Background The motivation for investigating biomass based DME and methanol synthesis plants is described in detail by presenting a well-to-wheel analysis for selected transportation fuels, and by investigating the global biomass potential. Hereafter, technical information is given on how DME and methanol are produced from biomass by thermo-chemical processes. The previous work within the field of modeling biomass based synthesis plants is also presented.
2 Capture of CO2 generated from biomass results in net removal of CO2 from the atmosphere.

3
Investigated plant designs The information supplied in the background chapter forms the basis of designing a large-scale and a small-scale synthesis plant. Modeling of components and processes A description is given on how the synthesis plants are modeled. The modeling is done in the component based thermodynamic modeling and simulation tools Aspen Plus and DNA. Large-scale DME production plants The model of a large-scale DME synthesis plant is used to simulate different plant concepts. The results of the modeling is presented, discussed and compared with literature. The cost of the produced DME is also estimated. Small-scale DME/methanol production plants The model of a small-scale DME/methanol synthesis plant is used to simulate different plant concepts. The results of the modeling is presented, discussed and compared with the results of the large-scale DME plants. Alternative designs of DME/methanol synthesis plants Alternative designs of DME/methanol synthesis plants are presented. These plants are designed for producing a high DME/methanol output per unit biomass input, and for utilizing fluctuating electricity produced by renewable sources.

4
2. Background
2.1 The global biomass potential The global potential of biomass feedstocks has been estimated in several studies with very different results. In this chapter the basis of estimating the global biomass potential is a review study made by IEA Bioenergy [IEA Bioenergy, 2009] and this is compared with the potential estimated by the IPCC in the fourth assessment report [IPCC, 2007]. This section is therefore not a complete review of the literature within the area, but it shows that trustworthy references in literature estimate that biomass can, or should, be used for bio-fuel production. Biomass for bioenergy can come from three different sectors:
• Residues from forestry, agriculture and organic waste, including municipal solid waste (MSW)
• Surplus forestry • Biomass produced via cropping systems
[IEA Bioenergy, 2009] Especially the last category has a huge technical potential if high yielding energy crops are produced. But it is also mainly this category that raises a number of sustainability issues, such as: competition for land with food and feed production, water availability and quality, and soil quality. Also, if new land is used for energy crops, issues such as biodiversity and net greenhouse gas emissions from land use change becomes important [IEA Bioenergy, 2009]. In the study from IEA Bioenergy, they give an estimate of the global sustainable biomass potential in 2050, for the three categories listed above, by imposing several sustainability constraints - among these the ones mentioned above. Residues from forestry and agriculture and organic waste, including municipal solid waste (MSW) Use of this type of biomass for energy has little or no sustainability constraints, since use of residues do not take up extra land or use extra water. The global sustainable potential in 2050 for this category is estimated to be 50-150 EJ/y (100 EJ/y used as a best estimate) [IEA Bioenergy, 2009]. Surplus forestry On top of using residues from forests, a part of the forest growth, not used for other products (e.g. by the paper and pulping industry), could be available for bioenergy. The global sustainable potential in 2050 for this category is estimated to be 60-100 EJ/y (80 EJ/y used as a best estimate) [IEA Bioenergy, 2009].

5
Biomass produced via cropping systems As mentioned above; the technical potential of this category is huge, if high yielding energy crops are produced. However, the global sustainable potential for this category is estimated to be 120 EJ/y if only surplus good quality agricultural and pasture lands are used, and water scarcity and land degradation are taken into account. If areas with moderate water-scarcity and moderately degraded lands are included in the estimation, the global sustainable potential can be increased with 70 EJ/yr. If the development of agricultural technology occurs faster than historic trends, then another 140 EJ/yr could be added to the global sustainable potential. If these potentials from the three biomass categories are added up, the global sustainable potential becomes 510 EJ/year (100+80+120+70+140). However, since the figures are uncertain, the global sustainable biomass potential is estimated to be 200-500 EJ/year in 2050 [IEA Bioenergy, 2009]. In Figure 2.1 from [IEA Bioenergy, 2009], the biomass potential is compared with the global energy demand, which in 2008 was 500 EJ/year and is projected to rise to 600-1000 EJ/year in 2050. It can be seen from the global sustainable biomass potential of 200-500 EJ/year that biomass can deliver a significant part of the primary energy needed. However, other sources of primary energy exist, and therefore it might not be feasible to use the full potential of the biomass resource; therefore it is essential to estimate the future biomass demand. In Figure 2.1, the biomass demand in 2008 (50 EJ/year) is shown together with the projected biomass demand for 2050 (50-250 EJ/year)3. By comparing the sustainable biomass potential of 200-500 EJ/year with the projected biomass demand of 50-250 EJ/year, it can be concluded that the sustainable biomass potential most likely will be able to meet the future biomass demand4
For comparison, the IPCC’s fourth assessment report from 2007 [IPCC, 2007], estimates the global biomass supply to be 125-760 EJ/year in 2050, and the global biomass demand to be 70-130 EJ/year in 2030. Although the supply and demand has been estimated for two different time horizons, this does suggest that the biomass supply most likely will be able to meet the future demand. In the IPCC scenarios for climate mitigation, biomass also plays a significant role
.
5
.
3 The biomass demand in 2050 depends greatly on the future cost of biomass and the future cost of emitting CO2 [IEA Bioenergy, 2009]. 4 “Thus, the projected biomass supply should be able to meet this projected demand and potentially contribute between a quarter and a third of the global energy mix.” [IEA Bioenergy, 2009] 5 “It is fair to say that the role of biomass in long-term stabilization (beyond 2030) will be very significant but that it is subject to relatively large uncertainties.” [IPCC, 2007] (chapter 11).

6
Figure 2.1. The world’s technical and sustainable biomass potential in 2050 together with the current and projected world energy demand and world biomass demand [IEA Bioenergy, 2009]. Even if it is possible to meet the future biomass demand, biomass should not be used for all kinds of purposes. It is important that biomass is used to mitigate climate change in a cost-effective way, which typically means that biomass should be used to substitute fossil fuels where the cost per ton CO2 avoided is lowest6
In some sectors though, it is more expensive to substitute fossil fuels compared to other sectors (e.g. the transportation sector compared with the heat and power sector). Because of this, the cost of CO2 avoided is not always enough to decide where biomass should be utilized. If GHG emission reduction is wanted for all sectors - the cost of CO2 avoided for alternatives must also be considered
.
7
7. IEA Bioenergy [IEA Bioenergy, 2009]
and the IPCC [IPCC, 2007] also suggests the use of biomass in multiple sectors ,8
6 “the best use is likely to be one that cost-effectively contributes to energy and environmental policy objectives, e.g. in terms of least cost per tonne of avoided CO2.” [IEA Bioenergy, 2009]
.
7 “Producing heat and power are in general more cost-efficient and land-efficient ways of using biomass to reduce greenhouse gas emissions than producing transport fuels, especially if coal use is replaced. However, while there are other renewable and low carbon options for producing heat and power, biofuels
7
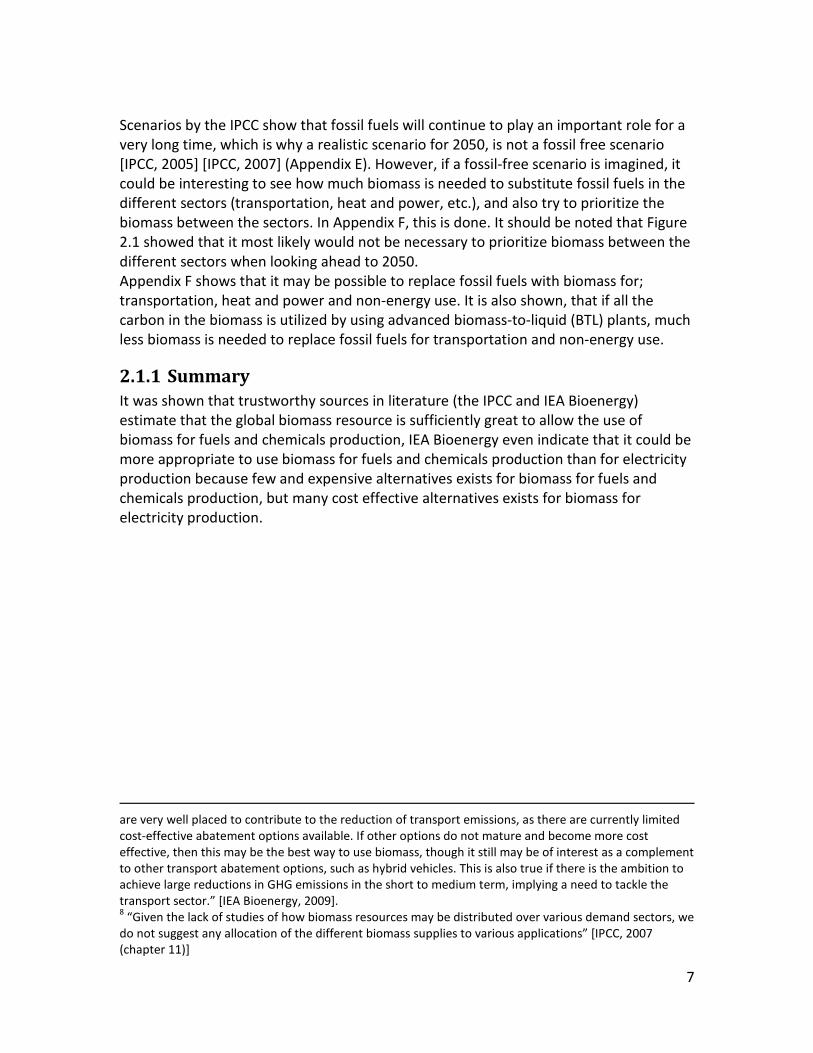
Scenarios by the IPCC show that fossil fuels will continue to play an important role for a very long time, which is why a realistic scenario for 2050, is not a fossil free scenario [IPCC, 2005] [IPCC, 2007] (Appendix E). However, if a fossil-free scenario is imagined, it could be interesting to see how much biomass is needed to substitute fossil fuels in the different sectors (transportation, heat and power, etc.), and also try to prioritize the biomass between the sectors. In Appendix F, this is done. It should be noted that Figure 2.1 showed that it most likely would not be necessary to prioritize biomass between the different sectors when looking ahead to 2050. Appendix F shows that it may be possible to replace fossil fuels with biomass for; transportation, heat and power and non-energy use. It is also shown, that if all the carbon in the biomass is utilized by using advanced biomass-to-liquid (BTL) plants, much less biomass is needed to replace fossil fuels for transportation and non-energy use.
2.1.1 Summary It was shown that trustworthy sources in literature (the IPCC and IEA Bioenergy) estimate that the global biomass resource is sufficiently great to allow the use of biomass for fuels and chemicals production, IEA Bioenergy even indicate that it could be more appropriate to use biomass for fuels and chemicals production than for electricity production because few and expensive alternatives exists for biomass for fuels and chemicals production, but many cost effective alternatives exists for biomass for electricity production.
are very well placed to contribute to the reduction of transport emissions, as there are currently limited cost-effective abatement options available. If other options do not mature and become more cost effective, then this may be the best way to use biomass, though it still may be of interest as a complement to other transport abatement options, such as hybrid vehicles. This is also true if there is the ambition to achieve large reductions in GHG emissions in the short to medium term, implying a need to tackle the transport sector.” [IEA Bioenergy, 2009]. 8 “Given the lack of studies of how biomass resources may be distributed over various demand sectors, we do not suggest any allocation of the different biomass supplies to various applications” [IPCC, 2007 (chapter 11)]
8
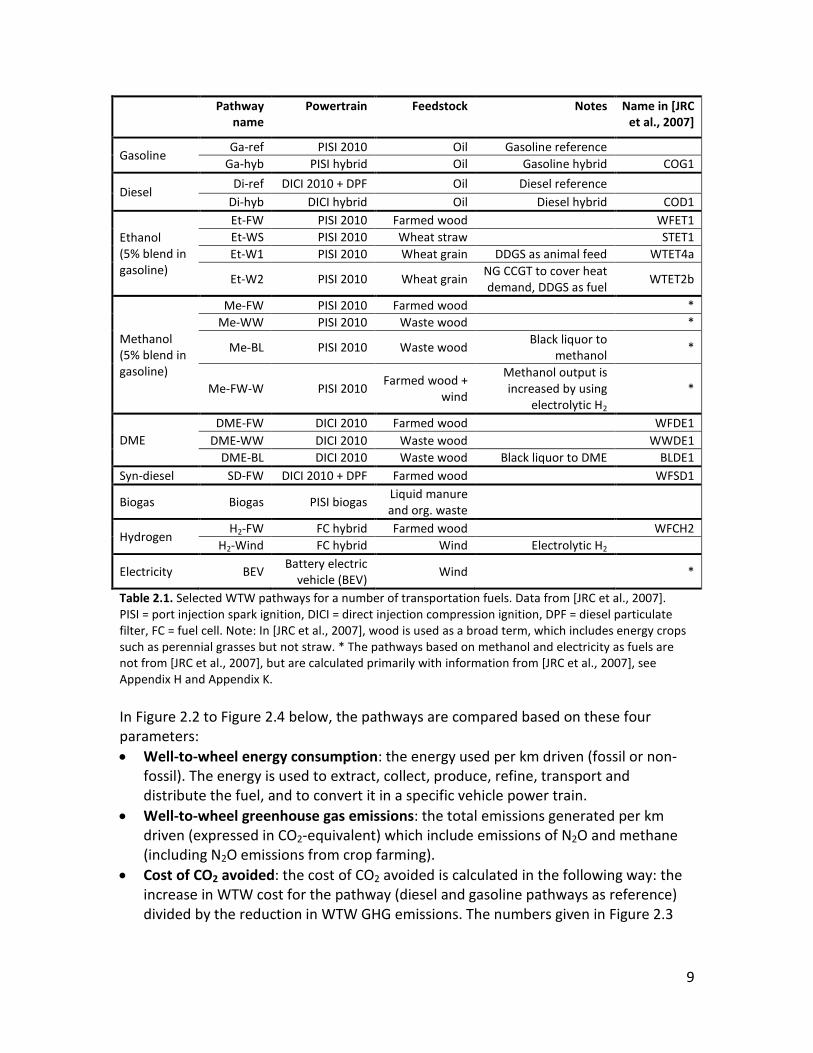
2.2 Well-to-wheel analysis In this section a well-to-wheel (WTW) analysis is presented for a number of road fuels including methanol and DME. The WTW analysis is presented in order to compare methanol and DME with alternative fuels such as ethanol, hydrogen or electricity. A WTW analysis looks at the extraction/farming/collection of feedstock, the refining/production of the fuel, the distribution of the fuel, and the usage of the fuel in a specific vehicle power train. A WTW analysis can therefore be very useful in comparing total energy consumption, GHG emissions and costs for different road fuels. It is however not a lifecycle analysis, which e.g. also considers the construction of the production plants and the vehicles, and the “end of life” aspects of the vehicles. The fuels analyzed here are: methanol, DME, ethanol, synthetic diesel, biogas, hydrogen and electricity. Gasoline and diesel are used for reference. Biodiesel is excluded from the analysis because it is a first generation biofuel and this type of biofuel is represented by some of the ethanol pathways. The WTW analysis is mainly based on the WTW analysis made by the EU Commission’s Joint Research Centre together with EUCAR and CONCAWE [JRC et al., 2007]. Other WTW analyses exist in the literature, but this analysis was chosen because it combines energy, GHG emissions and cost, but also because it is continuously updated – the latest version is from 2007 and a new version is being finalized at this time (2011). The WTW analysis is based on using the transportation fuel in a “virtual” vehicle, representing a typical European compact size 5-seater sedan [JRC et al., 2007]. In Table 2.1, the analyzed WTW pathways are described by giving the powertrain and feedstock used.
9
Pathway
name Powertrain Feedstock Notes Name in [JRC
et al., 2007]
Gasoline Ga-ref PISI 2010 Oil Gasoline reference
Ga-hyb PISI hybrid Oil Gasoline hybrid COG1
Diesel Di-ref DICI 2010 + DPF Oil Diesel reference
Di-hyb DICI hybrid Oil Diesel hybrid COD1
Ethanol (5% blend in gasoline)
Et-FW PISI 2010 Farmed wood WFET1 Et-WS PISI 2010 Wheat straw STET1 Et-W1 PISI 2010 Wheat grain DDGS as animal feed WTET4a
Et-W2 PISI 2010 Wheat grain NG CCGT to cover heat demand, DDGS as fuel
WTET2b
Methanol (5% blend in gasoline)
Me-FW PISI 2010 Farmed wood * Me-WW PISI 2010 Waste wood *
Me-BL PISI 2010 Waste wood Black liquor to
methanol *
Me-FW-W PISI 2010 Farmed wood +
wind
Methanol output is increased by using
electrolytic H2 *
DME DME-FW DICI 2010 Farmed wood WFDE1
DME-WW DICI 2010 Waste wood WWDE1 DME-BL DICI 2010 Waste wood Black liquor to DME BLDE1
Syn-diesel SD-FW DICI 2010 + DPF Farmed wood WFSD1
Biogas Biogas PISI biogas Liquid manure and org. waste
Hydrogen H2-FW FC hybrid Farmed wood WFCH2
H2-Wind FC hybrid Wind Electrolytic H2
Electricity BEV Battery electric
vehicle (BEV) Wind *
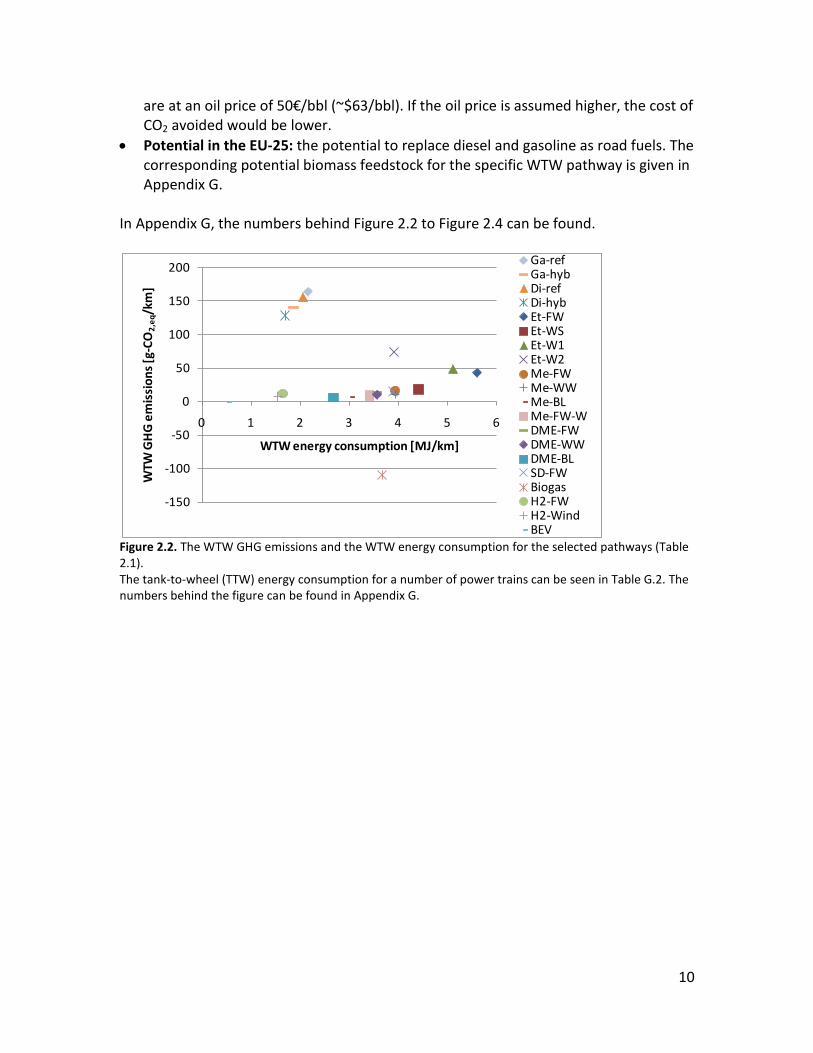
Table 2.1. Selected WTW pathways for a number of transportation fuels. Data from [JRC et al., 2007]. PISI = port injection spark ignition, DICI = direct injection compression ignition, DPF = diesel particulate filter, FC = fuel cell. Note: In [JRC et al., 2007], wood is used as a broad term, which includes energy crops such as perennial grasses but not straw. * The pathways based on methanol and electricity as fuels are not from [JRC et al., 2007], but are calculated primarily with information from [JRC et al., 2007], see Appendix H and Appendix K. In Figure 2.2 to Figure 2.4 below, the pathways are compared based on these four parameters: • Well-to-wheel energy consumption: the energy used per km driven (fossil or non-
fossil). The energy is used to extract, collect, produce, refine, transport and distribute the fuel, and to convert it in a specific vehicle power train.
• Well-to-wheel greenhouse gas emissions: the total emissions generated per km driven (expressed in CO2-equivalent) which include emissions of N2O and methane (including N2O emissions from crop farming).
• Cost of CO2 avoided: the cost of CO2 avoided is calculated in the following way: the increase in WTW cost for the pathway (diesel and gasoline pathways as reference) divided by the reduction in WTW GHG emissions. The numbers given in Figure 2.3
10
are at an oil price of 50€/bbl (~$63/bbl). If the oil price is assumed higher, the cost of CO2 avoided would be lower.
• Potential in the EU-25: the potential to replace diesel and gasoline as road fuels. The corresponding potential biomass feedstock for the specific WTW pathway is given in Appendix G.
In Appendix G, the numbers behind Figure 2.2 to Figure 2.4 can be found.
Figure 2.2. The WTW GHG emissions and the WTW energy consumption for the selected pathways (Table 2.1). The tank-to-wheel (TTW) energy consumption for a number of power trains can be seen in Table G.2. The numbers behind the figure can be found in Appendix G.
-150
-100
-50
0
50
100
150
200
0 1 2 3 4 5 6
WTW
GH
G e
mis
sion
s [g
-CO
2,eq
/km
]
WTW energy consumption [MJ/km]
Ga-refGa-hybDi-refDi-hybEt-FWEt-WSEt-W1Et-W2Me-FWMe-WWMe-BLMe-FW-WDME-FWDME-WWDME-BLSD-FWBiogasH2-FWH2-WindBEV

11
Figure 2.3. The cost of CO2 avoided and the WTW energy consumption for the selected pathways (Table 2.1). The numbers behind the figure can be found in Appendix G.
Figure 2.4. The potential fraction of the road fuels market in the EU-25 that can be replaced and the WTW energy consumption for the selected pathways (Table 2.1). Only the potential of the biofuels has been estimated. The numbers behind the figure can be found in Appendix G. Figure 2.2 to Figure 2.4 showed that only the hydrogen and electricity pathways have lower WTW energy consumption than the reference gasoline/diesel pathways. Many of the other pathways showed to have twice as high WTW energy consumption compared to the reference gasoline/diesel pathways.
-200
0
200
400
600
800
1000
1200
1400
1600
0 1 2 3 4 5 6
Cost
of C
O2
avoi
ded
[€/t
on-C
O2]
WTW energy consumption [MJ/km]
Ga-hybDi-hybEt-FWEt-WSEt-W1Et-W2Me-FWMe-WWMe-BLMe-FW-WDME-FWDME-WWDME-BLSD-FWBiogasH2-FWH2-WindBEV
0%
5%
10%
15%
20%
25%
0 1 2 3 4 5 6
Frac
tion
of r
oad
fuel
s m
arke
t rep
lace
d
WTW energy consumption [MJ/km]
Et-FW
Et-WS
Et-W1
Et-W2
Me-FW
Me-WW
Me-BL
Me-FW-W
DME-FW
DME-WW
DME-BL
SD-FW
Biogas
H2-FW

12
When comparing GHG emissions, most of the pathways showed very low emissions, only some of the ethanol pathways showed significant GHG emissions. The cost of CO2 avoided for the compared pathways were very diverse, ranging from -37 €/ton for methanol from black liquor (used as a blend with gasoline in an internal combustion engine, Me-BL) to 704 €/ton9 for hydrogen from wind turbines (used in a FC hybrid, H2-Wind). The Me-BL pathway was the only pathway with a negative cost of CO2 avoided10
.
The potential to replace fossil fuels as road fuels was also very different for the compared pathways. The pathway with the highest potential (not considering the two pathways based on wind turbines) was the hydrogen from farmed wood used in a FC hybrid (H2-FW), only the pathway based on methanol from farmed wood with external hydrogen supply (Me-FW-W) had a slightly lower potential, the rest of the pathways have less than half of this potential. The potential in the EU-25 for conventional or first generation biofuels (Et-W1 and Et-W2) showed to be lower than the potential for the second generation or advanced biofuels such as DME or methanol. In the WTW study [JRC et al., 2007], the fuels are also compared in “max potential” scenarios. These scenarios add the potential of the individual pathways to show what the total potential of a certain fuel is. This shows that the total potential for conventional biofuels is less than half the potential for advanced biofuels. In Appendix G, the results from the WTW study are discussed in detail, and in the same appendix, it is discussed how the cost for society of emissions could be included in the analysis. Recommendations Based on this analysis, recommendations for the short-, mid- and long-term are given in Table 2.2. No time horizon is given because this is very uncertain – especially for the long-term. The recommendations for the long-term is found to be the optimal solutions, but not yet ready for implementation, while the recommendations for the short term are based on commercially available technology that could be implemented immediately. It can be seen from the table that first generation ethanol from Brazil is recommended as a short-term solution. This is because that ethanol production from sugar cane is a commercial technology and that ethanol can be blended in gasoline, but also because that this type of ethanol can be used with relative low WTW GHG emissions and has a low CO2 avoidance cost [JRC et al., 2007]. The potential for ethanol produced from 9 Disregarding the fossil hybrid pathways shown in Table 2.1: Ga-hyb and Di-hyb. 10 The analysis therefore suggests that at an oil price of 50 €/bbl, it would be cheaper to produce a gasoline blend with methanol from black liquor than neat gasoline. Black liquor pathways are being pursued commercially: Chemrec is building a 2 MW (4 tons/day) pilot plant producing DME from black liquor. The plant is said to be completed in july 2010 [Chemrec, 2010].

13
sugarcane in Brazil is however limited, which is why other solutions must be found for the mid- to long-term. For the short- to mid-term, ethanol addition to gasoline could be replaced or supplemented by methanol addition to gasoline. Methanol addition to gasoline is placed in the short- to mid-term timeframe because biofuel production based on biomass gasification is close to being a commercially available technology (medium scale pilot plants of 45 MWth exists, see Appendix N). Methanol produced from black liquor showed to be a promising fuel because of low WTW energy consumption, low WTW GHG emissions and negative CO2 avoidance cost. The potential for methanol production from black liquor is however limited, which is why methanol production from waste wood and farmed wood could be used to increase the amount of gasoline replaced by methanol. For the mid-term, any solution including fossil fuels is not considered progressive enough (this includes gasoline and diesel hybrid vehicles and blends of biofuels in gasoline), which is why these solutions are excluded. For the mid-term it is assumed that battery electric vehicles are commercially available to replace gasoline and diesel vehicles in urban areas at a “reasonable price”. Because of the limited range of battery electric vehicles they are only recommended for urban areas. In non-urban areas (long distance transport) the recommended mid-term solution is DME because DME is the biofuel with the lowest cost of CO2 avoided11 11, one of the lowest WTW GHG emissions , and has a great potential to replace gasoline and diesel - especially if DME is produced like methanol is produced in the Me-FW-W pathway (a DME-FW-W pathway). For the long-term, hydrogen fuel cell vehicles will become interesting if the vehicle cost is reduced. This is because of hydrogen fuel cell vehicles have low WTW energy consumption and great potential to replace gasoline and diesel. First generation biofuels such as biodiesel and ethanol were not included in the recommendations (except for ethanol from Brazil) because the potential to replace diesel and gasoline for such fuels is too low, combined with the fact that such pathways (Et-W1, Et-W2) have relative high WTW GHG emissions and/or high WTW energy consumption. Second generation ethanol (Et-FW, Et-WS) was excluded from the recommendations because of the higher WTW energy consumption and lower potential than DME. The CO2 avoidance cost for Et-WS is the same as for DME-WW, but the cost for Et-WS is given for a blend in gasoline - if neat ethanol was used in an ICE vehicle, the cost would be higher.
11 Excluding biogas because of its limited potential as a road fuel.
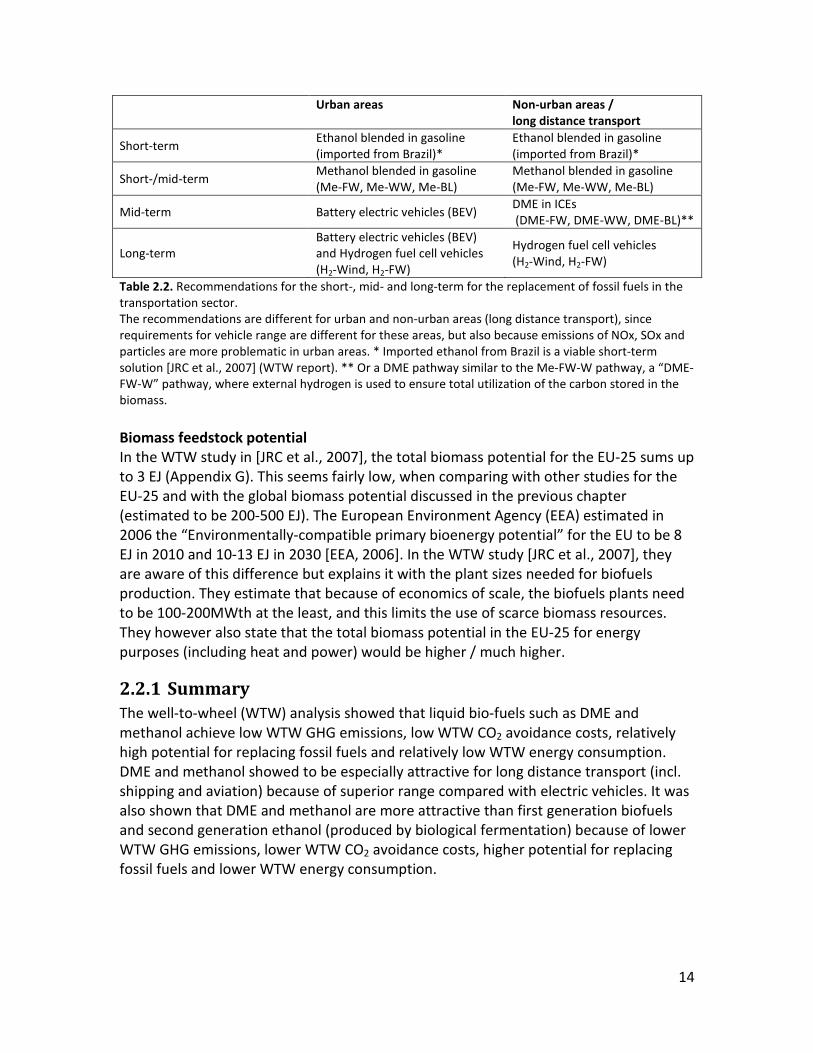
14
Urban areas Non-urban areas / long distance transport
Short-term Ethanol blended in gasoline (imported from Brazil)*
Ethanol blended in gasoline (imported from Brazil)*
Short-/mid-term Methanol blended in gasoline (Me-FW, Me-WW, Me-BL)
Methanol blended in gasoline (Me-FW, Me-WW, Me-BL)
Mid-term Battery electric vehicles (BEV) DME in ICEs (DME-FW, DME-WW, DME-BL)**
Long-term Battery electric vehicles (BEV) and Hydrogen fuel cell vehicles (H2-Wind, H2-FW)
Hydrogen fuel cell vehicles (H2-Wind, H2-FW)
Table 2.2. Recommendations for the short-, mid- and long-term for the replacement of fossil fuels in the transportation sector. The recommendations are different for urban and non-urban areas (long distance transport), since requirements for vehicle range are different for these areas, but also because emissions of NOx, SOx and particles are more problematic in urban areas. * Imported ethanol from Brazil is a viable short-term solution [JRC et al., 2007] (WTW report). ** Or a DME pathway similar to the Me-FW-W pathway, a “DME-FW-W” pathway, where external hydrogen is used to ensure total utilization of the carbon stored in the biomass. Biomass feedstock potential In the WTW study in [JRC et al., 2007], the total biomass potential for the EU-25 sums up to 3 EJ (Appendix G). This seems fairly low, when comparing with other studies for the EU-25 and with the global biomass potential discussed in the previous chapter (estimated to be 200-500 EJ). The European Environment Agency (EEA) estimated in 2006 the “Environmentally-compatible primary bioenergy potential” for the EU to be 8 EJ in 2010 and 10-13 EJ in 2030 [EEA, 2006]. In the WTW study [JRC et al., 2007], they are aware of this difference but explains it with the plant sizes needed for biofuels production. They estimate that because of economics of scale, the biofuels plants need to be 100-200MWth at the least, and this limits the use of scarce biomass resources. They however also state that the total biomass potential in the EU-25 for energy purposes (including heat and power) would be higher / much higher.
2.2.1 Summary The well-to-wheel (WTW) analysis showed that liquid bio-fuels such as DME and methanol achieve low WTW GHG emissions, low WTW CO2 avoidance costs, relatively high potential for replacing fossil fuels and relatively low WTW energy consumption. DME and methanol showed to be especially attractive for long distance transport (incl. shipping and aviation) because of superior range compared with electric vehicles. It was also shown that DME and methanol are more attractive than first generation biofuels and second generation ethanol (produced by biological fermentation) because of lower WTW GHG emissions, lower WTW CO2 avoidance costs, higher potential for replacing fossil fuels and lower WTW energy consumption.

15
2.3 Production of DME and methanol from biomass In this part of the background chapter, it is described how DME and methanol are produced from biomass by thermochemical processes. First a short description of the entire process is given to introduce the reader to the field.
Figure 2.5. Simplified flow sheet for DME/methanol production from biomass. Short description of the entire process (also see Figure 2.5): After a pretreatment of the solid biomass - which may include; drying, chipping or milling - the biomass is converted to a so called “synthesis gas” or “syngas” by gasification. Gasification is a process where a solid fuel is converted to a gaseous fuel by: pyrolysis12 1, partial oxidation (eq. ) and gasification reactions (eqs. 2 and 3). The syngas will consist of mainly H2 and CO, but also CO2, H2O, CH4 and higher hydrocarbons (including tars). Oxidation of coke: C+½O2 → CO
(1)
Gasification reactions: C+H2O → CO+H2
(2)
C+CO2 → 2CO
(3)
The syngas from the gasifier is cleaned for impurities such as sulfur because sulfur is poisonous to the catalyst used for the DME/methanol synthesis. The syngas is also
12 Pyrolysis: a process that occurs when heating a solid fuel (organic material) without the presence of oxygen. In a pyrolysis process the solid fuel will decompose to a volatile gas and solid coke (mainly carbon). The volatile gas will consist of H2, CO, CO2, H2O, CH4 and higher hydrocarbons (including tars). Pyrolysis gas made of biomass will also contain N2 and sulfur components.
GasificationPretreatment
Gas cleaning and conditioning
Synthesis
Syngas
Separation and purification
Electricity production
Biomass
DME/methanol
Unconverted syngas
Water
Oxygen/air
SulfurCO2

16
conditioned, which typically includes adjusting the H2/CO ratio by the water gas shift reaction (eq. 4) in order to optimize the DME/methanol synthesis. For methanol synthesis, the optimal H2/CO ratio is 2, which can be seen from the methanol synthesis reaction (eq. 5). Water gas shift (WGS) reaction: H2O+CO ↔ CO2+H2
(4)
Methanol synthesis reaction: 4H2+2CO ↔ 2CH3OH
(5)
Conditioning of the syngas will also typically include CO2 removal because CO2 slows down the chemical reactions producing methanol/DME, and because it enables the use of smaller (and therefore cheaper) downstream equipment. The synthesis of DME and methanol is achieved in a catalytic reactor at elevated pressure and temperature. The product gas from the reactor is cooled, whereby DME/methanol is condensed to a liquid. The liquid is sent to fractional distillation, where DME/methanol is separated from absorbed gasses, water and byproducts. The syngas that is not converted to DME/methanol can be used as fuel in a gas turbine, gas engine or burnt in a boiler to produce electricity. The production of DME/methanol from biomass can therefore be split into these three main parts: • Gasification • Gas cleaning and conditioning • Synthesis of methanol and DME In the following, these three parts will be described in the relevant detail, and the (best) available technology will be presented for each part.
2.3.1 Gasification In this section the suitability of the basic gasifier types for syngas production are discussed, which leads to a discussion on how biomass can be gasified in an entrained flow gasifier. Three main gasifier types exist. These are:
1. The Fixed bed or moving bed gasifier a. Updraft gasifier b. Downdraft gasifier
2. Fluidized bed gasifier 3. Entrained flow gasifier

17
In Figure 2.6, sketches of the three main gasifier types are given, together with an indicative temperature distribution through the gasifiers. In the following, a basic knowledge about these three gasifier types is assumed (see Appendix L for a detailed description).
Figure 2.6. A comparison of the three main gasifier types (operating on coal) [EPRI, 2004]. The “moving bed gasifier” showed in the top is an updraft gasifier.
2.3.1.1 Gasifier types suited for syngas production The three main gasifier types are not equally suited for syngas production. A gasifier suited for syngas production has the following characteristics: 1. The gas from the gasifier has a high content of CO and H2. This is attractive because
CO and H2 are the building blogs for most/all synthesis reactions. The preferred ratio between H2/CO depends on the specific synthesis process, but generally a H2/CO ratio between 1 and 2 is preferred. If the gas contains inert compounds (typically CH4 or N2) this will inhibit a high conversion of H2 and CO because inerts build up in the synthesis loop.
2. The gas has a low content of CH4 and higher hydrocarbons (including tars). This is attractive because these compounds contain a lot of chemical energy, which could

18
have been converted to CO and H2. Tars are also problematic because of condensation of tars when the gas is cooled, which is typically required.
3. The gas is pressurized to the pressure needed in the synthesis. This will lower the energy consumption for pressurization, even though the inputs to the gasifier need to be pressurized.
4. A high cold gas efficiency (eq. 6). This is attractive because this means that a high fraction of the chemical energy in the solid fuel is converted to chemical energy in the syngas, which hence can be converted to chemical energy in the final synthesis product.
(6)
Besides these four characteristics, the gasifier cost also plays a key role13
. Other important aspects concern the gasifier availability and scalability.
In Table 2.3, the main gasifier types are compared based on the four criteria. The comparison is based on using the same gasification agent in all gasifiers, which preferably is oxygen and steam14
Characteristic 1 and 2 are somewhat coupled because a gas with a high content of CH4 and higher hydrocarbons will also have a relatively low content of CO and H2. The amount of oxidant used is however also important for the content of CO and H2 because a high oxidant demand results in more H2O and CO2 and therefore less CO and H2. The oxidant demand can be seen from characteristic 4 because the cold gas efficiency states how much of the input chemical energy that has been oxidized and therefore converted to thermal energy.
.
13 It is not clear what biomass gasifier costs will be. If costs for coal gasifiers are used as guidance, the least costly gasifier would be an entrained flow gasifier, followed by a fluidized bed gasifier – especially for large scale plants because of the economy of scale [GWD, 2007] [NETL, 2010]. 14 Air contains inert nitrogen which results in higher energy consumption for pressurization and larger downstream equipment and lower synthesis yields. Oxygen production is however costly and energy consuming, but the benefits of oxygen outweighs these issues [Larson et al., 2009-1]. Oxygen production is discussed in Appendix M.

19
Fixed bed (updraft)
Fixed bed (downdraft)
Fluidized bed Entrained flow
1. High content of CO and H2 4 2 3 1
2. Low content of CH4 and higher hydrocarbons (including tars)
4 (a lot)
2 (some)
3 (some)
1 (trace)
3. Pressurized to the pressure needed in the synthesis
2 (up to
~30 bar)
2 (up to
~30 bar)
2 (up to
~30 bar)
1 (up to
~80 bar)
4. High cold gas efficiency 1 ~90% (LHV)
2 ~85% (LHV)
3 ~85% (LHV)
4 ~80% (LHV)
Table 2.3. A comparison of the basic gasifier types based on the four characteristics of a gasifier suited for syngas production (listed above). The gasifier types are rated 1 to 4 for each characteristic (1 is best). The data are based on Appendix L, Appendix N and Appendix Q. The data are indicative, and will depend on the actual design of the gasifier. Based on this comparison the entrained flow gasifier seems very suited for syngas production. The only problem for the entrained flow gasifier is the low cold gas efficiency. However, if a catalytic tar cracker is used on the other gasifier types to deal with the content of tar and higher hydrocarbons in the gas, the total cold gas efficiency (including tar cracker) would drop. In [Larson et al., 2009-1] the cold gas efficiency for a pressurized oxygen-blown fluidized bed biomass gasifier including tar cracker is 80% (the biomass is switchgrass). Entrained flow gasification of biomass is discussed below. In Table 2.3, it can be seen that the gasifier type with the highest cold gas efficiency is the updraft gasifier. This type of gasifier is however not suited for syngas production because too much of the chemical energy in the gas is stored as CH4 and higher hydrocarbons. However, Sasol Lurgi uses updraft coal gasifiers for syngas production, but these types of gasifiers where mainly constructed up until the 1980’s – they only play a minor role today [GWD, 2007] [NETL, 2010]. If a fluidized bed gasifier is used for syngas production, a tar cracker or similar is needed to reduce the content of tar and higher hydrocarbons in the gas. In [Larson et al., 2009-1], a pressurized oxygen-blown fluidized bed gasifier (with tar cracker) is used for syngas production even though the CH4 content in the gas is 7 mole% (in the cleaned and conditioned gas) [Larson et al., 2009-2]. This results in a relatively low fuel yield, but a high electricity production, because the unconverted syngas is used in a gas turbine to produce electricity. Pressurized oxygen-blown fluidized bed gasifiers are by many considered the most promising biomass gasifier for syngas production (see section 2.4). In Appendix N, such a

20
gasifier is described (GTI gasifier) together with other fluidized bed biomass gasifiers - and the CHOREN gasifier. The use of a modified down draft gasifier for syngas production is described in chapter 6. The use of a downdraft gasifier may however only be feasible for small-scale plants - if feasible at all - due to the poor economy of scale compared with fluidized beds and entrained flow gasifiers. In Appendix P, data is given for this modified downdraft gasifier.
2.3.1.2 Entrained flow gasification of biomass Entrained flow gasifiers are today the dominant gasifier type for new commercial coal based synthesis plants [GWD, 2007]. Because of this, and because the comparison in Table 2.3 showed that entrained flow gasification is attractive for syngas production, it is interesting to investigate the use of entrained flow gasifiers for biomass based synthesis plants. In Appendix Q, information is given on commercial entrained flow coal gasifiers. Modeling studies in literature considering entrained flow gasification of biomass for syngas production includes [Williams et al., 1995] and [Tock et al., 2010]15
.
An important issue relating to entrained flow gasification of biomass is the feeding of biomass to the gasifier [Bergman et al., 2005] [van der Drift et al., 2004]. Feeding of coal to an entrained flow gasifier is accomplished by first milling the coal to small particles (~100 µm [Bergman et al., 2005]) and then entraining the small particles in gas, which is then fed to the gasifier (by pneumatic feeders). The coal particles can also be entrained in water to form a pumpable slurry, which is then fed to the gasifier. Milling biomass to such very small particles required by conventional feeding methods is associated with a high electricity consumption, and if fed by pneumatic feeders, the fluidization behavior is not sufficient [Bergman et al., 2005]. Feeding biomass by entraining the particles in water to form a slurry has not been seen in the literature, but this would be associated with higher losses of chemical energy than observed for coal because biomass has a lower heating value than coal. One way to solve the feeding issue is by pretreating biomass by torrefaction, which is discussed below. Another pretreatment technique enabling entrained flow gasification of biomass is flash pyrolysis. This process produces a bio-oil, char and pyrolysis gas. In [Henrich et al., 2009], the bio-oil is mixed with the produced char to create a pumpable slurry containing 87% of the energy in the solid biomass (the Bioliq concept). In a review article about pretreatment options for feeding biomass to pressurized entrained flow gasifiers, these two options were compared among others, but no recommendations
15 Biomass torrefaction is used in [Tock et al., 2010]. No pretreatment technique is used in [Williams et al., 1995] except milling. The conclusion in [Williams et al., 1995] is that entrained flow gasification of biomass is not optimal because of the high costs of milling biomass to very small particles, and because of the high oxidant demand.
21
were given (torrefaction is not recommended above flash pyrolysis or vice versa) [Svoboda et al., 2008]. Co-gasification of untreated biomass with coal has been demonstrated at commercial scale in an entrained flow gasifier. In Buggenum (Netherlands), a Shell gasifier used in a 253 MWe integrated gasification combined cycle (IGCC) plant, has since 2006 co-gasified biomass with coal. CO2 emissions are reduced by 22%. They have conducted tests with chicken manure, sewage sludge and wood as replacements for coal [NUON, 2010] [van der Drift et al., 2006]. Feeding problems are avoided because biomass is mixed with coal [van der Drift et al., 2006]. Since the burner used in a pulverized coal (PC) power plant resembles the burner in an entrained flow gasifier, it could be relevant to compare with experience from PC power plants. One of the units of the Danish commercial PC power plant “Amagerværket” has been rebuilt to use only biomass (68 MWe). In this plant, biomass is milled by coal mills and burned in the coal boiler. The biomass is however only milled to millimeter size particles (30% <= 0.5 mm; 95% <= 2.0 mm [Kristensen, 2009]). Entrained flow gasification of such relatively large biomass particles may be possible [van der Drift et al., 2004], but feeding such big biomass particles to a pressurized entrained flow gasifier will still be an issue [van der Drift et al., 2004]16
.
Another issue relating to entrained flow gasification of biomass is the formation of slag (molten ash). This is discussed in Appendix R, but the conclusion is that biomass should be gasified in slagging entrained flow gasifiers instead of non-slagging entrained flow gasifiers, and that addition of fluxing agents and/or slag recycle are needed to ensure sufficient slag formation [van der Drift et al., 2004]. A slag recycle and addition of fluxing agents are also used when gasifying low ash coals [van der Ploeg et al., 2004]. Torrefaction of biomass The research cited here on torrefaction of biomass has been carried out by the Technical University of Eindhoven (TU/e) and the Energy research Centre of the Netherlands (ECN). Torrefaction is a mild pyrolysis process that alters the properties of biomass, making them similar to coal [Bergman et al., 2005]. The power consumption for milling torrefied biomass is similar to that of coal [Kiel et al., 2009], and the fluidization behavior is almost as good as coal, making it possible to feed the torrefied biomass particles by pneumatic feeders to an entrained flow gasifier [Bergman et al., 2005] [van der Drift et al., 2004]. More information about torrefaction of biomass is supplied in Appendix S.
16 In the PC power plant “Amagerværket” a high air flow is used to feed the biomass particles to the burners, which is possible because the burner operates at atmospheric pressure and a high air flow is no problem – the high air flow will simply reduce the amount of air required for complete combustion.

22
If the torrefaction process is done on-site, the volatile gas from the torrefaction process can be used for syngas production by feeding the gas to the gasifier, and the heat required for torrefaction can be supplied by waste heat from the synthesis plant. In [Prins et al., 2006], the volatile gas is suggested to be used as a chemical quench for the entrained flow gasifier, which improves the cold gas efficiency of the gasifier. The torrefaction process can however also be done decentralized, if combined with pelletization, to lower the biomass transportation costs – this enables large-scale biomass synthesis plants [Kiel et al., 2009] [Uslu et al., 2008]. Decentralized torrefaction and pelletization is however associated with a loss of chemical energy because the volatile gas from the torrefaction cannot be fed to the gasifier. In decentralized torrefaction, the volatile gas is burnt and the heat is used for drying and torrefaction [Kiel et al., 2009]. If the moisture content of the wood used is below 40 mass%, the loss in chemical energy can be limited to 90% (LHV, dry basis) [Bergman et al., 2005]. If the moisture content is higher, the loss in chemical energy will be greater, unless waste heat from an external process is available for drying. In [Uslu et al., 2008], cost for torrefied wood pellets for large-scale plants is estimated to be lower than conventional wood pellets. It is also estimated that the total energy efficiency is higher for torrefied wood pellets compared to conventional wood pellets because of lower energy requirements for milling and pelletization [Uslu et al., 2008]. It has not been possible to find any references where experiments have been conducted on gasifying torrefied biomass in an entrained flow gasifier at commercial scale. In [van der Drift et al., 2004], experiments with torrefied biomass have been done on lab-scale, but mainly concerning the slag formation.
2.3.2 Gas cleaning and conditioning Gas cleaning and conditioning of a syngas from a biomass gasifier typically includes: • Cleaning for impurities such as particles and sulfur. • Conditioning of the gas by adjusting the H2/CO ratio by the water gas shift reaction. • Conditioning of the gas by CO2 removal. Below, the gas cleaning requirements for a syngas are described, followed by the methods used for gas cleaning. The last section is about conditioning of a syngas by the water gas shift reaction. CO2 removal is included in the section about gas cleaning methods because the cleaning of impurities can be combined with CO2 removal.
2.3.2.1 Gas cleaning requirements Gas cleaning requirements for a syngas to be used for DME or methanol synthesis are very similar to requirements for other types of synthesis, such as Fischer-Tropsch synthesis [van der Drift et al., 2006]. In Table 2.4, indicative syngas specifications are given. It may however be economically attractive to clean below these requirements because an economic trade off exists between gas cleaning and synthesis catalyst performance [van der Drift et al., 2006].

23
Table 2.4. Maximum allowable concentration of impurities in syngas. Adapted from Fischer-Tropsch synthesis requirements [van der Drift et al., 2006]. In Table 2.5, gas impurities for two different gasifiers are given. If the values given for the CFB gasifier are compared with the values from Table 2.4, it is clear that gas cleaning is necessary for all species. If the same is done for the cleaned gas from the Viking gasifier, it can be seen that further gas cleaning is necessary at reduce the NH3 content (and perhaps other impurities not measured). The tar content is however sufficiently low, and the sulfur content is very close to the maximum allowable concentration. The particle concentration may also be sufficiently low. Circulating fluid bed
(raw gas)* Modified downdraft gasifier
(Viking Gasifier, cleaned gas)** [mg/Nm3] [ppm] [mg/Nm3] [ppm] NH3 2200 2899# 63-141 83-186# HCl 130 80# - - H2S 150 99# 0.75-1.5# 0.5-1 Particles 2000 - < 5 - Tar 9410 1200 < 1 - Table 2.5. Impurities in the gas from two different gasifiers. * data from Appendix T. ** data from [Iversen, 2006] except for H2S, which is from [Iversen et al., 2006] (also see Appendix P). The gas cleaning for the Viking Gasifier consists of a bag house filter and cooling the gas to 40-50 C. # calculated value, based on the value given in ppm or mg/Nm3.
2.3.2.2 Gas cleaning methods (incl. CO2 removal) Gas cleaning of a bio-syngas can be very similar to gas cleaning of a more conventional syngas (e.g. syngas made from coal). Conventional syngas cleaning includes:
1. Particle removal by a filter and perhaps a cyclone. 2. A Rectisol unit to remove bulk impurities and CO2 3. Guard beds (ZnO and active carbon filters) to remove trace impurities
[van der Drift et al., 2006] Gas cleaning of a bio-syngas will include points 1 and 3, and if CO2 removal is wanted then also point 2. A Rectisol unit, however, requires a pressurized gas and is only suited for large-scale plants. If a Rectisol unit is not used, some kind of scrubbing process is necessary to remove e.g. NH3.The Rectisol process as well as alternatives to this process is discussed below.

24
Gas cleaning of a bio-syngas from a fluidized bed - or any gasifier producing tar - will also include tar removal, which is why this is also discussed below. Tar removal Tar removal can be done either by: 1. catalytic or thermal cracking of the tars, 2. by a gas scrubbing process or 3. by steam reforming. Catalytic cracking of the tars is often preferred because this transforms the tars to H2 and CO, and because it is more energy efficient than thermal cracking (~1300°C). Catalytic tar cracking is used by [Larson et al., 2009-1] and by the 20 MWth Skive BGGE/CHP plant in Denmark [Carbona, 2006]. A scrubbing process is also used in operating biomass gasification CHP Plants such as in Harboøre in Denmark and Güssing in Austria [Zwart et al., 2009]. A scrubbing process called OLGA (oil-based gas washing) is proposed by the Energy research Centre of the Netherlands (ECN). In this process the captured tars are recycled back to the gasifier [Zwart et al., 2009]. Steam reforming could be used if the tar content is very high, e.g. gas from an allothermal (indirectly fired) gasifier. The Rectisol process The Rectisol process is an acid gas removal (AGR) process based on absorption of gases in a physical solvent, and in the Rectisol process the solvent is chilled methanol (typically -20°C to -50°C). Absorption based gas cleaning processes can be used when the gas is pressurized (pressurized gasification). The Rectisol process can clean a gas to (below) 0.1 ppm of total sulfur (H2S, COS, CS2) and 2 ppm of CO2 [Lurgi, 2010]. Other impurities, such as HCN, NH3, nickel and iron carbonyls, gum formers, CS2, mercaptans, naphthalene, thiophenes, organic sulfides, and higher hydrocarbons are also removed by the Rectisol process [Lurgi, 2010]. The Rectisol process is used for gas cleaning and conditioning of a bio-syngas in [Kreutz et al., 2008] and [Larson et al., 2009-1]. The Rectisol process is described further in Appendix U. Other absorption-based AGR processes include Selexol and Purisol. Both of these processes occur at ambient temperatures, which is why refrigeration of the solvent is not required. This means that the main energy consumption is for pressurizing the solvent by a pump. Selexol is less effective than Rectisol in removing sulfur17
17 1 ppm of H2S [Larson et al., 2003] vs. below 0.1 ppm of total sulfur (H2S + COS + CS2) [Lurgi, 2010].
, which is why 90% of all synthesis plants that is based on gasification use Rectisol for AGR [Lurgi, 2010]. Selexol is often used in IGCC plants, where requirements for sulfur removal are lower (20 ppm [Larson et al., 2003]), but can be used in synthesis plants [Larson et al., 2003]. However, if used in synthesis plants, the guard beds placed just before the synthesis reactor will need to be regenerated more often because of higher sulfur levels and higher levels of other contaminants.
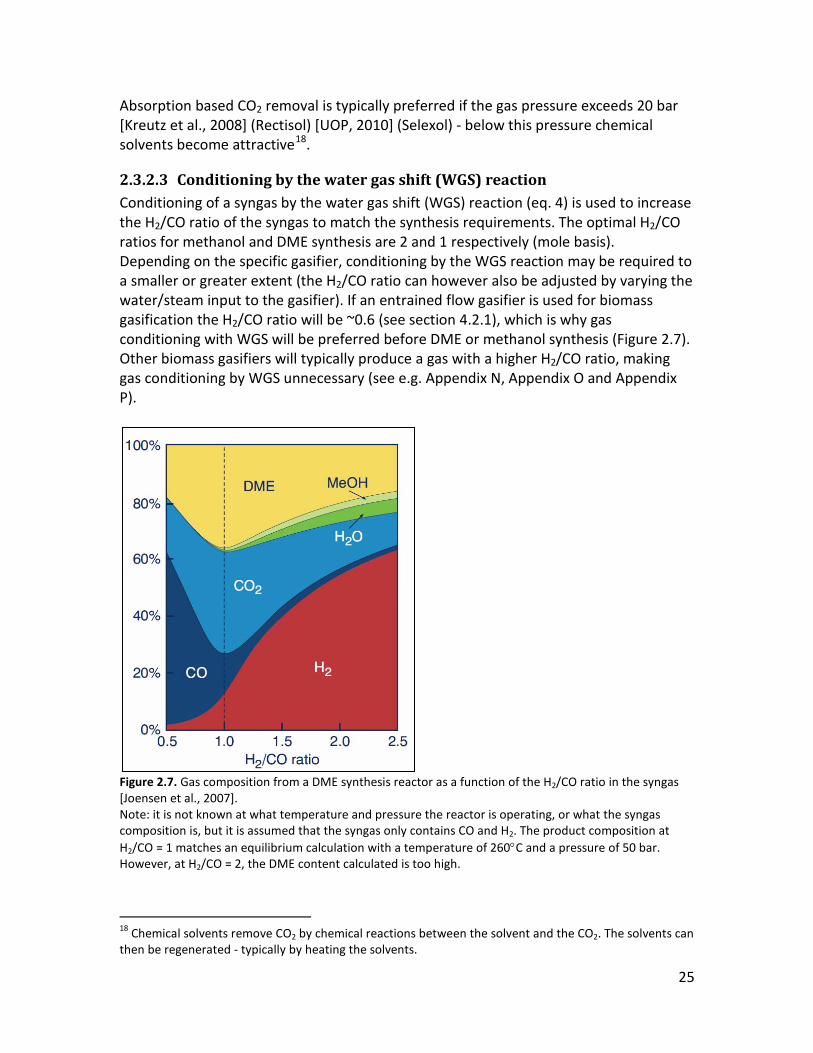
25
Absorption based CO2 removal is typically preferred if the gas pressure exceeds 20 bar [Kreutz et al., 2008] (Rectisol) [UOP, 2010] (Selexol) - below this pressure chemical solvents become attractive18
2.3.2.3 Conditioning by the water gas shift (WGS) reaction
.
Conditioning of a syngas by the water gas shift (WGS) reaction (eq. 4) is used to increase the H2/CO ratio of the syngas to match the synthesis requirements. The optimal H2/CO ratios for methanol and DME synthesis are 2 and 1 respectively (mole basis). Depending on the specific gasifier, conditioning by the WGS reaction may be required to a smaller or greater extent (the H2/CO ratio can however also be adjusted by varying the water/steam input to the gasifier). If an entrained flow gasifier is used for biomass gasification the H2/CO ratio will be ~0.6 (see section 4.2.1), which is why gas conditioning with WGS will be preferred before DME or methanol synthesis (Figure 2.7). Other biomass gasifiers will typically produce a gas with a higher H2/CO ratio, making gas conditioning by WGS unnecessary (see e.g. Appendix N, Appendix O and Appendix P).
Figure 2.7. Gas composition from a DME synthesis reactor as a function of the H2/CO ratio in the syngas [Joensen et al., 2007]. Note: it is not known at what temperature and pressure the reactor is operating, or what the syngas composition is, but it is assumed that the syngas only contains CO and H2. The product composition at H2/CO = 1 matches an equilibrium calculation with a temperature of 260°C and a pressure of 50 bar. However, at H2/CO = 2, the DME content calculated is too high.
18 Chemical solvents remove CO2 by chemical reactions between the solvent and the CO2. The solvents can then be regenerated - typically by heating the solvents.

26
Conditioning of a syngas by WGS is typically done in an adiabatic catalytic reactor operating at 200-500°C [Haldor Topsøe, 2010-1]. Total energy efficiency can be optimized if using sulfur tolerant catalysts (sour WGS), since this avoids cooling the syngas to ambient temperatures, required by conventional sulfur removal, and then reheating the syngas to perform WGS. When using sulfur tolerant catalysts, the syngas from the gasifier only needs particle filtering, and perhaps steam addition, before WGS [Haldor Topsøe, 2010-2]. Sulfur tolerant catalysts are used in [Larson et al., 2003] for a gas from an entrained flow gasifier on coal. It is unclear how low the steam/carbon ratio can be in the WGS reactor before coke formation becomes an issue. In [Haldor Topsøe, 2010-2], a figure shows that the H2O/CO ratio can be as low as 1 - but no lower limit is given. According to [Haldor Topsøe, 2010-4], the H2O/CO ratio can be as low as 0.4, but a lower limit is not given.
2.3.3 Synthesis of methanol and DME In this section, the basics of methanol and DME synthesis are described, followed by information on separation and purification of the synthesis products to pure DME and methanol. Both methanol and DME are produced by catalytic conversion of a syngas containing H2 and CO. The synthesis takes place in a reactor at elevated temperature and pressure. Methanol is produced from H2 and CO as described in reaction (7), but can also be produced from H2 and CO2 as described in reaction (8) - reaction (8) is however slow compared to (7). DME is produced by dehydration of methanol (9). DME production can therefore be done based on methanol, or directly from a syngas by combing reactions (7) and (9) to give reaction (10). However, if reaction (10) is combined with the water gas shift reaction (11), a more effective total reaction is achieved (12). The reason why reaction (12) is more effective than (10), is that water inhibits the dehydration of methanol because water is a product in the dehydration reaction (9). Figure 2.7 also shows that DME production is more effective by reaction (12) – corresponding to a H2/CO ratio of 1. The catalyst used to promote the methanol synthesis (1) is almost always a copper/zinc oxide catalyst [Hansen et al., 2008], while the catalyst used for methanol dehydration (3) is typically activated alumina [Haldor Topsøe, 2010-8]. When producing DME directly from a syngas - by reactions (10) or (12) - a mixture of the two catalysts is therefore used [Larson et al., 2003]. Specialized catalyst for the direct synthesis of DME from a syngas can however also be used. Methanol synthesis reaction: 4H2+2CO ↔ 2CH3OH
-181.6 kJ
(7)
Alternate methanol synthesis reaction: 6H2+2CO2 ↔ 2CH3OH+2H2O
-99.6 kJ
(8)
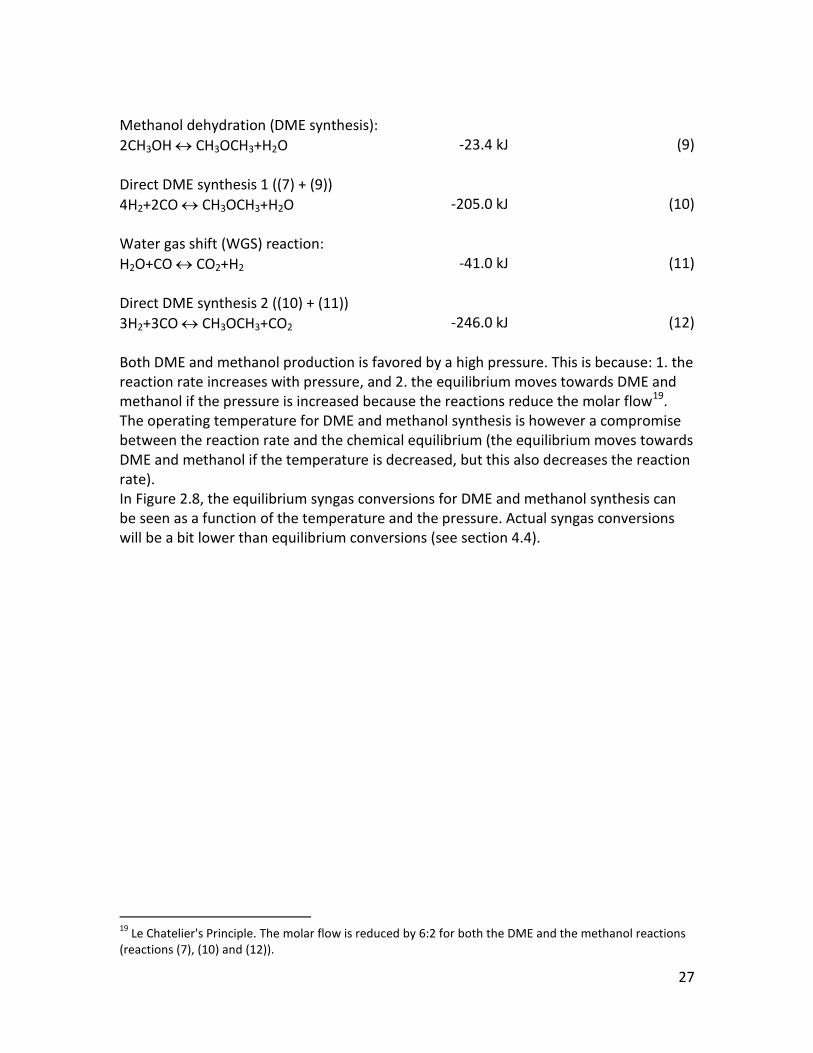
27
Methanol dehydration (DME synthesis): 2CH3OH ↔ CH3OCH3+H2O
-23.4 kJ
(9)
Direct DME synthesis 1 ((7) + (9)) 4H2+2CO ↔ CH3OCH3+H2O
-205.0 kJ
(10)
Water gas shift (WGS) reaction: H2O+CO ↔ CO2+H2
-41.0 kJ
(11)
Direct DME synthesis 2 ((10) + (11)) 3H2+3CO ↔ CH3OCH3+CO2
-246.0 kJ
(12)
Both DME and methanol production is favored by a high pressure. This is because: 1. the reaction rate increases with pressure, and 2. the equilibrium moves towards DME and methanol if the pressure is increased because the reactions reduce the molar flow19
The operating temperature for DME and methanol synthesis is however a compromise between the reaction rate and the chemical equilibrium (the equilibrium moves towards DME and methanol if the temperature is decreased, but this also decreases the reaction rate).
.
In Figure 2.8, the equilibrium syngas conversions for DME and methanol synthesis can be seen as a function of the temperature and the pressure. Actual syngas conversions will be a bit lower than equilibrium conversions (see section 4.4).
19 Le Chatelier's Principle. The molar flow is reduced by 6:2 for both the DME and the methanol reactions (reactions (7), (10) and (12)).

28
Figure 2.8. Equilibrium CO conversion as a function of the reactor outlet temperature and the reactor pressure. For the DME curves, the syngas had a H2/CO-ratio of 1 (48.5% H2, 48.5% CO, 3% CO2) and for the methanol curves, the syngas had a H2/CO-ratio of 2 (64.7% H2, 32.3% CO, 3% CO2). These H2/CO-ratio’s gives the maximum methanol/DME production. A bit of CO2 is kept in the syngas because this increases catalyst activity [Larson et al., 2009-1] [Hansen et al., 2008]. Typical operating temperatures for DME and methanol synthesis in isothermal reactors are 250-280°C [Larson et al., 2003] and 250-260°C [Haldor Topsøe, 2010-3] respectively, but the specific operating temperature chosen, will depend on the reactor used, the syngas composition and the operating pressure. In [Hansen et al., 2008], the operating pressure is stated to be 50-100 bar for commercial methanol synthesis20
The operating pressure for methanol synthesis is typically higher than for DME synthesis because the methanol synthesis is more pressure dependent at the typical operating temperatures (
, and in [Yagi et al., 2010], the typical operating pressure is stated to be 50 bar for DME synthesis (at 260°C).
Figure 2.8). In Figure 2.9, equilibrium conversion of a syngas for methanol and DME synthesis can be seen at typical operating conditions. The figure confirms that DME synthesis results in higher syngas conversions than methanol synthesis. The product gas compositions in Figure 2.9 show that the water gas shift reaction produces a bit of water and CO from the H2 and CO2 in the syngas. What is also seen for DME synthesis is that almost all the produced methanol is dehydrated to DME.
20 In [Haldor Topsøe, 2010-6] the operating temperature and pressure for the methanol catalyst is given as 200-310°C and 40-122 bar.
0
10
20
30
40
50
60
70
80
90
100
200 220 240 260 280 300
CO c
onve
rsio
n [%
]
Temperature [C]
50 bar
30 bar
80 bar
50 bar
30 bar
80 bar2H2+CO ↔ CH3OH
3H2+3CO ↔ CH3OCH3+CO2

29
Figure 2.9. Equilibrium conversion of a syngas to either DME or methanol (H2/CO = 2 for methanol, H2/CO = 1 for DME). The operating temperatures and pressures are shown on the figure. Both Figure 2.8 and Figure 2.9 show that equilibrium conversion of a syngas results in - especially for methanol - some unconverted syngas. This unconverted syngas can however be separated from the produced methanol/DME, and recycled back to the reactor. In this way, a syngas consisting of CO and H2 with the appropriate H2/CO ratio and little or no inert gas, can be almost completely converted to methanol/DME. Recycling 97% of the unconverted syngas to the reactor is not uncommon [Larson et al., 2009-1]. If the syngas contains much inert gas, a recycle of the unconverted syngas will result in build-up of inert gasses in the synthesis loop, which is why it may be economically optimal to add more catalytic material to the reactor, enabling a lowering of the operating temperature, which then increases the syngas conversion. For a syngas with a composition like that of the Two-Stage Gasifier (Appendix P), the operating temperatures may be reduced to 240°C for DME [Haldor Topsøe, 2010-4] and 230°C for methanol [Haldor Topsøe, 2010-5] (both stated at 40 bar). Energy efficiency By comparing the heat of reaction for reaction (7) and (12), it can be seen that a lot more heating value is lost in the synthesis of DME than methanol. The energy efficiencies can be calculated to be: 88.3% for the methanol reaction (7) and 84.3% for the DME reaction (12) (LHV). However, if the syngas is produced by an entrained flow gasifier, the syngas would require gas conditioning to increase the H2/CO ratio to 1 (DME) or 2 (methanol), which is why this loss in the gas conditioning should be included when comparing the energy efficiencies. In Figure 2.10, the theoretically achievable energy efficiencies for methanol and DME synthesis are compared based on the same syngas (H2/CO = 1 or 2). It can be seen that by doing this, the difference between DME
64.7
28.2
32.3
14.2
3
2.9
18.20.1
0
20
40
60
80
100
120
Reactor inlet
Reactor outlet
gas
flow
[mol
e/s]
Methanol
H2O
CH3OH
CO2
CO
H2
250 C 50 bar
48.5
5.4
48.5
6.2
3
16.80.5
14.00.2
0
20
40
60
80
100
120
Reactor inlet
Reactor outlet
DME
H2O
CH3OCH3
CH3OH
CO2
CO
H2
260 C 50 bar

30
and methanol synthesis is small. The figure assumes complete conversion of the syngas to DME/methanol. In practice, complete conversion is not possible, even when recycling the unconverted syngas. Figure 2.10 also shows the efficiencies based on DME/methanol as a liquid fuel (right side), by taking the heat of vaporization into account. This is relevant if DME/methanol is used as a fuel in direct injection combustion engines (diesel engines and some/most gasoline engines) or gas turbines. If DME/methanol is used as a gaseous fuel (e.g. in most fuel cells) the efficiencies under “gaseous product” would be the most relevant.
Figure 2.10. Theoretical energy efficiencies (LHV) for the conversion of a syngas, containing only CO and H2, to either DME or methanol. Calculated based on the heating values for H2, CO, DME and methanol (LHVH2 = 241.8 MJ/kmole, LHVCO = 283.0 MJ/kmole, LHVmethanol = 638.1 MJ/kmole, LHVDME = 1328 MJ/kmole). “gaseous product” means that LHV for DME/methanol is for a gaseous state (LHVmethanol is added the heat of vaporization for methanol: changed from 638.1 MJ/kmole to 676.8 MJ/kmole, LHVDME is unchanged because DME is in the gaseous state at standard conditions). “liquid product” means that LHV for DME/methanol is for a liquid state (LHVDME is subtracted the heat of vaporization for DME: changed from 1328 MJ/kmole to 1309 MJ/kmole, LHVmethanol is unchanged because methanol is in the liquid state at standard conditions). Note: the results shown for “gaseous product” can also be calculated based on LHV for CO and H2, and the reaction heats given above (gives the same results). Synthesis reactors Conventional methanol synthesis is done in fixed bed reactors. For small to medium scale plants (up to 400 MWth methanol per reactor) fixed bed boiling water reactors (BWR) are typically used. For large-scale plants (up to 2.3 GWth of methanol for a single line) adiabatic reactors in series are preferred [Hansen et al., 2008]. Liquid/slurry phase reactors, where the catalytic material is suspended in an inert oil for optimal temperature control, can also be used for methanol synthesis21
21 A liquid phase reactor has been demonstrated at commercial scale for methanol synthesis [Larson et al., 2009-1].
. The
86.0% 88.3%84.3% 86.6%
0%
10%
20%
30%
40%
50%
60%
70%
80%
90%
100%
H2/CO = 1 H2/CO = 2
Ener
gy e
ffic
ienc
y (L
HV
)
gaseous product MethanolDME
81.1% 83.2%83.1% 85.4%
0%
10%
20%
30%
40%
50%
60%
70%
80%
90%
100%
H2/CO = 1 H2/CO = 2
liquid product MethanolDME

31
liquid/slurry phase reactors can be scaled to higher capacities than the BWR, which is why they are the only alternative to fixed bed adiabatic reactors for large-scale methanol synthesis [Hansen et al., 2008]. The reactor types used for methanol synthesis, can also be used for DME synthesis, but because DME synthesis is favored by higher syngas conversion than methanol synthesis, direct DME synthesis is not done in adiabatic reactors, but only in isothermal reactors, such as BWR or liquid/slurry phase reactors. BWR is suggested by Haldor Topsøe for direct DME synthesis (at least for small to medium scale) [Haldor Topsøe, 2010-4] [Haldor Topsøe, 2010-5] [Haldor Topsøe, 2010-3], but also by Korea Gas Corporation [KOGAS, 2009]. Both companies have small-scale pilot plants. [KOGAS, 2009] suggests the use of multiple reactors for large-scale DME plants (250 MWth of DME per reactor in a plant using four reactors). A liquid phase reactor is used by [Larson et al., 2009-1] for DME synthesis. This reactor type has also been demonstrated at pilot scale for DME synthesis [Larson et al., 2009-1], which is also the case for the slurry phase reactor (33 MWth of DME) [Yagi et al., 2010]. In Appendix V, more information is given on the reactor types described above.
2.3.3.1 DME/methanol separation and purification The product gas from the DME or methanol synthesis contains (besides DME/methanol): H2, CO, CO2, H2O, inerts that were present in the syngas (e.g. N2, CH4) and very small amounts of byproducts formed by the synthesis catalyst (e.g. ethanol). In Appendix W, information is given on byproduct formation. The conventional method for separating DME/methanol from the gaseous components in the product gas is by cooling the product gas until condensation of DME/methanol occurs (Figure 2.11). In the case of methanol, condensation can be achieved with cooling water, while refrigeration of the product gas is needed for DME. After condensation, the stream is sent to a gas-liquid separator. The most of the gas is typically recycled back to the DME/methanol reactor, while the liquid stream is sent to distillation. The liquid stream will, beside DME/methanol, contain H2O and absorbed gasses (e.g. CO2, H2, CO). In the case of DME synthesis, the liquid stream will contain large amounts of CO2. The distillation of DME/methanol consists of 2-3 distillation columns, where the first column is a topping column (CO2 column in Figure 2.11), which separates the absorbed gasses from the liquid. In the case of methanol distillation, one or two columns are then used for separating methanol from water and byproducts (e.g. ethanol) [Hansen et al., 2008]. In the case of DME distillation, one or two columns are used for separating DME from methanol, water and byproducts (in Figure 2.11, two columns are used). If only one column is used, DME will be the overhead product, water the bottom product and methanol a side product (disregarding byproducts, see Figure X.1). The purity requirements for product methanol and DME are discussed in Appendix Y, and in Appendix X, background information is given on fractional distillation.

32
Figure 2.11. Flow sheet of a DME plant showing how the product gas from the DME reactor is separated and purified [Yagi et al., 2010]. This actual flow sheet is for a 100 ton/day DME demonstration plant (~ 33 MWth of DME).

33
2.4 Previous work within the field by others In this part of the background chapter, the work within the field by other authors is presented. Focus is on publications about modeling of gasification based liquid fuels plants. Publications in related areas on e.g. only biomass gasification or only synthesis of liquid fuels are not included because a comprehensive review of this literature would be overwhelming and distract the review from the specific field of interest. With this focus in mind it has been found that important contributors to the field are research groups at Princeton and Utrecht. In Table 2.6 and Table 2.7 a collection of modeling studies are listed, giving relevant data and results from each study. The liquid fuels produced are DME, methanol and Fischer Tropsch fuels, and the feedstocks used are biomass and coal. Some plants based on coal were included because these plants resemble the plants modeled in this study. Below, the studies are compared based on key parameters, but first the studies are compared based on the choice of: biomass gasifier, CO2 capture method and synthesis reactor. Biomass gasifiers By comparing the studies listed in Table 2.6 and Table 2.7, it can be seen that nearly all use fluidized bed gasifiers for biomass gasification (BFB or CFB), the only exception is [Williams et al., 1995] that investigates four different gasifiers which included an entrained flow gasifier22
. The dominant fluidized bed type is a pressurized oxygen-blown fluid bed, but [Tijmensen et al., 2002], [Hamelinck et al., 2001]and [Williams et al., 1995] also looks into indirectly fired fluid bed gasifiers operating at atmospheric pressure (BCL, MTCI), and one out of the five gasifiers investigated by [Tijmensen et al., 2002] is an air-blown fluid bed gasifier operating at atmospheric pressure. All, except [Williams et al., 1995], show that the pressurized oxygen-blown fluid bed produces the highest plant energy efficiencies. The oxygen-blown fluid bed gasifier used most, is the GTI gasifier (BFB) operating at 30-35 bar.
CO2 capture Most of the references use absorption-based CO2 capture for CO2 removal (Rectisol or Selexol), only [Tijmensen et al., 2002] use an amine scrubber (chemical solvent) for some of the cases investigated. [Tijmensen et al., 2002] does not reach a clear conclusion on the choice of CO2 removal technology. . In [Hamelinck et al., 2001], CO2 removal by Selexol is used when the methanol synthesis is performed with conventional synthesis reactors, not when using liquid phase methanol reactors.
22 The conclusion in [Williams et al., 1995] was that entrained flow gasification of biomass is not optimal because of the high costs of milling biomass to very small particles, and because of the high oxidant demand. However, the entrained flow gasifier achieved the highest biomass to methanol efficiency (68% (HHV)).

34
In [Hamelinck et al., 2004], Selexol is used for CO2 removal before FT synthesis in some cases. No clear conclusion is however reached in [Hamelinck et al., 2004] on whether CO2 removal is preferred or not. References such as [Kreutz et al., 2008] and [Larson et al., 2009-1] clearly states that CO2 removal is preferred because CO2 slows down the chemical reactions in the synthesis reactor, and because CO2 removal enables the use of smaller (and therefore cheaper) downstream equipment. Synthesis reactors The synthesis reactors used in the studies for DME synthesis are liquid phase reactors operating at 58-63 bar. The synthesis reactors used for methanol synthesis are liquid phase or fixed bed reactors operating at 90-106 bar. In [Hamelinck et al., 2001], a comparison is done between the two reactor types for methanol synthesis, and the reference finds the liquid phase reactor to produce slightly better results. Comparison on key parameters Below the studies are compared on key parameters:
• Size of biofuel plants [MWthLHV biomass input]: 367-893 • Feedstock to DME/MeOH energy ratio
(RC plants) [%-LHV]: 52-68 • Feedstock to DME/MeOH + net electricity
energy ratio (RC plants) [%-LHV]: 54-61 • Levelized cost of liquid fuel from biomass [$/GJ]: 8-25*
* The significant differences in levelized costs are due to the different assumptions about e.g. biomass cost and electricity sale price. The upper limit on the cost from [Hamelinck et al., 2004] was omitted ($63/GJ). In chapter 5, some of the plants presented here will be used for comparison with the results achieved for a large-scale DME plant. Comparisons will be done both on thermodynamic and economic results.

35
[Kreutz et al., 2008]
[Larson et al., 2009-1]
[Celik et al., 2005]
[Larson et al., 2003]
[Williams et al., 1995]
Product fuel FT DME DME DME MeOH Feedstock Switchgrass switchgrass coal coal Biomass Size [MWth-feedstock]
601 893 2203 1085 ?
Gasifier type BFB (GTI) BFB (GTI) Entrained flow*
Entrained flow*
GTI/MTCI/ BCL/Shell***
Gasifier pressure 30 30 ? 75 1-35 Gasification oxidant O2 O2 O2 O2 O2### CO2 capture method Rectisol Rectisol Rectisol Selexol - CO2 storage or vent Vent** Vent Vent** Vent** - Synthesis technology
Slurry-phase FT
LPDME LPDME LPDME Unknown type
Synthesis method RC RC OT RC assuming RC Synthesis pressure [bar]
23 63 ? 58 100
Energy ratios: Feedstock to fuel [%]
46 52 27 55 57-68 (HHV)##
Feedstock to net electricity [%]
6 9 22 -0.1 -3 to -7 (HHV)##
Total efficiency 52 61 50 55 54-61 (HHV)## Levelized cost of product fuel [$/GJ]
25 18 # 6.6-7.4 9.5 Omitted
Referred to in reference by
BTL-RC-V D-RC VENT - -
Table 2.6. Overview of biofuel plants modeled at the Princeton Environmental Institute at Princeton University. The studies are ordered by publication date (unless for [Kreutz et al., 2008] because the work done in this reference was made after [Larson et al., 2009-1]). LHV is used unless stated otherwise. FT = Fischer Tropsch fuels. BFB = Bubbling fluid bed. LPDME = liquid phase DME. RC = recycle of unconverted syngas. OT = once-through synthesis * Texaco quench (now GE Energy) ** the reference also has cases using CO2 storage. *** GTI (or IGT): Gas Technology Institute (Bubbling fluid bed), MTCI: Manufacturing and Technology Conversion International (Indirectly-heated fluid bed), BCL: Battelle Columbus Laboratory (Indirectly-heated fast fluidized-bed), Shell: Shell entrained flow coal gasifier ## Efficiencies depend on gasifier type (see ***). All plants require external electricity. # cost in reference is $14/GJ, but the reference states that this should have been higher. The reference refers to [Kreutz et al., 2008] (left column in this table), based on the information given, the cost is estimated to ~18 $/GJ-LHV. Biomass @ 50.9 $/ton. ### air is used for indirectly fired gasifiers

36
[Hamelinck et al.,
2004] [Tijmensen et al., 2002] [Hamelinck et al.,
2001] Product fuel FT FT MeOH Feedstock willow wood poplar wood biomass Size [MWth-feedstock] 400 (HHV) 367 380 Gasifier type CFB** CFB/BFB# GTI/BCL*** Gasifier pressure 25** 1-34# 1/35¤ Gasification oxidant O2** O2/air# Air/O2### CO2 capture method Selexol (for some
cases) Amine scrubber (for RC
synthesis) Selexol (for some
cases) CO2 storage or vent Vent Vent Vent Synthesis technology Fixed bed or slurry
bed Fixed bed or slurry bed LPMeOH or
conventional* Synthesis method RC/OT RC/OT RC/OT Synthesis pressure [bar] 25 (RC), 60 (OT) 40 90-106 Energy ratios:
Feedstock to fuel [%] 33 (HHV, typical value)**
14-47# 26-59 (HHV)***
Feedstock to net electricity [%]
12 (HHV, typical value)**
-4 to 29# -4 to 24 (HHV)***
Total efficiency 28-50 (HHV)** 25-52# 50-57 (HHV)*** Levelized cost of product fuel [$/GJ]
18-63 (HHV)## ~ 8-18# 9-12 (HHV)***
Referred to in reference by - - 1 to 6 Table 2.7. Overview of biofuel plants modeled at the Department of Science Technology and Society at Utrecht University. The studies are ordered by publication date. LHV is used unless stated otherwise. FT = Fischer Tropsch fuels. CFB = circulating fluid bed. BFB = bubbling fluid bed. LPMeOH = liquid phase methanol. RC = recycle of unconverted syngas. OT = once-through synthesis. * assuming BWR, but quench reactors are also mentioned ** many concepts are investigated, but the key concept is oxygen blown gasification at 25 bar (not a specific gasifier used). The efficiencies are for this key concept. The other concepts investigated are: air/oxygen gasification, pressurized/atmospheric gasification. # many concepts are investigated including different gasifier operating conditions: air/oxygen gasification, pressurized/atmospheric gasification, direct/indirect fired gasification. The gasifiers investigated are: GTI (or IGT): Gas Technology Institute (BFB), BCL: Battelle Columbus Laboratory (Indirectly-heated fast fluidized-bed, CFB), Termiska Processer (direct fired, air blown, atmospheric, CFB), Enviro Power (now Carbona, assumed to be the same as GTI because Enviro Power bought a license from GTI). ## Cost given in € (reference used: 0.88 €/$) *** many concepts are investigated. The gasifiers are: GTI (or IGT): Gas Technology Institute (Bubbling fluid bed), BCL: Battelle Columbus Laboratory (Indirectly-heated fast fluidized-bed). ### air used in indirectly heated gasifier ¤ atmospheric for indirectly heated gasifier

37
3. Investigated plant designs Based on the information given in the background chapter on the technology behind a DME/methanol production plant, two different plants were designed:
• Large-scale DME plant • Small-scale DME/methanol plant
In this chapter the designs of the two different plants are presented together with the reasoning behind the important design choices. In chapters 5 and 6, the two plants are presented in detail. When designing the large scale plant, both energy efficiency and economy were considered, whereas only energy efficiency was considered in the case of the small-scale plant because it is very unclear what the economy of small-scale biofuel plants will be. Most authors consider only large-scale plants to be feasible [Boerrigter, 2006] [Larson et al., 2006] [Larson et al., 2009-1]. The reason why the small-scale plant was included, was to show the performance of a plant based on a very energy-efficient small-scale gasifier.
Figure 3.1. Simplified flow sheet for DME/methanol production from biomass.
3.1 Large-scale DME plant The design of a large-scale DME plant was based on the use of an entrained flow gasifier operating on torrefied biomass. Based on this gasifier choice, the rest of the plant design was made (Table 3.1). Paper III is based on this design.
GasificationPretreatment
Gas cleaning and conditioning
Synthesis
Syngas
Separation and purification
Electricity production
Biomass
DME/methanol
Unconverted syngas
Water
Oxygen/air
SulfurCO2

38
Biomass Torrefied wood pellets
Pretreatment Milling*
Gasification Entrained flow gasification of torrefied biomass (Shell)
Gas cleaning and conditioning
Conventional particle removal. Sulfur tolerant water gas shift followed by a Rectisol plant. Guard beds before synthesis
reactor.
Synthesis Liquid/slurry phase reactor
Separation and purification
Conventional (cooling until condensation, fractional distillation in two
columns)
Electricity co-production
Integrated steam cycle (for once-through synthesis also a gas turbine)
Table 3.1. The design of a large-scale DME plant. * This is the pretreatment done on-site, which is why it only includes milling. The torrefaction is done on smaller decentralized plants. Drying of the pellets is assumed not to be necessary (constant moisture content of pellets of 3 mass%). Gasification The alternatives to the entrained flow gasifier for large-scale biofuel synthesis are considered to be the gasifier from CHOREN or an oxygen blown pressurized fluidized bed gasifier, both capable of operating on non-torrefied biomass. In Appendix N, these two gasifiers are described together with other biomass gasifiers. The reasons why the entrained flow gasifier was chosen, instead of one of the other gasifiers, can to some extent be seen from Table 3.2 . Other reasons are:
• Better scalability → Lower cost • Simple design → lower cost • Commercial experience for large-scale operation (coal gasification)
The fact that most literature on modeling of biomass based synthesis plants is based on fluidized bed gasifiers, also makes the use of entrained flow gasification of biomass interesting from a scientific point of view (section 2.4). The disadvantage of entrained flow gasification of biomass is, besides the relatively low cold gas efficiency, the melted ash, making the ash less suitable for fertilizer production - this is also the case for CHOREN.

39
Gasifier type Entrained flow (Shell)
CHOREN GTI (with tar cracker)
1. High content of CO and H2 1 1* 3
2. Low content of CH4 and higher hydrocarbons (including tars)
1 (~0.1% CH4)
1 (~0.1% CH4)
3 (~5% CH4)
3. Pressurized to the pressure needed in the synthesis
1 (45 bar)
3 (5 bar)
2 (30 bar)
4. Cold gas efficiency (LHV) (from untreated biomass to syngas)
3# (~72%)
1 (~80%)
1 (~80%)
Source Appendix Q Appendix N Appendix N
Table 3.2. A comparison of gasifier types suited for large-scale syngas production, based on the four characteristics of a gasifier suited for syngas production (listed above Table 2.3). The gasifiers are rated 1 to 3 for each characteristic (1 is best). * The H2/CO ratio is typically 1, making a water gas shift stage unnecessary for e.g. DME and FT synthesis. A water gas shift stage is required for entrained flow gasification. # calculated as 80% for the gasifier and 90% for the torrefaction process (section 4.2.1 and Appendix S) (72% = 80% * 90%). If the other gasifiers use pretreated biomass (e.g. wood pellets), the energy consumption associated with the pretreatment should also be included in the cold gas efficiencies for the other gasifiers. The lower cold gas efficiency of the entrained flow gasifier (~72%) could have been avoided if the torrefaction was done on-site, as explained in section 2.3.1.2. In section 2.3.1.2, it was also mentioned that the cold gas efficiency could be improved further, if the volatile gasses from the torrefaction was used as a chemical quench in the gasifier. The dry fed entrained flow gasifier (Shell) was preferred compared to a slurry fed entrained flow gasifier because of higher energy efficiency and higher carbon conversion23
. The advantage with using a slurry fed gasifier is that the energy consumption for pressurization of the fuel is much lower. It is therefore possible to pressurize the gasifier to at least 75 bar [Kreutz et al., 2008] (coal slurry).
Gas cleaning and conditioning A sulfur tolerant water gas shift was chosen because of higher total plant efficiency and simpler plant design24
compared with conventional (non-sulfur tolerant) water gas shift. A sulfur tolerant water gas shift is used in [Larson et al., 2003] for a coal based synthesis plant producing DME or methanol.
23 A carbon conversion of 99.5% is a typical value [Shell, 2006]. A carbon conversion of 95% is reported in [Kreutz et al., 2008] for a slurry fed GE gasifier. 24 Conventional sulfur removal is done at ambient temperatures, which is why the use of conventional water gas shift requires cooling the hot syngas from the gasifier to ambient temperatures, and then reheating the gas to perform water gas shift.

40
A Rectisol plant was preferred, compared to other absorption based acid gas removal (AGR) processes because of deeper sulfur removal25 and complete removal of other impurities26
. A Rectisol plant is used in [Kreutz et al., 2008] and [Larson et al., 2009-1] for gas conditioning of a bio-syngas for liquid fuels production. Absorption based CO2 removal is typically preferred, compared to CO2 removal by chemical solvents, if the gas pressure exceeds 20 bar [Kreutz et al., 2008] [UOP, 2010].
Synthesis A liquid/slurry phase reactor was preferred for direct synthesis of DME, instead of BWR, because of the size of the modeled plant. A BWR has a maximum size of ~ 400 MWth for methanol synthesis [Hansen et al., 2008], and the same capacity is expected for DME27
. BWR could be used in parallel as done in [KOGAS, 2009], but the cost is assumed to be higher. A liquid/slurry phase reactor is also used in [Larson et al., 2009-1] for DME synthesis.
Electricity co-production An integrated steam cycle uses plant waste heat for electricity production, and in the once-through plant, a gas turbine utilizes the unconverted syngas for electricity production. Because the amount of unconverted syngas is small when a syngas recycle is used, the unconverted syngas is combusted in a boiler. Utilizing unconverted syngas in a gas turbine combined cycle is also done in e.g. [Kreutz et al., 2008] and [Hamelinck et al., 2004]. The design of the integrated steam cycles are presented and discussed in section 5.1.
3.2 Small-scale DME/methanol plant The design of a small-scale DME/methanol plant was based on the use of the efficient Two-Stage Gasifier. Based on this gasifier choice, the rest of the plant design was made (Table 3.3). Paper IV is based on this design.
25 Rectisol cleans to below 0.1 ppm total sulfur (H2S + COS + CS2) [Lurgi, 2010] compared to ~1 ppm H2S for Selexol [Larson et al., 2003]. 26 Rectisol also removes: HCN, NH3, nickel and iron carbonyls, gum formers, CS2, mercaptans, naphthalene, thiophenes, organic sulfides, and higher hydrocarbons [Lurgi, 2010]. 27 However, In [KOGAS, 2009] a 3000 ton/day DME plant is expected to have four reactors (~250 MWth of DME per reactor).

41
Biomass Wood chips
Pretreatment Steam drying
Gasification Two-Stage Gasifier
Gas cleaning and conditioning
Cyclone and filter for particle removal. Water wash/scrubber. Guard beds before synthesis reactor.
Synthesis Boiling water reactor (BWR)
Separation and purification
Conventional (cooling until condensation, fractional distillation)
Electricity co-production
Gas engine
Table 3.3. The design of a small-scale DME/methanol plant. Gasification The Two-Stage Gasifier was the only small-scale gasifier considered. As mentioned in the beginning of this chapter, the small-scale plant is included to show the performance of a plant based on a very energy efficient small-scale gasifier. The Two-Stage Gasifier has one of the highest cold gas efficiencies of any gasifier made, while still producing a syngas with low (or no) tar content, low sulfur content and low CH4 content (~1%) (Appendix P). Gas cleaning and conditioning Gas cleaning for the Two-Stage Gasifier only has to consist of the listed processes because the gas contains only traces of tar and sulfur (section 2.3.2.1 and 2.3.2.2). Gas conditioning by water gas shift is not done because the H2/CO ratio from the gasifier is sufficiently high (H2/CO = 1.5-2). Gas conditioning by CO2 removal is not done because it is considered infeasible for a small-scale plant. Synthesis For small-scale plants, a BWR reactor is the optimal choice for both methanol and DME synthesis [Haldor Topsøe, 2010-4] [Haldor Topsøe, 2010-5] [Haldor Topsøe, 2010-3]. Electricity co-production A gas engine operating on unconverted syngas is used for electricity production. A gas engine has operated on syngas from the Two-Stage Gasifier without problems [Ahrenfeldt et al., 2006].

42
Because the plant is small-scale, and the waste heat generated is at low temperature, waste heat is not used for electricity generation, but is instead used internally in the plant, and for district heating. The design of the heat integration is presented and discussed in section 6.1.

43
4. Modeling of components and processes In this chapter, it is described how the different processes in the DME/methanol production plants were modeled. The modeling was done in the component based thermodynamic modeling and simulation tools Aspen Plus and DNA. In section 4.7 below, more information is given on these two modeling tools As described in the previous chapter, two plants designs are investigated:
• A large-scale DME plant • A small-scale DME/methanol plant
Below, all the process models used to model these two plants are described. Table 3.1 and Table 3.3 show, which processes that are used in which plant. Some processes are used in both plants.
Figure 4.1. Simplified flow sheet for DME/methanol production from biomass. In Table 4.1 and Table 4.2, all process design parameters set in the modeling of the two plants are given. Most of these parameters will be discussed in detail in the sections below.
GasificationPretreatment
Gas cleaning and conditioning
Synthesis
Syngas
Separation and purification
Electricity production
Biomass
DME/methanol
Unconverted syngas
Water
Oxygen/air
SulfurCO2
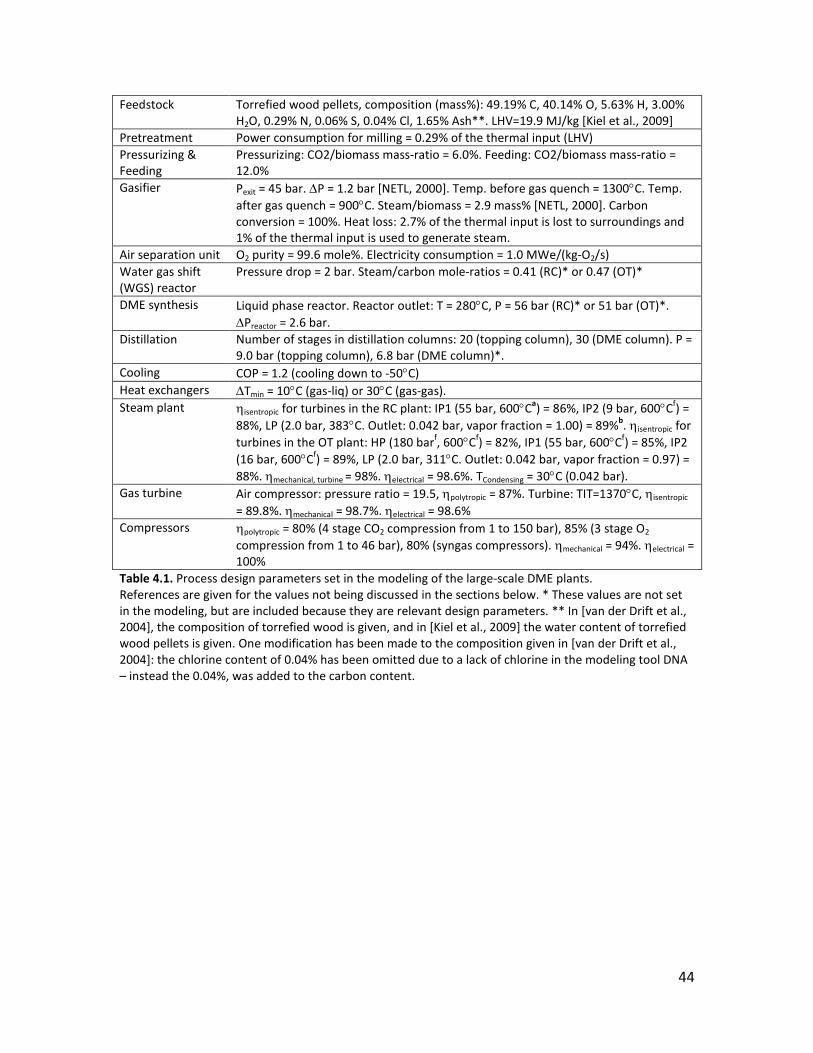
44
Feedstock Torrefied wood pellets, composition (mass%): 49.19% C, 40.14% O, 5.63% H, 3.00% H2O, 0.29% N, 0.06% S, 0.04% Cl, 1.65% Ash**. LHV=19.9 MJ/kg [Kiel et al., 2009]
Pretreatment Power consumption for milling = 0.29% of the thermal input (LHV) Pressurizing & Feeding
Pressurizing: CO2/biomass mass-ratio = 6.0%. Feeding: CO2/biomass mass-ratio = 12.0%
Gasifier Pexit = 45 bar. ∆P = 1.2 bar [NETL, 2000]. Temp. before gas quench = 1300°C. Temp. after gas quench = 900°C. Steam/biomass = 2.9 mass% [NETL, 2000]. Carbon conversion = 100%. Heat loss: 2.7% of the thermal input is lost to surroundings and 1% of the thermal input is used to generate steam.
Air separation unit O2 purity = 99.6 mole%. Electricity consumption = 1.0 MWe/(kg-O2/s) Water gas shift (WGS) reactor
Pressure drop = 2 bar. Steam/carbon mole-ratios = 0.41 (RC)* or 0.47 (OT)*
DME synthesis Liquid phase reactor. Reactor outlet: T = 280°C, P = 56 bar (RC)* or 51 bar (OT)*. ∆Preactor = 2.6 bar.
Distillation Number of stages in distillation columns: 20 (topping column), 30 (DME column). P = 9.0 bar (topping column), 6.8 bar (DME column)*.
Cooling COP = 1.2 (cooling down to -50°C) Heat exchangers ∆Tmin = 10°C (gas-liq) or 30°C (gas-gas). Steam plant ηisentropic for turbines in the RC plant: IP1 (55 bar, 600°Ca) = 86%, IP2 (9 bar, 600°Cf) =
88%, LP (2.0 bar, 383°C. Outlet: 0.042 bar, vapor fraction = 1.00) = 89%b. ηisentropic for turbines in the OT plant: HP (180 barf, 600°Cf) = 82%, IP1 (55 bar, 600°Cf) = 85%, IP2 (16 bar, 600°Cf) = 89%, LP (2.0 bar, 311°C. Outlet: 0.042 bar, vapor fraction = 0.97) = 88%. ηmechanical, turbine = 98%. ηelectrical = 98.6%. TCondensing = 30°C (0.042 bar).
Gas turbine Air compressor: pressure ratio = 19.5, ηpolytropic = 87%. Turbine: TIT=1370°C, ηisentropic = 89.8%. ηmechanical = 98.7%. ηelectrical = 98.6%
Compressors ηpolytropic = 80% (4 stage CO2 compression from 1 to 150 bar), 85% (3 stage O2 compression from 1 to 46 bar), 80% (syngas compressors). ηmechanical = 94%. ηelectrical = 100%
Table 4.1. Process design parameters set in the modeling of the large-scale DME plants. References are given for the values not being discussed in the sections below. * These values are not set in the modeling, but are included because they are relevant design parameters. ** In [van der Drift et al., 2004], the composition of torrefied wood is given, and in [Kiel et al., 2009] the water content of torrefied wood pellets is given. One modification has been made to the composition given in [van der Drift et al., 2004]: the chlorine content of 0.04% has been omitted due to a lack of chlorine in the modeling tool DNA – instead the 0.04%, was added to the carbon content.

45
Feedstock Wet wood chips. Dry composition (mass%): 48.8% C, 43.9% O, 6.2% H, 0.17% N, 0.02% S, 0.91% Ash [Ahrenfeldt et al., 2006]. LHV = 18.3 MJ/kg-dry [Ahrenfeldt et al., 2006]. Moisture content = 42.5 mass%
Steam dryer Texit = 115°C. Tsuperheat = 200°C. Dry wood moisture content = 2 mass%. Gasifier P = 1 bar. Carbon conversion = 99%. Heat loss = 3% of the biomass thermal input
(dry). Texit = 730°C. Tequilibrium = 750°C. Compressors ηpolytropic = 80% **, ηmechanical = 94%. ηelectrical = 100% [Kreutz et al., 2008]. Syngas
compressor: 5 stages with intercooling to 40°C. DME/MeOH synthesis
BWR reactor. Chemical equilibrium at reactor outlet temperature and pressure. Reactor outlet temperatures: 240°C (DME) and 220°C (MeOH). Reactor pressures*: 40.0 bar (DME-OT), 44.7 bar (DME-RC), 96.0 bar (MeOH-OT), 95.0 bar (MeOH-RC).
Cooling COP = 1.2 (cooling at -50°C) Expander / turbine ηisentropic = 70%, ηmechanical = 94%. Gas engine 38% of the chemical energy in the gas (LHV) is converted to electricity. Excess air
ratio (λ) = 2. Texhaust = 400°C. Turbocharger: p = 2 bar, ηis, compressor = 75%, ηis, turbine = 78%, ηmechanical = 94%.
Heat exchangers ∆Tmin = 10°C (gas-liq) or 30°C (gas-gas). In pyrolysis stage: ∆Tmin = 100°C (gas-solid). District heating Twater, supply = 80°C, Twater, return = 30°C Table 4.2. Process design parameters set in the modeling of the small-scale DME/methanol plants. References are given for the values not being discussed in the sections below. * These values are not set in the modeling, but are included because they are relevant design parameters. ** The polytropic efficiency of the syngas compressor may be lower than 80% because of the small scale. The effect of lowering the polytropic efficiency is discussed in section 6.2.2.1.
4.1 Pretreatment of biomass
4.1.1 Milling of torrefied biomass The milling of torrefied biomass pellets was modeled by an electricity consumption (0.29% of the thermal input (LHV), see Appendix S for source and discussion) and by an increase in temperature of the biomass matching the electrical input (from 20°C to 60°C).
4.2 Gasification of biomass
4.2.1 Entrained flow gasification of torrefied biomass The entrained flow gasifier was modeled based on Shell’s commercial, dry-fed, pressurized, slagging entrained flow gasifier. In Figure 4.2, a flow sheet of the modeled gasifier is shown. The gasifier is described further in Appendix Q.
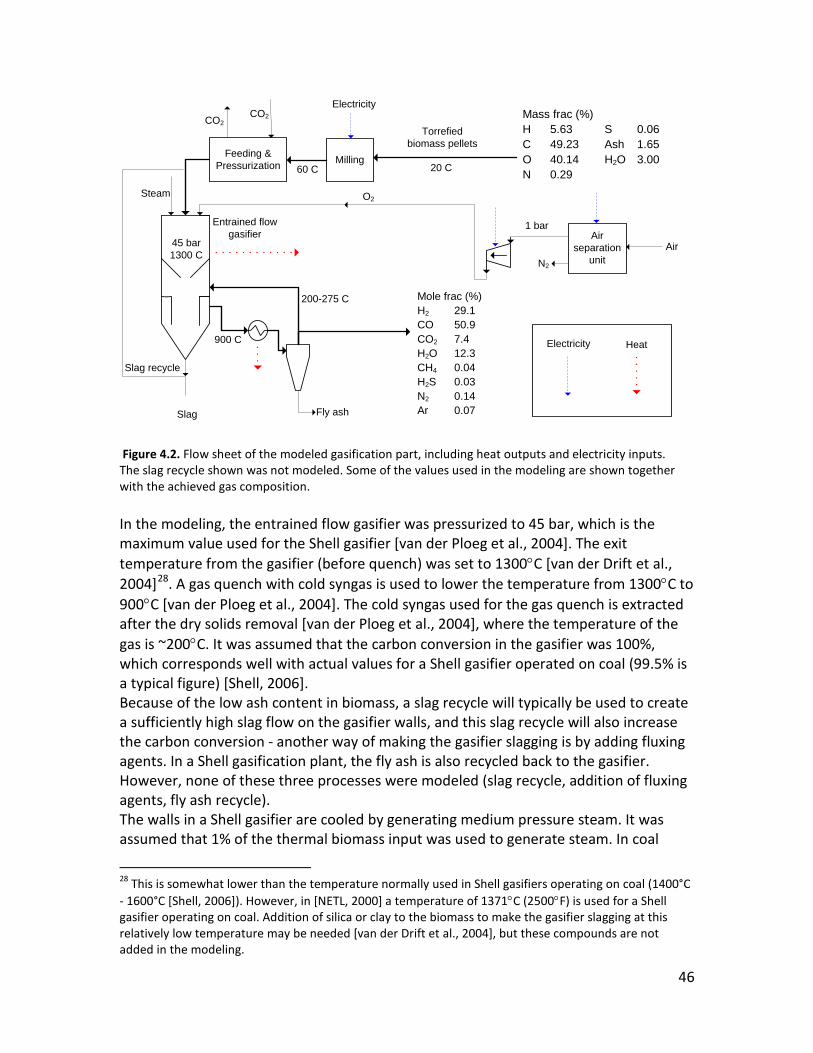
46
Figure 4.2. Flow sheet of the modeled gasification part, including heat outputs and electricity inputs. The slag recycle shown was not modeled. Some of the values used in the modeling are shown together with the achieved gas composition. In the modeling, the entrained flow gasifier was pressurized to 45 bar, which is the maximum value used for the Shell gasifier [van der Ploeg et al., 2004]. The exit temperature from the gasifier (before quench) was set to 1300°C [van der Drift et al., 2004]28
Because of the low ash content in biomass, a slag recycle will typically be used to create a sufficiently high slag flow on the gasifier walls, and this slag recycle will also increase the carbon conversion - another way of making the gasifier slagging is by adding fluxing agents. In a Shell gasification plant, the fly ash is also recycled back to the gasifier. However, none of these three processes were modeled (slag recycle, addition of fluxing agents, fly ash recycle).
. A gas quench with cold syngas is used to lower the temperature from 1300°C to 900°C [van der Ploeg et al., 2004]. The cold syngas used for the gas quench is extracted after the dry solids removal [van der Ploeg et al., 2004], where the temperature of the gas is ~200°C. It was assumed that the carbon conversion in the gasifier was 100%, which corresponds well with actual values for a Shell gasifier operated on coal (99.5% is a typical figure) [Shell, 2006].
The walls in a Shell gasifier are cooled by generating medium pressure steam. It was assumed that 1% of the thermal biomass input was used to generate steam. In coal
28 This is somewhat lower than the temperature normally used in Shell gasifiers operating on coal (1400°C - 1600°C [Shell, 2006]). However, in [NETL, 2000] a temperature of 1371°C (2500°F) is used for a Shell gasifier operating on coal. Addition of silica or clay to the biomass to make the gasifier slagging at this relatively low temperature may be needed [van der Drift et al., 2004], but these compounds are not added in the modeling.
Air separation
unit
Fly ash
Milling
N2
Air
Torrefiedbiomass pellets
CO2
Feeding & Pressurization
Electricity
Entrained flow gasifier
Steam O2
CO2
Electricity Heat
45 bar 1300 C
900 C
200-275 C
20 C60 C
Slag recycle
Slag
Mole frac (%) H2 29.1 CO 50.9 CO2 7.4 H2O 12.3 CH4 0.04 H2S 0.03 N2 0.14 Ar 0.07
Mass frac (%) H 5.63 S 0.06 C 49.23 Ash 1.65 O 40.14 H2O 3.00 N 0.29
1 bar

47
gasifiers this value is typically 2% (Appendix Q), but because of the lower operating temperature, the value was reduced to 1%. The heat loss to the surroundings was set to 2.7% of the thermal biomass input (Appendix Q), which includes the heat loss from the gas cooler [Shell, 2006]. The gas composition from the gasifier was calculated based on an assumption of chemical equilibrium at the operating temperature and pressure (1300°C, 45 bar) [Larson et al., 2003]. Pressurization and feeding: The pressurization and feeding of the pulverized torrefied biomass is done with conventional lock hoppers and pneumatic feeders. It was modeled by taking two streams of pressurized CO2 from the CO2 capture downstream: One was added to the gasifier to simulate the feeding (CO2/biomass = 12 mass% [NETL, 2000]29), and the other was sent to the surroundings to simulate the pressurization (CO2/biomass = 6 mass% [NETL, 2000]30
29). More correct values for the mass flows of CO2 would however have
been: 19-22 mass% for feeding and 13 mass% for pressurization (see footnotes and 30). If 22 mass% of CO2 were used for feeding, instead of 12 mass%, it would result in a decrease in the cold gas efficiency from 80.5% to 79.7%. Oxygen supply: The oxygen supply to the gasifier is provided by a cryogenic air separation unit (ASU), which is modeled by an electricity consumption (1.0 MWe/(kg-O2/s) [Andersson et al., 2006]). The oxygen leaves the ASU at atmospheric pressure with a purity of 99.6 mole% [Andersson et al., 2006]. The oxygen is then pressurized in a 3 stage intercooled
29 In the reference 18971 lb/h of nitrogen is used for feeding 248089 lb/h of coal to a Shell gasifier. This corresponds to a mass-ratio between feeding gas and solid of 7.6%. If this is multiplied with the ratio of the molar masses of CO2 and N2 (44/28), the mass-ratio between feeding gas and solid becomes 12%. But because the amount of feeding gas needed is a certain volume per mass of solid, the feeding gas requirement is dependent on the feeding pressure. In the reference the gasifier inlet pressure is 25.5 bar but in the modeled gasifier the pressure is 46.2 bar. A more correct amount of feeding gas would therefore be: 12%*46.2/25.5=22%. In [van der Drift et al., 2004] it is estimated that the amount of gas needed for feeding of coal at 40 bar to be 2.1 m3-CO2/ton-fuel. This corresponds to a mass-ratio between gas and solid of 17%, and if the pressure is adjusted to 46.2 bar the mass-ratio between gas and solid would be 17%*46.2/40=19%. In [van der Drift et al., 2004] the feeding gas need is also given for torrefied wood powder, but this value is considered unrealistically high. The value seems to be based on the consumption of feeding gas for coal multiplied with the ratio between the bulk densities. The value used for the bulk density of torrefied wood is however 240 kg/m3 while in [Kiel et al., 2009] the bulk density of torrefied biomass pellets is 750 kg/m3. This value is similar to the bulk density of coal (700 kg/m3). 30 In the reference 28456 lb/h of nitrogen is used as “plant N2” for an IGCC plant based on a Shell gasifier. This amount contains the amount of nitrogen used for feeding 248089 lb/h of coal to the gasifier (18971 lb/h). The residual amount of nitrogen is therefore 9485 lb/h, which corresponds to a mass-ratio between CO2 and solid of 6% (see footnote 29). Because the gasifier in the reference is only pressurized to 25.5 bar and the modeled gasifier is pressurized to 46.2 bar, the gas consumption is underestimated. In [van der Drift et al., 2004] it is estimated that the amount of gas needed for pressurization of coal to 40 bar with lock hoppers is 0.9 m3-CO2/ton-fuel (corresponding to a mass-ratio between CO2 and solid of 7%). In [van der Drift et al., 2004] it is also estimated that the amount of gas needed to avoid syngas in-flow to the feed bin is 0.7 m3-CO2/ton-fuel (corresponding to a mass-ratio between CO2 and solid of 6%). A more correct CO2/biomass mass-ratio would therefore be 13%.

48
compressor to 46 bar, with a polytropic efficiency of 85% (ηmechanical = 94% and ηelectrical = 100% [Kreutz et al., 2008]).
4.2.2 Two-stage gasification of wood chips The modeled gasifier used for gasification of wood chips was based on the upscaled version of the Two-Stage Gasifier (described in Appendix P). In Figure 4.3, a flow sheet of the modeled gasifier is shown.
Figure 4.3. Flow sheet of the modeled Two-Stage Gasifier, including heat input/output. Some of the values used in the modeling are shown together with the achieved gas compositions (one used for methanol synthesis and another for DME synthesis). Modified from Figure P.1 (the modifications are listed below). The model differs from the flow sheet of the pilot plant seen in Appendix P. The modifications were made to increase the cold gas efficiency, and to be able to control the H2/CO ratio of the gas produced. The modifications include:
• Splitting the syngas after the cyclone in order to increase the air preheating temperature
• Extracting a part of the steam from the steam dryer to control the steam input to the gasifier (to control the H2/CO ratio of the gas produced).
However, operation with a low steam input to the gasifier results in soot production, which is why the amount of steam extracted, when producing a syngas for DME synthesis, only resulted in a H2/CO ratio of 1.5 (1 is optimal).
Fly ash
Wet wood chips
Ash
GasifierSteam
Dry wood + steam
Pyrolysis reactor
Air Heat
750 C
730 C
115 C
200 C
1 bar
115 C230-236 C
80 C700 C
183-195 C
630 C
DME MeOH Mole frac (%) H2 30.0 29.9 CO 20.4 14.9 CO2 11.0 12.8 H2O 12.4 19.7 CH4 0.76 0.71 N2 25.1 21.7 Ar 0.30 0.26

49
Many of the parameters set for the Two-Stage Gasifier (Figure 4.3) were based on measured values. These include: • The gasifier exit temperature (730°C) • The gasification temperature (750°C, used for equilibrium calculation) • The temperatures before and after the steam dryer (200°C and 115°C) • The moisture content of dried wood (2 mass%) • The carbon conversion (99%, 99.4% measured in [Ahrenfeldt et al., 2006]) • The heat consumption in the pyrolysis unit for the pyrolysis of dry wood31
The gas composition from the gasifier was calculated based on an assumption of chemical equilibrium at the operating temperature and pressure, with the exception of CH4, which was increased to match measured CH4 contents (0.67 mole% was added to the value calculated by chemical equilibrium). The heat loss to the surroundings was set to 3% of the thermal biomass input. The DNA code for the two-stage gasification of wood chips is available in Appendix Z.
4.3 Gas cleaning and conditioning
4.3.1 Water gas shift reactor The water gas shift (WGS) reactor was modeled based on a sulfur tolerant WGS reactor from e.g. Haldor Topsoe. This type of reactor is adiabatic and operates at 200-500°C (section 2.3.2.3) - the inlet and outlet temperatures are therefore kept within this interval. The H2O/CO ratio in the gas to the reactor was 0.41-0.47, which is sufficiently high to avoid coke formation [Haldor Topsøe, 2010-4]. The gas composition from the reactor was calculated based on an assumption of chemical equilibrium of the water gas shift reaction at the exit temperature and pressure.
4.3.2 Rectisol The modeled Rectisol plant was based on the design of a basic Rectisol plant seen in Appendix U. However, because the design of a Rectisol plant depends on the requirements of the synthesis plant, the modeled Rectisol plant is modified in a number of ways. The specific requirement for the modeled Rectisol plant was that the captured CO2 was to be sent to underground storage at 150 bar32
31 The heat consumption in the pyrolysis unit for the pyrolysis of dry wood is calculated based on measured temperatures and known composition of the mass flows – the heat loss to the surroundings is not included. The heat consumption for pyrolysis of dry wood (0% water) was estimated to be 952 kJ/kg-(dry wood) or 5.2% of LHV (heating from 115°C to 630°C).
. Because of this requirement, the
32 In the results section, DME plants using CO2 compression and storage will be compared to plants were the captured CO2 is vented to the atmosphere. It is assumed that the only difference between the Rectisol

50
following modifications were made (see Figure 4.4 - compare with the basic Rectisol plant seen in Appendix U): • Two flash tanks were added between the absorber and the stripper • A secondary methanol loop was added (a part of the methanol solvent is extracted
just before the stripper, and this part is then pressurized, chilled and returned to the absorber)
The two flash tanks The two flash tanks were added in order to release the captured CO2 from the solvent at the highest possible pressure. This lowers the compression work of the CO2 compressor. However, because the solvent also contains the absorbed sulfur components (~H2S), some sulfur will be released with the CO2. This is not considered to be a problem since the sulfur concentrations are very low (because of the low sulfur content of biomass). Co-storage of CO2 and sulfur components is suggested for biomass gasification plants in e.g. [Kreutz et al., 2008]. The secondary methanol loop The secondary methanol loop was added in order to increase the amount of CO2 released in the flash tanks – and therefore also lower the amount of CO2 released in the stripper because CO2 from the stripper will contain some N2, and this increases the compression work of the CO2 compressor. The secondary methanol loop also decreases the steam consumption for distillation and the total refrigeration need of the plant because less solvent is sent to the H2S column. The reasons why the total refrigeration need is reduced when less solvent is sent to the H2S column is that the “H2S column” part results in a temperature increase of the solvent (from -41 C to -31 C, Figure 4.4). The total cost of the Rectisol plant is expected to be reduced by the added methanol loop because of the reduced size of the stripper and the distillation part. In Appendix AA, an idea to further improve the design of the AGR plant, by adding another methanol loop, is presented.
plants used will be the CO2 compression. In reality the Rectisol plants will be designed differently because sulfur must not be emitted with the CO2 to the atmosphere.

51
Figure 4.4. Flow sheet of the acid gas removal (AGR) step based on the Rectisol process (showing electricity consumptions and heat transfer). The flow sheet also includes CO2 compression for underground storage. The values given are taken from a more detailed flow sheet from paper III. Process description: the unclean syngas is first chilled by heat exchange with the clean syngas and a waste gas stream. The unclean syngas is then fed to the bottom of the absorber, where it counter flows with the chilled methanol solvent. At the top of the absorber the clean syngas is removed, and at the bottom of the absorber, the rich solvent is led to a series of flash tanks. In the first flash tank, the gas produced will contain relatively much H2 and CO, which is why this stream is recycled back to the absorber in order to lower the loss of CO and H2. The gas released in the next flash tanks will mainly contain CO2, which is why these gasses are sent directly to underground storage. After the last flash tank, the solvent is sent to a stripper at atmospheric pressure, where nitrogen is used to remove all CO2 from the solvent. The CO2-free solvent from the stripper is then heated by heat exchange with a hot solvent stream, before it is sent to a distillation column, where remaining gas components are removed (H2S-fraction). The sulfur rich gas stream from the H2S-column is sent to an off-gas boiler or gas turbine. A fraction of the liquid from the H2S-column is sent to another distillation column where absorbed water is removed, while the rest of the solvent stream is pressurized and chilled before being fed to the absorber. The reboiler duty needed for the H2S-column, is supplied by the condenser of the water-column. The modeled Rectisol plant removed sulfur components to below 0.1 ppm33 and CO2 to 0.1 mole% (when using a recycle of unconverted syngas in the downstream synthesis) or 3 mole%34
33 The simulations show even lower sulfur content, but it is not known if this is credible.
(when using once-through synthesis).
34 Some CO2 is left in the syngas to ensure catalyst activity in the DME reactor [Larson et al., 2003]. In the RC plant, the CO2 will be supplied by the recycled unconverted syngas.
Absorber
CO2 (+CO+H2)
Gas (with CO2 and sulfur)
CO2
Stripper
N2
N2 (+H2S+CO2)
CO2 (+N2)
Water
Make-up methanol
Clean gas
~H2S~Meoh+CO2
~CO2
~CO2
-20 C
-31 C
-41 C, 1 bar65 C
75 C
110 C
30 C
-38 C
1 bar
150 bar
41 bar
4 bar
42 bar
41 bar

52
The energy consumption of the AGR process is primarily electricity to power the cooling plant, but electricity is also used to run the pumps that pressurize the methanol solvent, and for a recycle compressor. The energy consumption of the AGR process also includes a heat consumption (steam) for the two distillation columns, but this is reduced by using the condenser duty from the water-column to cover the reboiler duty for the H2S-column (Figure 4.4). CO2 compression Besides the energy consumption in the AGR process, there is a substantial electricity consumption associated with the compression of the captured CO2 from 1-4 bar to 150 bar (150 bar is used for underground storage [Kreutz et al., 2008]). The compression of CO2 is done by an intercooled 4 stage compressor (CO2 at 4 bar skips the first stage), with a polytropic efficiency of 80% [Moore et al., 2007] (ηmechanical = 94% and ηelectrical = 100% [Kreutz et al., 2008]).
4.3.3 Gas cleaning for the small-scale plant Gas cleaning for the small-scale plant only included particle removal, a water wash for NH3 removal, and guard beds for removal of trace impurities. The gas cleaning did not comprise tar removal because the tar content in the syngas is almost zero. The water wash was not modeled because it does not have an important impact on the plant performance (the water wash would only result in a water consumption and a pressure drop). The particle removal was modeled as a simple pressure drop, and the guard beds were modeled simply by removing impurities from the gas stream just before the synthesis reactor.
4.4 Synthesis of DME and methanol The synthesis of DME/methanol from a syngas was modeled in two different ways:
1. By assuming chemical equilibrium at the reactor exit temperature and pressure 2. By assuming an approach to chemical equilibrium at the reactor exit
temperature and pressure35
Assuming an approach to chemical equilibrium gives more precise results because the methanol and DME synthesis reactions do not reach equilibrium in commercial reactors. A simple chemical equilibrium calculation was however used for the modeling of the large-scale DME plant because it was considered sufficient at the time the modeling was done. In the discussion of the results for the large-scale DME plant, the effect of using an approach to equilibrium is shown.
35 The way the approach to equilibrium is calculated, is by assuming approach temperatures for the different reactions involved. If for example only the methanol reaction was considered for a reactor with an exit temperature of 250°C, and the approach temperature is assumed to be 10°C for the reaction, the gas composition calculated, would be the equilibrium composition at 260°C.

53
The assumed approach temperatures for the reactions involved in DME/methanol synthesis are:
• 15°C for the methanol reaction (4H2+2CO ↔ 2CH3OH) • 15°C for the WGS reaction (H2O+CO ↔ CO2+H2) • 100°C for the methanol dehydration reaction (2CH3OH ↔ CH3OCH3+H2O)
[Haldor Topsøe, 2010-4] When producing DME, all these reactions are active, while for methanol synthesis, it is only the first two. The effect of using approach temperatures on the syngas conversion can be seen in Figure 4.5 for methanol synthesis, and in Figure 4.6 for DME synthesis.
Figure 4.5. CO conversion for methanol synthesis as a function of the reactor outlet temperature and the reactor pressure. Curves for both equilibrium conversion (Eq), and for an approach to equilibrium (App), are shown. The approach temperatures used are listed above the figure. The syngas had a H2/CO-ratio of 2 (64.7% H2, 32.3% CO, 3% CO2). Because the H2/CO-ratio is 2, the CO conversion is almost identical to the syngas conversion or the H2 conversion. In Appendix FF, a similar figure is given for the syngas from the small-scale gasifier.
0
10
20
30
40
50
60
70
80
90
100
200 220 240 260 280 300
CO c
onve
rsio
n [%
]
Temperature [C]
Eq, 80 bar App, 80 barEq, 50 bar App, 50 barEq, 30 bar App, 30 bar

54
Figure 4.6. CO conversion for DME synthesis as a function of the reactor outlet temperature and the reactor pressure. Curves for both equilibrium conversion (Eq), and for an approach to equilibrium (App), are shown. The approach temperatures used are listed above the figure. The syngas had a H2/CO-ratio of 1 (48.5% H2, 48.5% CO, 3% CO2). Because the H2/CO-ratio is 1, the CO conversion is almost identical to the syngas conversion or the H2 conversion. In Appendix FF, a similar figure is given for the syngas from the small-scale gasifier. All modeled DME/methanol reactors were isothermal reactors with operating temperatures as listed in Table 4.3. The operating pressures were not set, but determined in a number of different ways (described in the results sections). Temperature Reference Liquid/slurry phase reactor 280°C* [Larson et al., 2003] BWR (DME) 240°C [Haldor Topsøe, 2010-4] BWR (methanol) 220°C [Haldor Topsøe, 2010-5]** Table 4.3. Operating temperatures used in the modeled DME/methanol reactors. * This temperature was set as high as possible because the waste heat from the reactor is used to raise steam for power production (a higher temperature results in a higher steam pressure, which then results in a higher power production). ** 220°C was suggested for 100 bar, and 230°C was suggested for 40 bar. Because a small amount of CO2 in the syngas increases catalyst activity [Larson et al., 2009-1] [Hansen et al., 2008], the CO2 content, in the syngas to the DME reactor in the large-scale plants, was set to 3 mole% [Larson et al., 2009-2]. Below it is described how this CO2 content was achieved when using recycle synthesis. In the small-scale plants, the CO2 content in the syngas to the DME/methanol reactor was higher because CO2 removal was not used.
0
10
20
30
40
50
60
70
80
90
100
200 220 240 260 280 300
CO c
onve
rsio
n [%
]
Temperature [C]
Eq, 80 bar App, 80 barEq, 50 bar App, 50 barEq, 30 bar App, 30 bar

55
Recycle synthesis When modeling recycle synthesis, a maximum of 95% of the unconverted syngas was recycled back to the synthesis reactor. A 95% recycle was used in the large-scale DME plant using recycle synthesis (Figure 4.7), while lower recycle rates were used in the small-scale DME/methanol plants using recycle synthesis because of the high content of inert gasses. In the large-scale DME plant using recycle synthesis, a CO2 content of 3 mole% in the syngas to the reactor was achieved by adjusting the condensation temperature (tcondense in Figure 4.7) and the synthesis pressure (lowering the condensation temperature - or increasing the synthesis pressure - increases the amount of CO2 absorbed in the liquid DME).
Figure 4.7. Synthesis loop for the large-scale DME plant using recycle synthesis. Methanol dehydration reactor In the large-scale DME plant using once-through synthesis, a methanol dehydration reactor was used for converting the methanol stream, from the distillation, to DME (in the large-scale DME plant using recycle synthesis, this methanol stream was recycled back to the DME reactor). This methanol dehydration reactor was modeled as an adiabatic reactor, and the product gas composition was calculated by assuming chemical equilibrium of the dehydration reaction (9) at the reactor exit temperature and pressure. The production of by-product gasses was therefore neglected, but this is considered adequate because the mass flow of methanol to the reactor was small compared to the total amount of DME produced in the plant.
DME reactorGas-liquid separator
280 C tcondense =-37 to -50 C
~H2, CO
95% recycle
~H2, CO, CO2
Syngas from Rectisol plant
Liquid to distillation

56
4.5 DME/methanol separation and purification The DME/methanol separation and purification consists of two areas:
1. The condensation of the product gas from the DME/methanol reactor, followed by a gas-liquid separator.
2. The distillation of the liquid from the gas liquid separator. Both sections were modeled in Aspen Plus using the Schwartzentruber-Renon equation of state (for highly non-ideal systems). Condensation of the product gas and gas-liquid separator The condensation of the product gas from the DME/methanol reactor was modeled by cooling the product gas to the desired temperature. In the methanol plants, cooling water was used to cool the product gas to 40°C which ensures condensation, while refrigeration was used in the DME plants to cool the gas to -50 C36. The refrigeration plant used in the DME plants was modeled by an electricity consumption that was calculated based on a COP, which was estimated to be 1.237
The gas-liquid separator was modeled as an adiabatic flash tank, which means that the gas and liquid outlets are in physical equilibrium.
.
Distillation The distillation of the liquid stream from the gas liquid separator was modeled by one distillation column in the small-scale plants, while two distillation columns were used in the large-scale plants. The first column was for removal of absorbed gasses, and the second column for water and methanol removal. The purity of the produced DME in the large-scale plants was set to 99.9 mole% (~chemical grade, see Appendix Y). Only absorbed gasses were removed in the small-scale plants because it was considered infeasible, at such small-scale, to upgrade the liquid products to the required purity. Instead further processing is assumed to take place at a central plant. As written in Appendix Y: fuel grade methanol (for blending with gasoline) requires a water content of max 500 ppm. The requirements for fuel grade DME (to be used in vehicles) may be even stricter, but this is uncertain (Appendix Y). In Appendix BB, all parameters set in the modeling of the distillation are given.
36 This temperature was not set in the large-scale DME plant using recycle synthesis, but instead determined by optimization (see above Figure 4.7). 37 A COP of 1.2 should be achievable by a plant based on cascade cooling with CO2 in the bottom cycle (cold) and ammonia in the top cycle (warm). The cooling need was at -50°C.
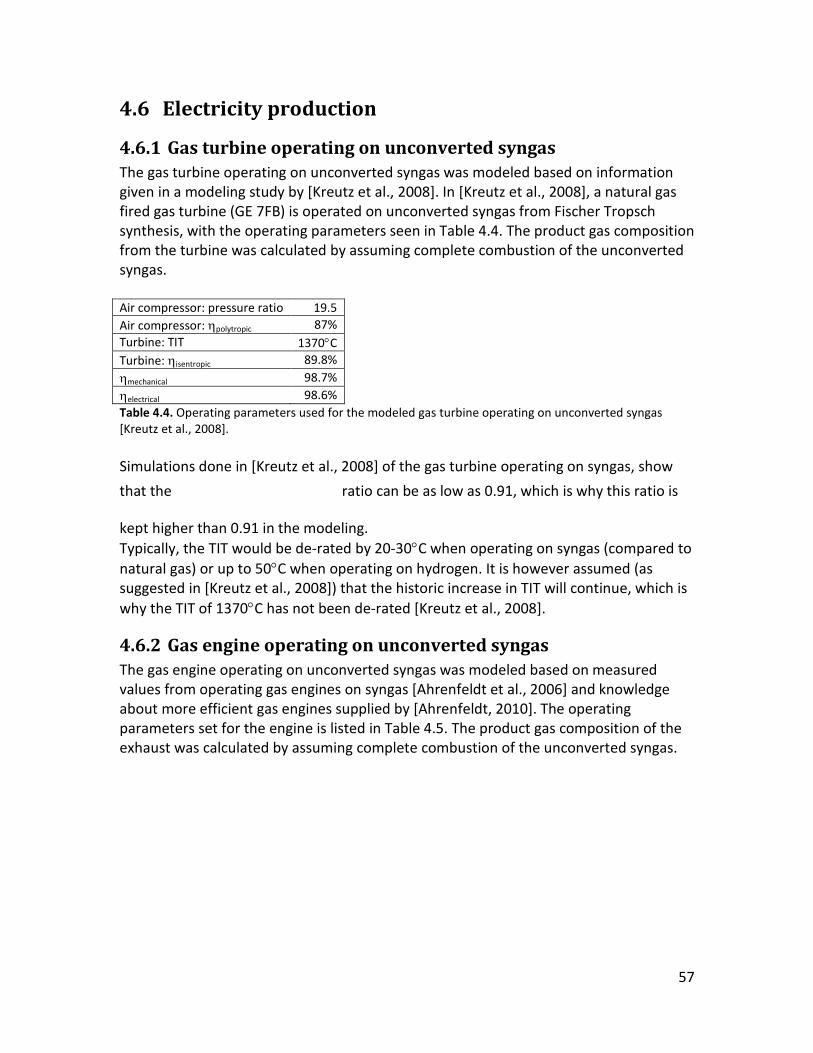
57
4.6 Electricity production
4.6.1 Gas turbine operating on unconverted syngas The gas turbine operating on unconverted syngas was modeled based on information given in a modeling study by [Kreutz et al., 2008]. In [Kreutz et al., 2008], a natural gas fired gas turbine (GE 7FB) is operated on unconverted syngas from Fischer Tropsch synthesis, with the operating parameters seen in Table 4.4. The product gas composition from the turbine was calculated by assuming complete combustion of the unconverted syngas. Air compressor: pressure ratio 19.5 Air compressor: ηpolytropic 87% Turbine: TIT 1370°C Turbine: ηisentropic 89.8% ηmechanical 98.7% ηelectrical 98.6% Table 4.4. Operating parameters used for the modeled gas turbine operating on unconverted syngas [Kreutz et al., 2008]. Simulations done in [Kreutz et al., 2008] of the gas turbine operating on syngas, show
that the ratio can be as low as 0.91, which is why this ratio is
kept higher than 0.91 in the modeling. Typically, the TIT would be de-rated by 20-30°C when operating on syngas (compared to natural gas) or up to 50°C when operating on hydrogen. It is however assumed (as suggested in [Kreutz et al., 2008]) that the historic increase in TIT will continue, which is why the TIT of 1370°C has not been de-rated [Kreutz et al., 2008].
4.6.2 Gas engine operating on unconverted syngas The gas engine operating on unconverted syngas was modeled based on measured values from operating gas engines on syngas [Ahrenfeldt et al., 2006] and knowledge about more efficient gas engines supplied by [Ahrenfeldt, 2010]. The operating parameters set for the engine is listed in Table 4.5. The product gas composition of the exhaust was calculated by assuming complete combustion of the unconverted syngas.
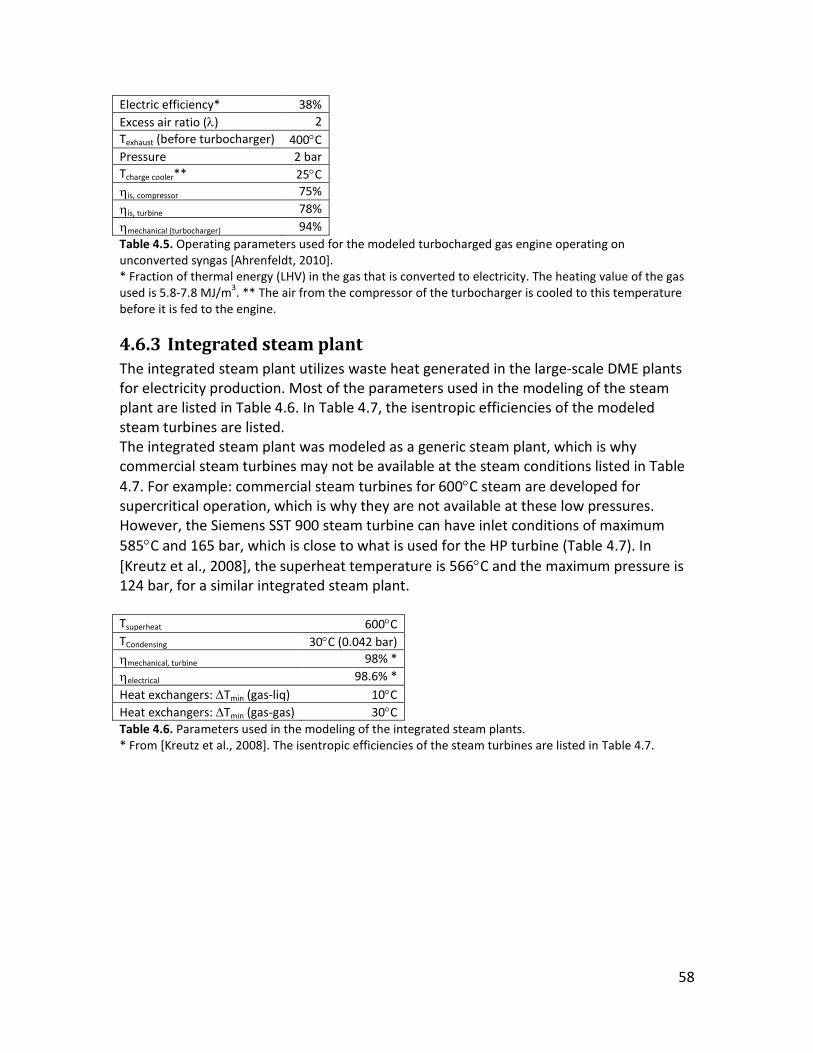
58
Electric efficiency* 38% Excess air ratio (λ) 2 Texhaust (before turbocharger) 400°C Pressure 2 bar Tcharge cooler** 25°C ηis, compressor 75% ηis, turbine 78% ηmechanical (turbocharger) 94% Table 4.5. Operating parameters used for the modeled turbocharged gas engine operating on unconverted syngas [Ahrenfeldt, 2010]. * Fraction of thermal energy (LHV) in the gas that is converted to electricity. The heating value of the gas used is 5.8-7.8 MJ/m3. ** The air from the compressor of the turbocharger is cooled to this temperature before it is fed to the engine.
4.6.3 Integrated steam plant The integrated steam plant utilizes waste heat generated in the large-scale DME plants for electricity production. Most of the parameters used in the modeling of the steam plant are listed in Table 4.6. In Table 4.7, the isentropic efficiencies of the modeled steam turbines are listed. The integrated steam plant was modeled as a generic steam plant, which is why commercial steam turbines may not be available at the steam conditions listed in Table 4.7. For example: commercial steam turbines for 600°C steam are developed for supercritical operation, which is why they are not available at these low pressures. However, the Siemens SST 900 steam turbine can have inlet conditions of maximum 585°C and 165 bar, which is close to what is used for the HP turbine (Table 4.7). In [Kreutz et al., 2008], the superheat temperature is 566°C and the maximum pressure is 124 bar, for a similar integrated steam plant. Tsuperheat 600°C TCondensing 30°C (0.042 bar) ηmechanical, turbine 98% * ηelectrical 98.6% * Heat exchangers: ∆Tmin (gas-liq) 10°C Heat exchangers: ∆Tmin (gas-gas) 30°C Table 4.6. Parameters used in the modeling of the integrated steam plants. * From [Kreutz et al., 2008]. The isentropic efficiencies of the steam turbines are listed in Table 4.7.

59
Large-scale DME plant using recycle synthesis (DME-RC)
Large-scale DME plant using once-through synthesis (DME-OT)
HP - 82% (180 bar, 600°C) IP1: 86% (55 bar, 600°C) 85% (55 bar, 600°C) IP2: 88% (9 bar, 600°C) 89% (16 bar, 600°C) LP 89% (2.0 bar, 383°C.
Outlet: vapor fraction = 1.00) 88% (2.0 bar, 311°C.
Outlet: vapor fraction = 0.97) Table 4.7. Isentropic efficiencies of the steam turbines used in the modeling of the integrated steam plants. The steam conditions are written in brackets. The isentropic efficiencies were estimated based on steam turbines modeled in [Kreutz et al., 2008].
4.7 Modeling tools
4.7.1 Aspen Plus Aspen Plus is a component based thermodynamic modeling and simulation tool. The software is commercial and developed by the company AspenTech. The program has a graphical user interface with a number of built-in components, and the capability of adding user-defined components. Thermodynamic data of gasses, liquids and some solids are built-in. Aspen Plus excels at modeling of chemical process plants, but its library of unit operations also enables detailed modeling and simulation of power plants. The ability to estimate physical properties of gas-liquid mixtures was particularly helpful in the plant design and simulation effort, especially in unit operations containing distillation columns and condensing liquid fuel reactor product streams that need to account for the solubility of gasses such as CO2. Aspen Plus has two built-in solvers – a sequential solver and a simultaneous solver (EO). The sequential solver was used primarily for generating start guesses for the simultaneous solver. The simultaneous EO solver was employed due to improved convergence and robustness of the process flow sheet, especially where recycle streams play a prominent role in the plant configuration. Because Aspen Plus does not support the use of EO mode when solids are present, the gasification of biomass was modeled in DNA. The version of Aspen plus used in the modeling was 7.1. The equation of state used was Peng-Robinson equation of state with Boston-Mathias modifications (PR-BM), except for the distillation part which was modeled with Schwartzentruber-Renon equation of state (for highly non-ideal systems).
4.7.2 DNA DNA (Dynamic Network Analysis) is also a component based thermodynamic modeling and simulation tool. The program is developed at the section of Thermal Energy Systems at DTU, and is open source [Elmegaard et al., 2005] [DNA, 2010]. The program is based on compiled FORTRAN code, and the user interface is text based through an editor such as Emacs. The program has a number of built-in components and the capability of adding user-defined components. Thermodynamic data of some ideal gasses, fluids and

60
solids are built-in. The program was used for the gasifier model because the solid capabilities of DNA are superior to Aspen Plus.
4.8 Endnote on modeling of synthesis plants Modeling of synthesis plants is different from modeling of other energy plants, such as steam plants, due to the linear design of a synthesis plant (Figure 4.1), and greater physical restrictions on many of the design parameters (e.g. synthesis temperature). This limits the number of free parameters, which can be optimized in the design phase. This modeling chapter also clearly shows that most of the components used for modeling the synthesis plants are based on actual components (e.g. commercially available components) instead of generic components. This means that most of the design parameters are limited to a specific value or range, and this also limits the number of free parameters, which can be optimized in the design phase. It is mainly the integrated steam plants and the Rectisol plant, that are designed based on optimization considerations.

61
5. Large-scale DME production plants The overall design of the investigated large-scale DME plant was presented in section 3.1 – and in chapter 4, it was explained how the different processes in the plant were modeled. If the overall design is combined with the individual process models, an overall plant model can be generated. The overall plant model - or flow sheet - for the large-scale DME plant can be seen in Figure 5.1.
Figure 5.1. Simplified flow sheet of a DME plant model using recycle (RC) synthesis. The CO2 captured in the gas conditioning is vented to the atmosphere. The values given are typical values used in the modeling. The plant in Figure 5.1 uses recycle synthesis to increase the conversion of syngas to DME. Another option is to use once-through synthesis, which means that the
Air separation
unit
Fly ash
Milling
N2
Air
Torrefiedwood pellets
WGSreactor
AGR (Rectisol)
DME reactorGas-liquid separator
CO2
Feeding & Pressurization
Off-gas boiler
Air
DME
Water
Flue gas~CO2
Water
CO2
Slag
Entrained flow gasifier
45 bar1300 C
Steam
Steam
O2
Methanol
CO2
30 C
280 C -37 C
H2/CO = 0.6
H2/CO = 1 ~H2, CO, CO2 ~H2, CO
95% recycle~H2, CO, CO2
900 C

62
unconverted syngas is not recycled to increase the DME production, but instead used for electricity production – typically in a gas turbine. In Figure 5.2, a once-through DME plant is presented.
Figure 5.2. Simplified flow sheet of a DME plant model using once-through (OT) synthesis. The CO2 captured in the gas conditioning is vented to the atmosphere. The values given are typical values used in the modeling. Note: the gas from the topping column is not sent to the gas turbine because the heating value of the gas is extremely low – this could however be done. Once-through synthesis is especially attractive if the syngas contains high amounts of inerts (e.g. CH4 or N2) because these inerts would build up in the synthesis loop if recycled. The inert content in a gas from an oxygen blown entrained flow gasifier is, however, low. The plants shown in Figure 5.1 and Figure 5.2 captures CO2 in the conditioning of the syngas, and this pure CO2 stream is emitted to the surroundings. Even though CO2
Air separation
unit
Fly ash
Milling
N2
Air
Torrefiedbiomass pellets
WGSreactor
AGR (Rectisol)
DME reactorGas-liquid separator
CO2
Feeding & Pressurization
Gas turbine20 bar
Air
DME
Water
Flue gas~CO2
Water
CO2
Slag
Entrained flow gasifier
45 bar1300 C
Steam
Steam
O2
methanol
CO2
280 C -30 C
30 C
H2/CO = 0.6
H2/CO = 1 ~H2, CO, CO2 ~H2, CO
~H2, CO, CO2

63
emissions generated from sustainable biomass is not considered a problem with regards to climate change (the green house effect), this pure CO2 stream could, at relatively low cost, be compressed to high pressure and sent to underground storage (costs are given in section 5.3). The DME plants seen in Figure 5.1 and Figure 5.2 have another substantial CO2 emission, besides the one from the conditioning. This is the emission created by the gas stream from the topping column (in the distillation area). Because this gas from the topping column is almost pure CO2, and because the topping column operates at elevated pressure, it is not costly to compress the gas, and recycle it to the gas conditioning (AGR plant), where it can be captured and stored. Recycling the gas from the topping column, when also using recycle synthesis, is only possible if the syngas generated by the gasifier has a very low content of inerts. Fortunately, this is the case for the entrained flow gasifier (discussed further in section 5.2.4). In Figure 5.3 and Figure 5.4, the flow sheets for DME plants with minimized CO2 emissions can be seen. In the figure captions, the differences between these plants and the reference plants (Figure 5.1 and Figure 5.2) are described.

64
Figure 5.3. Simplified flow sheet of a DME plant model using recycle (RC) synthesis. The CO2 captured in the gas conditioning is compressed and sent to underground storage. The values given are the values used in the modeling. Differences compared to Figure 5.1: The gas from the topping column is recycled to the AGR instead of being sent to the off-gas boiler.
Air separation
unit
Fly ash
Milling
N2
Air
Torrefiedwood pellets
WGSreactor
AGR (Rectisol)
DME reactorGas-liquid separator
CO2
Feeding & Pressurization
Off-gas boiler
Air
DME
Water
Flue gas~CO2
Water
CO2 (H2S)
Slag
Entrained flow gasifier
45 bar1300 C
Steam
Steam
O2
methanol
CO2
150 bar
280 C -37 C
30 C
H2/CO = 0.6
H2/CO = 1 ~H2, CO, CO2 ~H2, CO
95% recycle~H2, CO, CO2
900 C

65
Figure 5.4. Simplified flow sheet of a DME plant model using once-through (OT) synthesis. The CO2 captured in the gas conditioning is compressed and sent to underground storage. The values given are the values used in the modeling. Differences compared to Figure 5.2: 1. The gas from the topping column is recycled to the AGR. 2. The H2/CO ratio after gas conditioning is set to 1.6 to lower the CO2 emission from the gas turbine (a higher H2/CO ratio increase the CO conversion in the DME reactor and therefore lowers the amount of CO sent to the gas turbine). 3. The methanol side stream in the distillation is sent to a dehydration reactor, instead of being recycled back to the DME reactor, because the higher H2/CO ratio after gas conditioning increases the methanol production in the DME reactor. Using a dehydration reactor, when the H2/CO ratio of the syngas after conditioning is 1, is not considered feasible.
Air separation
unit
Fly ash
Milling
N2
Air
Torrefiedbiomass pellets
WGSreactor
AGR (Rectisol)
DME reactorGas-liquid separator
CO2
Feeding & Pressurization
Gas turbine20 bar
Air
DME
Water
Flue gas~CO2
Water
CO2 (H2S)
Slag
Entrained flow gasifier
45 bar1300 C
Steam
Steam
O2
methanol
CO2
150 bar
280 C -50 C
30 C
H2/CO = 0.6
H2/CO = 1.6 ~H2, CO, CO2 ~H2, CO
~H2
900 C
MeOH dehydration
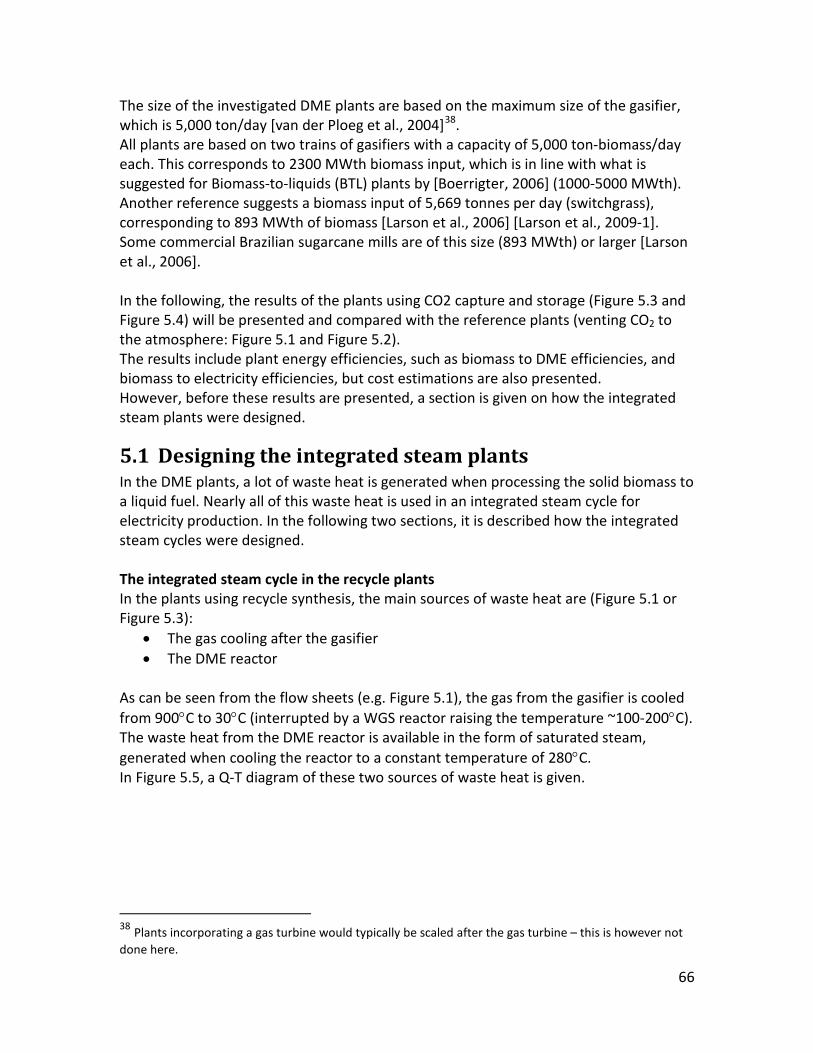
66
The size of the investigated DME plants are based on the maximum size of the gasifier, which is 5,000 ton/day [van der Ploeg et al., 2004]38
All plants are based on two trains of gasifiers with a capacity of 5,000 ton-biomass/day each. This corresponds to 2300 MWth biomass input, which is in line with what is suggested for Biomass-to-liquids (BTL) plants by [Boerrigter, 2006] (1000-5000 MWth). Another reference suggests a biomass input of 5,669 tonnes per day (switchgrass), corresponding to 893 MWth of biomass [Larson et al., 2006] [Larson et al., 2009-1]. Some commercial Brazilian sugarcane mills are of this size (893 MWth) or larger [Larson et al., 2006].
.
In the following, the results of the plants using CO2 capture and storage (Figure 5.3 and Figure 5.4) will be presented and compared with the reference plants (venting CO2 to the atmosphere: Figure 5.1 and Figure 5.2). The results include plant energy efficiencies, such as biomass to DME efficiencies, and biomass to electricity efficiencies, but cost estimations are also presented. However, before these results are presented, a section is given on how the integrated steam plants were designed.
5.1 Designing the integrated steam plants In the DME plants, a lot of waste heat is generated when processing the solid biomass to a liquid fuel. Nearly all of this waste heat is used in an integrated steam cycle for electricity production. In the following two sections, it is described how the integrated steam cycles were designed. The integrated steam cycle in the recycle plants In the plants using recycle synthesis, the main sources of waste heat are (Figure 5.1 or Figure 5.3):
• The gas cooling after the gasifier • The DME reactor
As can be seen from the flow sheets (e.g. Figure 5.1), the gas from the gasifier is cooled from 900°C to 30°C (interrupted by a WGS reactor raising the temperature ~100-200°C). The waste heat from the DME reactor is available in the form of saturated steam, generated when cooling the reactor to a constant temperature of 280°C. In Figure 5.5, a Q-T diagram of these two sources of waste heat is given.
38 Plants incorporating a gas turbine would typically be scaled after the gas turbine – this is however not done here.

67
Figure 5.5. Q-T diagram of the main sources of waste in the recycle plants (Figure 5.1 and Figure 5.3). The increase in temperature in the “gas cooler” is due to the WGS reactor (see e.g. Figure 5.1). The bend in the line for the gas cooler at low temperature, is due to condensation of water. The figure is made to scale (the lines are placed at the actual temperatures with correct length). The obvious way of utilizing the waste heats shown in Figure 5.5 in a steam plant, would be to use the waste heat from the DME reactor for steam generation, since the waste heat is available at a constant temperature, and the heat from the gas cooler for water preheating and for steam superheating. If this is done with a simple steam cycle, the Q-T diagram would look like this (Figure 5.6):
T [C]
900
30
DME reactor (282 MWth at 280 C)
Gas cooler(453 MWth)
Q [MWth]453 735

68
Figure 5.6. Q-T diagram of a simple steam cycle based on using the waste heats shown in Figure 5.5. Note: a conventional Q-T diagram would balance heat release and heat consumption. This is not done here because it would greatly complicate the diagram, with no (or limited) benefit for the reader. From Figure 5.6, it can be seen that ~138 MWth of heat is still available from the gas cooler. It was decided to use some of this heat for a steam reheat. It should however be noted that the steam generated by the DME reactor is only at 55 bar (saturation pressure at 270 C), which is why a reheat is at a relatively low pressure (~9 bar). The residual waste heat available, after adding the steam reheat, was utilized by using a small part of the waste heat from the gas cooler for steam generation (evaporation of water). By adjusting how much of the waste heat from the gas cooler that is used for steam generation, the steam plant could utilize all the available waste heat from the gas cooler. The final design of the integrated steam plant is presented in Figure 5.11. The integrated steam cycle in the once-through plants In the plants using once-through synthesis, the main sources of waste heat are (Figure 5.2 or Figure 5.4):
• The gas cooling after the gasifier • The DME reactor • Gas turbine exhaust
The only difference compared to the plants using recycle synthesis is therefore the waste heat available in the gas turbine exhaust. In Figure 5.7, a Q-T diagram of these three sources of waste heat is given.
900
Q [MWth]270 552
30
138
600
DME reactor (282 MWth at 280 C)
Gas cooler
616 735
Gas cooler
T [C]

69
Figure 5.7. Q-T diagram of the main sources of waste in the once-through plants (Figure 5.2 and Figure 5.4). The values are only valid for Figure 5.4: extra water gas shift). When comparing Figure 5.7 with Figure 5.5, it can be seen that the amount of waste heat from the DME reactor is reduced (less DME is produced in the once-through plant). Because of this, the waste heat from the gas turbine exhaust will be sufficient for preheating the water to the DME reactor and superheating the steam from the reactor. The waste heat from the gas cooler can therefore be used for generating steam at a higher pressure than the 55 bar generated in the DME reactor. It was decided to generate steam at the highest pressure allowed by the gas cooler. According to [van der Ploeg et al., 2004], this is 180 bar for the gas cooler used with the Shell gasifier. In Figure 5.8, a Q-T diagram for such a steam plant can be seen (simple cycles at both 55 bar and 180 bar).
900
DME reactor (202 MWth at 280 C)
Gas cooler(476 MWth)
Q [MWth]476 678
Gas turbine exhaust(252 MWth)
930
30
600
T [C]

70
Figure 5.8. Q-T diagram of two simple steam cycles based on using the waste heats shown in Figure 5.7. Superheated steam at 180 bar is generated in the gas cooler, while superheated steam at 55 bar is generated by the gas turbine exhaust + DME reactor. The evaporator for steam at 180 bar has been split into two evaporators (Figure 5.8) because it is necessary to cool the gas to 200-300°C before it enters the WGS reactor (the operating temperature of the WGS reactor is 200- 500°C, but a temperature increase of ~200°C occurs in the WGS reactor). Figure 5.8 shows that there is residual waste heat available to add a reheat of steam to the gas cooler. It was actually also possible to add a reheat of steam based on heat from the gas turbine exhaust. The final design of the integrated steam plant is presented in Figure 5.12.
5.2 Process simulation results The thermodynamic results from the plant simulations are presented in the following. The results from the DME plants using CO2 capture and storage will be presented first, and then compared in section 5.2.6.1 with the reference DME plants (venting CO2 to the atmosphere: Figure 5.1 and Figure 5.2). In Figure 5.9 and Figure 5.10, the flow sheets for the DME plants using CO2 capture and storage are shown with stream data (temperature, pressure, mass flow). The figures show the heat integration within the plants, and the process electricity consumptions. In Table 5.1 and Table 5.2, corresponding stream compositions are given. DME synthesis pressures The DME synthesis pressures were determined differently for the two DME plants. In the RC plant, the synthesis pressure and the temperature before the gas-liquid separator were optimized based on minimizing the combined electricity consumption of the syngas compressor and the cooling plant. The values resulting in the lowest power consumption were 56 bar and -37°C.
DME reactor (202 MWth at 280 C)
Gas cooler(476 MWth)
Q [MWth]476
Gas turbine exhaust
930
30
600
T [C]
Gas turbine exhaust
900
Steam at 55 barSteam at 180 bar

71
In the OT plant, the synthesis pressure was determined by the integrated steam cycle because a certain amount of hot exhaust from the gas turbine was needed to achieve the design of the integrated steam plant presented in section 5.2.2.2 (an increase in pressure results in a higher syngas conversion, which hence results in less unconverted syngas to the gas turbine). The pressure was determined to be 53 bar.
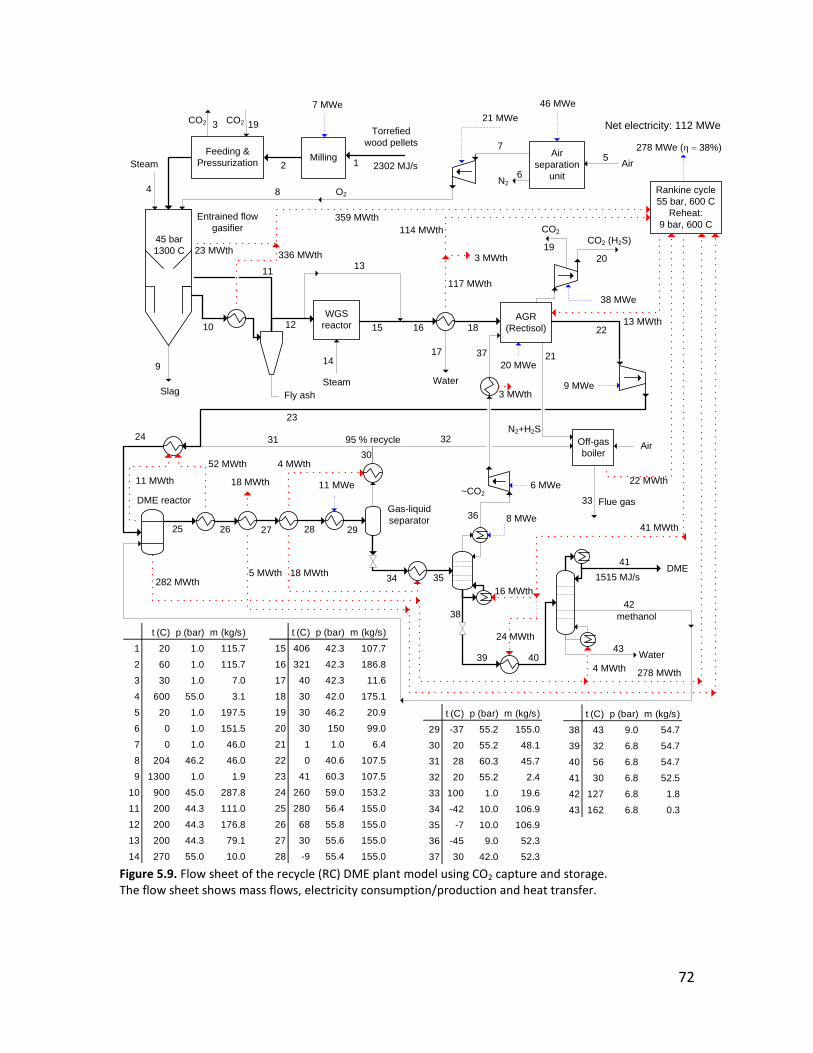
72
Figure 5.9. Flow sheet of the recycle (RC) DME plant model using CO2 capture and storage. The flow sheet shows mass flows, electricity consumption/production and heat transfer.
Air separation
unit
Fly ash
Milling
N2
Air
Torrefiedwood pellets
WGSreactor
AGR (Rectisol)12 18
DME reactorGas-liquid separator
29
CO2
Feeding & Pressurization
7 MWe
Off-gas boiler
Air
DME
Water
95 % recycle
Flue gas
N2+H2S
25
1
31
4 8
3
~CO2
23
Water
17
42
Rankine cycle55 bar, 600 C
Reheat: 9 bar, 600 C
336 MWth
22 MWth
117 MWth
278 MWe (η = 38%)
282 MWth 1515 MJ/s
CO2 (H2S)
20
46 MWe
38 MWe
7
21 MWe
9 MWe
5 MWth
Slag
9 20 MWe
10
11
Entrained flow gasifier
45 bar1300 C
Steam
41
8 MWe
13
Steam
14
CO2
27
O2
methanol
4 MWth
18 MWth
26
11 MWe11 MWth
52 MWth
4043
278 MWth4 MWth
34 35
39
30
24 MWth
6 MWe
28
24
41 MWth
16 MWth
15 16
18 MWth
36
37
32
1923 MWth
359 MWth
3 MWth
3 MWth
114 MWth
25
6
21
22
33
38
t (C) p (bar) m (kg/s)
1 20 1.0 115.7
2 60 1.0 115.7
3 30 1.0 7.0
4 600 55.0 3.1
5 20 1.0 197.5
6 0 1.0 151.5
7 0 1.0 46.0
8 204 46.2 46.0
9 1300 1.0 1.9
10 900 45.0 287.8
11 200 44.3 111.0
12 200 44.3 176.8
13 200 44.3 79.1
14 270 55.0 10.0
t (C) p (bar) m (kg/s)
15 406 42.3 107.7
16 321 42.3 186.8
17 40 42.3 11.6
18 30 42.0 175.1
19 30 46.2 20.9
20 30 150 99.0
21 1 1.0 6.4
22 0 40.6 107.5
23 41 60.3 107.5
24 260 59.0 153.2
25 280 56.4 155.0
26 68 55.8 155.0
27 30 55.6 155.0
28 -9 55.4 155.0
t (C) p (bar) m (kg/s)
29 -37 55.2 155.0
30 20 55.2 48.1
31 28 60.3 45.7
32 20 55.2 2.4
33 100 1.0 19.6
34 -42 10.0 106.9
35 -7 10.0 106.9
36 -45 9.0 52.3
37 30 42.0 52.3
t (C) p (bar) m (kg/s)
38 43 9.0 54.7
39 32 6.8 54.7
40 56 6.8 54.7
41 30 6.8 52.5
42 127 6.8 1.8
43 162 6.8 0.3
Net electricity: 112 MWe
2302 MJ/s
13 MWth
CO2 19

73
Gasifier exit
WGS outlet
AGR inlet
AGR outlet
Reactor inlet
Reactor outlet
Recycle gas
To distil-lation
Recycle CO2
DME
Stream number
12 15 18+37 22 24+42 25 31 34* 37 41*
Mass flow (kg/s)
176.8 107.9 227.4 107.5 155.0 155.0 45.7 106.9 52.3 52.6
Mole flow (kmole/s)
8.66 5.35 9.81 7.08 9.24 4.67 2.10 2.46 1.24 1.14
Mole frac (%)
H2 29.1 44.0 35.7 49.4 45.5 16.2 33.7 0.57 1.1 0.00 CO 50.9 27.7 35.7 49.4 45.5 17.0 33.6 2.2 4.3 0.00 CO2 7.4 24.6 27.7 0.10 3.0 30.0 12.8 45.4 90.0 0.00 H2O 12.3 3.4 0.12 0.00 0.09 0.56 0.00 1.1 0.00 0.10 CH4 0.04 0.03 0.25 0.35 0.93 1.8 2.9 0.86 1.7 0.00 H2S 0.03 0.02 0.02 0.00 0.00 0.00 0.00 0.00 0.00 0.00 N2 0.14 0.12 0.28 0.39 2.8 5.4 10.8 0.65 1.3 0.00 Ar 0.07 0.06 0.25 0.34 1.5 2.9 5.2 0.75 1.5 0.00 CH3OH - - 0.00 0.00 0.55 1.1 0.00 2.1 0.00 0.00 CH3OCH3 - - 0.01 0.00 0.25 25.0 1.1 46.4 0.09 99.9 Table 5.1. Stream compositions for the recycle (RC) DME plant model using CO2 capture and storage. Stream numbers refer to Figure 5.9. * Liquid Gasifier
exit WGS
outlet AGR inlet
Reactor inlet
Reactor outlet
Gas to gas
turbine
Recycle CO2
Metha-nol
Dehyd. metha-
nol
DME
Stream number
12 14 16+34 22 23 28 34 39 40 38*
Mass flow (kg/s)
176.8 200.8 223.8 92.4 92.4 17.2 33.6 4.5 4.5 38.7
Mole flow (kmole/s)
8.66 9.83 10.02 7.08 3.73 1.98 0.77 0.16 0.16 0.83
Mole frac (%)
H2 29.1 43.2 42.5 60.2 42.6 79.7 1.5 0.00 0.00 0.00 CO 50.9 26.2 25.8 36.5 6.3 11.5 1.1 0.00 0.00 0.00 CO2 7.4 24.3 31.3 3.0 23.8 7.3 97.1 0.00 0.00 0.01 H2O 12.3 6.0 0.12 0.00 3.1 0.00 0.00 29.6 56.9 0.09 CH4 0.04 0.03 0.04 0.06 0.11 0.16 0.10 0.00 0.00 0.00 H2S 0.03 0.02 0.02 0.00 0.00 0.00 0.00 0.00 0.00 0.00 N2 0.14 0.12 0.12 0.17 0.33 0.59 0.05 0.00 0.00 0.00 Ar 0.07 0.06 0.06 0.09 0.17 0.29 0.08 0.00 0.00 0.00 CH3OH - - 0.00 0.00 2.4 0.00 0.00 69.4 14.7 0.00 CH3OCH3 - - 0.01 0.00 21.2 0.45 0.11 1.0 28.4 99.9 Table 5.2. Stream compositions for the once-through (OT) DME plant model using CO2 capture and storage. Stream numbers refer to Figure 5.10. *Liquid

74
Figure 5.10. Flow sheet of the once-through (OT) DME plant model using CO2 capture and storage. The flow sheet shows mass flows, electricity consumption/production and heat transfer. Figure 5.9 shows that the RC DME plant using CO2 capture and storage produces 1515 MWth of DME from 2302 MWth of torrefied wood pellets, while Figure 5.10 shows that the OT plant only produces 1130 MWth of DME from the same biomass input. These
Air separation
unit
Fly ash
Milling
N2
Air
Torrefiedbiomass pellets
WGSreactor
AGR (Rectisol)12 16
DME reactorGas-liquid separator
23 27
CO2
Feeding & Pressurization
7 MWe
Gas turbine20 bar
Air
DME
Water
Flue gas
30
1
4 8
17
~CO2
21
Water
15
39
Rankine cycle180 bar, 600 C
1st Reheat: 55 bar, 600 C2nd Reheat:
16 bar, 600 C
315 MWth
252 MWth
173 MWth
354 MWe (η = 40%)
202 MWth
20 MWth
1130 MJ/s
CO2 (H2S)18
46 MWe
40 MWe
7
21 MWe
8 MWe
14 MWth
Slag
9 21 MWe
10
11
Entrained flow gasifier
45 bar1300 C
Steam
38
5 MWe
34
Steam
13
CO2
25
O2
methanol
4 MWth
14 MWth 31
24
37
10 MWe8 MWth
41 MWth
41
11 MWth
32
28
4 MWe
26
22
14
5 MWth
33
17
35
178 MWe
192 MWth
Meoh dehydration
40
20
12 MWth
N2+H2S
23 MWth
2 MWth
161 MWth
36
14 MWth
7 MWth
338 MWth
12 MWth
CO2 3
2 56
19
29
t (C) p (bar) m (kg/s)
15 61 42.0 10.6
16 30 42.0 190.2
17 30 46.2 20.9
18 30 150 110.4
19 1 1.0 5.6
20 0 40.6 92.4
21 34 56.5 92.4
22 260 55.2 92.4
23 280 52.6 92.4
24 79 52.0 92.4
25 30 51.8 92.4
26 -14 51.6 92.4
27 -50 51.4 92.4
28 20 27.7 17.2
t (C) p (bar) m (kg/s)
29 20 1.0 372.3
30 90 1.0 395.1
31 -50 10.0 75.3
32 -4 10.0 75.3
33 -43 9.0 33.6
34 30 42.0 33.6
35 48 9.0 46.2
t (C) p (bar) m (kg/s)
36 37 6.8 46.2
37 46 6.8 46.2
38 30 6.8 38.7
39 134 6.8 4.5
40 293 12.0 4.5
41 162 6.8 3.0
t (C) p (bar) m (kg/s)
1 20 1.0 115.7
2 60 1.0 115.7
3 30 1.0 7.0
4 600 55.0 3.1
5 20 1.0 197.5
6 0 1.0 151.5
7 0 1.0 46.0
8 204 46.2 46.0
9 1300 1.0 1.9
10 900 45.0 300.7
11 275 44.3 123.9
12 275 44.3 176.8
13 270 55.0 24.0
14 465 42.3 200.8
Net electricity: 369 MWe
2302 MJ/s

75
DME outputs correspond to energy efficiencies of 66% and 49% respectively (LHV). In section 5.2.3, these energy efficiencies will be discussed further. Figure 5.9 and Figure 5.10 also show the gross and net electricity production for the two plants, along with the process electricity consumptions. In section 5.2.2, details will be given on the design of the integrated steam plants, and on the process electricity consumptions. The plant design shown in Figure 5.9 and Figure 5.10 are more detailed than the ones shown in Figure 5.3 and Figure 5.4. The main differences concern the heat integration within the plant – especially in the synthesis and distillation area. In section 5.2.1, it is explained how the heat integration was designed. In Figure 5.9 and Figure 5.10, the total electricity and heat consumption of the Rectisol plants can be seen. The full flow sheet of the Rectisol plant is shown in paper III for the RC plant. A flow sheet of the Rectisol plant in the OT plant is not presented because it is very similar to the one for the RC plant.
5.2.1 Heat integration The design of the heat integration in the DME plants (Figure 5.9 and Figure 5.10) concern the following plant areas (the integrated steam plant is discussed in section 5.2.2):
1. A heat input to the Rectisol plant (used for heating the reboilers in the distillation of the methanol solvent)
2. Cooling the product gas from the DME reactor 3. Heating the reboilers in the distillation of DME 4. Heating the liquid feed to the DME column
For points 1 and 3, low pressure steam outtakes from the steam cycle are used (also see section 5.2.2), except for the reboiler for the DME column. For this reboiler, waste heat from the DME reactor is used because the temperature in the reboiler is 162°C, which is considered too high for using steam from the steam cycle. 2. Cooling the product gas from the DME reactor The product gas from the DME reactor is cooled by these methods (in this order):
1. Preheating the syngas to the DME reactor 2. Feed water preheating for the integrated steam cycle 3. Cooling water 4. Cold mass flows of gas and liquid available from the gas liquid separator 5. Refrigeration
1. Preheating the syngas to the DME reactor is done to ensure optimal utilization of the catalyst in the DME reactor (not using reactor space for heating the gas to operating temperature), and to increase the temperature of the available waste heat. If a preheat was not used, less steam would be generated by the DME reactor, but more heat would be available from cooling the product gas.

76
4. By using cold mass flows of gas and liquid, available from the gas liquid separator, the required duty of the refrigeration plant is lowered. 4. Heating the liquid feed to the DME column The liquid feed to the DME column is partly evaporated by low pressure steam from the integrated steam cycle. This is done to lower the duty of the reboiler in the DME column because the reboiler requires high temperature heat, while low temperature heat can be used when heating the feed to the DME column.
5.2.2 Coproduct electricity Besides the production of DME, electricity is coproduced in the DME plants. The produced electricity is used to cover the process electricity consumptions (section 5.2.2.3), and for export to the grid. In the RC plant, electricity is only produced by the integrated steam cycle, while in the OT plant; electricity is also produced by a gas turbine operating on unconverted syngas. As mentioned in the modeling chapter, the steam plant is modeled as a generic cycle, which is why the steam superheat temperature may be a bit higher than what is achieved in commercial plants. Especially the superheat temperature in the gas cooling may be overestimated because Shell writes in [van der Ploeg et al., 2004] that only a “mild superheat” can be achieved in the gas cooler. However, like the performance of the gas turbine is slightly overestimated to account for the continuous improvement of gas turbines – the performance of the steam cycle may be achievable in the near future.
5.2.2.1 Electricity production in the RC plant The concept behind the design of the integrated steam plant was presented in section 5.1. If this is compared with the flow sheet of the integrated steam plant (Figure 5.11), it can be seen that only minor details differ. These differences concern feedwater preheating, steam generation and steam outtakes (node numbers are supplied if relevant – these refer to Figure 5.11):
• Feedwater preheating: o A small amount of the heat generated by cooling the product gas from
the DME reactor is used for feedwater preheating (node 10). o The heat released by the off-gas boiler is used for feedwater preheating
(node 30). • Steam generation: a small amount of steam is generated in the gasifier
membrane walls (besides the steam generated by the DME reactor). • Steam outtakes:
o Some of the saturated steam generated by the evaporator is fed to the WGS reactor (node 16).
o Some of the superheated steam is fed to the gasifier (node 20). o Low pressure steam from the outlet of the IP2 turbine is used in the AGR
plant (node 25).
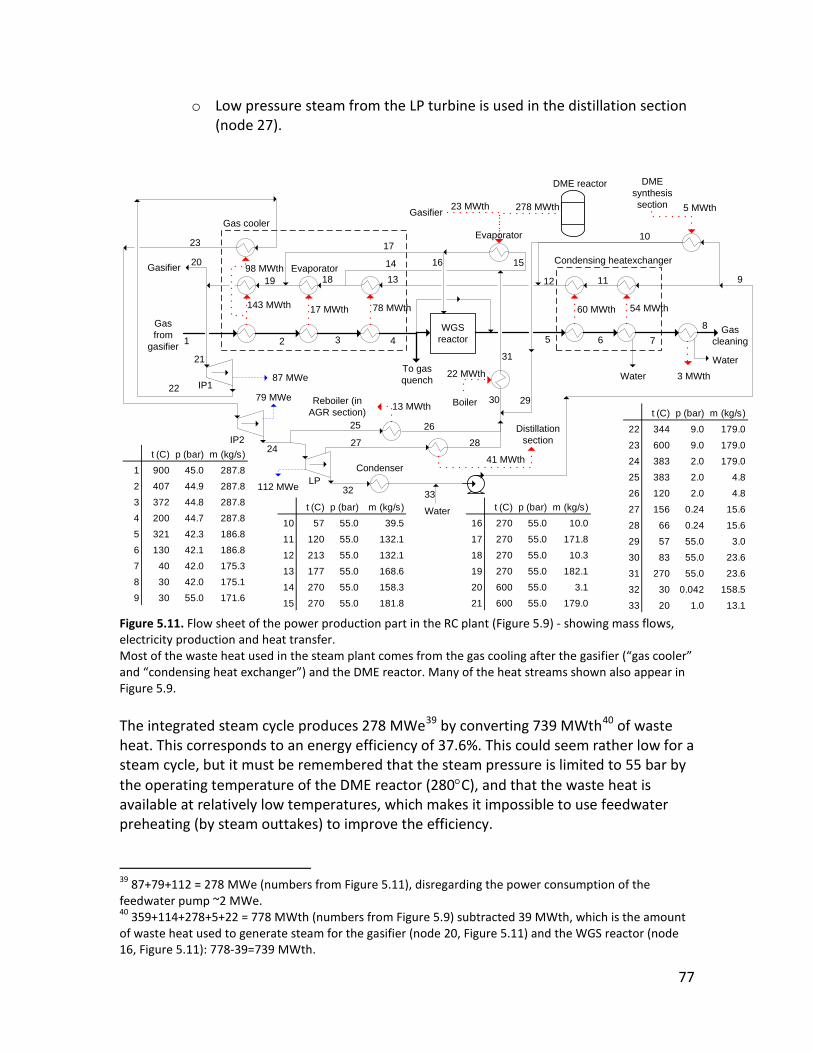
77
o Low pressure steam from the LP turbine is used in the distillation section (node 27).
Figure 5.11. Flow sheet of the power production part in the RC plant (Figure 5.9) - showing mass flows, electricity production and heat transfer. Most of the waste heat used in the steam plant comes from the gas cooling after the gasifier (“gas cooler” and “condensing heat exchanger”) and the DME reactor. Many of the heat streams shown also appear in Figure 5.9. The integrated steam cycle produces 278 MWe39 by converting 739 MWth40
of waste heat. This corresponds to an energy efficiency of 37.6%. This could seem rather low for a steam cycle, but it must be remembered that the steam pressure is limited to 55 bar by the operating temperature of the DME reactor (280°C), and that the waste heat is available at relatively low temperatures, which makes it impossible to use feedwater preheating (by steam outtakes) to improve the efficiency.
39 87+79+112 = 278 MWe (numbers from Figure 5.11), disregarding the power consumption of the feedwater pump ~2 MWe. 40 359+114+278+5+22 = 778 MWth (numbers from Figure 5.9) subtracted 39 MWth, which is the amount of waste heat used to generate steam for the gasifier (node 20, Figure 5.11) and the WGS reactor (node 16, Figure 5.11): 778-39=739 MWth.
IP187 MWe
143 MWth
98 MWth Evaporator
17 MWth
WGS reactor
Gas cooler
Condensing heatexchanger
78 MWth 60 MWth 54 MWth
3 MWthWater22 MWth
DME reactor
IP2
Condenser
Gas cleaning
To gas quench
Gas from
gasifier
Boiler
LP
Gasifier
Reboiler (in AGR section)
Distillation section
5 MWth
DME synthesis section
Gasifier 23 MWth
Evaporator
278 MWth
31
16
41 MWth
13 MWth
1 2 3 4 5
1314
17
6 78
9
10
11121819
20
23
21
22
24
25
27
32
30
15
t (C) p (bar) m (kg/s)
1 900 45.0 287.8
2 407 44.9 287.8
3 372 44.8 287.8
4 200 44.7 287.8
5 321 42.3 186.8
6 130 42.1 186.8
7 40 42.0 175.3
8 30 42.0 175.1
9 30 55.0 171.6
t (C) p (bar) m (kg/s)
10 57 55.0 39.5
11 120 55.0 132.1
12 213 55.0 132.1
13 177 55.0 168.6
14 270 55.0 158.3
15 270 55.0 181.8
t (C) p (bar) m (kg/s)
16 270 55.0 10.0
17 270 55.0 171.8
18 270 55.0 10.3
19 270 55.0 182.1
20 600 55.0 3.1
21 600 55.0 179.0
t (C) p (bar) m (kg/s)
22 344 9.0 179.0
23 600 9.0 179.0
24 383 2.0 179.0
25 383 2.0 4.8
26 120 2.0 4.8
27 156 0.24 15.6
28 66 0.24 15.6
29 57 55.0 3.0
30 83 55.0 23.6
31 270 55.0 23.6
32 30 0.042 158.5
33 20 1.0 13.1
Water
29
26
28
79 MWe
112 MWe
Water
33

78
5.2.2.2 Electricity production in the OT plant The concept behind the design of the integrated steam plant was presented in section 5.1. If this is compared with the flow sheet of the integrated steam plant (Figure 5.12), it can be seen that only minor details differ. Many of these differences were mentioned above for the RC plant, but other differences concern the steam reheat (node no. refer to Figure 5.12):
• The reheat of the HP steam generated in the gas cooler is done in the HRSG (with gas turbine exhaust, node 18-19). In this way all the superheating of 55 bar steam is done in the HRSG.
• The reheat of steam at 16 bar is done in the gas cooler (node 29-30). This steam mass flow is the sum of the steam produced in the gas cooler and the HRSG.

79
Figure 5.12. Flow sheet of the power production part in the OT plant (Figure 5.10) - showing mass flows, electricity production and heat transfer. Most of the waste heat used in the steam plant comes from the gas cooling after the gasifier (“gas cooler” and “condensing heat exchanger”), the DME reactor and the HRSG. Many of the heat streams shown also appear in Figure 5.10. The integrated steam cycle produces 354 MWe41 by converting 880 MWth42
41 34+75+123+122 = 354 MWe (numbers from
of waste heat. This corresponds to an energy efficiency of 40.2%, which is 2.6%-points higher
Figure 5.12), disregarding the power consumption of the feedwater pump ~3 MWe.
1716
HP 1834 MWe
99 MWth
85 MWth Evaporator
2
53 MWth
3 4 WGS reactor
5
12
Gas cooler
Condensing heatexchanger
11 10
6 7 8
30 Evaporator
13
79 MWth 34 MWth 85 MWth 42 MWth
9
14 MWth
Water
25
46 MWth
49 MWth
39
36 MWth
40
HRSG19
122 MWth
41
DME reactor
Evaporator
192 MWth
IP1
IP2
29
36Condenser
Gas cleaning
To gas quench
Gas from
gasifier
2620
Gas turbine exhaust
Stack
28
37
LP
33
Gasifier
Reboiler (in AGR section)
31
34
Distillation section
Gasifier23 MWth
12 MWth
35
21
32
20 MWth
12 MWth
1
Water
DME synthesis section
t (C) p (bar) m (kg/s)
1 900 45.0 300.7
2 542 44.9 300.7
3 437 44.8 300.7
4 275 44.7 300.7
5 465 42.3 200.8
6 367 42.2 200.8
7 124 42.1 200.8
8 63 42.0 191.1
9 30 42.0 190.2
10 30 180.0 112.2
11 114 180.0 112.2
t (C) p (bar) m (kg/s)
12 265 180.0 112.2
13 357 180.0 44.3
14 357 180.0 44.3
15 357 180.0 67.9
16 357 180.0 112.2
17 600 180.0 112.2
18 413 55.0 112.2
19 600 55.0 112.2
20 30 55.0 115.5
21 61 55.0 128.5
t (C) p (bar) m (kg/s)
22 270 55.0 128.5
23 270 55.0 24.0
24 270 55.0 104.5
25 413 55.0 104.5
26 600 55.0 104.5
27 600 55.0 3.1
28 600 55.0 213.6
29 418 16.0 213.6
30 600 16.0 213.6
31 311 2.0 4.7
t (C) p (bar) m (kg/s)
32 120 2.0 4.7
33 311 2.0 208.8
34 85 0.18 8.3
35 58 0.18 8.3
36 30 0.042 200.5
37 20 1.0 27.1
38 646 1.1 395.1
39 446 1.0 395.1
40 367 1.0 395.1
41 90 1.0 395.1
Water
15
14
2224
23
27
38
75 MWe
123 MWe
122 MWe

80
than the integrated steam plant used in the RC plant. This increase is due to the added HRSG, which makes it possible to use two steam pressure levels (180 bar and 55 bar) and double reheat (at 55 and 16 bar). Gas turbine In the OT plant, power is also produced by a gas turbine utilizing unconverted syngas from the DME reactor. The gas turbine produces 178 MWe (Figure 5.10) by converting 468 MWth of unconverted syngas. This corresponds to an energy efficiency of 38%. The energy efficiency of the combined cycle (gas turbine + HRSG) is difficult to determine precisely because the HRSG is integrated with a larger steam cycle. However, if the heat available in the gas turbine exhaust (252 MWth, Figure 5.10) is multiplied with the steam cycle efficiency (40.2%), the combined cycle energy efficiency becomes 59.6%43
5.2.2.3 On-site electricity consumptions
(LHV).
In Figure 5.9 and Figure 5.10 all process electricity consumptions are given, but in order to give a better overview of these consumptions, they are all listed in Figure 5.13.
42 338+161+192+14+252 = 957 MWth (numbers from Figure 5.10) subtracted 77 MWth, which is the amount of waste heat used to generate steam for the gasifier (node 27, Figure 5.12) and the WGS reactor (node 23, Figure 5.12): 957-77 = 880 MWth. 43 252 MWth * 40.2% = 101 MWe. 101 MWe + 178 MWe = 279 MWe (total electricity production). 279 MWe / 468 MWth = 59.6%.
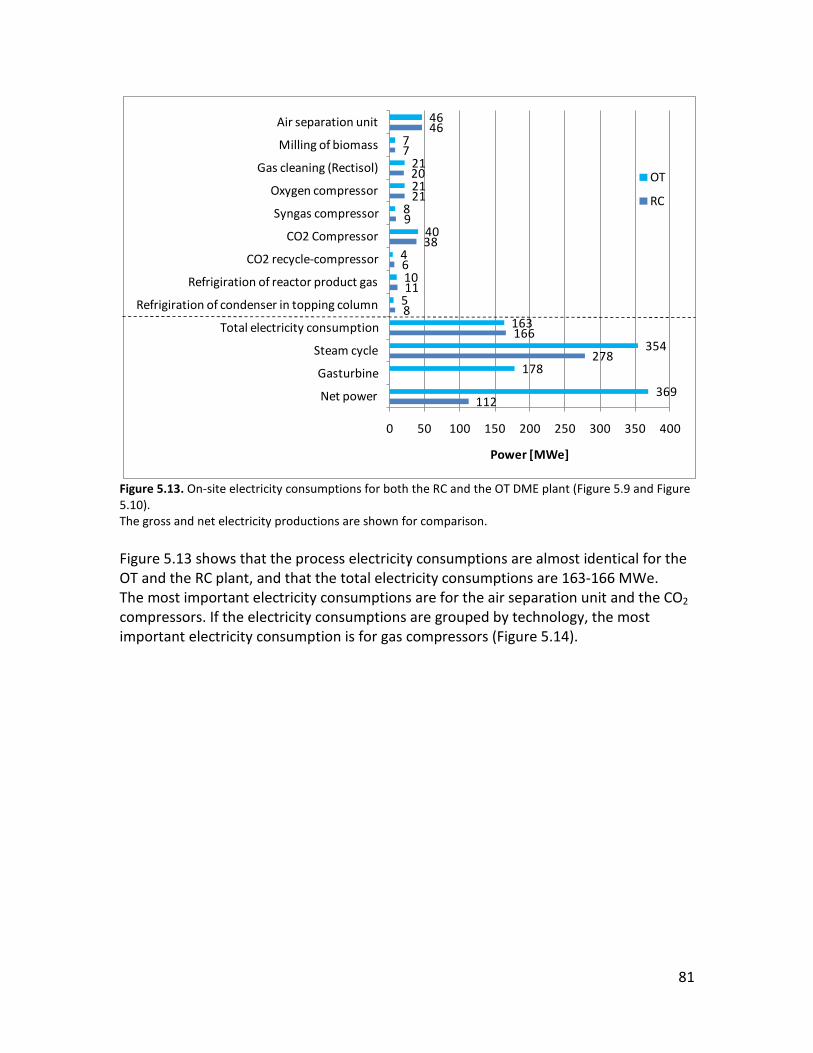
81
Figure 5.13. On-site electricity consumptions for both the RC and the OT DME plant (Figure 5.9 and Figure 5.10). The gross and net electricity productions are shown for comparison. Figure 5.13 shows that the process electricity consumptions are almost identical for the OT and the RC plant, and that the total electricity consumptions are 163-166 MWe. The most important electricity consumptions are for the air separation unit and the CO2 compressors. If the electricity consumptions are grouped by technology, the most important electricity consumption is for gas compressors (Figure 5.14).
112
278
166
8
11
6
38
9
21
20
7
46
369
178
354
163
5
10
4
40
8
21
21
7
46
0 50 100 150 200 250 300 350 400
Net power
Gasturbine
Steam cycle
Total electricity consumption
Refrigiration of condenser in topping column
Refrigiration of reactor product gas
CO2 recycle-compressor
CO2 Compressor
Syngas compressor
Oxygen compressor
Gas cleaning (Rectisol)
Milling of biomass
Air separation unit
Power [MWe]
OT
RC

82
Figure 5.14. On-site electricity consumptions grouped by technology for both the RC and the OT DME plant (Figure 5.9 and Figure 5.10). The gross (steam cycle + gas turbine) and net electricity production are shown for comparison.
5.2.3 Energy efficiencies The primary energy efficiency for a DME plant is the feedstock to DME efficiency, but because the waste heat generated in the plant is used for electricity co-production, the total energy efficiency also includes the biomass to net electricity efficiency. In Figure 5.15, the energy efficiencies for the two DME plants can be seen. The figure shows that the total energy efficiency for the RC plant is 71%, while the value is 64% for the OT plant. This means that the RC plant is more energy efficient than the OT plant. However, more chemical energy will always be lost when producing electricity compared with a liquid fuel, which is why the plants should be compared on the fuels effective efficiency (FEE) (defined in the caption of Figure 5.15). When doing this, the difference between the plants is minimal (73% vs. 72%). Figure 5.15 also shows the energy efficiencies when including the energy loss in the torrefaction of biomass. It can be seen that the total energy efficiencies then drop to 64% (RC) and 58% (OT).
112
278
166
19
74
20
7
46
369
178
354
163
15
73
21
7
46
0 50 100 150 200 250 300 350 400
Net power
Gasturbine
Steam cycle
Total electricity consumption
Refrigiration
Compressors
Gas cleaning (Rectisol)
Milling of biomass
Air separation unit
Power [MWe]
OT
RC

83
Figure 5.15. Energy efficiencies for the conversion of torrefied or untreated biomass to DME and electricity for the two plants (LHV). An energy efficiency of torrefaction of 90% is assumed. The numbers in parentheses are the fuels effective
efficiencies (FEE), defined as where the fraction corresponds to the amount
of biomass that would be used in a stand-alone BIGCC power plant with an efficiency of 50%, to produce the same amount of electricity [Larson et al., 2009-1]. In Appendix CC, the plant energy efficiencies are compared with the plant exergy efficiencies. The total energy efficiency of the plants could be increased if district heating was produced. This would however result in a small reduction in power production. District heating production was not included in the DME plants because this is typically not done in liquid fuels plants, and because the very large scale of the plants would require a large heating demand (~400-500 MWth).
5.2.3.1 Chemical energy flows To understand why the biomass to DME efficiencies shown in Figure 5.15 are achieved, it is necessary to look at the chemical energy flows in the plants (Figure 5.16)44
Figure 5.16.
shows how the chemical energy stored in the biomass is first converted to chemical energy in the syngas, and then to chemical energy stored in the DME. These conversions are associated with a certain loss of chemical energy, which is why there is a limit to how high the biomass to DME efficiencies can become. The chemical energy lost - or transformed - in the conversions, is released in the form of thermal energy. Chemical energy is lost in the following processes (Figure 5.16): torrefaction, gasification, water gas shift, DME synthesis. The loss of chemical energy in torrefaction and gasification can be minimized by optimizing the processes, but the loss of chemical energy in WGS and DME synthesis are determined by the reaction equations. In section 2.3.3, it was shown that the conversion of a syngas (with a H2/CO ratio of 1) to DME has a chemical energy efficiency of 84.3% - this can also be seen from Figure 5.16: RC plant: (71%-1%)*84.3% = 59%
44 Another possibility would have been to look at the chemical exergy flows, but because the plant efficiencies are based on LHV, the chemical energy flows are preferred because they directly shows how these efficiencies are achieved.
66%49% 59%
44%
5%16% 4%
14%
0%
20%
40%
60%
80%
100%E
ffic
ienc
y (L
HV
)
Net electricityDME
RC BM
RC To. BM
OTTo. BM
71%
OTBM
(62%)59%
(65%)64%
(72%)65%
(73%)
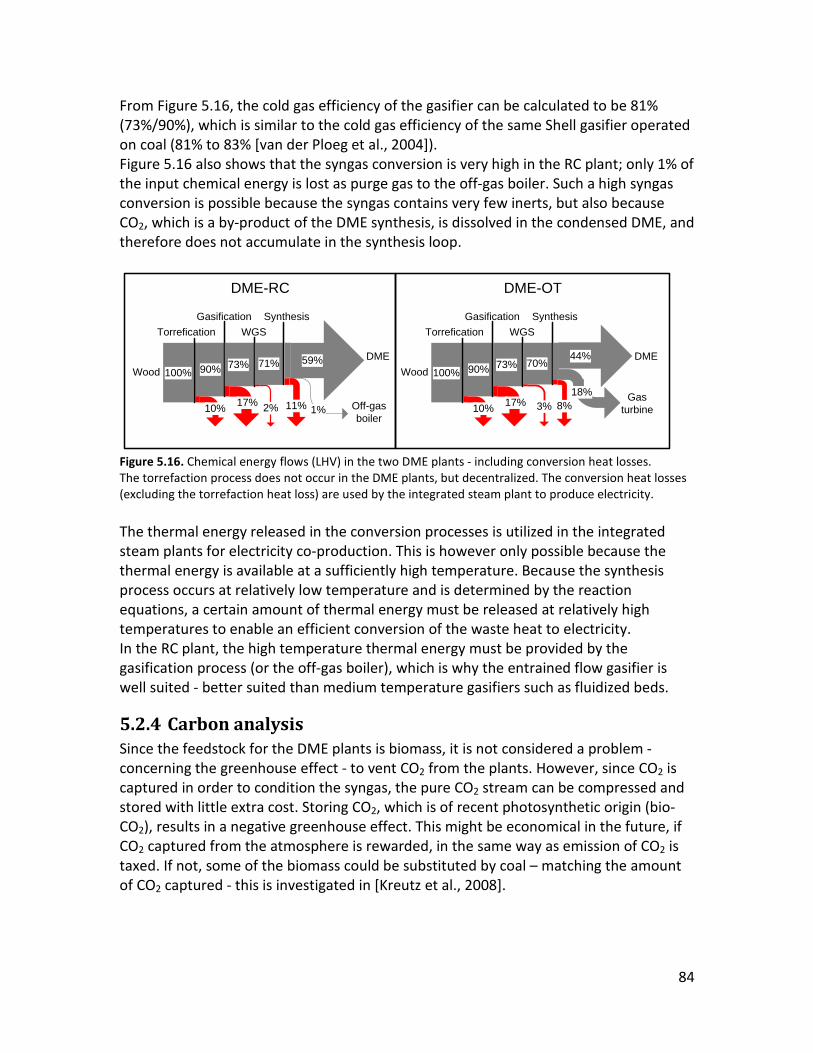
84
From Figure 5.16, the cold gas efficiency of the gasifier can be calculated to be 81% (73%/90%), which is similar to the cold gas efficiency of the same Shell gasifier operated on coal (81% to 83% [van der Ploeg et al., 2004]). Figure 5.16 also shows that the syngas conversion is very high in the RC plant; only 1% of the input chemical energy is lost as purge gas to the off-gas boiler. Such a high syngas conversion is possible because the syngas contains very few inerts, but also because CO2, which is a by-product of the DME synthesis, is dissolved in the condensed DME, and therefore does not accumulate in the synthesis loop.
Figure 5.16. Chemical energy flows (LHV) in the two DME plants - including conversion heat losses. The torrefaction process does not occur in the DME plants, but decentralized. The conversion heat losses (excluding the torrefaction heat loss) are used by the integrated steam plant to produce electricity. The thermal energy released in the conversion processes is utilized in the integrated steam plants for electricity co-production. This is however only possible because the thermal energy is available at a sufficiently high temperature. Because the synthesis process occurs at relatively low temperature and is determined by the reaction equations, a certain amount of thermal energy must be released at relatively high temperatures to enable an efficient conversion of the waste heat to electricity. In the RC plant, the high temperature thermal energy must be provided by the gasification process (or the off-gas boiler), which is why the entrained flow gasifier is well suited - better suited than medium temperature gasifiers such as fluidized beds.
5.2.4 Carbon analysis Since the feedstock for the DME plants is biomass, it is not considered a problem - concerning the greenhouse effect - to vent CO2 from the plants. However, since CO2 is captured in order to condition the syngas, the pure CO2 stream can be compressed and stored with little extra cost. Storing CO2, which is of recent photosynthetic origin (bio-CO2), results in a negative greenhouse effect. This might be economical in the future, if CO2 captured from the atmosphere is rewarded, in the same way as emission of CO2 is taxed. If not, some of the biomass could be substituted by coal – matching the amount of CO2 captured - this is investigated in [Kreutz et al., 2008].
44%100% 90%
DMEWood
DME-RC DME-OT
Torrefication
10%
Gasification
73%
WGS
70%
17%
Synthesis
18% Gas turbine8%3%
59%100% 90%
DMEWood
Torrefication
10%
Gasification
73%
WGS
71%
17%
Synthesis
1% Off-gas boiler
11%2%
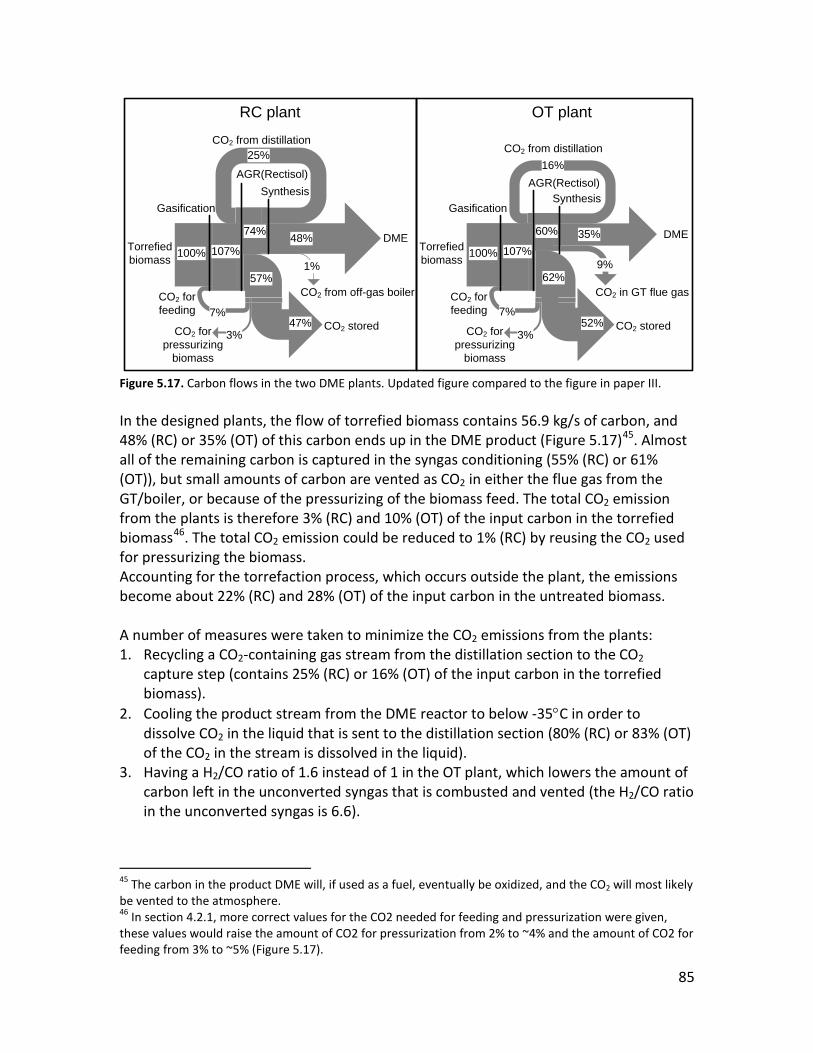
85
Figure 5.17. Carbon flows in the two DME plants. Updated figure compared to the figure in paper III. In the designed plants, the flow of torrefied biomass contains 56.9 kg/s of carbon, and 48% (RC) or 35% (OT) of this carbon ends up in the DME product (Figure 5.17)45. Almost all of the remaining carbon is captured in the syngas conditioning (55% (RC) or 61% (OT)), but small amounts of carbon are vented as CO2 in either the flue gas from the GT/boiler, or because of the pressurizing of the biomass feed. The total CO2 emission from the plants is therefore 3% (RC) and 10% (OT) of the input carbon in the torrefied biomass46
Accounting for the torrefaction process, which occurs outside the plant, the emissions become about 22% (RC) and 28% (OT) of the input carbon in the untreated biomass.
. The total CO2 emission could be reduced to 1% (RC) by reusing the CO2 used for pressurizing the biomass.
A number of measures were taken to minimize the CO2 emissions from the plants: 1. Recycling a CO2-containing gas stream from the distillation section to the CO2
capture step (contains 25% (RC) or 16% (OT) of the input carbon in the torrefied biomass).
2. Cooling the product stream from the DME reactor to below -35°C in order to dissolve CO2 in the liquid that is sent to the distillation section (80% (RC) or 83% (OT) of the CO2 in the stream is dissolved in the liquid).
3. Having a H2/CO ratio of 1.6 instead of 1 in the OT plant, which lowers the amount of carbon left in the unconverted syngas that is combusted and vented (the H2/CO ratio in the unconverted syngas is 6.6).
45 The carbon in the product DME will, if used as a fuel, eventually be oxidized, and the CO2 will most likely be vented to the atmosphere. 46 In section 4.2.1, more correct values for the CO2 needed for feeding and pressurization were given, these values would raise the amount of CO2 for pressurization from 2% to ~4% and the amount of CO2 for feeding from 3% to ~5% (Figure 5.17).
57%
48%
1%
74%
7%
100%
3%47%
DME
CO2 from off-gas boiler
CO2 storedCO2 for pressurizing
biomass
CO2 for feeding
Torrefied biomass
RC plant
107%
25%
SynthesisGasification
AGR(Rectisol)
CO2 from distillation
62%
35%
9%
60%
7%
100%
3%52%
DME
CO2 in GT flue gas
CO2 storedCO2 for pressurizing
biomass
CO2 for feeding
Torrefied biomass
OT plant
107%
16%
SynthesisGasification
AGR(Rectisol)
CO2 from distillation
86
The costs of doing these measures were: 1. 6 MWe (RC) or 4 MWe (OT) to compress the CO2 containing gas stream. 2. For the RC plant: most likely nothing because CO2 is typically removed before
recycling the gas stream to the DME reactor, in order to keep the size/cost of the reactor as low as possible. For the OT plant: some of the 11 MWe used to cool the gas stream could be saved.
3. By increasing the H2/CO ratio from 1 to 1.6 in the OT plant, more heat was released in the WGS reactor (Figure 5.16), and therefore less in the GT combustion chamber. Even though the waste heat from the WGS reactor is used to produce electricity, it is more efficient to release the heat in the GT. Besides this, the conversion rate in the DME reactor was also lowered, which was compensated for by increasing the reactor pressure. Also, more methanol was produced in the DME reactor, which increased the need for (or increased the benefit of adding) the methanol dehydration step.
It was only possible to do the recycle of the CO2 containing gas stream in the RC plant because the inert fraction of the gas from the gasifier was very low (the inert fraction was 0.24 mole%, sum of N2, Argon and CH4). Because of the recycle, the inert fraction in the syngas leaving the AGR step was 1.1 mole%. The inert fraction in the product gas from the DME reactor was even higher (10 mole%). It was assumed in the simulations that all N2 originated from the biomass input47
5.2.5 The assumption of chemical equilibrium
, and because the simulations showed that more than half of the inert fraction was N2, the N2 content of the biomass input is crucial. The N2 content of the torrefied wood input was 0.29 mass%, but the N2 content of other biomasses can be higher. If for instance a torrefied grass, with a N2 content of 1.2 mass% was used, the inert fraction in the product gas from the DME reactor would increase from 10 to 23 mole%. The proposed design would therefore still be possible, but the size/cost of the DME reactor would increase.
In the modeling of the DME synthesis, chemical equilibrium was assumed when calculating the product gas composition. It would however have been more correct if an approach to equilibrium had been used (see section 4.4). In the following, the effects of assuming chemical equilibrium on the results for the two DME plants are shown. In Figure 5.18, the results are summarized. The assumed approach temperatures are (section 4.4):
• 15°C for the methanol reaction (4H2+2CO ↔ 2CH3OH) • 15°C for the WGS reaction (H2O+CO ↔ CO2+H2) • 100°C for the methanol dehydration reaction (2CH3OH ↔ CH3OCH3+H2O)
47 It was assumed that the 0.4 mole% of inerts in the oxygen from the ASU is argon. This was done to show where the inerts in the downstream processing originated: argon from the ASU and nitrogen from the biomass. In practice, some nitrogen will also be present in the oxygen from the ASU.

87
Figure 5.18. Energy efficiencies for the two plants when assuming either chemical equilibrium or an approach to equilibrium (LHV). The numbers in parentheses are the fuels effective efficiencies (FEE) - defined at Figure 5.15. RC plant In Table 5.3, the product gas composition from the DME reactor is shown when assuming either chemical equilibrium (“original”) or an approach to equilibrium (“approach”). Besides this, the syngas composition of the syngas to the reactor is given, together with the composition of the unconverted syngas that is recycled to the reactor. Table 5.3 shows that the syngas conversion is 81.6% when assuming chemical equilibrium, and 73.2% if assuming an approach to equilibrium. Because the RC plant uses a recycle of unconverted syngas to the DME reactor, the consequence of assuming an approach to equilibrium need not be a lower DME production, but simply a greater flow of unconverted syngas recycled to the DME reactor. If a 97% recycle was used instead of 95%, the amount of purge gas could be kept constant, while the mole flow of unconverted syngas recycled to the DME reactor would increase from 2.1 kmole/s to ~5 kmole/s, with a corresponding increase in the mole flow to the reactor from 9.24 kmole/s to ~12 kmole/s.
66%49%
66%45%
5%16%
4%19%
0%
20%
40%
60%
80%
100%E
ffic
ienc
y (L
HV
)Net electricity DME
70%(72%)
RC approach
RC OT
71%
OTapproach
(71%)63%
(72%)65%
(73%)

88
Reactor inlet Reactor outlet Reactor outlet Recycle gas Original Original Approach Original Stream number 24+42 25 25 31 Mass flow (kg/s) 155.0 155.0 155.0 45.7 Flow (kmole/s) 9.24 4.67 5.14 2.10 Mole frac (%) H2 45.5 16.2 21.3 33.7 CO 45.5 17.0 22.5 33.6 CO2 3.0 30.0 24.7 12.8 H2O 0.09 0.56 0.60 0.00 CH4 0.93 1.8 1.7 2.9 H2S 0.00 0.00 0.00 0.00 N2 2.8 5.4 5.0 10.8 Ar 1.5 2.9 2.7 5.2 CH3OH 0.55 1.1 1.4 0.00 CH3OCH3 0.25 25.0 20.1 1.1 H2 conversion [%] 82.0 73.9 CO conversion [%] 81.1 72.5 H2 + CO conversion [%] 81.6 73.2 Unconverted H2 + CO [%] 18.4 26.8 Table 5.3. Stream compositions for the recycle (RC) DME plant model using CO2 capture and storage. Stream numbers refer to Figure 5.9.* Liquid The used approach temperatures should, at the least, be valid for BWR reactors, but since the DME reactor used is a liquid/slurry phase reactor, and measured syngas conversions for a slurry phase DME reactor is of the order 50-60% [Yagi et al., 2010] [Ohno, 2007], it may be more correct if assuming a syngas conversion of 60%. If a syngas conversion of 60% is used, the mole flow of unconverted syngas recycled to the DME reactor would increase from ~5 kmole/s to ~8 kmole/s, with a corresponding increase in the mole flow to the reactor from 12 kmole/s to ~15 kmole/s. The precise increases in the mole flows are not very important when considering the associated increase in electricity consumption. From Figure 5.9, it can be seen that the only electricity consumption affected is the refrigeration of the product gas (the electricity consumption of the recycle compressor would also increase, but this value is low). It is estimated that the electricity consumption may increase from 11 MWe to ~20 MWe, corresponding to a reduction in net electricity from 112 MWe to ~103 MWe. The resulting energy efficiencies would therefore be: 4% net electricity, 66% DME and 70% total. OT plant In Table 5.4, the product gas composition from the DME reactor is shown when assuming either chemical equilibrium (“original”) or an approach to equilibrium (“Approach”). Besides this, the composition of the syngas to the reactor is given, together with the composition of the unconverted syngas that is sent to the gas turbine. Table 5.4 shows that the syngas conversion is 73% when assuming chemical equilibrium, and 67% if assuming an approach to equilibrium.

89
The consequence of assuming an approach to equilibrium would therefore be a reduction of the DME production from 48% to 44%, but an increase in the net electricity production from 16% to 18-19% (interpolating between the RC and OT plant: 18%-point difference in DME efficiency and 11%-point difference in gross electricity production). Reactor inlet Reactor outlet Reactor outlet Gas to gas turbine Original Original Approach Original Stream number 22 23 23 28 Mass flow (kg/s) 92.4 92.4 92.4 17.2 Flow (kmole/s) 7.08 3.73 4.03 1.98 Mole frac (%) H2 60.2 42.6 45.5 79.7 CO 36.5 6.3 10.7 11.5 CO2 3.0 23.8 20.8 7.3 H2O 0.00 3.1 2.2 0.00 CH4 0.06 0.11 0.10 0.16 H2S 0.00 0.00 0.00 0.00 N2 0.17 0.33 0.30 0.59 Ar 0.09 0.17 0.20 0.29 CH3OH 0.00 2.4 2.5 0.00 CH3OCH3 0.00 21.2 17.7 0.45 H2 conversion 63 57 CO conversion 91 83 H2 + CO conversion 73 67 Table 5.4. Stream compositions for the once-through (OT) DME plant model. Stream numbers refer to Figure 5.10. As mentioned above for the RC plant, the actual syngas conversion in a liquid/slurry phase reactor may be lower. If this was the case, the DME efficiency would of course drop further, but the net electricity consumption would also increase.
5.2.6 Comparing with other plants
5.2.6.1 Comparing with plants venting CO2 If the CO2 captured in the gas conditioning was not sent to underground storage, but vented to the atmosphere, the design of the plants would be as shown in Figure 5.1 and Figure 5.2. Below, the performance of such plants is described and compared with the modeled DME plants, and in Figure 5.19 this is summarized.
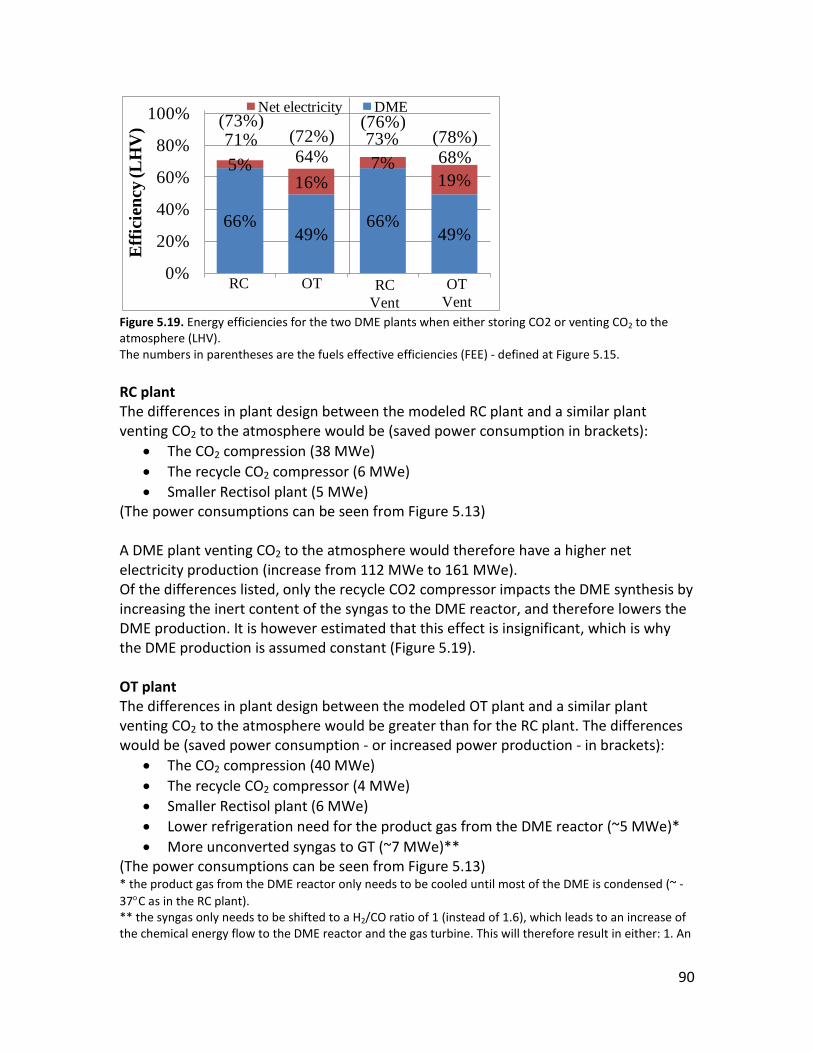
90
Figure 5.19. Energy efficiencies for the two DME plants when either storing CO2 or venting CO2 to the atmosphere (LHV). The numbers in parentheses are the fuels effective efficiencies (FEE) - defined at Figure 5.15. RC plant The differences in plant design between the modeled RC plant and a similar plant venting CO2 to the atmosphere would be (saved power consumption in brackets):
• The CO2 compression (38 MWe) • The recycle CO2 compressor (6 MWe) • Smaller Rectisol plant (5 MWe)
(The power consumptions can be seen from Figure 5.13) A DME plant venting CO2 to the atmosphere would therefore have a higher net electricity production (increase from 112 MWe to 161 MWe). Of the differences listed, only the recycle CO2 compressor impacts the DME synthesis by increasing the inert content of the syngas to the DME reactor, and therefore lowers the DME production. It is however estimated that this effect is insignificant, which is why the DME production is assumed constant (Figure 5.19). OT plant The differences in plant design between the modeled OT plant and a similar plant venting CO2 to the atmosphere would be greater than for the RC plant. The differences would be (saved power consumption - or increased power production - in brackets):
• The CO2 compression (40 MWe) • The recycle CO2 compressor (4 MWe) • Smaller Rectisol plant (6 MWe) • Lower refrigeration need for the product gas from the DME reactor (~5 MWe)* • More unconverted syngas to GT (~7 MWe)**
(The power consumptions can be seen from Figure 5.13) * the product gas from the DME reactor only needs to be cooled until most of the DME is condensed (~ -37°C as in the RC plant). ** the syngas only needs to be shifted to a H2/CO ratio of 1 (instead of 1.6), which leads to an increase of the chemical energy flow to the DME reactor and the gas turbine. This will therefore result in either: 1. An
66%49%
66%49%
5%16%
7%19%
0%
20%
40%
60%
80%
100%E
ffic
ienc
y (L
HV
)Net electricity DME
73%(76%)
RC Vent
RC OT
71%
OTVent
(78%)68%
(72%)64%
(73%)
91
increase in DME production combined with a small decrease in electricity production (because less thermal energy is released in the WGS reactor and the DME reactor combined) 2. An increase in electricity production because more chemical energy is converted in the gas turbine (the increase is small because the chemical energy converted in the WGS reactor was also used for electricity production). Option no. 2 is assumed. The first three differences listed are similar to the ones listed at the RC plant above. The “more unconverted syngas to GT” implies that the DME production is kept constant, which is why this is the case in Figure 5.19. A DME plant venting CO2 to the atmosphere would therefore have a higher net electricity production (increase from 369 MWe to 430 MWe).
5.2.6.2 Comparing with literature The most relevant modeling studies to compare with is considered to be ones described in [Larson et al., 2009-1] and [Larson et al., 2003] (both presented in section 2.4 about previous work). In these references, two DME plants using recycle synthesis are presented, and in Table 5.5, the energy efficiencies of these plants are compared with the DME plants modeled in this study. Table 5.5 shows that the energy efficiencies of the large-scale DME plants in this study are much higher than the energy efficiencies of the two plants from the literature, even when comparing the fuels effective efficiency (FEE), which is a more fair method of comparison than the total efficiency (FEE = 72% and 73% vs. FEE = 64% and 55%). The reasons for these higher efficiencies are discussed below - first for biomass to DME, then for biomass to electricity. It should also be mentioned that JFE reports the natural gas to DME efficiency to be 71% [Yagi et al., 2010], and the coal to DME efficiency to be 66% [Ohno, 2007]. Since the cold gas efficiency of the Shell gasifier operated on torrefied biomass is similar to the cold gas efficiency of the same gasifier operated on coal, the coal to DME efficiency should be similar to the torrefied biomass to DME efficiency.

92
This study This study [Larson et al., 2009-1]
[Larson et al., 2003]
OT RC RC RC Feedstock Torrefied
biomass Torrefied biomass
Switchgrass Coal
H2+CO [mole%] (into reactor, incl. recycle)
97 91 53 80
H2/CO [mole ratio] (into reactor, incl. recycle)
1.65 1.00 4.1 1.00
Syngas conversion per pass of reactor[%]
73 82 ?* 35*
Energy ratios [% of fuel input, LHV] Syngas (Cold gas efficiency of gasifier)
81 81 80** 74***
Gross electricity 23 12 16 10# Steam turbine electricity
15 12 10 6.4
Gas turbine electricity
8 0 6 2.4
Total electricity consumption
7 7 7 10
Net electricity 16 5 9 0 DME 48 66 52 55 DME +net electricity 64 71 61 55 DME +gross electricity
71 78 68 65
Other energy ratios [%-LHV] FEE### 72 73 64 55 Syngas to DME 59 81 65 74 Syngas to purge gas 25 1 ? 8
Table 5.5. Comparison of the modeled DME plants with the two DME plants from literature. * The DME synthesis modeling is based on reaction kinetics. The model is developed in [Larson-2003] (see [Larson-2009-2]). ** Including tar cracker. *** Calculated based on the coal input and the gas composition from the gasifier. The reference states the cold gas efficiency to be 76%-HHV, but this is for different operating conditions. The gasifier is a Texaco type (now GE energy) entrained flow gasifier. # Steam turbine + gas turbine + syngas expander. ### Fuels effective efficiency (FEE), defined at Figure 5.15. Biomass to DME If comparing the RC plant with the RC plant in [Larson et al., 2003], Table 5.5 shows that the reasons for the higher biomass to DME efficiency (66% vs. 55%) are:
• Higher biomass to syngas conversion (81% vs. 74%) • Higher syngas to DME conversion (81% vs. 74%)
(66%=81%*81% and 55%=74%*74%) The higher biomass to syngas conversion (81% vs. 74%) is because the Shell gasifier is more efficient than the Texaco type gasifier used in [Larson et al., 2003], primarily

93
because the Texaco gasifier is fed with a coal-water slurry and has a lower carbon conversion. The higher syngas to DME conversion (81% vs. 74%) is due to the modeling of the DME synthesis in [Larson et al., 2003] because the syngas composition is very similar to the one used in this study. The modeling of the DME synthesis in [Larson et al., 2003] results in a syngas conversion per pass of the reactor of 35%, while 82% is achieved in the RC plant in this study (Table 5.5). As discussed in section 5.2.5, the syngas conversion possible in a slurry phase reactor is at least 50-60%, and because the design of a liquid phase reactor is very similar, the syngas conversions are expected to be the same (50-60%). When comparing the RC plant from this study with the RC plant from [Larson et al., 2009-1], Table 5.5 show that the reason for the higher biomass to DME efficiency (66% vs. 52%) is because of a higher syngas to DME conversion (81% vs. 65%) - the cold gas efficiencies of the gasifiers are similar The higher syngas to DME conversion is due to: 1. The modeling of the DME synthesis in [Larson et al., 2009-1] (same model as in [Larson et al., 2003]), 2. The syngas composition in [Larson et al., 2009-1]. The syngas in [Larson et al., 2009-1] is generated by a fluidized bed and has a CH4 content of 7 mole% after AGR. In Table 5.5, it can be seen that the H2+CO content in the syngas to the DME reactor is only 53%, compared to 91% in this study, and with a H2/CO ratio of 4.1, which is not optimal for DME synthesis. Biomass to electricity In Table 5.5, the biomass to electricity efficiencies of the plants are compared. The biomass to electricity efficiencies are more difficult to compare than the biomass to DME efficiencies because a high production of electricity can either be due to the plant being very energy efficient, or due to the amount of unconverted syngas available for electricity production. It is however clear from Table 5.5 that the integrated steam plants in this study produce more electricity than the integrated steam plants from the other studies (15% and 12% vs. 10% and 6.4%). Even the RC plant from this study produces more electricity, although almost no unconverted syngas is available for power production. If the OT plant is compared with the most efficient of the two plants in Table 5.5 ([Larson et al., 2009-1]), it can be seen that the gross electricity productions are 23% vs. 16%. Some of the difference is due to a lower DME production in the OT plant, but if this is compensated for by interpolating between the RC and OT plants (18%-point difference in DME efficiency and 11%-point difference in gross electricity production), the gross electricity production for the modified OT plant would be 20%. The difference between the modified OT plant and the plant in [Larson et al., 2009-1] is therefore 20% vs. 16%. This difference is mostly due to a more efficient integrated steam plant (high pressure and high temperature steam from gas cooler, and double reheat).

94
5.3 Cost estimation Below, the levelized cost of DME is estimated for the two modeled DME plants, but before the levelized cost can be calculated, the plant investment must be estimated.
5.3.1 Plant investment The plant investment for the two DME plants are estimated based on component cost estimates given in Table 5.6. In Figure 5.20, the cost distribution between the different plant areas is shown for both the RC and the OT plant. The figure shows that the gasification part is very cost intensive, accounting for 38-41% of the investment. The figure also shows that the OT plant is slightly more expensive than the RC plant, mostly due to the added cost of the gas turbine and HRSG, which is not outbalanced by what is saved on the DME synthesis area48
.
Figure 5.20. Cost distribution for the two DME plants. If the DME plants vented the captured CO2 instead of sending it to underground storage, Figure 5.20 shows that the plant cost would be 11-12% lower (disregarding the reduced cost of the Rectisol plant). This includes the cost for CO2 transport and storage, although this does not take place at the plant site (Table 5.6).
48 If a lower syngas conversion is assumed per reactor pass (as discussed in section 5.2.5), the mole flow to the reactor would increase, which would then increase the cost of the DME reactor in the RC plant.
0200400600800
1000120014001600
RC OT
Inve
stm
ent (
M$)
HX & Comp.
Power productionDME synthesis
CO2 comp. & storageAGR+WGS
Gasification
ASU
10%
41%
8%12%17%6%6%
9%
38%
8%11%13%11%9%

95
Reference size Reference cost (million 2007$)
Scaling exponent
Overall installation factor
Source
Air separation unita
52.0 kg-O2/s 141 0.5 1 [Andersson et al., 2006]
Gasification
islandb 68.5 kg-feed/s 395 0.7 1 [van der Ploeg et al.,
2004] Water-gas shift reactorc
815 MWLHV biomass 3.4 0.67 1.16 [Kreutz et al., 2008]
AGR (Rectisol)d 2.48 kmole/s feed gas 28.8 0.63 1.55 [Kreutz et al., 2008] CO2 compression to 150 bare
13 MWe 9.5 0.67 1.32 [Kreutz et al., 2008]
CO2 transport and storagef
113 kg-CO2/s 110 0.66 1.32 [Ogden, 2004]
Compressorsg 10 MWe 6.3 0.67 1.32 [Kreutz et al., 2008] DME reactorh 2.91 kmole/s feed gas 21.0 0.65 1.52 [Larson et al., 2009-2] Cooling planti 3.3 MWe 1.7 0.7 1.32 Distillationl 6.75 kg/s DME 28.4 0.65 1.52 [Larson et al., 2009-2] Steam turbines and condenserk
275 MWe 67 0.67 1.16 [Kreutz et al., 2008]
Heat exchangersl 355 MWth 52 1 1.49 [Kreutz et al., 2008] Off-gas boilerm 355 MWth 52 1 1.49 Gas turbinen 266 MWe 73 0.75 1.27 [Kreutz et al., 2008] Table 5.6. Cost estimates for plant areas/components in the DME plants. The cost for a specific size component is calculated in this way:
The overall installation factor includes balance of plant costs (BOP) and indirect costs such as engineering, contingency and startup costs. BOP costs are listed below for each component, while indirect costs are assumed to be 32% of the cost (incl. BOP) - except for power island components, where indirect costs are assumed to be 27% [Kreutz et al., 2008]. If the overall installation factor is 1, BOP and indirect costs are included in the reference cost. All costs are adjusted to 2007$ by using the Chemical Engineering Plant Cost Index (CEPCI, data for 2000 to 2007 in [Kreutz et al., 2008]). Only the gasification island is assumed to be in dual train, all other process areas are single train. This corresponds well with data given on maximum component sizes in [Kreutz et al., 2008] - except for the slurry/liquid phase reactor, which is suggested to be dual train. However, in [Hansen et al., 2008] it is suggested that a single train could be used. a The reference reports an investment of 304.59 M€ (assumed to be 2004€) for an ASU with 2 or 4 production lines (4 is assumed here) that produces 221.6 kg/s of 95% pure O2 at atmospheric pressure. The cost for a single line is found by dividing with 40.9. This cost is then divided with 0.96 to correct for O2 purity (99.6% purity needed) [Andersson et al., 2006]. $/€ = 1.30 [Andersson et al., 2006]. The scaling exponent is from [Kreutz et al., 2005]. The cost is assumed to include BOP and indirect cost. b The gasification island is designed for coal in dual train and includes feed preparation, slag handling, high temperature syngas cooler and dry solids removal. The cost is in 2004$ and includes BOP and indirect cost. The coal gasification island cost is given for 3 different coal types – the one used here is for PRBasin, since it has the lowest heating value (more similar to torrefied biomass). The reference size basis is the feed mass flow, which is common (also used in e.g. [Larson et al., 2009-2]). The scaling exponent is from [Larson et al., 2009-2] and corresponds very well with gasification costs given by the reference for 2000 t/d, 3000 t/d and 4000 t/d (coal feed). The maximum size for a single train is 5000 t/d (58 kg/s, 116 kg/s for dual train). The cost given by the reference (Shell, from 2004) is about the same as the cost given in a study from 1998 (revised in 2000) by NETL on an IGCC using the Shell gasifier [Shelton et al., 2000].
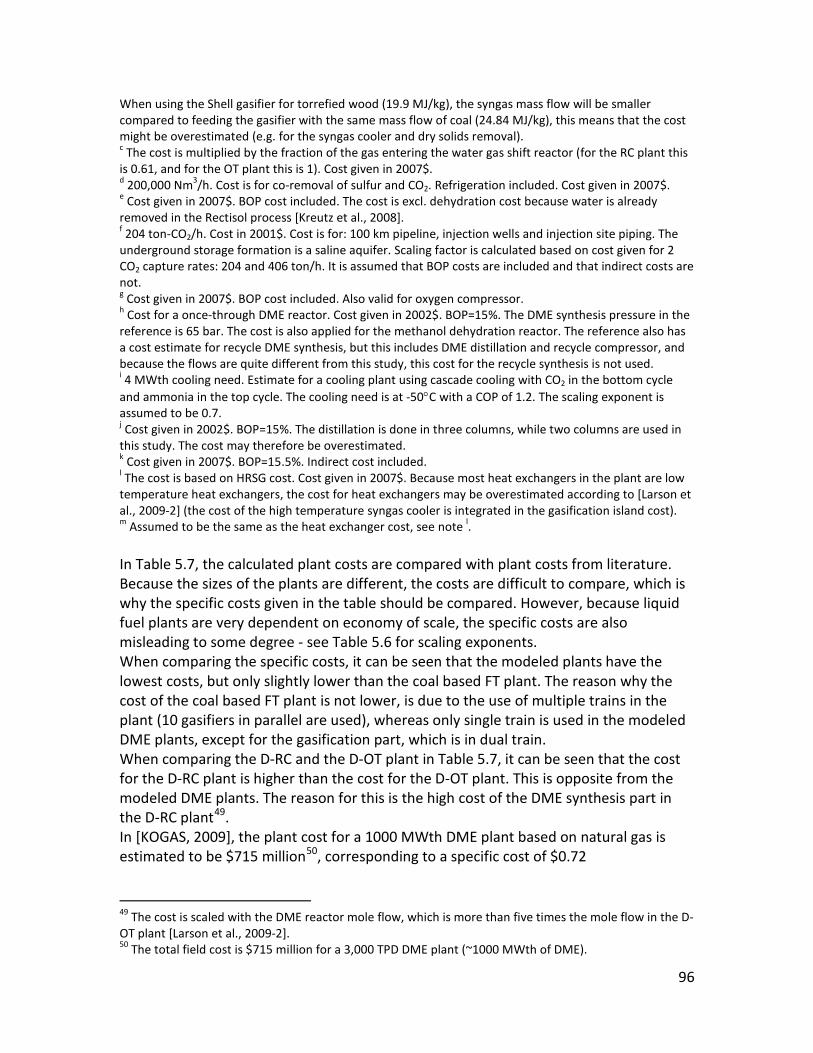
96
When using the Shell gasifier for torrefied wood (19.9 MJ/kg), the syngas mass flow will be smaller compared to feeding the gasifier with the same mass flow of coal (24.84 MJ/kg), this means that the cost might be overestimated (e.g. for the syngas cooler and dry solids removal). c The cost is multiplied by the fraction of the gas entering the water gas shift reactor (for the RC plant this is 0.61, and for the OT plant this is 1). Cost given in 2007$. d 200,000 Nm3/h. Cost is for co-removal of sulfur and CO2. Refrigeration included. Cost given in 2007$. e Cost given in 2007$. BOP cost included. The cost is excl. dehydration cost because water is already removed in the Rectisol process [Kreutz et al., 2008]. f 204 ton-CO2/h. Cost in 2001$. Cost is for: 100 km pipeline, injection wells and injection site piping. The underground storage formation is a saline aquifer. Scaling factor is calculated based on cost given for 2 CO2 capture rates: 204 and 406 ton/h. It is assumed that BOP costs are included and that indirect costs are not. g Cost given in 2007$. BOP cost included. Also valid for oxygen compressor. h Cost for a once-through DME reactor. Cost given in 2002$. BOP=15%. The DME synthesis pressure in the reference is 65 bar. The cost is also applied for the methanol dehydration reactor. The reference also has a cost estimate for recycle DME synthesis, but this includes DME distillation and recycle compressor, and because the flows are quite different from this study, this cost for the recycle synthesis is not used. i 4 MWth cooling need. Estimate for a cooling plant using cascade cooling with CO2 in the bottom cycle and ammonia in the top cycle. The cooling need is at -50°C with a COP of 1.2. The scaling exponent is assumed to be 0.7. j Cost given in 2002$. BOP=15%. The distillation is done in three columns, while two columns are used in this study. The cost may therefore be overestimated. k Cost given in 2007$. BOP=15.5%. Indirect cost included. l The cost is based on HRSG cost. Cost given in 2007$. Because most heat exchangers in the plant are low temperature heat exchangers, the cost for heat exchangers may be overestimated according to [Larson et al., 2009-2] (the cost of the high temperature syngas cooler is integrated in the gasification island cost). m Assumed to be the same as the heat exchanger cost, see note l. In Table 5.7, the calculated plant costs are compared with plant costs from literature. Because the sizes of the plants are different, the costs are difficult to compare, which is why the specific costs given in the table should be compared. However, because liquid fuel plants are very dependent on economy of scale, the specific costs are also misleading to some degree - see Table 5.6 for scaling exponents. When comparing the specific costs, it can be seen that the modeled plants have the lowest costs, but only slightly lower than the coal based FT plant. The reason why the cost of the coal based FT plant is not lower, is due to the use of multiple trains in the plant (10 gasifiers in parallel are used), whereas only single train is used in the modeled DME plants, except for the gasification part, which is in dual train. When comparing the D-RC and the D-OT plant in Table 5.7, it can be seen that the cost for the D-RC plant is higher than the cost for the D-OT plant. This is opposite from the modeled DME plants. The reason for this is the high cost of the DME synthesis part in the D-RC plant49
In [KOGAS, 2009], the plant cost for a 1000 MWth DME plant based on natural gas is estimated to be $715 million
.
50
49 The cost is scaled with the DME reactor mole flow, which is more than five times the mole flow in the D-OT plant [Larson et al., 2009-2].
, corresponding to a specific cost of $0.72
50 The total field cost is $715 million for a 3,000 TPD DME plant (~1000 MWth of DME).

97
million/MWthDME, which is lower than the specific cost for the RC plant - as expected ($0.90 million/MWthDME). This study This study [Larson et al.,
2009-1] [Larson et al.,
2009-1] [Kreutz et al., 2008]
[Kreutz et al., 2008]
Identifier used in reference
RC OT D-RC D-OT BTL-RC-CCS CTL-RC-
CCS
Feedstock Torrefied biomass
Torrefied biomass
Switchgrass Switchgrass Switchgrass Coal
Feedstock input [MWth-LHV]
2302 2302 893 893 601 7272
Fuel output [MWth-LHV]
1515 (DME)
1130 (DME)
468 (DME)
217 (DME)
278 (FT)
3147 (FT)
Total plant cost [million 2007$]
1366 1489 1047* 922* 636 4946
Cost per biomass input [million $ / MWth]
0.59 0.65 1.17 1.03 1.06 0.68
Cost per fuel output [million $ / MWth]
0.90 1.32 2.24 4.25 2.29 1.57
Table 5.7. Comparison of the DME plant costs with literature. * The original cost for the D-RC and D-OT plants were 596 and 501 million 2003$ respectively, but the reference writes that this should have been higher, referring to [kreutz et al., 2008]. The reference writes that the costs should have been 266 million 2007$ higher. The conversion between 2003$ to 2007$ is done with the CEPCI (see Table 5.6): 2007$/2003$ = 1.31.
5.3.2 Levelized cost calculation To calculate the cost of the produced DME, a twenty-year levelized cost calculation is carried out for both DME plants (Table 5.8). Price / rate RC OT Levelized cost in $/GJ-DME Capital charges 15.4% of plant investment [Kreutz et al., 2008] 4.9 7.2 O&M 4% of plant investment [Kreutz et al., 2008] 1.3 1.9 Torrefied biomass pellets 4.6$/GJ [Uslu et al., 2008] 6.9 9.3 Electricity sales 60$/MWh [Kreutz et al., 2008] -1.2 -5.4 Credit for bio-CO2 storage 0 0 DME ($/GJLHV) 11.9 12.9 Table 5.8. Twenty-year levelized production costs for the modeled DME plants. A capacity factor of 90% is assumed [Kreutz et al., 2008]. LHV is used. The levelized costs are calculated with no credit for the CO2 stored to give a reference DME cost - below the effect of giving a credit for CO2 storage is investigated. The results show a lower cost for the RC plant than the OT plant, which is similar to the difference seen in plant investment. In section 2.4, levelized cost for liquid fuels plants from literature were given. These cost ranged from $8/GJ to $25/GJ. One of the reasons for this large span is that the

98
calculated cost of fuel is very dependent on the assumed prices or rates listed in Table 5.8. If comparing with [Kreutz et al., 2008], which is the source of most of the assumed prices and rates used in Table 5.8, levelized cost are $12.2/GJLHV to $27.7/GJLHV for Fischer-Tropsch fuels based on coal and biomass (CTL, BTL and CBTL). Even though the coal price used in [Kreutz et al., 2008] is $1.8/GJLHV, the FT costs are not lower than the DME costs calculated here, which is mainly due to a higher conversion efficiency in the modeled DME plants, resulting in higher fuel outputs (the highest conversion efficiency in [Kreutz et al., 2008] is a total efficiency of 52%, achieved for the BTL plant shown in section 2.4). If a credit is given for storing the CO2 captured in the DME plants because the CO2 is of recent photosynthetic origin (bio-CO2), the cost of DME becomes even lower. At a credit of $100/ton-CO2, the levelized costs of DME are $5.4/GJLHV (RC) and $3.1/GJLHV (OT) (Figure 5.21). Figure 5.21 also shows that above a CO2 credit of ~$27/ton-CO2, the OT plant has a lower DME production cost than the RC plant because more CO2 is captured in the OT plant. It should be noted that the figure is generated by conservatively assuming all other costs constant. This will however not be the case because an increase in the GHG emission cost (= the credit for bio-CO2 storage) will cause an increase in electricity and biomass prices. In [Larson et al., 2006], the increase in income from coproduct electricity (when the GHG emission cost is increased) more than offsets the increase in biomass costs.
Figure 5.21. DME production costs as a function of the credit given for bio-CO2 storage. The effect of increasing the income from coproduct electricity for the two DME plants can be seen in Figure 5.22. This figure clearly shows how important the income from coproduct electricity is for the economy of the OT plant. This is because the net electricity production is more than three times the net electricity production of the RC plant.
0
5
10
15
0 20 40 60 80 100
DM
E c
ost (
$/G
J)
Credit for bio-CO2 storage /GHG emission cost ($/ton-CO2)
RCOT

99
Figure 5.22. DME production cost as a function of the electricity sales price. Since torrefied biomass pellets are not commercially available, the assumed price of $4.6/GJLHV is (very) uncertain. In Figure 5.23, the relation between the price of torrefied biomass pellets and the DME production cost is shown. The figure shows that the OT plant is slightly more dependent on the biomass price. This is because the output of DME is lower in the OT plant (this can also be seen from Table 5.8).
Figure 5.23. DME production cost as a function of the price of torrefied biomass pellets. If no credit was given for bio-CO2 storage, the plants could achieve lower DME production cost by venting the CO2 instead of compressing and storing the CO2. If the plants vented the CO2, the levelized cost of DME would be reduced from $11.9/GJLHV to $10.6/GJLHV (RC)51
5.4 WTW study revisited
, and from $12.9/GJLHV to $11.0/GJLHV (OT). The effect on the levelized cost of venting the CO2 is greater for the OT plant because more CO2 is captured in this plant, but also because more energy consuming process changes were made to lower the plant CO2 emissions.
Based on the modeled DME-RC plant, a WTW pathway called DME-FW-CCS has been generated for comparison with the WTW pathways shown in section 0. Table 5.9 shows 51 Calculated based on a reduction in the plant investment (affecting the capital charges and O&M, see Table 5.8) and an increase in electricity sales (Table 5.8). From section 5.3.1 we have that $159 million (RC) and $170 million (OT) are saved on the plant investment because of CO2 compression and storage. From section 5.2.6.1 we have that the net electricity production is raised with 49 MWe (RC) and 61 MWe (OT), primarily because of the CO2 compression.
0
5
10
15
20
0 20 40 60 80 100
DM
E c
ost (
$/G
J)
Electricity sales price ($/MWh)
RCOT
electricity price used
0
5
10
15
20
25
0 2 4 6 8 10
DM
E c
ost (
$/G
J LH
V)
Torrefied biomass price ($/GJLHV)
RCOT
biomass price used

100
that the calculated WTW energy consumption for the pathway is 2.81 MJ/km, which is lower than the value for the DME-FW pathway (3.56 MJ/km), which is the equivalent pathway. This is due to the higher energy efficiency of the modeled RC plant (FEE = 65% vs. 51%). The higher energy efficiency also results in a higher potential for replacing road fuels (8.8% vs. 7.6% - the difference is proportional to the biomass to DME efficiencies: 59% vs. 51%). The low GHG emission of -99 g-CO2,eq /km for the pathway is due to CO2 capture and storage (CCS). If CCS had not been used, the GHG emission would have been 13 g-CO2,eq
/km. The cost of CO2 avoided for the pathway is calculated to be 34 €/tCO2, which is much lower than the cost of 171 €/tCO2 for the DME-FW pathway. If CCS had not been used, the cost would still have been much lower (61 €/tCO2), mainly due to different plant costs (the DME-RC plant is also ~15 times larger), but also because the biomass cost is higher (4.5 €/GJ vs. 3.7 €/GJ ($4.6/GJ)). If comparing with other pathways based on farmed wood (FW), the lowest cost obtained in section 2.2 was for methanol (98 €/tCO2). The cost for DME was much higher than for methanol (171 €/tCO2) because of the added cost for distribution infrastructure and DME vehicles. If a Me-FW-CCS pathway was made, the cost of CO2 avoided is estimated to be ~-6 €/tCO2 (calculated by removing the costs for distribution infrastructure and DME vehicles). Other pathways could also achieve lower cost of CO2 avoided if using CCS, but pathways based on pressurized gasification are especially suited for CCS because CO2 is typically removed at elevated pressures in the gas conditioning anyway.

101
Pathway name
Pathway description
WTW Energy consumption [MJ/km]
WTW GHG emission [g-CO2,eq
/km]
Cost of CO2 avoided (oil @ 50 €/bbl) [€/tCO2]
Potential in EU-25
Biomass Feedstock [EJ/y]
Fraction of road fuels market replaced [%]
Gasoline Ga-ref PISI 2010 (reference)
2.16 164 - - -
Methanol* (5% blend in gasoline)
Me-FW PISI 2010, farmed wood*
3.93 16 98 1.866 7.4
Me-BL PISI 2010, waste wood, black liquor*
3.02 7 -37 0.236 1.2
DME
DME-FW
DICI 2010, farmed wood (WFDE1)
3.56 14 171 1.866 7.6
DME-BL
DICI 2010, waste wood, black liquor (BLDE1)
2.67 6 32 0.236 1.2
DME-FW-CCS
DICI 2010, farmed wood, CCS
2.81 -99 34 1.866 8.8
Hydrogen H2-FW
FC hybrid, farmed wood, (WFCH2)
1.65 12 553 1.866 19.9
Table 5.9. Well-to-wheel energy consumption, GHG emissions, cost of CO2 avoided and potential in the EU-25 for selected WTW pathways. Data from section 2.2 except for DME-FW-CCS, which is from Appendix DD.
5.5 Summary The large-scale DME plants based on entrained flow gasification of torrefied wood pellets achieved biomass to DME efficiencies of 49% when using once-through (OT) synthesis and 66% when using recycle (RC) synthesis. If the net electricity production was included, the total efficiencies became 65% for the OT plant and 71% for the RC plant. Although this seems to show that the RC plant is more energy efficient, the fuels effective efficiencies of the plants indicate that the plants are almost equally energy efficient (73% for the RC plant and 72% for the OT plant). Because some chemical energy is lost in the torrefaction process, the total efficiencies based on untreated biomass to DME were 64% for the RC plant and 59% for the OT plant. It was shown that CO2 emissions can be reduced to about 3% (RC) or 10% (OT) of the input carbon in the torrefied biomass by using CO2 capture and storage together with certain plant design changes. Accounting for the torrefaction process, which occurs

102
outside the plant, the emissions become 22% (RC) and 28% (OT) of the input carbon in the untreated biomass. The estimated cost of the produced DME was $11.9/GJLHV for the RC plant and $12.9/GJLHV for the OT plant, but if a credit was given for storing the bio-CO2 captured, the cost become as low as $5.4/GJLHV (RC) and $3.1/GJLHV (OT) (at $100/ton-CO2). The results from the RC plant were used to generate a WTW pathway for comparison with the WTW pathways presented in section 2.2. This DME-FW-CCS pathway had lower WTW energy consumption, lower WTW GHG emission, lower cost of CO2 avoided and higher potential to replace fossil fuels than the corresponding DME-FW pathway from section 2.2.

103
6. Small-scale DME/methanol production plants
The overall design of the investigated small-scale DME/methanol plant was presented in section 3.2 – and in chapter 4, it was explained how the different processes in the plant were modeled. If the overall design is combined with the individual process models, an overall plant model can be generated. The overall plant model - or flow sheet - for the small-scale DME/methanol plant, can be seen in Figure 6.1. The flow sheet is for a DME plant, but there are no differences between the flow sheets for the DME plant and the methanol plant – only some of the modeling parameters are different (compare Figure 6.1 with Figure 6.2).
Figure 6.1. Simplified flow sheet of a small-scale DME plant using once-through (OT) synthesis. The values shown are values used in the modeling (inputs or outputs). The plant in Figure 6.1 uses once-through synthesis because the syngas contains high amounts of N2 due to the air-blown gasifier. If the unconverted syngas was recycled, the nitrogen content would build up in the synthesis loop. Although this is the case, recycle synthesis is investigated for the small-scale plants, to show how high the biomass to fuel efficiency can become, without having a negative net electricity production.
Fly ash
Wet wood chips
DME reactor
Gas-liquid separator
H2/CO = 1.5
Gas engine
Air
Crude DME
Fluegas
240 C
Ash
gasifier
750 C1 bar
Water
Steam 200 C
Dry wood chips (2% water) + steam
Pyrolysis reactor
Air
Guard bed
40 bar
Water
Water
344 C
80 C
-50 C~CO2
115 C230 C
115 C
630 C
80 C

104
The fraction of unconverted syngas that is recycled will however be much lower than what was the case in the large-scale plants in chapter 5. Because the DME/methanol synthesis reactor operates at high pressure (40-96 bar), and the gas engine operates at low pressure (2 bar), there is a potential for utilizing this pressure difference in an expander. By also preheating the gas to the expander with hot exhaust from the gas engine, the power output of the expander can be increased. In Figure 6.2, a small-scale methanol plant with an expander is shown.
Figure 6.2. Simplified flow sheet of a small-scale methanol plant using once-through (OT) synthesis. The plant uses an expander to utilize the high pressure unconverted syngas. Differences between this flow sheet and Figure 6.1: A heater and an expander are added after the gas-liquid separator. The values shown are values used in the modeling (inputs or outputs). The size of the investigated DME/methanol plants are based on the maximum size of the gasifier, which is estimated to be 5 MWth biomass input (10 MWth is suggested in [Bentzen et al., 2004]). The size of the plants is therefore much lower than typical liquid fuels plants. One of the benefits of a smaller plant, is that a district heating co-production is more likely to be efficiently utilized, which is why the plants modeled used all excess waste heat for district heating production.
Fly ash
Wet Wood
Methanol reactor
Gas-liquid separator
H2/CO = 2
Gas engine
Air
Crude methanol
Fluegas
220 C
Ash
gasifier
750 C1 bar
Water
Steam
Dry wood (2% water) + steam
Pyrolysis reactor
Air
Guard bed
96 bar
Water
Water
343 C
80 C
40 C~CO2
200 C
115 C236 C
115 C
630 C
80 C

105
In the following, the results of the DME/methanol plants using an expander (Figure 6.2) will be presented for both once-through (OT) and recycle (RC) synthesis. The plants will be compared with the simpler reference plants (Figure 6.1). The results include plant energy efficiencies, such as biomass to DME/methanol, and biomass to electricity and district heating. However, before these results are presented, a section is given on how the heat integration was designed.
6.1 Designing the heat integration The DME/methanol plants, shown in Figure 6.1 and Figure 6.2, have several waste heat sources and streams needing heating. The most important waste heat sources are:
• The DME/methanol reactor • The gas engine exhaust
As can be seen from Figure 6.1 and Figure 6.2, the gasification part is fully heat integrated, which is why almost no additional high temperature waste heat can be extracted from this part (the temperature after the pyrolysis reactor is 230-236°C, and it may not be below 215°C because of the 100°C pinch in the pyrolysis reactor). The main streams needing heating are:
• The steam used for steam drying of biomass • The unconverted syngas to the expander turbine
Below, it is described how the heat integration was done in the DME plants and the methanol plants. Heat integration in the DME plants In Figure 6.3, a Q-T diagram of the main sources of waste in the DME plants, together with the main streams needing heating, can be seen. The temperature of the gas to the expander is set to be heated to the maximum obtainable temperature, to maximize the output from the expander. This temperature is 30°C (gas-gas pinch) below the gas engine exhaust temperature. In Figure 6.4, a Q-T diagram of the designed heat integration in the DME plants is given. The figure shows that it is possible to design the heat integration so that all heat requirements are satisfied.
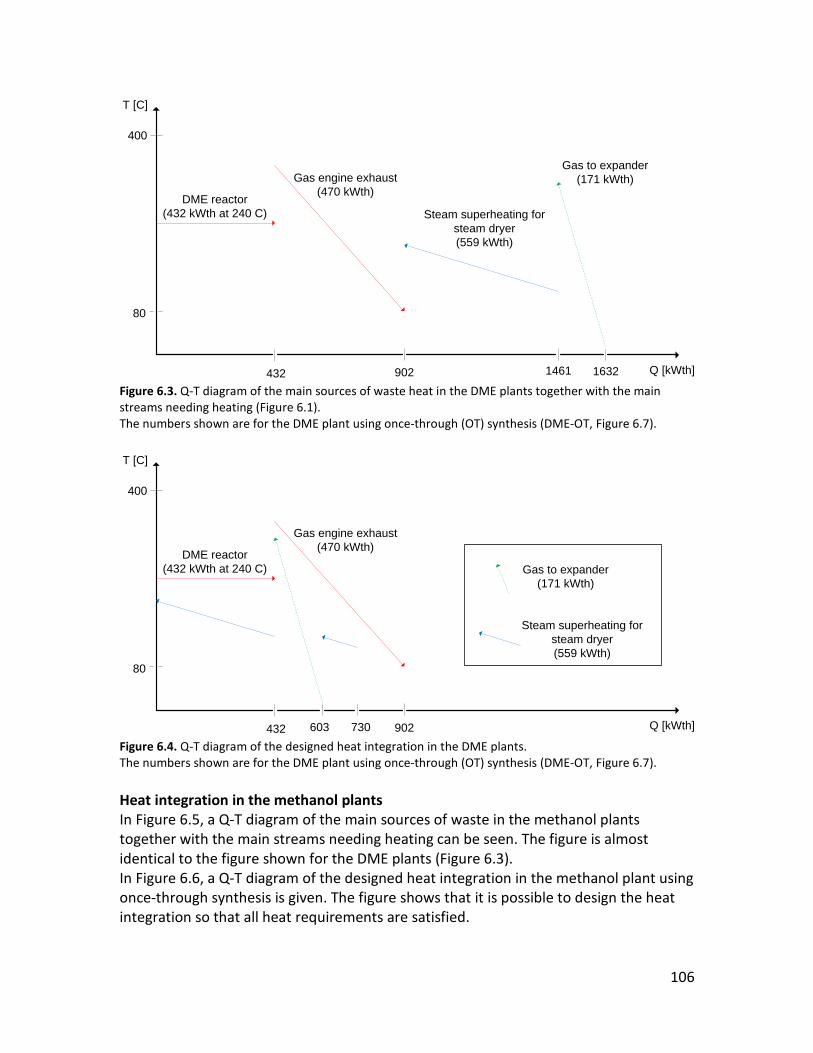
106
Figure 6.3. Q-T diagram of the main sources of waste heat in the DME plants together with the main streams needing heating (Figure 6.1). The numbers shown are for the DME plant using once-through (OT) synthesis (DME-OT, Figure 6.7).
Figure 6.4. Q-T diagram of the designed heat integration in the DME plants. The numbers shown are for the DME plant using once-through (OT) synthesis (DME-OT, Figure 6.7). Heat integration in the methanol plants In Figure 6.5, a Q-T diagram of the main sources of waste in the methanol plants together with the main streams needing heating can be seen. The figure is almost identical to the figure shown for the DME plants (Figure 6.3). In Figure 6.6, a Q-T diagram of the designed heat integration in the methanol plant using once-through synthesis is given. The figure shows that it is possible to design the heat integration so that all heat requirements are satisfied.
DME reactor (432 kWth at 240 C)
Q [kWth]432 1632
80
400
T [C]
Steam superheating for steam dryer(559 kWth)
902 1461
Gas engine exhaust(470 kWth)
Gas to expander(171 kWth)
DME reactor (432 kWth at 240 C)
Q [kWth]432 730
80
400
T [C]
902603
Gas engine exhaust(470 kWth)
Steam superheating for steam dryer(559 kWth)
Gas to expander(171 kWth)

107
In Appendix EE, a Q-T diagram of the designed heat integration in the methanol plant using recycle synthesis is given. This diagram shows that it is necessary to include the waste heat available in the syngas from the pyrolysis reactor (at 236°C), in order to satisfy all heat requirements.
Figure 6.5. Q-T diagram of the main sources of waste heat in the methanol plants together with the main streams needing heating (Figure 6.2). The numbers shown are for the methanol plant using once-through (OT) synthesis (MeOH-OT, Figure 6.9).
Figure 6.6. Q-T diagram of the designed heat integration in the methanol plant using once-through (OT) synthesis (Figure 6.9). In Appendix EE, a figure for the methanol plant using recycle (RC) synthesis is shown.
Methanol reactor (342 kWth at 220 C)
Q [kWth]342 1560
80
400
T [C]
Steam superheating for steam dryer(559 kWth)
811 1370
Gas engine exhaust(469 kWth)
Gas to expander(190 kWth)
Methanol reactor (342 kWth at 220 C)
Q [kWth]342 694
80
400
T [C]
811477
Gas engine exhaust(469 kWth)
Steam superheating for steam dryer(559 kWth)
Gas to expander(190 kWth)
749

108
6.2 Process simulation results The results from the simulation of the DME and methanol plants are presented in the following. In Figure 6.7 to Figure 6.10, the detailed flow sheets for the DME/methanol plants are shown with stream data (temperature, pressure, mass flow). The figures also show the heat integration within the plants, and the process electricity consumptions. In Table 6.1 to Table 6.4, corresponding stream compositions are given. In section 6.2.4, the results will be compared with the simpler reference DME/methanol plants (Figure 6.1), and the large-scale DME plants from the previous chapter. Synthesis pressures The synthesis pressure in the once-through DME plant was set to 40 bar, as advised by [Haldor Topsøe, 2010-4]. In order to simplify the comparison between the two once-through plants, the synthesis pressure in the OT methanol plant was set to give the same fuel output52
Because the plants based on recycle synthesis were included to show how high the biomass to fuel efficiency could become without needing electricity from the grid, the net electricity production is set to zero in the plants. The synthesis pressures in the RC plants were then determined by optimizing the biomass to fuel efficiency (in this optimization two parameters were varied: the synthesis pressure and the recycle ratio
.
53
53). The optimal synthesis pressures were found to be 44.7 bar in the DME plant
(with a corresponding recycle ratio of 2.5 ) and 95.0 bar in the methanol plant (with a corresponding recycle ratio of 3.053). The reason why the optimal pressures are not lower (and the recycle ratio higher) is that a lower pressure reduces the fraction of fuel that is condensed when cooling the product gas before the gas-liquid separator (a higher recycle ratio also has this effect because it lowers the partial pressure of methanol/DME in the reactor product gas). In the methanol plant, the optimal synthesis pressure corresponds to the point where just enough waste heat is available to preheat the gas to the expander to the maximum obtainable temperature (30°C below the gas engine exhaust temperature).
52 The same fuel output is on a methanol equivalence basis. This means that the fuel output from the DME plant was converted to a methanol equivalence by using the following relation: 1 mole of DME = 2 moles of methanol. 53 Defined as: (mole flow to reactor) / (mole flow of fresh syngas)
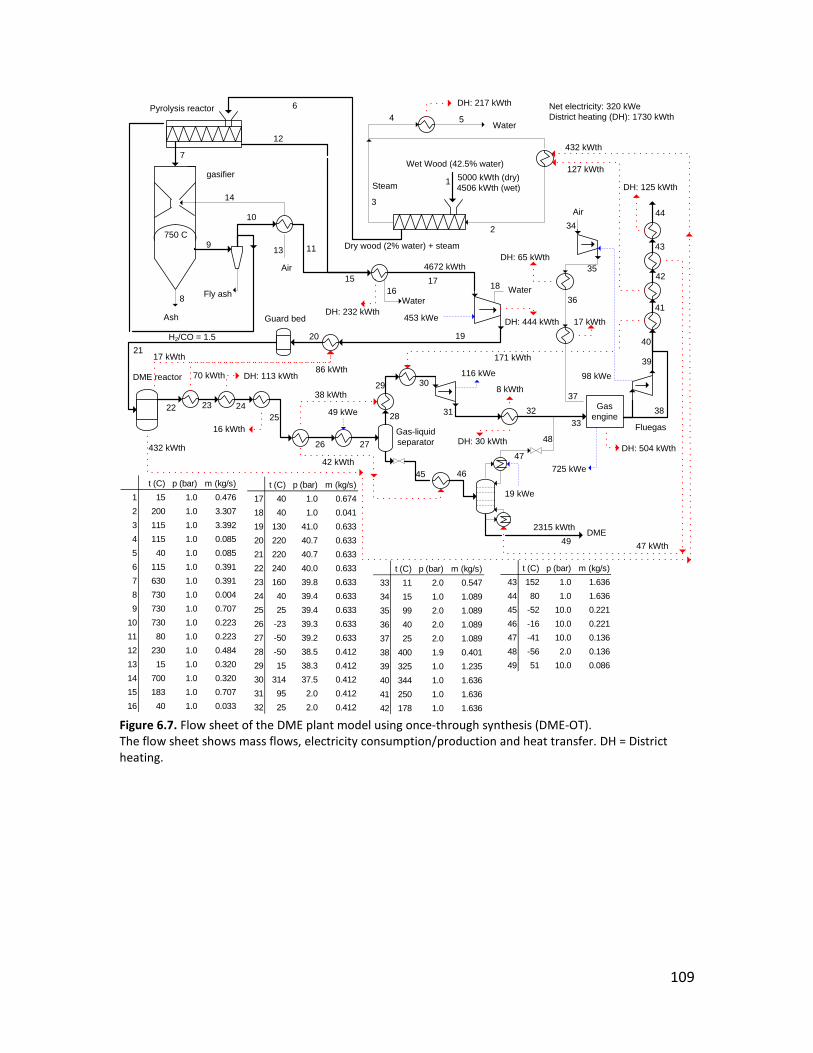
109
Figure 6.7. Flow sheet of the DME plant model using once-through synthesis (DME-OT). The flow sheet shows mass flows, electricity consumption/production and heat transfer. DH = District heating.
Fly ash
Wet Wood (42.5% water)
DME reactor
Gas-liquid separator
22 Gas engine
Air
DME
Fluegas
5000 kWth (dry)4506 kWth (wet)
432 kWth
453 kWeAsh
725 kWe
gasifier
750 C
1
Water
Steam
Dry wood (2% water) + steam
Pyrolysis reactor
Air
11
12
15 17
6
3
7
2
Guard bed
70 kWth
23
DH: 113 kWth
DH: 504 kWth
DH: 444 kWthDH: 232 kWth
33
9
10
14
16
127 kWth
Water18
20
38
Water
DH: 217 kWth
4
27
46
19 kWe
29
28
42 kWth
49 kWe
38 kWth
21
25
26
16 kWth
116 kWe 98 kWe
19
5
8
13
31 32
36
37
39
40
41
42
43
47
48
49
t (C) p (bar) m (kg/s)17 40 1.0 0.67418 40 1.0 0.04119 130 41.0 0.63320 220 40.7 0.63321 220 40.7 0.63322 240 40.0 0.63323 160 39.8 0.63324 40 39.4 0.63325 25 39.4 0.63326 -23 39.3 0.63327 -50 39.2 0.63328 -50 38.5 0.41229 15 38.3 0.41230 314 37.5 0.41231 95 2.0 0.41232 25 2.0 0.412
t (C) p (bar) m (kg/s)43 152 1.0 1.63644 80 1.0 1.63645 -52 10.0 0.22146 -16 10.0 0.22147 -41 10.0 0.13648 -56 2.0 0.13649 51 10.0 0.086
t (C) p (bar) m (kg/s)1 15 1.0 0.4762 200 1.0 3.3073 115 1.0 3.3924 115 1.0 0.0855 40 1.0 0.0856 115 1.0 0.3917 630 1.0 0.3918 730 1.0 0.0049 730 1.0 0.707
10 730 1.0 0.22311 80 1.0 0.22312 230 1.0 0.48413 15 1.0 0.32014 700 1.0 0.32015 183 1.0 0.70716 40 1.0 0.033
t (C) p (bar) m (kg/s)33 11 2.0 0.54734 15 1.0 1.08935 99 2.0 1.08936 40 2.0 1.08937 25 2.0 1.08938 400 1.9 0.40139 325 1.0 1.23540 344 1.0 1.63641 250 1.0 1.63642 178 1.0 1.636
432 kWth
30
44
171 kWth
35
24
47 kWth
8 kWth
DH: 30 kWth
17 kWth
DH: 65 kWth
34
DH: 125 kWth
45
Net electricity: 320 kWeDistrict heating (DH): 1730 kWth
4672 kWth
H2/CO = 1.5
2315 kWth
17 kWth86 kWth
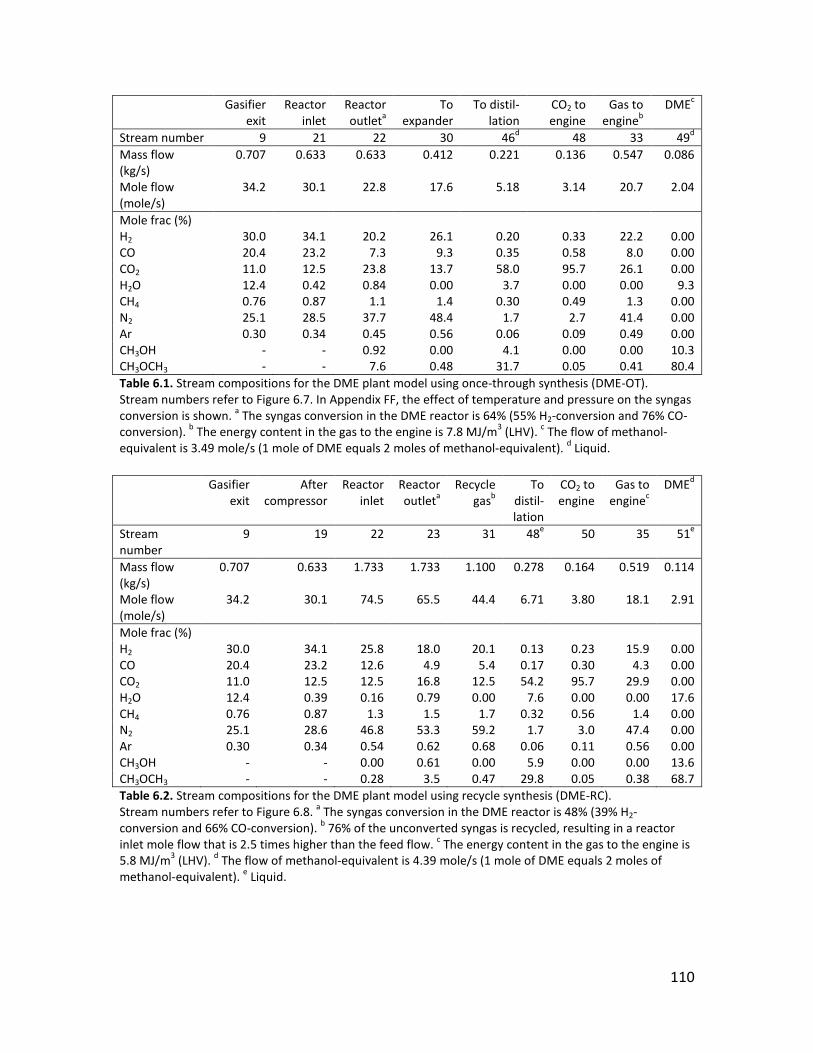
110
Gasifier exit
Reactor inlet
Reactor outleta
To expander
To distil-lation
CO2 to engine
Gas to engineb
DMEc
Stream number 9 21 22 30 46d 48 33 49d Mass flow (kg/s)
0.707 0.633 0.633 0.412 0.221 0.136 0.547 0.086
Mole flow (mole/s)
34.2 30.1 22.8 17.6 5.18 3.14 20.7 2.04
Mole frac (%) H2 30.0 34.1 20.2 26.1 0.20 0.33 22.2 0.00 CO 20.4 23.2 7.3 9.3 0.35 0.58 8.0 0.00 CO2 11.0 12.5 23.8 13.7 58.0 95.7 26.1 0.00 H2O 12.4 0.42 0.84 0.00 3.7 0.00 0.00 9.3 CH4 0.76 0.87 1.1 1.4 0.30 0.49 1.3 0.00 N2 25.1 28.5 37.7 48.4 1.7 2.7 41.4 0.00 Ar 0.30 0.34 0.45 0.56 0.06 0.09 0.49 0.00 CH3OH - - 0.92 0.00 4.1 0.00 0.00 10.3 CH3OCH3 - - 7.6 0.48 31.7 0.05 0.41 80.4 Table 6.1. Stream compositions for the DME plant model using once-through synthesis (DME-OT). Stream numbers refer to Figure 6.7. In Appendix FF, the effect of temperature and pressure on the syngas conversion is shown. a The syngas conversion in the DME reactor is 64% (55% H2-conversion and 76% CO-conversion). b The energy content in the gas to the engine is 7.8 MJ/m3 (LHV). c The flow of methanol-equivalent is 3.49 mole/s (1 mole of DME equals 2 moles of methanol-equivalent). d Liquid. Gasifier
exit After
compressor Reactor
inlet Reactor outleta
Recycle gasb
To distil-lation
CO2 to engine
Gas to enginec
DMEd
Stream number
9 19 22 23 31 48e 50 35 51e
Mass flow (kg/s)
0.707 0.633 1.733 1.733 1.100 0.278 0.164 0.519 0.114
Mole flow (mole/s)
34.2 30.1 74.5 65.5 44.4 6.71 3.80 18.1 2.91
Mole frac (%) H2 30.0 34.1 25.8 18.0 20.1 0.13 0.23 15.9 0.00 CO 20.4 23.2 12.6 4.9 5.4 0.17 0.30 4.3 0.00 CO2 11.0 12.5 12.5 16.8 12.5 54.2 95.7 29.9 0.00 H2O 12.4 0.39 0.16 0.79 0.00 7.6 0.00 0.00 17.6 CH4 0.76 0.87 1.3 1.5 1.7 0.32 0.56 1.4 0.00 N2 25.1 28.6 46.8 53.3 59.2 1.7 3.0 47.4 0.00 Ar 0.30 0.34 0.54 0.62 0.68 0.06 0.11 0.56 0.00 CH3OH - - 0.00 0.61 0.00 5.9 0.00 0.00 13.6 CH3OCH3 - - 0.28 3.5 0.47 29.8 0.05 0.38 68.7 Table 6.2. Stream compositions for the DME plant model using recycle synthesis (DME-RC). Stream numbers refer to Figure 6.8. a The syngas conversion in the DME reactor is 48% (39% H2-conversion and 66% CO-conversion). b 76% of the unconverted syngas is recycled, resulting in a reactor inlet mole flow that is 2.5 times higher than the feed flow. c The energy content in the gas to the engine is 5.8 MJ/m3 (LHV). d The flow of methanol-equivalent is 4.39 mole/s (1 mole of DME equals 2 moles of methanol-equivalent). e Liquid.

111
Figure 6.8. Flow sheet of the DME plant model using recycle synthesis (DME-RC). The flow sheet shows mass flows, electricity consumption/production and heat transfer. DH = District heating.
Fly ash
Wet Wood (42.5% water)
DME reactor
Gas-liquid separator
23 Gas engine
Air
DME
Fluegas
5000 kWth (dry)4506 kWth (wet)
474 kWth
469 kWeAsh
464 kWe
gasifier
750 C
1
Water
Steam
Dry wood (2% water) + steam
Pyrolysis reactor
Air
11
12
15 17
6
3
7
2
Guard bed
322 kWth
24
DH: 155 kWth
DH: 245 kWth
DH: 457 kWthDH: 232 kWth
35
9
10
14
16
85 kWth
Water18
21
40
Water
DH: 217 kWth
4
28
48
23 kWe
30
29
72 kWth
54 kWe
129 kWth
2022
26
2741 kWth
143 kWth98 kWe 64 kWe
32
19
5
8
13
33 34
38
39
41
42
43
44
45
49
50
51
t (C) p (bar) m (kg/s)18 40 1.0 0.04119 133 46.0 0.63320 69 46.0 1.73321 220 45.5 1.73322 220 45.5 1.73323 240 44.7 1.73324 99 44.2 1.73325 40 43.9 1.73326 25 43.9 1.73327 -37 43.8 1.73328 -50 43.7 1.73329 -50 42.9 1.45430 15 42.7 1.45431 26 47.7 1.10032 321 41.7 0.35533 93 2.0 0.35534 25 2.0 0.355
t (C) p (bar) m (kg/s)45 152 1.0 1.23246 80 1.0 1.23247 -51 10.0 0.27848 -5 10.0 0.27849 -41 10.0 0.16450 -56 2.0 0.16451 54 10.0 0.114
t (C) p (bar) m (kg/s)1 15 1.0 0.4762 200 1.0 3.3073 115 1.0 3.3924 115 1.0 0.0855 40 1.0 0.0856 115 1.0 0.3917 630 1.0 0.3918 730 1.0 0.0049 730 1.0 0.707
10 730 1.0 0.22311 80 1.0 0.22312 230 1.0 0.48413 15 1.0 0.32014 700 1.0 0.32015 183 1.0 0.70716 40 1.0 0.03317 40 1.0 0.674
t (C) p (bar) m (kg/s)35 6 2.0 0.51936 15 1.0 0.71337 99 2.0 0.71338 40 2.0 0.71339 25 2.0 0.71340 400 1.9 0.41141 326 1.0 0.82142 351 1.0 1.23243 246 1.0 1.23244 182 1.0 1.232
474 kWth
46
37
25
40 kWth
7 kWth
DH: 24 kWth
11 kWth
DH: 43 kWth
36
DH: 94 kWth
47
4672 kWth
H2/CO = 1.5
16 kWe
31
2908 kWth
42 kWth365 kWth
Net electricity: 0 kWeDistrict heating (DH): 1467 kWth

112
Figure 6.9. Flow sheet of the methanol plant model using once-through synthesis (MeOH-OT). The flow sheet shows mass flows, electricity consumption/production and heat transfer. DH = District heating.
Fly ash
Wet Wood (42.5 mass% water)
MeOH reactor
Gas-liquid separator
20 Gas engine
Air
MeOH
Fluegas
5000 kWth (dry)4506 kWth (wet)
342 kWth
597 kWeAsh
738 kWe
gasifier
750 C
1
Water
Steam
Dry wood (2% water) + steam
Pyrolysis reactor
Air
9
10
13 15
4
3
5
2
Guard bed
32 kWth
21
DH: 257 kWth
DH: 543 kWth
DH: 561 kWthDH: 412 kWth
28
7
8
12
14
217 kWth
Water16
18
3323
19
155 kWe 100 kWe25
17
6
11
26
31
32
34
35
38
39
42
43
t (C) p (bar) m (kg/s)15 40 1.0 0.69216 40 1.0 0.04417 153 98.1 0.64818 200 97.8 0.64819 200 97.8 0.64820 220 96.0 0.64821 183 95.8 0.64822 40 94.8 0.64823 40 93.0 0.50924 117 92.5 0.50925 313 91.3 0.50926 58 2.0 0.50927 25 2.0 0.50928 25 2.0 0.535
t (C) p (bar) m (kg/s)37 147 1.0 1.63938 116 1.0 1.63939 94 1.0 1.63940 80 1.0 1.63941 40 93.0 0.13942 25 2.0 0.02643 83 2.0 0.113
t (C) p (bar) m (kg/s)1 15 1.0 0.4762 200 1.0 3.3073 115 1.0 3.3074 115 1.0 0.4765 630 1.0 0.4766 730 1.0 0.0047 730 1.0 0.7848 730 1.0 0.2099 80 1.0 0.209
10 236 1.0 0.57511 15 1.0 0.31312 700 1.0 0.31313 195 1.0 0.78414 40 1.0 0.092
t (C) p (bar) m (kg/s)29 15 1.0 1.10430 99 2.0 1.10431 40 2.0 1.10432 25 2.0 1.10433 400 1.9 0.38434 325 1.0 1.25535 343 1.0 1.63936 269 1.0 1.639
342 kWth
40
55 kWth
30
22
38 kWth
17 kWth
DH: 66 kWth
29
DH: 24 kWth
41
2230 kWth
17 kWth
Net electricity: 296 kWeDistrict heating (DH): 1863 kWth
4647 kWth
H2/CO = 2.0
36
37
24
27
20 kWth
135 kWth17 kWth
49 kWth

113
Gasifier exit
Reactor inlet
Reactor outleta
To expander
To distil-lation
CO2 to engine
Gas to engineb
MeOHc
Stream number 7 19 20 25 41d 42 28 43d Mass flow (kg/s) 0.784 0.648 0.648 0.509 0.139 0.026 0.535 0.113 Mole flow (mole/s) 38.7 31.1 23.7 19.5 4.19 0.63 20.2 3.57 Mole frac (%) H2 29.9 37.1 17.5 21.2 0.15 0.99 20.6 0.00 CO 14.9 18.6 8.8 10.6 0.13 0.85 10.3 0.00 CO2 12.8 15.9 20.9 22.7 12.7 85.4 24.6 0.00 H2O 19.7 0.24 0.32 0.01 1.8 0.00 0.01 2.1 CH4 0.71 0.88 1.2 1.4 0.08 0.53 1.4 0.00 N2 21.7 27.0 35.4 42.9 0.52 3.5 41.6 0.00 Ar 0.26 0.32 0.42 0.51 0.02 0.13 0.49 0.00 CH3OH - - 15.6 0.77 84.6 8.6 1.0 97.9 Table 6.3. Stream compositions for the methanol plant model using once-through synthesis (MeOH-OT). Stream numbers refer to Figure 6.9. In Appendix FF, the effect of temperature and pressure on the syngas conversion is shown. a The syngas conversion in the methanol reactor is 64% (64% H2-conversion and 64% CO-conversion). b The energy content in the gas to the engine is 7.8 MJ/m3 (LHV). c The flow of methanol is 3.49 mole/s. d Liquid. Gasifier
exit After
compres-sor
Reactor inlet
Reactor outleta
Recycle gasb
To distil-lation
CO2 to engine
Gas to enginec
MeOHd
Stream number
7 18 21 22 26 43e 44 31 45e
Mass flow (kg/s)
0.784 0.648 2.391 2.391 1.743 0.180 0.035 0.504 0.145
Mole flow (mole/s)
38.7 31.1 92.5 83.3 61.3 5.45 0.83 17.3 4.62
Mole frac (%)
H2 29.9 37.1 21.3 12.5 13.3 0.09 0.58 12.7 0.00 CO 14.9 18.6 11.6 7.5 8.1 0.09 0.59 7.7 0.00 CO2 12.8 15.9 21.8 24.0 24.8 13.1 85.8 27.7 0.00 H2O 19.7 0.24 0.09 0.29 0.01 4.2 0.00 0.01 4.9 CH4 0.71 0.88 1.4 1.5 1.6 0.09 0.57 1.6 0.00 N2 21.7 27.0 42.7 47.4 50.7 0.57 3.7 48.5 0.00 Ar 0.26 0.32 0.50 0.56 0.60 0.02 0.14 0.58 0.00 CH3OH - - 0.52 6.1 0.78 81.8 8.6 1.2 95.1 Table 6.4. Stream compositions for the methanol plant model using recycle synthesis (MeOH-RC). Stream numbers refer to Figure 6.10. a The syngas conversion in the methanol reactor is 45% (47% H2-conversion and 42% CO-conversion). b 79% of the unconverted syngas is recycled, resulting in a reactor inlet mole flow that is 3.0 times higher than the feed flow. c The energy content in the gas to the engine is 5.9 MJ/m3 (LHV). d The flow of methanol is 4.39 mole/s. e Liquid.

114
Figure 6.10. Flow sheet of the methanol plant model using recycle synthesis (MeOH-RC). The flow sheet shows mass flows, electricity consumption/production and heat transfer. DH = District heating. From the flow sheets above, energy efficiencies such as the biomass to DME/methanol efficiency, or the biomass to net electricity, can be calculated - in section 6.2.3, these energy efficiencies are presented and discussed. The flow sheets also show the gross electricity production for the gas engine and the expander, along with the process electricity consumptions. In section 6.2.2, the plants electricity productions and consumptions are compared and discussed. The plant design shown in the flow sheets are more detailed than the ones shown in Figure 6.1 and Figure 6.2. The main differences concern the waste heat utilization for district heating production, and further heat integration than described in section 6.1. In section 6.2.1, the waste heat utilization is described further.
Fly ash
Wet Wood (42.5% water)
MeOH reactor
Gas-liquid separator
22 Gas engine
Air
MeOH
Fluegas
5000 kWth (dry)4506 kWth (wet)
352 kWth
596 kWe
Ash
479 kWe
gasifier
750 C
1
Water
Steam
Dry wood (2% water) + steam
Pyrolysis reactor
Air
9
10
14 16
4
3
5
2
Guard bed
337 kWth
23
DH: 379 kWth
DH: 291 kWth
DH: 560 kWthDH: 312 kWth
31
7
8
13
15
207 kWth
Water17
20
3625
21
132 kWe 66 kWe28
18
6
12
30
34
35
37
38
39
40
44
45
t (C) p (bar) m (kg/s)15 40 1.0 0.09216 40 1.0 0.69217 40 1.0 0.04418 153 97.6 0.64819 80 97.6 2.39120 200 96.8 2.39121 200 96.8 2.39122 220 95.0 2.39123 110 94.3 2.39124 40 93.8 2.39125 40 92.0 2.21126 47 99.0 1.74327 206 90.9 0.46928 320 90.2 0.469
t (C) p (bar) m (kg/s)38 350 1.0 1.23339 301 1.0 1.23340 145 1.0 1.23341 106 1.0 1.23342 80 1.0 1.23343 40 92.0 0.18044 25 2.0 0.03545 84 2.0 0.145
t (C) p (bar) m (kg/s)1 15 1.0 0.4762 200 1.0 3.3073 115 1.0 3.3074 115 1.0 0.4765 630 1.0 0.4766 730 1.0 0.0047 730 1.0 0.7848 730 1.0 0.2099 80 1.0 0.209
10 236 1.0 0.57511 127 1.0 0.57512 15 1.0 0.31313 700 1.0 0.31314 114 1.0 0.784
t (C) p (bar) m (kg/s)29 64 2.0 0.46930 25 2.0 0.46931 25 2.0 0.50432 15 1.0 0.73033 99 2.0 0.73034 40 2.0 0.73035 25 2.0 0.73036 400 1.9 0.38937 326 1.0 0.844
352 kWth
42
67 kWth
33
24
50 kWth
11 kWth
DH: 44 kWth
32
DH: 34 kWth
43
2803 kWth
23 kWth
2619
Net electricity: 0 kWeDistrict heating (DH): 1620 kWth
4647 kWth
H2/CO = 2.0
27
100 kWthP-284
15 kWe
29
20 kWth
41
11
56 kWth393 kWth

115
6.2.1 Heat integration and district heating production Besides the main heat integration described in section 6.1, the plants are further heat integrated. This is described in section 6.2.1.1 below. The waste heats that cannot be utilized within the plants are used for district heating production. This is described in section 6.2.1.2 below.
6.2.1.1 Heat integration The heat integration in the DME plants and the methanol plants share some aspects – this includes: • Preheating the syngas feed to the DME/methanol reactor by cooling the product gas
from the DME/methanol reactor. • Heating the reboilers in the distillation of DME/methanol with waste heat from the
gas engine exhaust. Besides this, the DME plants are further heat integrated by: • Precooling the product gas from the DME reactor before it is cooled by a
refrigeration plant, by using cold mass flows of gas and liquid, available from the gas liquid separator. This reduces the required duty of the refrigeration plant.
6.2.1.2 District heating production All waste heats generated in the plants that are not utilized by heat integration is used for district heating production. In Figure 6.11, all the sources of district heating are listed – these sources can also be found in the flow sheets (Figure 6.7 to Figure 6.10).

116
Figure 6.11. District heating production in the DME/methanol plants. All values are taken from the flow sheets (Figure 6.7 to Figure 6.10). Figure 6.11 shows that all plants have a substantial production of district heating, but that most are produced in the OT plants because of the extra waste heat generated by the gas engine. The figure also shows that the methanol plants produce more heat than the DME plants (MeOH-RC vs. DME-RC and MeOH-OT vs. DME-OT). This is because of: 1. the compressor intercooling due to the higher operating pressure, 2. the cooling of the syngas from the methanol/DME reactor due to the condensation of methanol when cooling to 40°C. In section 5.2.3 below, it can be seen how important the district heating production is for the total energy efficiency.
1620
44
34
291
0
379
560
312
0
1863
66
24
543
0
257
561
412
0
1467
43
94
245
24
155
457
232
217
1730
65
125
504
30
113
444
232
217
0 200 400 600 800 1000 1200 1400 1600 1800 2000
District heating total
Air from turbocharger
Gas engine exhaust
Gas engine
Gas to engine
Product gas from DME/methanol reactor
Syngas compressor intercooling
Syngas cooling before compressor
Excess steam from steam dryer
Heat [kWth]
DME-OT
DME-RC
MeOH-OT
MeOH-RC

117
6.2.2 Coproduct electricity The DME/methanol plants utilize the unconverted syngas from the synthesis of methanol/DME in a gas engine for production of electricity. A gas engine was considered to be the optimal solution for plants of this size. Besides the electricity production from the gas engine, an expander turbine is used for utilizing the high pressure in the unconverted syngas, before it is fed to the gas engine at 2 bar. From Figure 6.12, the electricity production of these two components can be seen, together with the gross electricity production in the plants. The figure shows that the gas engine produces the most electricity, but that the expander turbine increases the gross electricity production with 98-155 kWe, corresponding to an increase of the biomass to electricity energy efficiency of 2-3%-points (5000 kWth input of biomass). Another way to put it, is that the expander increases the efficiency of the conversion of unconverted syngas to electricity from 38% (gas engine efficiency) to 44-48% (depending on the heating value of the gas: 5.8-7.8 MJ/m3). The output from the expander turbine is higher in the methanol plants due to a higher mass flow of gas to the expander. This is because some of the CO2 in the unconverted syngas in the DME plants is absorbed in the liquid DME.
Figure 6.12. Electricity production in the DME/methanol plants. All values are taken from the flow sheets (Figure 6.7 to Figure 6.10). Operating a gas engine on unconverted syngas from a DME synthesis results in a certain DME content in the gas to the engine (0.4 mole%). Because DME is a diesel fuel this may result in problems if the engine is operated with a high compression ratio.
6.2.2.1 On-site electricity consumptions The electricity produced in the DME/methanol plants is used to cover the on-site electricity consumption and for export to the grid. In Figure 6.13, the plant electricity consumptions are listed, and the figure clearly shows that the most important electricity consumption is by the syngas compressor. The electricity consumption by the syngas compressor is therefore discussed below.
611
132
479
893
155
738
562
98
464
841
116
725
0 100 200 300 400 500 600 700 800 900 1000
Gross electricity production
Expander
Gas engine
Power [kWe]
DME-OTDME-RCMeOH-OTMeOH-RC
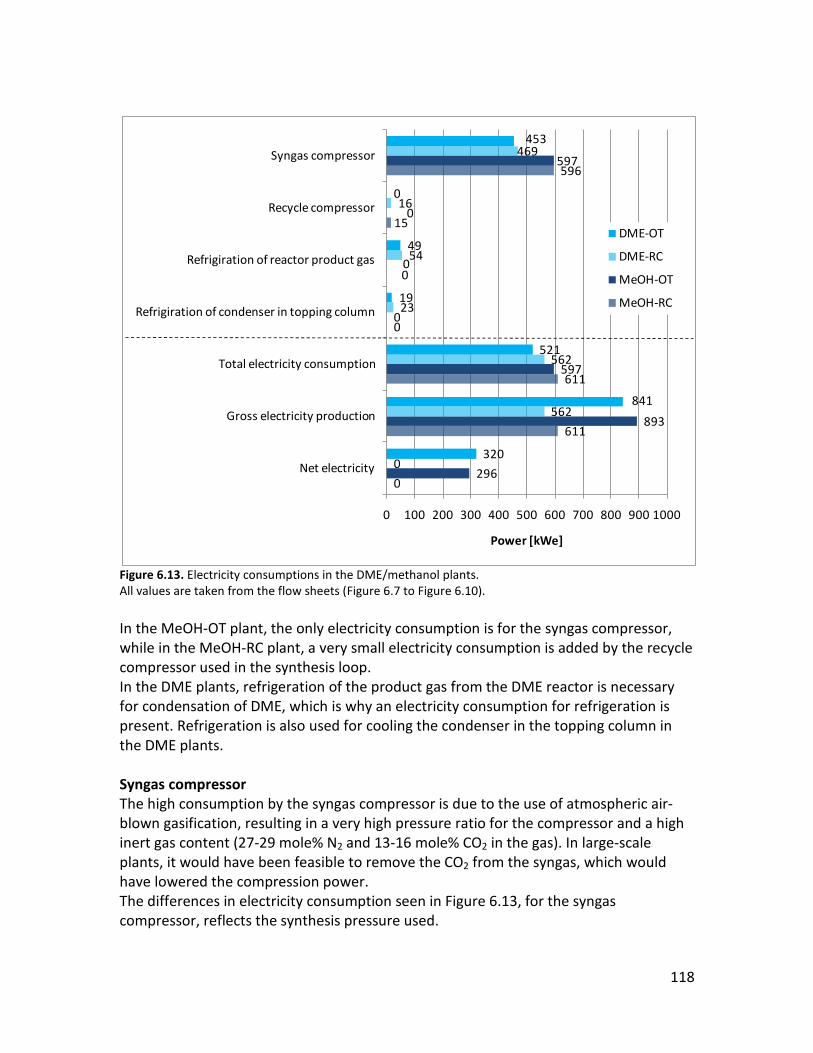
118
Figure 6.13. Electricity consumptions in the DME/methanol plants. All values are taken from the flow sheets (Figure 6.7 to Figure 6.10). In the MeOH-OT plant, the only electricity consumption is for the syngas compressor, while in the MeOH-RC plant, a very small electricity consumption is added by the recycle compressor used in the synthesis loop. In the DME plants, refrigeration of the product gas from the DME reactor is necessary for condensation of DME, which is why an electricity consumption for refrigeration is present. Refrigeration is also used for cooling the condenser in the topping column in the DME plants. Syngas compressor The high consumption by the syngas compressor is due to the use of atmospheric air-blown gasification, resulting in a very high pressure ratio for the compressor and a high inert gas content (27-29 mole% N2 and 13-16 mole% CO2 in the gas). In large-scale plants, it would have been feasible to remove the CO2 from the syngas, which would have lowered the compression power. The differences in electricity consumption seen in Figure 6.13, for the syngas compressor, reflects the synthesis pressure used.
0
611
611
0
0
15
596
296
893
597
0
0
0
597
0
562
562
23
54
16
469
320
841
521
19
49
0
453
0 100 200 300 400 500 600 700 800 900 1000
Net electricity
Gross electricity production
Total electricity consumption
Refrigiration of condenser in topping column
Refrigiration of reactor product gas
Recycle compressor
Syngas compressor
Power [kWe]
DME-OT
DME-RC
MeOH-OT
MeOH-RC

119
In the modeling of the syngas compressor the following parameters were assumed: ηpolytropic = 80%, ηmechanical = 94%. ηelectrical = 100% A polytropic efficiency of 80%, which is also used for the syngas compressor in the large-scale plants, may be too optimistic, even though higher polytropic efficiencies can be achieved at lower pressures. In Figure 6.14, the effect of varying the polytropic efficiency can be seen for the MeOH-OT plant. If a polytropic efficiency of 70% was used, the plant net electricity would be reduced from 296 kWe to 195 kWe, corresponding to a decrease in biomass to net electricity efficiency of 2%-point.
Figure 6.14. The electricity consumption of the syngas compressor in the MeOH-OT plant as a function of the polytropic efficiency.
6.2.3 Energy efficiencies Usually the total energy efficiency for a liquid fuels plant would be the feedstock to liquid fuel + net electricity efficiency, but because the small-scale DME/methanol plants utilize plant waste heat for district heating production, the total energy efficiency also includes the district heating production. In Figure 6.15, the energy efficiencies for the modeled DME/methanol plants can be seen, and the figure shows that the total energy efficiencies are 87-88%. The fuel + net electricity efficiencies are 51-58%, with the RC plants achieving 56-58%. The fuels effective efficiencies are almost identical to the fuel + net electricity efficiencies, which of course should be the case for the RC plants because there is no net electricity production – but the reason why they are almost identical for the OT plants, is that the fuel + net electricity efficiencies are 51-53%, which is almost the same as the electric efficiency assumed in the calculation of the FEE (50%). Since the fuels effective efficiency is the fairest way of comparing liquid fuels plants, the results show that the RC plants should be preferred because they are more energy
0
100
200
300
400
500
600
700
800
900
60 65 70 75 80 85 90
Pow
er [k
We]
Polytropic efficiency [%]
Used value
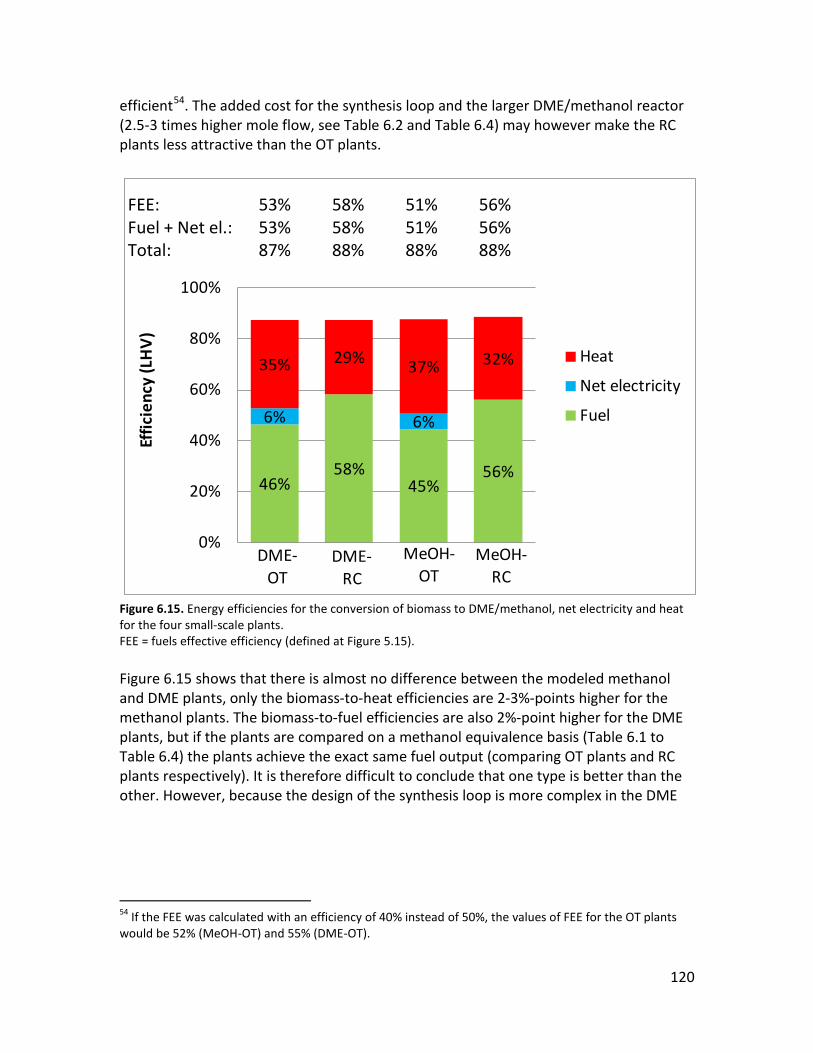
120
46%58%
45%56%
6% 6%
35% 29% 37% 32%
0%
20%
40%
60%
80%
100%
Effic
ienc
y (L
HV
)
Heat
Net electricity
Fuel
DME-RC
MeOH-OT
MeOH-RC
DME-OT
efficient54
Table 6.2. The added cost for the synthesis loop and the larger DME/methanol reactor
(2.5-3 times higher mole flow, see and Table 6.4) may however make the RC plants less attractive than the OT plants. FEE: 53% 58% 51% 56% Fuel + Net el.: 53% 58% 51% 56% Total: 87% 88% 88% 88%
Figure 6.15. Energy efficiencies for the conversion of biomass to DME/methanol, net electricity and heat for the four small-scale plants. FEE = fuels effective efficiency (defined at Figure 5.15). Figure 6.15 shows that there is almost no difference between the modeled methanol and DME plants, only the biomass-to-heat efficiencies are 2-3%-points higher for the methanol plants. The biomass-to-fuel efficiencies are also 2%-point higher for the DME plants, but if the plants are compared on a methanol equivalence basis (Table 6.1 to Table 6.4) the plants achieve the exact same fuel output (comparing OT plants and RC plants respectively). It is therefore difficult to conclude that one type is better than the other. However, because the design of the synthesis loop is more complex in the DME
54 If the FEE was calculated with an efficiency of 40% instead of 50%, the values of FEE for the OT plants would be 52% (MeOH-OT) and 55% (DME-OT).

121
plants and a refrigeration plant is needed in the synthesis loop and for the topping column, a methanol plant may be more suited for small-scale production55
The modeled plants achieve biomass to liquid fuels efficiencies similar to large-scale plants using recycle synthesis, where almost all the chemical energy in the syngas is converted to liquid fuel. However, in these small-scale plants an almost full conversion of the syngas to liquid fuel is not possible because of the high inert content in the syngas. The reason for the high biomass to liquid fuels efficiencies are instead the very efficient gasifier used. This is discussed further below.
6.2.3.1 Chemical energy flows Figure 6.16 shows how the chemical energy stored in the biomass is first converted to chemical energy in the syngas, and then converted to chemical energy stored in DME/methanol or to electricity (by a gas engine). The conversion efficiency from biomass to syngas is known as the cold gas efficiency of the gasifier and it is 92.9% in the methanol plants and 93.4% in the DME plants. The reason why the cold gas efficiency is 0.5%-points higher in the DME plants is the lower steam input to the gasifier. The conversion from syngas to DME/methanol is associated with a 7-11% loss in chemical energy (Figure 6.16), and the loss is 2-3%-points higher for DME synthesis compared to the methanol synthesis - corresponding well with the conversion efficiencies given in section 2.3.3 about methanol and DME synthesis. In the RC plants, 24-25% of the chemical energy must be used for electricity production to cover the on-site electricity consumption. In section 6.2.4.2 below, the chemical energy flows for the small-scale and large-scale DME plants are compared.
55 The fact that a higher synthesis pressure is used in the methanol plants may have a negative economic impact on the methanol plants, because of a higher syngas compressor cost, and perhaps higher costs for the synthesis section.

122
Figure 6.16. Chemical energy flows (LHV) in the small-scale DME/methanol plants - including conversion heat losses. The conversion heat loss in the gasification process is used primarily for preheating the inputs to the gasifier (including biomass pyrolysis). The heat loss in the synthesis process is used for steam drying of biomass. Note: In the methanol plants, the sum of the outputs from the synthesis only gives 90% instead of 93%. This is due to the definition of LHV for methanol (liquid at standard conditions). If the heat of vaporization for methanol is added to the LHV for methanol, the “actual” fuel production would be 47% (OT) and 59% (RC) (LHV for methanol: 638.1 MJ/kmole, LHV + heat of vaporization = 676.8 MJ/kmole).
6.2.4 Comparing with other plants Below the small-scale plants are first compared with the simpler reference plants (DME-OT plant in Figure 6.1) and then with the large-scale DME plants presented in the previous chapter.
6.2.4.1 Comparing with the reference plants The difference between the modeled small-scale plants and the reference plants is the expander turbine that was added to increase the electricity production. From Figure 6.1 it is clear that a simpler plant design is obtained if the expander turbine is not used. This would also simplify the heat integration in the plants because the gas engine exhaust would then not have to be used for heating the gas to the expander. In Figure 6.17, the fuel and net electricity efficiencies are compared for the modeled plants and the reference plants. As mentioned earlier, the expander turbine added ~2-3%-points to the
MeOH-OT
45%100% 93%
MeOHWood
7%
GasificationSynthesis
39%Engine7%
MeOH-RC
56%100% 93%
MeOHWood
7%
GasificationSynthesis
25%Engine8%
DME-OT
46%100% 93%
DMEWood
7%
GasificationSynthesis
38%Engine9%
DME-RC
58%100% 93%
DMEWood
7%
GasificationSynthesis
24%Engine11%

123
net electricity output for the OT plants, while it increased the fuel output in the RC plants with ~4-6%-points (Figure 6.17). The fuel output for the RC reference plants were calculated as described below. This corresponds well with more detailed calculations. RC plants It is more difficult to assess the efficiencies for the RC plants compared to the OT plants discussed above. The way the efficiencies were assessed was by comparing the original four plants with the results given for the OT plants. Figure 6.17 shows that the 6% net electricity output for the OT plants is converted to 11-12%-points (58%-46% or 56%-45%) more fuel output for the RC plants. If the same ratio is assumed for the reference plants (without expander turbine), the DME-RC plant will only produce 8%-points more fuel than the DME-OT plant (4% net electricity) – resulting in a fuel output of 54% (46%+8%) of the biomass input. In the same way the MeOH-RC fuel output can be calculated to be 50% of the biomass input.

124
46%58%
45%56%
46%54%
45% 50%
6% 6% 4% 3%
0%
20%
40%
60%
80%
100%
Effic
ienc
y (L
HV
)
Net electricity
Fuel
MeOH-RC
DME-OT
DME-RC
MeOH-OT
Original Reference
MeOH-RC
DME-OT
DME-RC
MeOH-OT
Figure 6.17. Energy efficiencies for the conversion of biomass to DME/methanol and net electricity for the four small-scale plants modeled (“original”) compared with the reference plants (“reference”). The production of district heating is not shown because it is not estimated for the four reference plants, but it will be higher because less electricity is produced. FEE = fuels effective efficiency (definition below Figure 5.15).
6.2.4.2 Comparing with the large scale DME plants In Figure 6.18, the energy efficiencies for the small-scale plants are compared with the energy efficiencies for the large-scale DME plants presented in the previous chapter. The figure shows that the small-scale plants generate higher total efficiencies because heat is co-produced in the small-scale plants. A co-production of heat could also be implemented in the large-scale plants, but it requires a substantial heat demand, such as a relatively big city (400-500 MWth). Figure 6.18 also shows that the fuel + net electricity efficiencies and the FEE’s are higher for the large-scale plants. This is also true if the efficiencies for the large-scale plants are based on untreated biomass instead of torrefied biomass (Figure 5.15). The untreated biomass to fuel efficiencies are however similar (Figure 6.19). The plant electricity consumptions are also compared in Figure 6.18, and the reason for the higher electricity consumptions in the small-scale plants is the syngas compressor.
FEE: 53% 58% 51% 56% 50% 54% 47% 50% Fuel + Net el.: 53% 58% 51% 56% 50% 54% 47% 50%

125
46%58%
45%56% 49%
66%
6% 6%
16%
5%35% 29% 37% 32%
10% 11% 12% 12%
7%7%
0%
20%
40%
60%
80%
100%
Effic
ienc
y (L
HV
)
Electricity consumption
Heat
Net electricity
Fuel
MeOH-RC
DME-OT
DME-RC
MeOH-OT
DME-RC-L
DME-OT-L
Figure 6.18. Energy efficiencies for the conversion of biomass to DME/methanol and electricity for the four small-scale plants compared with the two large-scale DME plants. Electricity consumption + net electricity = gross electricity production. FEE = fuels effective efficiency (defined at Figure 5.15). Note: the efficiencies shown for the large-scale plants are based on torrefied biomass – if the efficiencies were based on untreated biomass they would be lower (Figure 6.19). In Figure 6.19, the chemical energy flows in the small-scale DME plants are compared with the large-scale plants. The figure shows that the untreated biomass to fuel efficiencies are almost the same for the two DME-RC plants (58% and 59%). The reasons why the relatively high efficiencies are achieved are however different: In the small-scale RC plant, it is because of a very energy efficient gasifier (cold gas efficiency of 93%), whereas in the large-scale RC plant, it is because almost all the syngas is converted to DME. In the small-scale DME-RC plant it is not possible to convert more of the syngas to DME because the gas engine needs 24% of the chemical energy for electricity production to cover the on-site electricity consumption. The reasons why so much chemical energy must be used for electricity production is the high electricity consumption by the syngas compressor and the low conversion efficiency of the gas engine compared with a gas turbine combined cycle, but also because no waste heat is used for electricity production. The high inert content in the syngas also makes a higher conversion difficult. It should be noted that if the torrefaction was done on-site in the large-scale plants, the untreated biomass to fuel efficiency would increase to 66% (or more) for the RC plant (same as torrefied biomass to DME) because the volatile gasses released in the torrefaction could be sent to the gasifier and the heat needed for drying and
FEE: 53% 58% 51% 56% 72% 73% Fuel + Net el.: 53% 58% 51% 56% 65% 71% Total 87% 88% 88% 88% 65% 71%

126
torrefaction could be supplied by plant waste heat56
. This would however lower the net electricity efficiency and the logistic (economic) benefits of transporting torrefied biomass pellets would disappear.
Figure 6.19. Chemical energy flows (LHV) in the small-scale DME/methanol plants - including conversion heat losses. The conversion heat losses in the small-scale plants are used for preheating the inputs to the gasifier (including biomass pyrolysis) and for steam drying of biomass. The conversion heat losses in the large-scale plants (excluding the torrefaction heat loss) are used by the integrated steam plant to produce electricity. The torrefaction process does not occur in the DME plants, but decentralized. WGS = water gas shift.
6.3 Summary Small-scale synthesis of DME/methanol was investigated because this enabled the use of the highly energy efficient Two-Stage Gasifier and increased the possibility of efficiently utilizing a district heating co-production. Synthesis plants are however typically large-scale because economy of scale is very important for synthesis plants. The small-scale DME and methanol plants showed to be able to produce biomass to DME/methanol efficiencies of 45-46% when using once-through (OT) synthesis and 56-58% when using recycle (RC) synthesis. If the net electricity production is included the efficiencies increase to 51-53% for the OT plants - the net electricity production is zero
56 About 10% of the biomass input energy is needed for steam drying (see e.g. Figure 6.9): 10% of 2302 MWth is 230 MWth – the DME reactor generates 282 MWth of waste heat.
DME-OT
46%100% 93%
DMEWood
7%
GasificationSynthesis
38%Engine9%
DME-RC
58%100% 93%
DMEWood
7%
GasificationSynthesis
24%Engine11%
44%100% 90%
DMEWood
DME-OT (large-scale)
Torrefaction
10%
Gasification
73%
WGS
70%
17%
Synthesis
18% Gas turbine8%3%
59%100% 90%
DMEWood
Torrefaction
10%
Gasification
73%
WGS
71%
17%
Synthesis
1% Off-gas boiler
11%2%
DME-RC (large-scale)

127
in the RC plants. The total energy efficiencies of the plants achieved 87-88% by utilizing plant waste heat for district heating. The added expander turbine showed to increase the biomass to electricity efficiency with 2-3% points in the OT-plants, while the biomass to DME/methanol efficiency was increased with 4-6% in the RC plants. Because the thermodynamic performance showed to be very similar for the DME and methanol plants, and the plant design of the DME plants more complex, mainly due to the refrigeration duty needed, it was concluded that the methanol plants were slightly more preferable than the DME plants. The energy efficiencies achieved for biomass to methanol/DME + electricity were 6-8%-points lower than what could be achieved by the large-scale DME plants. The main reason for this difference showed to be the use of air-blown gasification at atmospheric pressure in the small-scale plants because this results in high syngas compressor duties and high inert content in the synthesis reactor. However, the use of a gas engine operating on unconverted syngas to cover the on-site electricity consumption also limits how much of the syngas that can be converted to liquid fuel. The reason why the difference between the small-scale and the large-scale plants showed not to be greater, was the high cold gas efficiency of the gasifier used in the small-scale plants (93%).

128
7. Alternative designs of DME/methanol synthesis plants
In this chapter, alternative plant designs for DME and methanol synthesis plants are presented. These alternative plant designs are very similar to the plant designs presented in the previous chapters, but differ by using electrolysis of water for oxygen and hydrogen production (Figure 7.1). The reasons why plant concepts incorporating electrolysis of water are investigated, are because these plants:
• Enable an almost complete utilization of the carbon in the biomass for DME/methanol production, resulting in DME/methanol yields that are higher than the biomass input (energy basis).
• Enable the use of surplus/cheap electricity from fluctuating renewables, such as wind turbines, by coupling the water electrolysis with gas storages for hydrogen and oxygen57
• Do not need an air separation unit (ASU) because sufficient oxygen is produced by water electrolysis.
.
Figure 7.1. Simplified flow sheet for a DME/methanol synthesis plant based on biomass gasification and electrolysis of water. Using external hydrogen, to enable an almost complete utilization of the carbon in the biomass, implies that also the CO2 in the gas from the gasifier is converted to DME/methanol. Conversion of CO2 to methanol/DME can be done with commercial catalyst, but results in lower syngas conversions per pass, lower reaction rates, higher water content in the raw product58
57 Another possibility is to have the entire synthesis plant follow the load changes of the water electrolysis - this is investigated in [Mignard et al., 2008].
and increased rate of catalyst deactivation [Hansen
58 If methanol is produced from H2 and CO2, one mole of water is produced per mole of methanol (eq. 8). If DME is produced from H2 and CO2, three moles of water is produced per mole of DME (eqs. 8 and 9).
GasificationPretreatment
Gas cleaning and conditioning
Synthesis
Syngas
Separation and purification
Electricity production
Biomass
DME/methanol
Unconverted syngas
Water
O2
Sulfur
Electrolysis
Water
H2
CO2

129
et al., 2008]. In Figure 7.2, the H2 conversion for production of DME/methanol from H2 and CO2 can be seen. If compared with synthesis of DME/methanol from H2 and CO (Figure 4.5 and Figure 4.6), it can be seen that much lower conversions are achieved per pass of the reactor. In section 7.2 below, it is shown how almost all the carbon in the biomass can be utilized for methanol production, without having to synthesize methanol from CO2.
Figure 7.2. H2 conversion for DME (left) and methanol (right) synthesis as a function of the reactor outlet temperature and the reactor pressure. The approach temperatures used are listed above Figure 4.5. The syngas had a H2/CO2-ratio of 3 (75% H2, 25% CO2). Note: the lines for high pressure are not shown for low temperatures because at these temperatures condensation occurs. Condensing methanol synthesis is a way to increase the conversion per pass by circumventing the equilibrium barrier [Hansen et al., 2008] - but it is not considered here. In section 7.1 below, several plant concepts based on using electrolysis of water for methanol production are presented. Some of these plants concepts also use natural gas or biogas for methanol production, and one of the concepts only use CO2 (and H2 from water electrolysis). Using electrolysis of water in a biomass synthesis plant has been investigated in the literature because of the reasons listed in the beginning of the chapter. This includes the following references: [Ouellette et al., 1995], [Specht et al., 1999], [Mignard et al., 2008] and [Gassner et al., 2008]. None of these references investigated how production of methanol/DME can be achieved without using a CO2-rich syngas (as done in section 7.2 below).
7.1 Methanol synthesis based on gasification of biomass, electrolysis of water and steam reforming of a hydrocarbon gas
In this section, six different methanol plant concepts based on gasification of biomass, electrolysis of water, and steam reforming of a hydrocarbon gas, are presented and compared. The section is a short summary of the work presented in paper I.
-10 20 30 40 50 60 70 80 90
100
200 220 240 260 280 300
H2
conv
ersi
on [
%]
Temperature [C]
150 bar 100 bar80 bar 50 bar30 bar
-10 20 30 40 50 60 70 80 90
100
200 220 240 260 280 300
H2
conv
ersi
on [
%]
Temperature [C]
150 bar 100 bar80 bar 50 bar30 bar
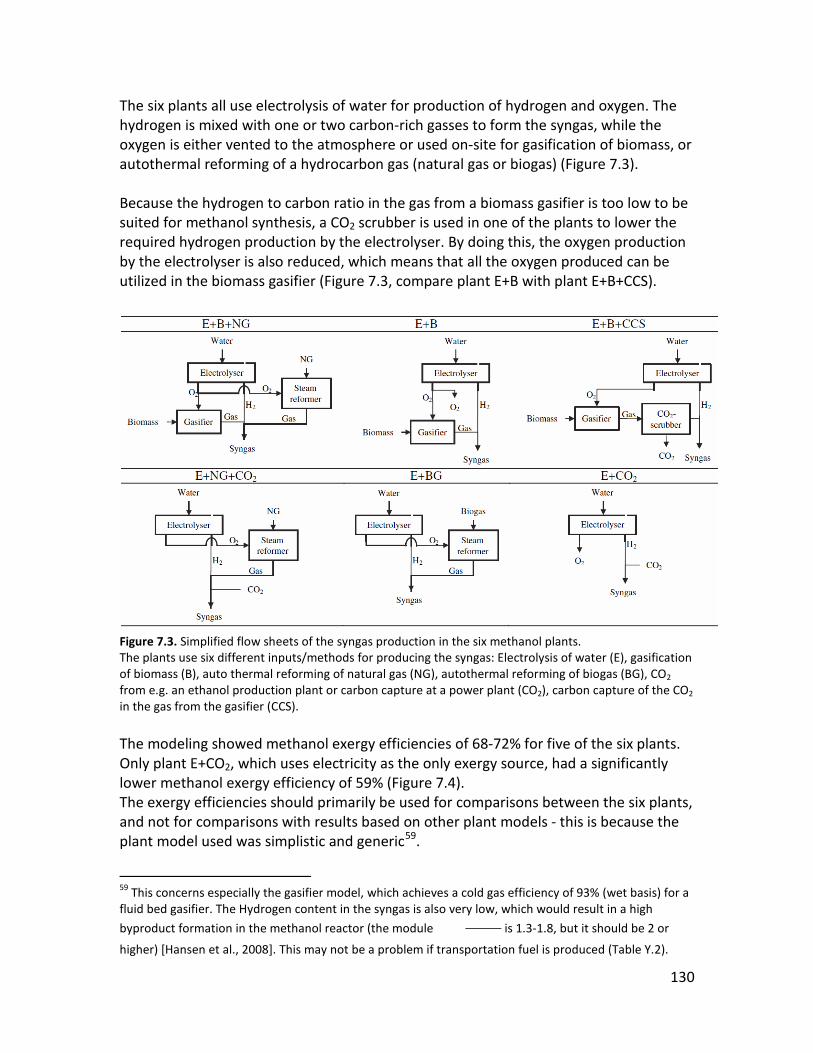
130
The six plants all use electrolysis of water for production of hydrogen and oxygen. The hydrogen is mixed with one or two carbon-rich gasses to form the syngas, while the oxygen is either vented to the atmosphere or used on-site for gasification of biomass, or autothermal reforming of a hydrocarbon gas (natural gas or biogas) (Figure 7.3). Because the hydrogen to carbon ratio in the gas from a biomass gasifier is too low to be suited for methanol synthesis, a CO2 scrubber is used in one of the plants to lower the required hydrogen production by the electrolyser. By doing this, the oxygen production by the electrolyser is also reduced, which means that all the oxygen produced can be utilized in the biomass gasifier (Figure 7.3, compare plant E+B with plant E+B+CCS).
Figure 7.3. Simplified flow sheets of the syngas production in the six methanol plants. The plants use six different inputs/methods for producing the syngas: Electrolysis of water (E), gasification of biomass (B), auto thermal reforming of natural gas (NG), autothermal reforming of biogas (BG), CO2 from e.g. an ethanol production plant or carbon capture at a power plant (CO2), carbon capture of the CO2 in the gas from the gasifier (CCS). The modeling showed methanol exergy efficiencies of 68-72% for five of the six plants. Only plant E+CO2, which uses electricity as the only exergy source, had a significantly lower methanol exergy efficiency of 59% (Figure 7.4). The exergy efficiencies should primarily be used for comparisons between the six plants, and not for comparisons with results based on other plant models - this is because the plant model used was simplistic and generic59
59 This concerns especially the gasifier model, which achieves a cold gas efficiency of 93% (wet basis) for a fluid bed gasifier. The Hydrogen content in the syngas is also very low, which would result in a high
byproduct formation in the methanol reactor (the module is 1.3-1.8, but it should be 2 or
higher) [Hansen et al., 2008]. This may not be a problem if transportation fuel is produced (
.
Table Y.2).

131
Figure 7.4. Methanol exergy efficiencies for the six plants. The methanol exergy efficiency is defined as the chemical exergy content of the produced methanol, divided by the sum of the chemical exergy content of the inputs (biomass + natural gas / biogas) and the electricity consumption (for the electrolyser and the compressors). The methanol costs for the six plants were estimated to be 11.8-14.6 €/GJex for all plants, except E+CO2 (25.3 €/GJex), at an electricity price of 40 €/MWh (11 €/GJ). The electricity price was shown to have a significant effect on the production cost, since 23-65% of the total costs for the six plant configurations were due to the electricity consumption (Figure 7.5).
Figure 7.5. The methanol production cost for the six plants as a function of the electricity price.
70% 68% 71% 70% 72%59%
0%
20%
40%
60%
80%
100%
E+B+NG E+B E+B+CCS E+NG+CO2 E+BG E+CO2
Exer
gy e
ffic
ienc
y (L
HV
)

132
The methanol costs estimated, also included the cost for underground gas storages for hydrogen and oxygen, and the income generated by producing district heating from the plant waste heat (estimated specific income: 7 €/GJ-heat). The six different plant concepts investigated, each have advantages and disadvantages, in Table 7.1, these are listed to give a better overview of the plants and how they performed.
E+B+NG E+B E+B+CCS
Advantages: • No excess oxygen from electrolyser
• Low cost
• High utilization of the carbon in the biomass (88%)
• No excess oxygen from electrolyser
• Low cost • Possibly a negative
CO2-emission if captured CO2 is stored.
Disadvantages: • Fossil fuel input
E+NG+CO2 E+BG E+CO2 Advantages: • No excess oxygen from
electrolyser • No excess oxygen from
electrolyser • High regulating ability
for the electricity grid Disadvantages: • Fossil fuel input • High cost
• Relatively low methanol efficiencies
Table 7.1. Advantages and disadvantages with the six plant concepts. Of the six plant configurations, plants E+B+NG and E+B+CCS produced the lowest methanol costs. Thus, these plants seem to be the most appropriate plants for the current energy system. For future energy systems other plants may be more appropriate: The E+B plant could be interesting at high biomass prices because it utilizes almost all the carbon in the biomass, without using a fossil fuel input (such as NG, which is used in the E+B+NG plant). The E+CO2 plant could be interesting if a high regulating ability is needed in the electricity grid. The economy of such a plant is estimated to be better than for a plant using electrolytic hydrogen for electricity production at a time of high electricity prices, instead of using the hydrogen for methanol production.
7.2 Methanol production based on gasification of biomass and electrolysis of water
In this section, a methanol plant based on gasification of biomass and electrolysis of water is presented. This plant converts almost all the carbon in the biomass to carbon stored in the methanol product, without having to synthesize methanol from CO2. In Figure 7.6, a simplified flow sheet of the plant is given. The basis of the design of the plant is the large-scale DME plant using recycle synthesis, presented in chapter 5. By using a similar plant design, the CO2 content in the syngas becomes very low. This is because:

133
• Entrained flow gasification results in a relatively low CO2 content in the syngas compared to e.g. fluidized bed gasification because of a higher gasification temperature (equilibrium of the WGS reaction).
• Feeding the biomass to the gasifier is done by pneumatic feeders using CO2 captured in the gas conditioning. This means that most of the CO2 in the syngas is captured and recycled to the gasifier (Figure 7.6).
Figure 7.6. Simplified flow sheet for a methanol synthesis plant based on biomass gasification and electrolysis of water. This plant uses captured CO2 for feeding the biomass to a pressurized entrained flow gasifier as done in the large-scale plants presented in chapter 5. The plant, shown in Figure 7.6, captures slightly more CO2 than what is needed for feeding the biomass to the gasifier, which is why the methanol yield could be increased slightly if this CO2 was utilized for methanol synthesis. In Figure 7.7, it is shown how this excess CO2 can be converted to CO, by using some of the electrolytic hydrogen for a chemical quench in the gasifier.
GasificationPretreatment
Gas cleaning and CO2 removal
Synthesis
Syngas
Separation and purification
Electricity production
Biomass
Methanol
Unconverted syngas
Water
O2
Sulfur
CO2 for feeding
Electrolysis
Water
H2
CO2

134
Figure 7.7. Simplified flow sheet for a methanol synthesis plant based on biomass gasification and electrolysis of water. This plant differs from Figure 7.6 by using some of the electrolytic hydrogen for a chemical quench in the gasifier – this eliminates the excess CO2 from the gas conditioning. In Figure 7.8, a detailed flow sheet can be seen for the plant presented in Figure 7.7. The plant size is, for simplicity, kept at the same biomass input as the large-scale DME plant from chapter 5. The plant uses recycle synthesis60
4 and is modeled as the large-scale
DME plant (chapter ) - with some exceptions. These exceptions, along with additional modeling inputs, are presented and discussed in Appendix GG. The detailed flow sheet in Figure 7.8 shows the on-site electricity consumptions - including the electrolysis plant. In Table 7.2, corresponding stream compositions are given.
60 This makes the most sense because electricity is used for electrolysis of water, and if once-through synthesis is used this would mean that a lot of the hydrogen generated from electricity would be used for electricity production – this would have the net effect of converting a lot of electricity to waste heat. However, if the plant used hydrogen and oxygen storage to enable the fluctuating operation of the electrolysis plant, and the constant operation of the synthesis plant (as done in paper I), a once-through plant would work as an electricity storage. The electricity would however be produced at a constant rate, and not when the electricity is needed (high electricity price).
GasificationPretreatment
Gas cleaning and CO2 removal
Synthesis
Syngas
Separation and purification
Electricity production
Biomass
Methanol
Unconverted syngas
Water
O2
Sulfur
CO2 for feeding
Electrolysis
Water
H2
H2 for quench

135
Figure 7.8. Detailed flow sheet for a methanol synthesis plant based on biomass gasification and electrolysis of water. Note: How the fluctuating production of the electrolysis plant is handled, is not considered for this plant, but if underground storage for hydrogen and oxygen was used (as done in paper I), the compressor work, for hydrogen and oxygen compression, would be slightly higher (compression to ~200 bar instead of ~45 bar). Note: The temperature after the H2-quench in the gasifier is 1175°C.
Water electrolysis
Fly ash
Milling
H2
Water
Torrefiedwood pellets
AGR (Rectisol)
1820
MeOH reactorGas-liquid separator
CO2
Feeding & Pressurization
7 MWe
Methanol
Water
97% recycle
27
1
32
4 14
3
~CO2
25
Water
19
123 MWth
432 MWth
2938 MWth
CO2
22
2536 MWe
9 MWe
13
23 MWe
36 MWeSlag
15 20 MWe
16
17
Entrained flow gasifier
45 bar1300 C
Steam
37
O2
28
8 MWth
75 MWth
36
33
301 MWe
29
26
235 MWth
34
31
25
6
23
35
t (C) p (bar) m (kg/s)1 20 1.0 115.72 60 1.0 115.73 - - 04 600 55.0 3.15 20 1.0 132.36 30 1.0 14.87 119 45.0 5.08 700 45.0 5.09 119 45.0 9.8
10 30 45.0 9.811 30 1.0 117.512 30 1.0 69.513 30 1.0 48.014 204 46.2 48.0
t (C) p (bar) m (kg/s)15 1300 1 1.916 900 45 278.817 200 44.3 83.318 200 44.3 195.419 30 44 26.220 30 44 169.321 - - 0.322 30 46.2 25.523 0 42.6 149.524 9 42.6 159.325 89 85 159.326 230 83.7 32827 260 80.7 32828 158 80.2 328
t (C) p (bar) m (kg/s)29 40 79.7 32830 40 79.7 173.931 40 79.7 5.232 51 87.7 168.733 40 79.7 154.134 30 46 6.135 - 9 14836 - - 0.537 - - 147.5
t (C) p (bar) m (kg/s)
2302 MWth
CO2 22
8
24
9
91 MWth
11
12
H2S (+water)
21
7
1043 MWth
337 MWth
13 MWth
1775 MWth101 MWe

136
Gasifier (before
quench)
Gasifier exit
AGR outlet
Comp. inlet
Reactor inlet
Reactor outlet
Recycle gas
To distil-lation
Recycle CO2
Stream number
- 18 23 24 26 27 32 33* 34
Mass flow (kg/s)
190.4 195.4 149.5 159.3 328.0 328.0 168.7 154.1 6.1
Mole flow (kmole/s)
8.93 11.43 9.54 14.39 26.79 17.58 12.41 4.79 0.16
Mole frac (%)
H2 26.1 40.5 48.6 65.9 62.8 43.1 59.1 0.28 8.7 CO 50.2 41.0 49.3 32.7 31.4 21.8 29.9 0.26 7.9 CO2 9.4 5.5 1.8 1.2 3.0 4.4 5.1 2.6 80.4 H2O 14.1 12.8 0.00 0.00 0.00 0.17 0.00 0.61 0.00 CH4 0.02 0.02 0.03 0.02 0.27 0.40 0.55 0.02 0.76 H2S 0.02 0.02 0.00 0.00 0.00 0.00 0.00 0.00 0.00 N2 0.13 0.10 0.14 0.09 1.5 2.3 3.1 0.03 0.83 Ar 0.07 0.05 0.09 0.06 0.75 1.1 1.6 0.05 1.4 CH3OH - - - - 0.31 26.7 0.68 96.1 0.00 Table 7.2. Stream compositions for the methanol plant shown in Figure 7.8.* Liquid Figure 7.8 showed that the methanol output was 2938 MWth, and that this was higher than the torrefied biomass input of 2302 MWth. This was achieved by using 2536 MWe for electrolysis of water. Below, the energy efficiencies of the plant is discussed (7.2.1), followed by a section on the carbon flows in the plant (7.2.2), showing that almost all the carbon in the biomass is converted to carbon stored in the product methanol. The final section compares this plant with other synthesis plants (7.2.3).
7.2.1 Energy efficiencies In Table 7.3, relevant energy efficiencies are shown for the methanol plant. The table shows that the methanol yield per biomass input is higher than 100%, but that the net energy efficiencies are 59-63% because of the high power consumption of the electrolyser. That the electrolyser is the dominating electricity consumption can be seen from Figure 7.9. This figure also shows that the net power consumption is a bit lower than the power consumption of the electrolyser because the integrated steam cycle produces an estimated 350 MWe. Torrefied biomass Untreated biomass Net energy efficiency (LHV) 63% 59% Biomass to methanol efficiency (LHV) 128% 115% Table 7.3. Energy efficiencies for the methanol plant based on either the torrefied biomass input or untreated biomass. Note: Assuming an energy efficiency of torrefaction of 90%.

137
Figure 7.9. On-site electricity consumptions in the methanol plant, including the electricity production of the integrated steam cycle.
7.2.1.1 Chemical energy flows In Figure 7.10, the chemical energy flows in the methanol plant is shown. The figure shows that the untreated biomass to methanol efficiency is 115% (as in Table 7.3), and that only a very small fraction of the syngas is not converted to methanol, but sent to the off-gas boiler. The figure also shows how much of the electrolytic hydrogen that is used for the chemical quench in the gasifier, and how much that is sent directly to the methanol synthesis.
2391
350
2741
3
14
1
101
36
23
20
7
2536
0 500 1000 1500 2000 2500 3000
Net power consumption
Steam cycle
Total electricity consumption
Recycle compressor/blower (synthesis loop)
CO2 compression (CO2 to gasifier)
CO2 recycle-compressor
Hydrogen compressor
Syngas compressor
Oxygen compressor
Gas cleaning (Rectisol)
Milling of biomass
Electrolyser
Power [MWe]

138
Figure 7.10. Chemical energy flows (LHV) in the methanol plant. All energy flows are normalized with the energy flow of untreated biomass. The figure also shows conversion heat losses. The torrefaction process does not occur in the methanol plant, but decentralized. The conversion heat losses (excluding the torrefaction heat loss and the electrolyser heat loss) are used by the integrated steam plant to produce electricity. The waste heat from the electrolyser is available at low temperature ~90°C because alkaline electrolysis is assumed.
7.2.2 Carbon analysis The concept behind the modeled methanol plant was to utilize all the carbon in the biomass for methanol production. In Figure 7.11, it can be seen that 97% of the carbon in the torrefied biomass ends up as carbon in the product methanol. The 3% loss is due to the necessary purge from the synthesis loop. Typically there will also be a loss of carbon due to the off-gasses from the topping column in the distillation – in this plant, this is avoided by recirculating the gas to the AGR.
Figure 7.11. Carbon flows in the methanol plant.
115%
100% 90%
MeOH
Wood
Torrefaction10%
96%
18%4%
Off-gas boiler
22%
99%
Electrolysis
30%
24%69% 45%
SynthesisGasification
Electricity
97%
3%
103%
12%
100% 112% MeOH
CO2 from off-gas boiler
CO2 captured (for feeding)
Torrefied biomass
SynthesisGasification
3%
AGR(Rectisol)
CO2 from distillation

139
The biomass torrefaction process is not shown on Figure 7.11 because it occurs outside the synthesis plant, in decentralized torrefaction plants. In the torrefaction process, about 21% of the carbon in the untreated biomass is lost with the volatile gasses, which is why even more methanol could have been produced if the torrefaction process occurred on-site, and the volatile gasses where fed to the gasifier. This is discussed in section 8.2.3.
7.2.3 Comparing with other plants
7.2.3.1 Comparing with other synthesis plants using water electrolysis In Table 7.4, the methanol plant is compared with two other plants using water electrolysis. The table shows that no other plant achieves as high a methanol output per input of dry wood, which is because of the very low loss of carbon in the plant. The consequence of utilizing almost all of the carbon input for methanol production, is a high electricity consumption for the electrolyser to produce the required amount of hydrogen. The hydrogen consumption is however only slightly higher than that reported in [Mignard et al., 2008] (mass-basis), due to a higher loss of hydrogen in this plant (hydrogen in purge gas). Because methanol is synthesized from CO, instead of CO2, in the modeled plant, the recycle ratio needed in the synthesis section is only 1.9 (Table 7.4), which is lower than if methanol also was synthesized from CO2. The recycle ratio can in this case be as high as 12 (Table 7.4, [Mignard et al., 2008]). The reasons for the very high recycle ratio in [Mignard et al., 2008] are the relatively high inert content in the syngas (2.6 mole%), and the relatively conservative conversion rates in the methanol reactor. If the synthesis of methanol is done with a similar syngas as reported in [Mignard et al., 2008], but with an inert level as low as the modeled methanol plant (0.17 mole%), and with the same approach temperatures as assumed in this study, a recycle ratio as low as 2.2 can be achieved61
. This shows that an entrained flow gasifier is more appropriate for these types of plants because of the low CH4 content in the gas from the gasifier.
If the modeled methanol plant is compared with the E+B plant from section 7.1, it can be seen that plant E+B has a much lower hydrogen consumption. This is due to a high cold gas efficiency of the gasifier, and a relatively high loss of carbon with the purge gas. It should be noted that the hydrogen content in the syngas, in the E+B plant, is very low (recycle gas contains 55.4 mole% CO2 and 30 mole% H2). Such low hydrogen content would result in a high production of by-products [Hansen et al., 2008].
61 Other assumptions: 220°C and 100 bar in outlet from methanol reactor. 99.3% of the unconverted syngas is recycled (as done in [Mignard et al., 2008]). The gas from the topping column is recycled to the reactor.
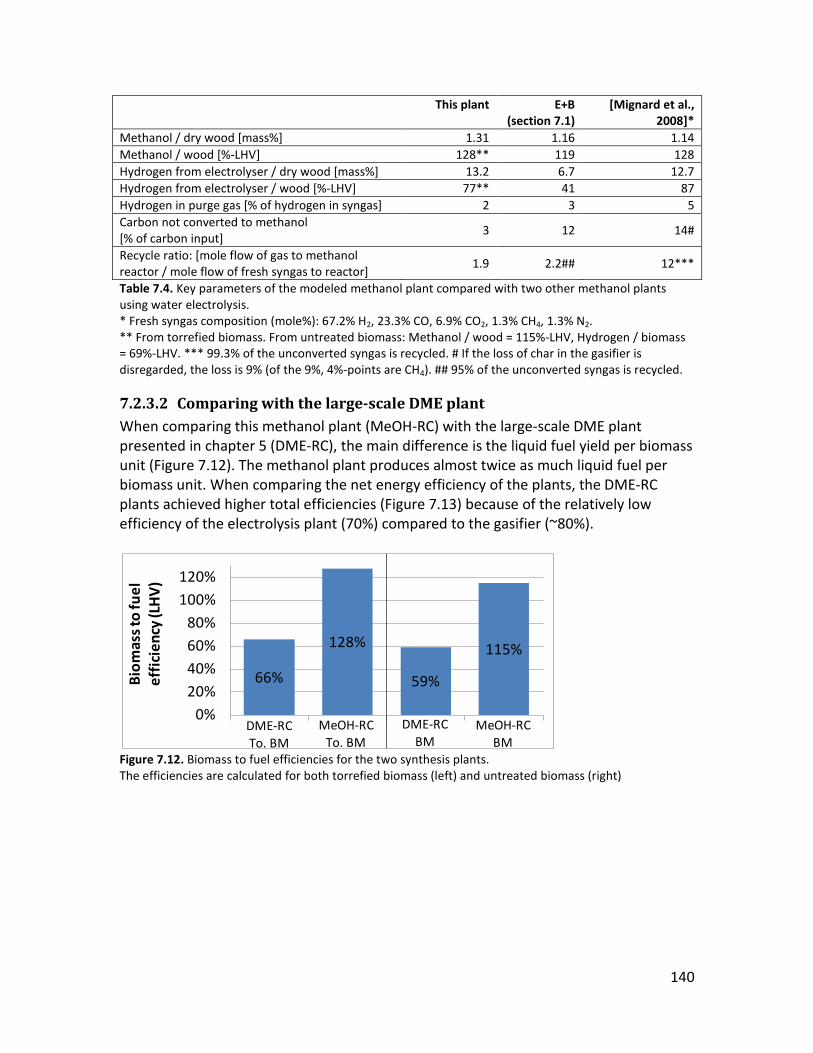
140
This plant E+B (section 7.1)
[Mignard et al., 2008]*
Methanol / dry wood [mass%] 1.31 1.16 1.14 Methanol / wood [%-LHV] 128** 119 128 Hydrogen from electrolyser / dry wood [mass%] 13.2 6.7 12.7 Hydrogen from electrolyser / wood [%-LHV] 77** 41 87 Hydrogen in purge gas [% of hydrogen in syngas] 2 3 5 Carbon not converted to methanol [% of carbon input]
3 12 14#
Recycle ratio: [mole flow of gas to methanol reactor / mole flow of fresh syngas to reactor]
1.9 2.2## 12***
Table 7.4. Key parameters of the modeled methanol plant compared with two other methanol plants using water electrolysis. * Fresh syngas composition (mole%): 67.2% H2, 23.3% CO, 6.9% CO2, 1.3% CH4, 1.3% N2. ** From torrefied biomass. From untreated biomass: Methanol / wood = 115%-LHV, Hydrogen / biomass = 69%-LHV. *** 99.3% of the unconverted syngas is recycled. # If the loss of char in the gasifier is disregarded, the loss is 9% (of the 9%, 4%-points are CH4). ## 95% of the unconverted syngas is recycled.
7.2.3.2 Comparing with the large-scale DME plant When comparing this methanol plant (MeOH-RC) with the large-scale DME plant presented in chapter 5 (DME-RC), the main difference is the liquid fuel yield per biomass unit (Figure 7.12). The methanol plant produces almost twice as much liquid fuel per biomass unit. When comparing the net energy efficiency of the plants, the DME-RC plants achieved higher total efficiencies (Figure 7.13) because of the relatively low efficiency of the electrolysis plant (70%) compared to the gasifier (~80%).
Figure 7.12. Biomass to fuel efficiencies for the two synthesis plants. The efficiencies are calculated for both torrefied biomass (left) and untreated biomass (right)
66%
128%
59%
115%
0%20%40%60%80%
100%120%
Biom
ass t
o fu
el
effi
cien
cy (L
HV
)
MeOH-RCBM
DME-RC BM
DME-RC To. BM
MeOH-RCTo. BM

141
Figure 7.13. Net energy efficiencies for the two synthesis plants. The efficiencies are calculated for both torrefied biomass (left) and untreated biomass (right).
7.3 Summary By integrating water electrolysis in a large-scale methanol plant, similar to the large-scale DME plant described in chapter 5, an almost complete conversion of the carbon in the torrefied biomass to methanol was achieved (97%). The methanol yield per unit biomass input was therefore increased from 66% (the large-scale DME plant) to 128% (LHV). The total energy efficiency was however reduced from 71% (the large-scale DME plant) to 63%, due to the relatively inefficient electrolyser. Because carbon is lost in the torrefaction process, a higher methanol yield per unit untreated biomass could be achieved if the plant operated on untreated biomass – and because this type of plant would only be attractive at high biomass prices and/or low electricity prices, it would be more attractive to use untreated biomass in the plant. Modeling of such a plant is suggested for further work (8.2.3). Other methanol plant concepts incorporating water electrolysis was also modeled, including plants based on biomass gasification, CO2, natural gas and biogas. The analysis showed that the plant based on biomass gasification + reforming of natural gas, and the plant based on biomass gasification followed by CO2 capture, produced methanol at the lowest costs, while still achieving high energy efficiencies.
66% 63% 59% 59%
5%4%
0%
20%
40%
60%
80%
100%N
et e
ffic
ienc
y (L
HV
)
Net electricityFuel
MeOH-RCBM
DME-RC BM
DME-RC To. BM
MeOH-RCTo. BM
71%59%64%63%

142
8. Concluding remarks The objective of this study was to design novel DME and methanol plants based on gasification of biomass, with a focus on:
1. Improving the total energy efficiency of the synthesis plants by minimizing losses
and co-producing electricity and heat. 2. Lowering the CO2 emissions from the synthesis plants. 3. Improving the DME/methanol yield per unit biomass input. 4. Integrating surplus electricity from renewables in the production of DME/methanol. This lead to the design of the following plants: 1. Large-scale DME plants based on torrefied biomass.
The focus in the plant design was on lowering the CO2 emission from the plants and improving the total energy efficiency by optimizing the design of the integrated steam plant.
2. Small-scale DME and methanol plants based on wood chips. The focus in the plant design was on improving the total energy efficiency by: 1. heat integration, 2. coproduction of district heating, 3. increasing the electricity production by adding an expander turbine.
3. Alternative synthesis plants. The focus in the plant design was on improving the fuel yield per unit biomass input and integrating surplus electricity from renewables. This lead to the integration of water electrolysis in a large-scale methanol plant.
In the following, the results from these three different plant types are summarized, but first some of the other important findings are presented. Note: The summary of findings is mainly a collection of the short summaries given throughout the thesis.
8.1 Summary of findings It was shown that trustworthy sources in literature (the IPCC and IEA Bioenergy) estimate that the global biomass resource is sufficiently great to allow the use of biomass for fuels and chemicals production, IEA Bioenergy even indicate that it could be more appropriate to use biomass for fuels and chemicals production, than for electricity production, because few and expensive alternatives exists for biomass for fuels and chemicals production, but many cost effective alternatives exists for biomass for electricity production. A well-to-wheel (WTW) analysis showed that liquid bio-fuels such as DME and methanol achieve low WTW GHG emissions, low WTW CO2 avoidance costs, relatively high potential for replacing fossil fuels and relatively low WTW energy consumption. DME and methanol showed to be especially attractive for long distance transport (incl. shipping and aviation) because of superior range compared with electric vehicles. It was

143
also shown that DME and methanol are more attractive than first generation biofuels and second generation ethanol (produced by biological fermentation) because of lower WTW GHG emissions, lower WTW CO2 avoidance costs, higher potential for replacing fossil fuels and lower WTW energy consumption.
8.1.1 Large-scale DME plants based on torrefied biomass It was shown that entrained flow gasification of torrefied biomass is preferred for large-scale synthesis plants compared to fluidized bed gasification of untreated biomass, mainly because of a lower production of higher hydrocarbons (incl. tar) in the gasifier, which is especially attractive if a high fuel output per unit biomass input is required. However, a fluidized bed biomass gasifier has the potential for a higher cold gas efficiency than an entrained flow gasifier because of lower operating temperatures, but if the volatile gasses from the torrefaction process is used as a chemical quench in the entrained flow gasifier as described in [Prins et al., 2006], the cold gas efficiency of the entrained flow gasifier is expected to be on level with - or superior to – the practically achievable cold gas efficiency of a fluidized bed biomass gasifier. The large-scale DME plants based on entrained flow gasification of torrefied wood pellets achieved biomass to DME efficiencies of 49% when using once-through (OT) synthesis and 66% when using recycle (RC) synthesis. If the net electricity production was included, the total efficiencies became 65% for the OT plant and 71% for the RC plant. Although this seems to show that the RC plant is more energy efficient, the fuels effective efficiencies of the plants indicate that the plants are almost equally energy efficient (73% for the RC plant and 72% for the OT plant). Because some chemical energy is lost in the torrefaction process, the total efficiencies based on untreated biomass to DME were 64% for the RC plant and 59% for the OT plant. It was shown that CO2 emissions can be reduced to about 3% (RC) or 10% (OT) of the input carbon in the torrefied biomass by using CO2 capture and storage together with certain plant design changes. Accounting for the torrefaction process, which occurs outside the plant, the emissions become 22% (RC) and 28% (OT) of the input carbon in the untreated biomass. The estimated cost of the produced DME was $11.9/GJLHV for the RC plant and $12.9/GJLHV for the OT plant, but if a credit was given for storing the bio-CO2 captured, the cost become as low as $5.4/GJLHV (RC) and $3.1/GJLHV (OT) (at $100/ton-CO2). The results from the RC plant were used to generate a WTW pathway for comparison with the WTW pathways presented in section 2.2. This DME-FW-CCS pathway had lower WTW energy consumption, lower WTW GHG emission, lower cost of CO2 avoided and higher potential to replace fossil fuels than the corresponding DME-FW pathway from section 2.2.
8.1.2 Small-scale DME/methanol plants based on wood chips Small-scale synthesis of DME/methanol was investigated because this enabled the use of the highly energy efficient Two-Stage Gasifier and increased the possibility of

144
efficiently utilizing a district heating co-production. Synthesis plants are however typically large-scale because economy of scale is very important for synthesis plants. The small-scale DME and methanol plants showed to be able to produce biomass to DME/methanol efficiencies of 45-46% when using once-through (OT) synthesis and 56-58% when using recycle (RC) synthesis. If the net electricity production is included the efficiencies increase to 51-53% for the OT plants - the net electricity production is zero in the RC plants. The total energy efficiencies of the plants achieved 87-88% by utilizing plant waste heat for district heating. The added expander turbine showed to increase the biomass to electricity efficiency with 2-3% points in the OT-plants, while the biomass to DME/methanol efficiency was increased with 4-6% in the RC plants. Because the thermodynamic performance showed to be very similar for the DME and methanol plants, and the plant design of the DME plants more complex, mainly due to the refrigeration duty needed, it was concluded that the methanol plants were slightly more preferable than the DME plants. The energy efficiencies achieved, for biomass to methanol/DME + electricity, were 6-8%-points lower than what could be achieved by the large-scale DME plants. The main reason for this difference showed to be the use of air-blown gasification at atmospheric pressure in the small-scale plants because this results in high syngas compressor duties and high inert content in the synthesis reactor. However, the use of a gas engine operating on unconverted syngas to cover the on-site electricity consumption also limits how much of the syngas that can be converted to liquid fuel. The reason why the difference between the small-scale and the large-scale plants showed not to be greater, was the high cold gas efficiency of the gasifier used in the small-scale plants (93%).
8.1.3 Alternative methanol plants By integrating water electrolysis in a large-scale methanol plant, similar to the large-scale DME plant described above, an almost complete conversion of the carbon in the torrefied biomass to methanol was achieved (97%). The methanol yield per unit biomass input was therefore increased from 66% (the large-scale DME plant) to 128% (LHV). The total energy efficiency was however reduced from 71% (the large-scale DME plant) to 63%, due to the relatively inefficient electrolyser. Because carbon is lost in the torrefaction process, a higher methanol yield per unit untreated biomass could be achieved if the plant operated on untreated biomass – and because this type of plant would only be attractive at high biomass prices and/or low electricity prices, it would be more attractive to use untreated biomass in the plant. Modeling of such a plant is suggested for further work (8.2.3). Other methanol plant concepts incorporating water electrolysis was also modeled, including plants based on biomass gasification, CO2, natural gas and biogas. The analysis showed that the plant based on biomass gasification + reforming of natural gas, and the plant based on biomass gasification followed by CO2 capture, produced methanol at the lowest costs, while still achieving high energy efficiencies.

145
8.2 Further work
8.2.1 Large-scale liquid fuels plants based on biomass DME plant based on untreated biomass: Similar plant concept as the large-scale DME plant, but the torrefaction process occurs on-site. Waste heat from the DME reactor is used for steam drying and torrefaction. The gasses from the torrefaction process are used for a chemical quench in the entrained flow gasifier as suggested by [Prins et al., 2006]. This plant concept will achieve a higher biomass to DME energy efficiency than the large-scale DME-RC plant achieved from torrefied biomass because of the chemical quench, but total energy efficiencies are expected to be similar because of a lower co-product electricity production due to waste heat being used for steam drying and torrefaction instead of electricity production. If the efficiencies are compared based on untreated biomass instead of torrefied biomass, this new plant concept would be superior. A DME plant based on untreated biomass instead of torrefied biomass may however experience higher biomass costs because of higher transportation cost for untreated biomass compared to torrefied biomass pellets. Storage of the biomass fuel would also be more expensive because outside storage is not an option for untreated biomass. Fischer-Tropsch (FT) plant based on torrefied biomass: Similar plant layout as the large-scale DME plant. Because a FT synthesis plants generates several hydrocarbon byproducts including naphta and light gasses such as methane, these gasses can be used for a chemical quench in the entrained flow gasifier. This would increase the overall plant energy efficiency because the chemical quench increases the cold gas efficiency of the gasifier, and because these hydrocarbon gasses typically are sent to a gas turbine or burner to generate electricity. Recycling of light gasses is e.g. done in [Kreutz et al., 2008], but here the light gasses are recycled by using an autothermal reformer, which lowers plant energy efficiency and increases plant costs.
8.2.2 Small-scale DME/methanol plants based on wood chips Enriched air: If enriched air was used in the small-scale plants, the nitrogen content in the syngas would decrease, resulting in a lower syngas compressor work. It is however estimated that the air purification process would require more electricity than what would be saved on the syngas compressor work. The lower nitrogen content of the syngas would also increase the potential fuel output, but because some unconverted syngas is needed by the gas engine to cover the on-site electricity consumption, it is estimated that the fuel production would not increase. If electricity from the grid was used as a supplement to the electricity produced by the gas engine, the CO2 content in the gas would limit how much the fuel output could increase because CO2 almost acts as an inert at these synthesis conditions. CO2 removal is considered infeasible at such small scale.

146
8.2.3 Alternative DME/methanol plants based on biomass Methanol plant based on untreated biomass and water electrolysis: Similar plant concept as the one described in section 7.2, but because carbon is lost in the torrefaction process, a higher methanol yield per unit untreated biomass could be achieved if the plant operated on untreated biomass. And because a plant incorporating electrolysis of water would only be attractive at high biomass prices and/or low electricity prices, it would be more attractive to use untreated biomass in the plant. In such a plant, the volatile gasses from the torrefaction process could be used as a chemical quench in the gasifier as suggested by [Prins et al., 2006]. This would however complicate the use of a hydrogen quench, used to convert CO2 to CO, because the temperature would be too low - but this could be solved by using a catalyst to promote the reverse water gas shift reaction. It may however be more feasible to synthesize the residual CO2 to methanol, instead of using a catalyst to convert CO2 to CO after the gasifier. DME plant based on untreated biomass and SOEC electrolysis of water and CO2: Similar plant concept as described above for the methanol plant, but by using high temperature solid oxide electrolysis (SOEC), instead of low temperature alkaline water electrolysis, CO2 can be used as an input to the electrolyser along with water to produce a syngas consisting of CO + H2. By using SOEC electrolysis, direct DME synthesis from a syngas with H2/CO = 1 becomes possible, without losing the CO2 produced in the synthesis, since this can be recycled to the SOEC. A plant based on SOEC electrolysis and gasification of biomass does not need an external CO2 input (to the SOEC). This type of DME plant concept could be more attractive than a DME plant concept similar to the one described above for a methanol plant because the added dehydration step needed to convert methanol to DME can be avoided. Note: DME production could also be performed solely based on a CO2 and water input to the SOEC (no gasifier), as described in the following reaction equations: 3CO2 + 3H2O -> 3CO + 3H2 + 3O2 -> CH3OCH3 + CO2 + 3O2 If the CO2 output is recycled, the resulting reaction equation becomes: 2CO2 + 3H2O -> CH3OCH3 + 3O2 Methanol plant based on the small-scale gasifier and SOEC electrolysis: This plant concept would be similar to the plant concept described above, but by using the highly efficient Two-Stage Gasifier, the biomass to methanol/DME efficiency could become even higher. This plant concept would not need to incorporate a gas engine, as done in the small-scale plant described in chapter 6, because an almost complete conversion of the syngas to DME/methanol could be accomplished (no N2, and the CO2 is synthesized to DME/methanol). Incorporating a gas engine would however enable a more flexible operation: 1. when cheap electricity is available, the SOEC would deliver oxygen to the gasifier, and hydrogen to the syngas, enabling an almost complete

147
conversion of the syngas to DME/methanol. 2. when cheap electricity is not available, the plant could operate as described in chapter 6. Storing H2 and O2 from the electrolysis is considered infeasible at this small scale.
8.3 Final statement By developing thermodynamic models of biomass based synthesis plants in the modeling tools DNA and Aspen Plus, it was shown that large-scale production of liquid biofuels such as DME or methanol can be produced with higher energy efficiency (up to 73%) and at lower cost (~$12/GJLHV) than what is typically reported in the literature. By incorporating certain design changes, and storing the CO2 captured in the gas conditioning, it was shown that the CO2 emissions could be reduced to 1% of the input carbon – and if a credit was given for storing bio-CO2, the DME production cost could be reduced even further. Small-scale production of DME/methanol was shown to have a lower biomass to biofuel energy efficiency than large-scale plants, but small-scale plants could become interesting due to co-production of district heating, simpler plant layouts and biomass logistics. Plants incorporating electrolysis of water was shown to be able to double the biofuel output per biomass input, and such plants could therefore become interesting at high biomass prices, and/or low electricity prices.

148
References [Ahrenfeldt et al., 2006] Ahrenfeldt J, Henriksen U, Jensen TK, Gøbel B, Wiese L, Kather A, Egsgaard H. Validation of a Continuous Combined Heat and Power (CHP) Operation of a Two-Stage Biomass Gasifier. Energy & Fuels 2006;20(6):2672-2680. [Ahrenfeldt, 2010] Personal communication with Jesper Ahrenfeldt about gas engines operating on syngas, Senior Scientist, Risø DTU, 2009-2010. [Andersen et al., 2003] Andersen L, Elmegaard B, Qvale B, Henriksen U, Bentzen JD, Hummelshøj R. “Modelling the low-tar BIG gasification concept”, proceedings of the 16th International conference on efficiency, cost, optimization, simulation, and environmental impact of energy systems (ECOS). Denmark: Technical University of Denmark (DTU), 2003. p. 1073-9, orbit.dtu.dk/getResource?recordId=25653&objectId=1&versionId=1 [Andersson et al., 2006] Andersson K, Johnsson F. Process evaluation of an 865 MWe lignite fired O2/CO2 power plant. Energy Convers. Manage. 2006;47(18-19):3487-3498. [Bentzen et al., 2004] Bentzen JD, Hummelshøj RM, Henriksen U*, Gøbel B*, Ahrenfelt J, Elmegaard B. “UPSCALE OF THE TWO-STAGE GASIFICATION PROCESS”, Procedings of 2. World Conference and Technology Exhibition on Biomass for Energy and Industry, Florence & WIP-Munich, Rome, 2004, http://orbit.dtu.dk/getResource?recordId=155745&objectId=1&versionId=1 [Bergman et al., 2005] Bergman PCA, Boersma AR, Kiel JHA, Prins MJ, Ptasinski KJ, Janssen FJJG. Torrefaction for entrained-flow gasification of biomass, report: ECN-C--05-067. Petten, The Netherlands: ECN, 2005. http://www.ecn.nl/publications/ [Boerrigter et al., 2004] Boerrigter H, Calis HP, Slort DJ, Bodenstaff H, Kaandorp AJ, den Uil H, Rabou LPLM. “Gas Cleaning for Integrated Biomass Gasification (BG) and Fischer-Tropsch (FT) Systems - Experimental demonstration of two BG-FT systems (“Proof-of-Principle”)”, report: ECN-C--04-056, Petten, The Netherlands: Energy research Centre of the Netherlands (ECN), 2004, http://www.ecn.nl/publications/ [Boerrigter, 2006] Boerrigter H. Economy of Biomass-to-Liquids (BTL) plants, report: ECN-C--06-019. Petten, The Netherlands: ECN, 2006. http://www.ecn.nl/publications/ [Carbona, 2006] Patel J, “Skive BGGE/CHP Plant”, presentation, Carbona Corporation, 2006, http://media.godashboard.com/gti/IEA/Fall06ChicagoTaskMeeting/IEA_WSCarbona10-06.pdf [Celik et al., 2005] Celik F, Larson ED, Williams RH. “Transportation Fuel from Coal with Low CO2 Emissions”. Wilson, M., T. Morris, J. Gale and K. Thambimuthu (eds.), Proceedings of 7th International Conference on Greenhouse Gas Control Technologies (2004). Volume II: Papers, Posters and Panel Discussion, pp. 1053-1058, Pergamon, 2005. [Chemrec, 2010] Chemrec. “BioDME steel towers successfully put in place”, ChemrecNews June 2010. http://www.chemrec.se/BioDME_steel_towers_mounted.aspx [CHEMSYSTEMS, 2008] CHEMSYSTEMS. “Dimethyl Ether (DME) Technology and Markets”, report: PERP07/08-S3 by CHEMSYSTEMS (only abstract), 2008, http://www.chemsystems.com/reports/search/docs/abstracts/0708S3_abs.pdf

149
[CHOREN, 2008-1] Dr. Christoph Kiener (Project Development Manager, CHOREN), “Start-up of the first commercial BTL production facility - CHORENs BETA-Plant Freiberg”, presentation from June 2008 (Valencia), www.choren.de (information & press; info downloads). [CHOREN, 2008-2] Christopher Peters (CHOREN USA), "CHOREN USA - Coal Gasification in Indiana - Solutions for a Low Carbon Footprint Environment", presentation from December 2008, http://www.purdue.edu/discoverypark/energy/events/cctr_meetings_dec_2008/presentations/Peters-12-11-08.pdf [CHOREN, 2010] Homepage of CHOREN, http://www.choren.com/ (accessed 13/10/2010) [Ciferno et al., 2002] Ciferno JP, Marano JJ. “Benchmarking Biomass Gasification Technologies for Fuels, Chemicals and Hydrogen Production”, report prepared for the National Energy Technology Laboratory (U.S. Department of Energy), 2002, http://www.netl.doe.gov/technologies/coalpower/gasification/pubs/pdf/BMassGasFinal.pdf [Clausen LR, 2007] Clausen LR. ”Design and modeling of methanol plant for the REtrol Vision” (Design og modellering af metanolanlæg til VEnzin-visionen). Master thesis, Technical University of Denmark (DTU), 2007, http://orbit.dtu.dk/Person.external?sp=16044 (in danish). [DEA, 2008] The Danish Energy Agency (Energistyrelsen). “Alternative fuels in the tranportation sector” (Alternative drivmidler i transportsektoren), report from 2008, excel model updated in 2010 (in danish). http://www.ens.dk/da-dk/klimaogco2/transport/alternativedrivmidler/Sider/Forside.aspx [DMT, 2010] Danish ministry of transport (DMT). ”Specific costs related to the transport sector for use in cost benefit analysis” (transportøkonomiske enhedspriser til brug for samfundsøkonomiske analyser). Excel model made by DTU Transport and COWI, 2010. http://www.dtu.dk/upload/institutter/dtu%20transport/modelcenter/transportoekonomiske%20enhedspriser/transport%C3%B8konomiske%20enhedspriser%20vers%201.3%20jul10.xls [DNA, 2010] Homepage of the thermodynamic simulation tool DNA. http://orbit.dtu.dk/query?record=231251. Technical University of Denmark (DTU). [Eaves et al., 2004] Eaves S, Eaves J. “A cost comparison of fuel-cell and battery electric vehicles”, Journal of Power Sources 2004;130(1-2):208-212. [EEA, 2006] European Environment Agency (EEA), “How much bioenergy can Europe produce without harming the environment?”, report, 2006. http://www.eea.europa.eu/publications/eea_report_2006_7 [Elmegaard et al., 2005] Elmegaard B, Houbak N. DNA – A General Energy System Simulation Tool, in: J. Amundsen et al., editors. SIMS 2005, 46th Conference on Simulation and Modeling, Trondheim, Norway. Tapir Academic Press, 2005. p. 43-52. [Energy storage R&D, 2010] Energy storage R&D, “Annual progress report for energy storage R&D” (for 2009), U.S. Department of Energy, Vehicle Technologies Program, 2010. http://www1.eere.energy.gov/vehiclesandfuels/pdfs/program/2009_energy_storage.pdf [ENVIROTHERM, 2010] ENVIROTHERM GmbH, “CFB Circulating Fluidized Bed” (website), http://envirotherm.de/content/e39/e137/e43/index_eng.html (accessed at 9/10/2010) [EPRI, 2004] N. Holt (EPRI), “Gasification process selection – Tradeoffs and ironies”, Gasification Technologies Conference, Washington DC, 2004.
150
[Gassner et al., 2008] Gassner M, Maréchal F. Thermo-economic optimisation of the integration of electrolysis in synthetic natural gas production from wood. Energy 2008;33(2):189-198. [GEK, 2010] The Gasifier Experimenters Kit (GEK), “Gasifier types” (website), http://www.gekgasifier.com/gasification-basics/gasifier-types/ (accessed at 9/10/2010) [GRASYS, 2010] Homepage of GRASYS (manufacturer of gas separation systems), http://www.grasys.com/products/gas/oxygen/membrane/ (accessed 16/10/2010) [GWD, 2007] The National Energy Technology Laboratory (NETL), Gasification World Database (GWD) 2007, http://www.netl.doe.gov/technologies/coalpower/gasification/database/database.html [Haldor Topsøe, 2001] Holm-Larsen H (Business Development Manager, Haldor Topsøe A/S). “How DME is Made – The Topsøe Technology for Production of DME”, Presented at the PETROTECH-2001 Conference, New Delhi, India, 2001, http://www.methanol.org/pdf/HowDMEismade%28dme-org%29.pdf [HaldorTopsøe, 2007] Jesper Nerlov (HaldorTopsøe A/S). “Gasification based synthesis of DME and Gasoline”, presentation, 2007, http://ida.dk/netvaerk/idaforum/U0637a/Documents/Indl%C3%A6g%20090507/TIGAS-DME-2.pdf [Haldor Topsøe, 2010-1] Haldor topsøe A/S. “SSK catalyst - Sulphur resistant/sour water-gas shift catalyst”, brochure, http://www.topsoe.com/business_areas/gasification_based/Processes/~/media/PDF%20files/SSK/topsoe_SSK_leaflet_aug09.ashx (accessed 19/10/2010) [Haldor Topsøe, 2010-2] Haldor topsøe A/S. “Sulphur resistant/sour water-gas shift catalyst”, brochure, http://www.topsoe.com/business_areas/gasification_based/Processes/~/media/PDF%20files/SSK/topsoe_SSK%20brochure_aug09.ashx (accessed 19/10/2010) [Haldor Topsøe, 2010-3] Personal communication with John Bøgild Hansen about methanol synthesis, Senior Scientist & Adviser to Chairman, Company Mangement, Haldor Topsøe A/S, 2010. [Haldor Topsøe, 2010-4] Personal communication with Finn Joensen about DME synthesis and water gas shift, Haldor Topsøe A/S, 2010. [Haldor Topsøe, 2010-5] Personal communication with Poul Erik Højlund Nielsen about methanol synthesis, department manager of science & innovation, R&D, Haldor Topsøe A/S, 2010. [Haldor Topsøe, 2010-6] Haldor topsøe A/S. “MK-121 - high activity methanol synthesis catalyst”, brochure, http://www.topsoe.com/business_areas/gasification_based/Processes/~/media/PDF%20files/Methanol/Topsoe_methanol_mk%20121.ashx (accessed 20/10/2010) [Haldor Topsøe, 2010-7] Aasberg-Petersen K, Nielsen CS, Dybkjær I, Perregaard J (Haldor Topsøe A/S). “Large Scale Methanol Production from Natural Gas”, http://www.topsoe.com/business_areas/methanol/~/media/PDF%20files/Methanol/Topsoe_large_scale_methanol_prod_paper.ashx (accessed 20/10/2010) [Haldor Topsøe, 2010-8] Haldor topsøe A/S. “Catalyst portfolio”, homepage, http://www.topsoe.com/products/CatalystPortfolio.aspx (accessed 20/10/2010).
151
[Haldor Topsøe, 2010-9] Haldor topsøe A/S. “On the way to DME”, brochure, http://www.topsoe.com/business_areas/gasification_based/~/media/PDF%20files/DME/DME.ashx (accessed 27/10/2010) [Hamelinck et al., 2001] Hamelinck CN, Faaij APC. “Future prospects for production of methanol and hydrogen from biomass - System analysis of advanced conversion concepts by ASPEN-plus flowsheet modelling”. Report NWS-E-2001-49, Utrecht University (The Netherlands), Copernicus Institute, Department of Science, Technology and Society. ISBN 90-73958-84-9, 2001. http://www.mtholyoke.edu/courses/tmillett/course/geog_304B/e2001-49.pdf [Hamelinck et al., 2004] Hamelinck CN, Faaij APC, den Uil H, Boerrigter H. “Production of FT transportation fuels from biomass; technical options, process analysis and optimisation, and development potential”. Energy 2004;29:1743–1771. [Hansen et al., 2008] John Bøgild Hansen, Poul Erik Højlund Nielsen (Haldor Topsøe). “Methanol Synthesis”, section 13.13 in “Handbook of Heterogeneous Catalysis”, Wiley-VCH, 2008, online ISBN: 9783527610044, http://onlinelibrary.wiley.com/doi/10.1002/9783527610044.hetcat0148/abstract [Henrich et al., 2009] Henrich E, Dahmen N, Dinjus E. “Cost estimate for biosynfuel production via biosyncrude gasification”, Biofuels, Bioprod. Bioref. 2009;3:28–41. [Henriksen et al., 2006] Henriksen U, Ahrenfeldt J, Jensen TK, Gøbel B, Bentzen JD, Hindsgaul C, Sørensen LH. “The design, construction and operation of a 75 kW two-stage gasifier”. Energy 2006;31:1542–1553. [IDA, 2010] International DME association (IDA). DME - Clean Fuel for Transportation. http://www.aboutdme.org/index.asp?bid=219 (accessed 24/11/2010) [IEA, 2007] The International Energy Agency (IEA). “2007 Energy Balance for World”, online statistics, 2007, http://www.iea.org/stats/index.asp [IEA Bioenergy, 2009] IEA Bioenergy. “Bioenergy – a Sustainable and Reliable Energy Source. A review of status and prospects”, 2009, http://www.ieabioenergy.com/LibItem.aspx?id=6479 [IGP, 2010] Homepage of Industrial Gas Plants (manufacturer of gas separation systems), http://www.industrialgasplants.com/noncryogenic-gas-types.html (accessed 16/10/2010). [IPCC, 2005] Metz B, Davidson O, de Coninck HC, Loos M, Meyer LA (editors). “IPCC Special Report on Carbon Dioxide Capture and Storage”. Prepared by Working Group III of the Intergovernmental Panel on Climate Change. Cambridge University Press, Cambridge, United Kingdom and New York, NY, USA, 442 pp. [IPCC, 2007] IPCC. “Climate Change 2007: Mitigation. Contribution of Working Group III to the Fourth Assessment Report of the Intergovernmental Panel on Climate Change” (editors : Metz B, Davidson OR, Bosch PR, Dave R, Meyer LA ), Cambridge University Press, Cambridge, United Kingdom and New York, NY, USA, 2007. [Iversen, 2006] Iversen HL, ”Production of liquid biofuels from syngas” (”Produktion af flydende biobrændsler udfra syngas”), master thesis report, The Technical University of Denamark (DTU), 2006. [Iversen et al., 2006] Iversen HL, Henriksen U, Ahrenfeldt J, Bentzen JD. ”D25 Performance characteristics of SOFC membranes at two stage gasifier”, (confidential). Technical report from the EU project BioCellus (Biomass Fuel Cell Utility System), 6th Framework Programme, Contract No: 502759. 2006.

152
[Joensen et al., 2007] Joensen F, Voss B, Rostrup-Nielsen T. "Coal gas to gasoline - a direct pathway to clean liquid fuels", poster presented at the 2nd international Freiberg conference on IGCC & XtL Technologies, Haldor Topsøe A/S, 2007, http://www.tu-freiberg.de/~wwwiec/conference/conf07/pdf/P14.pdf [JRC et al., 2007] JRC et al.,“Well-to-Wheels analysis of future automotive fuels and powertrains in the European context”, This work was carried out jointly by representatives of EUCAR (the European Council for Automotive R&D), CONCAWE (the oil companies’ European association for environment, health and safety in refining and distribution) and JRC/IES (the Institute for Environment and Sustainability of the EU Commission’s Joint Research Centre), March 2007. [Karg, 2009] Karg J. “IGCC experience and further developments to meet CCS market needs”, Siemens AG, Energy Sector, Fossil Power Generation Division, presentation at COAL-GEN EUROPE – Katowice, Poland, September 1 - 4, 2009. http://www.energy.siemens.com/mx/pool/hq/power-generation/power-plants/integrated-gasification-combined-cycle/Igcc-experience-and-further-developments.pdf [Kiel et al., 2009] Kiel JHA, Verhoeff F, Gerhauser H, van Daalen W, Meuleman B. “BO2-technology for biomass upgrading into solid fuel - an enabling technology for IGCC and gasification-based BtL”, ECN-M--09-058, Presented at 4th International Conference on Clean Coal Technologies in conjunction with the 3rd International Freiberg Conference on IGCC & XtL Technologies, Dresden 18-21 May 2009. http://www.ecn.nl/publications/ [KOGAS, 2009] Lee S, Cho W, Song T, Ra Y (R & D Division, Korea Gas Corporation (KOGAS)). “SCALE UP STUDY OF DME DIRECT SYNTHESIS TECHNOLOGY”, presented at the World Gas Conference 2009, http://www.igu.org/html/wgc2009/papers/docs/wgcFinal00745.pdf [Kreutz et al., 2005] Kreutz T, Williams R, Consonni S, Chiesa P. Co-Production of Hydrogen, Electricity, and CO2 from Coal with Commercially Ready Technology. Part B: Economic Analysis. International Journal of Hydrogen Energy 2005;30(7):769-784. [Kreutz et al., 2008] Kreutz TG, Larson ED, Liu G, Williams RH. Fischer-Tropsch Fuels from Coal and Biomass, report. Princeton, New Jersey: Princeton Environmental Institute, Princeton University, 2008. http://www.princeton.edu/pei/energy/publications [Kristensen, 2009] Personal communications with Tina Kristensen on milling of biomass, Vattenfall, 2009. [Larson et al., 2003] Larson ED, Tingjin R. Synthetic fuel production by indirect coal liquefaction. Energy for Sustainable Development 2003;7(4):79-102. [Larson et al., 2006] Larson ED, Williams RH, Jin H. Fuels and electricity from biomass with CO2 capture and storage. In: proceedings of the 8th International Conference on Greenhouse Gas Control Technologies, Trondheim, Norway, June 2006. [Larson et al., 2009-1] Larson ED, Jin H, Celik FE. Large-scale gasification-based coproduction of fuels and electricity from switchgrass. Biofuels, Biorprod. Bioref. 2009;3:174–194. [Larson et al., 2009-2] Larson ED, Jin H, Celik FE. Supporting information to: Large-scale gasification-based coproduction of fuels and electricity from switchgrass. Biofuels, Biorprod. Bioref. 2009;3:174–194. http://www.princeton.edu/pei/energy/publications [Linde, 2010] Homepage of Linde engineering (licensor of Rectisol together with Lurgi). “Rectisol wash”,
153
http://www.linde-le.com/process_plants/hydrogen_syngas_plants/gas_processing/rectisol_wash.php (accessed 18/10/2010) [Lurgi, 2010] Lurgi GmbH (licensor of Rectisol together with Linde). “The Rectisol process”, http://www.lurgi.com/website/fileadmin/user_upload/1_PDF/1_Broshures_Flyer/englisch/0308e_Rectisol.pdf (accessed 18/10/2010) [Maurstad, 2005] Ola Maurstad, ”An Overview of Coal based Integrated Gasification Combined Cycle (IGCC) Technology”, Massachusetts Institute of Technology (MIT), 2005. [MI, 2010] The Methanol Institute (MI). http://www.methanol.org/ (accessed 24/11/2010) [Mignard et al., 2008] Mignard D, Pritchard C. “On the use of electrolytic hydrogen from variable renewable energies for the enhanced conversion of biomass to fuels”. Chemical Engineering Research and Design 2008;86(5):473-487 [Moore et al., 2007] Moore JJ, Nored M, Brun K. Novel Concepts for the Compression of Large Volumes of Carbon Dioxide. Paper sent to Oil & Gas Journal in 2007, but a published version cannot be found. Southwest Research Institute. http://www.netl.doe.gov/technologies/coalpower/turbines/refshelf/papers/42650%20SwRI%20for%20Oil%20&%20Gas%20Journal.pdf [Morrow et al., 2008] Morrow K, Karner D, Francfort J. "Plug-in Hybrid Electric Vehicle Charging Infrastructure Review", U.S. Department of Energy, Vehicle Technologies Program - Advanced Vehicle Testing Activity, 2008. http://avt.inel.gov/pdf/phev/phevInfrastructureReport08.pdf [NETL, 2000] The National Energy Technology Laboratory (NETL). “Shell Gasifier IGCC Base Cases”, report: PED-IGCC-98-002, 1998 (revised in 2000), http://www.netl.doe.gov/technologies/coalpower/gasification/pubs/pdf/system/shell3x_.pdf [NETL, 2010] The National Energy Technology Laboratory (NETL). “Overview of DOE’s Gasification Program”. Presentaion by Jenny B. Tennant (Technology Manager – Gasification) from 2010, http://www.netl.doe.gov/technologies/coalpower/gasification/pubs/programmatic.html [NUON, 2010] Homepage of the energy company NUON. http://www.nuon.com/company/core-business/energy-generation/power-stations/buggenum/index.jsp (accessed 15/10/2010) [Ogden, 2004] Ogden JM. Conceptual Design of Optimized Fossil Energy Systems with Capture and Sequestration of Carbon Dioxide, Report UCD-ITSRR-04-34. University of California Davis, Institute of Transportation Studies, 2004. [Ohno, 2007] Ohno Y. New Clean Fuel DME. Presentation at the DeWitt Global Methanol & MTBE Conference in Bangkok in 2007. http://www.methanol.org/pdf/Ohno_DME_Dev_Co.pdf [Ouellette et al., 1995] Ouellette N, Rogner HH, Scott DS. Hydrogen from remote excess hydroelectricity. Part II: Hydrogen peroxide or biomethanol. Int. J. Hydrogen Energy 1995;20(11):873-880 [Prins et al., 2006] Prins MJ, Ptasinski KJ, Janssen FJJG. “More efficient biomass gasification via torrefaction”. Energy 2006;31(15):3458–3470.

154
[RENEW, 2008] Klintbom P (Fuels and Lubricants, Volvo Technology Corporation), “A tentative fuel specification of engine grade DME”, Report: SES6-CT-2003-502705, Renewable fuels for advanced powertrains (RENEW), 2008, http://www.renew-fuel.com/download.php?dl=del_sp3_wp6_3-6-3_08-07-02_vtec.pdf&kat=15 [Rollins et al., 2002] Rollins ML, Reardon L, Nichols D, Lee P, Moore M, Crim M, Luttrell R, Hughes E. “Economic Evaluation of CO2 Sequestration Technologies - Task 4, Biomass Gasification-Based Processing”, Semi-Annual Technical Report: DE-FC26-00NT40937, prepared for the department of energy (USA), 2002, http://www.osti.gov/bridge/purl.cover.jsp?purl=/814694-yNYZfd/native/ [Rudloff, 2003] Rudloff M, “Carbo-V Process Development and Operations”, Presentation at IEA Bioenergy, London, may 2003. [Shell, 2005] Thomas Chhoa (Vice President Coal Gasification - Shell Gas & Power), ”Shell Gasification business in action”, presentation at Gasification Technology Updates, 2005, http://www.gasification.org/library/overview.aspx [Shell, 2006] Shell. Coal Gasification brochure. The Shell Coal Gasification Process - For Sustainable Utilisation of Coal. 2006. http://www.shell.com/static/globalsolutions/downloads/innovation/coal_gasification_brochure.pdf [Shelton et al., 2000] Shelton W, Lyons J. Shell Gasifier IGCC Base Cases, report no. PED-IGCC-98-002. The National Energy Technology Laboratory (NETL): Process Engineering Division, 1998 (revised in 2000). http://www.netl.doe.gov/technologies/coalpower/gasification/pubs/system-studies.html [Specht et al., 1999] Specht M, Bandi A, Baumgart F, Muray CM, Gretz J. Synthesis of methanol from biomass/CO2 resources. In: Riemer P, Elliasson B, Wokaun A, editor. Greenhouse Gas Control Technologies, Interlaken, Switzerland. Oxford: Elsevier, 1999, p. 723–727. [Svoboda et al., 2008] Svoboda K, Pohořelý M, Hartman M, Martinec J. “Pretreatment and feeding of biomass for pressurized entrained flow gasification”, Fuel processing technology 2008;90:629-635. [Tecnon, 2006] Fryer C (Tecnon OrbiChem Ltd, UK). “The Renaissance of Coal-based Chemicals: Acetylene, Coal-to-Liquids, Acetic Acid”, Tecnon OrbiChem Seminar at APIC, Bangkok, Thailand, 2006, http://www.orbichem.com/gen/uploads/syezuu55kgu0ok55epcqomjf12052006115942.pdf [Tijmensen et al., 2002] Tijmensen MJA, Faaij APC, Hamelinck CN, van Hardeveld MRM. “Exploration of the possibilities for production of Fischer Tropsch liquids and power via biomass gasification”. Biomass and Bioenergy 2002;23:129-152. [Tock et al., 2010] Tock L, Gassner M, Maréchal F. “Thermochemical production of liquid fuels from biomass: Thermo-economic modeling, process design and process integration analysis”. Biomass and Bioenergy 2010;34(12):1838-1854. [Uhde, 2010] Uhde. “Methanol”, company brochure, http://www.uhde.eu/archive/upload/uhde_brochures_pdf_en_6.00.pdf (accessed 28/10/2010) [UIG, 2010] Homepage of Universal Industrial Gases (manufacturer of gas separation systems), http://www.uigi.com/cryodist.html#Nitrogen (accessed 16/10/2010) [UOP, 2010] UOP LLC (licensor of Selexol), “Selexol Process”, brochure, http://www.uop.com/objects/97%20Selexol.pdf (accessed 18/10/2010)

155
[Uslu et al., 2008] Uslu A, Faaij APC, Bergman PCA. Pre-treatment technologies, and their effect on international bioenergy supply chain logistics. Techno-economic evaluation of torrefaction, fast pyrolysis and pelletization. Energy 2008;33(8):1206-1223. [van der Drift et al., 2004] van der Drift A, Boerrigter H, Coda B, Cieplik MK, Hemmes K. Entrained flow gasification of biomass; Ash behaviour, feeding issues, system analyses, report: ECN-C--04-039. Petten, The Netherlands: ECN, 2004. http://www.ecn.nl/publications/ [van der Drift et al., 2006] van der Drift A, Boerrigter H, ”Synthesis gas from biomass”, report: ECN-C--06-001. Petten, The Netherlands: Energy research Centre of the Netherlands (ECN), 2006, http://www.ecn.nl/publications/ [van der Drift, 2010] Van der Drift A. “Biomass gasification for second generation biofuels”, presentation: ECN-L--10-076, presented at the conference: Gasification, the development of gasification as a key technology contributor to future clean coal power generation, London, UK, 2010, http://www.ecn.nl/publications/ [van der Ploeg et al., 2004] van der Ploeg HJ, Chhoa T, Zuideveld PL. The Shell Coal Gasification Process for the US Industry. In: Proceedings for the Gasification Technology Conference, Washington DC, USA, 2004. [VVBGC, 2010] Homepage of the Växjö Värnamo Biomass Gasification Centre, www.vvbgc.se (accessed 14/10/2010) [Williams et al., 1995] Williams RH, Larson ED, Katofsky RE, Chen J. “Methanol and hydrogen from biomass for Transportation”. Energy for Sustainable Development 1995;1(5):18-34. [Yagi et al., 2010] Yagi H, Ohno Y, Inoue N, Okuyama K, Aoki S. Slurry Phase Reactor Technology for DME Direct Synthesis. International Journal of Chemical Reactor Engineering 2010;8:A109. [Zwart et al., 2009] Zwart RWR, Van der Drift A, Bos A, Visser HJM, Cieplik MK, Könemann HWJ. “Oil-Based Gas Washing— Flexible Tar Removal for High-Efficient Production of Clean Heat and Power as Well as Sustainable Fuels and Chemicals”, Environmental Progress & Sustainable Energy 2009;28(3):324-335.

156
Appendix A. Paper I ISI Journal Paper Clausen LR, Houbak N, Elmegaard B. “Technoeconomic analysis of a methanol plant based on gasification of biomass and electrolysis of water”. Energy 2010;35(5):2338-2347. Paper I is in part based on results from my master thesis [Clausen LR, 2007].
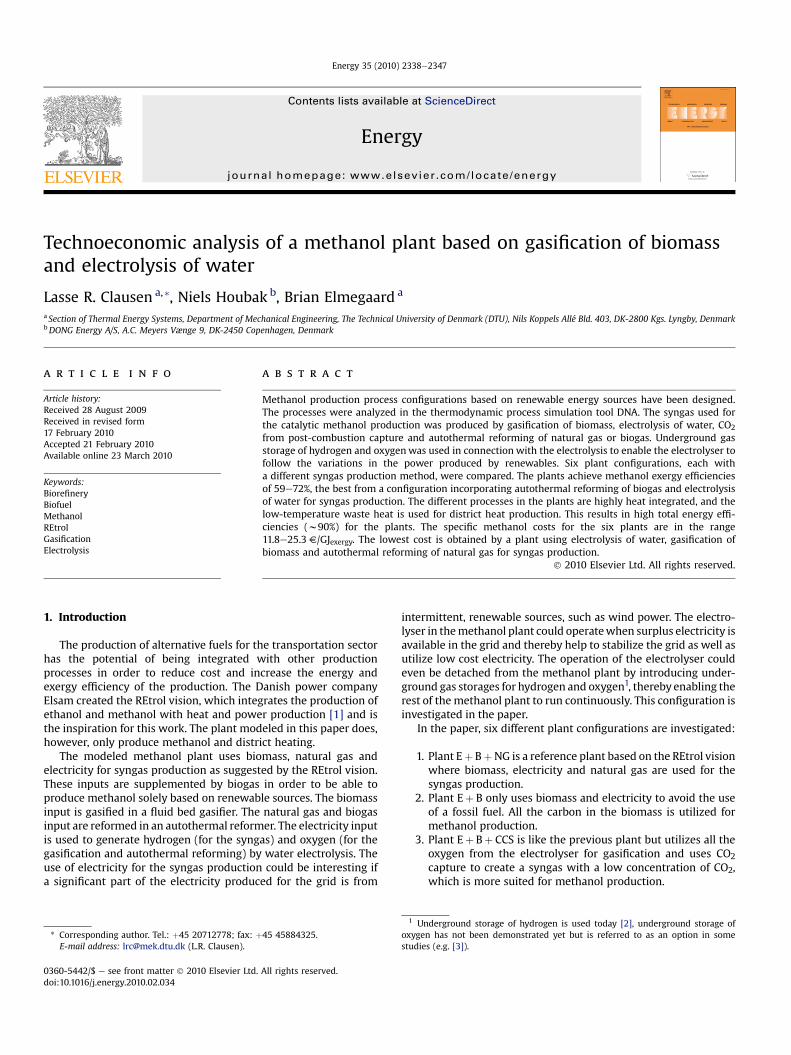
lable at ScienceDirect
Energy 35 (2010) 2338e2347
Contents lists avai
Energy
journal homepage: www.elsevier .com/locate/energy
Technoeconomic analysis of a methanol plant based on gasification of biomassand electrolysis of water
Lasse R. Clausen a,*, Niels Houbak b, Brian Elmegaard a
a Section of Thermal Energy Systems, Department of Mechanical Engineering, The Technical University of Denmark (DTU), Nils Koppels Allé Bld. 403, DK-2800 Kgs. Lyngby, DenmarkbDONG Energy A/S, A.C. Meyers Vænge 9, DK-2450 Copenhagen, Denmark
a r t i c l e i n f o
Article history:Received 28 August 2009Received in revised form17 February 2010Accepted 21 February 2010Available online 23 March 2010
Keywords:BiorefineryBiofuelMethanolREtrolGasificationElectrolysis
* Corresponding author. Tel.: þ45 20712778; fax: þE-mail address: [email protected] (L.R. Clausen).
0360-5442/$ e see front matter � 2010 Elsevier Ltd.doi:10.1016/j.energy.2010.02.034
a b s t r a c t
Methanol production process configurations based on renewable energy sources have been designed.The processes were analyzed in the thermodynamic process simulation tool DNA. The syngas used forthe catalytic methanol production was produced by gasification of biomass, electrolysis of water, CO2
from post-combustion capture and autothermal reforming of natural gas or biogas. Underground gasstorage of hydrogen and oxygenwas used in connection with the electrolysis to enable the electrolyser tofollow the variations in the power produced by renewables. Six plant configurations, each witha different syngas production method, were compared. The plants achieve methanol exergy efficienciesof 59e72%, the best from a configuration incorporating autothermal reforming of biogas and electrolysisof water for syngas production. The different processes in the plants are highly heat integrated, and thelow-temperature waste heat is used for district heat production. This results in high total energy effi-ciencies (w90%) for the plants. The specific methanol costs for the six plants are in the range11.8e25.3 V/GJexergy. The lowest cost is obtained by a plant using electrolysis of water, gasification ofbiomass and autothermal reforming of natural gas for syngas production.
� 2010 Elsevier Ltd. All rights reserved.
1. Introduction
The production of alternative fuels for the transportation sectorhas the potential of being integrated with other productionprocesses in order to reduce cost and increase the energy andexergy efficiency of the production. The Danish power companyElsam created the REtrol vision, which integrates the production ofethanol and methanol with heat and power production [1] and isthe inspiration for this work. The plant modeled in this paper does,however, only produce methanol and district heating.
The modeled methanol plant uses biomass, natural gas andelectricity for syngas production as suggested by the REtrol vision.These inputs are supplemented by biogas in order to be able toproduce methanol solely based on renewable sources. The biomassinput is gasified in a fluid bed gasifier. The natural gas and biogasinput are reformed in an autothermal reformer. The electricity inputis used to generate hydrogen (for the syngas) and oxygen (for thegasification and autothermal reforming) by water electrolysis. Theuse of electricity for the syngas production could be interesting ifa significant part of the electricity produced for the grid is from
45 45884325.
All rights reserved.
intermittent, renewable sources, such as wind power. The electro-lyser in themethanol plant could operatewhen surplus electricity isavailable in the grid and thereby help to stabilize the grid as well asutilize low cost electricity. The operation of the electrolyser couldeven be detached from the methanol plant by introducing under-ground gas storages for hydrogen and oxygen1, thereby enabling therest of the methanol plant to run continuously. This configuration isinvestigated in the paper.
In the paper, six different plant configurations are investigated:
1. Plant Eþ BþNG is a reference plant based on the REtrol visionwhere biomass, electricity and natural gas are used for thesyngas production.
2. Plant Eþ B only uses biomass and electricity to avoid the useof a fossil fuel. All the carbon in the biomass is utilized formethanol production.
3. Plant Eþ Bþ CCS is like the previous plant but utilizes all theoxygen from the electrolyser for gasification and uses CO2capture to create a syngas with a low concentration of CO2,which is more suited for methanol production.
1 Underground storage of hydrogen is used today [2], underground storage ofoxygen has not been demonstrated yet but is referred to as an option in somestudies (e.g. [3]).

L.R. Clausen et al. / Energy 35 (2010) 2338e2347 2339
4. Plant EþNG is also a reference plant. This plant uses naturalgas and electricity for the syngas production because naturalgas is the most commonly used feedstock for methanolproduction.
5. Plant Eþ BG is like the previous plant but uses biogas insteadof natural gas in order to produce methanol based onrenewable sources.
6. Plant Eþ CO2 only uses electricity and CO2 for the syngasproduction. This plant could be used to stabilize the electricitygrid as mentioned above.
The objective of this study was to compare the six plantconfigurations based on economy, thermal efficiencies and theextent of renewables used for the methanol production. Theproduction costs of the methanol produced from the six plants arecompared to relevant fuels.
For the economic evaluation of the modeled methanol plants,Denmark is used as a case of amodern, national energy system. Thisis because:
1. The REtrol vision is developed for the Danish energy system.2. Electricity from wind turbines accounts for 20% of the elec-
tricity production (in 2007) [4], and this figure is predicted toincrease. Thus, the Danish system is an interesting case,because renewable sources account for a significant share ofthe electricity production.
3. There are high taxes on petrol [5], whichmeans that methanolfrom renewable sources that is untaxed could be competitive.
4. District heating is used to a great extent in Denmark [4] (thebyproduct from the modeled methanol plant is districtheating).
The use of hydrogen from electrolysis together with gasificationof biomass to produce a biofuel has also been investigated in [6e9].In [8], the biofuel is synthetic natural gas (SNG). In [6,7,9], thebiofuel is methanol. The plant investigated in [6] resembles plantEþ B in this paper, and the plants investigated in [7,9] resembleplants Eþ B and Eþ Bþ CCS in this paper. However, neither the useof electrolysis together with autothermal reforming of a hydro-carbon feed for syngas production nor the use of gas storage forhydrogen and oxygen in connection with a methanol plant hasbeen investigated. Combining gasification and autothermalreforming to avoid production of excess oxygen from the electrol-ysis is also a new concept generated from the REtrol vision. Theproduction of methanol from biomass is, on the other hand, a wellinvestigated field (e.g. [10,11]).
1.1. The REtrol vision
The REtrol2 vision (VEnzin-visionen in Danish) is a visionproposed by the Danish power company Elsam (now DONGEnergy) and involves the integration of the heat and powerproductionwith production of fuel for the transportation sector [1].In Denmark, heat and power production are highly integrated e
about 50% of the power is produced in cogeneration [4]. Thisintegration of heat and power production saves fuel for the plantscompared to production of heat and power separately, which isboth an economical advantage and benefits the environment. Byintegrating transportation fuel production with the combined heatand power (CHP) plants, the plants increase the number of productsfrom two (heat and power) to three (heat, power and
2 The word REtrol is a mix of the phrase “Renewable Energy” and the word“petrol”.
transportation fuel), which would provide advantages in terms ofbeing able to emphasize which product to produce, based on thedemand from the market. Depending on what kind and how manydifferent transportation fuels the plant would produce e e.g.,methanol, dimethyl ether (DME) or ethanol e the integrationopportunities are different. However compared to stand-aloneplants, the plants should be able to receive economical and envi-ronmental advantages (due to efficiency increases).
In the REtrol vision, a methanol and ethanol plant is integratedwith a CHP plant. Besides the exchange of heat at differenttemperatures, some of the integration opportunities lie betweenthe ethanol and methanol production. A 2nd generation ethanolplant3 would produce a solid lignin residue that can be gasified inthe methanol plant and used for methanol synthesis together withCO2 and H2, which are also byproducts from a 2nd generationethanol production. If the ethanol plant includes a biogas plant,the biogas could also be used for methanol synthesis by reformingthe biogas.
REtrol is thought to consist of petrol with a small percentage(5e10%) of ethanol and/or methanol. In the case of ethanol, theinput to the production would be biomass (e.g., straw) andthe conversion process would be biological. In the case of methanol,the input to the productionwould be biomass, electricity or naturalgas. The biomass would be gasified to produce a syngas that couldbe catalytically converted to methanol. Electricity from renewablesources would be used in an electrolyser to produce hydrogen forthe syngas. Natural gas is, however, not a renewable energy sourceand could be replaced by biogas.
2. Design of the methanol plant model
Themethanol plant model was designedwith strong inspirationfrom the REtrol vision.
This means that the plant feedstocks are based on renewableenergy sources and that the plant is flexible in the choice of feed-stock: biomass, electricity, natural gas and biogas.
The plant was also designed with the goal of high energy/exergyefficiency, and the methanol efficiency is especially crucial.
The design and analysis of the methanol plant model were donewith the thermal system simulation tool DNA4 [12,13]. Themodel ofthe methanol plant was developed for steady-state operation. Themodeled methanol plant was used to investigate six different plantconfigurations, which are presented in Section 3.
The designed methanol plant is different from a commercialmethanol plant based on autothermal reforming of natural gasbecause of the added electrolyser and gasifier. In the modeledmethanol plant, the syngas can be produced by three components:the electrolyser, the gasifier and the autothermal reformer (Fig. 1).The product gases from the three components are mixed togetherto form a syngas. Addition of CO2 (from, e.g., carbon capture froma power plant or ethanol production) is possible in order to adjustthe carbon/hydrogen ratio. The optimal carbon/hydrogen ratiodepends on input concentrations of CO and CO2. An optimal rela-tion between CO, CO2 and H2 in the syngas can be extracted by thechemical reactions producing methanol given in Eqs. (1) and (2).
2H2 þ CO4CH3OH (1)
3H2 þ CO24CH3OHþ H2O (2)
3 Production of ethanol from cellulosic material by fermentation (and otherbiological processes).
4 Exergy calculations were also done by DNA using the method described in [14].
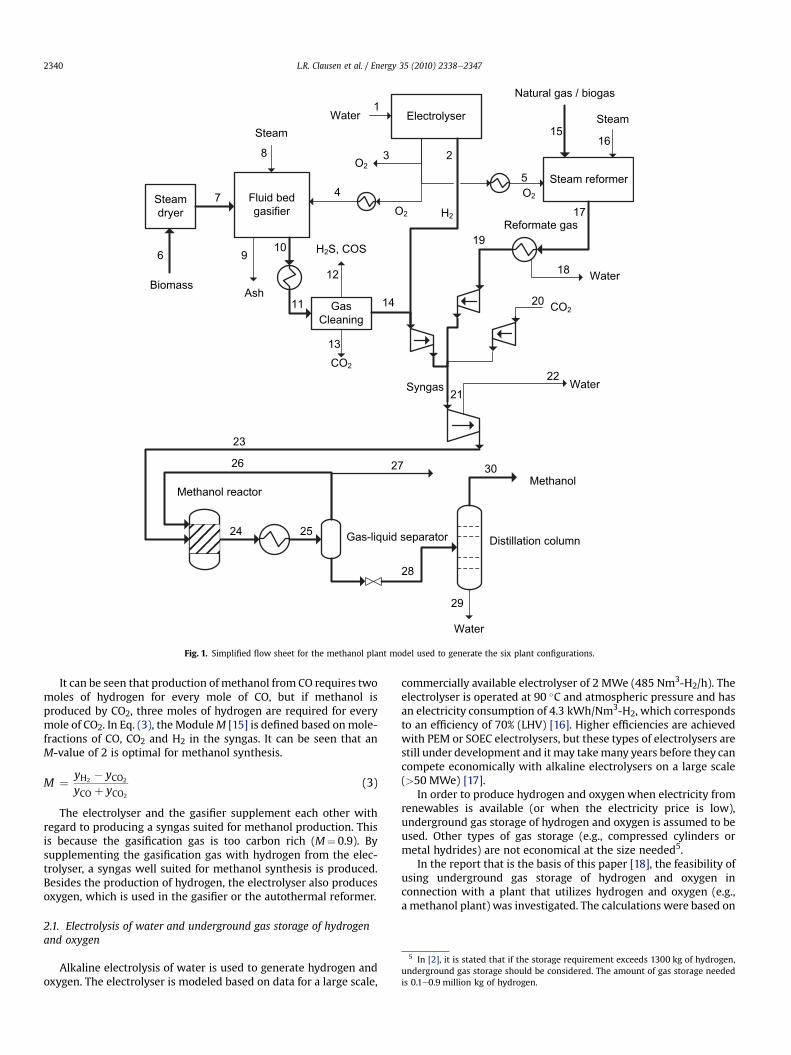
21
Steam
Biomass
GasCleaning
Methanol reactor
Gas-liquid separator Distillation column
Steamdryer
Methanol
Water
H2S, COS
CO2
Ash
Fluid bedgasifier
Electrolyser
H2O2
O2
Steam reformer
Water
Syngas
Natural gas / biogas
Steam
O2
Reformate gas
Water
Water
11
1096
7
8
4
3
15
1
16
5
2
19
17
18
22
13
23
26 27
24 25
28
30
29
12
CO214 20
Fig. 1. Simplified flow sheet for the methanol plant model used to generate the six plant configurations.
5 In [2], it is stated that if the storage requirement exceeds 1300 kg of hydrogen,underground gas storage should be considered. The amount of gas storage neededis 0.1e0.9 million kg of hydrogen.
L.R. Clausen et al. / Energy 35 (2010) 2338e23472340
It can be seen that production of methanol from CO requires twomoles of hydrogen for every mole of CO, but if methanol isproduced by CO2, three moles of hydrogen are required for everymole of CO2. In Eq. (3), the ModuleM [15] is defined based onmole-fractions of CO, CO2 and H2 in the syngas. It can be seen that anM-value of 2 is optimal for methanol synthesis.
M ¼ yH2� yCO2
yCO þ yCO2
(3)
The electrolyser and the gasifier supplement each other withregard to producing a syngas suited for methanol production. Thisis because the gasification gas is too carbon rich (M¼ 0.9). Bysupplementing the gasification gas with hydrogen from the elec-trolyser, a syngas well suited for methanol synthesis is produced.Besides the production of hydrogen, the electrolyser also producesoxygen, which is used in the gasifier or the autothermal reformer.
2.1. Electrolysis of water and underground gas storage of hydrogenand oxygen
Alkaline electrolysis of water is used to generate hydrogen andoxygen. The electrolyser is modeled based on data for a large scale,
commercially available electrolyser of 2 MWe (485 Nm3-H2/h). Theelectrolyser is operated at 90 �C and atmospheric pressure and hasan electricity consumption of 4.3 kWh/Nm3-H2, which correspondsto an efficiency of 70% (LHV) [16]. Higher efficiencies are achievedwith PEM or SOEC electrolysers, but these types of electrolysers arestill under development and it may takemany years before they cancompete economically with alkaline electrolysers on a large scale(>50 MWe) [17].
In order to produce hydrogen and oxygen when electricity fromrenewables is available (or when the electricity price is low),underground gas storage of hydrogen and oxygen is assumed to beused. Other types of gas storage (e.g., compressed cylinders ormetal hydrides) are not economical at the size needed5.
In the report that is the basis of this paper [18], the feasibility ofusing underground gas storage of hydrogen and oxygen inconnection with a plant that utilizes hydrogen and oxygen (e.g.,a methanol plant) was investigated. The calculations were based on

Fig. 2. Heat integration in the methanol plant model.Table 1Parameters used for the plant simulations.
ElectrolyserEfficiency 70%Temperature 90 �C
Steam dryerFeedstock (Wood) 3.05% H, 18.86% O,
25.03% C, 0.005% S,0.30% N, 0.205% Ar,2.55% ash, 50% H2O.9.64 MJ/kg
Outlet water content 5% (mass)Steam exit 120 �C
GasifierCarbon conversion 100%Steam/fuel mass-ratio 0.2a
Gas exit 800 �C
Gas coolingExit temperature 60 �C
Autothermal reformerFeedstock (Natural gas) 91.12% CH4, 0.31% N2,
0.56% CO2, 5.03% C2H6,1.84% C3H8, 0.47% C4H10,0.23% C5H12,0.44% of 8 higher hydrocarbons.48.5 MJ/kg
Feedstock (Biogas) 65% CH4, 35% CO2.20.2 MJ/kg
Pressure 10 barExit temperature 950 �CSteam/fuel mass-ratio 1 (natural gas) 0.2 (biogas)
Methanol synthesisPressure 144 barTemperature 235 �CRecirculation percentage of
unconverted syngas95%
H2 content in purged syngas 30 mol%
DistillationPressure 3.5 bar
CompressorsIsentropic efficiency 90%
L.R. Clausen et al. / Energy 35 (2010) 2338e2347 2341
historic electricity prices from western Denmark (from 2000 to2006) where the installed capacity of wind turbines is about 20% ofthe total installed capacity. The cost for electrolysers and under-ground gas storage used in the study is the same as used in thispaper. It was shown that with today's electricity prices in westernDenmark, electricity cost could be reduced by 5e18%, and totalcosts could be reduced by up to 12%6 by using gas storage to exploitdaily variations in the electricity price. A gas storage size corre-sponding to about five days of operation and an electrolysercapacity corresponding to about twice the capacity needed if gasstorages were not used were the most economical. These sizes ofthe electrolysis plant and underground gas storage are thus used inthis paper. It should be noted that if the electrolysis plant operatesat a partial load (e.g. if the gas storages are filled), higher conversionefficiencies are achieved: at about 300e377 Nm3-H2/h (62e78%load), the electricity consumption drops to 4.1 kWh/Nm3-H2 (73%efficiency) [16]. This means that at the electricity price used in thispaper (40 V/MWh), about the same economics for the electrolyserplant are achieved if operating at 4.3 kWh/Nm3-H2 (100% load) aswhen operating at 4.1 kWh/Nm3-H2 (62e78% load) at a largerelectrolysis plant. The extra capital needed for the larger electrol-ysis plant is saved by lower electricity costs.
2.2. Gasification of biomass
The feedstock for the biomass gasifier is wood. Before being fedto the gasifier, the wood is dried in a steam dryer. The gasifier ismodeled as a modified Low-Tar BIG gasifier, which is a two-stagefluidized bed gasifier at atmospheric pressure with very low-tarcontent in the gasification product gas [19]. The gas exiting thegasifier is at 800 �C with a composition given by an assumption ofchemical equilibrium7 at this temperature. The gas is cooled to60 �C before the gas cleaning by preheating oxygen, superheatingsteam and heating district heating water. The superheated steam isused for steam injection in the gasifier and for steam drying ofbiomass.
6 These figures refer to calculations done where the model only had knowledgeof historic electricity prices. If the model is used to optimize production for a givenyear and the model knows all the electricity prices for that year at the start of thecalculations, even greater reductions in cost can be achieved.
7 Typically, the methane content will be higher than what is given by chemicalequilibrium at this temperature and pressure [20]. A catalyst could be added at theexit to convert the methane.
2.3. Autothermal reforming of natural gas or biogas
Natural gas or biogas is after a desulfurization process, reformedin an autothermal reformer (ATR) to a reformate gas consisting ofH2, CO, CO2 and H2O. The heat needed for the reforming is createdby partially oxidizing the fuel with oxygen. The composition of thereformate gas is calculated by assuming chemical equilibrium atthe exit where the temperature is 950 �C and the pressure is 10 bar.The steam/fuel mass-ratio is set to give an adequately lowmethanecontent in the reformate gas (0.5e0.6 mol%). In the case of naturalgas, this ratio is set to 1, and for biogas it is set to 0.2. This corre-sponds to a steam/carbon mole-ratio of 0.89 for natural gas and0.29 for biogas (the ratio is 0.44 if the carbon in the CO2 in thebiogas is disregarded). Because the reforming in the case of biogasis mostly done with the CO2 present in the biogas, a CO2-reformingcatalyst is most likely needed in order to avoid problems with cokeformation. The CO2-reforming catalysts are under development[21]. The oxygen consumption of the ATR is calculated by
Mechanical efficiency 98%Electrical efficiency 95%
Heat exchangersMinimum DT at pinch pointb 10 �Cor Maximum effectivenessb 90%
a Except for one case (plant Eþ Bþ CCS, see Table 2).b The minimum temperature difference at pinch point is used for all heat
exchangers unless it violates the maximum heat exchanger effectiveness.
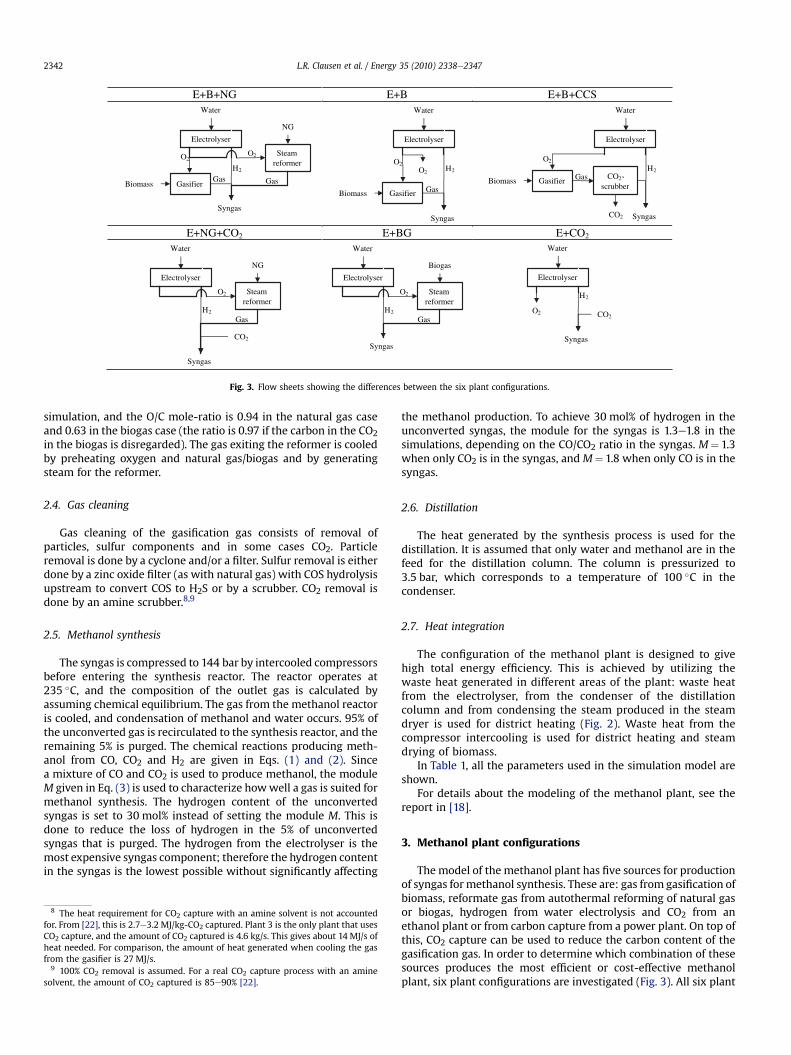
E+B+NG E+B E+B+CCS
E+NG+CO2 E+BG E+CO2
Water
Gas
Steam reformer
Biomass
O2
Gasifier
Electrolyser
O2
H2
NG
Syngas
Gas
Water
GasBiomass
O2
Gasifier
Electrolyser
O2H2
Syngas CO2
CO2-scrubber
Water
GasBiomass Gasifier
Electrolyser
O2
H2
Syngas
Water
Steam reformer
CO2
O2
Electrolyser
H2
NG
Syngas
Gas
Water
Steam reformer
O2
Electrolyser
H2
Biogas
Syngas
Gas
Water
CO2
Electrolyser
H2
Syngas
O2
Fig. 3. Flow sheets showing the differences between the six plant configurations.
L.R. Clausen et al. / Energy 35 (2010) 2338e23472342
simulation, and the O/C mole-ratio is 0.94 in the natural gas caseand 0.63 in the biogas case (the ratio is 0.97 if the carbon in the CO2in the biogas is disregarded). The gas exiting the reformer is cooledby preheating oxygen and natural gas/biogas and by generatingsteam for the reformer.
2.4. Gas cleaning
Gas cleaning of the gasification gas consists of removal ofparticles, sulfur components and in some cases CO2. Particleremoval is done by a cyclone and/or a filter. Sulfur removal is eitherdone by a zinc oxide filter (as with natural gas) with COS hydrolysisupstream to convert COS to H2S or by a scrubber. CO2 removal isdone by an amine scrubber.8,9
2.5. Methanol synthesis
The syngas is compressed to 144 bar by intercooled compressorsbefore entering the synthesis reactor. The reactor operates at235 �C, and the composition of the outlet gas is calculated byassuming chemical equilibrium. The gas from the methanol reactoris cooled, and condensation of methanol and water occurs. 95% ofthe unconverted gas is recirculated to the synthesis reactor, and theremaining 5% is purged. The chemical reactions producing meth-anol from CO, CO2 and H2 are given in Eqs. (1) and (2). Sincea mixture of CO and CO2 is used to produce methanol, the moduleM given in Eq. (3) is used to characterize howwell a gas is suited formethanol synthesis. The hydrogen content of the unconvertedsyngas is set to 30 mol% instead of setting the module M. This isdone to reduce the loss of hydrogen in the 5% of unconvertedsyngas that is purged. The hydrogen from the electrolyser is themost expensive syngas component; therefore the hydrogen contentin the syngas is the lowest possible without significantly affecting
8 The heat requirement for CO2 capture with an amine solvent is not accountedfor. From [22], this is 2.7e3.2 MJ/kg-CO2 captured. Plant 3 is the only plant that usesCO2 capture, and the amount of CO2 captured is 4.6 kg/s. This gives about 14 MJ/s ofheat needed. For comparison, the amount of heat generated when cooling the gasfrom the gasifier is 27 MJ/s.
9 100% CO2 removal is assumed. For a real CO2 capture process with an aminesolvent, the amount of CO2 captured is 85e90% [22].
the methanol production. To achieve 30 mol% of hydrogen in theunconverted syngas, the module for the syngas is 1.3e1.8 in thesimulations, depending on the CO/CO2 ratio in the syngas. M¼ 1.3when only CO2 is in the syngas, and M¼ 1.8 when only CO is in thesyngas.
2.6. Distillation
The heat generated by the synthesis process is used for thedistillation. It is assumed that only water and methanol are in thefeed for the distillation column. The column is pressurized to3.5 bar, which corresponds to a temperature of 100 �C in thecondenser.
2.7. Heat integration
The configuration of the methanol plant is designed to givehigh total energy efficiency. This is achieved by utilizing thewaste heat generated in different areas of the plant: waste heatfrom the electrolyser, from the condenser of the distillationcolumn and from condensing the steam produced in the steamdryer is used for district heating (Fig. 2). Waste heat from thecompressor intercooling is used for district heating and steamdrying of biomass.
In Table 1, all the parameters used in the simulation model areshown.
For details about the modeling of the methanol plant, see thereport in [18].
3. Methanol plant configurations
The model of the methanol plant has five sources for productionof syngas formethanol synthesis. These are: gas from gasification ofbiomass, reformate gas from autothermal reforming of natural gasor biogas, hydrogen from water electrolysis and CO2 from anethanol plant or from carbon capture from a power plant. On top ofthis, CO2 capture can be used to reduce the carbon content of thegasification gas. In order to determine which combination of thesesources produces the most efficient or cost-effective methanolplant, six plant configurations are investigated (Fig. 3). All six plant
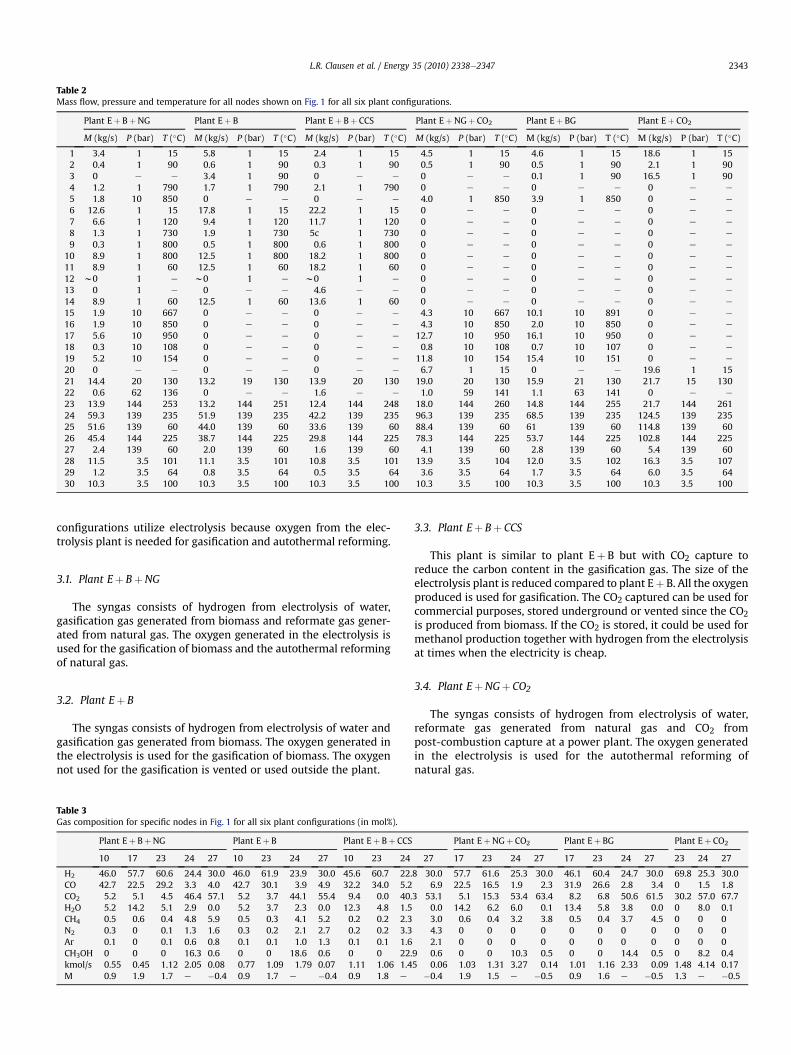
Table 2Mass flow, pressure and temperature for all nodes shown on Fig. 1 for all six plant configurations.
Plant Eþ BþNG Plant Eþ B Plant Eþ Bþ CCS Plant EþNGþ CO2 Plant Eþ BG Plant Eþ CO2
M (kg/s) P (bar) T (�C) M (kg/s) P (bar) T (�C) M (kg/s) P (bar) T (�C) M (kg/s) P (bar) T (�C) M (kg/s) P (bar) T (�C) M (kg/s) P (bar) T (�C)
1 3.4 1 15 5.8 1 15 2.4 1 15 4.5 1 15 4.6 1 15 18.6 1 152 0.4 1 90 0.6 1 90 0.3 1 90 0.5 1 90 0.5 1 90 2.1 1 903 0 e e 3.4 1 90 0 e e 0 e e 0.1 1 90 16.5 1 904 1.2 1 790 1.7 1 790 2.1 1 790 0 e e 0 e e 0 e e
5 1.8 10 850 0 e e 0 e e 4.0 1 850 3.9 1 850 0 e e
6 12.6 1 15 17.8 1 15 22.2 1 15 0 e e 0 e e 0 e e
7 6.6 1 120 9.4 1 120 11.7 1 120 0 e e 0 e e 0 e e
8 1.3 1 730 1.9 1 730 5c 1 730 0 e e 0 e e 0 e e
9 0.3 1 800 0.5 1 800 0.6 1 800 0 e e 0 e e 0 e e
10 8.9 1 800 12.5 1 800 18.2 1 800 0 e e 0 e e 0 e e
11 8.9 1 60 12.5 1 60 18.2 1 60 0 e e 0 e e 0 e e
12 w0 1 e w0 1 e w0 1 e 0 e e 0 e e 0 e e
13 0 1 e 0 e e 4.6 e e 0 e e 0 e e 0 e e
14 8.9 1 60 12.5 1 60 13.6 1 60 0 e e 0 e e 0 e e
15 1.9 10 667 0 e e 0 e e 4.3 10 667 10.1 10 891 0 e e
16 1.9 10 850 0 e e 0 e e 4.3 10 850 2.0 10 850 0 e e
17 5.6 10 950 0 e e 0 e e 12.7 10 950 16.1 10 950 0 e e
18 0.3 10 108 0 e e 0 e e 0.8 10 108 0.7 10 107 0 e e
19 5.2 10 154 0 e e 0 e e 11.8 10 154 15.4 10 151 0 e e
20 0 e e 0 e e 0 e e 6.7 1 15 0 e e 19.6 1 1521 14.4 20 130 13.2 19 130 13.9 20 130 19.0 20 130 15.9 21 130 21.7 15 13022 0.6 62 136 0 e e 1.6 e e 1.0 59 141 1.1 63 141 0 e e
23 13.9 144 253 13.2 144 251 12.4 144 248 18.0 144 260 14.8 144 255 21.7 144 26124 59.3 139 235 51.9 139 235 42.2 139 235 96.3 139 235 68.5 139 235 124.5 139 23525 51.6 139 60 44.0 139 60 33.6 139 60 88.4 139 60 61 139 60 114.8 139 6026 45.4 144 225 38.7 144 225 29.8 144 225 78.3 144 225 53.7 144 225 102.8 144 22527 2.4 139 60 2.0 139 60 1.6 139 60 4.1 139 60 2.8 139 60 5.4 139 6028 11.5 3.5 101 11.1 3.5 101 10.8 3.5 101 13.9 3.5 104 12.0 3.5 102 16.3 3.5 10729 1.2 3.5 64 0.8 3.5 64 0.5 3.5 64 3.6 3.5 64 1.7 3.5 64 6.0 3.5 6430 10.3 3.5 100 10.3 3.5 100 10.3 3.5 100 10.3 3.5 100 10.3 3.5 100 10.3 3.5 100
L.R. Clausen et al. / Energy 35 (2010) 2338e2347 2343
configurations utilize electrolysis because oxygen from the elec-trolysis plant is needed for gasification and autothermal reforming.
3.1. Plant Eþ BþNG
The syngas consists of hydrogen from electrolysis of water,gasification gas generated from biomass and reformate gas gener-ated from natural gas. The oxygen generated in the electrolysis isused for the gasification of biomass and the autothermal reformingof natural gas.
3.2. Plant Eþ B
The syngas consists of hydrogen from electrolysis of water andgasification gas generated from biomass. The oxygen generated inthe electrolysis is used for the gasification of biomass. The oxygennot used for the gasification is vented or used outside the plant.
Table 3Gas composition for specific nodes in Fig. 1 for all six plant configurations (in mol%).
Plant Eþ BþNG Plant Eþ B Plant Eþ Bþ CCS
10 17 23 24 27 10 23 24 27 10 23 24
H2 46.0 57.7 60.6 24.4 30.0 46.0 61.9 23.9 30.0 45.6 60.7 22.CO 42.7 22.5 29.2 3.3 4.0 42.7 30.1 3.9 4.9 32.2 34.0 5.2CO2 5.2 5.1 4.5 46.4 57.1 5.2 3.7 44.1 55.4 9.4 0.0 40.H2O 5.2 14.2 5.1 2.9 0.0 5.2 3.7 2.3 0.0 12.3 4.8 1.5CH4 0.5 0.6 0.4 4.8 5.9 0.5 0.3 4.1 5.2 0.2 0.2 2.3N2 0.3 0 0.1 1.3 1.6 0.3 0.2 2.1 2.7 0.2 0.2 3.3Ar 0.1 0 0.1 0.6 0.8 0.1 0.1 1.0 1.3 0.1 0.1 1.6CH3OH 0 0 0 16.3 0.6 0 0 18.6 0.6 0 0 22.kmol/s 0.55 0.45 1.12 2.05 0.08 0.77 1.09 1.79 0.07 1.11 1.06 1.4M 0.9 1.9 1.7 e �0.4 0.9 1.7 e �0.4 0.9 1.8 e
3.3. Plant Eþ Bþ CCS
This plant is similar to plant Eþ B but with CO2 capture toreduce the carbon content in the gasification gas. The size of theelectrolysis plant is reduced compared to plant Eþ B. All the oxygenproduced is used for gasification. The CO2 captured can be used forcommercial purposes, stored underground or vented since the CO2is produced from biomass. If the CO2 is stored, it could be used formethanol production together with hydrogen from the electrolysisat times when the electricity is cheap.
3.4. Plant EþNGþ CO2
The syngas consists of hydrogen from electrolysis of water,reformate gas generated from natural gas and CO2 frompost-combustion capture at a power plant. The oxygen generatedin the electrolysis is used for the autothermal reforming ofnatural gas.
Plant EþNGþ CO2 Plant Eþ BG Plant Eþ CO2
27 17 23 24 27 17 23 24 27 23 24 27
8 30.0 57.7 61.6 25.3 30.0 46.1 60.4 24.7 30.0 69.8 25.3 30.06.9 22.5 16.5 1.9 2.3 31.9 26.6 2.8 3.4 0 1.5 1.8
3 53.1 5.1 15.3 53.4 63.4 8.2 6.8 50.6 61.5 30.2 57.0 67.70.0 14.2 6.2 6.0 0.1 13.4 5.8 3.8 0.0 0 8.0 0.13.0 0.6 0.4 3.2 3.8 0.5 0.4 3.7 4.5 0 0 04.3 0 0 0 0 0 0 0 0 0 0 02.1 0 0 0 0 0 0 0 0 0 0 0
9 0.6 0 0 10.3 0.5 0 0 14.4 0.5 0 8.2 0.45 0.06 1.03 1.31 3.27 0.14 1.01 1.16 2.33 0.09 1.48 4.14 0.17
�0.4 1.9 1.5 e �0.5 0.9 1.6 e �0.5 1.3 e �0.5

Table 4Energy and exergy inputs for all six plant configurations.
Eþ BþNG
Eþ B Eþ Bþ CCS
EþNGþ CO2
Eþ BG Eþ CO2
ElectricityFor electrolyser (MW) 64 111 46 87 88 357For compressors (MW) 23 24 25 23 19b 33Total (MW) 87 135 71 110 107 390
BiomassEnergy (MWLHV) 121 172 214 e e e
Exergy (MW)a 145 205 256 e e e
Natural gasEnergy (MWLHV) 92 e e 210 e e
Exergy (MW)a 96 e e 219 e e
BiogasEnergy (MWLHV) e e e e 204 e
Exergy (MW)a e e e e 216 e
Total energyinput (MWLHV)
300 307 285 320 311 390
Total exergyinput (MW)
328 340 327 329 323 390
Renewables used,incl. electricity (%)
69 100 100 34 100 100
Renewables used,excl. electricity (%)
40 56 75 0 66 0
a Calculated by the simulation tool DNA as done in [14].b The electricity consumption of the compressors is lower because the biogas is
assumed to be pressurized to 10 bar outside the plant (like the natural gas). Theelectricity consumption for compression of biogas from 1 to 10 bar is about 6 MW.
Table 6Investment estimates for the different plant areas.
Plant area Reference size Cost (MV) Specific cost Source
Electrolysis 1 MWe 0.2 0.2 MV/MWe [16,26]Underground gasstoragea
28,000 MWh-H2 2.7 96 V/MWh-H2 [16,2]
Steam drying 50 t/h ofevap. water
7.5 0.54 MV/(kg/s)evap. [27]
Gasification incl.cleaning
30 MWth 13.6 0.45 MV/MWth [28]
Autothermalreformingb
1882 MWth 267 0.14 MV/MWth [29]
Methanol synthesisb 17 kmol/ssyngas feed
267 16 MV/(kmol/s) [29]
Distillationb 85 kg/s (feed) 267 3.1 MV/(kg/s) [29]
a It is assumed that the same cost can be used for oxygen storage. The capacity forone cavern is: 28,000 MWh of hydrogen (840,000 kg of hydrogen). The cost are verydependent on the type of underground gas storage (e.g., if the cavern has to bemined or not).
b The costs for the three plant areas: autothermal reforming, methanol synthesisand distillation are calculated from a total plant investment for commercial GTLplants given in [29]. It is assumed that each of the three plant areas accounts for 1/3of the total plant investment. Themodel for themethanol plant is used to determinethe relationship between the methanol production (50,000 barrels/day) and thethree parameters stated in the “reference size” column for the three plant areas.
L.R. Clausen et al. / Energy 35 (2010) 2338e23472344
This plant configuration is modeled because it is based onnatural gas, which is the most commonly used resource incommercial methanol plants [23].
3.5. Plant Eþ BG
This plant is similar to plant EþNG but biogas is used instead ofnatural gas, and since CO2 is present in the biogas, CO2 does nothave to be added to the syngas.
Table 5Energy and exergy outputs from all six plant configurations.
Eþ BþNG
Eþ B Eþ Bþ CCS
EþNGþ CO2
Eþ BG Eþ CO2
MethanolEnergy (MWLHV) 205 205 205 205 205 205Exergy (MW)a 231 231 231 231 231 231Energy efficiency (%) 68c 67c 72c 64 66 53Exergy efficiency (%) 70 68 71 70 72 59
District heatingEnergy (MW) 80 90 80 82 79 129Exergy (MW)b 11 13 12 12 12 18
Total energyoutput (MWLHV)
285 295 285 287 284 334
Total energyefficiency (%)
95c 96c 100c 90 91 86
Total exergyefficiency (%)
74 72 74 74 75 64
Unconverted syngasEnergy (MWLHV) 11 9 7 15 12 14Exergy (MW) 13 11 8 19 14 18
a Calculated by the simulation tool DNA as done in [14].b Calculated by using the exergy difference between a stream at 90 �C and
a stream at 50 �C (both at 1 bar). Reference is at 20 �C and 1 bar.c The higher energy efficiencies seen for the plants using gasification are because
thebiomass input energy (LHV)used in the calculation is for thewetbiomass enteringthedryer. If instead thebiomass input energy (LHV)was calculatedbasedon thedriedbiomass entering the gasifier, the efficiencies (both methanol efficiencies and totalefficiencies) would have been at the same level as plants EþNGþ CO2 and Eþ BG.
3.6. Plant Eþ CO2
The syngas consists of hydrogen from electrolysis of water andCO2 from post-combustion capture at a power plant. The oxygengenerated in the electrolysis is vented or used outside the plant.
Since the plants described above have several sources for theproduction of syngas, the ratio(s) between the different sourceshave to be set. For plants Eþ B, Eþ BG and Eþ CO2 that use twosources for syngas production, the ratio between the two sources isdetermined by the hydrogen content specified for the unconvertedsyngas. In the case of plant 2, this means that 0.6 kg/s of hydrogenfrom the electrolyser and 17.8 kg/s of biomass to the gasifier willproduce an unconverted syngas with an H2 content of 30 mol%. Forplants Eþ BþNG and EþNGþ CO2 that use three sources forsyngas production, the ratios between the three sources aredetermined by the hydrogen content specified for the unconvertedsyngas and the requirement that all of the oxygen from the elec-trolysis is used for gasification or autothermal reforming. PlantEþ Bþ CCS only uses two sources for syngas production, but sinceCO2 capture is also used, the amount of CO2 captured and the size ofthe electrolyser are fitted so that there is no excess oxygen from theelectrolyser while still achieving the specified hydrogen content inthe unconverted syngas.
4. Results
4.1. Process simulation results
The model of the methanol plant was used to simulate the sixplant configurations. All six plants were fixed to produce a meth-anol output of 10.3 kg/s (205 MWLHV)10. In Tables 2 and 3, detailedmaterial balances are presented for the plants. These tables showthe differences between the plants in syngas composition andflows. From Table 3, it can be seen that the CO2/CO ratio of thesyngas affects the flows in the methanol synthesis loop. The higherthe CO2/CO ratio, the higher the amount of unconverted syngas that
10 The output corresponds to one plant being able to cover the addition ofmethanol to petrol used for Danish road transport so that 7% [1] of the energycontent in the mixture would be methanol. Petrol used for Danish road transport in2004: 84.6 PJ [24].

28 4323 36 35
124
1521
2613 30 43
3
9
4
3945
4538 33
59
0
50
100
150
200M[ tso
C]raey rep
Electricity Biomass
Natural gas Biogas
CO2 CO2 removal
Capital cost and O&M
94110
98111106
192
Fig. 4. Production cost distribution for the six plant configuration. 8000 operationhours per year are assumed. The costs are calculated based on the information given inTable 4 (consumption data, Table 2 for the consumption of CO2 and for the amount ofCO2 captured), Table 7 (prices) and the following. The specific cost of CO2 capture isassumed to be 30 V/ton-CO2 [16]. The capital cost per year is calculated as 15% of thetotal investment [33], and 4% of the total investment is used for O&M per year [33].
16 18 16 16 16 26
79 92 81 90 94
166
0
50
100
150
200
M[ tsoC
]raey rep
MethanolDistrict heating
94110
98111106
192
Fig. 5. Annual production costs of methanol and district heating. The total cost seen atthe end of each bar matches the total cost seen in Fig. 4.
L.R. Clausen et al. / Energy 35 (2010) 2338e2347 2345
will be recirculated because the conversion rate per pass is lowerfor CO2 than for CO. This ultimately leads to a greater loss ofunconverted syngas.
The main difference between the six plant configurations is thekind of energy inputs used for the syngas production. The differentenergy inputs are electricity, biomass, natural gas and biogas. InTable 4, the distribution between these inputs is shown. It can beseen from this table that the electricity consumption for elec-trolysis for plant Eþ Bþ CCS is considerably lower than for plantEþ B. This is because of the use of carbon capture in plantEþ Bþ CCS that reduces the need for hydrogen from theelectrolysis. Table 4 also shows the amount of input energy to theplants that comes from renewable energy sources. If the electricityis regarded as a renewable energy source, all of the plants that donot use natural gas only use energy from renewable sources. Ifelectricity is not regarded as a renewable energy source, plantEþ Bþ CCS is the plant where most of the input energy is fromrenewable sources (75%).
In addition to produce methanol, the plants also produce heatfor district heating. Table 5 shows the amount of methanol anddistrict heating produced together with important plantefficiencies. It can be seen that plant Eþ BG has the highestmethanol exergy efficiency of 72%, and the other plants (exceptEþ CO2) have only slightly lower methanol exergy efficiencies
Table 7Prices for the inputs used in the six plant configurations.
Price Source
Electricity 11.1 V/GJ [30]Biomass 4.3 V/GJ [16]Natural gas 4.9 V/GJ [30]Biogas 7.3 V/GJ [16]CO2 15.0 V/ton [16]
(68e71%). Total energy efficiencies for all the plants except Eþ CO2are around 90%. The efficiencies for plant Eþ CO2 are lowercompared to the efficiencies of the other plants: the methanolexergy efficiency is 59%, and the total energy efficiency is 86%. Thereasonwhy plant Eþ CO2 has lower methanol efficiencies is mainlydue to the 70% efficiency of the electrolyser, which is lower than the93% cold gas efficiency of the gasifier and the 95e96% efficiency ofthe autothermal reformer.
4.2. Cost estimation
In order to estimate the investment of the methanol plantsinvestigated, the investment of some major plant areas was esti-mated and shown in Table 6. We found that the gasification part ismuch more expensive than the other syngas-producing parts,namely the electrolysis and the autothermal reforming parts. Theinvestment costs for the six plant configurations are 175e310 MV.
In Fig. 4, the cost distribution between electricity, biomass,capital cost, etc. can be seen for all six plant configurations (theprices assumed for electricity, biomass, etc. can be seen in Table 7).The largest cost areas for plants Eþ BG and Eþ CO2 are biogas andelectricity, respectively; for the other plants, the capital cost is thelargest cost area. It is also clear by comparing costs for plants Eþ Band Eþ Bþ CCS that 20 MV/year (43e23) is saved in electricitycosts for the electrolyser by using CO2 capture with a cost of 9 MV/year11 (4 MV/year for CO2 capture and 5 MV/year for increasedbiomass use).
The total costs shown in Fig. 4 are to be covered by the producedmethanol and district heating (Fig. 5). The specific income ofdistrict heating is estimated to be 7 V/GJ. The cost not covered bythe district heating is placed on the produced methanol.
In Table 8, the specific methanol costs for all six plant configu-rations are compared to other fuels. It is clear from this table thatthe production cost is lowest for plants Eþ BþNG and Eþ Bþ CCSand that plant Eþ CO2 has the highest production cost by far e
more than twice as high as plants Eþ BþNG and Eþ Bþ CCS. Thisdifference is mainly due to the difference in the electricityconsumption. Actually, 23% (plant Eþ Bþ CCS) to 65% (plantEþ CO2) of the total costs for the six plant configurations are forelectricity. In Fig. 6, the relation between the electricity price and
11 Disregarding the potential income for the unused oxygen from the electrolyserin plant Eþ B.

Table 8Fuel prices for a number of relevant fuels for comparison of the production cost ofmethanol for the six plant configurations.
Fuel Price/Cost
(V/L) (V/GJex)
MethanolEþ BþNG 0.20 11.8Eþ B 0.25 14.0Eþ Bþ CCS 0.21 12.4EþNGþ CO2 0.23 13.2Eþ BG 0.25 14.6Eþ CO2 0.44 25.3
Commercial methanola 0.13 7.1Gasolineb 0.35 10.0Crude oilc 0.29 7.7Ethanold (2nd generation) 0.28 12.0
a Price at V159/ton [31]. HHV¼ 17.7 MJ/l, density¼ 0.79 kg/l.b Danish price excl. VAT and taxes, HHV¼ 35 MJ/l.c Assumed price at $60/bbl (1 bbl¼ 159 l), HHV¼ 37.8 MJ/l.d Production cost of 2nd generation ethanol¼ $1.36/gal [32]. HHV¼ 23.4 MJ/l.
Table 9Advantages and disadvantages of the six plant configurations.
Eþ BþNG Eþ B Eþ Bþ CCS
Advantages � No excessoxygen fromelectrolyser
� Low cost
� Total utilizationof the carbon inthe biomass
� No excess oxygen fromelectrolyser
� Low cost� Possibly a negativeCO2-emissionif capturedCO2 is stored.
Disadvantages � Fossil fuel input
EþNGþ CO2 Eþ BG Eþ CO2
Advantages � No excessoxygen fromelectrolyser
� No excessoxygen fromelectrolyser
� High regulating abilityfor the electricity grid
Disadvantages � Fossil fuel input � High cost� Relatively lowmethanol efficiencies
L.R. Clausen et al. / Energy 35 (2010) 2338e23472346
the methanol production cost is shown. We see that all plantsexcept Eþ CO2 have similar production costs. The figure indicatesthat the average electricity price has to be below 20 V/MWh beforeplant Eþ B produces cheaper methanol than plant Eþ Bþ CCS.Above 20 V/MWh, it is more cost-effective to remove carbon fromthe gas from the gasifier and thereby reduce the need for expensivehydrogen from the electrolyser. Below 20 V/MWh, it is more cost-effective to keep all the carbon in the gas from the gasifier anduse the required amount of hydrogen from the electrolyser. Thefigure also shows that the average electricity price has to be as lowas 3e8 V/MWh before plant Eþ CO2 can compete with the otherfive plants. However, if regulation of the electricity grid is neededon a large scale (hundreds of MWe), e.g., if 50% of the electricityproduction is from wind turbines, as suggested for Denmark [25],plant Eþ CO2 seems to be the only possible option out of the sixplants and would produce better thermal efficiencies by producingmethanol from the stored hydrogen than a plant generating elec-tricity from the stored hydrogen by fuel cells.
From Table 8, it can also be seen that the methanol productioncost for plants Eþ BþNG and Eþ Bþ CCS (11.8 and 12.4 V/GJex)can compete with the production cost of 2nd generation ethanol(12.0 V/GJex) but not with the current commercial methanol price(7.1 V/GJex).
Table 9 presents a summary of some of the main characteristicsof the six plant configurations. We find that plants Eþ BþNG andEþ Bþ CCS would be most appropriate for the current Danishenergy system and that plant Eþ CO2 will have a high potential inthe future system with a high penetration of wind power. This
0
5
10
15
20
25
0 20 40 60
[tsoclonahteM
]xeJG/
E+B+NGE+BE+B+CCSE+NG+CO2E+BGE+CO2
Commercial methanol price Electricity priceused
Electricity price [ /MWh]
Fig. 6. Methanol cost as a function of the electricity price.
conclusion may apply to other systems as well, but different sharesof energy sources may have an influence.
5. Conclusion
In connection with Elsam's REtrol vision six methanol plantswere designed to obtain optimal energy and exergy efficiencieswhile maintaining reasonable economics.
The design of the plants was based on the use of sustainableenergy sources for the methanol production. All six plants usedelectricity from renewables to produce hydrogen for syngasproduction and oxygen for either gasification of biomass or auto-thermal reforming of a hydrocarbon gas. Underground gas storageof hydrogen and oxygen was used to ensure the constant produc-tion of methanol while the operation of the electrolyser followedthe daily variations in the electricity price induced by the fluctu-ating production by renewables. The modeling showed methanolexergy efficiencies of 68e72% for five of the six plants. Only plantEþ CO2 that uses electricity as the only exergy source has a signif-icantly lowermethanol exergy efficiency of 59%. By heat integratingthe different plant processes and using the waste heat from themethanol plant for district heating, the total energy efficiencyreached more than 90% for all plants except Eþ CO2.
The estimated methanol costs were 11.8e14.6 V/GJex for allplants except Eþ CO2 (25.3 V/GJex). The methanol costs achievedfor some of the plant configurations can compete with theproduction cost of 2nd generation ethanol (12.0 V/GJex) but notwith the current commercial methanol price (7.1 V/GJex).
It was also shown that the electricity price has a significanteffect on the production cost since 23e65% of the total costs for thesix plant configurations are due to electricity consumption.
Of the six plant configurations, plants Eþ BþNG andEþ Bþ CCS are themost appropriate for the current energy system.Plant Eþ CO2 may be competitive in the future system.
References
[1] DONG Energy A/S. Renewable energy within the transport sector (The REtrol/VEnzin vision). Available from: www.elsamvpp.com/page.dsp?area¼1422.accessed at 2/17/2010.
[2] AmosWA.Costsofstoringand transportinghydrogen, report.Golden,Co:NationalRenewable Energy Laboratory. Available from: http://www.hydrogen.energy.gov/analysis_repository/project.cfm/PID¼114; 1998. accessed at 2/17/2010.
[3] Forsberg CW. Economics of meeting peak electricity demand using hydrogenand oxygen from base-load nuclear or off-peak electricity. Nuclear Technology2009;166(1):18e26.
[4] The Danish Energy Authority. Energy statistics. Available from: http://www.ens.dk/en-US/Info/publications/Sider/Forside.aspx; 2007. accessed at2/17/2010.

L.R. Clausen et al. / Energy 35 (2010) 2338e2347 2347
[5] TheDanishEnergyAuthority. Energy taxes (Energiafgiftsatserne). Available from:http://www.ens.dk/da-DK/Info/TalOgKort/Statistik_og_noegletal/Energipriser_og_afgifter/Energiafgifter/Sider/Forside.aspx (in danish), accessed at 2/17/2010.
[6] Mignard D, Pritchard C. On the use of electrolytic hydrogen from variablerenewable energies for the enhanced conversion of biomass to fuels. ChemicalEngineering Research and Design 2008;86(5):473e87.
[7] Specht M, Bandi A, Baumgart F, Muray CM, Gretz J. Synthesis of methanol frombiomass/CO2 resources. In: Riemer P, Elliasson B, Wokaun A, editors. Green-house gas control technologies, Interlaken, Switzerland. Oxford: Elsevier;1999. p. 723e7.
[8] Gassner M, Maréchal F. Thermo-economic optimisation of the integration ofelectrolysis in synthetic natural gas production from wood. Energy 2008;33(2):189e98.
[9] Ouellette N, Rogner HH, Scott DS. Hydrogen from remote excesshydroelectricity. Part II: hydrogen peroxide or biomethanol. Int J HydrogenEnergy 1995;20(11):873e80.
[10] Sues A, Jura�s�cík M, Ptasinski K. Exergetic evaluation of 5 biowastes-to-biofuelsroutes via gasification. Energy 2010;35(2):996e1007.
[11] Hamelinck CN, Faaij APC. Future prospects for production of methanol andhydrogen from biomass, report NWS-E-2001-49. Utrecht, The Netherlands:Utrecht University, Copernicus Institute. Available from: http://www.mtholyoke.edu/courses/tmillett/course/geog_304B/e2001-49.pdf; 2001.accessed at 1/27/2010.
[12] Elmegaard B, Houbak N. DNA e a general energy system simulation tool. In:Amundsen J, et al., editors. SIMS 2005, 46th conference on simulation andmodeling, Trondheim, Norway. Tapir Academic Press; 2005. p. 43e52.
[13] Homepage of the thermodynamic simulation tool DNA. Available from: http://orbit.dtu.dk/query?record¼231251. Technical University of Denmark (DTU),accessed at 2/17/2010.
[14] Bejan A, Tsatsaronis G, Moran M. Thermal design & optimization. John Wileyand Sons Inc.; 1996.
[15] Steynberg A, Dry M. FischereTropsch technology. Elsevier; 2004. p. 315.[16] Danish Energy Authority. Elkraft System and Eltra. Technology data for
electricity and heat generating plants. ISBN: 87-7844-502-7 (webedition: 87-7844-503-5). Available from: www.energinet.dk/NR/rdonlyres/4F6480DC-207B-41CF-8E54-BF0BA82926D7/0/Teknologikatalog050311.pdf;2005. accessed at 2/17/2010.
[17] Kruse B, Grinna S, Buch C. Hydrogen e status and possibilities, report no. 6.The Bellona foundation. Available from: http://bellona.org/filearchive/fil_Hydrogen_6-2002.pdf; 2002. accessed at 2/17/2010.
[18] Clausen LR.Designandmodelingof amethanol plant for theREtrol vision (Designog modellering af metanolanlæg til VEnzin-visionen), report. Kgs. Lyngby,Denmark: Technical University of Denmark (DTU) (in danish). Available from:http://orbit.dtu.dk/getResource?recordId¼256657&objectId¼1&versionId¼1;2007. accessed at 2/17/2010.
[19] Andersen L, Elmegaard B, Qvale B, Henriksen U, Bentzen JD, Hummelshøj R.Modelling the low-tar BIG gasification concept. In: The 16th International
conference on efficiency, cost, optimization, simulation, and environmentalimpact of energy systems (ECOS). Denmark: Technical University of Denmark(DTU); 2003. p. 1073e9.
[20] Ahrenfeldt J, Henriksen U, Jensen TK, Gøbel B, Wiese L, Kather A, et al. Vali-dation of a continuous combined heat and power (CHP) operation of a two-stage biomass gasifier. Energy & Fuels 2006;20(6):2672e80.
[21] Gaoa J, Houa Z, Liub X, Zengc Y, Luob M, Zhenga X. Methane autothermalreforming with CO2 and O2 to synthesis gas at the boundary between Ni andZrO2. Int J Hydrogen Energy 2009;34(9):3734e42.
[22] IPCC. IPCC special report on carbon dioxide capture and storage. Availablefrom: http://www.ipcc.ch/publications_and_data/publications_and_data_reports_carbon_dioxide.htm; 2005. accessed at 2/17/2010.
[23] The Methanol Institute (MI). Methanol production. Available from: http://www.methanol.org/contentIndex.cfm?section¼methanol&topic¼factSheets&title¼Methpr. accessed at 2/17/2010.
[24] The Danish Energy Authority. Energy statistics: construct your own tablesand graphs. Available from: http://www.ens.dk/en-US/Info/FactsAndFigures/Energy_statistics_and_indicators/Annual%20Statistics/Construct%20your%20own%20tables%20and%20graphs/Sider/Forside.aspx. accessed at 2/17/2010.
[25] Xu Z, Gordon M, Lind M, Østergaard J. Towards a Danish power systemwith 50%windesmartgridsactivities inDenmark. In: IEEEPower&EnergySocietyGeneralMeeting; 2009. p. 1e8. http://orbit.dtu.dk/getResource?recordId¼251984&objectId¼1&versionId¼1, [accessed 17.02.10].
[26] Hydrogen Technologies (a subsidiary of StatoilHydro). Water electrolysers.Available from: www.electrolysers.com/. accessed at 2/17/2010.
[27] Enerdry. Steam dryer economics. Available from: http://www.enerdry.com/index.php?id¼489; 2003. accessed at 2/17/2010.
[28] Choren Industries GmbH. Power and heat from biomass. Available from:http://www.choren.com/dl.php?file¼Electricity_and_heat_from_biomass_6.pdf.accessed at 2/17/2010.
[29] Fleisch TH, Sills RA, Briscoe MD. Emergence of the gas-to-liquids industry:a review of global GTL developments. Journal of Natural Gas Chemistry2002;11:1e14.
[30] DONG Energy A/S. Energy together: scenario 1 e The free market (det friemarked). Electricity price. Available from: http://www.energyserver.net/ET1/Default%20inkl%20CO2/_html/Default%20Scenario%201.htm#Elpriser; 2004.accessed at 1/31/2007. Natural gas price: http://www.energyserver.net/ET1/Default%20inkl%20CO2/Default%20Scenario%201.xls, accessed at 1/31/2007.(in Danish).
[31] Methanex (worlds largest methanol producer). Commercial methanol price inEurope. Valid July 1eSeptember 30; 2009. www.methanex.com/products/methanolprice.html, [accessed 17.02.10].
[32] Biogasol. Cost of 2nd generation ethanol. www.biogasol.dk, [accessed 17.02.10].[33] Kreutz TG, Larson ED, Liu G, Williams RH. FischereTropsch fuels from coal and
biomass, report. Princeton, New Jersey: Princeton Environmental Institute,Princeton University. Available from: http://www.princeton.edu/pei/energy/publications; 2008. accessed at 2/17/2010.

167
Appendix B. Paper II Proceedings Paper - Peer Reviewed Manuscript Clausen LR, Elmegaard B, Houbak N, Braun RJ. “Zero-dimensional model of a dimethyl ether (DME) plant based on gasification of torrefied biomass”. Proceedings of SIMS 50; Modeling of Energy Technology, 2009, ISBN 978-87-89502-88-5. Paper III is a more elaborated and updated study based on the same model as used in paper II.

Proceedings of SIMS 50Fredericia, Denmark
October 7–8, 2009
ZERO-DIMENSIONAL MODEL OF A DIMETHYL ETHER (DME) PLANT BASED ON GASIFICATION OF TORREFIED BIOMASS
Lasse Røngaard Clausen* and Brian Elmegaard
Technical University of Denmark, Department of Mechanical Engineering 2800 Lyngby, Denmark
Niels Houbak
DONG Energy 2450 Copenhagen, Denmark
Robert J. Braun
Colorado School of Mines, Engineering Division Golden, Colorado USA 80401
ABSTRACT
A model of a DME fuel production plant was designed and analyzed in Aspen Plus. The plant produces DME by catalytic conversion of a syngas generated by gasification of torrefied woody biomass. Torrefication is a mild pyrolysis process that takes place at 200-300°C. Torrefied biomass has properties similar to coal, which enables the use of commercially available coal gasification processing equipment. The DME plant model is integrated with a steam cycle that utilizes waste heat from the plant and covers the on-site electricity consumption. The plant model predicts a fuel production efficiency of 67 % (LHV) from torrefied biomass to DME and 70 % (LHV) if the exported electricity is included. When accounting for raw, untreated biomass, the efficiency for DME production is reduced to about 60 %. Keywords: biorefinery, biofuel, dimethyl ether, DME, torrefication, gasification, syngas, CO2 capture.
INTRODUCTION
One of the ways of reducing the CO2 emissions from the transportation sector is by increasing the use of biofuels in vehicular applications. Dimethyl ether (DME) is a diesel-like fuel that can be produced from biomass in processes very similar to methanol production processes. Combustion of DME produces lower emissions of NOx than combustion of diesel, with no particulate matter or SOx in the exhaust [1], however it also requires storage pressures in excess of 5 bars to maintain a liquid state. The DME production plant investigated in this paper is of large-scale (> 2,000 tPD) because of the better economics compared to small-scale production of DME [2] [3]. Larger–scale plants, however, have higher feedstock transportation costs which increase the attractiveness of
torrefied wood pellets as a feedstock instead of conventional wood pellets. Torrefication of biomass also makes it possible to use commercially available coal gasification processing equipment1
. This paper documents the design of a DME plant using Aspen Plus modeling tools with a focus on process integration and waste heat recovery. Thermodynamic performance of the resulting plant configuration is presented and discussed.
Torrefication of biomass
Torrefaction of biomass is a mild pyrolysis process where biomass is heated to 200-300°C. *Corresponding author. Phone: +45 45 25 41 65, email: [email protected] 1 See the Gasification World Database [4] for a list of commercial plants.
229

The process alters the properties of biomass in a number of ways, including increased energy density, improved grindability/pulverization, better pelletization behavior, and higher resistance to biodegradation and spontaneous heating. This conversion process enables torrefied biomass to achieve properties very similar to coal, and therefore allows the altered biomass feedstock to be handled and processed using conventional coal preparation methods. Additionally, torrefied biomass can be stored in outdoor environments and the electricity consumption for milling and pelletization is significantly lower than that of wood [5] [6]. DESIGN OF THE DME PLANT
A process flow sheet of the DME plant design is shown in Figure 1. Plant design aspects related to feedstock preparation, gasification, syngas cleanup, and DME synthesis and distillation are described next and are followed by a brief discussion of electricity co-production and Aspen Plus modeling techniques. Feedstock
The feedstock employed in this design analysis is torrefied wood pellets. The composition is (Weight-%): 50.0 % C, 40.8 % O, 5.7 % H, 1.5 % H2O, 0.29 % N, 0.01 % S, 1.7 % Ash [7]. Pretreatment & feeding
The pretreatment and feeding of torrefied biomass is assumed to be accomplished with existing coal-based commercial technology [5] [6]. The torrefied biomass is milled to powder with an electricity consumption similar to milling of bituminous coal [5]; a power input equivalent to 0.29 %2
[8 of the thermal energy input (LHV) of
torrefied biomass ] is utilized. The resulting biomass powder is pressurized with lock hoppers using CO2 from the carbon capture process downstream. It is envisioned that pneumatic feeders - also driven by captured CO2 gases - are used for feeding the torrefied biomass to the gasifier. 2 In [5] the power consumption is reported to be around 1 % of the thermal input of torrefied biomass (LHV). It is assumed that the size of the mill used in the experiments is the reason for the higher value (heavy-duty cutting mill, 1.5 kWe).
Gasification
A commercial, dry-fed, slagging entrained flow coal gasifier is used for gasifying the torrefied wood powder. The gasifier is oxygen blown, pressurized to 40 bar and steam moderated [7]. The oxygen supply is provided by a cryogenic air separation plant which delivers oxygen with a purity of 99.6 %3
[9 while consuming electricity at a
rate of 1.0 MWe/(kg O2/s) ]4. A gas quench using 200°C recycled product gas downstream of the cyclone lowers the temperature of the syngas from 1300°C to 900°C5
. The composition of the syngas is calculated by assuming chemical equilibrium at 1300°C. The steam used for gasification is generated by waste heat boilers in the plant.
Gas cooling and water gas shift
The syngas is further cooled to approximately 200°C by generating superheated steam for primarily the integrated steam cycle. A sulfur tolerant6 water gas shift (WGS) reactor adjusts the H2/CO-ratio to 1 in order to optimize DME synthesis7 [11 ]. The gas is then cooled to 25°C prior to acid-gas cleaning step. Gas cleaning incl. CCS
Gas cleaning of biomass syngas for DME synthesis includes an acid-gas cleaning step, a filter and/or cyclone for particle removal and guard beds8
[12 placed just before the synthesis
reactor ] [8]. The acid-gas cleaning step is done with Selexol9
3 Chosen instead of 95 % purity in order to minimize inert buildup in the synthesis recycle loop. 95 % purity would only give a 1.6 % reduction in electricity consumption and a 4 % reduction in capital cost
and removes sulfur
[9]. 4 0.36 kWe / (mn
3 O2/h) used in reference. 5 The electricity consumption for recycling gas is not accounted for since pressure drops through components are not included. 6 E.g. Haldor Topsoe produces such catalysts [10] 7 Given by the chemical reaction equation: 3H2+3CO ↔ CH3OCH3+CO2 8 ZnO and active carbon filters 9 Another physical solvent such as Rectisol could also be used. Rectisol can clean the gas to lower sulfur concentrations (0.1 ppm [13] compared to 1 ppm for Selexol [14]) which is preferred because of the very low sulfur tolerance of the synthesis catalysts [12]. Cleaning with Rectisol is more expensive than Selexol. This increased expense might however be offset by the less frequent need to regenerate the guard beds [12].
230

Air separation
unit
Particles (ash)
Milling
Oxygen~ Nitrogen
Air
TorrefiedBiomass
WGSreactor
Gas Cleaning (Selexol)
900 C
196 C 25 C
DME reactorGas-liquid separator
260 C 16 C
CO2
PressurizationFeeding
CO2 5 MWe
burner
Air
DME
methanol
Water
95 % recycle
Fluegas
H2S, COS
2
4
5
100 kg/s1860 MJ/s
14 kg/s
43 kg/s
10 kg/s600 C
45 kg/s
1 kg/s1 kg/s
CO2 (H2, CO, CH4, DME)
7
6
92 kg/s, 100 bar
Water
10 kg/s
1 kg/s
Steam cycle40 bar, 600 C
303 MJ/s
33 MJ/s
88 MJ/s
189 Mwe
244 MJ/s26 MJ/s
1246 MJ/s
CO2
140 bar
45 MWe
16 MWe
27 MWe
27 MWe
10 bar
23 MJ/s
218 MJ/s
21 MJ/s
Slag
~2 kg/s
1
15 MWe
252 kg/s
97 kg/s
155 kg/s
Entrained flow gasifier
40 bar1300 C
Steam
3
Figure 1. Flow sheet of the modeled DME plant. Some important parameter values are shown.
231

components (H2S and COS) and CO2 in either two separate streams or one combined stream. The latter is an option because the sulfur content in biomass syngas is very low. If CO-removal is not used, the sulfur components are oxidized and vented [8]. The captured CO2 is compressed to 140 bar for underground storage. The CO2 content in the syngas after the wash is 2 % and the H2S + COS content is about 1 ppm [14]. The only energy input for the Selexol process is electricity to run a pump that pressurizes the physical solvent. Synthesis of DME
The syngas is compressed to 100 bar before entering the synthesis reactor. The reactor is modeled as a liquid-phase reactor operating at 260°C10
[15 where the product stream is assumed to
be in chemical equilibrium ]. The reactor operating temperature is maintained at 260°C by a water-jacketed cooler that generates saturated steam at 40 bar. The product gas is then cooled to about 16°C and a gas-liquid separator separates the liquid DME from the unconverted syngas. 95 %11
5 of the unconverted syngas is recycled to the
synthesis reactor and the remaining 5 % is sent to an off-gas burner that augments the steam generation for electricity co-production in the Rankine power cycle. Distillation
The liquid stream from the gas-liquid separator is distilled by fractional distillation in two columns. The first column is a 10-stage topping column operating at 10 bar. The purge gas from the topping column is mixed with the separator off-gas and sent to the same burner previously mentioned. The second column separates the water and methanol from the DME. The methanol is recycled to the synthesis reactor and the water is either sent to waste water treatment or injected into the gasifier as steam. The column
10 A low temperature moves the chemical equilibrium towards DME but slows down the chemical reactions. A too high temperature can cause catalyst deactivation. “In practice, a reactor operating temperature of 250-280ºC balances kinetic, equilibrium, and catalyst activity considerations” [16]. 11 The recycle percentage is maximized in order to increase DME production while not generating a too high recycle mass flow. For comparison the Haldor Topsoe fixed-bed system design uses a recycle percentage of 93-98 % [17].
is modeled with 15 stages at 10 bar. In this configuration, the DME liquid product achieves a purity of 99.99 mol %. Power production
A simple steam cycle power plant is thermally integrated into the biorefinery configuration. It produces enough electric power from waste heat recovery to meet both the on-site electricity demand as well as excess for export to the utility grid. Approximately 58% of the heat addition to the steam power cycle comes from cooling of the syngas after gasification, 36% from the synthesis reactor and about 6% from on-site gas burner/boiler. The temperature of the steam entering the steam turbines is 600°C at 40 bar. Modeling tool
The modeling was done with Aspen Plus, which is a component-based commercial modeling tool with integrated thermodynamic, chemical and physical properties for a large number of gases and liquids. Aspen Plus excels at modeling of chemical process plants, but its library of unit operations also enables detailed modeling and simulation of power plants. The handling of solids is however not optimal12
. The ability to estimate physical properties of gas-liquid mixtures was particularly helpful in the plant design and simulation effort, especially in unit operations containing distillation columns and liquid fuel reactor product streams that need to account for the solubility of CO2.
Aspen Plus has two built-in solvers – a sequential solver and a simultaneous solver (EO). The sequential solver was used primarily for generating start guesses for the simultaneous solver. The simultaneous EO solver was employed due to improved convergence and robustness of the process flowsheet, especially where recycle streams play a prominent role in the plant configuration. RESULTS
The results from the simulation of the DME plant are presented in the following. In the flow sheet in figure 1 some of the important thermodynamic
12 E.g. solids are not supported when using the simultaneous solver (EO)
232
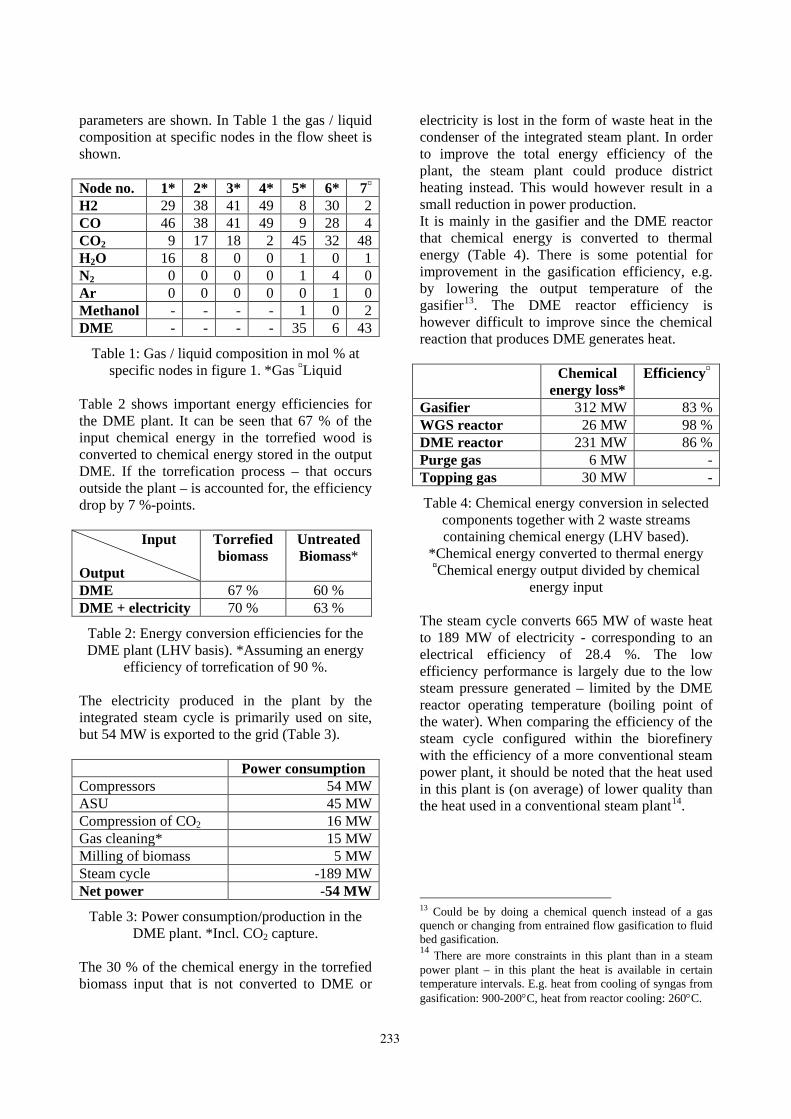
parameters are shown. In Table 1 the gas / liquid composition at specific nodes in the flow sheet is shown. Node no. 1* 2* 3* 4* 5* 6* 7¤ H2 29 38 41 49 8 30 2 CO 46 38 41 49 9 28 4 CO2 9 17 18 2 45 32 48 H2O 16 8 0 0 1 0 1 N2 0 0 0 0 1 4 0 Ar 0 0 0 0 0 1 0 Methanol - - - - 1 0 2 DME - - - - 35 6 43
Table 1: Gas / liquid composition in mol % at specific nodes in figure 1. *Gas ¤Liquid
Table 2 shows important energy efficiencies for the DME plant. It can be seen that 67 % of the input chemical energy in the torrefied wood is converted to chemical energy stored in the output DME. If the torrefication process – that occurs outside the plant – is accounted for, the efficiency drop by 7 %-points. Input Output
Torrefied biomass
Untreated Biomass*
DME 67 % 60 % DME + electricity 70 % 63 %
Table 2: Energy conversion efficiencies for the DME plant (LHV basis). *Assuming an energy
efficiency of torrefication of 90 %. The electricity produced in the plant by the integrated steam cycle is primarily used on site, but 54 MW is exported to the grid (Table 3). Power consumption Compressors 54 MW ASU 45 MW Compression of CO2 16 MW Gas cleaning* 15 MW Milling of biomass 5 MW Steam cycle -189 MW Net power -54 MW
Table 3: Power consumption/production in the DME plant. *Incl. CO2 capture.
The 30 % of the chemical energy in the torrefied biomass input that is not converted to DME or
electricity is lost in the form of waste heat in the condenser of the integrated steam plant. In order to improve the total energy efficiency of the plant, the steam plant could produce district heating instead. This would however result in a small reduction in power production. It is mainly in the gasifier and the DME reactor that chemical energy is converted to thermal energy (Table 4). There is some potential for improvement in the gasification efficiency, e.g. by lowering the output temperature of the gasifier13
. The DME reactor efficiency is however difficult to improve since the chemical reaction that produces DME generates heat.
Chemical energy loss*
Efficiency¤
Gasifier 312 MW 83 % WGS reactor 26 MW 98 % DME reactor 231 MW 86 % Purge gas 6 MW - Topping gas 30 MW -
Table 4: Chemical energy conversion in selected components together with 2 waste streams containing chemical energy (LHV based).
*Chemical energy converted to thermal energy ¤Chemical energy output divided by chemical
energy input The steam cycle converts 665 MW of waste heat to 189 MW of electricity - corresponding to an electrical efficiency of 28.4 %. The low efficiency performance is largely due to the low steam pressure generated – limited by the DME reactor operating temperature (boiling point of the water). When comparing the efficiency of the steam cycle configured within the biorefinery with the efficiency of a more conventional steam power plant, it should be noted that the heat used in this plant is (on average) of lower quality than the heat used in a conventional steam plant14
.
13 Could be by doing a chemical quench instead of a gas quench or changing from entrained flow gasification to fluid bed gasification. 14 There are more constraints in this plant than in a steam power plant – in this plant the heat is available in certain temperature intervals. E.g. heat from cooling of syngas from gasification: 900-200°C, heat from reactor cooling: 260°C.
233

Carbon analysis
Since the feedstock for DME production is biomass, it is not considered a problem - with regards to the greenhouse effect - to vent CO2 from the plant. But since CO2 is captured in order to condition the syngas, the pure CO2 stream might as well be stored, as vented. This gives a positive greenhouse effect and might be economic in the future, if CO2 capture from the atmosphere is rewarded in the same way as emission of CO2 is taxed. If not, some of the biomass could be substituted by coal – matching the amount of CO2 captured. In the designed plant the feedstock contains 50 kg/s of carbon and the DME product (43 kg/s) contains 22 kg/s of carbon. This means that 45 % of the input carbon is stored in the product DME, this will eventually be combusted and the CO2 will most likely be vented to the atmosphere. The rest of the carbon (28 kg/s) is either captured in the syngas conditioning (14 kg/s) or vented as flue gas from the burner (14 kg/s). The vented CO2 from the burner could be captured as well – the most economical way probably being oxy-fuel capture since most of the fuel is CO2 and an air separation unit is already available on-site. CONCLUSION
A zero-dimensional model of a DME plant was designed and analyzed using Aspen Plus. A simple steam cycle was integrated with the DME plant in order to use the waste heat from the plant to co-produce electricity. The produced electricity meets the on-site electricity consumption (135 MW) with a surplus (54 MW) being exported to the grid. The DME plant model simulation resulted in an energy efficiency of 67 % from torrefied biomass to DME (LHV) and 70 % if the exported electricity is included. However if the torrefaction process is included the energy efficiencies drops to 60 % and 63% respectively. REFERENCES
[1] International DME association (IDA). DME - Clean Fuel for Transportation. http://www.aboutdme.org/index.asp?bid=219
[2] Boerrigter H. Economy of Biomass-to-Liquids (BTL) plants, report: ECN-C--06-019. Petten, The Netherlands: ECN, 2006. http://www.ecn.nl/publications/
[3] Larson ED, Williams RH, Jin H. Fuels and electricity from biomass with CO2 capture and storage. In: proceedings of the 8th International Conference on Greenhouse Gas Control Technologies, Trondheim, Norway, June 2006.
[4] The National Energy Technology Laboratory (NETL) (a part of the U.S. Department of Energy), Gasification World Database 2007, http://www.netl.doe.gov/technologies/coalpower/gasification/database/database.html
[5] Kiel JHA, Verhoeff F, Gerhauser H, Meuleman B. BO2-technology for biomass upgrading into solid fuel − pilot -scale testing and market implementation. In: Proceedings for the 16th European Biomass Conference & Exhibition, Valencia, Spain, 2008, p. 48-53. http://www.ecn.nl/publications/
[6] Bergman PCA, Boersma AR, Kiel JHA, Prins MJ, Ptasinski KJ, Janssen FJJG. Torrefaction for entrained-flow gasification of biomass, report: ECN-C--05-067. Petten, The Netherlands: ECN, 2005. http://www.ecn.nl/publications/
[7] van der Drift A, Boerrigter H, Coda B, Cieplik MK, Hemmes K. Entrained flow gasification of biomass; Ash behaviour, feeding issues, system analyses, report: ECN-C--04-039. Petten, The Netherlands: ECN, 2004. http://www.ecn.nl/publications/
[8] Kreutz TG, Larson ED, Liu G, Williams RH. Fischer-Tropsch Fuels from Coal and Biomass, report. Princeton, New Jersey: Princeton Environmental Institute, Princeton University, 2008. http://www.princeton.edu/pei/energy/publications
234
[9] Andersson K, Maksinen P. Process
evaluation of CO2 free combustion in an O2/CO2 power plant, report no. T2002-258. Göteborg, Sweden: Chalmers University of Technology, 2002.
[10] Haldor topsoe. Sulphur tolerant shift conversion. http://www.topsoe.com/Business_areas/Gasification-based/Processes/Sour_shift.aspx
[11] Larson ED, Jin H, Celik FE. Large-scale gasification-based coproduction of fuels and electricity from switchgrass. Biofuels, Biorprod. Bioref. 2009;3:174–194.
[12] van der Drift A, Boerrigter H. Synthesis gas from biomass, report: ECN-C--06-001. Petten, The Netherlands: ECN, 2006. http://www.ecn.nl/publications/
[13] Linde Engineering. Rectisol wash. Homepage accessed January 28 2009. http://www.linde-engineering.com/process_plants/hydrogen_syngas_plants/gas_processing/rectisol_wash.php
[14] Sharp CR, Kubek DJ, Kuper DE, Clark ME, DiDio M. Recent Selexol operating experience with gasification, including CO2 capture. In: Proceedings for the 5th European Gasification Conference, Noordwijk, the Netherlands, 2002.
[15] Gogate MR, Vijayaraghavan P. A single-stage, liquid-phase dimethyl ether synthesis process from syngas: thermodynamic analysis of the LPDME process system. Fuel Science and Technology International 1992;10(3):281-311.
[16] Larson ED, Tingjin R. Synthetic fuel production by indirect coal liquefaction. Energy for Sustainable Development 2003;7(4):79-102.
[17] Voss B, Joensen F, Hansen JB. Preparation of fuel grade dimethyl ether, US Pat. 5908963. June 1, 1999.
235

175
Appendix C. Paper III ISI Journal Paper Clausen LR, Elmegaard B, Houbak N. “Technoeconomic analysis of a low CO2 emission dimethyl ether (DME) plant based on gasification of torrefied biomass”. Energy 2010;35(12):4831-4842. Paper III is a more elaborated and updated study based on the same model as used in paper II.

lable at ScienceDirect
Energy 35 (2010) 4831e4842
Contents lists avai
Energy
journal homepage: www.elsevier .com/locate/energy
Technoeconomic analysis of a low CO2 emission dimethyl ether (DME) plant basedon gasification of torrefied biomass
Lasse R. Clausen a,*, Brian Elmegaard a, Niels Houbak b
a Section of Thermal Energy Systems, Department of Mechanical Engineering, The Technical University of Denmark (DTU), Nils Koppels Allé Bld. 403, Room 211,DK-2800 Kgs. Lyngby, DenmarkbDONG Energy A/S, A.C. Meyers Vænge 9, DK-2450 Copenhagen, Denmark
a r t i c l e i n f o
Article history:Received 30 March 2010Received in revised form18 August 2010Accepted 2 September 2010Available online 18 October 2010
Keywords:BiorefineryBiofuelTorreficationGasificationSyngasCO2 capture
* Corresponding author. Tel.: þ45 20712778; fax: þE-mail address: [email protected] (L.R. Clausen).
1 For hydrogen, the catalytic conversion occurs inreacts with CO to produce hydrogen. Hydrogenfermentation.
0360-5442/$ e see front matter � 2010 Elsevier Ltd.doi:10.1016/j.energy.2010.09.004
a b s t r a c t
Two models of a dimethyl ether (DME) fuel production plant were designed and analyzed in DNA andAspen Plus. The plants produce DME by either recycle (RC) or once through (OT) catalytic conversion ofa syngas generated by gasification of torrefied woody biomass. Torrefication is a mild pyrolysis processthat takes place at 200e300 �C. Torrefied biomass has properties similar to coal, which enables the use ofcommercially available coal gasification processing equipment. The DME plants are designed with focuson lowering the total CO2 emissions from the plants; this includes e.g. a recycle of a CO2 rich stream toa CO2 capture plant, which is used in the conditioning of the syngas.
The plant models predict energy efficiencies from torrefied biomass to DME of 66% (RC) and 48% (OT)(LHV). If the exported electricity is included, the efficiencies are 71% (RC) and 64% (OT). When accountingfor energy loss in torrefaction, the total efficiencies are reduced to 64% (RC) and 58% (OT). The two plantsproduce DME at an estimated cost of $11.9/GJLHV (RC) and $12.9/GJLHV (OT). If a credit is given for storingthe CO2 captured, the future costs may become as low as $5.4/GJLHV (RC) and $3.1/GJLHV (OT).
� 2010 Elsevier Ltd. All rights reserved.
1. Introduction
One of the ways of reducing the CO2 emissions from the trans-portation sector is by increasing the use of biofuels in vehicularapplications. Dimethyl ether (DME) is a diesel-like fuel that can beproduced from biomass in processes very similar to methanolproduction processes. Combustion of DME produces lower emis-sions of NOx than combustion of diesel, with no particulate matteror SOx in the exhaust [1], however, it also requires storage pressuresin excess of 5 bar to maintain a liquid state (this pressure is similarto LPG). Other “advanced” or “second generation” biofuels includemethanol, FischereTropsch diesel and gasoline, hydrogen andethanol. Like DME and methanol, FischereTropsch fuels andhydrogen are also produced by catalytic conversion of a syngas.1
Ethanol could also be produced by catalytic conversion ofa syngas (at research stage), but is typically produced by biological
45 45884325.
a WGS reactor, where steamcan also be produced by
All rights reserved.
fermentation. Of these fuels, only hydrogen can be produced ata higher biomass to fuel energy efficiency than methanol and DME.Ethanol (produced from fermentation of cellulosic biomass) andFischereTropsch fuels have lower biomass to fuel energy efficiencythan methanol and DME [2]. The advantage of FischereTropschdiesel and gasoline e as well as methanol and ethanol blended ingasoline e is that these fuels can be used in existing vehicle powertrains, while hydrogen, DME and neat ethanol and methanolrequire new or modified vehicle power trains.
The relative low cost needed to implement DME as a trans-portation fuel, together with its potential for energy efficientproduction and low emissions (including low well-to-wheelgreenhouse gas emissions) when used in an internal combustionengine, makes DME attractive as a diesel substitute [2].
Two DME production plants, based on syngas from gasificationof torrefied wood pellets, are investigated in this paper.
� The OT (once through) plant uses once through synthesis andthe unconverted syngas is used for electricity production ina combined cycle.
� The recycle (RC) plant recycles unconverted syngas to the DMEreactor to maximize DME production.

Table 1Process design parameters used in the modeling.
Feedstock Torrefied wood pellets, composition (mass%):49.19% C, 40.14% O, 5.63% H, 3.00% H2O, 0.29% N,0.06% S, 0.04% Cl, 1.65% Ash [9,13]. LHV¼ 19.9 MJ/kg[9]
Pretreatment Power consumption for milling¼ 0.29% of the thermalinput (LHV)a
Pressurizing andfeeding
Pressurizing: CO2/biomass mass-ratio¼ 6.0%. Feeding:CO2/biomass mass-ratio¼ 12.0%
Gasifier Pexit¼ 45 bar [12]. DP¼ 1.2 bar. Temperature beforegas quench¼ 1300 �Cb. Temperature after gasquench¼ 900 �C. Steam/biomass¼ 2.9 mass%. Carbonconversion¼ 100%c. Heat loss: 2.7% of the thermalinput is lost to surroundings and 1% of the thermalinput is used to generate steamd.
Air separation unit O2 purity¼ 99.6 mole%. Electricityconsumption¼ 1.0 MWe/(kg-O2/s) [23]
Water gas shift(WGS) reactor
Pressure drop¼ 2 bar. Steam/carbon mole-ratios¼ 0.41(RC) or 0.47 (OT)
DME synthesis Liquid-phase reactor. Reactor outlet: T¼ 280 �Ce,P¼ 56 bar (RC) or 51 bar (OT). DPreactor¼ 2.6 bar.
Distillation Number of stages in distillation columns: 20 (toppingcolumn), 30 (DME column). P¼ 9.0 bar (toppingcolumn), 6.8 bar (DME column).
Cooling COP¼ 1.2Heat exchangers DTmin¼ 10 �C (gaseliq) or 30 �C (gasegas).Steam plant hisentropic for turbines in the RC plant: IP1 (55 bar,
600 �Cf)¼ 86%, IP2 (9 bar, 600 �Cf)¼ 88%, LP (2.0 bar,383 �C. Outlet: 0.042 bar, vapor fraction¼ 1.00)¼ 89%g.hisentropic for turbines in the OT plant: HP (180 barf,600 �Cf)¼ 82%, IP1 (55 bar, 600 �Cf)¼ 85%, IP2 (16 bar,600 �Cf)¼ 89%, LP (2.0 bar, 311 �C. Outlet: 0.042 bar,vapor fraction¼ 0.97)¼ 88%g. hmechanical, turbine¼ 98%g.helectrical¼ 98.6%g. TCondensing¼ 30 �C (0.042 bar).
Gas turbine Air compressor: pressure ratio¼ 19.5 g,hpolytropic¼ 87%g. Turbine: TIT¼ 1370 �Cg,hisentropic¼ 89.8%g. hmechanical¼ 98.7%g.helectrical¼ 98.6%g
Compressors hpolytropic¼ 80% (4 stage CO2 compression from 1 to150 bar) [24], 85% (3 stage O2 compression from 1 to46 bar), 80% (syngas compressors)g. hmechanical¼ 94%g.helectrical¼ 100%
a [15]. In [9] the power consumption for milling torrefied biomass and bituminouscoal are determined experimentally to be the same (1% of the thermal input). It isassumed that the size of themill used in the experiments is the reason for the highervalue (heavy-duty cutting mill, 1.5 kWe).
b In [13], 1300 �C is used for entrained flow gasification of torrefied biomass.Addition of silica or clay to the biomass to make the gasifier slagging at this rela-tively low temperature is probably needed [13], but these compounds are not addedin the modeling.
Entrained flow gasification
Milling & pressurization
Gas conditioning
DME synthesis
Syngas
Separation
Liquid
Electricity production
Torrefied wood
DME
Unconverted syngas
Fig. 1. Simplified flow sheet of the DME plant models.
L.R. Clausen et al. / Energy 35 (2010) 4831e48424832
Both plants uses CO2 capture to condition the syngas for DMEsynthesis and the captured CO2 is sent to underground storage. Theplants are designed with focus on lowering the total CO2 emissionfrom the plants, even though the feedstock used is biomass.Capturing and storing CO2 from a biomass plant gives a negativegreenhouse effect, and can be an interesting concept, if a credit isgiven for storing CO2 generated from biomass. The concept ofreceiving a credit for storing CO2 generated from biomass has beeninvestigated before (e.g., in [3]), but a study of the thermodynamicsand economics of a biomass-based liquid fuel plant, where thefocus in the design of the plant, was lowering the total CO2 emissionfrom the plant is not presented in the literature.
The DME plants modeled are of large-scale (>2000 tonnes perday) because of the better economics compared to small-scaleproduction of DME [3,4]. Larger-scale plants, however, havehigher feedstock transportation costs, which increase the attrac-tiveness of torrefied wood pellets as a feedstock instead ofconventional wood pellets. Torrefication of biomass also makes itpossible to use commercially available coal gasification processingequipment.2
Production of DME from biomass has been investigated before(e.g., [5,6]). In [6] the feedstock used is black liquor and in [5] thefeedstock used is switchgrass.
This paper documents the design of two DME plants usingDNA3 [7,8] and Aspen Plus modeling tools. Thermodynamic andeconomic performance of the plant configurations are presentedand discussed.
c 95% is used in [15] for an entrained flow coal-slurry gasifier, but because thegasifier used in this study is dry fed, the carbon conversion is more than 99% (99,5%is a typical figure) [25]. The extensive use of slag recycle (fly ash is also recycled backto the gasifier) because of the low ash content in biomass increases this figure toalmost 100%.
d [25] (for a coal gasifier). The 2.7% includes the heat loss from the gas coolerplaced after the gasifier. In [25] 2% of the thermal input is used to generate steam.The figure is reduced to 1% because the gasification temperature is lowered from1500e1600 �C to 1300 �C.
e A low temperature moves the chemical equilibrium towards DME, but slowsdown the chemical reactions, on the other hand, a too high temperature causescatalyst deactivation: “In practice, a reactor operating temperature of 250e280 �Cbalances kinetic, equilibrium, and catalyst activity considerations” [21].
f The integrated steam cycles are modeled as generic cycles. Commercial steamturbines for 600 �C are not available at these low pressures (e.g. the Siemens SST 900steam turbine can have inlet conditions of maximum 585 �C and 165 bar).
g [15]. Note for gas turbine: the gas turbine is a natural gas fired gas turbine (GE7FB) that is fitted to use syngas. In [15], simulations of the gas turbine operating onsyngas show that themair compressor/mturbine ratio can be 0.91e in this paper the ratio
1.1. Torrefication of biomass
Torrefaction of biomass is a mild pyrolysis process, taking placeat 200e300 �C. The process alters the properties of biomass ina number of ways, including increased energy density, improvedgrindability/pulverization, better pelletization behavior, and higherresistance to biodegradation and spontaneous heating. Thisconversion process enables torrefied biomass to achieve propertiesvery similar to coal, and therefore allows the altered biomassfeedstock to be handled and processed using conventional coalpreparation methods. Additionally, torrefied biomass can be storedin outdoor environments and the electricity consumption formilling and pelletization is significantly lower than that of wood[9,10].
is 0.94. This high ratio is a result of the composition of the unconverted syngas(contains 80 mole% H2). Typically, the TIT would be de-rated by 20e30 �C whenoperating on syngas (compared to natural gas) or up to 50 �C when operating onhydrogen. It is however assumed (as suggested in [15]) that the historic increase inTIT will continue, why the TIT of 1370 �C has not been de-rated.
2 See the Gasification World Database [11] for a list of commercial gasificationplants.
3 Because of DNA’s excellent solids handling, DNA was used to model the gasifier.The rest of the modeling was done with Aspen Plus.

Absorber
5
8
CO2 (+CO+H2)
9
11
273
gas
CO2
7
Stripper
17N2
N2(+H2S+CO2)
CO2 (+N2)
35
344
12
33
32
18
21
19
2320
24
Water
22
25
16
Make-up methanol26
1 MWe
~0 MWe
2 MWe
14 MWe
4 MWe
~0 MWe
8 MWe
17 MWe
13 MWe
11 MWth
87 MWth
10 MWth
13 MWth
3 MWth
0.2 MWth
1 2
6Clean gas
10 13
14
15
28
~H2S
29 30
31
~Meoh+CO2t (C) p (bar) m (kg/s)
1 30 42.0 227.42 -1 41.8 230.13 -50 40.8 107.54 0 40.6 107.55 -21 40.8 552.36 -20 15.0 2.77 78 43.2 2.78 -20 15.0 549.69 -31 4.0 483.1
10 -38 1.0 439.211 -38 1.0 175.712 -46 40.8 175.713 -38 1.0 263.514 0 1.0 6.315 -41 1.0 6.3
t (C) p (bar) m (kg/s)16 0 1.0 6.317 -41 1.0 254.218 56 1.0 254.219 30 1.0 0.220 65 1.0 254.121 65 1.0 7.622 66 40.8 246.523 110 1.5 0.224 75 1.5 7.425 20 40.8 0.1
t (C) p (bar) m (kg/s)26 -31 40.8 254.027 -50 40.8 254.028 -31 4.0 66.429 30 46.2 13.930 30 46.2 7.031 -38 1.0 43.9
t (C) p (bar) m (kg/s)32 -39 1.0 9.333 -39 1.0 53.234 30 46.2 98.835 146 150 98.8
~CO2
~CO2
Fig. 2. Flow sheet of the acid gas removal (AGR) step incl. CO2 compression, showing mass flows, electricity consumption and heat transfer. The numbers are valid for the RC plant.
L.R. Clausen et al. / Energy 35 (2010) 4831e4842 4833
2. Design of the DME plant
A simplified process flow sheet of the DME plant design isshown in Fig.1 and detailed process flow sheets are shown in Figs. 5and 6. Plant design aspects related to feedstock preparation, gasi-fication, syngas conditioning, DME synthesis and distillation aredescribed next and are followed by a discussion of electricityco-production in the two plants and the commercial status of theprocess components used. Important process design parametersused in the modeling are shown in Table 1.
2.1. Pretreatment and feeding
The pretreatment and feeding of torrefied wood pellets areassumed to be accomplished with existing commercial coal tech-nology [9,10]. The torrefied biomass is milled to powder and thepowder is pressurized with lock hoppers and fed to the gasifierwith pneumatic feeders, both using CO2 from the carbon captureprocess downstream.
5 Steam is superheated to 600 �C in the gas cooling (at 55 bar (RC) or 180 bar(OT)). In [12] it is stated that only a “mild superheat” can be used in the gas cooling,
2.2. Gasification
A commercial, dry-fed, slagging4 entrained flow coal gasifierfrom Shell is used for gasifying the torrefied wood powder. Thegasifier is oxygen blown, pressurized to 45 bar and steam moder-ated [12]. The oxygen supply is provided by a cryogenic air sepa-ration unit. A gas quench using about 200 �C recycled syngasdownstream of the dry solids removal lowers the temperature ofthe syngas from 1300 �C to 900 �C. The composition of the syngas iscalculated by assuming chemical equilibrium at 1300 �C (compo-sition given in Tables 2 and 3).
4 Because of the low ash content in biomass a slag recycle is needed to make thegasifier slagging [13]. Also see note b below Table 1.
2.3. Gas cooling and water gas shift
The syngas is further cooled to 200e275 �C by generatingsuperheated steam for primarily the integrated steam cycle.5 Asulfur tolerant6 water gas shift (WGS) reactor adjusts the H2/COratio to 1 (RC plant) or 1.6 (OT plant). In the RC plant, the H2/CO ratiois adjusted to 1, to optimize DME synthesis according to Eq. (1) [5].In the OT plant, the H2/CO ratio is set to 1.6 to increase the amountof CO2 captured in the downstream conditioning and therebyminimizing the CO2 emissions from the plant. After the WGSreactor, the gas is cooled to 30 �C prior to the acid gas removal(ACR) step.
2.4. Gas cleaning incl. Carbon Capture and Storage (CCS)
Gas cleaning of biomass syngas for DME synthesis includescyclones and filters for particle removal placed just after the hightemperature syngas cooler, an AGR step and guard beds7 placed justbefore the synthesis reactor [15,16]. The AGR step is done witha chilled methanol process similar to the Rectisol process [17,18],and it removes sulfur components (H2S and COS8), CO2 and otherspecies such as NH3 and HCl in one absorber (Fig. 2). By using onlyone absorber, some of the sulfur components will be removed andstored with the CO2. This is an option because the sulfur content inbiomass syngas is very low (w250 ppm of H2Sþ COS). The sulfurcomponents that are not stored with the CO2 are sent to the off-gasboiler or gas turbine. The captured CO2 is compressed to 150 bar forunderground storage. The H2Sþ COS content in the syngas after
but in [14] steam at 125 bar is superheated to 566 �C.6 e.g. Haldor Topsoe produces such catalysts [19].7 ZnO and active carbon filters.8 Sulfur is only modeled as H2S.

IP187 MWe
143 MWth
98 MWth Evaporator
17 MWth
WGS reactor
Gas cooler
Condensing heatexchanger
78 MWth 60 MWth 54 MWth
3 MWthWater22 MWth
DME reactor
IP2
Condenser
Gas cleaning
To gas quench
Gasfrom
gasifier
Boiler
LP
Gasifier
Reboiler (in AGR section)
Distillation section
5 MWth
DME synthesis section
Gasifier 23 MWth
Evaporator
278 MWth
31
16
41 MWth
13 MWth
1 2 3 4 5
1314
17
6 78
9
10
11121819
20
23
21
22
24
25
27
32
30
15
t (C) p (bar) m (kg/s)1 900 45.0 287.82 407 44.9 287.83 372 44.8 287.84 200 44.7 287.85 321 42.3 186.86 130 42.1 186.87 40 42.0 175.38 30 42.0 175.19 30 55.0 171.6
t (C) p (bar) m (kg/s)10 57 55.0 39.511 120 55.0 132.112 213 55.0 132.113 177 55.0 168.614 270 55.0 158.315 270 55.0 181.8
t (C) p (bar) m (kg/s)16 270 55.0 10.017 270 55.0 171.818 270 55.0 10.319 270 55.0 182.120 600 55.0 3.121 600 55.0 179.0
t (C) p (bar) m (kg/s)22 344 9.0 179.023 600 9.0 179.024 383 2.0 179.025 383 2.0 4.826 120 2.0 4.827 156 0.24 15.628 66 0.24 15.629 57 55.0 3.030 83 55.0 23.631 270 55.0 23.632 30 0.042 158.533 20 1.0 13.1
Water
29
2628
79 MWe
112 MWe
Water
33
Fig. 3. Flow sheet of the power production part in the RC plant, showing mass flows, electricity production and heat transfer.
L.R. Clausen et al. / Energy 35 (2010) 4831e48424834
AGR is about 0.1 ppm9 [20] and the CO2 content is 0.1 mole% (RC) or3 mole% (OT).10
The energy input for the AGR process is primarily electricity topower a cooling plant, but electricity is also used to run pumps thatpressurize the methanol solvent.
2.5. Synthesis of DME
The syngas is compressed to 55e60 bar before entering thesynthesis reactor. The reactor is modeled as a liquid-phase reactoroperating at 280 �C, where the product gas is assumed to be inchemical equilibrium.11 Besides the production of DME (Eqs. (1)and (2)) in the reactor, methanol is also produced in small quan-tities (Eq. (3)), and promoted by a high H2/CO ratio. The reactoroperating temperature is maintained at 280 �C by a water-jacketedcooler that generates saturated steam at 270 �C (55 bar). Thereactor product gas is cooled to �37 �C (RC)12 or �50 �C (OT) inorder to dissolve most of the CO2 in the liquid DME and a gas-liquidseparator separates the liquid from the unconverted syngas. In theRC plant, 95% of the unconverted syngas is recycled to the synthesisreactor and the remaining 5% is sent to an off-gas boiler thataugments the steam generation for electricity co-production in the
9 The simulations show even lower sulfur content, but it is not known if this iscredible.10 Some CO2 is left in the syngas to ensure catalyst activity in the DME reactor[21]. In the RC plant, the CO2 will be supplied by the recycled unconverted syngas.11 Assuming chemical equilibrium at 280 �C and 56 bar corresponds to a COconversion of 81% (RC plant). In practice, chemical equilibriumwill not be obtained.The Japanese slurry phase reactor (similar to the liquid-phase reactor) by JFE hasachieved 55e64% CO conversion (depending on catalyst loading) at a 100 t/daypilot plant operating at 260 �C and 50 bar and H2/CO¼ 1 [22]. The consequences ofassuming chemical equilibrium are discussed in Section 3.1.12 As mentioned in the paragraph about gas cleaning some CO2 is needed in therecycled unconverted syngas. When the stream is cooled to �37 �C, the rightamount of CO2 is kept in the gas phase.
Rankine power cycle. In the OT plant, the unconverted syngas issent to a combined cycle.
In both the RC and the OT plant, the DME reactor pressure andtemperature, and the cooling temperature before the gas-liquidseparator have been optimized to improve the conversion effi-ciencies of biomass to DME and electricity. In both plants, the DMEreactor temperature is kept as high as possible (280 �C) to ensureamore efficient conversion of thewaste heat to electricity. In the RCplant, the reactor pressure (56 bar) and the cooling temperature(�37 �C) have been optimized to lower the combined electricityconsumption of the syngas compressor and the cooling plant. In theOT plant the cooling temperature is set at �50 �C to dissolve mostof the CO2 in the liquid DME, while the reactor pressure (53 bar) isset so that the right amount of unconverted syngas is available forthe gas turbine (see the section belowabout the power production).
3H2þ 3CO4 CH3OCH3þ CO2 (1)
4H2þ 2CO4 CH3OCH3þH2O (2)
4H2þ 2CO4 2CH3OH (3)
2.6. Distillation
The liquid stream from the gas-liquid separator is distilled byfractional distillation in two columns. The first column isa topping column separating the absorbed gasses from the liquids.The gas from the topping column consisting mainly of CO2 iscompressed and recycled back to the AGR mentioned earlier. Thesecond column separates the water and methanol from the DME.The DME liquid product achieves a purity of 99.99 mole%. Thewater is either sent to waste water treatment or evaporated andinjected into the gasifier. The methanol is in the OT plant sent to

1716
HP 1834 MWe
99 MWth
85 MWth Evaporator
2
53 MWth
3 4 WGS reactor
5
12
Gas cooler
Condensing heatexchanger
11 10
6 7 8
30 Evaporator
13
79 MWth 34 MWth 85 MWth 42 MWth
9
14 MWth
Water
25
46 MWth
49 MWth
39
36 MWth
40
HRSG19
122 MWth
41
DME reactor
Evaporator
192 MWth
IP1
IP2
29
36Condenser
Gas cleaning
To gas quench
Gas from
gasifier
2620
Gas turbine exhaust
Stack
28
37
LP
33
Gasifier
Reboiler (in AGR section)
31
34
Distillation section
Gasifier23 MWth
12 MWth
35
21
32
20 MWth
12 MWth
1
Water
DME synthesis section
t (C) p (bar) m (kg/s)1 900 45.0 300.72 542 44.9 300.73 437 44.8 300.74 275 44.7 300.75 465 42.3 200.86 367 42.2 200.87 124 42.1 200.88 63 42.0 191.19 30 42.0 190.2
10 30 180.0 112.211 114 180.0 112.2
t (C) p (bar) m (kg/s)12 265 180.0 112.213 357 180.0 44.314 357 180.0 44.315 357 180.0 67.916 357 180.0 112.217 600 180.0 112.218 413 55.0 112.219 600 55.0 112.220 30 55.0 115.521 61 55.0 128.5
t (C) p (bar) m (kg/s)22 270 55.0 128.523 270 55.0 24.024 270 55.0 104.525 413 55.0 104.526 600 55.0 104.527 600 55.0 3.128 600 55.0 213.629 418 16.0 213.630 600 16.0 213.631 311 2.0 4.7
t (C) p (bar) m (kg/s)32 120 2.0 4.733 311 2.0 208.834 85 0.18 8.335 58 0.18 8.336 30 0.042 200.537 20 1.0 27.138 646 1.1 395.139 446 1.0 395.140 367 1.0 395.141 90 1.0 395.1
Water
15
14
2224
23
27
38
75 MWe
123 MWe
122 MWe
Fig. 4. Flow sheet of the power production part in the OT plant, showing mass flows, electricity production and heat transfer.
L.R. Clausen et al. / Energy 35 (2010) 4831e4842 4835
a dehydration reactor to produce DME, which is then recycledback to the topping column. In the RC plant, the methanol isinstead recycled back to the synthesis reactor, because the massflow of methanol is considered too low to make the dehydrationreactor feasible.
2.7. Power production in the RC plant
An integrated steam cycle with reheat utilizes waste heatfrom mainly the DME reactor and the syngas coolers, toproduce electricity (Fig. 3). Waste heat from the DME reactor isused to generate steam and the temperature of the reactorlimits the steam pressure to 55 bar. Preheating of the water tothe DME reactor and superheating of the steam from the DMEreactor is mainly done with waste heat from the syngascoolers.
2.8. Power production in the OT plant
Besides power production from a steam cycle, power is in thisplant also produced by a gas turbine utilizing unconverted syngasfrom the DME reactor. A heat recovery steam generator (HRSG) usesthe exhaust from the gas turbine to produce steam for the steam
cycle. Two pressure levels and double reheat is used in the steamcycle (Fig. 4). Steam at 180 bar is generated by the gas coolersplaced after the gasifier, and steam at 55 bar is generated by wasteheat from the DME reactor and the HRSG. The steam is reheated at55 bar and 16 bar.
2.9. Status of process components used
It is assumed that commercial coal processing equipment (formilling, pressurization, feeding and gasification) can be used fortorrefied biomass [9,10]. This needs to be verified by experi-ments and demonstrated at commercial scale, which to theauthor’s knowledge has not been done. The liquid-phase DMEreactor has only been demonstrated at pilot scale for DMEsynthesis, but is commercially available for FischereTropschsynthesis, and has been demonstrated at commercial scale formethanol synthesis [5]. Commercial gas turbines and steamturbines are only available at specific sizes, and typically, theplant size would be fixed by the size of the gas turbine used. Inthis paper this has not been done. The size of the plant is basedon two gasification trains, each at maximum size [12].Commercial steam turbines are also only available for specificsteam pressures and temperatures. However, in order to ease

Air separation
unit
Fly ash
Milling
N2
Air
Torrefiedwood pellets
WGSreactor
AGR (Rectisol)12 18
DME reactorGas-liquid separator
29
CO2
Feeding & Pressurization
7 MWe
Off-gas boiler
Air
DME
Water
95 % recycle
Flue gas
N2+H2S
25
1
31
4 8
3
~CO2
23
Water
17
42
Rankine cycle55 bar, 600 C
Reheat: 9 bar, 600 C
336 MWth
22 MWth
117 MWth
278 MWe ( 38%)
282 MWth 1515 MJ/s
CO2 (H2S)
20
46 MWe
38 MWe
7
21 MWe
9 MWe
5 MWth
Slag
9 20 MWe
10
11
Entrained flow gasifier
45 bar1300 C
Steam
41
8 MWe
13
Steam
14
CO2
27
O2
methanol
4 MWth
18 MWth
26
11 MWe11 MWth
52 MWth
4043
278 MWth4 MWth
34 35
39
30
24 MWth
6 MWe
28
24
41 MWth
16 MWth
15 16
18 MWth
36
37
32
1923 MWth
359 MWth
3 MWth
3 MWth
114 MWth
25
6
21
22
33
38
t (C) p (bar) m (kg/s)1 20 1.0 115.72 60 1.0 115.73 30 1.0 7.04 600 55.0 3.15 20 1.0 197.56 0 1.0 151.57 0 1.0 46.08 204 46.2 46.09 1300 1.0 1.9
10 900 45.0 287.811 200 44.3 111.012 200 44.3 176.813 200 44.3 79.114 270 55.0 10.0
t (C) p (bar) m (kg/s)15 406 42.3 107.716 321 42.3 186.817 40 42.3 11.618 30 42.0 175.119 30 46.2 20.920 30 150 99.021 1 1.0 6.422 0 40.6 107.523 41 60.3 107.524 260 59.0 153.225 280 56.4 155.026 68 55.8 155.027 30 55.6 155.028 -9 55.4 155.0
t (C) p (bar) m (kg/s)29 -37 55.2 155.030 20 55.2 48.131 28 60.3 45.732 20 55.2 2.433 100 1.0 19.634 -42 10.0 106.935 -7 10.0 106.936 -45 9.0 52.337 30 42.0 52.3
t (C) p (bar) m (kg/s)38 43 9.0 54.739 32 6.8 54.740 56 6.8 54.741 30 6.8 52.542 127 6.8 1.843 162 6.8 0.3
Net electricity: 112 MWe
2302 MJ/s
13 MWth
CO2 19
Fig. 5. Flow sheet of the recycle (RC) DME plant model, showing mass flows, electricity consumption/production and heat transfer.
L.R. Clausen et al. / Energy 35 (2010) 4831e48424836
the modeling of the integrated steam cycle a generic steam cyclehas been modeled, using superheat and reheat temperaturesof 600 �C (Table 1). Components used for WGS, gas cleaning,CO2 capture and compression, distillation are commerciallyavailable [5].
The modeling input values are based on best commerciallyavailable technology, only the values used for: the steamsuperheating temperature (600 �C), HP steam pressure in the OTplant (180 bar) and the gas turbine TIT (1370 �C) can beconsidered progressive (see comments at Table 1). Theassumption of chemical equilibrium in the DME synthesis is veryprogressive and the consequences of this assumption are dis-cussed in Section 3.1.
3. Results
3.1. Process simulation results
The results from the simulation of the two DME plants arepresented in the following. In the flow sheets in Figs. 5 and 6, someof the important thermodynamic parameters are shown togetherwith electricity production/consumption and heat transfer in theplants. In Tables 2 and 3, the composition of specific streams in theflow sheets is shown.
Important energy efficiencies for the DME plants are shown inFig. 7. It can be seen, for the RC plant, that 66% of the inputchemical energy in the torrefied wood is converted to chemical

Table 2Stream composition for the RC plant (stream numbers refer to Fig. 5).
Gasifier exit WGS outlet AGR inlet AGR outlet Reactor inlet Reactor outlet Recycle gas To distillation Recycle CO2 DME
Stream number 12 15 18þ 37 22 24þ 42 25 31 34a 37 41a
Mass flow (kg/s) 176.8 107.9 227.4 107.5 155.0 155.0 45.7 106.9 52.3 52.6Flow (kmole/s) 8.66 5.35 9.81 7.08 9.24 4.67 2.10 2.46 1.24 1.14
Mole frac (%)H2 29.1 44.0 35.7 49.4 45.5 16.2 33.7 0.57 1.1 0.00CO 50.9 27.7 35.7 49.4 45.5 17.0 33.6 2.2 4.3 0.00CO2 7.4 24.6 27.7 0.10 3.0 30.0 12.8 45.4 90.0 0.00H2O 12.3 3.4 0.12 0.00 0.09 0.56 0.00 1.1 0.00 0.10CH4 0.04 0.03 0.25 0.35 0.93 1.8 2.9 0.86 1.7 0.00H2S 0.03 0.02 0.02 0.00 0.00 0.00 0.00 0.00 0.00 0.00N2 0.14 0.12 0.28 0.39 2.8 5.4 10.8 0.65 1.3 0.00Ar 0.07 0.06 0.25 0.34 1.5 2.9 5.2 0.75 1.5 0.00CH3OH e e 0.00 0.00 0.55 1.1 0.00 2.1 0.00 0.00CH3OCH3 e e 0.01 0.00 0.25 25.0 1.1 46.4 0.09 99.9
a Liquid.
L.R. Clausen et al. / Energy 35 (2010) 4831e4842 4837
energy stored in the output DME. If the torrefication process e
that occurs outside the plant e is accounted for, the efficiencydrops to 59%. In [5] energy efficiencies of biomass to DME arereported to be 52% (RC) and 24% (OT), if the net electricityproduction is included the efficiencies are 61% (RC) 55% (OT) [5].The gasifier used in [5] is an oxygen-blown, pressurized fluid bedgasifier that produces a gas with a high concentration of CH4(7 mole% after AGR [26]), because of this a high conversion effi-ciency from biomass to DME is difficult to achieve.13 JFE reportsthe natural gas to DME efficiency to be 71% [22] and the coal toDME efficiency to be 66% [27]. Since the cold gas efficiency of theShell gasifier operated on torrefied biomass is similar to the coldgas efficiency of the same gasifier operated on coal (see below),the coal to DME efficiency should be similar to the torrefiedbiomass to DME efficiency.
The biomass to DME efficiency of 66% for the RC plant is mainlyachieved because only a small fraction of the syngas in the RC plantis not converted to DME, but sent to the off-gas boiler (Fig. 8). This ispossible because the syngas contains very few inerts, but alsobecause CO2, which is a by-product of DME production (Eq. (1)), isdissolved in the condensed DME, and therefore does not accumu-late in the synthesis loop.
The input chemical energy in the torrefied wood that is notconverted to DME is converted to thermal energy in the plants andused to produce electricity in the integrated steam cycle or gasturbine. Fig. 8 shows in which components that chemical energy isconverted to thermal energy. Only small amounts of thermalenergy is not used for electricity production, but directly removedby cooling water (see flow sheets in Figs. 5 and 6). The thermalenergy released in the gasifier, WGS reactor, DME reactor and theoff-gas boiler is converted to electricity in the integrated steamcycle with an efficiency of 38% (RC) or 40% (OT). The thermal energyreleased in the gas turbine combustor is converted to electricity
13 Because the biomass to DME conversion efficiency in [5] is limited byespecially the high CH4 concentration in the syngas, and this creates a greatamount of purge gas from the DME reactor in the RC plant, it is more appropriateto compare the RC plant in [5] with the OT plant in this paper: The (torrefied)biomass to DME efficiencies are: 48% (OT) and 52% ([5]). The (torrefied) biomassto electricity (gross) efficiencies are 23% (OT) and 16% ([5]). If a mild recirculationof unconverted syngas was incorporated in the OT plant, a torrefied biomass toDME efficiency of 52% could be achieved, with an expected drop in gross elec-tricity efficiency from 23% to 20%. The higher gross electricity production in themodified OT plant compared to the RC plant in [5] (20% vs. 16%) is due to a moreefficient waste heat recovery system in the modified OT plant (e.g. doublereheat).
with an efficiency of 60%.14 The chemical energy in the torrefiedbiomass input that is not converted to DME or electricity is lost inthe form of waste heat mainly in the condenser of the integratedsteam plant. In order to improve the total energy efficiency of theplant, the steam plant could produce district heating instead. Thiswould however result in a small reduction in power production.
From Fig. 8 the cold gas efficiency of the gasifier can be seen tobe 81% (73%/90%), which is similar to the efficiency of the sameShell gasifier operated on coal (81e83% [12]). The cold gas effi-ciency of the oxygen-blown, pressurized fluid bed gasifier reportedin [5] is also similar (80% for switchgrass [5]).
The assumption of chemical equilibrium in the DME synthesisreactor results in a CO conversion of 81% (per pass) in the RC plant.If a CO conversion of 60% (as suggested in footnote 11) wasassumed, the recycle gas flow would double, but the reactor inletmole flow would only increase from 9.24 kmol/s to w12 kmol/s.The higher flow increases the duty of the recycle compressor andthe cooling need in the synthesis loop, but the effect on the netelectricity production would only be modest. The total biomass toDME conversion efficiency would drop slightly, but could be keptconstant by raising the recycle ratio from 95% to 97%.
The effect of lowering the syngas conversion in the DME reactorwould be greater in the OT plant: it is estimated that the uncon-verted syngas flow to the gas turbine would increase with w70%,and this would lower the biomass to DME conversion efficiencyfrom 48% to 35% but raise the DME to net electricity conversionefficiency from 16% to 24%.
3.2. Cost estimation
3.2.1. Plant investmentsThe investments for the two DME plants are estimated based on
component cost estimates given in Table 4. In Fig. 9 the cost distri-bution between different plant areas is shown for both the RC andthe OT plant. It is seen that the gasification part is very cost inten-sive, accounting for 38e41% of the investment. The figure alsoshows that theOTplant is slightlymore expensive than the RCplant,mostly due to the added cost of the gas turbine and HRSG, which isnot outbalanced by what is saved on the DME synthesis area.
14 The gas turbine is only used in the OT plant. The net efficiency of the gasturbine is 38%. The 60% efficiency is calculated by assuming that 40% (the efficiencyof the complete steam cycle in the OT plant) of the heat transferred in the HRSG isconverted to electricity. Because the steam pressure in the HRSG is 55 bar, while theHP steam in the OT plant is 180 bar, it may be more correct to use the steam cycleefficiency of the RC plant (38%), which is also based on steam at 55 bar. If this isdone, the efficiency is reduced from 60% to 58%.

Airseparation
unit
Fly ash
Milling
N2
Air
Torrefiedbiomass pellets
WGSreactor
AGR(Rectisol)12 16
DME reactorGas-liquidseparator
23 27
CO2
Feeding &Pressurization
7 MWe
Gasturbine20 bar
Air
DME
Water
Flue gas
30
1
4 8
17
~CO2
21
Water
15
39
Rankine cycle180 bar, 600 C
1st Reheat:55 bar, 600 C2nd Reheat:
16 bar, 600 C
315 MWth
252 MWth
173 MWth
354 MWe ( = 40%)
202 MWth
20 MWth
1130 MJ/s
CO2 (H2S)18
46 MWe
40 MWe
7
21 MWe
8 MWe
14 MWth
Slag
9 21 MWe
10
11
Entrained flowgasifier
45 bar1300 C
Steam
38
5 MWe
34
Steam
13
CO2
25
O2
methanol
4 MWth
14 MWth 31
24
37
10 MWe8 MWth
41 MWth
41
11 MWth
32
28
4 MWe
26
22
14
5 MWth
33
17
35
178 MWe
192 MWth
Meoh dehydration
separator23 27
202 MWth
14 MWth
25
14 MWth 31
24
32
2633
35
Meoh dehyd
40
20
12 MWth
N2+H2S
23 MWth
2 MWth
161 MWth
36
14 MWth
7 MWth
338 MWth
12 MWth
CO2 3
2 56
19
29
t (C) p (bar) m (kg/s)15 61 42.0 10.616 30 42.0 190.217 30 46.2 20.918 30 150 110.419 1 1.0 5.620 0 40.6 92.421 34 56.5 92.422 260 55.2 92.423 280 52.6 92.424 79 52.0 92.425 30 51.8 92.426 -14 51.6 92.427 -50 51.4 92.428 20 27.7 17.2
t (C) p (bar) m (kg/s)29 20 1.0 372.330 90 1.0 395.131 -50 10.0 75.332 -4 10.0 75.333 -43 9.0 33.634 30 42.0 33.635 48 9.0 46.2
t (C) p (bar) m (kg/s)36 37 6.8 46.237 46 6.8 46.238 30 6.8 38.739 134 6.8 4.540 293 12.0 4.541 162 6.8 3.0
t (C) p (bar) m (kg/s)1 20 1.0 115.72 60 1.0 115.73 30 1.0 7.04 600 55.0 3.15 20 1.0 197.56 0 1.0 151.57 0 1.0 46.08 204 46.2 46.09 1300 1.0 1.9
10 900 45.0 300.711 275 44.3 123.912 275 44.3 176.813 270 55.0 24.014 465 42.3 200.8
Net electricity: 369 MWe
2302 MJ/s
Fig. 6. Flow sheet of the once through (OT) DME plant model, showing mass flows, electricity consumption/production and heat transfer.
Similar plant costs are reported in [5] (per MWth biomass input)for RC and OT DME plants, but in this reference, the cost for the RCplant is higher than the cost for the OT plant due to high cost of theDME synthesis part in the RC plant.15
3.2.2. Levelized cost calculationTo calculate the cost of the produced DME, a 20-year levelized
cost calculation is carried out for both DME plants (Table 5). The
15 The cost is scaled with the DME reactor mole flow, which is more than fivetimes the mole flow in the OT case [26].
levelized costs are calculated with a capacity factor of 90% and withno credit for the CO2 stored. The results showa lower cost for the RCplant than the OT plant. Levelized costs reported in [5] for OT andRC DME plants without CCS are $16.9/GJLHV (OT) and $13.8/GJLHV(RC). The difference between these costs and the costs calculatedin this paper is mainly due to a lower credit for the electricityco-production in [5],16 but the higher conversion efficiencies
16 An electricity price of 40 $/MWh is assumed in [5]. The capital charge rate andO&M rate are the same as used in this paper, but the biomass cost used in [5] islower.
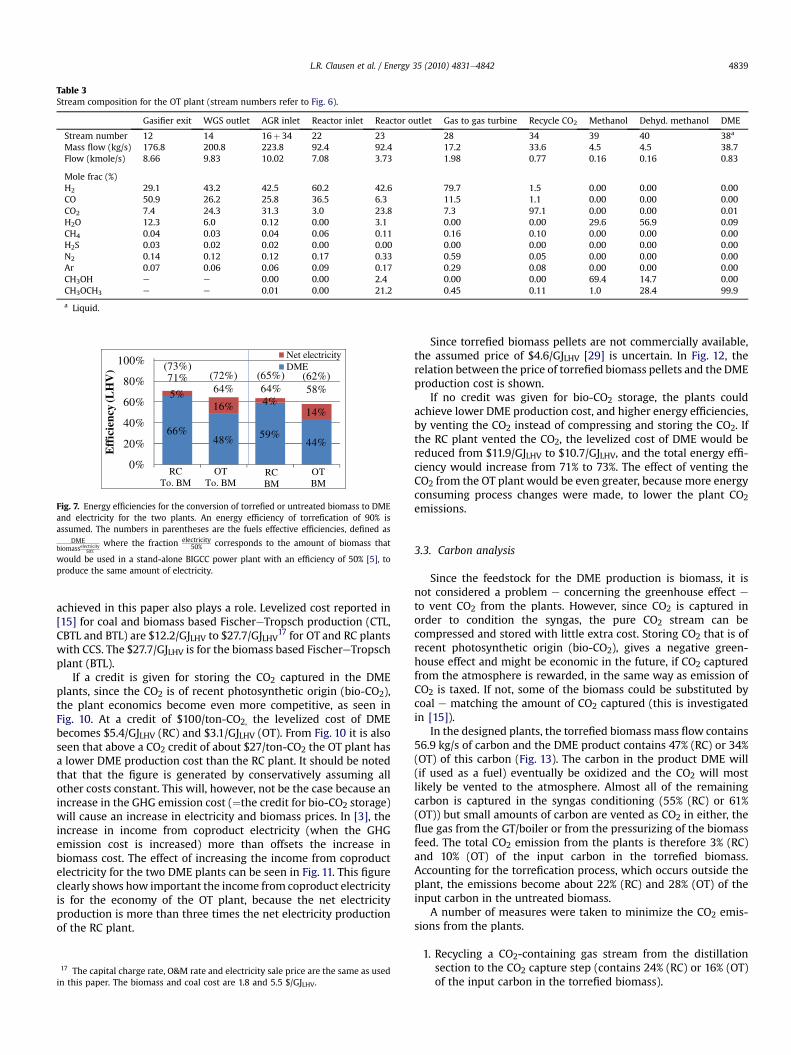
Table 3Stream composition for the OT plant (stream numbers refer to Fig. 6).
Gasifier exit WGS outlet AGR inlet Reactor inlet Reactor outlet Gas to gas turbine Recycle CO2 Methanol Dehyd. methanol DME
Stream number 12 14 16þ 34 22 23 28 34 39 40 38a
Mass flow (kg/s) 176.8 200.8 223.8 92.4 92.4 17.2 33.6 4.5 4.5 38.7Flow (kmole/s) 8.66 9.83 10.02 7.08 3.73 1.98 0.77 0.16 0.16 0.83
Mole frac (%)H2 29.1 43.2 42.5 60.2 42.6 79.7 1.5 0.00 0.00 0.00CO 50.9 26.2 25.8 36.5 6.3 11.5 1.1 0.00 0.00 0.00CO2 7.4 24.3 31.3 3.0 23.8 7.3 97.1 0.00 0.00 0.01H2O 12.3 6.0 0.12 0.00 3.1 0.00 0.00 29.6 56.9 0.09CH4 0.04 0.03 0.04 0.06 0.11 0.16 0.10 0.00 0.00 0.00H2S 0.03 0.02 0.02 0.00 0.00 0.00 0.00 0.00 0.00 0.00N2 0.14 0.12 0.12 0.17 0.33 0.59 0.05 0.00 0.00 0.00Ar 0.07 0.06 0.06 0.09 0.17 0.29 0.08 0.00 0.00 0.00CH3OH e e 0.00 0.00 2.4 0.00 0.00 69.4 14.7 0.00CH3OCH3 e e 0.01 0.00 21.2 0.45 0.11 1.0 28.4 99.9
a Liquid.
66%48% 59%
44%
5%16% 4%
14%
0%
20%
40%
60%
80%
100%
)V
HL(
ycneiciffE
Net electricityDME
RCBM
RCTo. BM
OTTo. BM
71%
OTBM
(62%)58%
(65%)64%
(72%)64%
(73%)
Fig. 7. Energy efficiencies for the conversion of torrefied or untreated biomass to DMEand electricity for the two plants. An energy efficiency of torrefication of 90% isassumed. The numbers in parentheses are the fuels effective efficiencies, defined as
DMEbiomasselectricity50%
where the fraction electricity50% corresponds to the amount of biomass that
would be used in a stand-alone BIGCC power plant with an efficiency of 50% [5], toproduce the same amount of electricity.
L.R. Clausen et al. / Energy 35 (2010) 4831e4842 4839
achieved in this paper also plays a role. Levelized cost reported in[15] for coal and biomass based FischereTropsch production (CTL,CBTL and BTL) are $12.2/GJLHV to $27.7/GJLHV17 for OT and RC plantswith CCS. The $27.7/GJLHV is for the biomass based FischereTropschplant (BTL).
If a credit is given for storing the CO2 captured in the DMEplants, since the CO2 is of recent photosynthetic origin (bio-CO2),the plant economics become even more competitive, as seen inFig. 10. At a credit of $100/ton-CO2, the levelized cost of DMEbecomes $5.4/GJLHV (RC) and $3.1/GJLHV (OT). From Fig. 10 it is alsoseen that above a CO2 credit of about $27/ton-CO2 the OT plant hasa lower DME production cost than the RC plant. It should be notedthat that the figure is generated by conservatively assuming allother costs constant. This will, however, not be the case because anincrease in the GHG emission cost (¼the credit for bio-CO2 storage)will cause an increase in electricity and biomass prices. In [3], theincrease in income from coproduct electricity (when the GHGemission cost is increased) more than offsets the increase inbiomass cost. The effect of increasing the income from coproductelectricity for the two DME plants can be seen in Fig. 11. This figureclearly shows how important the income from coproduct electricityis for the economy of the OT plant, because the net electricityproduction is more than three times the net electricity productionof the RC plant.
17 The capital charge rate, O&M rate and electricity sale price are the same as usedin this paper. The biomass and coal cost are 1.8 and 5.5 $/GJLHV.
Since torrefied biomass pellets are not commercially available,the assumed price of $4.6/GJLHV [29] is uncertain. In Fig. 12, therelation between the price of torrefied biomass pellets and the DMEproduction cost is shown.
If no credit was given for bio-CO2 storage, the plants couldachieve lower DME production cost, and higher energy efficiencies,by venting the CO2 instead of compressing and storing the CO2. Ifthe RC plant vented the CO2, the levelized cost of DME would bereduced from $11.9/GJLHV to $10.7/GJLHV, and the total energy effi-ciency would increase from 71% to 73%. The effect of venting theCO2 from the OT plant would be even greater, because more energyconsuming process changes were made, to lower the plant CO2emissions.
3.3. Carbon analysis
Since the feedstock for the DME production is biomass, it isnot considered a problem e concerning the greenhouse effect e
to vent CO2 from the plants. However, since CO2 is captured inorder to condition the syngas, the pure CO2 stream can becompressed and stored with little extra cost. Storing CO2 that is ofrecent photosynthetic origin (bio-CO2), gives a negative green-house effect and might be economic in the future, if CO2 capturedfrom the atmosphere is rewarded, in the same way as emission ofCO2 is taxed. If not, some of the biomass could be substituted bycoal e matching the amount of CO2 captured (this is investigatedin [15]).
In the designed plants, the torrefied biomass mass flow contains56.9 kg/s of carbon and the DME product contains 47% (RC) or 34%(OT) of this carbon (Fig. 13). The carbon in the product DME will(if used as a fuel) eventually be oxidized and the CO2 will mostlikely be vented to the atmosphere. Almost all of the remainingcarbon is captured in the syngas conditioning (55% (RC) or 61%(OT)) but small amounts of carbon are vented as CO2 in either, theflue gas from the GT/boiler or from the pressurizing of the biomassfeed. The total CO2 emission from the plants is therefore 3% (RC)and 10% (OT) of the input carbon in the torrefied biomass.Accounting for the torrefication process, which occurs outside theplant, the emissions become about 22% (RC) and 28% (OT) of theinput carbon in the untreated biomass.
A number of measures were taken to minimize the CO2 emis-sions from the plants.
1. Recycling a CO2-containing gas stream from the distillationsection to the CO2 capture step (contains 24% (RC) or 16% (OT)of the input carbon in the torrefied biomass).

4 4 % 1 0 0 % 9 0 %
D M E W o o d
D M E - R C D M E - O T
T o r r e f i c a t i o n
1 0 %
G a s i f i c a t i o n
7 3 %
W G S
7 0 %
1 7 %
S y n t h e s i s
1 8 % G a s t u r b i n e 8 % 3 %
5 9 % 1 0 0 % 9 0 %
D M E W o o d
T o r r e f i c a t i o n
1 0 %
G a s i f i c a t i o n
7 3 %
W G S
7 1 %
1 7 %
S y n t h e s i s
1 % O f f - g a s b o i l e r
1 1 % 2 %
Fig. 8. Chemical energy streams (LHV) in the two DME plants, including conversion heat losses. The torrefication process does not occur in the DME plants, but decentralized. Theconversion heat losses (excluding the torrefication heat loss) are used by the integrated steam plant to produce electricity.
Table 4Investment estimates for plant areas and components in the DME plants.
Plant area/component
Referencesize
Referencecost (million2007 $)
Scalingexponent
Overallinstallationfactor
Source
Air separationunit
52.0 kg-O2/s 141 0.5 1 [23]
Gasificationislanda
68.5 kg-feed/s 395 0.7 1 [12]
Water gasshift reactor
815 MWLHV
biomass3.36 0.67 1.16 [15]
AGR (Rectisol) 2.48 kmole/sfeed gas
28.8 0.63 1.55 [15]
CO2 compressionto 150 bar
13 MWe 9.52 0.67 1.32 [15]
CO2 transportand storage
113 kg-CO2/s 110 0.66 1.32 [28]
Compressors 10 MWe 6.3 0.67 1.32 [15]DME reactor 2.91 kmole/s
feed gas21.0 0.65 1.52 [26]
Cooling plant 3.3 MWe 1.7 0.7 1.32Distillation 6.75 kg/s DME 28.4 0.65 1.52 [26]Steam turbines
and condenser275 MWe 66.7 0.67 1.16 [15]
Heat exchangers 355 MWth 52 1 1.49 [15]Off-gas boiler 355 MWth 52 1 1.49Gas turbine 266 MWe 73.2 0.75 1.27 [15]
The cost for a specific size component is calculated in this way: cost¼ referencecost� (size/reference size)scaling exponent� overall installation factor.The overall installation factor includes balance of plant (BOP) costs and indirect costssuch as engineering, contingency and startup costs. For some components thesecosts are, however, included in the reference cost. All costs are adjusted to 2007 $ byusing the CEPCI (Chemical Engineering Plant Cost Index (data for 2000e2007 in[15])).
a The reference size basis chosen is mass flow instead of energy flow. This meansthat the cost might be overestimated because the dried coal LHV used in thereference is 24.84 MJ/kg and the LHV of torrefied wood pellets is 19.9 MJ/kg.
0200400600800
1000120014001600
RC OT
)$M(
tnemtsevnI
HX & Comp.
Power productionDME synthesis
CO2 comp. & storage
AGR+WGS
Gasification
ASU10%
41%
8%12%17%
6%6%
9%
38%
8%11%13%11%
9%
Fig. 9. Cost distribution between different plant areas for the two DME plants.
Table 5Twenty-year levelized production costs for DME.
Price/rate RC OT
Levelized costin $/GJ-DME
Capital charges 15.4% of plantinvestment [15]
4.9 7.2
O&M 4% of plantinvestment [15]
1.3 1.9
Torrefied biomasspellets
4.6$/GJLHV [29] 6.9 9.3
Electricity sales At 60$/MWh [15] �1.2 �5.4Credit for bio-CO2
storage0 0
DME ($/GJLHV) 11.9 12.9
0
5
10
15
0 20 40 60 80 100
)JG/$(
tsocE
MD
Credit for bio-CO2 storage /GHG emission cost ($ /ton-CO2)
RCOT
Fig. 10. DME production cost as a function of the credit given for bio-CO2 storage.
L.R. Clausen et al. / Energy 35 (2010) 4831e48424840
2. Cooling the product stream from the DME reactor to below�35 �C in order to dissolve CO2 in the liquid that is sent to thedistillation section (80% (RC) or 83% (OT) of the CO2 in thestream is dissolved in the liquid).
3. Having an H2/CO ratio of 1.6 instead of 1 in the OT plant, whichlowers the amount of carbon left in the unconverted syngas,that is combusted and vented (the H2/CO ratio in the uncon-verted syngas is 6.6).
0
5
10
15
20
0 20 40 60 80 100
)JG/$(
tsocE
MD
Electricity sales price ($/MWh)
RCOT
electricity price used
Fig. 11. DME production cost as a function of the electricity sales price.

0
5
10
15
20
25
0 2 4 6 8 10
JG/$(
tsocE
MD
VH
L)
Torrefied biomass price ($/GJLHV)
RCOT
biomass price used
Fig. 12. DME production cost as a function of the price of torrefied biomass pellets.
61%
34%
9%
43%
3%
100%
2%55%
103%
DME
CO2 in GT flue gas
CO2 storedCO2 forpressurizing
biomass
CO2 forfeeding
Torrefiedbiomass
55%
47%
1%
48%
3%
100%
2%50%
103%DME
CO2 in burner flue gas
CO2 storedCO2 forpressurizing
biomass
CO2 forfeeding
Torrefiedbiomass
RC plant OT plant
Fig. 13. Carbon flows in the two DME plants.
L.R. Clausen et al. / Energy 35 (2010) 4831e4842 4841
The costs of doing these measures are as follows.
1. 6 MWe (RC) or 4 MWe (OT) to compress the CO2-containing gasstream.
2. For the RC plant: most likely nothing, because CO2 is typicallyremoved before recycling the gas stream to the DME reactor, inorder to keep the size/cost of the reactor as low as possible. Forthe OT plant: some of the 11 MWe used to cool the gas streamcould be saved.
3. By increasing the H2/CO ratio from 1 to 1.6 in the OT plant, moreheat will be released in the WGS reactor (Fig. 8) and thereforeless in the GTcombustion chamber. Even though thewaste heatfrom the WGS reactor is used to produce electricity, it is moreefficient to release the heat in the GT. Besides this, theconversion rate in the DME reactor is also lowered, which iscompensated for by increasing the reactor pressure. Also, moremethanol is produced in the DME reactor, which increases theneed for (or increases the benefit of adding) the methanoldehydration step.
Doing the recycle of the CO2 containing gas stream in the RCplant is only possible if the inert fraction (sum of N2, Argon andCH4) in the gas from the gasifier is very low. For the plantsmodeled, the inert fraction in the gas is 0.24 mole%. The inertfraction in the syngas leaving the AGR step has however risen to1.1 mole%, because of the recycle of the CO2 stream. The inertfraction in the product gas from the DME reactor is even higher(10 mole%). In the simulations, all the N2 originates from thebiomass18, and because more than half of the inert fraction is N2,
18 It was assumed that the 0. mole% of inerts in the oxygen from the ASU is argon.This was done to show where the inerts in the downstream processing originated:argon from the ASU and nitrogen from the biomass. In practice, some nitrogen willalso be present in the oxygen from the ASU.
the N2 content of the biomass is important. The N2 content of thetorrefied wood used is 0.29 mass%, but the N2 content in otherbiomasses can be higher. If for instance a torrefied grass is usedwith a N2 content of 1.2 mass%, the inert fraction in the productgas from the DME reactor would be increased from 10 to 23 mole%. This would still be a feasible option but would increase thesize/cost of the DME reactor.
4. Conclusion
The paper documents the thermodynamics and economics oftwo DME plants based on gasification of torrefied wood pellets,
where the focus in the design of the plants was lowering the CO2emissions from the plants. It is shown that CO2 emissions can bereduced to about 3% (RC) and 10% (OT) of the input carbon in thetorrefied biomass. Accounting for the torrefication process, whichoccurs outside the plant, the emissions become 22% (RC) and 28%(OT) of the input carbon in the untreated biomass. The plantsachieve total energy efficiencies of 71% (RC) and 64% (OT) fromtorrefied biomass to DME and net electricity, but if the torreficationprocess is taken into account, the total energy efficiencies fromuntreated biomass to DME and net electricity are 64% (RC) and 58%(OT). The two plants produce DME at an estimated cost of $11.9/GJLHV (RC) and $12.9/GJLHV (OT) and if a credit is given for storingthe CO2 captured, the cost become as low as $5.4/GJLHV (RC) and$3.1/GJLHV (OT) (at $100/ton-CO2).
References
[1] International DME association (IDA). DME e clean fuel for transportation,http://www.aboutdme.org/index.asp?bid¼219.
[2] Eucar, Concawe, JRC. Well-to-wheels analysis of future automotive fuelsand powertrains in the European context, version 2C. Eucar, Concawe, JRC,http://ies.jrc.ec.europa.eu/WTW; 2007.
[3] Larson ED, Williams RH, Jin H. Fuels and electricity from biomass with CO2capture and storage. In: Proceedings of the eighth international conference ongreenhouse gas control technologies, Trondheim, Norway; June 2006.
[4] Boerrigter H. Economy of biomass-to-liquids (BTL) plants. Report: ECN-Ce06-019. Petten, The Netherlands: ECN, http://www.ecn.nl/publications/;2006.
[5] Larson ED, Jin H, Celik FE. Large-scale gasification-based coproduction of fuelsand electricity from switchgrass. Biofuels Bioprod Bioref 2009;3:174e94.
[6] Pettersson K, Harveya S. CO2 emission balances for different black liquorgasification biorefinery concepts for production of electricity or second-generation liquid biofuels. Energy 2010;35(2):1101e6.
[7] Elmegaard B, Houbak N. DNA e a general energy system simulation tool. In:Amundsen J, et al., editors. SIMS 2005, 46th conference on simulation andmodeling, Trondheim, Norway. Tapir Academic Press; 2005. p. 43e52.
[8] Homepage of the thermodynamic simulation tool DNA, http://orbit.dtu.dk/query?record¼231251.
[9] Kiel JHA, Verhoeff F, Gerhauser H, Meuleman B. BO2-technology for biomassupgrading into solid fuel e pilot-scale testing and market implementation. In:

L.R. Clausen et al. / Energy 35 (2010) 4831e48424842
Proceedings for the 16th European biomass conference and exhibition,Valencia, Spain; 2008, p. 48e53. http://www.ecn.nl/publications/.
[10] Bergman PCA, Boersma AR, Kiel JHA, Prins MJ, Ptasinski KJ, Janssen FJJG.Torrefaction for entrained-flow gasification of biomass. Report: ECN-Ce05-067. Petten, The Netherlands: ECN, http://www.ecn.nl/publications/; 2005.
[11] The National Energy Technology Laboratory (NETL). Gasification WorldDatabase 2007, http://www.netl.doe.gov/technologies/coalpower/gasification/database/database.html; 2007.
[12] van der Ploeg HJ, Chhoa T, Zuideveld PL. The shell coal gasification process forthe US industry. In: Proceedings for the gasification technology conference,Washington DC, USA; 2004.
[13] van der Drift A, Boerrigter H, Coda B, Cieplik MK, Hemmes K. Entrainedflow gasification of biomass; ash behaviour, feeding issues, system analyses.Report: ECN-Ce04-039. Petten, The Netherlands: ECN, http://www.ecn.nl/publications/; 2004.
[14] The National Energy Technology Laboratory (NETL). Shell gasifier IGCC basecases. Report: PED-IGCC-98-002, http://www.netl.doe.gov/technologies/coalpower/gasification/pubs/pdf/system/shell3x_.pdf; 1998 (revised in 2000).
[15] Kreutz TG, Larson ED, Liu G, Williams RH. FischereTropsch fuels from coal andbiomass. Report. Princeton, New Jersey: Princeton Environmental Institute,Princeton University, http://www.princeton.edu/pei/energy/publications;2008.
[16] van der Drift A, Boerrigter H. Synthesis gas from biomass. Report: ECN-C-06-001. Petten, The Netherlands: ECN, http://www.ecn.nl/publications/; 2006.
[17] Linde Engineering. Rectisol wash, http://www.linde-le.com/process_plants/hydrogen_syngas_plants/gas_processing/rectisol_wash.php.
[18] Lurgi GmbH. The rectisol process, http://www.lurgi.com/website/fileadmin/user_upload/1_PDF/1_Broshures_Flyer/englisch/0308e_Rectisol.pdf.
[19] Haldor Topsoe. Sulphur tolerant shift conversion, http://www.topsoe.com/Business_areas/Gasification-based/Processes/Sour_shift.aspx.
[20] Linde Engineering. Rectisol wash, http://www.linde-engineering.com/process_plants/hydrogen_syngas_plants/gas_processing/rectisol_wash.php[accessed 28.01.09].
[21] Larson ED, Tingjin R. Synthetic fuel production by indirect coal liquefaction.Energy Sustain Dev 2003;7(4):79e102.
[22] Yagi H, Ohno Y, Inoue N, Okuyama K, Aoki S. Slurry phase reactor technologyfor DME direct synthesis. Int J Chem React Eng 2010;8:A109.
[23] Andersson K, Johnsson F. Process evaluation of an 865 MWe lignite fired O2/CO2 power plant. Energy Convers Manage 2006;47(18e19):3487e98.
[24] Moore JJ, Nored M, Brun K. Novel concepts for the compression of largevolumes of carbon dioxide. Paper sent to Oil and Gas Journal in 2007, buta published version cannot be found. Southwest Research Institute. http://www.netl.doe.gov/technologies/coalpower/turbines/refshelf/papers/42650%20SwRI%20for%20Oil%20&%20Gas%20Journal.pdf.
[25] Shell. Coal gasification brochure. The shell coal gasification process e forsustainable utilisation of coal, http://www.shell.com/static/globalsolutions/downloads/innovation/coal_gasification_brochure.pdf; 2006.
[26] Larson ED, Jin H, Celik FE. Supporting information to: Large-scale gasifica-tion-based coproduction of fuels and electricity from switchgrass. BiofuelsBioprod Bioref 2009;3:174e94, http://www.princeton.edu/pei/energy/publications.
[27] Ohno Y. New clean fuel DME. Presentation at the DeWitt Global Methanol &MTBE Conference in Bangkok in 2007, http://www.methanol.org/pdf/Ohno_DME_Dev_Co.pdf.
[28] Ogden JM. Conceptual design of optimized fossil energy systems with captureand sequestration of carbon dioxide. Report UCD-ITSRR-04-34. University ofCalifornia Davis, Institute of Transportation Studies; 2004.
[29] Uslu A, Faaij APC, Bergman PCA. Pre-treatment technologies, and their effect oninternational bioenergy supply chain logistics. Techno-economic evaluation oftorrefaction, fast pyrolysis and pelletization. Energy 2008;33(8):1206e23.
188
Appendix D. Paper IV ISI Journal Paper Clausen LR, Elmegaard B, Ahrenfeldt J, Henriksen U. “Thermodynamic analysis of small-scale DME and methanol plants based on the efficient Two-stage gasifier”. Submitted to Energy (manuscript number: EGY-D-11-00180), 2011.

* Corresponding author. Fax: +45 45884325, email: [email protected] 1
THERMODYNAMIC ANALYSIS OF SMALL-SCALE DME AND METHANOL PLANTS BASED ON THE EFFICIENT TWO-STAGE GASIFIER Lasse R. Clausen a, *, Brian Elmegaard a, Jesper Ahrenfeldt b, Ulrik Henriksen b a Section of Thermal Energy Systems, Department of Mechanical Engineering, The Technical University of Denmark (DTU), Nils Koppels Allé Bld. 403, DK-2800 Kgs. Lyngby, Denmark b Biosystems Division, Risø National Laboratory for Sustainable Energy, The Technical University of Denmark (DTU), Frederiksborgvej 399, DK-4000 Roskilde, Denmark
Received: xx Abstract Models of DME and methanol synthesis plants have been designed by combining the features of the simulation tools DNA and Aspen Plus. The plants produce DME or methanol by catalytic conversion of a syngas generated by gasification of woody biomass. Electricity is co-produced in the plants by a gas engine utilizing the unconverted syngas. A two-stage gasifier with a cold gas efficiency of 93% is used, but because of the design of this type of gasifier, the plants have to be of small scale (5 MWth biomass input). The plant models show energy efficiencies from biomass to DME/methanol + electricity of 51-58% (LHV), which shows to be 6-8%-points lower than efficiencies achievable on large-scale plants based on torrefied biomass pellets. By using waste heat from the plants for district heating, the total energy efficiencies become 87-88%. Keywords: biorefinery, dimethyl ether, DME, methanol, Two-Stage Gasifier, syngas. 1. Introduction The CO2 emissions of the transportation sector can be reduced by increasing the use of biofuels – especially when the biofuels are produced from lignocellulosic biomass [1]. Dimethyl ether (DME) and methanol are two such biofuels. DME is a diesel-like fuel that can be produced from biomass in processes very similar to methanol production processes. Combustion of DME produces lower emissions of NOx than combustion of diesel, with no particulate matter or SOx in the flue gas [2], however it also requires storage pressures in excess of 5 bar to maintain a liquid state, which is similar to LPG. Two DME and two methanol synthesis plant configurations, based on syngas from gasification of wood chips, are investigated in this paper: • The DME-OT and MeOH-OT plants uses once through synthesis and the unconverted syngas
is combusted in a gas engine to produce electricity. • The DME-RC and MeOH-RC plants use recycling of some of the unconverted syngas to the
DME/methanol reactor to maximize DME/methanol production. All the electricity produced by the gas engine is used on-site.
Production of methanol from biomass is very well investigated in the literature (e.g., [3,4]), and DME production from biomass has also been reported in the literature (e.g., [5,6]). Small-scale tri-generation of liquid fuel, electricity and heat based on an efficient two-stage gasifier has however not been presented in the literature. The small-scale production enables the use of the energy efficient Two-Stage Gasifier [7,8] and enhances the possibility of utilizing a district heating co-production. The economy of small-scale production of liquid fuel cannot compete with large-scale

2
production [9,10]1
This paper documents the design of two DME and two methanol plants using the modeling tool DNA
, but the co-production of district heating in the small-scale plants will improve the economy of these plants.
[11,12] for the steam dryer and gasifier modeling and Aspen Plus for the downstream modeling. Thermodynamic performance of the plant configurations are presented and compared with the performance of large-scale plants. 2. Design of the DME and methanol plants A simplified process flow sheet of the DME and methanol plant designs is shown in Fig. 1 and detailed process flow sheets can be seen in Fig. 3-Fig. 6. Plant design aspects related to feedstock preparation, gasification, syngas conditioning, DME/methanol synthesis and separation are described next and are followed by a discussion of electricity and heat production in the plants. Important process design parameters used in the modeling are shown in Table 1.
Fig. 1. Simplified flow sheet of the DME and methanol plant models Steam drying The wet wood chips are dried in co-flow with superheated steam by using a screw conveyer design. The methanol/DME reactor and the gas engine exhaust supply the heat needed to superheat the steam. Gasification A two-stage gasifier at atmospheric pressure is used for gasifying the dried wood chips. The gasifier is an updated design of the one described in [7,8]. In the first stage, the dried wood chips, together with the steam surplus from the steam dryer, are heated/pyrolyzed in a closed screw conveyer by passing the hot syngas from the gasifier on the outside surface of the closed screw conveyer2
[7
. In order to lower the tar content, the pyrolysis gas is partially oxidized by adding air. In the second stage, the partially oxidized gas passes through a downdraft fixed bed, where the gasification reactions occur. The bed consists of coke from the pyrolysis stage. After this stage, the tar content in the gas is almost zero ]3
1 Small-scale plants will have lower biomass transportation cost than large-scale plants, but economy of scale more than outweighs this.
. The composition of the syngas is calculated by assuming
2 The heat consumption in the pyrolysis unit for the pyrolysis of dry wood is calculated based on measured temperatures of inputs and outputs and measured syngas composition – the heat loss to the surroundings is not included. The heat consumption for pyrolysis of dry wood (0% water) was estimated to be 952 kJ/kg-(dry wood) or 5.2% of the LHV (heating from 115°C to 630°C). 3 Only naphthalene could be measured and the content was <0.1 mg/Nm3 [7].
Two-stage gasification
Stream drying
Compression Synthesis
Syngas
Separation
Liquid
Electricity production
Wood
DME/MeOH
Unconverted syngas
3
chemical equilibrium at a temperature slightly above the gasifier exit temperature4
The two-stage gasification concept has been demonstrated in plants with 75 kWth
. In the methanol plants the H2/CO ratio of the syngas is set to 2 by adjusting the biomass water content (42.5 mass% water), and in the DME plants the H2/CO ratio is reduced to 1.5 by removing steam from the steam dryer loop. A H2/CO ratio of 1 is optimal for DME synthesis (Eq. 4), but a ratio of 1.5 is estimated to be the lowest achievable ratio that the gasifier can produce, due to soot formation in the partial oxidation at lower steam contents.
[7] and 700 kWth biomass input. Because of the design of the pyrolysis stage (heat is transferred from gas to solid), it is not considered possible to scale up the gasifier to more than some MWth [8]5
. Therefore, the biomass input for the modeled gasifier is set to 5 MWth (dry).
Gas cleaning Gas cleaning of biomass syngas for DME/methanol synthesis includes cyclones and filters for particle removal, a water wash to remove NH3 and HCl, and guard beds placed just before the synthesis reactor to remove sulfur and other impurities [13,14]. The guard beds consist of ZnO filters to remove H2S, and active carbon filters to remove traces of NH3, HCl, HCN, CS2, and COS [14]. Guard beds are used to remove sulfur because the sulfur content in biomass syngas is very low6
[15. Measurements on a two-stage gasifier with 75 kWth input showed only 0.93 ppm of COS
and 0.5-1 ppm of H2S in the raw gas ]. This is most likely due to the coke bed in the gasifier acting as an active carbon filter. The gas cleaning does not comprise tar removal because the tar content in the syngas is almost zero. The gas cleaning steps are not included in the modeling. Synthesis of DME and methanol The cooled syngas is sent to an intercooled compressor before it enters the DME/methanol synthesis reactor. Both reactors are boiling water reactors (BWR) because these reactor types are preferred over slurry/liquid phase reactors at small-scale [16,17]. The chemical reaction equations producing DME and methanol are showed in Eqs. 1-5. The product gas composition is calculated by assuming an approach to chemical equilibrium at the reactor operating temperature and pressure (approach temperatures in Table 1). Methanol synthesis reaction (from CO and H2): 4H2 + 2CO ↔ 2CH3OH -181.6 kJ (1) Methanol dehydration: 2CH3OH ↔ CH3OCH3 + H2O -23.4 kJ (2) Water gas shift reaction: CO + H2O ↔ CO2 + H2 -41.0 kJ (3) Direct DME synthesis reactions, (1)+(2) (+(3)): 3H2 + 3CO ↔ CH3OCH3 + CO2 4H2 + 2CO ↔ CH3OCH3 + H2O
-246.0 kJ -205.0 kJ
(4) (5)
4 In order to match measured data for the methane content, the model adds 0.67 mole% to the methane content calculated by chemical equilibrium. 5 The reference states a size of 3-10 MWth biomass input. 6 At a sulfur content of 0.02-0.1 mass% (dry biomass), the sulfur concentration in the dry gas becomes 55-275 ppm (H2S+COS).

4
The reactor product gas is cooled to 40°C (methanol) or -50°C (DME) in order to condense the methanol/DME. A gas-liquid separator then separates the liquid from the unconverted syngas. In the RC plants, about 76-79% of the unconverted syngas is recycled to the synthesis reactor, and the remaining 21-24% is used for power production. The recycle ratio has been optimized together with the synthesis pressure to yield the highest fuel production. Regarding the OT plants, the synthesis pressure was set to 40 bar in the DME-OT plant [17] and the synthesis pressure in the MeOH-OT plant was then adjusted to give the same fuel production as the DME-OT plant (96 bar). This was done to simplify the comparison of the OT plants. Because the syngas from the Two-Stage Gasifier only consists of 56-57 mole% H2+CO, the syngas conversions are lower than what would be achieved in large-scale plants using oxygen blown gasification and CO2 removal (Fig. 2). The syngas conversions are lowered from 86% to 64% for methanol synthesis (96 bar, 220°C), and from 85% to 64% for DME synthesis (40 bar, 240°C). The reduction in syngas conversion, due to the inert content, can however be compensated for by increasing the synthesis pressure (Fig. 2)7
17. The relatively low operating temperatures of
220°C and 240°C are suggested by [ ] to compensate for the high inert content in the syngas. This however results in higher costs for catalytic material compared to large-scale plants operating at 250-280°C (DME synthesis) [5,18].
Fig. 2. Syngas conversions (H2+CO) for methanol synthesis (left) and DME synthesis (right) at different synthesis temperatures and pressures. The solid lines are for the syngas from the Two-Stage Gasifier (composition in Table 2 for DME and Table 4 for methanol), and the dashed lines marked (L) are for a typical syngas used in a large-scale plant (methanol: 64.7% H2, 32.3% CO, 3% CO2. DME: 48.5% H2, 48.5% CO, 3% CO2 (mole%)). The syngas conversions are calculated with the approach temperatures listed in Table 1. Separation The liquid stream from the gas-liquid separator is distilled by fractional distillation in a topping column in order to remove the absorbed gasses (CO2). The CO2-rich stream from the column is sent to the gas engine. The resulting crude methanol product contains 2-5% water and the crude DME product contains 9-18% water and 10-14% methanol. The crude liquid fuel products are sent to central upgrading/purification because this is considered too costly at this small-scale. If additional distillation columns were added to the plants, the heat demand for the reboilers could be supplied by plant waste heat.
7 For methanol synthesis at 220°C, the syngas conversion at 96 bar corresponds to the syngas conversion at 45 bar in a large-scale plant. For DME synthesis at 240°C, the syngas conversion at 40 bar corresponds to the syngas conversion at 13 bar in a large-scale plant. The syngas conversion is 64% in all cases.
0102030405060708090
100
200 220 240 260 280 300
H2+
CO
conv
ersio
n [%
]
Temperature [C]
90 bar 90 bar (L)60 bar 60 bar (L)30 bar 30 bar (L)
0102030405060708090
100
200 220 240 260 280 300
Temperature [C]
90 bar 90 bar (L)60 bar 60 bar (L)30 bar 30 bar (L)

5
Power production The unconverted syngas that is not recycled to the synthesis reactor is heated by the gas engine exhaust before being expanded through a turbine to 2 bar8
[7. The gas is then combusted with air in a
turbocharged gas engine. Gas engine operation on syngas is described in ]. Because the unconverted syngas from the DME plant contains some DME (0.4 mole%), which is a diesel fuel, the operation of the gas engine may need to be adjusted. More simple plant designs could be obtained if the expander turbines were removed9
.
District heating production District heating is produced in order to improve the overall energy conversion efficiency for the plants. The main sources for district heating are syngas cooling, compressor intercooling and gas engine cooling. In the detailed flow sheets (Fig. 3 to Fig. 6), all the sources for district heating in the plants can be seen. Table 1 Process design parameters used in the modeling. Feedstock Wet wood chips. Dry composition (mass%): 48.8% C, 43.9% O, 6.2% H, 0.17% N, 0.02% S,
0.91% Ash [7]. LHV = 18.3 MJ/kg-dry [7]. Moisture content = 42.5 mass% Steam dryer Texit = 115°C. Tsuperheat = 200°C. Dry wood moisture content = 2 mass%a. Gasifier P = 1 bar. Carbon conversion = 99% [7]. Heat loss = 3% of the biomass thermal input (dry).
Texit = 730°C. Tequilibrium = 750°C. Compressors ηpolytropic = 80%, ηmechanical = 94%. ηelectrical = 100% [19]b. Syngas compressor: 5 stages with
intercooling to 40°C. DME/MeOH synthesis
BWR reactor. Chemical equilibrium at reactor outlet temperature and pressure. Reactor outlet temperatures: 240°C (DME) and 220°C (MeOH) [17]. Reactor pressures: 40.0 bar (DME-OT), 44.7 bar (DME-RC), 96.0 bar (MeOH-OT), 95.0 bar (MeOH-RC). The approach temperatures used are: 15°C for the methanol reaction (1) and the water gas shift reaction (3), 100°C for the methanol dehydration reaction (2) [17].
Cooling COP = 1.2 (cooling at -50°C) Expander / turbine ηisentropic = 70%, ηmechanical = 94%. Gas engine 38% of the chemical energy in the gas (LHV) is converted to electricity. Excess air ratio (λ) =
2. Texhaust = 400°C. Turbocharger: p = 2 bar, ηis, compressor = 75%, ηis, turbine = 78%, ηmechanical = 94%.
Heat exchangers ∆Tmin = 10°C (gas-liq) or 30°C (gas-gas). In pyrolysis stage: ∆Tmin = 100°C (gas-solid). District heating Twater, supply = 80°C, Twater, return = 30°C a The model of the steam dryer is based on measured data for a steam dryer of the same configuration and 700 kWth wood chips input. b The polytropic efficiency of the syngas compressor may be lower than 80%, because of the small scale. If the efficiency was 70%, the power consumption of the compressor in the MeOH-OT would be 101 kWe higher (17% higher), resulting in a 2%-points lower net electricity output (Fig. 7).
8 The MeOH-RC plant also uses waste heat from the gasification section to heat the gas before the expander because not enough waste heat is available in the gas engine exhaust. 9 Removing the expander turbine would lower the number of heat exchangers required, but would also result in a reduction of the net power production of 2-3%-points for the OT plants (Fig. 7) and an estimated reduction of the fuel production in the RC plants of 4-6%-points (Fig. 7).

6
3. Results The results from the simulation of the DME and methanol plants are presented in the following. In the flow sheets in Fig. 3 to Fig. 6, some of the important thermodynamic parameters are shown together with electricity production/consumption and heat transfer in the plants. In Table 2 to Table 5, the composition of specific streams in the flow sheets are shown.
Fig. 3. Flow sheet of the DME-OT plant model, showing mass flows, electricity consumption/production and heat
transfer.
Fly ash
Wet Wood (42.5% water)
DME reactor
Gas-liquid separator
22 Gas engine
Air
DME
Fluegas
5000 kWth (dry)4506 kWth (wet)
432 kWth
453 kWeAsh
725 kWe
gasifier
750 C
1
Water
Steam
Dry wood (2% water) + steam
Pyrolysis reactor
Air
11
12
15 17
6
3
7
2
Guard bed
70 kWth
23
DH: 113 kWth
DH: 504 kWth
DH: 444 kWthDH: 232 kWth
33
9
10
14
16
127 kWth
Water18
20
38
Water
DH: 217 kWth
4
27
46
19 kWe
29
28
42 kWth
49 kWe
38 kWth
21
25
26
16 kWth
116 kWe 98 kWe
19
5
8
13
31 32
36
37
39
40
41
42
43
47
48
49
t (C) p (bar) m (kg/s)17 40 1.0 0.67418 40 1.0 0.04119 130 41.0 0.63320 220 40.7 0.63321 220 40.7 0.63322 240 40.0 0.63323 160 39.8 0.63324 40 39.4 0.63325 25 39.4 0.63326 -23 39.3 0.63327 -50 39.2 0.63328 -50 38.5 0.41229 15 38.3 0.41230 314 37.5 0.41231 95 2.0 0.41232 25 2.0 0.412
t (C) p (bar) m (kg/s)43 152 1.0 1.63644 80 1.0 1.63645 -52 10.0 0.22146 -16 10.0 0.22147 -41 10.0 0.13648 -56 2.0 0.13649 51 10.0 0.086
t (C) p (bar) m (kg/s)1 15 1.0 0.4762 200 1.0 3.3073 115 1.0 3.3924 115 1.0 0.0855 40 1.0 0.0856 115 1.0 0.3917 630 1.0 0.3918 730 1.0 0.0049 730 1.0 0.707
10 730 1.0 0.22311 80 1.0 0.22312 230 1.0 0.48413 15 1.0 0.32014 700 1.0 0.32015 183 1.0 0.70716 40 1.0 0.033
t (C) p (bar) m (kg/s)33 11 2.0 0.54734 15 1.0 1.08935 99 2.0 1.08936 40 2.0 1.08937 25 2.0 1.08938 400 1.9 0.40139 325 1.0 1.23540 344 1.0 1.63641 250 1.0 1.63642 178 1.0 1.636
432 kWth
30
44
171 kWth
35
24
47 kWth
8 kWth
DH: 30 kWth
17 kWth
DH: 65 kWth
34
DH: 125 kWth
45
Net electricity: 320 kWeDistrict heating (DH): 1730 kWth
4672 kWth
H2/CO = 1.5
2315 kWth
17 kWth86 kWth

7
Table 2 Stream compositions for the DME-OT plant (stream numbers refer to Fig. 3) Gasifier
exit Reactor
inlet Reactor
outleta To
expander To distil-
lation CO2 to engine
Gas to engineb
DMEc
Stream number 9 21 22 30 46d 48 33 49d Mass flow (kg/s) 0.707 0.633 0.633 0.412 0.221 0.136 0.547 0.086 Flow (mole/s) 34.2 30.1 22.8 17.6 5.18 3.14 20.7 2.04 Mole frac (%) H2 30.0 34.1 20.2 26.1 0.20 0.33 22.2 0.00 CO 20.4 23.2 7.3 9.3 0.35 0.58 8.0 0.00 CO2 11.0 12.5 23.8 13.7 58.0 95.7 26.1 0.00 H2O 12.4 0.42 0.84 0.00 3.7 0.00 0.00 9.3 CH4 0.76 0.87 1.1 1.4 0.30 0.49 1.3 0.00 N2 25.1 28.5 37.7 48.4 1.7 2.7 41.4 0.00 Ar 0.30 0.34 0.45 0.56 0.06 0.09 0.49 0.00 CH3OH - - 0.92 0.00 4.1 0.00 0.00 10.3 CH3OCH3 - - 7.6 0.48 31.7 0.05 0.41 80.4 a The syngas conversion in the DME reactor is 64% (55% H2-conversion and 76% CO-conversion). b The energy content in the gas to the engine is 7.8 MJ/m3 (LHV). c The flow of methanol-equivalent is 3.49 mole/s (1 mole of DME is 2 mole methanol-equivalent). d Liquid. Table 3 Stream compositions for the DME-RC plant (stream numbers refer to Fig. 4) Gasifier
exit After
compressor Reactor
inlet Reactor
outleta Recycle
gasb To distil-
lation CO2 to engine
Gas to enginec
DMEd
Stream number 9 19 22 23 31 48e 50 35 51e Mass flow (kg/s) 0.707 0.633 1.733 1.733 1.100 0.278 0.164 0.519 0.114 Flow (mole/s) 34.2 30.1 74.5 65.5 44.4 6.71 3.80 18.1 2.91 Mole frac (%) H2 30.0 34.1 25.8 18.0 20.1 0.13 0.23 15.9 0.00 CO 20.4 23.2 12.6 4.9 5.4 0.17 0.30 4.3 0.00 CO2 11.0 12.5 12.5 16.8 12.5 54.2 95.7 29.9 0.00 H2O 12.4 0.39 0.16 0.79 0.00 7.6 0.00 0.00 17.6 CH4 0.76 0.87 1.3 1.5 1.7 0.32 0.56 1.4 0.00 N2 25.1 28.6 46.8 53.3 59.2 1.7 3.0 47.4 0.00 Ar 0.30 0.34 0.54 0.62 0.68 0.06 0.11 0.56 0.00 CH3OH - - 0.00 0.61 0.00 5.9 0.00 0.00 13.6 CH3OCH3 - - 0.28 3.5 0.47 29.8 0.05 0.38 68.7 a The syngas conversion in the DME reactor is 48% (39% H2-conversion and 66% CO-conversion). b 76% of the unconverted syngas is recycled, resulting in a reactor inlet mole flow that is 2.5 times higher than the feed flow. c The energy content in the gas to the engine is 5.8 MJ/m3 (LHV). d The flow of methanol-equivalent is 4.39 mole/s (1 mole of DME is 2 mole methanol-equivalent). e Liquid.

8
Fig. 4. Flow sheet of the DME-RC plant model, showing mass flows, electricity
consumption/production and heat transfer.
Fly ash
Wet Wood (42.5% water)
DME reactor
Gas-liquid separator
23 Gas engine
Air
DME
Fluegas
5000 kWth (dry)4506 kWth (wet)
474 kWth
469 kWeAsh
464 kWe
gasifier
750 C
1
Water
Steam
Dry wood (2% water) + steam
Pyrolysis reactor
Air
11
12
15 17
6
3
7
2
Guard bed
322 kWth
24
DH: 155 kWth
DH: 245 kWth
DH: 457 kWthDH: 232 kWth
35
9
10
14
16
85 kWth
Water18
21
40
Water
DH: 217 kWth
4
28
48
23 kWe
30
29
72 kWth
54 kWe
129 kWth
2022
26
2741 kWth
143 kWth98 kWe 64 kWe
32
19
5
8
13
33 34
38
39
41
42
43
44
45
49
50
51
t (C) p (bar) m (kg/s)18 40 1.0 0.04119 133 46.0 0.63320 69 46.0 1.73321 220 45.5 1.73322 220 45.5 1.73323 240 44.7 1.73324 99 44.2 1.73325 40 43.9 1.73326 25 43.9 1.73327 -37 43.8 1.73328 -50 43.7 1.73329 -50 42.9 1.45430 15 42.7 1.45431 26 47.7 1.10032 321 41.7 0.35533 93 2.0 0.35534 25 2.0 0.355
t (C) p (bar) m (kg/s)45 152 1.0 1.23246 80 1.0 1.23247 -51 10.0 0.27848 -5 10.0 0.27849 -41 10.0 0.16450 -56 2.0 0.16451 54 10.0 0.114
t (C) p (bar) m (kg/s)1 15 1.0 0.4762 200 1.0 3.3073 115 1.0 3.3924 115 1.0 0.0855 40 1.0 0.0856 115 1.0 0.3917 630 1.0 0.3918 730 1.0 0.0049 730 1.0 0.707
10 730 1.0 0.22311 80 1.0 0.22312 230 1.0 0.48413 15 1.0 0.32014 700 1.0 0.32015 183 1.0 0.70716 40 1.0 0.03317 40 1.0 0.674
t (C) p (bar) m (kg/s)35 6 2.0 0.51936 15 1.0 0.71337 99 2.0 0.71338 40 2.0 0.71339 25 2.0 0.71340 400 1.9 0.41141 326 1.0 0.82142 351 1.0 1.23243 246 1.0 1.23244 182 1.0 1.232
474 kWth
46
37
25
40 kWth
7 kWth
DH: 24 kWth
11 kWth
DH: 43 kWth
36
DH: 94 kWth
47
4672 kWth
H2/CO = 1.5
16 kWe
31
2908 kWth
42 kWth365 kWth
Net electricity: 0 kWeDistrict heating (DH): 1467 kWth

9
Fig. 5. Flow sheet of the MeOH-OT plant model, showing mass flows, electricity consumption/production and heat
transfer.
Fly ash
Wet Wood (42.5 mass% water)
MeOH reactor
Gas-liquid separator
20 Gas engine
Air
MeOH
Fluegas
5000 kWth (dry)4506 kWth (wet)
342 kWth
597 kWeAsh
738 kWe
gasifier
750 C
1
Water
Steam
Dry wood (2% water) + steam
Pyrolysis reactor
Air
9
10
13 15
4
3
5
2
Guard bed
32 kWth
21
DH: 257 kWth
DH: 543 kWth
DH: 561 kWthDH: 412 kWth
28
7
8
12
14
217 kWth
Water16
18
3323
19
155 kWe 100 kWe25
17
6
11
26
31
32
34
35
38
39
42
43
t (C) p (bar) m (kg/s)15 40 1.0 0.69216 40 1.0 0.04417 153 98.1 0.64818 200 97.8 0.64819 200 97.8 0.64820 220 96.0 0.64821 183 95.8 0.64822 40 94.8 0.64823 40 93.0 0.50924 117 92.5 0.50925 313 91.3 0.50926 58 2.0 0.50927 25 2.0 0.50928 25 2.0 0.535
t (C) p (bar) m (kg/s)37 147 1.0 1.63938 116 1.0 1.63939 94 1.0 1.63940 80 1.0 1.63941 40 93.0 0.13942 25 2.0 0.02643 83 2.0 0.113
t (C) p (bar) m (kg/s)1 15 1.0 0.4762 200 1.0 3.3073 115 1.0 3.3074 115 1.0 0.4765 630 1.0 0.4766 730 1.0 0.0047 730 1.0 0.7848 730 1.0 0.2099 80 1.0 0.209
10 236 1.0 0.57511 15 1.0 0.31312 700 1.0 0.31313 195 1.0 0.78414 40 1.0 0.092
t (C) p (bar) m (kg/s)29 15 1.0 1.10430 99 2.0 1.10431 40 2.0 1.10432 25 2.0 1.10433 400 1.9 0.38434 325 1.0 1.25535 343 1.0 1.63936 269 1.0 1.639
342 kWth
40
55 kWth
30
22
38 kWth
17 kWth
DH: 66 kWth
29
DH: 24 kWth
41
2230 kWth
17 kWth
Net electricity: 296 kWeDistrict heating (DH): 1863 kWth
4647 kWth
H2/CO = 2.0
36
37
24
27
20 kWth
135 kWth17 kWth
49 kWth

10
Table 4 Stream compositions for the MeOH-OT plant (stream numbers refer to Fig. 5) Gasifier
exit Reactor
inlet Reactor
outleta To
expander To distil-
lation CO2 to engine
Gas to engineb
MeOHc
Stream number 7 19 20 25 41d 42 28 43d Mass flow (kg/s) 0.784 0.648 0.648 0.509 0.139 0.026 0.535 0.113 Flow (mole/s) 38.7 31.1 23.7 19.5 4.19 0.63 20.2 3.57 Mole frac (%) H2 29.9 37.1 17.5 21.2 0.15 0.99 20.6 0.00 CO 14.9 18.6 8.8 10.6 0.13 0.85 10.3 0.00 CO2 12.8 15.9 20.9 22.7 12.7 85.4 24.6 0.00 H2O 19.7 0.24 0.32 0.01 1.8 0.00 0.01 2.1 CH4 0.71 0.88 1.2 1.4 0.08 0.53 1.4 0.00 N2 21.7 27.0 35.4 42.9 0.52 3.5 41.6 0.00 Ar 0.26 0.32 0.42 0.51 0.02 0.13 0.49 0.00 CH3OH - - 15.6 0.77 84.6 8.6 1.0 97.9 a The syngas conversion in the methanol reactor is 64% (64% H2-conversion and 64% CO-conversion). b The energy content in the gas to the engine is 7.8 MJ/m3 (LHV).
c The flow of methanol is 3.49 mole/s. d Liquid. Table 5 Stream compositions for the MeOH-RC plant (stream numbers refer to Fig. 6) Gasifier
exit After
compressor Reactor
inlet Reactor
outleta Recycle
gasb To distil-
lation CO2 to engine
Gas to enginec
MeOHd
Stream number 7 18 21 22 26 43e 44 31 45e Mass flow (kg/s) 0.784 0.648 2.391 2.391 1.743 0.180 0.035 0.504 0.145 Flow (mole/s) 38.7 31.1 92.5 83.3 61.3 5.45 0.83 17.3 4.62 Mole frac (%) H2 29.9 37.1 21.3 12.5 13.3 0.09 0.58 12.7 0.00 CO 14.9 18.6 11.6 7.5 8.1 0.09 0.59 7.7 0.00 CO2 12.8 15.9 21.8 24.0 24.8 13.1 85.8 27.7 0.00 H2O 19.7 0.24 0.09 0.29 0.01 4.2 0.00 0.01 4.9 CH4 0.71 0.88 1.4 1.5 1.6 0.09 0.57 1.6 0.00 N2 21.7 27.0 42.7 47.4 50.7 0.57 3.7 48.5 0.00 Ar 0.26 0.32 0.50 0.56 0.60 0.02 0.14 0.58 0.00 CH3OH - - 0.52 6.1 0.78 81.8 8.6 1.2 95.1 a The syngas conversion in the methanol reactor is 45% (47% H2-conversion and 42% CO-conversion). b 79% of the unconverted syngas is recycled, resulting in a reactor inlet mole flow that is 3.0 times higher than the feed flow. c The energy content in the gas to the engine is 5.9 MJ/m3 (LHV). d The flow of methanol is 4.39 mole/s. e Liquid.

11
Fig. 6. Flow sheet of the MeOH-RC plant model, showing mass flows, electricity
consumption/production and heat transfer. Fig. 3 to Fig. 6 shows that the 5000 kWth biomass input can be converted to a maximum of 2803 kWth of methanol or 2908 kWth of DME in the RC plants - with no net electricity production, but with a heat production of 1620 kWth (MeOH) or 1467 kWth (DME) (see Fig. 7 for corresponding energy efficiencies). If once-through synthesis is used to simplify the synthesis process, the fuel production drops to 2230 kWth of methanol or 2315 kWth of DME, but the net electricity production and the heat production increases to 296 kWe and 1863 kWth (MeOH) or 320 kWe and 1730 kWth (DME). These values show that the DME plants produce more fuel than the methanol plants on an energy basis, but if the fuel production is compared on a methanol-equivalence basis
Fly ash
Wet Wood (42.5% water)
MeOH reactor
Gas-liquid separator
22 Gas engine
Air
MeOH
Fluegas
5000 kWth (dry)4506 kWth (wet)
352 kWth
596 kWe
Ash
479 kWe
gasifier
750 C
1
Water
Steam
Dry wood (2% water) + steam
Pyrolysis reactor
Air
9
10
14 16
4
3
5
2
Guard bed
337 kWth
23
DH: 379 kWth
DH: 291 kWth
DH: 560 kWthDH: 312 kWth
31
7
8
13
15
207 kWth
Water17
20
3625
21
132 kWe 66 kWe28
18
6
12
30
34
35
37
38
39
40
44
45
t (C) p (bar) m (kg/s)15 40 1.0 0.09216 40 1.0 0.69217 40 1.0 0.04418 153 97.6 0.64819 80 97.6 2.39120 200 96.8 2.39121 200 96.8 2.39122 220 95.0 2.39123 110 94.3 2.39124 40 93.8 2.39125 40 92.0 2.21126 47 99.0 1.74327 206 90.9 0.46928 320 90.2 0.469
t (C) p (bar) m (kg/s)38 350 1.0 1.23339 301 1.0 1.23340 145 1.0 1.23341 106 1.0 1.23342 80 1.0 1.23343 40 92.0 0.18044 25 2.0 0.03545 84 2.0 0.145
t (C) p (bar) m (kg/s)1 15 1.0 0.4762 200 1.0 3.3073 115 1.0 3.3074 115 1.0 0.4765 630 1.0 0.4766 730 1.0 0.0047 730 1.0 0.7848 730 1.0 0.2099 80 1.0 0.209
10 236 1.0 0.57511 127 1.0 0.57512 15 1.0 0.31313 700 1.0 0.31314 114 1.0 0.784
t (C) p (bar) m (kg/s)29 64 2.0 0.46930 25 2.0 0.46931 25 2.0 0.50432 15 1.0 0.73033 99 2.0 0.73034 40 2.0 0.73035 25 2.0 0.73036 400 1.9 0.38937 326 1.0 0.844
352 kWth
42
67 kWth
33
24
50 kWth
11 kWth
DH: 44 kWth
32
DH: 34 kWth
43
2803 kWth
23 kWth
2619
Net electricity: 0 kWeDistrict heating (DH): 1620 kWth
4647 kWth
H2/CO = 2.0
27
100 kWthP-284
15 kWe
29
20 kWth
41
11
56 kWth393 kWth

12
(two moles methanol is used to produce one mole DME), the fuel production is actually the same for the OT plants and the RC plants respectively (Table 2 to Table 5)10
The lower net electricity production by the MeOH-OT plant compared with the DME-OT plant is due to the higher synthesis pressure in the methanol plants (96 bar vs. 40 bar for the OT plants), resulting in a higher syngas compressor duty. The difference in syngas compressor duty is however almost completely compensated for by the electricity consumption for refrigeration needed in the DME plants, and by a higher gross electricity production in the methanol plants.
.
The higher heat production by the OT plants compared with the RC plants is due to the higher waste heat production by the gas engine, and the higher heat production by the methanol plants compared with the DME plants is because of: 1. the compressor intercooling due to the higher synthesis pressure, and 2. the cooling of the syngas from the methanol/DME reactor due to the condensation of methanol when cooling to 40°C. Because the performance of the DME/methanol plants showed to be very similar when comparing OT plants and RC plants respectively, it is difficult to conclude that one type is better than the other. However, because the design of the synthesis loop is more complex in the DME plants and a refrigeration plant is needed in the synthesis loop and for the topping column, a methanol plant may be more suited for small-scale production11
Fig. 7. If the RC plants are compared with the OT
plants, shows that the fuels effective efficiencies (FEE) are 5%-points higher for the RC plants12
Table 3
, which means that the RC plants should be preferred because they produce DME/methanol more efficiently. The added cost for the synthesis loop and the larger DME/methanol reactor (2.5-3 times higher mole flow, see and Table 5) may however make the RC plants less attractive than the OT plants.
10 Equal fuel production for the OT plants was an input to the modeling. The reason why the energy content of the produced DME is higher than the energy content of the produced methanol is that LHV for methanol includes the heat of vaporization because methanol is liquid at standard conditions (LHVmethanol = 638.1 MJ/kmole, LHVDME = 1328 MJ/kmole). 11 The fact that a higher synthesis pressure is used in the methanol plants may have a negative economic impact on the methanol plants, because of a higher syngas compressor cost, and perhaps higher costs for the synthesis section. 12 If the FEE’s were calculated with an electric efficiency of 30-31% instead of 50%, the FEE’s for the OT plants would be the same as the FEE’s for the RC plants (56% and 58%).
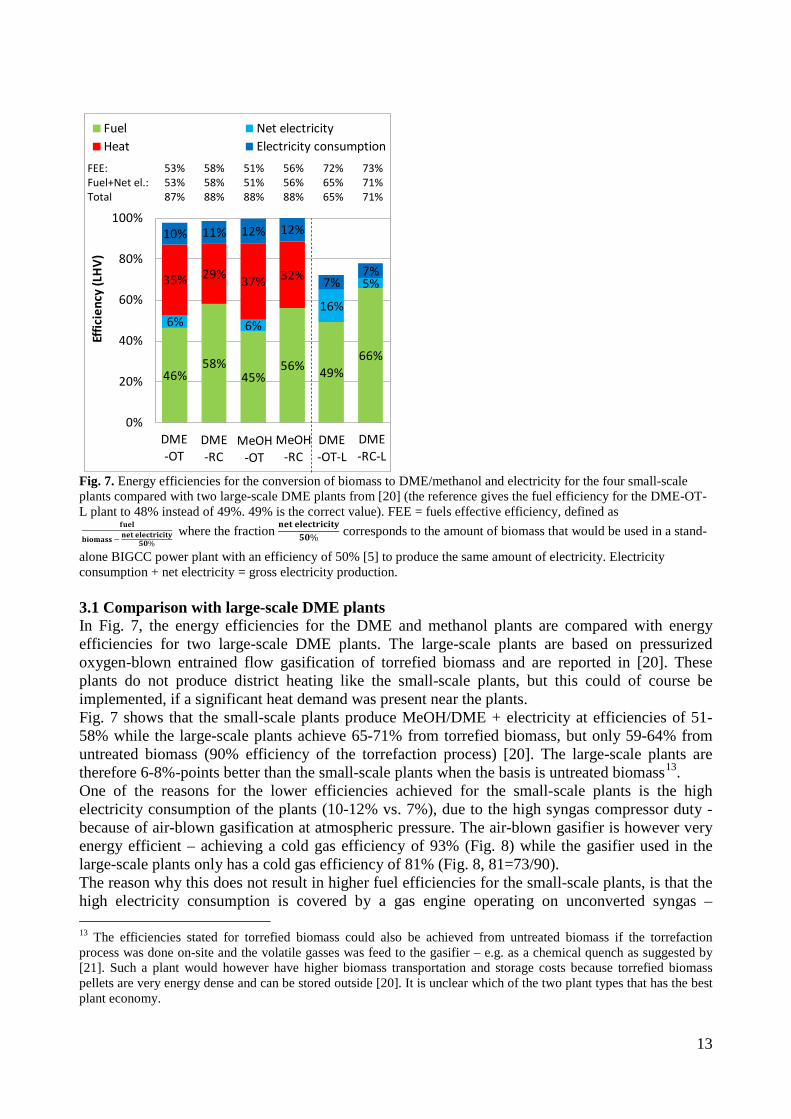
13
Fig. 7. Energy efficiencies for the conversion of biomass to DME/methanol and electricity for the four small-scale plants compared with two large-scale DME plants from [20] (the reference gives the fuel efficiency for the DME-OT-L plant to 48% instead of 49%. 49% is the correct value). FEE = fuels effective efficiency, defined as
where the fraction corresponds to the amount of biomass that would be used in a stand-
alone BIGCC power plant with an efficiency of 50% [5] to produce the same amount of electricity. Electricity consumption + net electricity = gross electricity production. 3.1 Comparison with large-scale DME plants In Fig. 7, the energy efficiencies for the DME and methanol plants are compared with energy efficiencies for two large-scale DME plants. The large-scale plants are based on pressurized oxygen-blown entrained flow gasification of torrefied biomass and are reported in [20]. These plants do not produce district heating like the small-scale plants, but this could of course be implemented, if a significant heat demand was present near the plants. Fig. 7 shows that the small-scale plants produce MeOH/DME + electricity at efficiencies of 51-58% while the large-scale plants achieve 65-71% from torrefied biomass, but only 59-64% from untreated biomass (90% efficiency of the torrefaction process) [20]. The large-scale plants are therefore 6-8%-points better than the small-scale plants when the basis is untreated biomass13
One of the reasons for the lower efficiencies achieved for the small-scale plants is the high electricity consumption of the plants (10-12% vs. 7%), due to the high syngas compressor duty - because of air-blown gasification at atmospheric pressure. The air-blown gasifier is however very energy efficient – achieving a cold gas efficiency of 93% (
.
Fig. 8) while the gasifier used in the large-scale plants only has a cold gas efficiency of 81% (Fig. 8, 81=73/90). The reason why this does not result in higher fuel efficiencies for the small-scale plants, is that the high electricity consumption is covered by a gas engine operating on unconverted syngas – 13 The efficiencies stated for torrefied biomass could also be achieved from untreated biomass if the torrefaction process was done on-site and the volatile gasses was feed to the gasifier – e.g. as a chemical quench as suggested by [21]. Such a plant would however have higher biomass transportation and storage costs because torrefied biomass pellets are very energy dense and can be stored outside [20]. It is unclear which of the two plant types that has the best plant economy.
46%58%
45%56% 49%
66%
6% 6%
16%
5%35% 29% 37% 32%
10% 11% 12% 12%
7%7%
0%
20%
40%
60%
80%
100%
Effic
ienc
y (L
HV
)
Fuel Net electricityHeat Electricity consumption
MeOH-RC
DME-OT
DME-RC
MeOH-OT
DME-RC-L
DME-OT-L
FEE: 53% 58% 51% 56% 72% 73% Fuel+Net el.: 53% 58% 51% 56% 65% 71% Total 87% 88% 88% 88% 65% 71%

14
meaning that a certain amount of unconverted syngas must be supplied to the engine. In the large-scale plants, waste heat is also used for electricity production why no unconverted syngas is needed to cover the (low) electricity consumption. In the DME-RC plant, 24% of the input chemical energy is used for electricity production, while only 1% is used in large-scale DME-RC plant. This clearly eliminates the higher flow of chemical energy in the small-scale plants after gasification (93% vs. 73%, Fig. 8). If less unconverted syngas was needed by the gas engine or external electricity was supplied to the small-scale plants, it would however be difficult to increase the fuel production much, because of the high level of inerts in the syngas.
Fig. 8. Chemical energy streams (LHV, dry) in the small-scale DME plants compared with two large-scale DME plants from [20]. The figure includes conversion heat losses. The conversion heat losses (excluding the torrefaction heat loss) are in the large-scale DME plants used by a steam plant to produce electricity. In the small-scale DME plants, the conversion heat losses are used internally in the gasifier and for steam drying of biomass. The torrefaction process does not occur in the large-scale DME plants, but decentralized. WGS = water gas shift. 4. Conclusion Synthesis of DME or methanol from syngas generated by the efficient Two-Stage Gasifier showed to give energy efficiencies from biomass to methanol/DME + electricity of 51-53% (LHV) for once through synthesis, and 56-58% (LHV) for RC synthesis. There was almost no difference between the energy performance of the methanol plants and the DME plants, when comparing the fuel production on a methanol-equivalence basis. Besides producing liquid fuel and electricity, the plants also produced district heating, which increased the total energy efficiency of the plants to 87-88% (LHV). The energy efficiencies achieved for biomass to methanol/DME + electricity were 6-8%-points lower than what could be achieved by large-scale DME plants. The main reason for this difference showed to be the use of air-blown gasification at atmospheric pressure in the small-scale plants, because this results in high syngas compressor duties and high inert content in the synthesis reactor. However, the use of a gas engine operating on unconverted syngas to cover the on-site electricity consumption also limits how much of the syngas that can be converted to liquid fuel.
DME-OT
46%100% 93%
DMEWood
7%
GasificationSynthesis
38%Engine9%
DME-RC
58%100% 93%
DMEWood
7%
GasificationSynthesis
24%Engine11%
44%100% 90%
DMEWood
DME-OT (large-scale)
Torrefaction
10%
Gasification
73%
WGS
70%
17%
Synthesis
18% Gas turbine8%3%
59%100% 90%
DMEWood
Torrefaction
10%
Gasification
73%
WGS
71%
17%
Synthesis
1% Off-gas boiler
11%2%
DME-RC (large-scale)

15
The reason why the difference between the small-scale and the large-scale plants showed not to be greater, was the high cold gas efficiency of the gasifier used in the small-scale plants. Acknowledgements For financial support, the authors would like to thank the Danish Energy Research Programme (Energiforskningsprogrammet - EFP). The Danish Energy Research Programme had no influence on the research presented in this article, or the writing of the article. References [1] JRC, Eucar, Concawe. Well-to-wheels analysis of future automotive fuels and powertrains in the European context. Report, version 2C, 2007, http://ies.jrc.ec.europa.eu/jec-research-collaboration/downloads-jec.html, accessed 12/15/2010. [2] International DME association (IDA). DME - Clean Fuel for Transportation. http://www.aboutdme.org/index.asp?bid=219, accessed 12/15/2010. [3] Sues A, Juraščík M, Ptasinski K. Exergetic evaluation of 5 biowastes-to-biofuels routes via gasification. Energy 2010;35(2):996-1007 [4] Hamelinck CN, Faaij APC. Future prospects for production of methanol and hydrogen from biomass, report NWS-E-2001-49. Utrecht, The Netherlands: Utrecht University, Copernicus Institute, 2001. http://www.mtholyoke.edu/courses/tmillett/course/geog_304B/e2001-49.pdf, accessed 12/15/2010. [5] Larson ED, Jin H, Celik FE. Large-scale gasification-based coproduction of fuels and electricity from switchgrass. Biofuels, Biorprod. Bioref. 2009;3:174–194. [6] Pettersson K, Harveya S. CO2 emission balances for different black liquor gasification biorefinery concepts for production of electricity or second-generation liquid biofuels. Energy 2010;35(2):1101-1106. [7] Ahrenfeldt J, Henriksen U, Jensen TK, Gøbel B, Wiese L, Kather A, Egsgaard H. Validation of a Continuous Combined Heat and Power (CHP) Operation of a Two-Stage Biomass Gasifier. Energy & Fuels 2006;20(6):2672-2680. [8] Bentzen JD, Hummelshøj RM, Henriksen U, Gøbel B, Ahrenfelt J, Elmegaard B. Upscale of the two-stage gasification process. In: procedings of 2. World Conference and Technology Exhibition on Biomass for Energy and Industry, Florence & WIP-Munich, Rome, 2004. http://orbit.dtu.dk/getResource?recordId=155745&objectId=1&versionId=1, accessed 12/15/2010. [9] Boerrigter H. Economy of Biomass-to-Liquids (BTL) plants, report: ECN-C--06-019. Petten, The Netherlands: ECN, 2006. http://www.ecn.nl/publications/, accessed 12/15/2010. [10] Larson ED, Williams RH, Jin H. Fuels and electricity from biomass with CO2 capture and storage. In: proceedings of the 8th International Conference on Greenhouse Gas Control Technologies, Trondheim, Norway, June 2006, http://www.princeton.edu/pei/energy/publications/, accessed 12/15/2010. [11] Elmegaard B, Houbak N. DNA – A General Energy System Simulation Tool. In: J. Amundsen et al., editors. SIMS 2005, 46th Conference on Simulation and Modeling, Trondheim, Norway. Tapir Academic Press, 2005. p. 43-52. [12] Homepage of the thermodynamic simulation tool DNA. http://orbit.dtu.dk/query?record=231251. Technical University of Denmark (DTU). Accessed 12/15/2010. [13] van der Drift A, Boerrigter H. Synthesis gas from biomass, report: ECN-C--06-001. Petten, The Netherlands: ECN, 2006. http://www.ecn.nl/publications/, accessed 12/15/2010.

16
[14] Boerrigter H, Calis HP, Slort DJ, Bodenstaff H, Kaandorp AJ, Kaandorp AJ, den Uil H, Rabou LPLM. Gas Cleaning for Integrated Biomass Gasification (BG) and Fischer-Tropsch (FT) Systems, report: ECN-C--04-056. Petten, The Netherlands: ECN, 2006. http://www.ecn.nl/publications/, accessed 12/15/2010. [15] Iversen HL, Henriksen U, Ahrenfeldt J, Bentzen JD. D25 Performance characteristics of SOFC membranes at two stage gasifier (confidential), report (EU project no.: 502759). Technical University of Denmark (DTU), 2006. [16] Hansen JB, Nielsen PEH (Haldor Topsøe). Methanol Synthesis. Section 13.13 in “Handbook of Heterogeneous Catalysis”, Wiley-VCH, 2008, online ISBN: 9783527610044, http://onlinelibrary.wiley.com/doi/10.1002/9783527610044.hetcat0148/abstract, accessed 12/15/2010. [17] Personal communication with John Bøgild Hansen (Senior Scientist & Adviser to Chairman, Company Mangement) and Poul Erik Højlund Nielsen (department manager of science & innovation, R&D) about methanol synthesis, and Finn Joensen about DME synthesis, Haldor Topsøe A/S, 2010. [18] Lee S, Cho W, Song T, Ra Y (R & D Division, Korea Gas Corporation (KOGAS)). Scale up study of DME direct synthesis technology. In: proceedings of the 24th World Gas Conference, 2009, http://www.igu.org/html/wgc2009/papers/docs/wgcFinal00745.pdf, accessed 12/15/2010. [19] Kreutz TG, Larson ED, Liu G, Williams RH. Fischer-Tropsch Fuels from Coal and Biomass, report. Princeton, New Jersey: Princeton Environmental Institute, Princeton University, 2008. http://www.princeton.edu/pei/energy/publications, accessed 12/15/2010. [20] Clausen LR, Elmegaard B, Houbak N. Technoeconomic analysis of a low CO2 emission dimethyl ether (DME) plant based on gasification of torrefied biomass. Energy 2010;35(12):4831-4842. [21] Prins MJ, Ptasinski KJ, Janssen FJJG. More efficient biomass gasification via torrefaction. Energy 2006;31(15):3458–3470.

205
Appendix E. Scenarios from IPCC Scenarios from [IPCC, 2005]:

206
Appendix F. A fossil free scenario In a fossil free scenario, the only hydrocarbon source is biomass, and since the “non-energy use” sector relies on a hydrocarbon feedstock, it seems obvious that biomass must be prioritized for this sector. In the transportation sector, alternatives to biomass exist in the form of renewable (or nuclear) electricity, which can be used directly in an electric vehicle or converted to hydrogen and then used in a hydrogen vehicle. However, these alternatives might be too expensive compared to biofuels, or at least, might not be suited to replace all parts of the transportation sector (aviation, shipping, long distance road transport), which is why it seems very likely that biomass would replace some part (or a great part) of the fossil energy use in the transportation sector in a fossil free scenario. In the heat and power sector, obvious alternatives exists to biomass in a fossil free scenario, namely electricity generating renewables such as wind, solar, hydro, etc., or nuclear power. However, most of these renewables (e.g. wind and solar) generate fluctuating power, which is why it would be an advantage to use biomass as backup power in situations when these renewables do not generate enough power to meet the demand. In Figure F.1, the fossil fuel usage in 2007 for different sectors is shown together with the estimated amount of biomass needed to replace fossil fuels in three of these sectors. The figure shows, that the amount of biomass needed to replace 1 energy unit of fossil energy, varies for the different sectors but is higher than 1 energy unit of biomass (Figure F.1: compare the world fossil fuel usage with the conv. replacement case). This is because biomass needs to be converted in an energy consuming process, in order to be able to replace e.g. petroleum products in the transportation sector or the “non-energy use” sector. In the heat and power sector, biomass does not need to be converted before usage, which is why it is a reasonable to assume that less biomass is needed to replace 1 energy unit of fossil fuel (still higher than 1 energy unit of biomass). Figure F.1 suggests that there most likely will be enough biomass to replace the “non-energy use” sector, in a fossil free scenario, while still leave a lot of biomass supply to replace some parts of the transport and heat and power sectors (in Figure F.1: compare the conv. replacement case with the sustainable biomass potential). It should however be noted that the fossil fuel usage shown in Figure F.1 is for 2007 (410 EJ/year), where the total primary energy usage was 500 EJ/year. The primary energy usage is projected to grow to 600-1000 EJ/year in 2050 (Figure 2.1). It should also be noted, that the sustainable biomass potential shown for reference in Figure F.1 is for 2050 and might therefore be too pessimistic when looking at an even longer term (e.g. 2100-?), where a fossil free scenario could be realized. As shown in Figure F.1 it is possible to lower the amount of biomass needed to replace fossil fuels in the transportation and “non-energy use” sector (Figure F.1: the alt. case).

207
This could be interesting if the supply of biomass is very limited - but as mentioned above, this does not seem to be the case according to Figure F.1. The reduction in biomass demand is achieved by introducing external hydrogen62
to the biomass to liquids (BTL) plants, which enables full utilization of the carbon stored in the biomass. In this way, the amount of biomass needed to replace 1 energy unit of fossil energy in the transportation and “non-energy use” sector can be reduced to less than 1 energy unit of biomass.
Figure F.1. The world fossil fuel usage in 2007 distributed on six different sectors [IEA, 2007] together with the estimated amounts of biomass energy needed to replace fossil fuels in three of these sectors. The sustainable biomass potential is given for reference. * Other sectors include: residential, commercial and public services, agriculture / forestry and fishing. ** “Non-energy use” includes the petrochemical industry (e.g. production of ethylene, propylene and butylene.) *** The amount of biomass energy needed to replace fossil fuel energy in the “electricity, heat and CHP plants” sector is estimated to be 1:1.25 in both the conventional and alternative case. For the transportation sector and the “non-energy use” sector the ratios are 1:1.8 in the conv. case (conventional BTL, the substitution ratio of 1:1.8 is from [IPCC, 2007]) and 1:0.78 in the alt. case (BTL with complete utilization of the carbon in the biomass by using external hydrogen). The substitution ratio of 1:0.78 is calculated based on information from section 7.2.1 (0.78=1/1.28). A substitution ratio of 1:0.78 for the “non-energy use” sector is uncertain, since most hydrocarbons produced in this sector will have higher carbon/hydrogen ratio than methanol or DME, but other products from the sector, such as ammonia (NH3), contains no carbon and can therefore be produced from hydrogen without any use of biomass. **** The sustainable biomass potential of 200-500 EJ is from [IEA Bioenergy, 2009]. In the transportation sector, BTL with external hydrogen is not the only way of reducing the biomass demand compared with conventional BTL. If biomass is converted to hydrogen and then used in a fuel cell vehicle, it is also possible to replace 1 energy unit of fossil energy with less than 1 energy unit of biomass. However, both these methods will probably only be economical compared to conventional BTL, if the price of biomass
62 The external hydrogen should be generated from surplus power from renewables such as wind and solar.
050
100150200250300350400450500
World fossil fuel
usage 2007
conv. alt. Sustainable biomass
potential in 2050****
Ener
gy [E
J/ye
ar]
Transformation and extraction lossesOther sectors*
Industry sector
Electricity, heat and CHP plantsTransport sector
Non-energy use**
Biomass neddedto replace***:

208
is very high (corresponding to a very limited biomass supply) – and in the case of BTL with external hydrogen, only if the external hydrogen can be generated at a low cost. These two alternative methods of substituting fossil fuels in the transportation sector are discussed further in the well-to-wheels analysis in section 2.2.

209
Appendix G. WTW analysis in detail Pathway
name Pathway
description WTW Energy consumption
[MJ/km]
WTW GHG
emission [g-CO2,eq
/km]
Cost of CO2
avoided (oil @ 50
€/bbl) [€/tCO2]
Potential in EU-25
Biomass Feedstock
[EJ/y]
Fraction of road
fuels market
replaced [%]
Gasoline Ga-ref
PISI 2010 (reference)
2.16 164 - - -
Ga-hyb PISI hybrid
(COG1) 1.86 141 1385 - -
Diesel Di-ref
DICI 2010 + DPF
(reference) 2.05 156 - - -
Di-hyb DICI hybrid
(COD1) 1.69 129 710 - -
Ethanol (5% blend in gasoline)
Et-FW PISI 2010,
farmed wood (WFET1)
5.60 43 240 1.866 5.0
Et-WS PISI 2010,
wheat straw (STET1)
4.41 19 130 0.230 0.8
Et-W1 PISI 2010,
wheat grain, (WTET4a)
5.11 49 97 0.398 1.7
Et-W2
PISI 2010, wheat grain, NG GT+CHP, DDGS as fuel
(WTET2b)
3.91 74 126 0.398 1.7
Methanol* (5% blend in gasoline)
Me-FW PISI 2010,
farmed wood*
3.93 16 98 1.866 7.4
Me-WW PISI 2010,
waste wood* 3.93 11 57 0.471 1.9
Me-BL PISI 2010,
waste wood, black liquor*
3.02 7 -37 0.236 1.2
Me-FW-W
PISI 2010, farmed
wood+wind (ext. H2)*
3.41 9 299 1.866 18.6
DME
DME-FW
DICI 2010, farmed wood
(WFDE1) 3.56 14 171 1.866 7.6
DME-WW
DICI 2010, waste wood
(WWDE1) 3.56 10 130 0.471 1.9

210
DME-BL
DICI 2010, waste wood,
black liquor (BLDE1)
2.67 6 32 0.236 1.2
Syn-diesel SD-FW
DICI 2010 + DPF, farmed
wood (WFSD1)
3.88 15 198 1.866 4.6
Biogas Biogas
PISI, compressed,
liq. manure and org.
waste
3.67 -109 104 0.379 1.5
Hydrogen H2-FW
FC hybrid, farmed wood,
(WFCH2) 1.65 12 553 1.866 19.9
H2-Wind FC hybrid,
wind 1.54 8 704** - -
Electricity* BEV
Battery electric
vehicle (BEV), wind
0.51 0 261 - -
Table G.1. Well-to-wheel energy consumption, GHG emissions, cost of CO2 avoided and potential in the EU-25 for selected WTW pathways for a number of transportation fuels. Data from [JRC et al., 2007]. In the column “pathway description”, the power train used and the feedstock for the fuel is given, along with the pathway name (in parentheses) used in [JRC et al., 2007] - if available. The tank-to-wheel (TTW) energy consumption for a number of power trains can be seen in Table G.2. * The pathways based on methanol or electricity as fuel are not from [JRC et al., 2007], but are calculated primarily with information from [JRC et al., 2007], see Appendix H and Appendix K. ** This value has been corrected from 640 €/tCO2 by the author because of a calculation error in [JRC et al., 2007] (WTW-app. 2), see Appendix I. Energy consumption
[MJfuel/km] PISI 2002 2.24 PISI 2010 1.90 PISI (biogas) 1.88 DICI 2002 1.83 DICI 2010+DPF 1.77 DICI 2010 1.72 PISI hybrid 1.63 Reformer + FC (methanol) 1.48 DICI hybrid 1.46 FC (hydrogen) 0.94 FC hybrid (hydrogen) 0.84 Battery electric vehicle 0.42* Table G.2. The tank-to-wheel (TTW) energy consumption for a number of power trains. Data from [JRC et al., 2007]. PISI: port injection spark ignition. DICI: direct injection compression ignition. FC: fuel cell. * data from Appendix K.

211
Ethanol, methanol, DME and syn-diesel These four road fuels are all converted to mechanical energy by an ICE: Ethanol and methanol in port injection spark ignition (PISI) engines, DME and syn-diesel in more efficient direct injection compression ignition (DICI) engines. Only the pathways with methanol are not taken directly from the WTW study [JRC et al., 2007], but are calculated by the author based on information in [JRC et al., 2007]. This was done to show that even lower cost of CO2 avoidance could be achieved than the ones seen for the other three fuels. Of the four road fuels it is only DME that needs a new distribution infrastructure (refueling stations) and new and slightly more expensive vehicles. Ethanol and methanol are blended with gasoline so they can be used in existing vehicle power trains, and syn-diesel can directly substitute normal diesel. The only advantage for DME is that the DME power train (DICI 2010) does not require a diesel particulate filter (DPF), as the syn-diesel power train (DICI 2010 + DPF). This makes the DME power train slightly more efficient than the syn-diesel power train (see Table G.2). The biomass feedstocks used in the selected pathways for these four road fuels are mostly farmed wood and waste wood (in [JRC et al., 2007] wood is used as a broad term, which includes energy crops, such as perennial grasses - but not straw), but black liquor63
In the WTW study [JRC et al., 2007], there were many ethanol pathways. The ones shown in
(BL) is also considered as a feedstock because of its potential for generating low WTW energy consumptions, low GHG emissions and low costs. In the case of ethanol, two pathways involving wheat, and one pathway involving wheat straw as feedstocks, are included for comparison. This means that only the two pathways based on wheat produces “first generation” (or “conventional”) biofuels, the other pathways produce “second generation” (or “advanced”) biofuels.
Table G.1 are the ones with the lowest WTW energy consumption (Et-W2), lowest WTW GHG emission (Et-WS), lowest cost of CO2 avoidance (Et-W1) and greatest potential (ET-FW). The three DME pathways chosen from the WTW study where all the pathways involving non-fossil (biomass) feedstocks – three similar pathways for methanol was then generated by the author for comparison (the fourth methanol pathway: Me-FW-W is discussed below). For the purpose of limiting the number of pathways in this analysis, the pathways based on waste wood and black liquor were omitted for syn-diesel. Well-to-wheel energy consumption If the WTW energy consumption for the pathways involving the four road fuels are compared, it can be seen that the black liquor pathways have the lowest values (DME-BL: 2.67 MJ/km and Me-BL: 3.02 MJ/km) followed by the other two DME pathways, and
63 Black liquor is a waste product from the pulp and paper industry. Today it is combusted to generate process heat at the plants, but the boiler efficiency is limited to about 65% because of the corrosive nature of the molten salts present. In the black liquor pathway the black liquor is instead gasified and catalytically converted to a synthetic fuel, the process heat needed in the pulp and paper plants is instead generated by burning waste wood in a more efficient “hog boiler” that produces both heat and power for the plant. [JRC et al., 2007] (WTT-app. 1).

212
then the syn-diesel pathway (3.88 MJ/km). The ethanol pathway with the lowest WTW energy consumption (ET-W2: 3.91 MJ/km) matches the energy consumption of the other two methanol pathways (Me-FW, Me-WW). All of the four road fuels have higher - or much higher - WTW energy consumption than the reference diesel and gasoline pathways (Di-ref: 2.05 MJ/km, Ga-ref: 2.16 MJ/km). The main reason for the higher WTW energy consumption is the conversion process from biomass to biofuel, the energy consumption related to cultivation and transport is much lower. Well-to-wheel greenhouse gas (GHG) emissions It can be seen that the black liquor pathway that had the lowest WTW energy consumption (DME-BL) also has the lowest WTW GHG emissions. It can also be seen that all pathways involving catalytic conversion of a syngas to a biofuel (methanol, DME and syn-diesel) have low WTW GHG emissions (6-16 g-CO2,eq/km). The GHG emissions for the ethanol pathways are somewhat higher (19-74 g-CO2,eq/km) – the lowest being based on wheat straw. However, even the ethanol pathway with the highest WTW GHG emission has around half the value of the reference diesel and gasoline pathways (Di-ref: 156 g-CO2,eq /km, Ga-ref: 164 g-CO2,eq /km). The reason for the high GHG emission for some of the ethanol pathways, is the GHG emission related to cultivation (for the Et-FW pathway, the emissions from the ethanol plant are greater than the emission related to cultivation). For the methanol, DME and syn-diesel pathways the sources of GHG emissions are; wood farming and chipping and transportation of waste wood. Cost of CO2 avoided When comparing CO2 avoidance cost at an oil price of 50 €/bbl, the lowest value is again achieved by a black liquor pathway, but this time it is the methanol pathway (Me-BL: -37 €/tCO2). This pathway has a negative avoidance cost, which means that both GHG emissions and total cost could be reduced by replacing some of the gasoline used as road fuels with methanol from the Me-BL pathway. At an oil price of 37 €/bbl ($41/bbl) the avoidance cost for the Me-BL pathway would be 0 €/tCO2. The other black liquor pathway (DME-BL) has the second lowest cost of 32 €/tCO2. The difference in cost between these black liquor pathways is due to the new distribution infrastructure needed for DME (refueling stations) and the more expensive DME vehicles (14% more expensive than the reference gasoline vehicle). The third lowest cost is achieved by the methanol pathway based on waste wood (57 €/tCO2), and then comes the ethanol pathway based on wheat (ET-W1) with 97 €/tCO2 and the methanol pathway based on farmed wood (Me-FW) with 98 €/tCO2. If the pathways based on farmed wood (the feedstock with the greatest potential in the EU-25) are compared, it can be seen that after the methanol pathway (Me-FW) at 98 €/tCO2 the order is DME (171 €/tCO2), syn-diesel64
64 The high CO2 avoidance cost is due to a high production cost of syn-diesel. The cost of syn-diesel in the SD-FW pathway is 27.4 €/GJ-fuel [JRC et al., 2007] (WTW-app. 2, page 10) or 45% higher than the cost of methanol in the Me-FW pathway and 38% higher than DME in the DME-FW pathway. Literature, such as [Larson et al., 2009-1] suggests the cost of syn-diesel to be lower, but still higher than methanol and DME.
(198 €/tCO2) and ethanol (240 €/tCO2).

213
The avoidance cost of 240 €/tCO2 is the highest among the pathways for the four road fuels. Biomass feedstock potential As mentioned in the paragraph above, farmed wood is the feedstock with the greatest potential in the EU-25 (1.866 EJ-feedstock/y) and the feedstock with the second greatest potential is waste wood (0.471 EJ-feedstock/y). The black liquor pathways uses waste wood as feedstock, but it is estimated that only half of the potential waste wood can be used in the black liquor pathways (0.236 EJ-feedstock/y). The potential for wheat and wheat straw65
are among the lowest, 0.398 EJ-feedstock/y and 0.23 EJ-feedstock/y respectively.
Road fuel potential If instead of comparing biomass feedstock potentials, the potentials for replacing diesel and gasoline as road fuels are compared, it can be seen that there are great differences in how effectively the different pathways can convert the biomass feedstock into biofuels (Figure 2.4). By comparing all the pathways using farmed wood, it can be seen that the DME pathway (DME-FW) can replace 7.6% of the road fuels market (gasoline and diesel), and then follows methanol (7.4%), ethanol (5%) and syn-diesel (4.6%)66. The potential for other pathways are low (0.8%-1.9%). In the WTW study [JRC et al., 2007], the fuels are also compared in “max potential” scenarios. These scenarios add the potential of the individual pathways to show what the total potential of a certain fuel is. The “max DME” scenario shows to be able to replace 10.7% of the road fuels market in the EU-25, while the values for the “max syn-diesel” and the “max ethanol”67
66 scenarios
are 6.8% and 7.1% respectively. The “max conventional biofuels” scenario (ethanol68
and bio-diesel) has a potential of 4.2%.
Biogas When biogas is used as a road fuel it is compressed and used in an ICE similar to the ones used for compressed natural gas (CNG). The WTW energy consumption for the biogas pathway (3.67 MJ/km) is much higher than the WTW energy consumption for the reference gasoline pathway (2.16 MJ/km), but similar to the DME-FW pathway (3.56 MJ/km). This is due to the production processes of biogas since the power train
65 The amount of unused straw in the EU-25 is 0.82 EJ/a, but if transport cost are considered, the potential is reduced to 0.23 EJ/a. 66 The syn-diesel potential is this low because naptha is co-produced in the process. By recycling the naptha in the production plant a higher syn-diesel output could be achieved, but it is more efficient to use the naptha as a chemical feedstock to replace fossil based naptha [JRC et al., 2007] (WTW report). To give a more fair picture of syn-diesel, the reference [JRC et al., 2007] (WTW report) states that a “max DME” scenario would save 110 Mt-CO2/a while the “max syn-diesel” scenario would save 90 Mt-CO2/a. 67 The “max ethanol” scenario is almost only based on cellulosic feedstock such as wood, making this biofuel “advanced” or “second generation”. 68 Imported ethanol produced from sugar cane in e.g. Brazil has great potential to replace fossil fuels for road transport. This kind of ethanol can be produced at a low cost with low GHG emissions. It however still has a high WTW energy consumption [JRC et al., 2007] (WTW report).
214
efficiency is slightly more efficient (1.88 MJ/km) than the reference PISI 2010 power train (1.90 MJ/km) used for gasoline (Table G.2). The WTW GHG emission of the biogas pathway (-109 g-CO2,eq/km) is the lowest among all the pathways investigated in[JRC et al., 2007]. This is because biogas produced from liquid manure (80%) and org. waste (20%) generates great GHG emission savings because the alternative use of liquid manure is spreading it as fertilizer on fields, and this use results in GHG emissions from the fields (methane). If the WTW GHG emission is compared to e.g. the WTW GHG emission of the syn-diesel pathway based on farmed wood (SD-FW), it can be seen that almost twice as much CO2,eq is saved per km by switching from gasoline (164 g-CO2,eq/km) to biogas (-109 g-CO2,eq/km) than from gasoline to SD-FW (15 g-CO2,eq/km). This low WTW GHG emission for biogas makes the cost of CO2 avoided (104 €/tCO2) on the same level as the methanol Me-FW pathway (102 €/tCO2), which is a low or moderate cost compared to the other pathways. However, the cost of replacing a certain amount of gasoline/diesel with biogas is relatively high; 15.2 € per GJ of gasoline/diesel replaced. This is on the same level as syn-diesel from the SD-FW pathway (15.2 € per GJ of diesel replaced) but the SD-FW cost of CO2 avoided is 198 €/tCO2. The potential of biogas from liquid manure and organic waste used for transportation is relatively small, only 1.5% of the road fuels market in the EU-25 can be replaced. However the potential for using biogas for CHP applications is much higher, since smaller biogas plants then become economical [JRC et al., 2007] (WTW report). Electricity and hydrogen As was the case with the methanol pathways, the electricity pathway or battery electric vehicle (BEV) pathway is not from the WTW study, but was calculated by the author based on information from the WTW study [JRC et al., 2007] and other sources. The calculations for the BEV pathway can be found in Appendix K. The electricity and hydrogen pathways are the only alternative fuel pathways with lower WTW energy consumption than the reference diesel and gasoline pathways (Figure 2.2). This is mostly due to the very energy efficient vehicle power trains used; 0.42 MJ/km for the BEV, and 0.84 MJ/km for the fuel cell hybrid vehicle. This can be compared to the reference PISI 2010 power train: 1.90 MJ /km (Table G.2). The WTW GHG emissions for the electricity and hydrogen pathways are very low (0-12 g-CO2,eq/km), but the cost of CO2 avoided is very high (261-704 €/tCO2). The high cost is mostly due to the higher vehicle cost compared to the reference gasoline vehicle. In the case of the BEV pathway, it is only the higher vehicle cost, which causes the high CO2 avoidance cost, since the cost of electricity from wind turbines + a new distribution infrastructure (charging stations), matches the cost saved on diesel/gasoline at an oil price of 50 €/bbl (Appendix K). Even though electricity generated by wind turbines is about twice as expensive as gasoline/diesel (per energy unit), the cost of electricity per km is around half the reference cost of gasoline/diesel per km because of the much more energy efficient BEV power train. The BEV is estimated to cost 28,637 € (46% more than the reference gasoline vehicle, see Appendix K) and the FC hybrid vehicle; 34,505 € (76% more than the reference

215
gasoline vehicle) [JRC et al., 2007] (TTW-app. 1). However, the range of the BEV has been reduced from the standard value of 600 km (used for all other vehicles in this analysis) to 200 km, in order to reduce li-ion battery cost. Methanol from biomass + electrolytic hydrogen A way to increase the potential of methanol (or DME or syn-diesel) to replace gasoline and diesel is by supplying external hydrogen to the biomass to liquid (BTL) plants. By doing this, all the carbon stored in the biomass can be converted to liquid fuel69
7.2.3.2
, and therefore more liquid fuel is produced per unit biomass. The external hydrogen needed could be supplied by electrolysis of water based on surplus electricity from fluctuating power sources such as wind and solar. The pathway Me-FW-W is a methanol pathway similar to the Me-FW pathway, but wind power is used to generate hydrogen for the BTL plant. Compared to the Me-FW pathway, the Me-FW-W pathway has a slightly lower well-to-wheel energy consumption, which is due to a relatively inefficient methanol production in the Me-FW pathway (in section , the relationship between the plant energy efficiencies are opposite). The WTW GHG emissions are also lower than the value for the Me-FW pathway because no WTW GHG emissions occur when producing hydrogen from wind power. The cost of CO2 avoided is however much higher for this pathway compared to the Me-FW pathway because of high electricity costs when using wind power to produce electrolytic hydrogen. The cost of wind power is assumed to be 73 €/MWh (545 DKK/MWh) [JRC et al., 2007] (WTW-app. 2), but if only surplus electricity from wind turbines is used, the cost of electricity could instead be 0-27 €/MWh (0-200 DKK/MWh). If a cost of 13 €/MWh (100 DKK/MWh) is assumed, the cost of CO2 avoided would be lowered from 299 €/ton to 107 €/ton - only a bit more than the 98 €/ton for the Me-FW pathway. As mentioned in the beginning of this paragraph, the fuel potential is increased compared to the Me-FW pathway (18.6% of the road fuels market can be replaced compared to 7.4%). This potential is the second highest - almost as high as the H2-FW pathway (19.9%). The WTW energy consumption is however more than double that of the H2-FW pathway, but the cost of CO2 avoided is much lower. Costs for society of emissions It could be very interesting and relevant to add costs for society of emissions such as NOx, SOx and particles to the WTW study, but these costs are very difficult to assess and depends on where the substances are emitted70
69 The carbon/hydrogen ratio is larger for the biomass than the liquid fuel, so by supplying external hydrogen, all the carbon in the biomass can be utilized (see more details about BTL with external hydrogen in chapter
. If costs of emissions where included in the study, it would be relevant to compare these extra costs with costs for exhaust gas cleaning - especially for NOx (exhaust gas cleaning for particles is assumed in the study).
7). 70 The cost for society of emissions in cities are higher than on the countryside. In [DMT, 2010] the cost of emissions of fine particles (PM2.5) is estimated to be 224-10577 DKK/kg in the city and 31-1475 DKK/kg in the countryside. The cost of emissions of NOx is however not that influenced by where the emissions occur: 4-366 DKK/kg in the city and 0-336 DKK/kg in the countryside.

216
In [DEA, 2008], the costs for society of emissions have been integrated in a WTW study for Denmark. However, CO2 is also included in this category and the uncertainty of the costs of emissions for society was not shown. If the estimated emissions of NOx, SOx and particles for gasoline and diesel WTW pathways provided in [DEA, 2008] for the year 2025 are converted to a cost pr km by using costs of emissions from [DMT, 2010], the cost become 0.0003-0.029 DKK/km for gasoline and 0.001-0.106 DKK/km for diesel71. For comparison the reference cost in this WTW study can be calculated to be 1.01 DKK/km for gasoline and 0.75 DKK/km for diesel72
. If the emission costs were included in this study, it would have different impacts on the examined pathways, since some of the pathways have no WTW emissions of NOx, SOx and particles (BEV and the hydrogen pathways), while the rest of the pathways have reduced WTW emissions compared to the reference gasoline and diesel pathways. For the BEV pathway the emission costs translates to a reduction in cost of CO2 avoided from 261 €/tonCO2 to 213-260 €/tonCO2.
71 Almost all of the cost is due to NOx emissions. The WTW NOx emissions are 0.22 g/km for diesel and 0.07 g/km for gasoline. 72 The costs are made up of fuel and vehicle costs. Around 80% of the costs are vehicle costs.

217
Appendix H. Methanol pathways: Me-FW, Me-WW, Me-BL and Me-FW-W
WTW Energy consumption Me-FW Me-WW Me-BL Me-FW-W Pathway name in [WTT_app 2] WFME1 WWME1 BLME1 - WTT energy consumption [MJextra/MJfuel] 1.07 1.07 0.59 0.79 WTT energy consumption [MJ/MJfuel] 2.07 2.07 1.59 1.79 TTW energy consumption [MJfuel/km] 1.90 1.90 1.90 1.90 WTW energy consumption [MJ/km] 3.93 3.93 3.02 3.41 The well-to-tank (WTT) energy consumption for the methanol pathways can be found In [JRC et al., 2007] (WTT-app. 2) - for ME-FW-W see Appendix J. The TTW energy consumption is given in Table G.2 (standard PISI 2010). By multiplying the WTT energy consumption with the TTW energy consumption you get the WTW energy consumption. WTW GHG emission Me-FW Me-WW Me-BL Me-FW-W Pathway name in [WTT_app 2] WFME1 WWME1 BLME1 - WTT GHG emission (before credit) [gCO2/MJfuel] 7.2 4.7 2.4 3.5 Credit for renewable combustion CO2 [gCO2/MJfuel] -69.1 -69.1 -69.1 -69.1 WTT GHG emission [gCO2/MJfuel] -61.9 -64.4 -66.7 -65.6 TTW GHG emission [gCO2/MJfuel] 70.3* 70.3* 70.3* 70.3* WTW GHG emission [gCO2/MJfuel] 8.4 5.9 3.6 4.7 TTW energy consumption [MJfuel/km] 1.90 1.90 1.90 1.90 WTW GHG emission [gCO2/km] 16 11 7 9 In [JRC et al., 2007] (WTT-app. 2) the well-to-tank (WTT) GHG emission can be found (for ME-FW-W see Appendix J). By estimating the TTW GHG emission (see *), the WTW GHG emission can be calculated (gCO2/MJfuel). From the table above we have the TTW energy consumption and from this we can calculate the WTW GHG emission per km. * this is higher than the amount of CO2 that is released when combusting 1 MJ of methanol (69.1 g CO2/MJ) because of emissions of other GHG gasses (CH4 and N2O) during ICE combustion. The value is estimated based on the non-CO2 GHG emission from combustion of DME [JRC et al., 2007] (TTW report and WTW-app. 1).

218
Cost of CO2 avoided (oil @ 50 €/bbl) Me-FW Me-WW Me-BL Me-FW-W Specific cost of methanol from plant [€/GJ] 18.9 15.8 8.2 35.7 Distribution and retail cost [€/GJ] (same as ethanol-blend in gasoline)
1 1 1 1
Total specific cost of methanol [€/GJ] 19.9 16.8 9.2 36.7 Amount of methanol [PJ/y] 200 200 200 200 Methanol cost (alternative fuel) [M€/y] 3980 3360 1840 7342 Conventional fuel (saving) [M€/y] -2448 -2448 -2448 -2448 WTT cost [M€/y] 1532 912 -608 4894 WTW cost (net total cost) 1532 912 -608 4894 Distance covered [Tm/y] 105 105 105 105 WTW GHG emission [Mt/y] 1.7 1.2 0.7 1.0 Base GHG emission [Mt/y] 17.3 17.3 17.3 17.3 GHG savings [Mt/y] 15.6 16.1 16.6 16.3 Cost of CO2 avoided [€/ton] 98 57 -37 299 The method of calculating cost of CO2 avoided is the same as in [JRC et al., 2007] (WTW-app. 2) (look at 8.2 Bio-fuels: ethanol blend). In [JRC et al., 2007] (WTW-app. 2) the “Specific cost of methanol from plant” and the “distribution and retail cost” can be found (for ME-FW-W the “Specific cost of methanol from plant” is calculated in Appendix I). The WTW GHG emission per year is calculated based on the WTW GHG emission per km (table above) and the distance covered per year. Fraction of road fuels market replaced Me-FW Me-WW Me-BL Me-FW-W Feedstock potential [EJ/y] 1.866 0.471 0.236 1.866 Conversion efficiencies [%] 51 51 66 128* Methanol potential [EJ/y] 952 240 156 2284 Fossil fuels replaced [EJ/y] 952 240 156 2284 Fraction of road fuels market replaced [%]** 7.4 1.9 1.2 17.9 In [JRC et al., 2007] (WTT-app. 1, page 60 and 65) the conversion efficiencies for the pathways can be found (for ME-FW-W see *). In [JRC et al., 2007] they assume that methanol replaces gasoline in an energy ratio of 1:1. * 128% is a methanol / biomass energy ratio. The actual conversion efficiency when electricity for electrolysis is accounted for is 58% (see Appendix I). ** the EU-25 road fuels market is 12.78 EJ/y (based on table 8.6.2-2 in the WTW report [JRC et al., 2007]).

219
Appendix I. Methanol pathway Me-FW-W: Cost of methanol
Cost of methanol (Me-FW for comparison) Me-FW Me-FW-W Biomass input [PJ/y] 5.8 5.8 Hydrogen input [PJ/y] - 4.5* Electricity production [PJ/y] - 7.1** Methanol output [PJ/y] 2.9 7.4*** Efficiency [%] 51 58 Capex [M€] 165 250# Capital charge (12%) [M€/y] 19.8 30.0 Opex (6%) [M€/y] 9.9 15.0 Biomass cost [€/GJ] 4.5 4.5 Biomass cost [M€/y] 25.9 25.9 Hydrogen cost [€/GJ] - 43.3## Hydrogen cost [M€/y] 193 Total cost [M€/y] 55.6 264 Cost of methanol [€/GJ] 18.9 35.7 Data from [JRC et al., 2007] (WTW-app. 2). *The hydrogen input is calculated based on the results from section 7.2 (2302 MWth torrefied biomass, 1775 MWth hydrogen, torrefaction is assumed to be done on site). ** Calculated based on the table below about electrolysis (a downscaling of the electrolysis plant described below): 7.1=4.5/(5.8/9.2). *** The methanol output is calculated based on the results from section 7.2 (2302 MWth torrefied biomass, 2938 MWth methanol). # High estimate (only the methanol reactor and the separation / distillation part needs to be enlarged compared to the reference Me-FW – the water-gas shift reactor used in Me-FW is not used in Me-FW-W). ## Hydrogen cost from table below about electrolysis. Electrolyser (oil @ 50 €/bbl) Electricity consumption [PJ/y] 8.9 Hydrogen production [PJ/y] 5.8 Efficiency [%] 65 Capex [M€] 110 Capital charge (12%) [M€/y] 13.2 Opex [M€/y] 3.3 Cost of electricity from wind turbines (oil @ 50 €/bbl) [€/GJ] 20.2 Electricity production [PJ/y] 9.2* Cost of electricity from wind turbines (oil @ 50 €/bbl) [M€/y] 185.2 Cost of electricity distribution [€/GJconsumed] 5.6 Cost of electricity distribution [M€/y] 49.2 Total cost of electricity [M€/y] 234.4 Total cost [M€/y] 250.9 Total cost of hydrogen [€/GJ] 43.3 Data from [JRC et al., 2007] (WTW-app. 2). The cost of hydrogen from electrolysis calculated here is higher than in [JRC et al., 2007]. It is believed to be because of a general error for all “Hydrogen from electrolysis” pathways in [JRC et al., 2007] (WTW-app. 2). The cost of hydrogen in [JRC et al., 2007] (WTW-app. 2, chapter 8.11 “Hydrogen from electrolysis - FC hybrid”, wind, central electrolysis, pipeline) can be calculated to be: (5368 M€/y) / (157 PJ/y) = 34.2 €/GJ. This is including distribution costs of 2.7 €/GJ. Based on data from the table above, the actual cost of hydrogen is: 43.3+2.7 = 46.0 €/GJ.

220
How the hydrogen production is affected by the intermittent nature of wind energy is not dealt with in the WTW study [JRC et al., 2007]. In paper I, this is solved by using underground hydrogen storage (hydrogen is only produced when cheap electricity is available, but the hydrogen storage ensures the supply of hydrogen to the methanol plant, so that it can operate 8000 h/y). The cost of the underground hydrogen storage is small and the increase in the total capex due to a larger electrolysis plant is also small, which is why these costs are not considered here. * The difference in electricity production and consumption is due to a 3% loss in transmission [JRC et al., 2007] (WTT-app. 2, page 27, written as 0.03 MJextra/MJfuel).

221
Appendix J. Methanol pathway Me-FW-W: WTT Energy consumption and GHG emission
WTT Energy consumption and GHG emission (Me-FW for comparison) Me-FW Me-FW-W Me-FW Me-FW-W
WTT Energy
[MJextra/MJfuel] WTT Energy
[MJextra/MJfuel] WTT GHG
[g CO2-eq/MJfuel] WTT GHG
[g CO2-eq/MJfuel] Wood farming and chipping 0.08 0.03* 5.2 2.1* Road transport 0.01 0.004* 0.7 0.3* Gasifier + MeOH synthesis (+electrolysis + electricity distribution)
0.96 0.74** 0.2 0.1*
Methanol distribution & dispensing 0.02
0.02 1.1
1.1
Total 1.07 0.79 7.2 3.5 Data for Me-FW from [JRC et al., 2007] (WTT-app. 2). * calculated based on the values for Me-FW, e.g. 0.03 = 0.08*0.51/1.28, where 0.51 is the methanol / biomass energy ratio for Me-FW, and 1.28 is the methanol / biomass energy ratio for Me-FW-W (Table 7.3). ** calculated based on the energy efficiency of 58% for the Me-FW-W (Appendix I): 0.74 = 1/0.58-1.
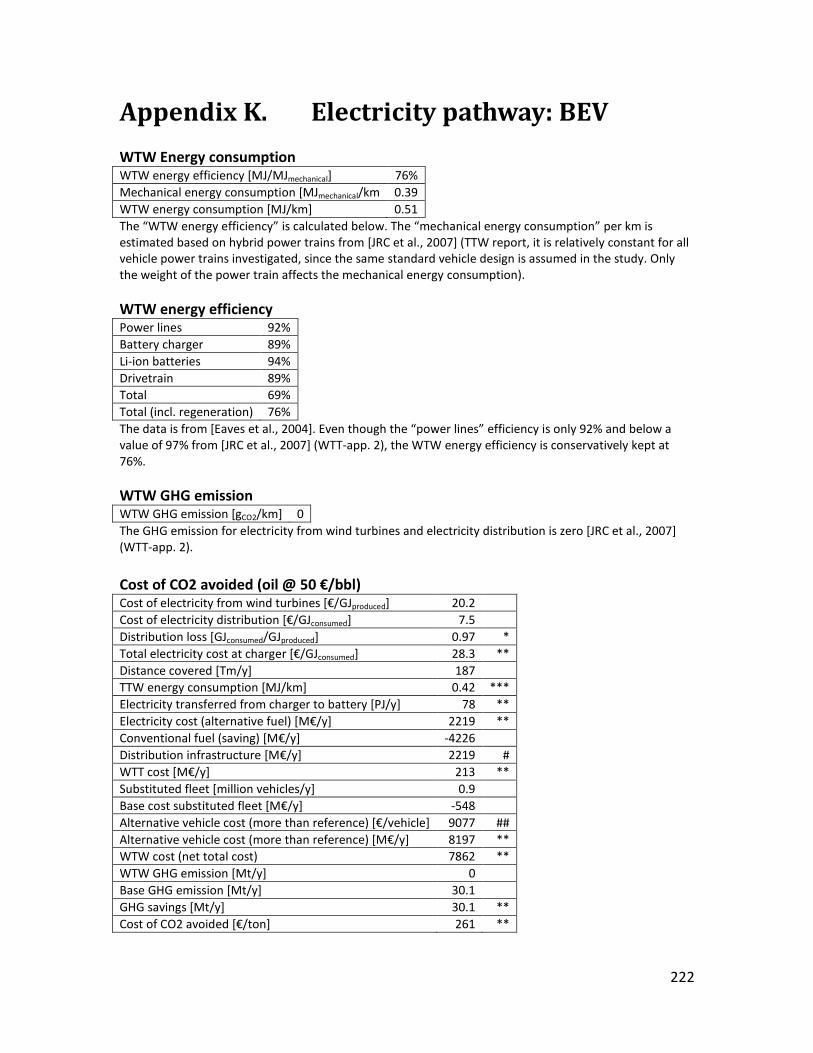
222
Appendix K. Electricity pathway: BEV WTW Energy consumption WTW energy efficiency [MJ/MJmechanical] 76% Mechanical energy consumption [MJmechanical/km 0.39 WTW energy consumption [MJ/km] 0.51 The “WTW energy efficiency” is calculated below. The “mechanical energy consumption” per km is estimated based on hybrid power trains from [JRC et al., 2007] (TTW report, it is relatively constant for all vehicle power trains investigated, since the same standard vehicle design is assumed in the study. Only the weight of the power train affects the mechanical energy consumption). WTW energy efficiency Power lines 92% Battery charger 89% Li-ion batteries 94% Drivetrain 89% Total 69% Total (incl. regeneration) 76% The data is from [Eaves et al., 2004]. Even though the “power lines” efficiency is only 92% and below a value of 97% from [JRC et al., 2007] (WTT-app. 2), the WTW energy efficiency is conservatively kept at 76%. WTW GHG emission WTW GHG emission [gCO2/km] 0 The GHG emission for electricity from wind turbines and electricity distribution is zero [JRC et al., 2007] (WTT-app. 2). Cost of CO2 avoided (oil @ 50 €/bbl) Cost of electricity from wind turbines [€/GJproduced] 20.2 Cost of electricity distribution [€/GJconsumed] 7.5 Distribution loss [GJconsumed/GJproduced] 0.97 * Total electricity cost at charger [€/GJconsumed] 28.3 ** Distance covered [Tm/y] 187 TTW energy consumption [MJ/km] 0.42 *** Electricity transferred from charger to battery [PJ/y] 78 ** Electricity cost (alternative fuel) [M€/y] 2219 ** Conventional fuel (saving) [M€/y] -4226 Distribution infrastructure [M€/y] 2219 # WTT cost [M€/y] 213 ** Substituted fleet [million vehicles/y] 0.9 Base cost substituted fleet [M€/y] -548 Alternative vehicle cost (more than reference) [€/vehicle] 9077 ## Alternative vehicle cost (more than reference) [M€/y] 8197 ** WTW cost (net total cost) 7862 ** WTW GHG emission [Mt/y] 0 Base GHG emission [Mt/y] 30.1 GHG savings [Mt/y] 30.1 ** Cost of CO2 avoided [€/ton] 261 **
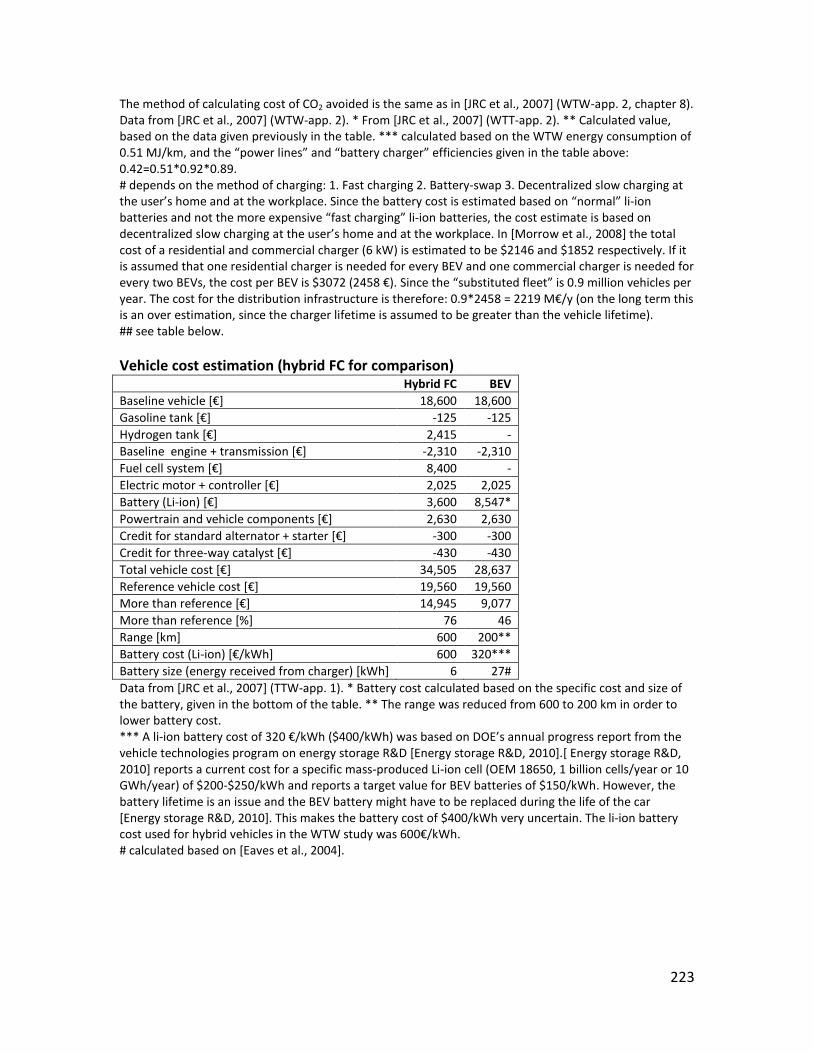
223
The method of calculating cost of CO2 avoided is the same as in [JRC et al., 2007] (WTW-app. 2, chapter 8). Data from [JRC et al., 2007] (WTW-app. 2). * From [JRC et al., 2007] (WTT-app. 2). ** Calculated value, based on the data given previously in the table. *** calculated based on the WTW energy consumption of 0.51 MJ/km, and the “power lines” and “battery charger” efficiencies given in the table above: 0.42=0.51*0.92*0.89. # depends on the method of charging: 1. Fast charging 2. Battery-swap 3. Decentralized slow charging at the user’s home and at the workplace. Since the battery cost is estimated based on “normal” li-ion batteries and not the more expensive “fast charging” li-ion batteries, the cost estimate is based on decentralized slow charging at the user’s home and at the workplace. In [Morrow et al., 2008] the total cost of a residential and commercial charger (6 kW) is estimated to be $2146 and $1852 respectively. If it is assumed that one residential charger is needed for every BEV and one commercial charger is needed for every two BEVs, the cost per BEV is $3072 (2458 €). Since the “substituted fleet” is 0.9 million vehicles per year. The cost for the distribution infrastructure is therefore: 0.9*2458 = 2219 M€/y (on the long term this is an over estimation, since the charger lifetime is assumed to be greater than the vehicle lifetime). ## see table below. Vehicle cost estimation (hybrid FC for comparison) Hybrid FC BEV Baseline vehicle [€] 18,600 18,600 Gasoline tank [€] -125 -125 Hydrogen tank [€] 2,415 - Baseline engine + transmission [€] -2,310 -2,310 Fuel cell system [€] 8,400 - Electric motor + controller [€] 2,025 2,025 Battery (Li-ion) [€] 3,600 8,547* Powertrain and vehicle components [€] 2,630 2,630 Credit for standard alternator + starter [€] -300 -300 Credit for three-way catalyst [€] -430 -430 Total vehicle cost [€] 34,505 28,637 Reference vehicle cost [€] 19,560 19,560 More than reference [€] 14,945 9,077 More than reference [%] 76 46 Range [km] 600 200** Battery cost (Li-ion) [€/kWh] 600 320*** Battery size (energy received from charger) [kWh] 6 27# Data from [JRC et al., 2007] (TTW-app. 1). * Battery cost calculated based on the specific cost and size of the battery, given in the bottom of the table. ** The range was reduced from 600 to 200 km in order to lower battery cost. *** A li-ion battery cost of 320 €/kWh ($400/kWh) was based on DOE’s annual progress report from the vehicle technologies program on energy storage R&D [Energy storage R&D, 2010].[ Energy storage R&D, 2010] reports a current cost for a specific mass-produced Li-ion cell (OEM 18650, 1 billion cells/year or 10 GWh/year) of $200-$250/kWh and reports a target value for BEV batteries of $150/kWh. However, the battery lifetime is an issue and the BEV battery might have to be replaced during the life of the car [Energy storage R&D, 2010]. This makes the battery cost of $400/kWh very uncertain. The li-ion battery cost used for hybrid vehicles in the WTW study was 600€/kWh. # calculated based on [Eaves et al., 2004].

224
Appendix L. Basic gasifier types Updraft gasifier An updraft fixed bed gasifier, or a counter-current fixed bed gasifier, is a gasifier where the solid fuel and the gasification media flows in counter-current (Figure L.1). The solid fuel is added in the top of the gasifier, while the gasification media is supplied in the bottom of the gasifier. The gasification media is typically air or oxygen, but could also be steam or CO2 (or a mix of these four gasses). If the gasification media is air or oxygen, there will be a combustion zone in the bottom of the gasifier (Figure L.1), where oxidation reactions will dominate (eq. 1). Above the combustion zone, the gasification reactions occur in the reduction zone (eqs. 2 and 3). If the gasification media is steam or CO2, the reduction zone would extend all the way to the bottom of the gasifier. But since the gasification processes are endothermic, heat will have to be supplied, either by heating the steam or CO2 prior to the gasifier or by external means. Above the reduction zone, pyrolysis of the solid fuel will take place. In the pyrolysis zone the solid fuel is converted to a volatile gas and solid coke (see e.g. footnote 12), the volatile gas will follow the gas stream upwards, while the coke will continue downwards until it is converted to gas in the reduction or combustion zone. Above the pyrolysis zone eventual moisture in the solid fuel is removed in the drying zone. The gas from an updraft gasifier will contain much water vapor and higher hydrocarbons (including tars) because the pyrolysis and drying zones are placed just before the gas exit.
Figure L.1. An updraft gasifier [GEK, 2010]. The solid fuel is added to the gasifier at the top. Downdraft gasifier A downdraft fixed bed gasifier, or a co-current fixed bed gasifier, is a gasifier where the solid fuel and the gasification media flows in co-current (Figure L.2). The solid fuel is added in the top of the gasifier, while the gasification media is supplied in the middle of
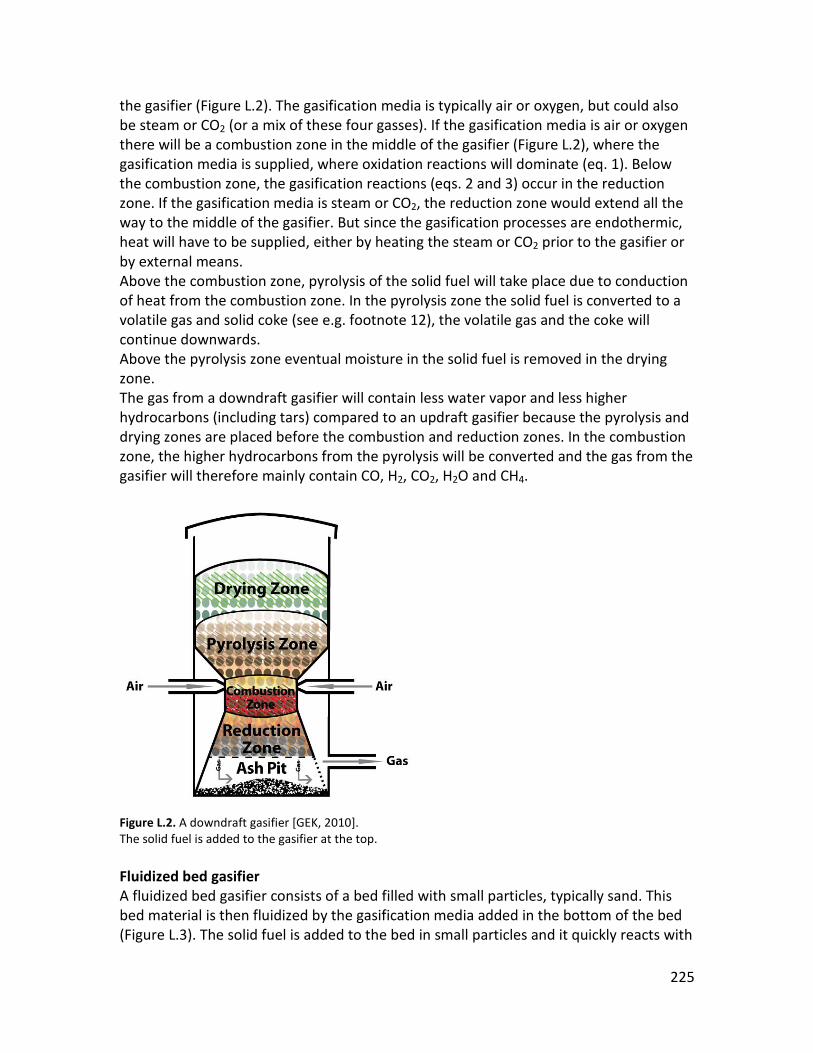
225
the gasifier (Figure L.2). The gasification media is typically air or oxygen, but could also be steam or CO2 (or a mix of these four gasses). If the gasification media is air or oxygen there will be a combustion zone in the middle of the gasifier (Figure L.2), where the gasification media is supplied, where oxidation reactions will dominate (eq. 1). Below the combustion zone, the gasification reactions (eqs. 2 and 3) occur in the reduction zone. If the gasification media is steam or CO2, the reduction zone would extend all the way to the middle of the gasifier. But since the gasification processes are endothermic, heat will have to be supplied, either by heating the steam or CO2 prior to the gasifier or by external means. Above the combustion zone, pyrolysis of the solid fuel will take place due to conduction of heat from the combustion zone. In the pyrolysis zone the solid fuel is converted to a volatile gas and solid coke (see e.g. footnote 12), the volatile gas and the coke will continue downwards. Above the pyrolysis zone eventual moisture in the solid fuel is removed in the drying zone. The gas from a downdraft gasifier will contain less water vapor and less higher hydrocarbons (including tars) compared to an updraft gasifier because the pyrolysis and drying zones are placed before the combustion and reduction zones. In the combustion zone, the higher hydrocarbons from the pyrolysis will be converted and the gas from the gasifier will therefore mainly contain CO, H2, CO2, H2O and CH4.
Figure L.2. A downdraft gasifier [GEK, 2010]. The solid fuel is added to the gasifier at the top. Fluidized bed gasifier A fluidized bed gasifier consists of a bed filled with small particles, typically sand. This bed material is then fluidized by the gasification media added in the bottom of the bed (Figure L.3). The solid fuel is added to the bed in small particles and it quickly reacts with

226
the gasification media because of the extremely good heat conduction and mixing in a fluidized bed. Unlike the fixed bed gasifiers described above, a fluidized bed gasifier cannot be split into zones (combustion, reduction pyrolysis, drying) because everything is mixed in a fluidized bed, which is why combustion, reduction, pyrolysis and drying occurs all over the bed. Different types of fluidized beds exist: in Figure L.3, a circulating fluidized bed is shown and in Figure 2.6 a bubbling fluidized bed can be seen. In a circulating fluidized bed the gasification media (or fluidizing media) is supplied with such a high velocity that the bed material travels with the solid fuel particles and therefore has to be captured in a cyclone and then recirculated to the bed. In a bubbling fluidized bed, the gasification media is supplied with a lower velocity, but the velocity is high enough to keep the bed fluidized. In a bubbling fluidized bed only small amounts of bed material will follow the gas stream, but a cyclone is still needed to recycle this part back to the bed. Because of the good mixing in a fluidized bed gasifier most of the higher hydrocarbons (including tars) released in the bed will be converted to CO, H2, CO2, H2O and CH4, but the content of higher hydrocarbons (including tars) will typically be higher than with the downdraft gasifier but lower than the updraft gasifier. This type of gasifier is more compact than the fixed bed gasifiers described above because of the high reaction rates in the gasifier induced by the fluidization (high heat conduction and good mixing).
Figure L.3. A fluidized bed gasifier. This type is a circulating fluidized bed gasifier because the bed material follows the gas to the cyclone, from where it is re-circulated to the bed. Modified from [ENVIROTHERM, 2010].
Gas
Cyclone
Air
Solid fuel
Ash
Grate
Gas

227
Entrained flow gasifier An entrained flow gasifier is very different from the gasifier types described above because an entrained flow gasifier resembles a burner, such as a gas burner (Figure L.4). In an entrained flow gasifier the solid fuel is supplied in very small particles so that the fuel particles can be entrained in a gas (or liquid), typically an inert gas such as N2 or CO2. The gas/particle mixture is then supplied to a burner, where the mixture is gasified by the gasification media, which typically is oxygen and some steam (but can also be air). The temperature after the burner is 1200-1600°C. Before the gas leaves the gasifier, the gas is quenched, which means that the gas is cooled quickly, typically by water or cold gas injection (water quench in Figure L.4). Because of the high temperatures in the gasifier the gas only contains (oxygen-blown): CO, H2, CO2, H2O and traces of CH4 and impurities from the solid fuel. The high temperature also melts the ash contained in the solid fuel. This liquid ash, called slag, is then solidified in the bottom of the gasifier. This type of gasifier is very compact (more than the other gasifier types described above) because of the high reaction rates in the gasifier induced by the high temperature.
Figure L.4. An entrained flow gasifier (modified from [NETL, 2010]). This particular illustration is for a Siemens GSP gasifier.

228
Comparison of the gasifier types In Table L.1, the main gasifier types are compared based on a number of key parameters. It can be seen that the outlet temperature varies a lot from type to type, but is lowest in the case of the updraft gasifier. This is because this type of gasifier is a counter-current gasifier, where the hot gas generated in the combustion zone is cooled in the reduction, pyrolysis and drying zone before leaving the gasifier. If the fuel supplied to an updraft gasifier is very moist the outlet temperature can be very low. The outlet temperature from the gasifier also tells something about the cold gas efficiency of the gasifier. It can be seen from Table L.1 that the gasifier with the lowest outlet temperature also has the best cold gas efficiency. Since the cold gas efficiency is defined as the chemical energy flow in the gas, divided by the chemical energy flow in the solid fuel (eq. 6), a low cold gas efficiency means that a lot of chemical energy has been converted to thermal energy (high temperature). Because of this, a low cold gas efficiency also means a high oxidant demand, which corresponds with what can be seen from Table L.1. All the different gasifier types can be pressurized, which typically is an advantage because it increases the throughput of the gasifier. It is also an advantage if the gas from the gasifier is used in a gas turbine or for synthesis of chemicals such as DME and methanol because it requires more energy to pressurize the gas from the gasifier than the feed to the gasifier. It is however complicated to pressurize a solid feed for a gasifier. The most common technology used to pressurize a solid feed is by lock hoppers, but because lock hoppers use an inert gas, typically N2 or CO2, to pressurize the solid, and that this gas consumption increases with the pressure (because of the density reduction of the gas), it will not be economical to pressurize the gasifier to more than about 45 bar (45 bar is in the case of entrained flow gasifiers) [van der Ploeg et al., 2004]. As seen in Table L.1 it is however possible to achieve higher pressures in entrained flow gasifiers (~80 bar). This is achieved by mixing the solid fuel particles with a liquid (typically water) to form a pumpable slurry. Since the energy consumption associated with pressurizing a liquid is much less, than the energy consumption associated with pressurizing a gas, it can be economical to increase the pressure up to (~80 bar).
Fixed bed (updraft)
Fixed bed (downdraft)
Fluidized bed Entrained flow
Outlet temperature 200-600°C 800-1000°C 900-1050°C 1200-1600°C*
Oxidant Air / oxygen Air / oxygen Air / oxygen Air** / oxygen
Oxidant demand Low Moderate Moderate High

229
Size of feed (coal) 6-50 mm 6-50 mm 6-10 mm < 0.1 mm
Hydrocarbons (tar, methane, …)
Yes, a lot Yes, some*** Yes, some*** Trace
Pressure 1-30 bar 1-30 bar 1-30 bar 1-80 bar
Cold gas efficiency ~ 90 % (LHV) ~ 85 % (LHV) ~ 85 % (LHV) ~ 80 % (LHV)
Commercial scale (coal)#
Up to ~ 200 MWth
Up to ~ 200 MWth
Up to ~ 500 MWth
Up to ~ 1.4 GWth
Table L.1. A comparison of the three main gasifier types (the fixed bed gasifier is split into: updraft and downdraft). Modified from [Maurstad, 2005]. * Temperature before quench. ** In commercial entrained flow gasifiers oxygen is used. *** Depends on gasifier design (e.g. 2-stage gasification). # These values are based on existing commercial plants - not what could be possible in the future.

230
Appendix M. Oxygen production If gasification is used for syngas production, a low inert content in the gas is preferred, which is why gasification with oxygen is more attractive than gasification with air. A high inert content in the gas from the gasifier results in: • A need for larger and therefore more expensive downstream equipment. • Slower synthesis reactions and lower syngas conversions because of lower partial
pressures of CO and H2. Note: Conventional synthesis will also include recirculation of unconverted syngas to the synthesis reactor, which is why even a small inert content in the gas from the gasifier can result in considerable concentrations in the synthesis loop. Oxygen production is however costly and energy consuming, but this is made up for by the reasons described above [Larson et al., 2009-1] - at least for large scale plants. Large scale and high purity (95-99.9%) oxygen production is today done by a cryogenic air separation unit (ASU). This technology is the most cost effective and energy efficient at large scale (Figure M.1: above ~60 ton-O2/day = 3600 Nm3/h ~ gasifier at 30 MWth). Medium and small scale oxygen production (0.08 - 60 ton-O2/day) is done by either pressure swing adsorption (PSA), if medium purity is needed (90-95%), or by membrane separation, if low purity oxygen is needed (up to 50%, see Figure M.1). Membrane separation is more energy and cost effective than pressure swing adsorption, but can only deliver low purity oxygen [GRASYS, 2010] [IGP, 2010]. Because cryogenic air separation is the only air separation technique used in this study, a section is included about this below.
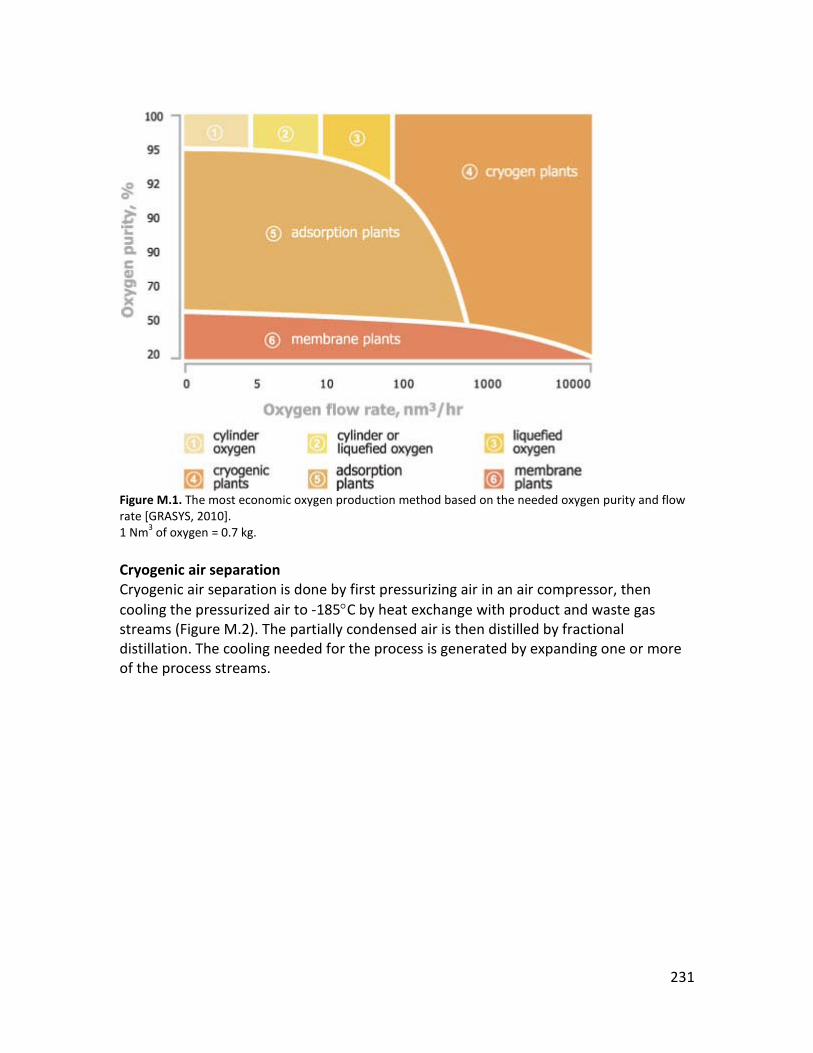
231
Figure M.1. The most economic oxygen production method based on the needed oxygen purity and flow rate [GRASYS, 2010]. 1 Nm3 of oxygen = 0.7 kg. Cryogenic air separation Cryogenic air separation is done by first pressurizing air in an air compressor, then cooling the pressurized air to -185°C by heat exchange with product and waste gas streams (Figure M.2). The partially condensed air is then distilled by fractional distillation. The cooling needed for the process is generated by expanding one or more of the process streams.

232
Figure M.2. A sketch of a generic cryogenic air separation plant. If only gaseous oxygen is needed, liquefied products will not be produced (the right side of the figure). The “internal refrigeration” is done by expanding one or more of the process streams [UIG, 2010]. “GAR” = gaseous argon, “GAN” = gaseous nitrogen, “GOX” = gaseous oxygen, “LIN” = liquefied nitrogen, “LAR” = liquefied argon, “LOX” = liquefied oxygen. If a cryogenic air separation unit (ASU) is used in a plant, where compressed air also is needed elsewhere, higher energy efficiency and lower cost may be achieved by integrating the ASU with the rest of the plant. This is the case in an integrated gasification combined cycle (IGCC) plant, where the gas turbine could deliver the pressurized air needed in the ASU (Figure M.3). This would especially be attractive if a low calorific gas is burnt in the gas turbine73 Figure M.3. As seen on , it is also possible to send the unused nitrogen from the ASU to the gas turbine - this increases overall energy efficiency [Karg, 2009]. In a synthesis plant, a gas turbine can be used to burn the unconverted syngas (especially in once-through synthesis plants), which is why the ASU in a synthesis plant also may be integrated with a gas turbine. This is done in [Larson et al., 2009-1]. The size of the gas turbine in a synthesis plant will however be smaller than in an IGCC because some (or most) of the syngas is converted in the synthesis stage, which is why
73 A gas turbine is typically manufactured to have almost the same mass flow in both compressor and turbine, which is why the use of a low calorific gas would create a higher turbine mass flow. By extracting air from the compressor the mass flows in the compressor and the turbine can become equal.

233
integration between the ASU and the gas turbine becomes less attractive. There will also be a limit to how much of the air from the gas turbine compressor (to the gas turbine combustor), that can be replaced by nitrogen from the ASU (Figure M.3). All European commercial-scale IGCC plants (2-3 plants) are fully integrated with the ASU – meaning that air is supplied to the ASU by the gas turbine compressor, and that nitrogen from the ASU is sent to the gas turbine combustor (Figure M.3). This was done to optimize energy efficiency. However, because that these plants have experienced problems like low availability due to this design, future IGCC plants (with or without CCS) are designed with no or only partial integration with the ASU [Karg, 2009]. Partial integration means, that a separate air compressor is available for the ASU to ensure at least part load operation (Figure M.3). It is assumed that the same conclusions can be drawn for synthesis plants incorporating a gas turbine and ASU.
Figure M.3. Integration options for IGCC power plants [Karg, 2009].

234
Appendix N. Existing biomass gasifiers suited for syngas production
Two existing biomass gasifiers suited for syngas production are described below. The first gasifier is the gasifier developed by the German company CHOREN, which is considered to be one of the most promising biomass gasifiers suited for syngas production. This gasifier was originally developed for heat and power production, but is now optimized for syngas production for Fischer-Tropsch synthesis. The second gasifier is the GTI gasifier. This gasifier is an air or oxygen-blown bubbling fluidized bed gasifier demonstrated at both atmospheric and elevated pressure. Other biomass gasifiers include the Güssing gasifier (1), the Ferco gasifier (2), the MTCI gasifier (3) and the Värnamo gasifier (4): 1. The Güssing gasifier is an 8 MWth allothermal (or indirectly fired) circulating fluidized bed gasifier (Fast Internal Circulating Fluidized Bed, FICFB) operating at atmospheric pressure. The gasifier was developed for CHP applications. The gasification is only done with steam, which is why the inert content in the gas produced is very low. The content of CH4 and higher hydrocarbons is however 12.5%, or 40% of the heating value of the gas, requiring the use of a tar cracker, or perhaps steam reforming, to increase the H2 and CO content. The cold gas efficiency of the gasifier is stated to be 77% [Iversen, 2006]. 2. Another allothermal circulating fluidized bed gasifier is the FERCO gasifier. This gasifier can be pressurized to 1.8 bar (absolute pressure), making it slightly more interesting for syngas production than the Güssing gasifier. The cold gas efficiency of this gasifier is however low (~72%, HHV) [Rollins et al., 2002]. 3. An allothermal bubbling fluidized bed gasifier has been demonstrated by MTCI. This gasifier is fluidized by steam and operated at atmospheric pressure, generating a gas with a high tar content. The cold gas efficiency of this type of gasifier is unknown [Ciferno et al., 2002]. A high pressure allothermal circulating/bubbling fluidized bed gasifier could be interesting for syngas production when coupled with a tar cracker (or steam reforming/partial oxidation), but the low cold gas efficiency is an issue. High pressure allothermal gasification has however not been demonstrated [Rollins et al., 2002]. It is not clear if these types of gasifiers are suited for high pressure operation. 4. The Värnamo gasifier is an 18 MWth air-blown circulating fluidized bed gasifier operating at a pressure of 19 bar. The gas generated by the gasifier contains 50% N2 and 6% CH4 (corresponding to 39% of the heating value of the gas) [Iversen, 2006]. Because of the high nitrogen content, the cold gas efficiency is considered to be low (e.g. compare with Table P.1 - the cold gas efficiency is stated above the table). If the gasifier had been oxygen-blown, it could have been suited for syngas production (like the GTI gasifier described below). In 2007, a reconstruction of the Värnamo gasifier was started to rebuild the gasifier to oxygen-blown gasification, and production of DME from the

235
syngas. The reconstruction however stopped in 2007 due to insufficient funds. The Värnamo gasifier has not been operating since 2000 [VVBGC, 2010]. Other biomass gasifiers can be seen in Appendix O, were data from [Ciferno et al., 2002] are given on operating conditions and gas compositions (including the Ferco, MTCI, GTI and Värnamo gasifier (written as “sydkraft”)). The gasifiers in Appendix O include 7 bubbling fluidized bed gasifiers (5 of these are air-blown, 1 is oxygen-blown and 1 is indirectly heated), 6 circulating fluidized bed gasifiers (5 of these are air-blown and 1 is indirectly heated), and 2 fixed bed gasifiers for municipal solid waste (MSW, 1 is oxygen-blown). CHOREN The gasification system from CHOREN is actually split into two separate gasifiers (Figure N.1 and Figure N.2): 1. a low temperature gasifier where biomass is partly pyrolyzed and partly gasified with oxygen (or air) and steam. 2. A high temperature entrained flow gasifier, where the tar rich gas and some of the coke from the low temperature gasifier is heated to 1200-1370°C by oxygen (or air) injection – at this temperature the tars are cracked. The hot gas is cooled by a chemical quench by injecting the remaining coke generated in the low temperature gasifier. The generated gas (Table N.1) contains no traceable tars and has a low content of CH4 (< 0.5% at 5 bar). The gasification system is pressurized to 5 bar and the cold gas efficiency is stated to be 80% (more than 80%, LHV). The biggest pilot plant made so far is the 45 MWth Beta plant producing Fischer-Tropsch diesel. This pilot plant was commissioned in 2008 [CHOREN, 2010]. CHOREN has plans for a Sigma plant at 640 MWth consisting of 16 low temperature gasifiers (NTV) at 40 MWth each, and 4 high temperature gasifiers (HTV) at 160 MWth each [CHOREN, 2008-1].
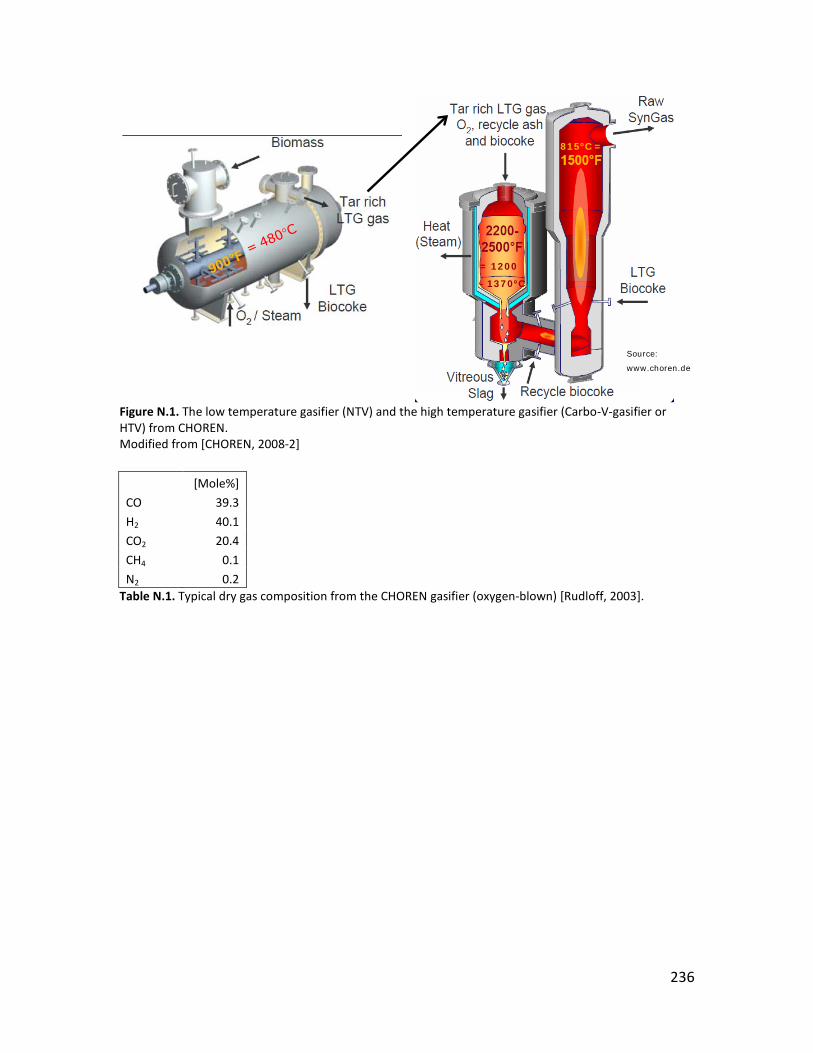
236
Figure N.1. The low temperature gasifier (NTV) and the high temperature gasifier (Carbo-V-gasifier or HTV) from CHOREN. Modified from [CHOREN, 2008-2]
[Mole%]
CO 39.3
H2 40.1
CO2 20.4
CH4 0.1
N2 0.2 Table N.1. Typical dry gas composition from the CHOREN gasifier (oxygen-blown) [Rudloff, 2003].
= 1200
- 1370°C
815°C =
Source:
www.choren.de

237
Figure N.2. The Carbo-V process from CHOREN [CHOREN, 2008-1]. The gasification process from CHOREN has many (or all) of the characteristics of a gasifier suited for syngas production (Table 2.3): • No tar and low CH4 content (CH4 content less than 0.5% at 5 bar) • High CO and H2 content (typical H2/CO ratio of 1) • Pressurized operation (only 5 bar though) The disadvantage with the CHOREN gasifier is: • Low (or medium) cold gas efficiency (80%) Another disadvantage with the CHOREN gasifier may be the gasifier cost, since the gasifier consists of three stages, making it rather complex. The economy of scale of the CHOREN gasifier may also be limited, due to the low temperature gasifier (16 low temperature gasifiers used in the proposed 640 MWth plant) [CHOREN, 2008-1].

238
GTI gasifier The GTI gasifier is an air or oxygen-blown bubbling fluidized bed gasifier demonstrated at both atmospheric and elevated pressure. In Figure N.3, a sketch of the gasifier can be seen.
Figure N.3. The GTI gasifier used in the Skive CHP plant [Carbona, 2006]. Note: the GTI gasifier can also be oxygen-blown. The gasifier has demonstrated gasification of wood chips, forest residue, paper mill waste (bark, paper, sludge), willow, and straw with coal [Rollins et al., 2002]. In Table N.2, measured gas compositions from the GTI gasifier are shown. The measurements were done with two oxygen-blown gasifiers operating at 3-21 bar with and without steam addition. The table show that the gas produced had a high heating value (HHV = 9.95-12.6 MJ/m3) with a high content of methane (9-17.3 vol%) and some higher hydrocarbons (0.8-2.7 vol%). The carbon conversion was measured to 95-98%. The cold gas efficiency of the measurements seen in Table N.2 has not been found, but the same reference states that the 100 tpd plant (“demonstration test” in Table N.2) had a cold gas efficiency of 55-77% (assumed to be HHV basis). However, simulations also done in the same reference ([Rollins et al., 2002]) show a cold gas efficiency of 82% (assumed to be HHV basis) for oxygen-blown pressurized gasification of wood. In [Larson et al., 2009-1] the gasifier is modeled to have a cold gas efficiency (including tar cracker) of 80% (LHV) for oxygen-blown pressurized (30 bar) gasification of switchgrass. The modeled gas composition after the tar cracker is shown in Table N.3.

239
Table N.2. Measured gas composition from a pressurized oxygen blown GTI gasifier [Rollins et al., 2002]. The table also shows corresponding heating values of the gas and carbon conversions. The “demonstration tests” were done with a 100 tpd (~10 MWth) plant in Hawaii and the “PDU test” with a 12 tpd (~1.2 MWth) process development unit (PDU) at GTI in Chicago.
Wet gas [Mole%]
Dry gas [Mole%]
CO 18 23
H2 31 40
CO2 24 31
CH4 4 5
H2O 22 0 Table N.3. Modeled gas composition (after tar cracker) of a pressurized (30 bar) oxygen-blown GTI gasifier [Larson et al., 2009-1]. The GTI gasifier - with tar cracker - has some of the characteristics of a gasifier suited for syngas production (Table 2.3): • Pressurized operation (30 bar) • High CO and H2 content, with an appropriate H2/CO ratio (improved greatly by tar
cracker: compare Table N.2 with Table N.3) The disadvantage with the GTI gasifier are: • Low (or medium) cold gas efficiency (~80%) • High CH4 content (9-17%) and some tar, requiring a tar cracker (5% CH4 after tar
cracker). When using a tar cracker the CO and H2 content increases greatly, and the H2/CO ratio becomes 1.75 (Table N.3), which is suitable for DME/methanol synthesis.
240
Another advantage with this type of gasifier is that the biomass ash is not melted because of the lower gasification temperatures compared with entrained flow gasification (CHOREN). This makes the bio-ash more suited for fertilizer production. The gasifier is used commercially in the 19.5 MWth CHP plant in Skive, Denmark [Carbona, 2006]. This type is air-blown and pressurized to 2 bar. A bubbling fluidized bed gasifier like the GTI gasifier is considered by many to be the preferred biomass gasifier for syngas production (used with tar cracker) [Larson et al., 2009-1] [Rollins et al., 2002]. The maximum size of the gasifier is estimated to be 120 dry tonne/h (oxygen-blown and pressurized to 30 bar) [Larson et al., 2009-2] corresponding to 567 MWth switchgrass (LHV) [Larson et al., 2009-2]. The scalability of this type of gasifier is therefore better than the CHOREN gasifier, but still lower than for an entrained flow gasifier.

241
Appendix O. Demonstrated biomass gasifiers
Data from [Ciferno et al., 2002]:

242

243
Appendix P. The Two-Stage Gasifier The Two-Stage Gasifier was developed at the Technical University of Denmark (DTU) by the biomass gasification group (BGG) and is a modified fixed bed downdraft gasifier made for gasification of wood chips. The gasifier system consists of three stages: Drying, pyrolysis and gasification (Figure P.1). Originally the drying was done in the pyrolysis reactor and therefore the name “Two-Stage Gasifier” [Henriksen et al., 2006]. In the first stage, the wet wood chips are dried in co-flow with superheated steam by using a screw conveyer design. In the second stage the dried wood (+ surplus steam) is heated and pyrolyzed in a screw conveyer by passing hot syngas on the outside of the screw conveyer. In the third stage the pyrolysis gas is first partially oxidized by air injection and thereafter the gas is led through a coke bed generated by coke from the pyrolysis. The gasifier is operated at atmospheric pressure and the gas generated by the gasifier (Table P.1) has very low tar content. This is because of the partial oxidation and the coke bed, which acts as an active carbon filter (only 0.1 mg/Nm3 naphthalene has been measured in the raw gas [Ahrenfeldt et al., 2006]). The coke bed also reduces the sulfur content of the gas; from an expected value of ~44 ppm74
The cold gas efficiency of the gasifier can be very high. The pilot plant named the Viking Gasifier, which is a 75 kWth gasifier, has a cold gas efficiency of 93% (wet wood to raw gas, LHV) [Ahrenfeldt et al., 2006]. Because the Viking Gasifier is operated without steam drying, the cold gas efficiency with steam drying can be higher. Simulations suggests that the cold gas efficiency can reach 103% (wet wood to raw gas, LHV, or 93% from dry wood to raw gas, LHV) (section
(COS, H2S) to less than 2 ppm (0.93 ppm of COS and 0.5-1 ppm of H2S was measured [Iversen et al., 2006]).
6.2.3.1). The Two-stage gasifier was designed for gas production to a gas engine: In the Viking Gasifier the exhaust from the engine is used to heat the pyrolysis reactor, while in the newest pilot plant (Figure P.1) the engine exhaust is used for steam drying of the wet wood chips, while the hot syngas is used for heating the pyrolysis reactor. The pilot plant shown in Figure P.1 is 700 kWth.
74 Based on a sulfur content in the biomass of 0.02 mass% (dry), and the assumption that all sulfur is transformed to H2S or COS. In [Ahrenfeldt J et al., 2006], two measurements of the ultimate analysis of the wood chips used, showed that the sulfur content was 0.022-0.07 mass% (dry).

244
Figure P.1. The 700 kWth Two-Stage Gasifier with steam drying. Flow sheet made on the basis of [Bentzen et al., 2004] (in this reference the wood chips are dried in counter-flow with steam, but the plant was built with co-flow).
[Mole%]
CO 19.6
H2 30.5
CO2 15.4
CH4 1.16
N2 33.3 Table P.1. Typical dry gas composition from the Two-stage gasifier (the Viking Gasifier) [Ahrenfeldt et al., 2006]. The Two-Stage Gasifier has some of the characteristics of a gasifier suited for syngas production (Table 2.3): • High cold gas efficiency (93% - 103%) • Low tar (no tar) and low CH4 content (CH4 content measured to less than 1 mole% in
the 700 kWth plant - around 1% in the Viking Gasifier) • H2/CO ratio of 1.5 - 2 (can be changed by adding water to the wood or removing
steam from the steam dryer) Another general advantage with this type of gasifier is that the biomass ash is not melted due to the lower gasification temperatures compared with entrained flow gasification. This makes the bio-ash more suited for fertilizer production. Another advantage is the low sulfur content in the gas. Because the sulfur content is less than 2 ppm the guard beds that would be used to capture the sulfur, rarely needs regeneration.
Fly ash
Wet Wood
Dry syngas (to gas engine)
Ash
gasifier
Water
Steam
Dry wood (2% water) + steam
Pyrolysis reactor
Air
Exhaust gas(from gas engine)

245
The disadvantages with the Two-Stage Gasifier if used for syngas production: • Operation at atmospheric pressure • High inert content because of air-blown gasification It seems possible to shift the gasifier from air-blown gasification to gasification with enriched air. It might be necessary to add steam to the enriched air to simulate the replaced nitrogen, possibly by extracting steam from the steam dryer (typically enough steam will be generated in the steam dryer to replace the nitrogen content in the air). The energy consumption associated with air enrichment might however be too great compared with the benefits achieved. Like the CHOREN gasifier above, the gasifier cost may be high due to a rather complex design, consisting of three-stages. This type of gasifier is however only intended for small-scale use (up to 10 MWth [Bentzen et al., 2004]), unlike most gasifiers intended for syngas production, which is why it may be competitive in the “small-scale synthesis”-category, if such a category ever becomes attractive. Another design of the Two-Stage Gasifier, consisting of two bubbling fluidized beds, has been proposed in [Andersen et al., 2003] and [Bentzen et al., 2004]. This type of design would be more suitable for large-scale gasification – however, the design is based on atmospheric air-blown gasification. Because this version of the Two-Stage Gasifier has only been demonstrated at laboratory scale (100 kWth), and that very little data exists, it is not described further.

246
Appendix Q. Commercial coal gasifiers used for syngas production
The three main gasifier types (fixed bed, fluidized bed, entrained flow) have all been commercialized for coal gasification for syngas production [GWD, 2007]. However, today most/all new synthesis plants based on gasification of coal use entrained flow gasification, and the primary technology supplier is Shell [GWD, 2007] [NETL, 2010]. The Shell coal gasifier In Figure Q.1, the entrained flow gasifier from Shell can be seen, and in Table Q.1, a typical gas composition for the gasifier is given. From Figure Q.1 it can be seen that the gasifier is oxygen-blown and feed with dry coal (as opposed to a coal slurry, which is a liquid mixture of coal and water), and that the gasifier is cooled by steam generation in the membrane walls. From Figure Q.2 it can be seen that the gas from the gasifier is quenched by cold syngas from 1600°C to 900°C. What cannot be seen from the figures is that the gasifier is pressurized up to 35-45 bar, and that the coal is pressurized by lock hoppers and fed to the gasifier by pneumatic feeders, both using inert gas (N2 or CO2) [van der Ploeg et al., 2004]. The gasifier is also steam moderated, with a typical steam input of 4-10 mass% of the coal mass flow (moisture and ash free) [van der Ploeg et al., 2004]. The maximum size of the gasifier is 5000 ton-coal/day (~1.4-1.7 GWth input) [van der Ploeg et al., 2004]. Like other entrained flow coal gasifiers, the shell gasifier is slagging, which means that the coal ash melts in the gasifier and runs down the gasifier walls to the bottom of the gasifier, where it is collected and solidified. The liquid ash acts as an insulator for the gasifier walls from the high temperature in the gasifier.
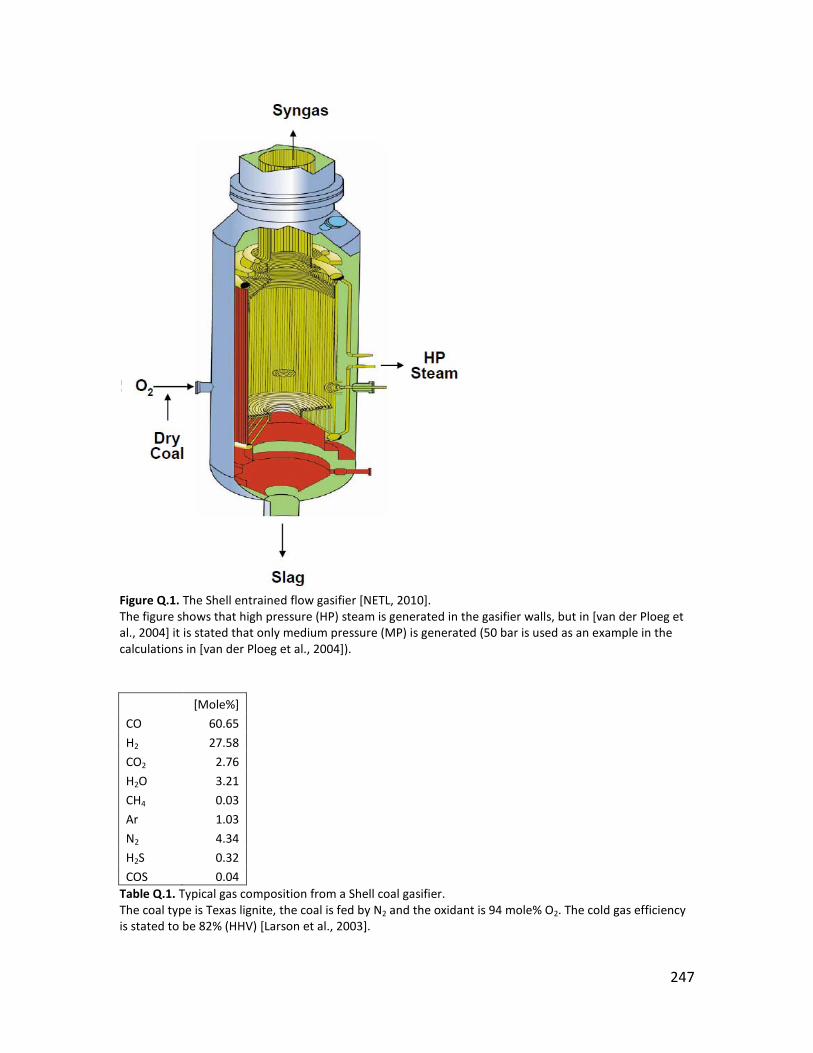
247
Figure Q.1. The Shell entrained flow gasifier [NETL, 2010]. The figure shows that high pressure (HP) steam is generated in the gasifier walls, but in [van der Ploeg et al., 2004] it is stated that only medium pressure (MP) is generated (50 bar is used as an example in the calculations in [van der Ploeg et al., 2004]).
[Mole%]
CO 60.65
H2 27.58
CO2 2.76
H2O 3.21
CH4 0.03
Ar 1.03
N2 4.34
H2S 0.32
COS 0.04 Table Q.1. Typical gas composition from a Shell coal gasifier. The coal type is Texas lignite, the coal is fed by N2 and the oxidant is 94 mole% O2. The cold gas efficiency is stated to be 82% (HHV) [Larson et al., 2003].

248
Figure Q.2. The total coal gasification system from Shell [Shell, 2005]. DSR = dry solids removal. In Figure Q.3, a typical energy balance is given for the Shell coal gasifier system. It can be seen that the cold gas efficiency is 82%75
, and that the loss in unconverted carbon is 0.5%, which in the same reference is stated to correspond to a carbon conversion of more than 99% [Shell, 2005]. The figure also shows that most of the heat generated in the gasifier is converted to steam; either by steam generation in the reactor wall (2%) or by steam generation (and possible superheating) in the following syngas cooler (12.8%). The figure also states the heat loss from the gasifier to the surroundings to be 2.7%.
75 81-83% (LHV) and 82-84% (HHV) [van der Ploeg HJ et al., 2004].

249
Figure Q.3. A typical energy balance for the Shell coal gasifier system [Shell, 2006]. In Buggenum (Netherlands) a Shell gasifier used in a 253 MWe Integrated Gasification Combined Cycle (IGCC) plant owned by the power company NUON, has since 2006 co-gasified biomass with coal. CO2 emissions are reduced by 22%. They have conducted tests with chicken manure, sewage sludge and wood as replacements for coal [NUON, 2010]. Other commercial coal gasifiers The main competitor to the Shell coal gasifier is the GE Energy (previously Chevron-Texaco) gasifier (Figure Q.4) [GWD, 2007] [NETL, 2010]. This type of gasifier is (like the Shell gasifier) an oxygen-blown, pressurized entrained flow gasifier [NETL, 2010]. Unlike the Shell gasifier this type of gasifier is fed with a coal slurry (mixture of water and coal), and steam is generated by a radiant syngas cooler before the syngas is quenched by water (the gasifier is also supplied without a water quench) [NETL, 2010]. Instead of using membrane wall cooling the gasifier is refractory-lined, which means that the gasifier walls are lined (coated) with a material with a high melting point [NETL, 2010]. This type of gasifier has lower cold gas efficiency than the Shell gasifier because of the energy needed to evaporate the water in the coal slurry and because of the lower carbon conversion (a carbon conversion of 95% is reported in [Kreutz et al., 2008]). On top of this, when using water quench in the GE gasifier, less of the thermal energy released in the gasifier can be utilized for steam generation for power production, than in the Shell gasifier system. The advantage with using coal slurry instead of dry coal is that the energy consumption for pressurization of the fuel is much lower. It is therefore possible to pressurize the gasifier to at least 75 bar [Kreutz et al., 2008]. The advantage with water quench when producing a syngas, is that the H2/CO ratio of the gas will/can be close to 1 [NETL, 2010], which is what is needed for e.g. DME synthesis. If a higher H2/CO ratio is needed, the gas contains more than enough water vapor to avoid steam addition before the water gas shift reactor.

250
Figure Q.4. The GE Energy (previously Chevron-Texaco) coal gasifier (modified from [NETL, 2010]).
1370 C
600 C
O2
Gas out
Slag out

251
Appendix R. Slag formation in entrained flow gasification of biomass
Entrained flow gasification of biomass can be done in either a slagging or non-slagging gasifier. In a slagging entrained flow gasifier the ash melts and run down the gasifier walls, thereby creating a protective layer for the walls against the high temperature gasification process. An entrained flow coal gasifier is always slagging. In a non-sagging entrained flow gasifier slag must not stick to the walls, which is why only fuels with very low ash content (max. 1%) can be used. Entrained flow gasifiers on oil residues can be non-slagging [van der Drift et al., 2004]. In [van der Drift et al., 2004] it is investigated whether biomass should be gasified in slagging or non-slagging entrained flow gasifiers. A non-slagging gasifier seems possible because of the low ash content of biomass and because biomass ash hardly melts (Figure R.1). It is however concluded that biomass should be gasified in slagging entrained flow gasifiers because of: 1. some slag cannot be avoided and 2. because a slagging entrained flow gasifier is more fuel flexible (coal or biomass with high ash content). However, gasification of biomass in a slagging entrained flow gasifier requires addition of fluxing agents like silica or clay to make the gasifier slagging. A slag recycle may also be needed [van der Drift et al., 2004]. Slag recycle and addition of flux agents is also used when gasifying low ash coals (e.g. petcoke76 Figure R.1). In and Figure R.2, the slagging behavior of wood with and without fluxing agents can be seen. Both figures suggest a gasification temperature of 1300°C may be adequate for wood with fluxing agents.
76 In [van der Ploeg et al., 2004] a slag recycle and/or addition of flux agents are used when gasifying a coal mixture (consisting of petcoke) with an ash content of 2.4%.
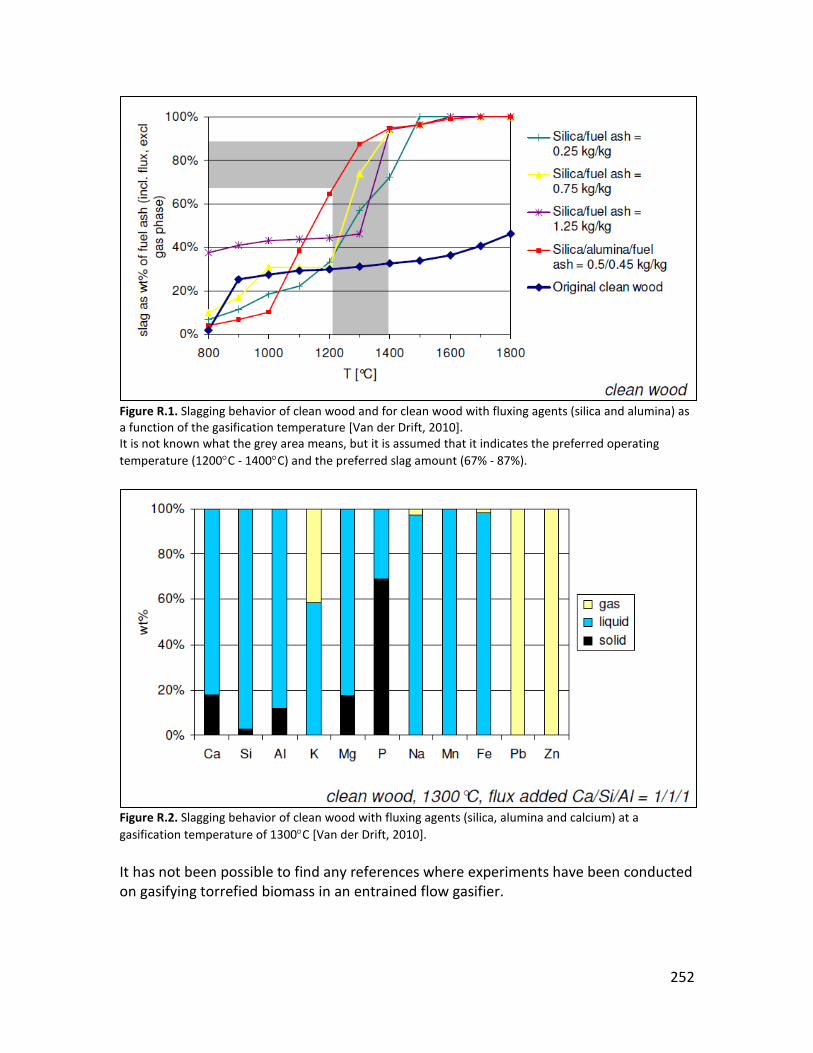
252
Figure R.1. Slagging behavior of clean wood and for clean wood with fluxing agents (silica and alumina) as a function of the gasification temperature [Van der Drift, 2010]. It is not known what the grey area means, but it is assumed that it indicates the preferred operating temperature (1200°C - 1400°C) and the preferred slag amount (67% - 87%).
Figure R.2. Slagging behavior of clean wood with fluxing agents (silica, alumina and calcium) at a gasification temperature of 1300°C [Van der Drift, 2010]. It has not been possible to find any references where experiments have been conducted on gasifying torrefied biomass in an entrained flow gasifier.
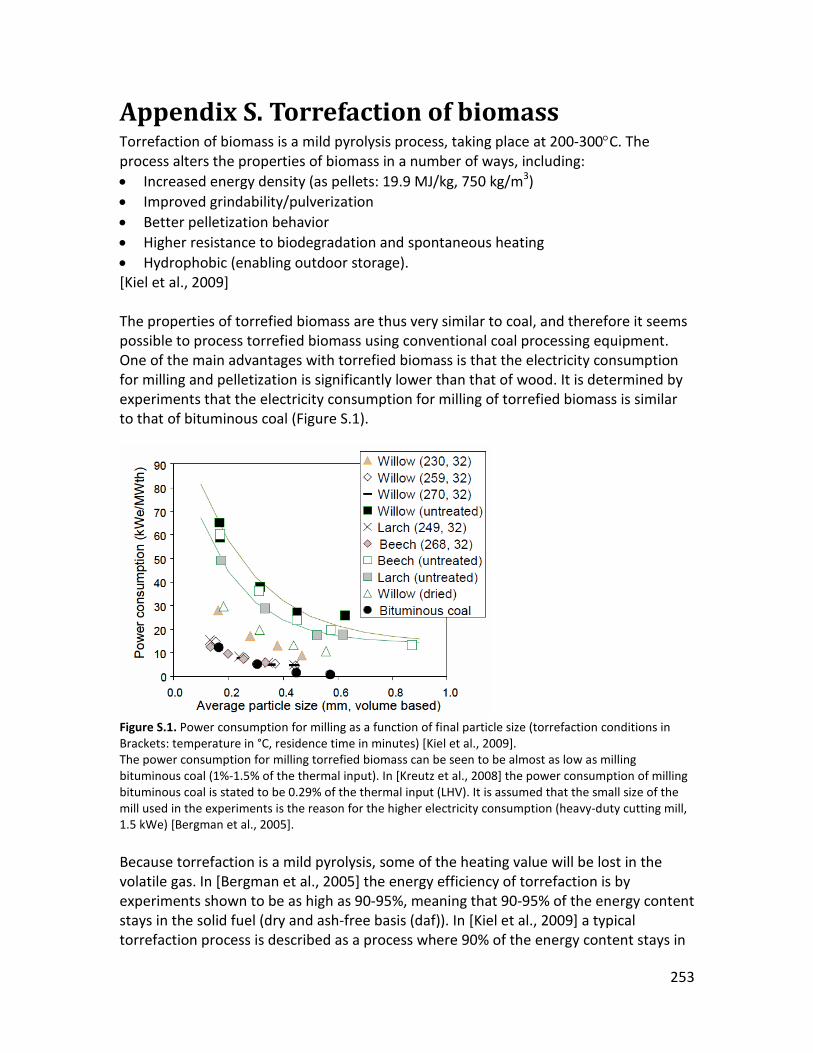
253
Appendix S. Torrefaction of biomass Torrefaction of biomass is a mild pyrolysis process, taking place at 200-300°C. The process alters the properties of biomass in a number of ways, including: • Increased energy density (as pellets: 19.9 MJ/kg, 750 kg/m3) • Improved grindability/pulverization • Better pelletization behavior • Higher resistance to biodegradation and spontaneous heating • Hydrophobic (enabling outdoor storage). [Kiel et al., 2009] The properties of torrefied biomass are thus very similar to coal, and therefore it seems possible to process torrefied biomass using conventional coal processing equipment. One of the main advantages with torrefied biomass is that the electricity consumption for milling and pelletization is significantly lower than that of wood. It is determined by experiments that the electricity consumption for milling of torrefied biomass is similar to that of bituminous coal (Figure S.1).
Figure S.1. Power consumption for milling as a function of final particle size (torrefaction conditions in Brackets: temperature in °C, residence time in minutes) [Kiel et al., 2009]. The power consumption for milling torrefied biomass can be seen to be almost as low as milling bituminous coal (1%-1.5% of the thermal input). In [Kreutz et al., 2008] the power consumption of milling bituminous coal is stated to be 0.29% of the thermal input (LHV). It is assumed that the small size of the mill used in the experiments is the reason for the higher electricity consumption (heavy-duty cutting mill, 1.5 kWe) [Bergman et al., 2005]. Because torrefaction is a mild pyrolysis, some of the heating value will be lost in the volatile gas. In [Bergman et al., 2005] the energy efficiency of torrefaction is by experiments shown to be as high as 90-95%, meaning that 90-95% of the energy content stays in the solid fuel (dry and ash-free basis (daf)). In [Kiel et al., 2009] a typical torrefaction process is described as a process where 90% of the energy content stays in

254
the solid fuel (assuming the value is for dry and ash-free basis (daf)) and the 10% of the energy content in the volatile gas is used for generating heat for the torrefaction process and pre-drying of the biomass. The loss in chemical energy in the torrefaction is - perhaps only to some extent - compensated for by the lower electricity consumption of milling and pelletization, but also by a lower energy consumption associated with transport because of the higher energy density of torrefied wood pellets compared with conventional wood pellets (BO2pellets: 13-17 GJ/m3 compared to 10 GJ/m3 for wood pellets [Kiel et al., 2009]). The moisture content of torrefied wood pellets is also lower than that of conventional wood pellets (1-5 mass% vs. 10 mass%), and in [Uslu et al., 2008] it is stated that the net energy efficiency of torrefaction followed by pelletization is 91%, compared with 87% for conventional wood pelletization. In Table S.1, it is shown that the fluidization behavior of pulverized torrefied biomass is almost as good as that of pulverized coal, whereas the fluidization behavior of untreated wood powder is insufficient. It is stated in [Bergman et al., 2005] that: “the quality of the (torrefied) powder is sufficient for its feeding into an entrained-flow gasifier” (referring to dp = 100 in Table S.1).
Table S.1. Fluidization behavior of coal, willow and torrefied willow [Bergman et al., 2005] (dp is the mean particle size). In Figure S.1, the power consumption for milling the fuels to these particle sizes can be seen.

255
Appendix T. Gas composition for a fluidized bed biomass gasifier
Table T.1. Typical gas composition (dry basis) for gasification of wood (15% moisture) at 850°C in an atmospheric air-blown CFB gasifier [Boerrigter et al., 2004].

256
Appendix U. The Rectisol process The Rectisol process is an acid gas removal (AGR) process based on absorption of gases in a solvent. Absorption based gas cleaning processes can be used when the gas is pressurized (pressurized gasification). The physical solvent used in Rectisol is chilled methanol (typically -20°C to -50°C). In Figure U.1, the absorption coefficients of various gasses in chilled methanol can be seen, and it is clear from this figure, which is why chilled methanol is used for removal of acid gasses (H2S, COS and CO2). The Rectisol process can clean a gas to (below) 0.1 ppm of total sulfur (H2S, COS, CS2) and 2 ppm of CO2 [Lurgi, 2010].
Figure U.1. Absorption coefficient α of various gasses in methanol (partial pressure: 1 bar) [Lurgi, 2010]. Other impurities such as HCN, NH3, nickel and iron carbonyls, gum formers, CS2, mercaptans, naphthalene, thiophenes, organic sulfides, and higher hydrocarbons are also removed by the Rectisol process [Lurgi, 2010]. The chilled methanol will however also absorb H2 and CO to some extent (Figure U.1), which is why the Rectisol process must be designed to lower the loss of H2 and CO. In Figure U.2, a basic flow sheet for the Rectisol process is shown together with a general process description in the figure caption. In this figure caption it is also explained how the loss of H2 and CO is reduced.

257
The energy consumption for the Rectisol process is mostly electricity used for refrigeration of the methanol solvent, but some electricity is also used by pumps for pressurizing the methanol and for a recycle compressor. Besides the electricity consumption, there will also be a steam consumption, which is used in the distillation columns (Figure U.2).
Figure U.2. Basic flow sheet of a Rectisol process (Rectisol wash) [Linde, 2010]. Process description: the feedgas/syngas is first chilled by heat exchange with product and waste streams. The gas is then fed to the bottom of the absorber, where it counter flows with the chilled methanol solvent. At the top of the absorber the clean syngas is removed, and at the bottom of the absorber the rich solvent is led to one or more flash tanks. In the first flash tank, the gas produced will contain relatively much H2 and CO, which is why this stream is recycled back to the feedgas, to lower the loss of CO and H2. If CO2 storage is wanted (or high pressure CO2 streams are wanted) more flash tanks will be used (not shown on figure), the gas from the flash tanks will mainly contain CO2, which is why these streams can be compressed and sent to CO2 storage (the gas will however contain some sulfur components, e.g. H2S). After the last flash tank the liquid is sent to a stripper at atmospheric pressure, where nitrogen is used to remove all CO2 from the solvent. The liquid solvent from the stripper is then heated by heat exchange with a hot solvent stream before it is sent to a distillation column where remaining gas components absorbed in the solvent is removed (H2S-fraction). The liquid solvent from the distillation column can then be pressurized by a pump and then cooled by a refrigeration plant before it is returned to the absorber. What is not shown on the flow sheet is that a fraction of the liquid from the distillation column is sent to another distillation column where absorbed water is removed. Since the water is removed as a bottoming stream from the column, it will also contain all non-gaseous impurities (e.g. trace metals). It should be noted that in this basic flow sheet, the “tailgas” and “CO2“ streams produced, will also contain some sulfur components, and the “tailgas” will contain some CO2 and the “CO2“ some nitrogen. If the CO2 product/waste stream needs to be free of sulfur compounds another absorber needs to be added to the flow sheet [Lurgi, 2010]. The CO2 stream from the Rectisol process can without further treatment be compressed to more than 150 bar because the CO2 is completely dry. Such high pressures are needed in e.g. a CO2 underground storage. Other CO2 capture technologies such as oxy-fuel capture require extensive drying to remove water.

258
Other absorption-based gas cleaning processes include Selexol and Purisol. Both of these processes occur at ambient temperatures, which is why refrigeration of the solvent is not required. This means that the main energy consumption is for pressurizing the solvent by a pump. The solvents used are however more expensive than methanol (used in the Rectisol process). In Selexol, the solvent is dimethyl ethers of polyethylene glycol. Selexol is less effective than Rectisol in removing sulfur77
In
, which is why 90% of all synthesis plants based on gasification use Rectisol for sulfur removal [Lurgi, 2010]. Selexol is often used in IGCC plants, where requirements for sulfur removal are lower (20 ppm [Larson et al., 2003]), but can be used in synthesis plants [Larson et al., 2003]. However, if used in synthesis plants, the guard beds placed just before the synthesis reactor will need to be regenerated more often because of higher sulfur levels (and perhaps higher levels of other contaminants).
Figure U.3, the CO2 loading capacity can be seen for different solvents, including chemical solvents78
, and it is clear that chilled methanol can contain a lot of CO2 at relatively low CO2 partial pressures. Typically absorption based CO2 removal is preferred if the gas pressure exceeds 20 bar [Kreutz et al., 2008] (Rectisol) [UOP, 2010] (Selexol). For example: if the CO2 concentration was 30% at 20 bar, the CO2 partial pressure would be 0.6 MPa.
77 1 ppm of H2S [Larson et al., 2003] vs. below 0.1 ppm of total sulfur (H2S + COS + CS2) [Lurgi, 2010]. 78 Chemical solvents remove CO2 by chemical reactions between the solvent and the CO2. The solvents can then be regenerated - typically by heating the solvents.
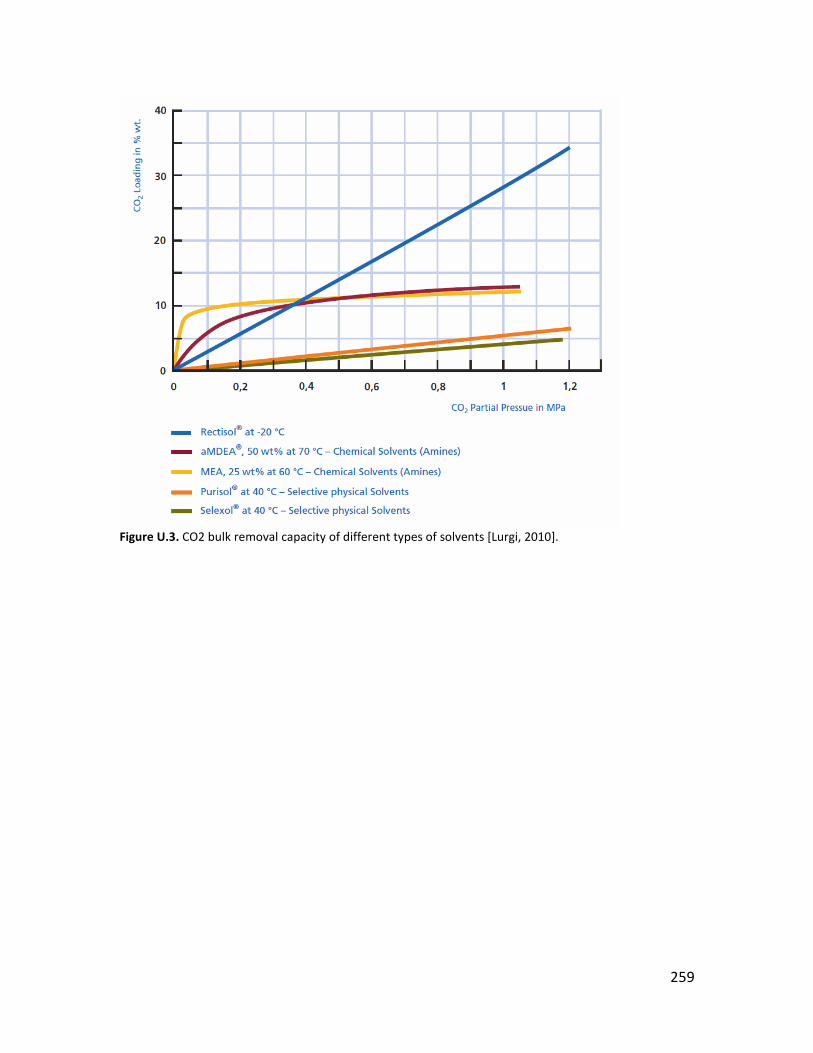
259
Figure U.3. CO2 bulk removal capacity of different types of solvents [Lurgi, 2010].

260
Appendix V. Synthesis reactors for DME/methanol synthesis
Commercial status Methanol synthesis is a fully commercially available technology, while DME synthesis is a more recent development, but still a commercially available technology. Today DME is commercially produced in a two-step process: the first process is a conventional methanol synthesis process, where liquid and purified methanol is produced. The second process is then the actual DME synthesis, which is done by dehydration of methanol (Figure V.6). DME production by the two-step process can therefore be added to existing methanol plants, using a part of the produced methanol for DME synthesis. Many two-step DME synthesis plants exist in China [Haldor Topsøe, 2007] [Tecnon, 2006]. DME synthesis is however also possible in a one-step process, where DME is produced directly from a syngas - also referred to as a direct DME synthesis. This is done in one reactor by using both methanol and dehydration catalysts. DME synthesis in one reactor is favored by greater syngas conversions per pass than methanol synthesis (Figure 2.8). DME production can however also be done as seen in Figure V.7. This process could be characterized as a mix between the two-step process and the one-step process because methanol is synthesized in the first reactor, and DME in the second. Plans for commercial scale plants based on a one-step process exist [Ohno, 2007] [KOGAS, 2009], but operating plants based on a one-step process has not been found79. The technology for one-step DME synthesis is available from e.g. Haldor Topsøe, JFE, Korea Gas Corporation (KOGAS) and Air Products and Chemicals. All have pilot/demonstration plants for direct DME synthesis80
.
Synthesis reactors DME and methanol can be synthesized in different types of reactors, below these relevant types are discussed:
• Boiling Water Reactors (BWR) • Slurry/liquid phase reactors • Adiabatic reactors
Boiling water reactors (BWR) A BWR is a fixed bed isothermal reactor where boiling water is used to remove the process heat generated (Figure V.1). The operating temperature is controlled by controlling the pressure of the boiling water. In Figure V.2, the conversion profile for methanol synthesis in a BWR is shown. From this it can be seen that the conversion
79 [KOGAS, 2009] reports that commercial DME plants all use two-step synthesis. 80 The demonstration plant from JFE and KOGAS are 100 ton/day and 10 ton/day respectively [Yagi et al., 2010] [KOGAS, 2009]. The size of the DME pilot/ demonstration plants by Haldor Topsøe and Air Products and Chemicals are unknown, but the plant by Haldor Topsøe is described in [Haldor Topsøe, 2010-4] and the plant from Air Products and Chemicals are referred to in [Larson et al., 2009-1].
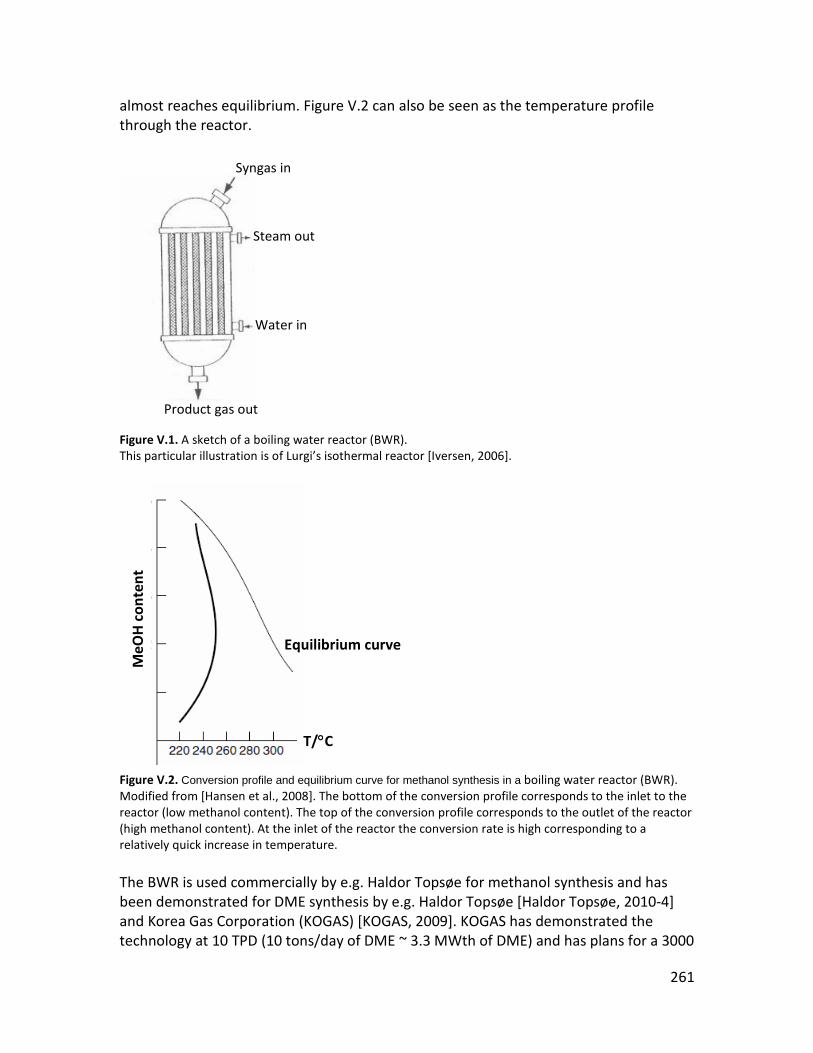
261
almost reaches equilibrium. Figure V.2 can also be seen as the temperature profile through the reactor.
Figure V.1. A sketch of a boiling water reactor (BWR). This particular illustration is of Lurgi’s isothermal reactor [Iversen, 2006].
Figure V.2. Conversion profile and equilibrium curve for methanol synthesis in a boiling water reactor (BWR). Modified from [Hansen et al., 2008]. The bottom of the conversion profile corresponds to the inlet to the reactor (low methanol content). The top of the conversion profile corresponds to the outlet of the reactor (high methanol content). At the inlet of the reactor the conversion rate is high corresponding to a relatively quick increase in temperature. The BWR is used commercially by e.g. Haldor Topsøe for methanol synthesis and has been demonstrated for DME synthesis by e.g. Haldor Topsøe [Haldor Topsøe, 2010-4] and Korea Gas Corporation (KOGAS) [KOGAS, 2009]. KOGAS has demonstrated the technology at 10 TPD (10 tons/day of DME ~ 3.3 MWth of DME) and has plans for a 3000
Steam out
Water in
Syngas in
Product gas out
T/°C
Equilibrium curve
MeO
H c
onte
nt
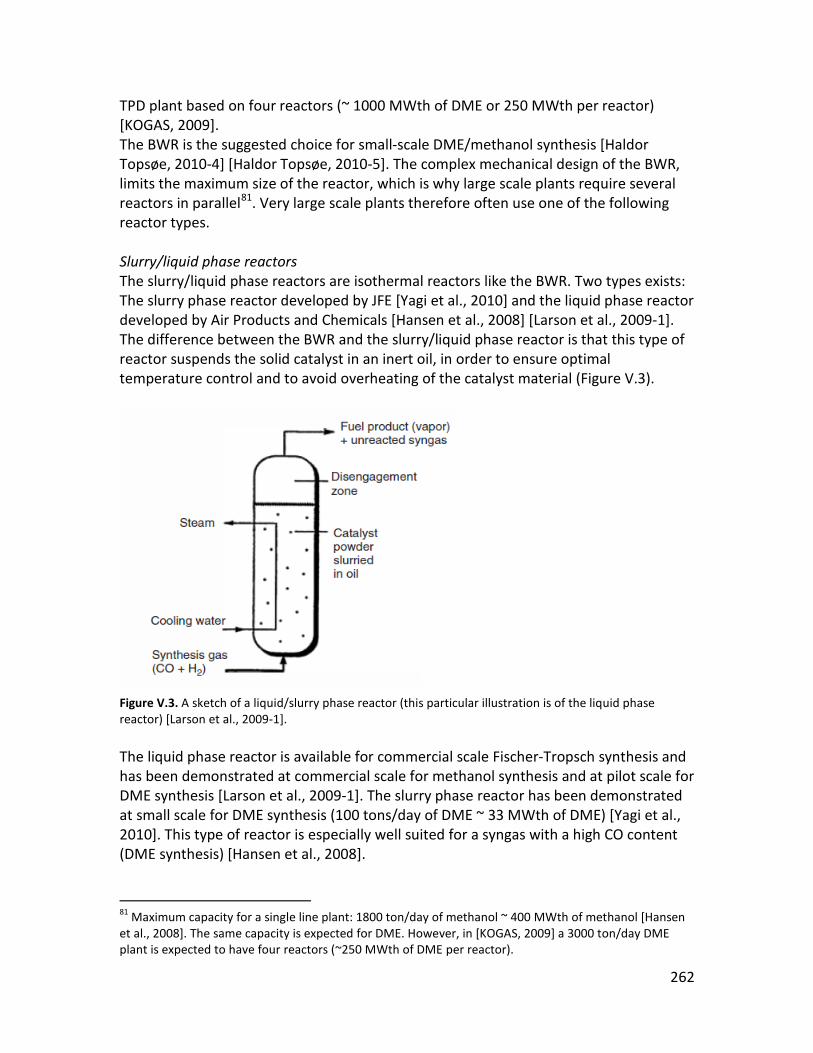
262
TPD plant based on four reactors (~ 1000 MWth of DME or 250 MWth per reactor) [KOGAS, 2009]. The BWR is the suggested choice for small-scale DME/methanol synthesis [Haldor Topsøe, 2010-4] [Haldor Topsøe, 2010-5]. The complex mechanical design of the BWR, limits the maximum size of the reactor, which is why large scale plants require several reactors in parallel81
. Very large scale plants therefore often use one of the following reactor types.
Slurry/liquid phase reactors The slurry/liquid phase reactors are isothermal reactors like the BWR. Two types exists: The slurry phase reactor developed by JFE [Yagi et al., 2010] and the liquid phase reactor developed by Air Products and Chemicals [Hansen et al., 2008] [Larson et al., 2009-1]. The difference between the BWR and the slurry/liquid phase reactor is that this type of reactor suspends the solid catalyst in an inert oil, in order to ensure optimal temperature control and to avoid overheating of the catalyst material (Figure V.3).
Figure V.3. A sketch of a liquid/slurry phase reactor (this particular illustration is of the liquid phase reactor) [Larson et al., 2009-1]. The liquid phase reactor is available for commercial scale Fischer-Tropsch synthesis and has been demonstrated at commercial scale for methanol synthesis and at pilot scale for DME synthesis [Larson et al., 2009-1]. The slurry phase reactor has been demonstrated at small scale for DME synthesis (100 tons/day of DME ~ 33 MWth of DME) [Yagi et al., 2010]. This type of reactor is especially well suited for a syngas with a high CO content (DME synthesis) [Hansen et al., 2008].
81 Maximum capacity for a single line plant: 1800 ton/day of methanol ~ 400 MWth of methanol [Hansen et al., 2008]. The same capacity is expected for DME. However, in [KOGAS, 2009] a 3000 ton/day DME plant is expected to have four reactors (~250 MWth of DME per reactor).

263
The liquid/slurry phase reactor is a more complex design than the BWR, which is why the investment cost is expected to be greater for the same syngas throughput. However, because a slurry/liquid phase reactor can be scaled to higher capacities than the BWR, this type of reactor is the only alternative to fixed bed adiabatic reactors for very large scale plants [Hansen et al., 2008] (the reference is about methanol synthesis). The fixed bed reactors are however not very suited for DME synthesis (see below), which is why for very large scale DME synthesis plants, the liquid/slurry phase reactor seem to be the optimal choice. Fixed bed adiabatic reactors Adiabatic reactors are - as the name implies - not isothermal, which is why the heat generated by the synthesis must be removed by cooling the product gas stream. Typically medium pressure steam is generated when cooling the product gas stream, but preheating of the syngas before the reactor can also be done. Synthesis of methanol with fixed bed adiabatic reactors normally comprises 2-4 reactors in series with cooling in between [Haldor Topsøe, 2010-7] (Figure V.4).
Figure V.4. Methanol synthesis loop with three adiabatic reactors [Hansen et al., 2008]. The “makeup gas” is the syngas. The figure shows that the product gas from the last reactor is first cooled until methanol condenses, then the liquid is separated from the unconverted syngas and most of this gas is recirculated to the first reactor. The final stage seen here is a topping column; separating the absorbed gasses from the crude methanol. In Figure V.5, the conversion profile for methanol synthesis by three adiabatic reactors in series can be seen. The figure shows how the conversion is limited by equilibrium (the

264
equilibrium curve). By comparing the temperature increase in each reactor it can be seen that most of the methanol is generated in the first reactor and the least in the last reactor, which is why the benefit of adding an extra reactor is small. Figure V.5 can also be seen as the temperature profile through the reactors.
Figure V.5. Conversion profile and equilibrium curve for methanol synthesis in three adiabatic reactors in series (Figure V.4). Modified from [Hansen et al., 2008]. The bottom of the conversion profile corresponds to the inlet to the first reactor (low methanol content). The top of the conversion profile corresponds to the outlet of the third reactor (high methanol content). Between each reactor the gas is cooled (Figure V.4). In order to limit the temperature rise in the adiabatic reactors, the CO content in the syngas entering the first reactor is limited to 10–15 vol%. This is done by recycling H2-rich unconverted syngas to the reactor (meaning that the syngas supplied to the synthesis loop also contains excess H2) [Larson et al., 2009-1]. Because optimal DME synthesis requires a H2/CO ratio of 1 (~50 vol% CO) the use of adiabatic fixed bed reactors is not considered optimal for DME synthesis. If they were used for DME synthesis, the production of methanol and water would increase dramatically (Figure 2.7, 15 vol% H2 ~ H2/CO = 5). The syngas supplied to the synthesis loop would also need to have a H2/CO ratio approaching 2 (or maybe even above 2), meaning that gas from an entrained flow gasifier would have to be conditioned further (H2/CO < 1 for gas from an entrained flow gasifier. Syngas used in an isothermal reactor can have a H2/CO ratio of 1). Because the CO content is limited by recycling H2-rich unconverted syngas, this type of reactor is also not optimal for once-through synthesis. The adiabatic reactor system can be scaled up to single-line capacities of 10,000 MTPD (metric tons per day) of methanol, corresponding to 2.3 GWth of methanol [Hansen et al., 2008].
Equilibrium curve MeO
H c
onte
nt

265
An adiabatic reactor is also used in commercial DME production, where liquid and purified methanol is dehydrated to DME in an adiabatic reactor (Figure V.6). The use of an adiabatic reactor is possible because the dehydration reaction is only moderately exothermic (reaction (9)). DME production based on product methanol is referred to as a two-step DME production process. DME production directly from a syngas can however also be done by using an adiabatic reactor as seen in Figure V.7. In this process by Haldor Topsøe, the adiabatic reactor is used for dehydrating a methanol rich gas, produced in a conventional methanol reactor. This process is very similar to a methanol synthesis process, in the sense that a syngas with a H2/CO ratio of 2 is required, and that the conversion per pass of the reactors is low (compared to DME synthesis in a single reactor). It is unknown if this process is used commercially, but it is assumed to be commercially available. In a review of the DME market and technology there is a reference to a one-step DME synthesis process available from Haldor Topsøe for large-scale production based on natural gas [CHEMSYSTEMS, 2008]. It is unknown if this reference is to the concept seen in Figure V.7, or to a concept based on direct DME synthesis in BWR reactors.
Figure V.6. Flow sheet for DME synthesis by dehydration of product methanol [Haldor Topsøe, 2010-9]. Process description (the flow sheet does not show all the processes): First methanol is evaporated, and then it is dehydrated to DME in an adiabatic reactor. The product gas is cooled until condensation and then sent to the DME column. In the DME column methanol/water leaves at the bottom, DME from the side and gaseous products (~CO2, H2, CO) from the top. In the last column, water is separated from methanol. The methanol from the last column is recycled. This is the process used commercially for DME production.

266
Figure V.7. The “hybrid” DME synthesis process by Haldor Topsøe. Modified from [Haldor Topsøe, 2001]. The first reactor is a BWR where methanol is produced. The second reactor is an adiabatic reactor for the dehydration of methanol to DME.
Syngas
Product gas

267
Appendix W. By-product formation in DME/methanol synthesis
When producing DME/methanol by catalytic conversion some by-products will be formed. However, commercial methanol catalysts can have a selectivity for methanol above 99.9% [Hansen et al., 2008]. The by-products that are formed in methanol synthesis (and presumably DME synthesis) are:
• Higher alcohols, predominantly ethanol, butanols and propanols • Esters, notably methyl formate and methyl acetate • Ethers, especially dimethyl ether (for methanol synthesis) • Ketones, mainly acetone and methyl ethyl ketone • Hydrocarbons such as normal paraffins • Minute amounts of acids and aldehyde
[Hansen et al., 2008] As seen from Table W.1, the dominant by-product formed is higher alcohols – with ethanol being the dominant higher alcohol. Table W.1 also shows that by-product formation is lower for a CO2 rich syngas. This is because by-product formation is inhibited by water (3 H2 + CO2 -> CH3OH + H2O) [Hansen et al., 2008]. The by-product formation given for the “CO-rich” syngas would be most applicable for the type of synthesis done in this study. However, since by-product formation is typically increased with increasing temperature, the by-product formation given for the “CO-rich” syngas is expected to be an upper limit (at 295°C) – also when recalling that a selectivity for methanol above 99.9% was typical. If fuel grade DME/methanol is produced, the requirements for product purity is lower than for chemical grade DME/methanol (grade AA), which is why by-product formation is less important (Table Y.2 and Table Y.3).
Table W.1. By-product formation in methanol synthesis for two different syngasses [Hansen et al., 2008]. It is assumed that the syngas used for the experiments only contained H2, CO and CO2.

268
Appendix X. Fractional distillation
Figure X.1. Flow sheet of a fractional distillation column. The horizontal lines in the column symbolize the trays or stages. A distillation column is used to separate two or more components: The component with the lowest evaporation temperature will leave as the overhead product, while the component with the highest evaporation temperature will leave as the bottom product. Basic process description: If the feed to the column is a mixture of liquid and vapor, the liquid part will run downwards while the vapor part will rise upwards. In the bottom of the column a part of the liquid stream will be evaporated in the reboiler and returned to the column, while the rest of the liquid is the bottom product. In the top of the column the vapor leaving the column will be condensed and some of this will be returned to the column and the rest will be the overhead product. Often the overhead product is extracted before the condenser as a gaseous product. The reboiler and the condenser creates a counter flow of liquid and vapor in the column, and ideally the vapor phase and the liquid phase will be in equilibrium on each tray, meaning that the vapor leaving a tray will contain more of the components with low evaporation temperature and the liquid leaving a tray will contain more of the components with high evaporation temperature. In this way the components with low evaporation temperature will be concentrated in the top of the column while the components with high evaporation temperature will be concentrated in the bottom of the column. Because of this, the temperature will also be highest in the bottom of the column and lowest in the top of the column. The heat needed to evaporate the liquid in the reboiler will therefore often be delivered by condensation of steam, while cooling water or a refrigeration system often is used to remove heat from the condenser. By controlling the distillation pressure, the distillation temperatures can be changed: Higher pressure results in higher temperatures. In this way the heat from a condenser at high pressure can be used by a reboiler at low pressure (connected to another distillation column). If methanol is distilled in three columns this concept is used (the condenser heat from the topping column is used as reboiler heat in the second column).
Reboiler
Bottom product
Condenser
Overhead product
Feed Side product

269
Appendix Y. Purity requirements for DME/methanol products
The purity requirements for DME/methanol can be seen in Table Y.1 and Table Y.2 for methanol, and in Table Y.3 for DME. Both Table Y.1 and Table Y.2 include grade AA methanol, but there are slight differences in the defined impurities and the values given. Grade AA is the typical chemical grade methanol, and will be ~99.9 mass% methanol. Fuel grade methanol, defined as a blending component for gasoline, will have an even lower water content than grade AA (Table Y.2). Chemical grade DME is 99.9 mass% DME [RENEW, 2008] (no list of impurity specifications found), while the purity requirements for fuel grade DME (fuel for vehicles) are lower (Table Y.3). The requirements listed in Table Y.3 are however only proposed values. The reference for Table Y.3 is from July 2008, and writes that an ISO standard for fuel grade DME is under preparation – it is assumed that this is still the case (the standard has not been found).
Table Y.1. Specification of different methanol products [Hansen et al., 2008].
Table Y.2. Specification of different methanol products [Uhde, 2010]. Fuel grade methanol is here defined as a blending component for gasoline.
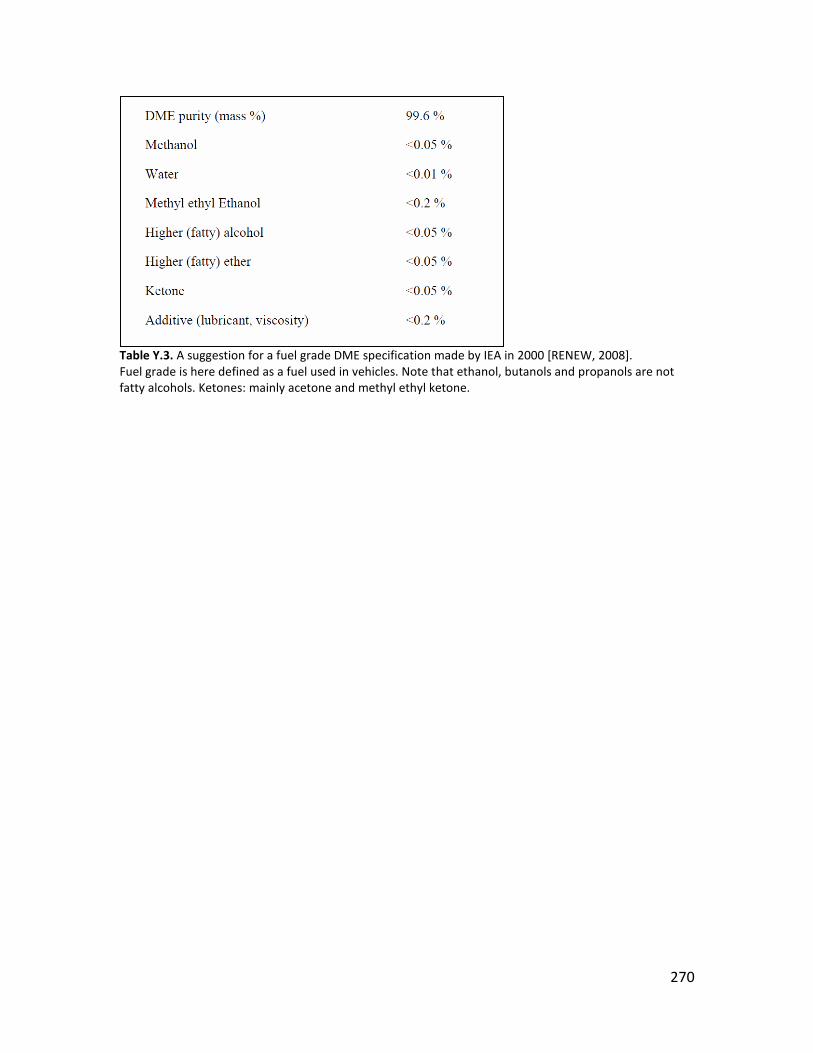
270
Table Y.3. A suggestion for a fuel grade DME specification made by IEA in 2000 [RENEW, 2008]. Fuel grade is here defined as a fuel used in vehicles. Note that ethanol, butanols and propanols are not fatty alcohols. Ketones: mainly acetone and methyl ethyl ketone.

271
Appendix Z. DNA code for the two-stage gasification of wood chips
The following contains:
• The DNA code used in the small-scale methanol plant (4 pages) • The results from DNA for the above code (3 pages) • The DNA code used in the small-scale DME plant (3 pages) • The results from DNA for the above code (3 pages)

2_stage_gasifier_meoh.dnac:/Documents and Settings/lacl/My Documents/DTU/ph.d/fagligt/DNA/for aspen/2 stage gas
1/411−01−2011
C ~~~~~~~~~~~~~~~~~~~~~~~~~~~~~~~~~~~~~~~~~~~~~~~~~~~~~~~~~~~~~~~~~~~~~~~~~~~~~~~~~~~~~~~~~~~~~~~~~C ~~ This is an auto−generated file containing a DNA model with updated initial guesses. C ~~ The file will be over−written by next DNA run.C ~~~~~~~~~~~~~~~~~~~~~~~~~~~~~~~~~~~~~~~~~~~~~~~~~~~~~~~~~~~~~~~~~~~~~~~~~~~~~~~~~~~~~~~~~~~~~~~~~title Two−Stage Gasifier for methanol plant media 1 Wood 2 DryWoodmedia 74 STANDARD_AIR 3 syngas 99 Ash solid Wood C 0.488 H .062 O .439 S .0002 N 0.0017 ASH .0091+ LHV 18280 CP 1.35 MOI 0.425 struc Dryer DRYER_04 1 64 2 61 301 0.02 0addco m Dryer 1 4.757 t Dryer 1 15 p 1 1.013addco p 2 1.013 t Dryer 2 115 t Dryer 61 115addco q Dryer 301 0
C splitter2: splitter with a variable number of nodes (4) − one input (61) C and three outputs (65,67,68). The pressure in node 65 is set to equal theC pressure in 61 struc splitter2 splitter2 4 61 65 67 68addco p 68 1 struc dampveksler heatsrc0 67 64 303 0addco t dampveksler 64 200 struc pyro−damp heatsrc0 65 66 302 0addco t pyro−damp 66 630
C GASIFI_3_VENZIN: Variable constitution parameter: Number of calculated gas components 8C Nodes: Inlet fuel 2; inlet water 66; inlet air 74; outlet syngas 3,C outlet ash 99, heat loss 305, heat input (pyrolysis) 302C Integer Parameters: Calculated gas compounds: H2 (1), N2 (3), CO (4),C CO2 (6), H2O (7), H2S (9), CH4 (11), Ar (36)C Real parameter: Pressure 0.998 bar, Eq. temperature 750 degC, C Pressure loss 0.005 bar, non−equilibrium methane 0.0067 mole%C The heat input in the pyrolysis in the Two−Stage Gasifier is modeled byC having a heat input to the gasifier (302)struc Gasifier GASIFI_3_VENZIN 8 2 66 74 3 99 305 302 /1 3 4 6 7 9 11 36 0.998 750 0.005 0.0067addco t Gasifier 3 730 t Gasifier 99 730addco p 99 1.013addco ZA Gasifier 11 0.99 {carbon conversion factor 0.99}addco ZA Gasifier 17 0.03 {heat loss, % of input LHV} struc splitter3 splitter2 3 3 44 55 struc syngas−pyro heatsnk0 44 4 302 0addco q syngas−pyro 302 −4870 struc air_preheat heatex_2 55 4 73 74 306 30 0 0addco q air_preheat 306 0addco t air_preheat 73 15 t air_preheat 4 80 C SET_X2: component that sets a control variableC (ZC 900) equal to the molefraction of the gas component C specified (first parameter = PAR1 = 1), divided by a C factor specified (second parameter = PAR2 = 2).C First parameter = PAR1: gas component (1 is H2)C Second parameter = PAR2: factorC ZC = Y_J (PAR1) / PAR2 struc set−X_H2 SET_X2 4 5 900 1 2
C SET_X: component that sets a control variableC (ZC 900) equal to the molefraction of the gas component C specified (first parameter = PAR1 = 1).C First parameter = PAR1: gas component (4 is CO)C ZC = Y_J (PAR1) struc set−X_CO SET_X 5 6 900 4 C ~~~~~~~~~~~~~~~~~~~~~~~~~~~~~~~~~~~~~~~~~~~~~~~~~~~~~~~~~~~~~~~~~~~~~~~~~~~~~~~~~~~~~~~~~~~~~~~~~C ~~ Start of list of generated initial guesses.C ~~ The values are the results of the latest simulation.C ~~~~~~~~~~~~~~~~~~~~~~~~~~~~~~~~~~~~~~~~~~~~~~~~~~~~~~~~~~~~~~~~~~~~~~~~~~~~~~~~~~~~~~~~~~~~~~~~~

2_stage_gasifier_meoh.dnac:/Documents and Settings/lacl/My Documents/DTU/ph.d/fagligt/DNA/for aspen/2 stage gas
2/411−01−2011
START P 1 0.1013000000000004E+01 {~~}START H Dryer 1 −0.9793313062183990E+04 {~~}START M Dryer 64 0.3307244248999589E+02 {~~}START P 64 0.1003000000000004E+01 {~~}START H Dryer 64 −0.1309561789902113E+05 {~~}START M Dryer 2 −0.2791096938775520E+01 {~~}START P 2 0.1013000000000004E+01 {~~}START H Dryer 2 −0.5345738679896153E+04 {~~}START M Dryer 61 −0.3503834555122038E+02 {~~}START P 61 0.1003000000000004E+01 {~~}START H Dryer 61 −0.1326462131406221E+05 {~~}START Q Dryer 301 0.0000000000000000E+00 {~~}START ZA Dryer 1 0.5589355724558814E+04 {~~}START X_J DryWood H2 0.6076000000000024E−01 {~~}START X_J DryWood O2 0.4302200000000016E+00 {~~}START X_J DryWood N2 0.1666000000000007E−02 {~~}START X_J DryWood CO 0.0000000000000000E+00 {~~}START X_J DryWood NO 0.0000000000000000E+00 {~~}START X_J DryWood CO2 0.0000000000000000E+00 {~~}START X_J DryWood H2O−L 0.2000000000000007E−01 {~~}START X_J DryWood NH3 0.0000000000000000E+00 {~~}START X_J DryWood H2S 0.0000000000000000E+00 {~~}START X_J DryWood SO2 0.0000000000000000E+00 {~~}START X_J DryWood CH4 0.0000000000000000E+00 {~~}START X_J DryWood C2H6 0.0000000000000000E+00 {~~}START X_J DryWood C3H8 0.0000000000000000E+00 {~~}START X_J DryWood C4H10−N 0.0000000000000000E+00 {~~}START X_J DryWood C4H10−I 0.0000000000000000E+00 {~~}START X_J DryWood C5H12 0.0000000000000000E+00 {~~}START X_J DryWood C6H14 0.0000000000000000E+00 {~~}START X_J DryWood C7H16 0.0000000000000000E+00 {~~}START X_J DryWood C8H18 0.0000000000000000E+00 {~~}START X_J DryWood C2H4 0.0000000000000000E+00 {~~}START X_J DryWood C3H6 0.0000000000000000E+00 {~~}START X_J DryWood C5H10 0.0000000000000000E+00 {~~}START X_J DryWood C6H12−1 0.0000000000000000E+00 {~~}START X_J DryWood C7H14 0.0000000000000000E+00 {~~}START X_J DryWood C2H2 0.0000000000000000E+00 {~~}START X_J DryWood C6H6 0.0000000000000000E+00 {~~}START X_J DryWood C6H12−C 0.0000000000000000E+00 {~~}START X_J DryWood C 0.4782400000000017E+00 {~~}START X_J DryWood S 0.1960000000000007E−03 {~~}START X_J DryWood NO2 0.0000000000000000E+00 {~~}START X_J DryWood HCN 0.0000000000000000E+00 {~~}START X_J DryWood COS 0.0000000000000000E+00 {~~}START X_J DryWood N2O 0.0000000000000000E+00 {~~}START X_J DryWood NO3 0.0000000000000000E+00 {~~}START X_J DryWood SO3 0.0000000000000000E+00 {~~}START X_J DryWood AR 0.0000000000000000E+00 {~~}START X_J DryWood ASH 0.8918000000000035E−02 {~~}START X_J DryWood TAR 0.0000000000000000E+00 {~~}START M splitter2 61 0.3503834555122038E+02 {~~}START H splitter2 61 −0.1326462131406221E+05 {~~}START M splitter2 65 −0.1955886891723041E+01 {~~}START P 65 0.1003000000000004E+01 {~~}START H splitter2 65 −0.1326462131406221E+05 {~~}START M splitter2 67 −0.3307244248999589E+02 {~~}START P 67 0.1003000000000004E+01 {~~}START H splitter2 67 −0.1326462131406221E+05 {~~}START M splitter2 68 −0.1001616950145485E−01 {~~}START P 68 0.1000000000000004E+01 {~~}START H splitter2 68 −0.1326462131406221E+05 {~~}START M dampveksler 67 0.3307244248999589E+02 {~~}START H dampveksler 67 −0.1326462131406221E+05 {~~}START M dampveksler 64 −0.3307244248999589E+02 {~~}START H dampveksler 64 −0.1309561789902113E+05 {~~}START Q dampveksler 303 0.5589355724558829E+04 {~~}START M pyro−damp 65 0.1955886891723041E+01 {~~}START H pyro−damp 65 −0.1326462131406221E+05 {~~}START M pyro−damp 66 −0.1955886891723041E+01 {~~}START P 66 0.1003000000000004E+01 {~~}START H pyro−damp 66 −0.1219910204708110E+05 {~~}START Q pyro−damp 302 0.2084035167166692E+04 {~~}START M Gasifier 2 0.2791096938775520E+01 {~~}START H Gasifier 2 −0.5345738679896153E+04 {~~}START M Gasifier 66 0.1955886891723041E+01 {~~}START H Gasifier 66 −0.1219910204708110E+05 {~~}START M Gasifier 74 0.3126551298199623E+01 {~~}
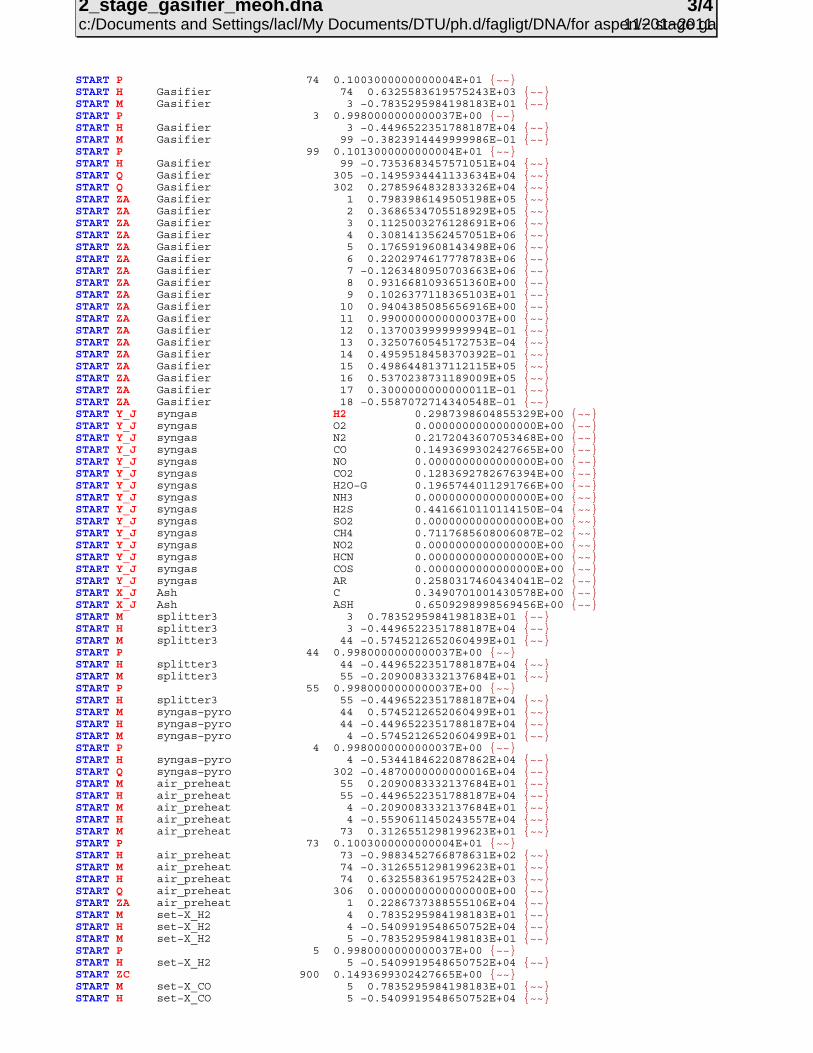
2_stage_gasifier_meoh.dnac:/Documents and Settings/lacl/My Documents/DTU/ph.d/fagligt/DNA/for aspen/2 stage gas
3/411−01−2011
START P 74 0.1003000000000004E+01 {~~}START H Gasifier 74 0.6325583619575243E+03 {~~}START M Gasifier 3 −0.7835295984198183E+01 {~~}START P 3 0.9980000000000037E+00 {~~}START H Gasifier 3 −0.4496522351788187E+04 {~~}START M Gasifier 99 −0.3823914449999986E−01 {~~}START P 99 0.1013000000000004E+01 {~~}START H Gasifier 99 −0.7353683457571051E+04 {~~}START Q Gasifier 305 −0.1495934441133634E+04 {~~}START Q Gasifier 302 0.2785964832833326E+04 {~~}START ZA Gasifier 1 0.7983986149505198E+05 {~~}START ZA Gasifier 2 0.3686534705518929E+05 {~~}START ZA Gasifier 3 0.1125003276128691E+06 {~~}START ZA Gasifier 4 0.3081413562457051E+06 {~~}START ZA Gasifier 5 0.1765919608143498E+06 {~~}START ZA Gasifier 6 0.2202974617778783E+06 {~~}START ZA Gasifier 7 −0.1263480950703663E+06 {~~}START ZA Gasifier 8 0.9316681093651360E+00 {~~}START ZA Gasifier 9 0.1026377118365103E+01 {~~}START ZA Gasifier 10 0.9404385085656916E+00 {~~}START ZA Gasifier 11 0.9900000000000037E+00 {~~}START ZA Gasifier 12 0.1370039999999994E−01 {~~}START ZA Gasifier 13 0.3250760545172753E−04 {~~}START ZA Gasifier 14 0.4959518458370392E−01 {~~}START ZA Gasifier 15 0.4986448137112115E+05 {~~}START ZA Gasifier 16 0.5370238731189009E+05 {~~}START ZA Gasifier 17 0.3000000000000011E−01 {~~}START ZA Gasifier 18 −0.5587072714340548E−01 {~~}START Y_J syngas H2 0.2987398604855329E+00 {~~}START Y_J syngas O2 0.0000000000000000E+00 {~~}START Y_J syngas N2 0.2172043607053468E+00 {~~}START Y_J syngas CO 0.1493699302427665E+00 {~~}START Y_J syngas NO 0.0000000000000000E+00 {~~}START Y_J syngas CO2 0.1283692782676394E+00 {~~}START Y_J syngas H2O−G 0.1965744011291766E+00 {~~}START Y_J syngas NH3 0.0000000000000000E+00 {~~}START Y_J syngas H2S 0.4416610110114150E−04 {~~}START Y_J syngas SO2 0.0000000000000000E+00 {~~}START Y_J syngas CH4 0.7117685608006087E−02 {~~}START Y_J syngas NO2 0.0000000000000000E+00 {~~}START Y_J syngas HCN 0.0000000000000000E+00 {~~}START Y_J syngas COS 0.0000000000000000E+00 {~~}START Y_J syngas AR 0.2580317460434041E−02 {~~}START X_J Ash C 0.3490701001430578E+00 {~~}START X_J Ash ASH 0.6509298998569456E+00 {~~}START M splitter3 3 0.7835295984198183E+01 {~~}START H splitter3 3 −0.4496522351788187E+04 {~~}START M splitter3 44 −0.5745212652060499E+01 {~~}START P 44 0.9980000000000037E+00 {~~}START H splitter3 44 −0.4496522351788187E+04 {~~}START M splitter3 55 −0.2090083332137684E+01 {~~}START P 55 0.9980000000000037E+00 {~~}START H splitter3 55 −0.4496522351788187E+04 {~~}START M syngas−pyro 44 0.5745212652060499E+01 {~~}START H syngas−pyro 44 −0.4496522351788187E+04 {~~}START M syngas−pyro 4 −0.5745212652060499E+01 {~~}START P 4 0.9980000000000037E+00 {~~}START H syngas−pyro 4 −0.5344184622087862E+04 {~~}START Q syngas−pyro 302 −0.4870000000000016E+04 {~~}START M air_preheat 55 0.2090083332137684E+01 {~~}START H air_preheat 55 −0.4496522351788187E+04 {~~}START M air_preheat 4 −0.2090083332137684E+01 {~~}START H air_preheat 4 −0.5590611450243557E+04 {~~}START M air_preheat 73 0.3126551298199623E+01 {~~}START P 73 0.1003000000000004E+01 {~~}START H air_preheat 73 −0.9883452766878631E+02 {~~}START M air_preheat 74 −0.3126551298199623E+01 {~~}START H air_preheat 74 0.6325583619575242E+03 {~~}START Q air_preheat 306 0.0000000000000000E+00 {~~}START ZA air_preheat 1 0.2286737388555106E+04 {~~}START M set−X_H2 4 0.7835295984198183E+01 {~~}START H set−X_H2 4 −0.5409919548650752E+04 {~~}START M set−X_H2 5 −0.7835295984198183E+01 {~~}START P 5 0.9980000000000037E+00 {~~}START H set−X_H2 5 −0.5409919548650752E+04 {~~}START ZC 900 0.1493699302427665E+00 {~~}START M set−X_CO 5 0.7835295984198183E+01 {~~}START H set−X_CO 5 −0.5409919548650752E+04 {~~}

2_stage_gasifier_meoh.dnac:/Documents and Settings/lacl/My Documents/DTU/ph.d/fagligt/DNA/for aspen/2 stage gas
4/411−01−2011
START M set−X_CO 6 −0.7835295984198183E+01 {~~}START P 6 0.9980000000000037E+00 {~~}START H set−X_CO 6 −0.5409919548650752E+04 {~~}C ~~~~~~~~~~~~~~~~~~~~~~~~~~~~~~~~~~~~~~~~~~~~~~~~~~~~~~~~~~~~~~~~~~~~~~~~~~~~~~~~~~~~~~~~~~~~~~~~~C ~~ End of generated initial guesses.C ~~~~~~~~~~~~~~~~~~~~~~~~~~~~~~~~~~~~~~~~~~~~~~~~~~~~~~~~~~~~~~~~~~~~~~~~~~~~~~~~~~~~~~~~~~~~~~~~~

2_stage_gasifier_meoh.stac:/Documents and Settings/lacl/My Documents/DTU/ph.d/fagligt/DNA/for aspen/2 stage gas
1/311−01−2011
Two−Stage Gasifier for methanol plant RUN NUMBER 1 ALGEBRAIC VARIABLES NO | TO | MEDIA | M | T | P | H | ENERGY | X | S | V | U | DE | COMPONENT | | [kg/s] | [C] | [bar] | [kJ/kg] | [kJ/s] | | [kJ/kg K] | [m3/kg] | [kJ/kg] | −−−−−−−−−−−−−−−−−−−−−−−−−−−−−−−−−−−−−−−−−−−−−−−−−−−−−−−−−−−−−−−−−−−−−−−−−−−−−−−−−−−−−−−−−−−−−−−−−−−−−−−−−−−−−−−−−−−−−−−−−−−−−−−−− 1 |Dryer |Wood | 4.76 | 15.00 | − | −9793.3 | 4.506E+04 | − | 0.3622 | − | −9793.3| 64 |Dryer |STEAM−HF | 33.07 | 200.00 | 1.003 | −13095.6 | | − | 11.3500 | 2.1660 | −13312.9| 2 |Dryer |DryWood | −2.79 | 115.00 | − | −5345.7 | | − | 1.4138 | − | −5345.7| 61 |Dryer |STEAM−HF | −35.04 | 114.99 | 1.003 | −13264.6 | | − | 10.9561 | 1.7637 | −13441.5| 301 |Dryer |HEAT | | | | | 0.000E+00 | | | | | 61 |splitter2 |STEAM−HF | 35.04 | 114.99 | 1.003 | −13264.6 | | − | 10.9561 | 1.7637 | −13441.5| 65 |splitter2 |STEAM−HF | −1.96 | 114.99 | 1.003 | −13264.6 | | − | 10.9561 | 1.7637 | −13441.5| 67 |splitter2 |STEAM−HF | −33.07 | 114.99 | 1.003 | −13264.6 | | − | 10.9561 | 1.7637 | −13441.5| 68 |splitter2 |STEAM−HF | −0.01 | 114.98 | 1.000 | −13264.6 | | − | 10.9575 | 1.7690 | −13441.5| 67 |dampveksler |STEAM−HF | 33.07 | 114.99 | 1.003 | −13264.6 | | − | 10.9561 | 1.7637 | −13441.5| 64 |dampveksler |STEAM−HF | −33.07 | 200.00 | 1.003 | −13095.6 | | − | 11.3500 | 2.1660 | −13312.9| 303 |dampveksler |HEAT | | | | | 5.589E+03 | | | | | 65 |pyro−damp |STEAM−HF | 1.96 | 114.99 | 1.003 | −13264.6 | | − | 10.9561 | 1.7637 | −13441.5| 66 |pyro−damp |STEAM−HF | −1.96 | 630.00 | 1.003 | −12199.1 | | − | 12.6890 | 4.1541 | −12615.8| 302 |pyro−damp |HEAT | | | | | 2.084E+03 | | | | | 2 |Gasifier |DryWood | 2.79 | 115.00 | − | −5345.7 | | − | 1.4138 | − | −5345.7| 66 |Gasifier |STEAM−HF | 1.96 | 630.00 | 1.003 | −12199.1 | | − | 12.6890 | 4.1541 | −12615.8| 74 |Gasifier |STANDARD_AIR | 3.13 | 700.00 | 1.003 | 632.6 | | − | 8.1509 | 2.7957 | 352.2| 3 |Gasifier |syngas | −7.84 | 730.00 | 0.998 | −4496.5 | | − | 11.3572 | 4.1207 | −4907.8| 99 |Gasifier |Ash | −0.04 | 730.00 | − | −7353.7 | | − | 1.2710 | − | −7353.7| 305 |Gasifier |HEAT | | | | | −1.496E+03 | | | | | 302 |Gasifier |HEAT | | | | | 2.786E+03 | | | | | 3 |splitter3 |syngas | 7.84 | 730.00 | 0.998 | −4496.5 | | − | 11.3572 | 4.1207 | −4907.8| 44 |splitter3 |syngas | −5.75 | 730.00 | 0.998 | −4496.5 | | − | 11.3572 | 4.1207 | −4907.8| 55 |splitter3 |syngas | −2.09 | 730.00 | 0.998 | −4496.5 | | − | 11.3572 | 4.1207 | −4907.8| 44 |syngas−pyro |syngas | 5.75 | 730.00 | 0.998 | −4496.5 | | − | 11.3572 | 4.1207 | −4907.8| 4 |syngas−pyro |syngas | −5.75 | 235.81 | 0.998 | −5344.2 | | − | 10.2010 | 2.0907 | −5552.8| 302 |syngas−pyro |HEAT | | | | | −4.870E+03 | | | | | 55 |air_preheat |syngas | 2.09 | 730.00 | 0.998 | −4496.5 | | − | 11.3572 | 4.1207 | −4907.8| 4 |air_preheat |syngas | −2.09 | 80.00 | 0.998 | −5590.6 | | − | 9.6237 | 1.4506 | −5735.4| 73 |air_preheat |STANDARD_AIR | 3.13 | 15.00 | 1.003 | −98.8 | | − | 6.8682 | 0.8278 | −181.9| 74 |air_preheat |STANDARD_AIR | −3.13 | 700.00 | 1.003 | 632.6 | | − | 8.1509 | 2.7957 | 352.2| 306 |air_preheat |HEAT | | | | | 0.000E+00 | | | | | 4 |set−X_H2 |syngas | 7.84 | 194.86 | 0.998 | −5409.9 | | − | 10.0664 | 1.9225 | −5601.8| 5 |set−X_H2 |syngas | −7.84 | 194.86 | 0.998 | −5409.9 | | − | 10.0664 | 1.9225 | −5601.8| 5 |set−X_CO |syngas | 7.84 | 194.86 | 0.998 | −5409.9 | | − | 10.0664 | 1.9225 | −5601.8| 6 |set−X_CO |syngas | −7.84 | 194.86 | 0.998 | −5409.9 | | − | 10.0664 | 1.9225 | −5601.8| −−−−−−−−−−−−−−−−−−−−−−−−−−−−−−−−−−−−−−−−−−−−−−−−−−−−−−−−−−−−−−−−−−−−−−−−−−−−−−−−−−−−−−−−−−−−−−−−−−−−−−−−−−−−−−−−−−−−−−−−−−−−−−−−− FUEL CONSUMPTION (LHV) = 50652.0992 kJ/s FUEL CONSUMPTION (HHV) = 59291.7430 kJ/s HEAT CONSUMPTION = 5589.3557kJ/s TOTAL HEAT CONSUMPTION = 50652.0992kJ/s MAXIMUM RELATIVE ERROR = 6.1058E−13

2_stage_gasifier_meoh.stac:/Documents and Settings/lacl/My Documents/DTU/ph.d/fagligt/DNA/for aspen/2 stage gas
2/311−01−2011
COMPUTER ACCURACY = 2.2204E−16 IDEAL GAS COMPOSITION (MOLAR BASE): |STANDARD_AIR|syngas | −−−−−−−−−−−−−−−−−−−−−−−−−−−−−−−−−−−−−−−−−−− HYDROGEN | 0.0000E+00 | 0.2987E+00 | OXYGEN | 0.2075E+00 | 0.0000E+00 | NITROGEN | 0.7729E+00 | 0.2172E+00 | CARBON MONOXIDE | 0.0000E+00 | 0.1494E+00 | CARBON DIOXIDE | 0.3000E−03 | 0.1284E+00 | WATER (I.G.) | 0.1010E−01 | 0.1966E+00 | HYDROGEN SULFIDE| 0.0000E+00 | 0.4417E−04 | METHANE | 0.0000E+00 | 0.7118E−02 | ARGON | 0.9200E−02 | 0.2580E−02 | −−−−−−−−−−−−−−−−−−−−−−−−−−−−−−−−−−−−−−−−−−− MEAN MOLE MASS| 0.2885E+02 | 0.2028E+02 | NET CALORI VALUE| 0.0000E+00 | 0.5929E+04 | GRS CALORI VALUE| 0.0000E+00 | 0.7035E+04 | −−−−−−−−−−−−−−−−−−−−−−−−−−−−−−−−−−−−−−−−−−− NON−IDEAL FLUID AND SOLID COMPOSITION (MASS BASE): |Wood |DryWood |Ash | −−−−−−−−−−−−−−−−−−−−−−−−−−−−−−−−−−−−−−−−−−−−−−−−−−−−−−−− HYDROGEN | 0.3565E−01 | 0.6076E−01 | 0.0000E+00 | OXYGEN | 0.2524E+00 | 0.4302E+00 | 0.0000E+00 | NITROGEN | 0.9775E−03 | 0.1666E−02 | 0.0000E+00 | CARBON (SOLID) | 0.2806E+00 | 0.4782E+00 | 0.3491E+00 | SULFUR (SOLID) | 0.1150E−03 | 0.1960E−03 | 0.0000E+00 | WATER (LIQUID) | 0.4250E+00 | 0.2000E−01 | 0.0000E+00 | ASHES | 0.5233E−02 | 0.8918E−02 | 0.6509E+00 | −−−−−−−−−−−−−−−−−−−−−−−−−−−−−−−−−−−−−−−−−−−−−−−−−−−−−−−− MEAN MOLE MASS| 0.1377E+02 | 0.1181E+02 | 0.2658E+02 | NET CALORI VALUE| 0.9473E+04 | 0.1787E+05 | 0.1144E+05 | GRS CALORI VALUE| 0.1129E+05 | 0.1924E+05 | 0.1144E+05 | −−−−−−−−−−−−−−−−−−−−−−−−−−−−−−−−−−−−−−−−−−−−−−−−−−−−−−−− NUMBER OF CLOSED INTERNAL LOOPS IN THE SYSTEM: 0 SOLUTION FOR THE INDEPENDENT ALGEBRAIC VARIABLES : VARIABLE NO | COMPONENT | NAME | VALUE | −−−−−−−−−−−−−−−−−−−−−−−−−−−−−−−−−−−−−−−−−−−−−−−−−−−−− 1 |Dryer |Trans. heat | 0.5589E+04 | 1 |Gasifier |MULTIPLIER H| 0.7984E+05 | 2 |Gasifier |MULTIPLIER C| 0.3687E+05 |

2_stage_gasifier_meoh.stac:/Documents and Settings/lacl/My Documents/DTU/ph.d/fagligt/DNA/for aspen/2 stage gas
3/311−01−2011
3 |Gasifier |MULTIPLIER N| 0.1125E+06 | 4 |Gasifier |MULTIPLIER O| 0.3081E+06 | 5 |Gasifier |MLTIPLIER S | 0.1766E+06 | 6 |Gasifier |MULTIPL Ar | 0.2203E+06 | 7 |Gasifier |GIBBS ENERGY| −.1263E+06 | 8 |Gasifier |Cold eff LHV| 0.9317E+00 | 9 |Gasifier |Cold eff HHV| 0.1026E+01 | 10 |Gasifier |LHV eff C+g | 0.9404E+00 | 11 |Gasifier |Carbon conv | 0.9900E+00 | 12 |Gasifier |Ash/Solid | 0.1370E−01 | 13 |Gasifier |CO2 kmol in | 0.3251E−04 | 14 |Gasifier |CO2 kmol out| 0.4960E−01 | 15 |Gasifier |LHV fuel in | 0.4986E+05 | 16 |Gasifier |HHV fuel in | 0.5370E+05 | 17 |Gasifier |Q_1/LHV_f_in| 0.3000E−01 | 18 |Gasifier |Q_1/LHV_f_in| −.5587E−01 | 1 |air_preheat |Transferred | 0.2287E+04 | −−−−−−−−−−−−−−−−−−−−−−−−−−−−−−−−−−−−−−−−−−−−−−−−−−−−− SOLUTION FOR THE CONTROL VARIABLES : CONTROL NO | NODE NO | NAME | VALUE | −−−−−−−−−−−−−−−−−−−−−−−−−−−−−−−−−−−−−−−−−−−−−−−−−−−−−−−− 1 | 900 | −−−− | 0.1494E+00 | −−−−−−−−−−−−−−−−−−−−−−−−−−−−−−−−−−−−−−−−−−−−−−−−−−−−−−−− ======================================================================================================================== ########################################################################################################################

2_stage_gasifier_DME_new.dnac:/Documents and Settings/lacl/My Documents/DTU/ph.d/fagligt/DNA/for aspen/2 stage gas
1/311−01−2011
C ~~~~~~~~~~~~~~~~~~~~~~~~~~~~~~~~~~~~~~~~~~~~~~~~~~~~~~~~~~~~~~~~~~~~~~~~~~~~~~~~~~~~~~~~~~~~~~~~~C ~~ This is an auto−generated file containing a DNA model with updated initial guesses. C ~~ The file will be over−written by next DNA run.C ~~~~~~~~~~~~~~~~~~~~~~~~~~~~~~~~~~~~~~~~~~~~~~~~~~~~~~~~~~~~~~~~~~~~~~~~~~~~~~~~~~~~~~~~~~~~~~~~~title Two−Stage Gasifier for DME plant media 1 Wood 2 DryWoodmedia 74 STANDARD_AIR 3 syngas 99 Ash solid Wood C 0.488 H .062 O .439 S .0002 N 0.0017 ASH .0091+ LHV 18280 CP 1.35 MOI 0.425 struc Dryer DRYER_04 1 64 2 61 301 0.02 0addco m Dryer 1 4.757 t Dryer 1 15 p 1 1.013addco p 2 1.013 t Dryer 2 115 t Dryer 61 115addco q Dryer 301 0 C splitter2: splitter with a variable number of nodes (4) − one input (61) C and three outputs (65,67,68). The pressure in node 65 is set to equal theC pressure in 61 struc splitter2 splitter2 4 61 65 67 68addco p 68 1 m splitter2 68 −0.85 struc dampveksler heatsrc0 67 64 303 0addco t dampveksler 64 200 struc pyro−damp heatsrc0 65 66 302 0addco t pyro−damp 66 630 C GASIFI_3_VENZIN: Variable constitution parameter: Number of calculated gas components 8C Nodes: Inlet fuel 2; inlet water 66; inlet air 74; outlet syngas 3,C outlet ash 99, heat loss 305, heat input (pyrolysis) 302C Integer Parameters: Calculated gas compounds: H2 (1), N2 (3), CO (4),C CO2 (6), H2O (7), H2S (9), CH4 (11), Ar (36)C Real parameter: Pressure 0.998 bar, Eq. temperature 750 degC, C Pressure loss 0.005 bar, non−equilibrium methane 0.0067 mole%struc Gasifier GASIFI_3_VENZIN 8 2 66 74 3 99 305 302 /1 3 4 6 7 9 11 36 0.998 750 0.005 0.0067 addco t Gasifier 3 730addco t Gasifier 99 730addco p 99 1.013 addco ZA Gasifier 17 0.03 {heat loss, % of input LHV}addco ZA Gasifier 11 0.99 {carbon conversion factor 0.99}C The heat input in the pyrolysis in the Two−Stage Gasifier is modeled byC having a heat input to the gasifier (302, 2783 is from the model for theC gasifier in the methanol plant (acturally 2786))addco q Gasifier 302 2783 struc splitter3 splitter2 3 3 44 55 struc syngas−pyro heatsnk0 44 4 302 0 struc air_preheat heatex_2 55 4 73 74 306 30 0 0addco q air_preheat 306 0addco t air_preheat 73 15 t air_preheat 4 80
struc dummy ADDANODE 4 5 C ~~~~~~~~~~~~~~~~~~~~~~~~~~~~~~~~~~~~~~~~~~~~~~~~~~~~~~~~~~~~~~~~~~~~~~~~~~~~~~~~~~~~~~~~~~~~~~~~~C ~~ Start of list of generated initial guesses.C ~~ The values are the results of the latest simulation.C ~~~~~~~~~~~~~~~~~~~~~~~~~~~~~~~~~~~~~~~~~~~~~~~~~~~~~~~~~~~~~~~~~~~~~~~~~~~~~~~~~~~~~~~~~~~~~~~~~START P 1 0.1013000000000002E+01 {~~}START H Dryer 1 −0.9793313062183972E+04 {~~}START M Dryer 64 0.3307244248999583E+02 {~~}START P 64 0.1003000000000002E+01 {~~}START H Dryer 64 −0.1309561789902111E+05 {~~}START M Dryer 2 −0.2791096938775515E+01 {~~}START P 2 0.1013000000000002E+01 {~~}START H Dryer 2 −0.5345738679896143E+04 {~~}START M Dryer 61 −0.3503834555122032E+02 {~~}START P 61 0.1003000000000002E+01 {~~}START H Dryer 61 −0.1326462131406219E+05 {~~}START Q Dryer 301 0.0000000000000000E+00 {~~}

2_stage_gasifier_DME_new.dnac:/Documents and Settings/lacl/My Documents/DTU/ph.d/fagligt/DNA/for aspen/2 stage gas
2/311−01−2011
START ZA Dryer 1 0.5589355724558805E+04 {~~}START X_J DryWood H2 0.6076000000000013E−01 {~~}START X_J DryWood O2 0.4302200000000008E+00 {~~}START X_J DryWood N2 0.1666000000000004E−02 {~~}START X_J DryWood CO 0.0000000000000000E+00 {~~}START X_J DryWood NO 0.0000000000000000E+00 {~~}START X_J DryWood CO2 0.0000000000000000E+00 {~~}START X_J DryWood H2O−L 0.2000000000000004E−01 {~~}START X_J DryWood NH3 0.0000000000000000E+00 {~~}START X_J DryWood H2S 0.0000000000000000E+00 {~~}START X_J DryWood SO2 0.0000000000000000E+00 {~~}START X_J DryWood CH4 0.0000000000000000E+00 {~~}START X_J DryWood C2H6 0.0000000000000000E+00 {~~}START X_J DryWood C3H8 0.0000000000000000E+00 {~~}START X_J DryWood C4H10−N 0.0000000000000000E+00 {~~}START X_J DryWood C4H10−I 0.0000000000000000E+00 {~~}START X_J DryWood C5H12 0.0000000000000000E+00 {~~}START X_J DryWood C6H14 0.0000000000000000E+00 {~~}START X_J DryWood C7H16 0.0000000000000000E+00 {~~}START X_J DryWood C8H18 0.0000000000000000E+00 {~~}START X_J DryWood C2H4 0.0000000000000000E+00 {~~}START X_J DryWood C3H6 0.0000000000000000E+00 {~~}START X_J DryWood C5H10 0.0000000000000000E+00 {~~}START X_J DryWood C6H12−1 0.0000000000000000E+00 {~~}START X_J DryWood C7H14 0.0000000000000000E+00 {~~}START X_J DryWood C2H2 0.0000000000000000E+00 {~~}START X_J DryWood C6H6 0.0000000000000000E+00 {~~}START X_J DryWood C6H12−C 0.0000000000000000E+00 {~~}START X_J DryWood C 0.4782400000000009E+00 {~~}START X_J DryWood S 0.1960000000000004E−03 {~~}START X_J DryWood NO2 0.0000000000000000E+00 {~~}START X_J DryWood HCN 0.0000000000000000E+00 {~~}START X_J DryWood COS 0.0000000000000000E+00 {~~}START X_J DryWood N2O 0.0000000000000000E+00 {~~}START X_J DryWood NO3 0.0000000000000000E+00 {~~}START X_J DryWood SO3 0.0000000000000000E+00 {~~}START X_J DryWood AR 0.0000000000000000E+00 {~~}START X_J DryWood ASH 0.8918000000000020E−02 {~~}START X_J DryWood TAR 0.0000000000000000E+00 {~~}START M splitter2 61 0.3503834555122032E+02 {~~}START H splitter2 61 −0.1326462131406219E+05 {~~}START M splitter2 65 −0.1115903061224492E+01 {~~}START P 65 0.1003000000000002E+01 {~~}START H splitter2 65 −0.1326462131406219E+05 {~~}START M splitter2 67 −0.3307244248999583E+02 {~~}START P 67 0.1003000000000002E+01 {~~}START H splitter2 67 −0.1326462131406219E+05 {~~}START M splitter2 68 −0.8500000000000016E+00 {~~}START P 68 0.1000000000000002E+01 {~~}START H splitter2 68 −0.1326462131406219E+05 {~~}START M dampveksler 67 0.3307244248999583E+02 {~~}START H dampveksler 67 −0.1326462131406219E+05 {~~}START M dampveksler 64 −0.3307244248999583E+02 {~~}START H dampveksler 64 −0.1309561789902111E+05 {~~}START Q dampveksler 303 0.5589355724558811E+04 {~~}START M pyro−damp 65 0.1115903061224492E+01 {~~}START H pyro−damp 65 −0.1326462131406219E+05 {~~}START M pyro−damp 66 −0.1115903061224492E+01 {~~}START P 66 0.1003000000000002E+01 {~~}START H pyro−damp 66 −0.1219910204708108E+05 {~~}START Q pyro−damp 302 0.1189016211817892E+04 {~~}START M Gasifier 2 0.2791096938775515E+01 {~~}START H Gasifier 2 −0.5345738679896143E+04 {~~}START M Gasifier 66 0.1115903061224492E+01 {~~}START H Gasifier 66 −0.1219910204708108E+05 {~~}START M Gasifier 74 0.3200947520194182E+01 {~~}START P 74 0.1003000000000002E+01 {~~}START H Gasifier 74 0.6325583619575222E+03 {~~}START M Gasifier 3 −0.7069708375694189E+01 {~~}START P 3 0.9980000000000019E+00 {~~}START H Gasifier 3 −0.3527789070611707E+04 {~~}START M Gasifier 99 −0.3823914449999979E−01 {~~}START P 99 0.1013000000000002E+01 {~~}START H Gasifier 99 −0.7353683457571038E+04 {~~}START Q Gasifier 305 −0.1495934441133632E+04 {~~}START Q Gasifier 302 0.2783000000000005E+04 {~~}START ZA Gasifier 1 0.7981639681438376E+05 {~~}START ZA Gasifier 2 0.3021255196209142E+05 {~~}

2_stage_gasifier_DME_new.dnac:/Documents and Settings/lacl/My Documents/DTU/ph.d/fagligt/DNA/for aspen/2 stage gas
3/311−01−2011
START ZA Gasifier 3 0.1118825433710599E+06 {~~}START ZA Gasifier 4 0.3121307847900007E+06 {~~}START ZA Gasifier 5 0.1756029712017547E+06 {~~}START ZA Gasifier 6 0.2190615022058169E+06 {~~}START ZA Gasifier 7 −0.1052323135289136E+06 {~~}START ZA Gasifier 8 0.9369950351423328E+00 {~~}START ZA Gasifier 9 0.9931472364624941E+00 {~~}START ZA Gasifier 10 0.9457654343428884E+00 {~~}START ZA Gasifier 11 0.9900000000000019E+00 {~~}START ZA Gasifier 12 0.1370039999999992E−01 {~~}START ZA Gasifier 13 0.3328112323571235E−04 {~~}START ZA Gasifier 14 0.3757071737848754E−01 {~~}START ZA Gasifier 15 0.4986448137112106E+05 {~~}START ZA Gasifier 16 0.5370238731189000E+05 {~~}START ZA Gasifier 17 0.3000000000000006E−01 {~~}START ZA Gasifier 18 −0.5581126933392272E−01 {~~}START Y_J syngas H2 0.3003925338300272E+00 {~~}START Y_J syngas O2 0.0000000000000000E+00 {~~}START Y_J syngas N2 0.2511597316649906E+00 {~~}START Y_J syngas CO 0.2042868093856153E+00 {~~}START Y_J syngas NO 0.0000000000000000E+00 {~~}START Y_J syngas CO2 0.1098397455108139E+00 {~~}START Y_J syngas H2O−G 0.1236642570786999E+00 {~~}START Y_J syngas NH3 0.0000000000000000E+00 {~~}START Y_J syngas H2S 0.4988586466229489E−04 {~~}START Y_J syngas SO2 0.0000000000000000E+00 {~~}START Y_J syngas CH4 0.7623203214864482E−02 {~~}START Y_J syngas NO2 0.0000000000000000E+00 {~~}START Y_J syngas HCN 0.0000000000000000E+00 {~~}START Y_J syngas COS 0.0000000000000000E+00 {~~}START Y_J syngas AR 0.2983833450328100E−02 {~~}START X_J Ash C 0.3490701001430572E+00 {~~}START X_J Ash ASH 0.6509298998569445E+00 {~~}START M splitter3 3 0.7069708375694189E+01 {~~}START H splitter3 3 −0.3527789070611707E+04 {~~}START M splitter3 44 −0.4837565642442526E+01 {~~}START P 44 0.9980000000000019E+00 {~~}START H splitter3 44 −0.3527789070611708E+04 {~~}START M splitter3 55 −0.2232142733251664E+01 {~~}START P 55 0.9980000000000019E+00 {~~}START H splitter3 55 −0.3527789070611707E+04 {~~}START M syngas−pyro 44 0.4837565642442526E+01 {~~}START H syngas−pyro 44 −0.3527789070611708E+04 {~~}START M syngas−pyro 4 −0.4837565642442526E+01 {~~}START P 4 0.9980000000000019E+00 {~~}START H syngas−pyro 4 −0.4348866551601175E+04 {~~}START Q syngas−pyro 302 −0.3972016211817897E+04 {~~}START M air_preheat 55 0.2232142733251664E+01 {~~}START H air_preheat 55 −0.3527789070611708E+04 {~~}START M air_preheat 4 −0.2232142733251664E+01 {~~}START H air_preheat 4 −0.4576624443664456E+04 {~~}START M air_preheat 73 0.3200947520194182E+01 {~~}START P 73 0.1003000000000002E+01 {~~}START H air_preheat 73 −0.9883452766878614E+02 {~~}START M air_preheat 74 −0.3200947520194182E+01 {~~}START H air_preheat 74 0.6325583619575222E+03 {~~}START Q air_preheat 306 0.0000000000000000E+00 {~~}START ZA air_preheat 1 0.2341150256336985E+04 {~~}C ~~~~~~~~~~~~~~~~~~~~~~~~~~~~~~~~~~~~~~~~~~~~~~~~~~~~~~~~~~~~~~~~~~~~~~~~~~~~~~~~~~~~~~~~~~~~~~~~~C ~~ End of generated initial guesses.C ~~~~~~~~~~~~~~~~~~~~~~~~~~~~~~~~~~~~~~~~~~~~~~~~~~~~~~~~~~~~~~~~~~~~~~~~~~~~~~~~~~~~~~~~~~~~~~~~~
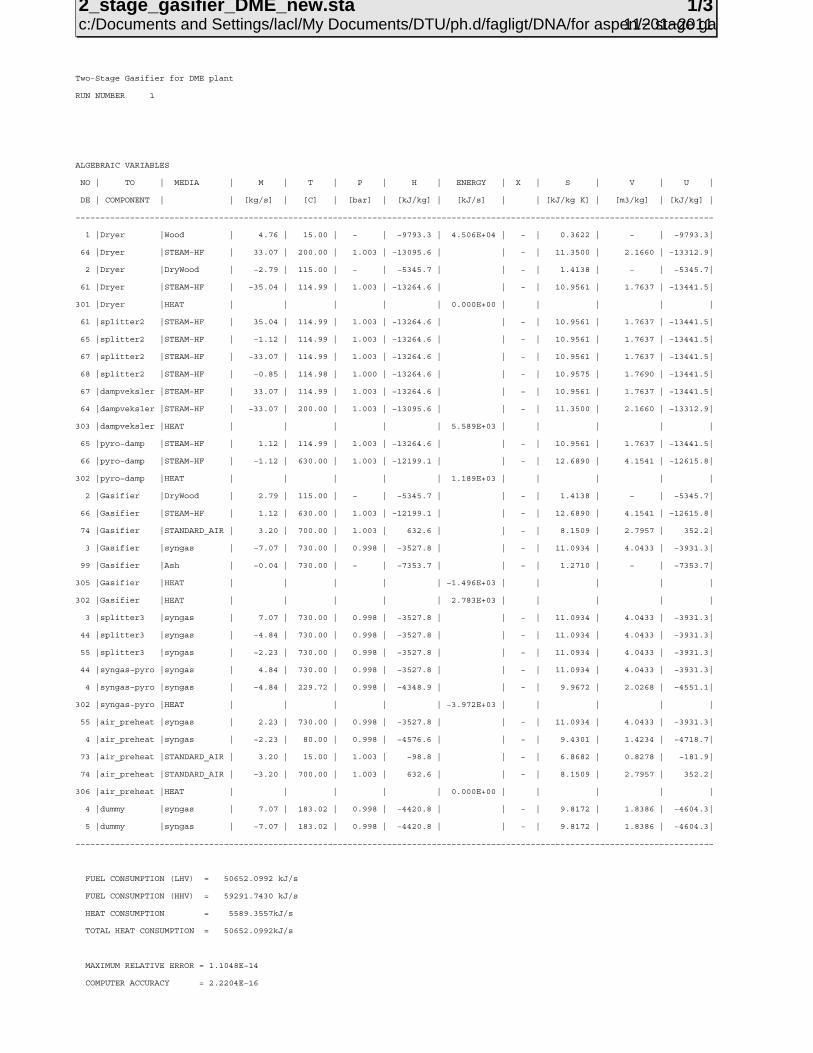
2_stage_gasifier_DME_new.stac:/Documents and Settings/lacl/My Documents/DTU/ph.d/fagligt/DNA/for aspen/2 stage gas
1/311−01−2011
Two−Stage Gasifier for DME plant RUN NUMBER 1 ALGEBRAIC VARIABLES NO | TO | MEDIA | M | T | P | H | ENERGY | X | S | V | U | DE | COMPONENT | | [kg/s] | [C] | [bar] | [kJ/kg] | [kJ/s] | | [kJ/kg K] | [m3/kg] | [kJ/kg] | −−−−−−−−−−−−−−−−−−−−−−−−−−−−−−−−−−−−−−−−−−−−−−−−−−−−−−−−−−−−−−−−−−−−−−−−−−−−−−−−−−−−−−−−−−−−−−−−−−−−−−−−−−−−−−−−−−−−−−−−−−−−−−−−− 1 |Dryer |Wood | 4.76 | 15.00 | − | −9793.3 | 4.506E+04 | − | 0.3622 | − | −9793.3| 64 |Dryer |STEAM−HF | 33.07 | 200.00 | 1.003 | −13095.6 | | − | 11.3500 | 2.1660 | −13312.9| 2 |Dryer |DryWood | −2.79 | 115.00 | − | −5345.7 | | − | 1.4138 | − | −5345.7| 61 |Dryer |STEAM−HF | −35.04 | 114.99 | 1.003 | −13264.6 | | − | 10.9561 | 1.7637 | −13441.5| 301 |Dryer |HEAT | | | | | 0.000E+00 | | | | | 61 |splitter2 |STEAM−HF | 35.04 | 114.99 | 1.003 | −13264.6 | | − | 10.9561 | 1.7637 | −13441.5| 65 |splitter2 |STEAM−HF | −1.12 | 114.99 | 1.003 | −13264.6 | | − | 10.9561 | 1.7637 | −13441.5| 67 |splitter2 |STEAM−HF | −33.07 | 114.99 | 1.003 | −13264.6 | | − | 10.9561 | 1.7637 | −13441.5| 68 |splitter2 |STEAM−HF | −0.85 | 114.98 | 1.000 | −13264.6 | | − | 10.9575 | 1.7690 | −13441.5| 67 |dampveksler |STEAM−HF | 33.07 | 114.99 | 1.003 | −13264.6 | | − | 10.9561 | 1.7637 | −13441.5| 64 |dampveksler |STEAM−HF | −33.07 | 200.00 | 1.003 | −13095.6 | | − | 11.3500 | 2.1660 | −13312.9| 303 |dampveksler |HEAT | | | | | 5.589E+03 | | | | | 65 |pyro−damp |STEAM−HF | 1.12 | 114.99 | 1.003 | −13264.6 | | − | 10.9561 | 1.7637 | −13441.5| 66 |pyro−damp |STEAM−HF | −1.12 | 630.00 | 1.003 | −12199.1 | | − | 12.6890 | 4.1541 | −12615.8| 302 |pyro−damp |HEAT | | | | | 1.189E+03 | | | | | 2 |Gasifier |DryWood | 2.79 | 115.00 | − | −5345.7 | | − | 1.4138 | − | −5345.7| 66 |Gasifier |STEAM−HF | 1.12 | 630.00 | 1.003 | −12199.1 | | − | 12.6890 | 4.1541 | −12615.8| 74 |Gasifier |STANDARD_AIR | 3.20 | 700.00 | 1.003 | 632.6 | | − | 8.1509 | 2.7957 | 352.2| 3 |Gasifier |syngas | −7.07 | 730.00 | 0.998 | −3527.8 | | − | 11.0934 | 4.0433 | −3931.3| 99 |Gasifier |Ash | −0.04 | 730.00 | − | −7353.7 | | − | 1.2710 | − | −7353.7| 305 |Gasifier |HEAT | | | | | −1.496E+03 | | | | | 302 |Gasifier |HEAT | | | | | 2.783E+03 | | | | | 3 |splitter3 |syngas | 7.07 | 730.00 | 0.998 | −3527.8 | | − | 11.0934 | 4.0433 | −3931.3| 44 |splitter3 |syngas | −4.84 | 730.00 | 0.998 | −3527.8 | | − | 11.0934 | 4.0433 | −3931.3| 55 |splitter3 |syngas | −2.23 | 730.00 | 0.998 | −3527.8 | | − | 11.0934 | 4.0433 | −3931.3| 44 |syngas−pyro |syngas | 4.84 | 730.00 | 0.998 | −3527.8 | | − | 11.0934 | 4.0433 | −3931.3| 4 |syngas−pyro |syngas | −4.84 | 229.72 | 0.998 | −4348.9 | | − | 9.9672 | 2.0268 | −4551.1| 302 |syngas−pyro |HEAT | | | | | −3.972E+03 | | | | | 55 |air_preheat |syngas | 2.23 | 730.00 | 0.998 | −3527.8 | | − | 11.0934 | 4.0433 | −3931.3| 4 |air_preheat |syngas | −2.23 | 80.00 | 0.998 | −4576.6 | | − | 9.4301 | 1.4234 | −4718.7| 73 |air_preheat |STANDARD_AIR | 3.20 | 15.00 | 1.003 | −98.8 | | − | 6.8682 | 0.8278 | −181.9| 74 |air_preheat |STANDARD_AIR | −3.20 | 700.00 | 1.003 | 632.6 | | − | 8.1509 | 2.7957 | 352.2| 306 |air_preheat |HEAT | | | | | 0.000E+00 | | | | | 4 |dummy |syngas | 7.07 | 183.02 | 0.998 | −4420.8 | | − | 9.8172 | 1.8386 | −4604.3| 5 |dummy |syngas | −7.07 | 183.02 | 0.998 | −4420.8 | | − | 9.8172 | 1.8386 | −4604.3| −−−−−−−−−−−−−−−−−−−−−−−−−−−−−−−−−−−−−−−−−−−−−−−−−−−−−−−−−−−−−−−−−−−−−−−−−−−−−−−−−−−−−−−−−−−−−−−−−−−−−−−−−−−−−−−−−−−−−−−−−−−−−−−−− FUEL CONSUMPTION (LHV) = 50652.0992 kJ/s FUEL CONSUMPTION (HHV) = 59291.7430 kJ/s HEAT CONSUMPTION = 5589.3557kJ/s TOTAL HEAT CONSUMPTION = 50652.0992kJ/s MAXIMUM RELATIVE ERROR = 1.1048E−14 COMPUTER ACCURACY = 2.2204E−16
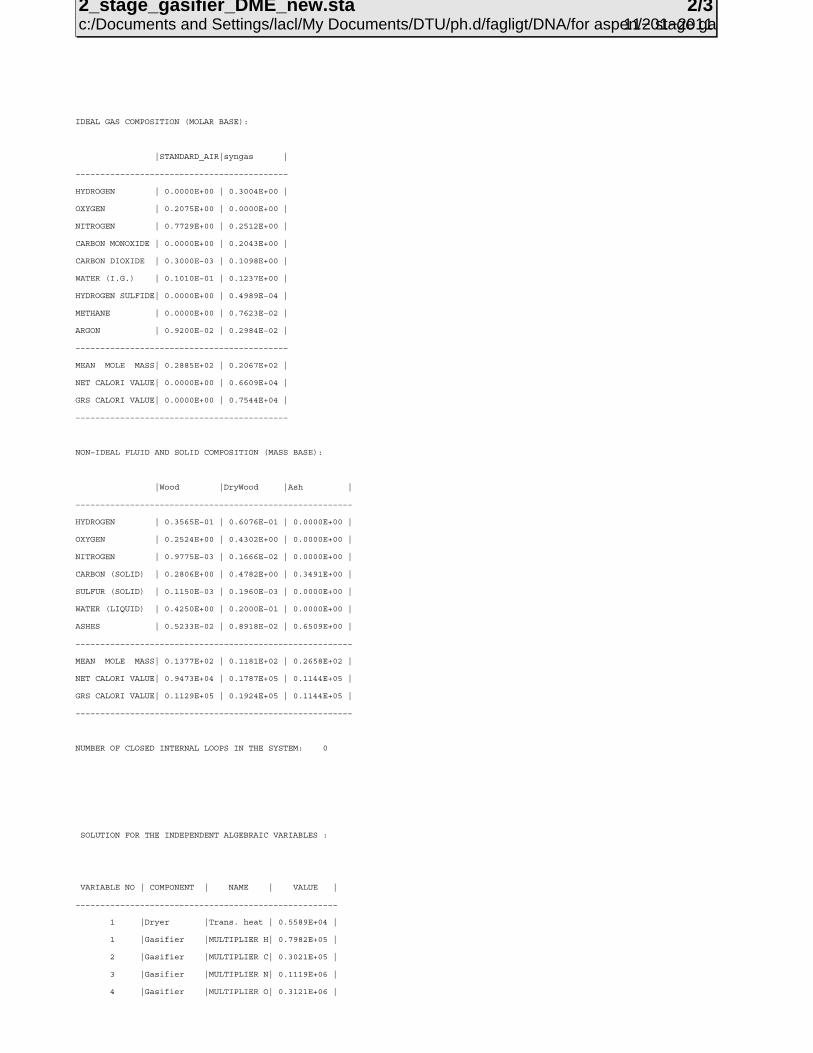
2_stage_gasifier_DME_new.stac:/Documents and Settings/lacl/My Documents/DTU/ph.d/fagligt/DNA/for aspen/2 stage gas
2/311−01−2011
IDEAL GAS COMPOSITION (MOLAR BASE): |STANDARD_AIR|syngas | −−−−−−−−−−−−−−−−−−−−−−−−−−−−−−−−−−−−−−−−−−− HYDROGEN | 0.0000E+00 | 0.3004E+00 | OXYGEN | 0.2075E+00 | 0.0000E+00 | NITROGEN | 0.7729E+00 | 0.2512E+00 | CARBON MONOXIDE | 0.0000E+00 | 0.2043E+00 | CARBON DIOXIDE | 0.3000E−03 | 0.1098E+00 | WATER (I.G.) | 0.1010E−01 | 0.1237E+00 | HYDROGEN SULFIDE| 0.0000E+00 | 0.4989E−04 | METHANE | 0.0000E+00 | 0.7623E−02 | ARGON | 0.9200E−02 | 0.2984E−02 | −−−−−−−−−−−−−−−−−−−−−−−−−−−−−−−−−−−−−−−−−−− MEAN MOLE MASS| 0.2885E+02 | 0.2067E+02 | NET CALORI VALUE| 0.0000E+00 | 0.6609E+04 | GRS CALORI VALUE| 0.0000E+00 | 0.7544E+04 | −−−−−−−−−−−−−−−−−−−−−−−−−−−−−−−−−−−−−−−−−−− NON−IDEAL FLUID AND SOLID COMPOSITION (MASS BASE): |Wood |DryWood |Ash | −−−−−−−−−−−−−−−−−−−−−−−−−−−−−−−−−−−−−−−−−−−−−−−−−−−−−−−− HYDROGEN | 0.3565E−01 | 0.6076E−01 | 0.0000E+00 | OXYGEN | 0.2524E+00 | 0.4302E+00 | 0.0000E+00 | NITROGEN | 0.9775E−03 | 0.1666E−02 | 0.0000E+00 | CARBON (SOLID) | 0.2806E+00 | 0.4782E+00 | 0.3491E+00 | SULFUR (SOLID) | 0.1150E−03 | 0.1960E−03 | 0.0000E+00 | WATER (LIQUID) | 0.4250E+00 | 0.2000E−01 | 0.0000E+00 | ASHES | 0.5233E−02 | 0.8918E−02 | 0.6509E+00 | −−−−−−−−−−−−−−−−−−−−−−−−−−−−−−−−−−−−−−−−−−−−−−−−−−−−−−−− MEAN MOLE MASS| 0.1377E+02 | 0.1181E+02 | 0.2658E+02 | NET CALORI VALUE| 0.9473E+04 | 0.1787E+05 | 0.1144E+05 | GRS CALORI VALUE| 0.1129E+05 | 0.1924E+05 | 0.1144E+05 | −−−−−−−−−−−−−−−−−−−−−−−−−−−−−−−−−−−−−−−−−−−−−−−−−−−−−−−− NUMBER OF CLOSED INTERNAL LOOPS IN THE SYSTEM: 0 SOLUTION FOR THE INDEPENDENT ALGEBRAIC VARIABLES : VARIABLE NO | COMPONENT | NAME | VALUE | −−−−−−−−−−−−−−−−−−−−−−−−−−−−−−−−−−−−−−−−−−−−−−−−−−−−− 1 |Dryer |Trans. heat | 0.5589E+04 | 1 |Gasifier |MULTIPLIER H| 0.7982E+05 | 2 |Gasifier |MULTIPLIER C| 0.3021E+05 | 3 |Gasifier |MULTIPLIER N| 0.1119E+06 | 4 |Gasifier |MULTIPLIER O| 0.3121E+06 |

2_stage_gasifier_DME_new.stac:/Documents and Settings/lacl/My Documents/DTU/ph.d/fagligt/DNA/for aspen/2 stage gas
3/311−01−2011
5 |Gasifier |MLTIPLIER S | 0.1756E+06 | 6 |Gasifier |MULTIPL Ar | 0.2191E+06 | 7 |Gasifier |GIBBS ENERGY| −.1052E+06 | 8 |Gasifier |Cold eff LHV| 0.9370E+00 | 9 |Gasifier |Cold eff HHV| 0.9931E+00 | 10 |Gasifier |LHV eff C+g | 0.9458E+00 | 11 |Gasifier |Carbon conv | 0.9900E+00 | 12 |Gasifier |Ash/Solid | 0.1370E−01 | 13 |Gasifier |CO2 kmol in | 0.3328E−04 | 14 |Gasifier |CO2 kmol out| 0.3757E−01 | 15 |Gasifier |LHV fuel in | 0.4986E+05 | 16 |Gasifier |HHV fuel in | 0.5370E+05 | 17 |Gasifier |Q_1/LHV_f_in| 0.3000E−01 | 18 |Gasifier |Q_1/LHV_f_in| −.5581E−01 | 1 |air_preheat |Transferred | 0.2341E+04 | −−−−−−−−−−−−−−−−−−−−−−−−−−−−−−−−−−−−−−−−−−−−−−−−−−−−− ======================================================================================================================== ########################################################################################################################

285
Appendix AA. Further improvements to the Rectisol process
The cost and the energy consumption may be reduced even further if the sulfur distillation was only done on part of the solvent from the stripper. The other part of the solvent from the stripper would then be pressurized and sent to a new chiller placed before the absorber. This would add another methanol loop in the plant and therefore increase the number of inputs of methanol to the absorber from two to three: The first input from the top would be totally sulfur and CO2 free, the second input would be totally CO2 free, and the third input would only be low in CO2 content. This would increase the complexity of the Rectisol plant but may still reduce the total cost of the plant.
286
Appendix BB. Modeling the distillation of DME/methanol
Below, all the parameters set in the modeling of the distillation in the DME/methanol plants are shown. The distillation of the liquid feed from the gas-liquid separator was done in 1-2 distillation columns (only one column was used in the small-scale plants): the first is the topping column (Figure BB.1), which removes absorbed gasses from the liquid. The second column is the DME column, which separates water and methanol from DME (Figure BB.2). All columns were modeled by the “RadFrac” component in Aspen Plus, meaning that physical equilibrium calculations were done for each stage/tray through the column. The convergence method used was: “strongly non-ideal liquid”. In Figure BB.1 and Table BB.1, it is described how the topping column was modeled for all the plants. In Figure BB.2 and Table BB.2, it is described how the DME column was modeled for the large-scale DME plants. The modeling did not include separation of by-products (such as ethanol) from DME/methanol, which would have required a substantial number of stages [Hansen et al., 2008]. It is however not expected, that including this would have changed the condenser/reboiler temperatures and duties (heat input/output) much. The number of stages/trays used in the distillation columns was estimated based on looking at the stream compositions of the individual stages: a certain change in the compositions should be seen from stage to stage. In the same way the placement of the feed stage was done. The placement of the side product stage (methanol extraction) was based on looking at the stream compositions of the individual stages, and then choosing the stage with the highest concentration of methanol.

287
Figure BB.1. Flow sheet of the modeled topping column used in all DME/methanol plants. The red and blue streams symbolize vapor and liquid streams respectively. The figure also shows how the reflux ratio and the boilup ratio are defined (mass basis). In Table BB.1, all parameters set in the modeling of the topping columns are shown Large-scale once-
through (OT) DME plant
Large-scale recycle (RC) DME plant
Small-scale DME plants
Small scale methanol plants
Number of stages/trays
20 20 20 20
Feed input (stage no.)*
8 and 17** 7 11 10
Pressure [bar] 9 9 10 2 Reflux ratio (mass basis)
0.5 0.5 0.5 0.5
Mole recovery of DME [%]
99.9 99.9 99.9 -
Toverhead product [°C] - - - 25## Table BB.1. The parameters set for the modeled topping columns (Figure BB.1). The parameters set, results in boilup ratios (mass basis) of 0.20-0.97. * The stage no. is defined as 1 being the top of the column (overhead product). ** The extra feed stream (17) is the dehydrated methanol stream. # The mole recovery of DME is defined as: (mole DME in bottom product) / (mole DME in feed). ## The overhead temperature was set to 25°C instead of setting the mole recovery, to allow the use of cooling water to remove the condenser duty.
Reboiler
MeOH/DME/water(Bottom product)
Condenser
Liquid from gas-liquid separator (feed)
~CO2 (Overhead product)
mdistillate
mreflux
Reflux ratio = mreflux/ mdistillate
mboilup
mbottoms
Boilup ratio = mboilup/ mbottoms
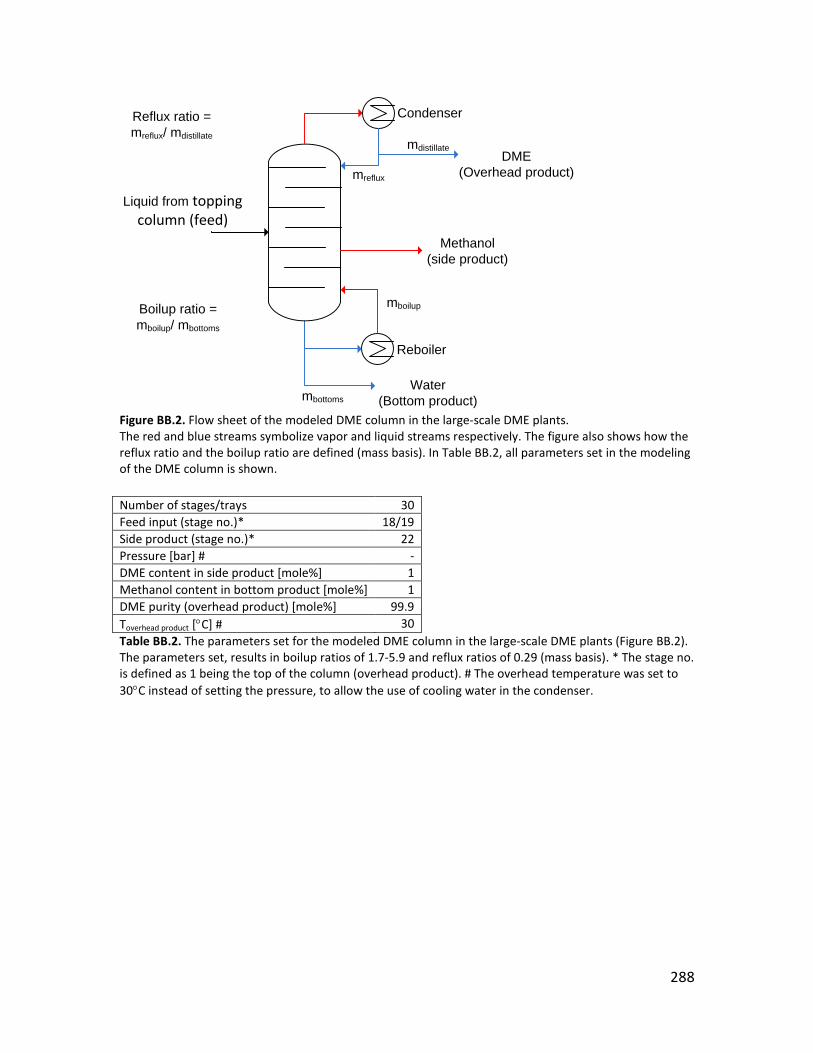
288
Figure BB.2. Flow sheet of the modeled DME column in the large-scale DME plants. The red and blue streams symbolize vapor and liquid streams respectively. The figure also shows how the reflux ratio and the boilup ratio are defined (mass basis). In Table BB.2, all parameters set in the modeling of the DME column is shown. Number of stages/trays 30 Feed input (stage no.)* 18/19 Side product (stage no.)* 22 Pressure [bar] # - DME content in side product [mole%] 1 Methanol content in bottom product [mole%] 1 DME purity (overhead product) [mole%] 99.9 Toverhead product [°C] # 30 Table BB.2. The parameters set for the modeled DME column in the large-scale DME plants (Figure BB.2). The parameters set, results in boilup ratios of 1.7-5.9 and reflux ratios of 0.29 (mass basis). * The stage no. is defined as 1 being the top of the column (overhead product). # The overhead temperature was set to 30°C instead of setting the pressure, to allow the use of cooling water in the condenser.
Reboiler
Water(Bottom product)
Condenser
Liquid from topping column (feed)
mdistillate
mreflux
Reflux ratio = mreflux/ mdistillate
mboilup
mbottoms
Boilup ratio = mboilup/ mbottoms
DME(Overhead product)
Methanol(side product)

289
Appendix CC. Energy and exergy efficiencies for the large scale DME plants
RC OT RC OT Input basis Torrefied
biomass Torrefied biomass
Untreated biomass
Untreated biomass
Biomass (energy) [MWthLHV]
2302 2302 2558 2558
Biomass (exergy)* [MWthHHV]
2452 2452 2725** 2725**
DME (energy) [MWthLHV]
1515 1130 1515 1130
DME (exergy)*** [MWthHHV]
1667 1243 1667 1243
Net electricity [MWe]
112 369 112 369
Energy ratios: Biomass to DME [%-LHV] 65.8 49.1 59.2 44.2 Biomass to net electricity [%-LHV] 4.9 16.0 4.4 14.4 Biomass to DME + net electricity [%-LHV] 70.7 65.1 63.6 58.6 FEE [%-LHV]# 72.9 72.3 64.9 62.1 Exergy ratios Biomass to DME [%-HHV] 68.0 50.7 61.2 45.6 Biomass to net electricity [%-HHV] 4.6 15.0 4.1 13.5 Biomass to DME + net electricity [%-HHV] 72.5 65.7 65.3 59.2 FEE [%-HHV]# 75.3 74.6 67.0 64.1 * The torrefied biomass HHV = 21.2 MJ/kg (LHV = 19.9 MJ/kg). ** assumed to be the torrefied biomass input (HHV) divided with 0.9 (as done with LHV). This gives a greater energy loss in the torrefaction: 272 MWthHHV vs. 256 MWthLHV. The energy loss in HHV may however be underestimated because the volatile gas released in the torrefaction contains a lot of hydrogen, which has a lot higher HHV (286 MJ/kmole) than LHV (242 MJ/kmole). *** The DME HHV = 1461 MJ/kmole (LHV = 1328 MJ/kmole).
# The fuels effective efficiency (FEE), defined as where the fraction
corresponds to the amount of biomass that would be used in a stand-alone BIGCC power plant with an electric efficiency of 50%-LHV (47%-HHV) [Larson et al., 2009-1], to produce the same amount of electricity.
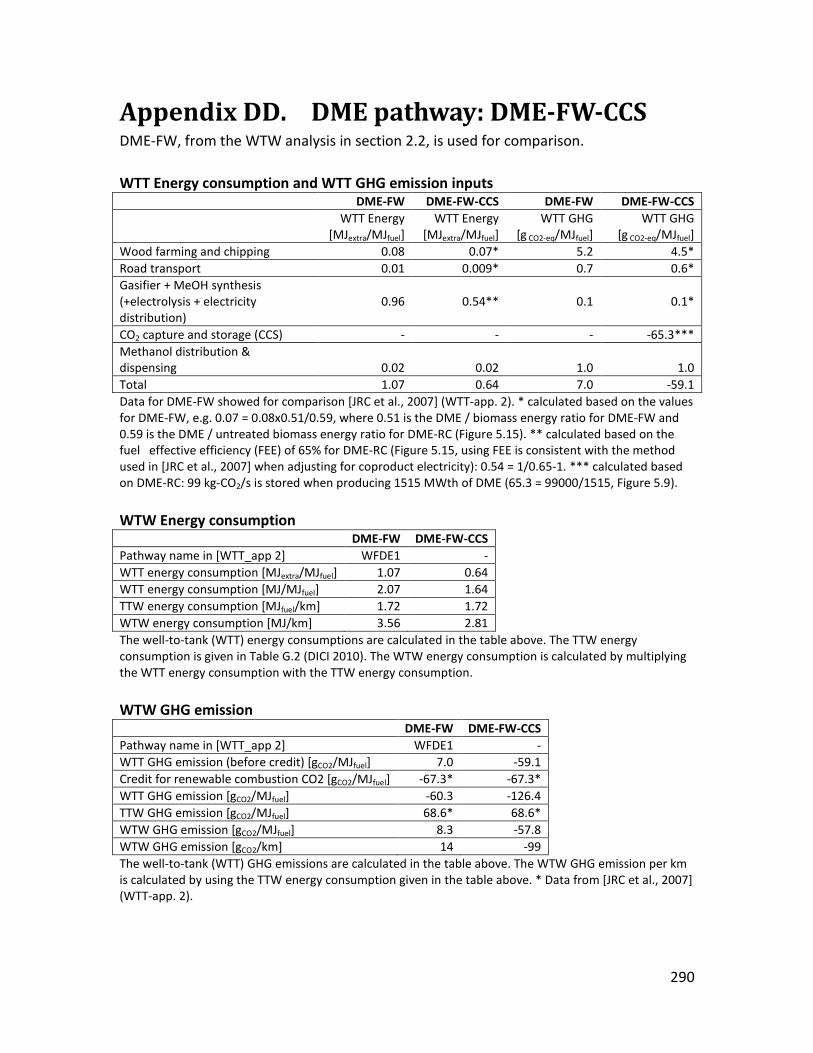
290
Appendix DD. DME pathway: DME-FW-CCS DME-FW, from the WTW analysis in section 2.2, is used for comparison. WTT Energy consumption and WTT GHG emission inputs DME-FW DME-FW-CCS DME-FW DME-FW-CCS
WTT Energy
[MJextra/MJfuel] WTT Energy
[MJextra/MJfuel] WTT GHG
[g CO2-eq/MJfuel] WTT GHG
[g CO2-eq/MJfuel] Wood farming and chipping 0.08 0.07* 5.2 4.5* Road transport 0.01 0.009* 0.7 0.6* Gasifier + MeOH synthesis (+electrolysis + electricity distribution)
0.96 0.54** 0.1 0.1*
CO2 capture and storage (CCS) - - - -65.3*** Methanol distribution & dispensing 0.02
0.02 1.0
1.0
Total 1.07 0.64 7.0 -59.1 Data for DME-FW showed for comparison [JRC et al., 2007] (WTT-app. 2). * calculated based on the values for DME-FW, e.g. 0.07 = 0.08x0.51/0.59, where 0.51 is the DME / biomass energy ratio for DME-FW and 0.59 is the DME / untreated biomass energy ratio for DME-RC (Figure 5.15). ** calculated based on the fuel effective efficiency (FEE) of 65% for DME-RC (Figure 5.15, using FEE is consistent with the method used in [JRC et al., 2007] when adjusting for coproduct electricity): 0.54 = 1/0.65-1. *** calculated based on DME-RC: 99 kg-CO2/s is stored when producing 1515 MWth of DME (65.3 = 99000/1515, Figure 5.9). WTW Energy consumption DME-FW DME-FW-CCS Pathway name in [WTT_app 2] WFDE1 - WTT energy consumption [MJextra/MJfuel] 1.07 0.64 WTT energy consumption [MJ/MJfuel] 2.07 1.64 TTW energy consumption [MJfuel/km] 1.72 1.72 WTW energy consumption [MJ/km] 3.56 2.81 The well-to-tank (WTT) energy consumptions are calculated in the table above. The TTW energy consumption is given in Table G.2 (DICI 2010). The WTW energy consumption is calculated by multiplying the WTT energy consumption with the TTW energy consumption. WTW GHG emission DME-FW DME-FW-CCS Pathway name in [WTT_app 2] WFDE1 - WTT GHG emission (before credit) [gCO2/MJfuel] 7.0 -59.1 Credit for renewable combustion CO2 [gCO2/MJfuel] -67.3* -67.3* WTT GHG emission [gCO2/MJfuel] -60.3 -126.4 TTW GHG emission [gCO2/MJfuel] 68.6* 68.6* WTW GHG emission [gCO2/MJfuel] 8.3 -57.8 WTW GHG emission [gCO2/km] 14 -99 The well-to-tank (WTT) GHG emissions are calculated in the table above. The WTW GHG emission per km is calculated by using the TTW energy consumption given in the table above. * Data from [JRC et al., 2007] (WTT-app. 2).

291
Cost of CO2 avoided (oil @ 50 €/bbl) DME-FW DME-FW-CCS Specific cost of DME from plant [€/GJ] 19.9 9.5* Distribution and retail cost [€/GJ] 0.8 2.2** Total specific cost of DME [€/GJ] 20.8 11.7 Amount of DME [PJ/y] 141 141 DME cost (alternative fuel) [M€/y] 2931 1653 Conventional fuel (saving) [M€/y] -1778 -1778 Distribution infrastructure [M€/y] 550 550 WTT cost [M€/y] 1702 425 Alternative vehicle cost (more than reference) [M€/y] 296 296 WTW cost (net total cost) 1999 721 Distance covered [Tm/y] 82 82 WTW GHG emission [Mt/y]*** 1.2 -8.2 Base GHG emission [Mt/y] 12.8 12.8 GHG savings [Mt/y] 11.7 20.9 Cost of CO2 avoided [€/ton] 171 34 The method of calculating cost of CO2 avoided is the same as in [JRC et al., 2007] (WTW-app. 2). * Cost of DME from the DME-RC plant ($11.9/GJ). ** Long-distance transport because of large-scale production plant [JRC et al., 2007] (WTW-app. 2). *** Calculated based on the WTW GHG emission per km (table above) and the distance covered per year. Fraction of road fuels market replaced DME-FW DME-FW-CCS Feedstock potential [EJ/y] 1.866 1.866 Conversion efficiencies [%] 51 59* DME potential [EJ/y] 952 1101 Fossil fuels replaced [EJ/y] 978 1131 Fraction of road fuels market replaced [%]** 7.6 8.8 In [JRC et al., 2007] (WTT-app. 1, page 60) the conversion efficiencies for the DME-FW pathway can be found. In [JRC et al., 2007] they assume that DME replaces diesel in an energy ratio of 1:1.03 (the difference is due to the diesel particulate filter (DPF)).* The untreated biomass to DME efficiency for the DME-RC plant (Figure 5.15). ** the EU-25 road fuels market is 12.78 EJ/y (based on table 8.6.2-2 in the WTW report [JRC et al., 2007]).

292
Appendix EE. Q-T diagram for the small-scale methanol plant using recycle (RC) synthesis
Figure EE.1. Q-T diagram of the designed heat integration in the methanol plant using recycle (RC) synthesis.
Methanol reactor (352 kWth at 220 C)
Q [kWth]352 626
80
400
T [C]
710419
Gas engine exhaust(358 kWth)
Steam superheating for steam dryer(559 kWth)
Gas to expander(167 kWth)Syngas from pyrolysis reactor
(100 kWth)
810

293
Appendix FF. Syngas conversion for DME/methanol synthesis in the small-scale OT plants
Figure FF.1. Syngas conversion for methanol synthesis in the small-scale MeOH-OT plant as a function of the reactor outlet temperature and the reactor pressure. Curves for both equilibrium conversion (Eq) and for actual conversion (approach to equilibrium, App) are shown. The approach temperatures used are listed in section 4.4. The syngas had a H2/CO-ratio of 2.0 (37.1% H2, 18.6% CO, 15.9% CO2, 0.24% H2O, 0.88% CH4, 27.0% N2, 0.32% Ar). If compared with Figure 4.5, the effect of the syngas composition can be seen.
0
10
20
30
40
50
60
70
80
90
100
200 220 240 260 280 300
H2+
CO c
onve
rsio
n [%
]
Temperature [C]
Eq, 80 bar App, 80 bar
Eq, 50 bar App, 50 bar
Eq, 30 bar App, 30 bar

294
Figure FF.2. Syngas conversion for DME synthesis in the small-scale DME-OT plant as a function of the reactor outlet temperature and the reactor pressure. Curves for both equilibrium conversion (Eq) and for actual conversion (approach to equilibrium, App) are shown. The approach temperatures used are listed in section 4.4. The syngas had a H2/CO-ratio of 1.5 (34.1% H2, 23.2% CO, 12.5% CO2, 0.42% H2O, 0.87% CH4, 28.5% N2, 0.34% Ar). If compared with Figure 4.6, the effect of the syngas composition can be seen.
0
10
20
30
40
50
60
70
80
90
100
200 220 240 260 280 300
H2+
CO c
onve
rsio
n [%
]
Temperature [C]
Eq, 80 bar App, 80 bar
Eq, 50 bar App, 50 bar
Eq, 30 bar App, 30 bar
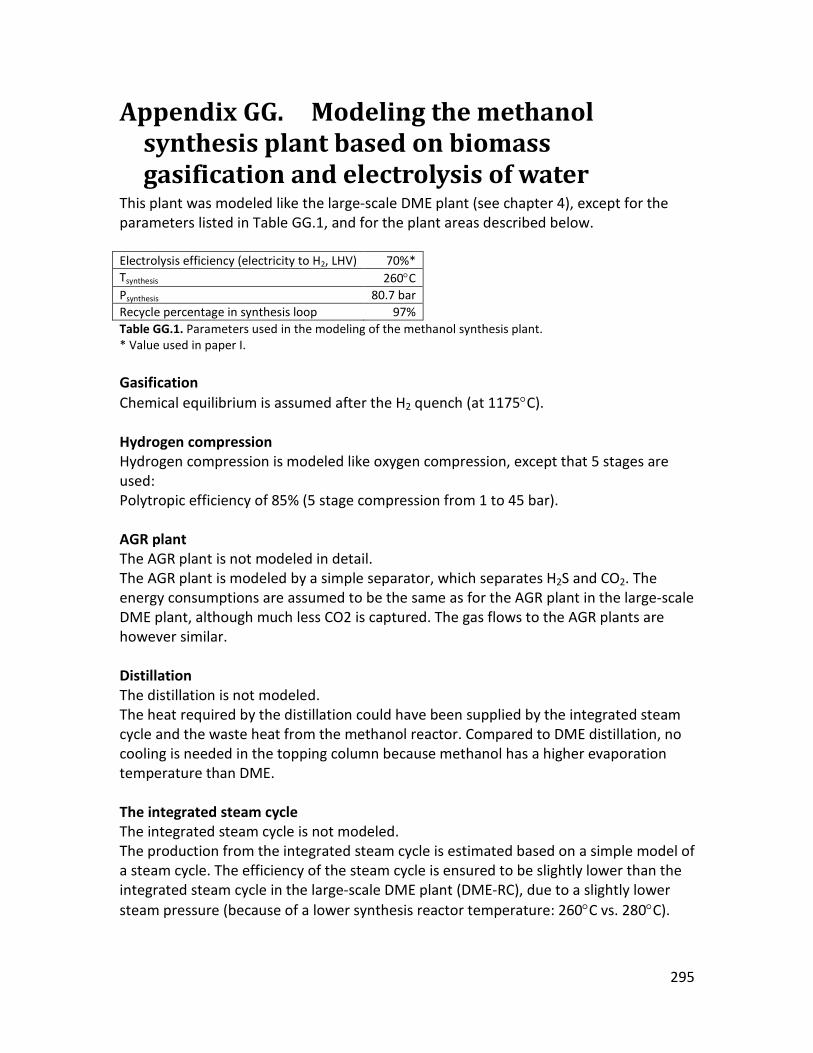
295
Appendix GG. Modeling the methanol synthesis plant based on biomass gasification and electrolysis of water
This plant was modeled like the large-scale DME plant (see chapter 4), except for the parameters listed in Table GG.1, and for the plant areas described below. Electrolysis efficiency (electricity to H2, LHV) 70%* Tsynthesis 260°C Psynthesis 80.7 bar Recycle percentage in synthesis loop 97% Table GG.1. Parameters used in the modeling of the methanol synthesis plant. * Value used in paper I. Gasification Chemical equilibrium is assumed after the H2 quench (at 1175°C). Hydrogen compression Hydrogen compression is modeled like oxygen compression, except that 5 stages are used: Polytropic efficiency of 85% (5 stage compression from 1 to 45 bar). AGR plant The AGR plant is not modeled in detail. The AGR plant is modeled by a simple separator, which separates H2S and CO2. The energy consumptions are assumed to be the same as for the AGR plant in the large-scale DME plant, although much less CO2 is captured. The gas flows to the AGR plants are however similar. Distillation The distillation is not modeled. The heat required by the distillation could have been supplied by the integrated steam cycle and the waste heat from the methanol reactor. Compared to DME distillation, no cooling is needed in the topping column because methanol has a higher evaporation temperature than DME. The integrated steam cycle The integrated steam cycle is not modeled. The production from the integrated steam cycle is estimated based on a simple model of a steam cycle. The efficiency of the steam cycle is ensured to be slightly lower than the integrated steam cycle in the large-scale DME plant (DME-RC), due to a slightly lower steam pressure (because of a lower synthesis reactor temperature: 260°C vs. 280°C).

DTU Mechanical Engineering
Section of Thermal Energy Systems
Technical University of Denmark
Nils Koppels Allé, Bld. 403
DK- 2800 Kgs. Lyngby
Denmark
Phone (+45) 45 88 41 31
Fax (+45) 45 88 43 25
www.mek.dtu.dk
ISBN: 978-87-90416-44-7
DCAMM
Danish Center for Applied Mathematics and Mechanics
Nils Koppels Allé, Bld. 404
DK-2800 Kgs. Lyngby
Denmark
Phone (+45) 4525 4250
Fax (+45) 4593 1475
www.dcamm.dk
ISSN: 0903-1685