design of a prototype hybrid electrical serial drive ... · design of a prototype hybrid electrical...
TRANSCRIPT

Department of Mechanical Engineering
Design of a Prototype Hybrid Electrical Serial
Drive System for Motor
Vehicular Applications
Author:
John Egbuta
Supervisor:
Dr. Nick Kelly
A thesis submitted in partial fulfilment for the requirement of degree in
Master of Science in Energy Systems and the Environment
2009

2
Copyright Declaration
This thesis is the result of the author’s original research. It has been composed by the
author and has not been previously submitted for examination which has led to the
award of a degree.
The copyright of this thesis belongs to the author under the terms of the United
Kingdom Copyright Acts as qualified by University of Strathclyde Regulation 3.50.
Due acknowledgement must always be made of the use of any material contained in,
or derived from, this thesis.
Signed: John Egbuta Date: 18th September 2009
.

3
Abstract
The term Hybrid Vehicle as defined by the United Nations is a vehicle with 2
different energy converters and 2 different energy storage systems for the purpose of
propulsion. The Hybridization of renewable energy sources to create cleaner and more
efficient solutions for vehicular transport has lead to the design of various modular
technologies in which the traditional Internal Combustion Engine (ICE) driven by
petrol is combined with the an alternative energy source in the drive train. Hybrid
designs exist, such as the Serial, Parallel, Combined, through the road, Two Mode,
Micro and Mild, Full and Plug in Hybrids.
In this thesis, a prototype of the serial hybrid electric drive was designed to investigate
the capability of combining a Hydrogen fuel cell and Lithium Ion Battery Power Pack
to power a DC Motor using an embedded MSP430 Micro controller to digitally
control the Battery charging program. Basically, the system is a standalone battery
charger combined with a DC motor, in which the DC motor is driven only by the Li-
Ion Battery Pack while it is charged by the Hydrogen Fuel Cell. This hybrid electric
drive system was designed at the Greenspace Research-Hydrogen Labs using the
Heliocentris FC-50 PEM Fuel Cell to provide power to charge the Li-Ion Battery.
A complete analysis of the loading effect of the DC motor on the battery pack was
done as observations were made on the charge and discharge states. An investigation
into the variation of the DC motor speeds over a period of time (also known as a
Drive Cycle) was executed. These Drive cycles were also generated to understand the
impact of starts and stops as well as the impact of the charging program on the battery
over a period of time, as a steady energy source is dissipated as it drives a load. Since
this is a Prototypical Drive System, the basic properties of the drive train were
measured and analyzed, such as the Mechanical Power, Torque, Motor Speeds,
Efficiency and Loading effect on the motor as drive cycles were emulated.
The specific objective of this work is therefore to verify the efficacy of the embedded
MSP430 microcontroller to digitally control the charge program for the Li-Ion Battery
pack when the DC motor is mobile and stationary and provide peak power directly

4
from the Li-Ion Battery pack (while it is charged by the PEM Fuel Cell) as it drives
the motor over a specified time period.
The next 4 sections of this thesis will cover the literature review of the current hybrid
electric drive systems and more importantly the current serial drive systems available
and prototypes in the market; this will be followed by methods and materials, which is
the storyline of the research endeavour at the hydrogen labs at Greenspace Research
involving the design, build and test phases of the different modules of this prototype;
followed by Results and Discussion of the data acquired by the National Instruments
Labview Signal Express Program and tachometer measurements of varying speeds
over the different drive cycles as well as the analysis of this data; Finally, conclusions
will be made and recommendations regarding future improvements on this prototype
will be proposed.

5
Acknowledgements
I would like to express my gratitude to Greenspace Research, UK for providing the
quintessential environment to conduct research on the design of this prototype. Special
Mention has to be made of Dr. Alasdair Macleod and the aids he provided during the
course of the deployment of the Heliocentris Instructor and the rest of the team at
Greenspace Research who provided all the components for this project. Without them,
this prototype would not have been designed.
I also want to thank the Comhairle nan Eilean Siar for making the placement at
Greenspace Research possible. I am thankful for the direction for research provided by
the Royal Mail Bus Service.
I also want to thank Dr. Nick Kelly for providing guidance during the course of this
project.
Lastly, I am thankful to God for my family who stood with me through the course of the
MSc. Program and supported me, may God Bless you all.

6
Table of Contents
Chapter1.0 Introduction……..……………………………………………10
Chapter 2.0 Literature Review…………………………………………….14
2.1. PEM Fuel Cell…………………………………………….....15
2.1.1. Heliocentris FC50………………………………………..16
2.2 Lithium Ion Batteries………………………………………17
2.2.1 Origins ……………………………………………………17
2.2.2 Advantages………………………………………………..17
2.2.3 Disadvantages…………………………………………….18
2.2.4 Charging the Li-Ion battery………………………………18
2.2.5 Varta Li-Ion Battery Design……………………………...19
2.3 Direct Current Motors……………………………………22
2.3.1 Description ……………………………………………...22
2.3.2 Mechanical Power……………………………………….23
2.3.3 Mechanical Torque………………………………………24
2.3.4 Speed of Rotation………………………………………..24
2.3.5 Efficiency………………………………………………..24
2.4 Electric Drive Technologies………………………………...25
2.4.1 Electric Drive Hybridisation……………………………26
2.4.2 Serial Hybrid Drives …………………………………...26
2.4.3 Parallel Hybrid Drives………………………………….27
2.4.4 Combined Hybrid Drives………………………………28

7
2.5 MSP430F2132 Mixed Signal Micro-controller……………30
2.5.1 Description………………………………………………30
2.5.2 Operating Modes……………………………………...33
2.5.3 Digital Input / Output………………………………….34
2.5.1d Timers………………………………………………..34
2.5.1e Analogue to Digital Converters………………...……35
Chapter 3.0 Methods and Materials………………………………...….36
3.1 System Architecture and Modular Design ……………….37
3.1.1 MSP430 Microcontroller Programme Design Environment…41
3.1.1a Charge Control Algorithm …………………………………42
3.1.1b Source code Design, Build and Test…………….………..48
3.2 Full System Integration …………………………………………49
3.2.1 Design, Build of Test System with Dual Power Supply Unit.49
3.2.2 Integration of Stand Alone System………………………….51
3.3 Drive Cycle Emulation and Motor Load Design………..……..53
Chapter 4.0 Results and Discussions………………………………….……54
4.1 Charge Cycle Analysis…………………………………….…..54
4.2 Discharge Cycle Analysis…………………………………..….57
4.3 Drive Cycle Analysis ……………………………………...…62
4.4 DC Motor Characteristics during Drive Cycle Emulation….65
Chapter 5.0 Conclusions and Recommendations…………………………...67
5.1 Conclusions…………………………………………………….67

8
5.2 Recommendations…………………………………………….68
5.3 Limitations…………………………………………………….68
References………………………………………………………………………70
Appendices

9
List of figures
Figure 1 Brent Crude Oil Prices per Barrel (courtesy thisismoney.co.uk)
Figure 2 PEM Fuel Cell
Figure 3. The Heliocentris Instructor
Figure 4. Constant Voltage Charge program for a 3.7V Lithium Ion Battery
Figure 5a Basic Principle of the Lithium Ion Battery
Figure 5b Varta Lithium ion battery with Protection Circuit Module
Figure 6 CEMF in a DC motor
Figure 7 Serial Hybridization of Battery and ICE Power trains
Figure 8 Parallel Hybridization of the ICE and battery powertrains
Figure 9 Series-parallel or combined hybridization
Figure 10 Planetary Gear System: T and Omega represent Torques and Correspondent
speeds in the electric motors and the different components of the planetary gear unit.
Figure 11 I/O Pins
Figure 12 MSP430 CPU Architecture
Figure 13 Operating Modes of the MSP430F2132
Figure 14 Timer A
Figure 16 10bit ADC
Figure 17a Schematic of the Hybrid Electric Serial Drive
Figure 17b Block Diagram of Hybrid Electrical Serial Drive System (aka volTRONe)
Figure 18 Data Acquisition Module
Figure 19 NI-Signal Express Data Playback of charge program.
Figure 20 Voltage Regulation Module.
Figure 20a Battery Charger Block diagram
Figure 20b Flowchart showing the charge algorithm
Figure 20c Battery charger source code

10
Figure 21 Pulse Width Modulation of Li-Ion battery voltage.
Figure 22 Source Code Modular Design Process
Figure 23 Initial Test Module with Dual Power Supply Unit and Oscilloscope
Figure 24.Dual Power Supply and Initial circuitry showing the Power Supply and Pulse
width Modulation Test Modules
Figure 25 Fully Integrated Standalone system
Figure 26 The Drive Cycle Emulator
Figure 27 Stornoway-Port Ness Route
Figure 28 Charge cycle of the battery
Figure 29 Voltage of the Li-Ion Battery during the constant voltage charge cycle
Figure 30 FC 50 voltage data during charge cycle
Figure 31 Discharge cycle of the battery showing FC50 and Battery voltages
Figure 32 Voltage of the Li-ion battery during charge cycle
Figure 33 Initial loading of the battery to emulate sloped terrain
Figure 34 Over-discharge of the battery and protection circuit activation
Figure 35 Short Stop and recharge
Figure 36 Final discharge and end of drive cycle
Figure 37 Delay/Resume sequence for final discharge.
Figure 38 Western Isles map and red route
Figure 39 Drive Cycle Emulation for the journey from Port Ness to Stornoway
Figure 40 Discharge cycle of battery during Drive Cycle emulation shown in figure 39
Figure 41 Short Stop at Bavras (region C of drive cycle)
Figure 42 Current data for 1.2ohm resistor (current values were divided by 1000)

11
1.0 Introduction
The first decade of the 21st century saw the crash of crude oil prices as it spiralled from a
peak of 144.95 USD to 38.12 USD (i.e. Brent Crude, see figure 1). All this happening
within a period of 6 months, when there were speculations of even higher prices and the
ushering in of an era of economical growth for the Developing economies in the far East
and abroad.
Figure 1 Brent Crude Oil Prices per Barrel [1]
In the movie, A Crude Awakening-The Oil Crash [2], Energy Analysts and major players
in the Oil Industry such as Matthew Simmons, Dr. Colin Campbell (author of The
Coming Oil Crisis) and Terry Lynn Karl support the theory that, we are moving from an
era of cheap abundant energy to an era of scarce hard to get expensive energy, while at
the same time making ourselves dependent on some extremely unstable regimes in some
nasty parts of the world.
According to Dr. Colin Campbell, the crude oil reserves that were formed briefly over
geological time have been used up over 2 centuries. The fact that oil reserves today are

12
questionable in terms of meeting the needs of the demand of developing countries like
China and India leads to an inescapable reality, that Energy Supply from Crude Oil is no
longer sustainable and we can no longer continue to rely solely on this source of energy.
The last major oil discoveries occurred between 1967-1969 in the Alaskan North Slope,
Siberia, Siberia and the North Sea. Since then, most of the major crude oil producing
nations have peaked and are producing significantly less than they did 3 decades ago.
Transport forms a huge component of the demand for crude oil and the threat of
unsustainable crude oil supplies has led to the Hybridization of renewable energy sources
to create cleaner and more efficient solutions for vehicular transport. Various modular
technologies exist, in which the traditional Internal Combustion Engine (ICE) driven by
petrol is combined with an alternative energy source in the drive train. Hybrid designs,
such as the Serial, Parallel, Combined, through the road, Two Mode, Micro and Mild,
Full and Plug in Hybrids are currently being developed, tested and even commercialised.
In this thesis, a prototype of the serial hybrid electric drive was designed to investigate
the capability of combining a Hydrogen fuel cell and Lithium Ion Battery Power Pack to
power a DC Motor using an embedded MSP430 Micro controller to control the Battery
charging program. Basically, the system is a standalone battery charger combined with a
DC motor, in which the DC motor is driven only by the Li-Ion Battery Pack while it is
charged by the Hydrogen Fuel Cell. This hybrid electric drive system was designed at the
Greenspace Research-Hydrogen Labs using the Heliocentris FC-50 PEM Fuel Cell to
provide power to charge the Li-Ion Battery.
A complete analysis of the loading effect of the DC motor on the battery pack was done
as observations were made on the charge and discharge states. An investigation into the
variation of the DC motor speeds over a period of time (also known as a Drive Cycle)
was executed. These Drive cycles were also generated to understand the impact of starts
and stops as well as the impact of the charging program on the battery over a period of
time, as a steady energy source is dissipated as it drives a load. Since this is a
Prototypical Drive System, the basic properties of the drive train were measured and

13
analyzed, such as the Mechanical Power, Torque, Motor Speeds, Efficiency and Loading
effect on the motor as drive cycles were emulated.
The specific objectives of this work are therefore to verify the efficacy of the embedded
MSP430 microcontroller to charge the Li-Ion Battery pack when the DC motor is mobile
and stationary, and understand the limits of the Li-Ion Battery pack as it drives the motor
over a specified time period.
The next 4 sections of this thesis will cover the literature review of the current hybrid
electric drive systems and more importantly the current serial drive systems available and
prototypes in the market; this will be followed by methods and materials, which is the
storyline of the research endeavour at the hydrogen labs at Greenspace Research
involving the design, build and test phases of the different modules of this prototype;
followed by Results and Discussion of the data acquired by the National Instruments
Labview Signal Express Program and tachometer measurements of varying speeds over
the different drive cycles as well as the analysis of this data; Finally, conclusions will be
made and recommendations regarding future improvements on this prototype will be
proposed.
2.0 Literature Review
2.1 The PEM Fuel Cell
The Polymer Electrolyte Membrane Fuel Cell or Proton Exchange Membrane Fuel Cell
has a proton conducting membrane as the electrolyte. This electrolytic membrane is
interposed between two platinum electrodes to enable faster electrochemical reactions at
the electrodes. The electrode backing is Teflon coated and acts as a water proof and
diffusion path for the Platinum catalyst to guarantee faster reaction rates. In Figure 2, the
Anodic reactions release protons which diffuse through the polymer electrolytic
membrane to the cathode where they react with Oxygen in an exothermic reaction to
produce water. The electrons are conducted by a load generating an electric current.

14
Figure 2 PEM Fuel Cell [3]
The Electrochemical reactions at both electrodes are shown below
Anode: = + 2
Cathode: + + 2 = O
The PEM Fuel Cell operates with Hydrogen as the primary fuel at relatively low
temperatures giving them quicker start up times and reducing exposure to thermal stress,
thereby increasing their lifetimes.
However, they are currently designed with Platinum catalysts which make them
expensive and susceptible to catalytic poisoning from C . Therefore, a clean Hydrogen
gas supply must be guaranteed or a reformer module must be coupled with the supply to
ensure that the C component is reduced.
Due to above mentioned ability to start up at low temperatures, PEM fuel cells have
become a staple for transport applications. They also have a much more favourable
Power to Weight Ratio enabling portability and increased range of operation. However,
the drawback lies in the hydrogen storage as Hydrogen has a very low energy density and

15
a very low volumetric capacity (0.03Kg/L at 700bar) as well This implies that for a
transport application, Hydrogen storage space will have a very high priority as
compromises to the system design with respect to weight have to be made to enable the
vehicle compete over the same distance as the petrol fuelled vehicles, due to the huge
storage space required. [4]
2.1.1 Heliocentris Instructor-FC 50
The Heliocentris is a Power Supply Unit that has a PEM Fuel Cell. This power supply
unit was deployed for this project. In figure 3, there are 6 components that make up the
system. Five of which are on the main panel and the other is an external Data Acquisition
Unit.
Figure 3 The Heliocentris Instructor [5]
The FC50 is the fuel cell stack, which is fuelled by gaseous Hydrogen from the Hydrogen
supply cartridge and Oxygen from the fan intake. 5 LCD displays read out the cell
temperature, output voltage, load current, hydrogen gas consumption rate and fan control.
There are 10 cells in the stack that can produce a maximum power of 50W at 5VDC.

16
The EL200 on the main panel is the electronic load. It has a potentiometer that enables
resistance values to be dialled in to create different characteristic curves.
The VC100 is a DC-DC voltage converter which provides a stable 12V supply voltage
for applications such as Battery charging. It provides a stable 12V supply for the TL10
which is a traffic light and part of the experimental package for the Heliocentris
Instructor.
Hydrogen Supply Option 2 is the metal hydride storage cartridge with quick coupler and
single stage regulator. This provided the hydrogen necessary for the experiments at
10bar.
2.2 Lithium Ion Batteries
2.2.1 Origins
In the search for a lighter power pack for portable electronic equipment the Nickel
Cadmium battery seemed to be the most suitable until the 1970s when the Lithium-Ion
batteries made it to the scene and since then they have competed with the Ni-Cd batteries
and are the most popular solution in the market.
Research for power solutions utilising Lithium metal (which is the lightest of all metals)
began in 1912 under G.N. Lewis and continued until 1991, when SONY Corporation
commercialised the first Li-Ion Battery [6].
2.2.2 Advantages
It has twice the energy density of the Ni-Cd batteries, with each cell having a high
voltage of 3.6V. This allows for single cell battery designs as is available in cell phone
batteries.

17
It does not suffer from the memory effect and has minimal self discharge compared to its
competitors. It is also low maintenance as it does not need a periodic discharge.
2.2.3 Disadvantages
It is fragile and charge regimes must be controlled by internal protection circuits or
microcontrollers to very accurate voltage ceilings. Temperature must be regulated as well
during charge cycles. It tends to fail after 3 years, but there are certain models that have
survived for 5 years. The metal Lithium is also a hazardous substance and transportation
is controlled.
2.2.4 Charging the Li-Ion battery
A battery charger was designed for this project. This system which is based roughly on
the Texas Instrument Li-Ion Battery Charger Solution implements the constant voltage
charging process.
The constant voltage charging process is the fastest method utilised today in charging
systems. It utilises a set voltage which is held constant while the state of charge of the
battery will determine how much current will flow [ref]. Figure 4, shows the constant
voltage process which was implemented with the MSP430F2132 microcontroller. This
process was executed with the microcontroller sending a 50% duty cycle Pulse width
modulated signal to the Li-Ion battery power pack during the above named process.

18
Figure 4 Constant Voltage Charge program for a 3.7V Lithium Ion Battery [8]
It is very important to note that as soon as the battery attains maximum voltage that the
current begins to drop as the electrical energy becomes converted to thermal energy. This
is where the charge controllers are useful such as the solution that was designed for this
project using the MSP430F2132 microcontroller.
It is also important to note that a safe timing method can be employed, in which the
battery charging process is timed and terminated when the time for a full recharge has
expired.
2.2.5 Varta Li-Ion Battery Design
Due to the fact that it is the alkaline metal with the smallest molecular weight and it has a
standard potential equilibrium of -3.045V, it is a very suitable material for negative
electrodes which provide very high energy storage capacity. However, it can only be
combined with organic electrolytes or molten salts as a result of its electro negativity and
the electrodes in a Li-Ion battery dissolve during discharging and are reformed during the
charge process. This leads to the formation of Lithium dendrites which can short circuit
the electrochemical cell structure [8].
19
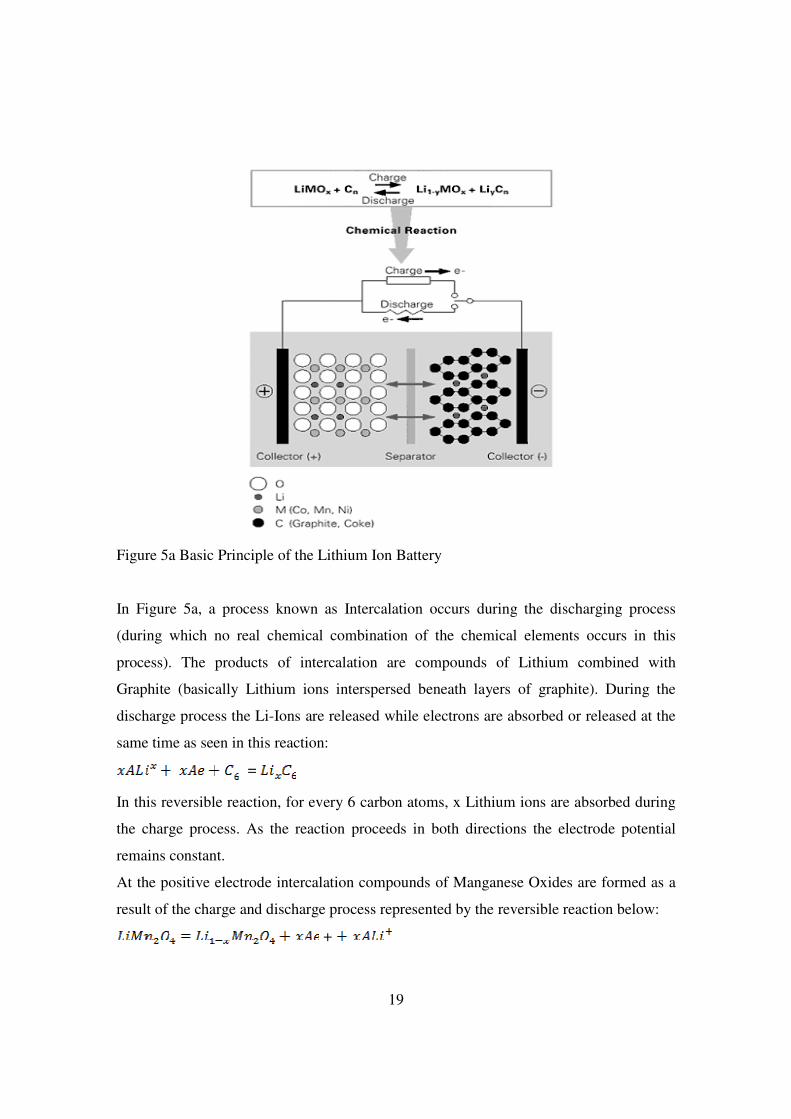
Figure 5a Basic Principle of the Lithium Ion Battery
In Figure 5a, a process known as Intercalation occurs during the discharging process
(during which no real chemical combination of the chemical elements occurs in this
process). The products of intercalation are compounds of Lithium combined with
Graphite (basically Lithium ions interspersed beneath layers of graphite). During the
discharge process the Li-Ions are released while electrons are absorbed or released at the
same time as seen in this reaction:
=
In this reversible reaction, for every 6 carbon atoms, x Lithium ions are absorbed during
the charge process. As the reaction proceeds in both directions the electrode potential
remains constant.
At the positive electrode intercalation compounds of Manganese Oxides are formed as a
result of the charge and discharge process represented by the reversible reaction below:
+

20
In the above equation adsorption means the active mass is discharged (going from right to
left) while Lithium Ions are released during the charging process. If both electrodes are
combined in a cell the Lithium ions migrate between both electrodes as shown in figure
5, this eliminates the problem of high solubility as the Li-Ions are highly soluble during
the above reversible reactions. The Carbon and Manganese Oxides host grids at the
electrodes remain unaltered, creating the ability to perform constant discharge and charge
cycles without significant cell degradation.
The Lithium Ion battery has an Energy density of 120Wh/kg and can operate at room
temperature [9].
Below is a diagram of the 3.7V Li-Ion battery that was deployed for this project. A very
important subcomponent of this battery is its overcharge and over-discharge protection
system (component 6 of figure 5b) which in subsequent chapters will manifest in data
collected during discharge and charge cycles generated over the course of this project.
This protection system protects the system to an overcharge voltage ceiling of 4.35V +/-
0.025V (with a delay/resume period of 0.4 to 2seconds at the 4.1V mark) and an over-
discharge voltage floor of 2.3V +/- 0.08V (with a delay/resume period of
40/200milliseconds at the 2.8V +/- 0.1V mark). The watt hour rating of the Li-Ion battery
shown in figure 5b is 7.3Wh.

21
Figure 5b Varta Lithium ion battery with Protection Circuit Module [10]
2.3 Direct Current Motors
2.3.1 Description
They are devices that transform electrical energy to mechanical energy. They can possess
a definite torque-speed characteristic or a highly variable one, meaning that they must be
adapted to the load they are supposed to drive. In figure 6, when a DC motor is connected
to a DC source a torque is produced as a result of the current flowing through the
armature which is immersed in the magnetic field thereby causing the armature to rotate.
A counter-electromotive force is developed in the armature as it cuts the magnetic field.
This CEMF is expressed in the following equation
= ZnƟ/60
Figure 6 CEMF in a DC motor [11]
Where Z is a constant that depends on the number of turns of the armature and the type of
winding; n is the speed of rotation of the motor and Ɵ is the flux per pole. The net voltage

22
acting on the armature in Figure 6 is ). The armature current is limited by the
resistance in the armature. Therefore;
I = )/R....when the armature is mobile.
And
I = )/R...............when it is stationary, because the CEMF is zero as no voltage is
induced.
As soon as the armature starts rotating, approaches leading to a decrease in the
armature current, this leads to a speed decrease. However, the motor accelerates to a
definite maximum speed. At no load is slightly less than . It is important to note that
they cannot be equal as this will cause the motor to halt. As the speed decreases, the net
voltage increases with the current and the motor speed will cease to fall when the torque
developed by the armature current is equal to the load torque.
2.3.2 Mechanical Power
This property of a DC Motor depends on two other important properties, the rotational
speed and torque of the DC motor. Where they are related by the equation:
The mechanical power is derived from the Power Supplied to the armature, which is the
product of the supply voltage multiplied by the armature current as expressed in the
equation below:
Applying Kirchhoff’s Voltage Law to Figure 6 and expanding the relationship;

23
Thus, the Mechanical Power is is the electrical power converted to mechanical
power. The second term represents heat losses from wind resistance and hysteresis in the
armature.
2.3.3 Mechanical Torque
The Mechanical Torque is inversely proportional to the speed of the rotating motor and
directly proportional to the mechanical power. This means it is also directly proportional
to the product of the flux and number of conductors on the armature. See the expression
below:
)
This property originates as a result of the CEMF on the armature that enables it to rotate.
2.3.4 Speed of Rotation
The speed of rotation is directly proportional to the supply voltage as will be
demonstrated in subsequent chapters. There is very minimal difference in the IR drop as a
result of the armature resistance when the motor moves from no load to full load. This
means , the Armature voltage can be replaced with in this equation:
= ZnƟ/60
Therefore, = ZnƟ/60 and the speed of the motor is:
n=60 ZƟ
2.3.5 Mechanical Efficiency
All known energy transfers involve losses. For machines that have rotating parts these
losses are known as mechanical losses. They are dues to windage, brush friction and can

24
be minimised by optimising the design of the contact surfaces and utilizing better cooling
fans and air flow control systems in the machine housing.
The Efficiency of a DC motor is the ratio of the useful output power to the input power as
expressed in the equation below:
[11]
2.4 Electric Drive Technologies
Four major motor drives are currently in service today. They are the Brushed DC,
Permanent Magnet (PM) Brushless DC (BLDC), Induction (IM) and Switched
Reluctance (SRM) Motor Drives.
Brushed DC motor drives have the ability to achieve high torque at low speed and are
well suited for traction equipment. However they are rugged and bulky with low
efficiency and are expensive to maintain. The presence of brushes and commutators
reduces the motor speed and adds to their overall weight.
IM drives are simple, less expensive and operate in hostile environments. They do not
have brushes and so their speeds are higher than the Brushed DC motor drive. They have
expensive controllers and a limit to the Torque known as Breakdown Torque (i.e. the
torque at critical speed, at which any attempt to operate the motor at maximum current
will cause a stall) that limits extended constant operation.
PM BLDC motor drives have higher efficiencies and power densities. This is due to the
fact that the presence of the permanent magnet eliminates the need for electrical energy to
produce magnetic poles. Their speeds and efficiencies rival the competition by 3-4 times.

25
They are expensive due to the cost of magnetic material and the field strength tends to
weaken over time due to the production of a stator field component.
SRM are new and gaining popularity because of their simplicity in terms of design,
operation and control. They also have outstanding torque-speed characteristics and unlike
the IM drives can operate over extended periods of constant power. Due to its low rotor
inertia and simple design, it has a higher fault tolerance. It also has good IR reduction
measures as there are no magnetic sources to induce hysteresis. However, they can be
noisy and suffer from torque ripple (Selection of Electric Motor Drives for Electric
Vehicles) [12].
2.4.1 Electric Drive Hybridisation
The term Hybrid Vehicle as defined by the United Nations is a vehicle with 2 different
energy converters and 2 different energy storage systems for the purpose of propulsion.
There are three basic architectures of vehicle drive train hybridisation: Series Hybrid,
Parallel Hybrid and Series-Parallel Drive Trains or Combined Drive Train.
2.4.2 Serial Hybrid Drive
In the Series or Serial hybrid drive, the combustion engine directly drives an electric
generator instead of the wheels. The electric generator then charges the battery pack
which drives an electric motor that propels the vehicle. This is the case in the prototype
designed for this project. The only difference is that the combustion engine is replaced
with a hydrogen PEM fuel cell. There is no mechanical link between the PEM fuel cell
and the motor allowing maximization of the energy density of the fuel cell and efficient
dispatch of energy for start and stop situations. In a real motor vehicle, the serial hybrid
implementation with internal combustion engine (ICE) must have the energy pass from
the generator to the motor. During extended drives, IR losses accumulate as a result of
this electrical transmission making it less efficient than conventional transmission. Figure
7 shows the series hybridisation of the two power trains (i.e. Battery and ICE). The GM
Volt which will be available in 2020 is an example of the Serial Hybrid.

26
Figure 7 Serial Hybridization of Battery and ICE Power trains [13]
In figure 7, VSI 1 and 2 are voltage source inverters which invert the DC voltage signal
from the battery to provide AC Voltage to the EM 1 and 2 which are Electric Motors.
Please, observe the serial arrangement of the power trains by following the black arrow.
2.4.3 Parallel Hybrid Drives
The Parallel Hybridization system involves the connection of both powertrains alongside
each other to the mechanical transmission system. Today, they are designed by
combining the large generator with the motor to replace the starter motor and alternator.
A larger battery than the conventional 12V battery is used to store energy so that other
accessories can be powered more efficiently regardless of the speed of the motor. In
Figure 8, the power trains are coupled by a differential gear which allows the input speed
to be controlled.

27
Figure 8 Parallel Hybridization of the ICE and battery powertrains [13]
This coupling allows for the ability to choose the dominant part of the drive train, be it
the ICE or the battery or both. The Toyota Prius is a good example of the parallel hybrid.
2.4.4 Combined Hybrid Drives
Combined or Series-Parallel Hybridization involves both features of the serial and
parallel drive trains. They utilize power split devices that control the path of power from
the two powertrains. This allows for decoupling of the ICE power or the primary power
from the driver controls. Typically, the combined hybrid will have a smaller more
efficient engine than the ICE that will allow it to generate maximum torque at low rpm
during stall conditions and acceleration from standstill. Figure 9 is a combined Hybrid
which possesses a planetary gear unit with Ring (R) and Sun (S) gears and a Carrier (C) –
see figure 10. It is observed that the system is much more complicated and expensive as
the different drive trains can be coupled and decoupled by the planetary gear system via
the DC bus. Observe that the electric motor shares a common shaft with the transmission
shaft and all three machines are connected together via the carrier in figure 9.

28
Figure 9 Series-parallel or combined hybridization
Figure 10 Planetary Gear System: T and Omega represent Torques and Correspondent
speeds in the electric motors and the different components of the planetary gear unit.

29
Other Hybridization technologies exist, such as through the road hybrids which have
independent powertrains that operate on separate axles. The ICE and Electric motor
combine power when more power is needed and then the ICE powertrain is disconnected
to allow the electric powertrain kick in. Regenerative Braking allows for battery charging
and the system uses the energy more efficiently in the 4 wheel drive configuration
because energy from the ICE is activated only during heavy traction. Otherwise, the
electric motors in the electric powertrain provide traction.
There is also the two mode technology which Daimler is currently deploying. GM and
BMW use an electric continuously variable transmission, allowing their vehicles to
operate at high efficiencies and economise fuel using a four fixed ratios gear system. It
has improved torque speed characteristics as a result of the implementation of the electric
continuously variable transmission.
Full Hybrids can either run on the ICE alone or the battery system or both such as the
Toyota Prius. When the battery can be connected to the national grid it is called a Plug in
Hybrid Electric Vehicle.
There are also varying degrees of hybridization, which range from micro to mild. The
difference lies in the presence of large starter motors in both conventional vehicles and
the ability to cleanly engage and disengage the engine during starts, cruise and stop
conditions. [14]
2.5 MSP430F2132 Mixed Signal Microcontroller
2.5.1 Description
It is an ultra low power (i.e. Active mode-250uA, 2.2V; Standby mode-0.7uA; Off-mode-
0.1uA) microcontroller for portable applications. It has 2 built in 16bit timers with
capture compare registers to register events, a 10 bit Analogue to Digital Converter
(ADC) with integrated reference and data transfer controller that can operate in 5 low
power modes. It has a unique 16bit RISC (i.e. the instruction set for the chip architecture

30
allows for word and byte data assignments to the sixteen 16-bit registers, there are 51 of
these instructions that operate at 62.5ns cycle time) and a Basic Clock Module that can be
configured for frequencies up to 16MHz. There are 28 pins on the micro controller a
shown in figure 11. These input and output (I/O) pins provide digital and analogue access
to the internal devices on the chip and to peripheral devices like the tuning fork or
resonator for high frequency applications.[14]
Figure 11 I/O Pins
The system architecture of the MSP430F2132 has 27 instructions and 7 addressing modes
that allow for programming in assembly and C. Programming for this project was done in
assembly. The architecture is orthogonal allowing for the same instructions to be used in
all the addressing modes. The architecture is shown in figure 12.

31
Figure 12 MSP430 CPU Architecture
In Figure 12, the first register is the program counter which points to the next instruction
to be executed in the source code and is incremented by 2, 4 or 6 depending on the
number of bytes for that instruction. The Stack pointer is used to store return address of
subroutine calls and interrupts during the execution of source code to enable a logical and
correct return to the program execution when subroutines are called. The status register
contains status bits that are set or cleared after carries, zero sum, overflow or negative
operations are executed. It also has the General Enable bit for maskable interrupts, the
CPU off bit, the Oscillator off bit and the system clock generator bits to turn of the
clocking and oscillator systems. The constant generators generate 6 commonly used

32
constants without requiring additional code. They last set of registers are general purpose
registers used for data transfer, index values and pointers. They can be accessed by the 27
core instructions in either byte (8 bit) or word (16bit) format.
2.5.2 Operating Modes
There is one active mode of operation for the MSP430F2132 and 5 Low Power Modes
(LPM) for controlling the events in the source code. This is so that power is efficiently
consumed and data movement is controlled effectively and in a timely manner. The
battery charger in this project was programmed to operate at low power mode 0, during
which the CPU is disabled and the Auxiliary clock (ACLK) and Sub-Main Clock
(SMCLK) remain active while the Main Clock (MCLK) is disabled. All the Low Power
Modes have the CPU disabled; However, LPM1 has the ACLK and SMCLK active while
the MCLK is disabled. The Digitally Controlled Oscillator (DCO) remains active if it is
used in the active mode, else it is disabled. LPM2 has CPU, MCLK, SMCLK disabled
while the DCO and ACLK stay active. LPM3 has DCO, CPU, SMCLK and MCLK
disabled while the ACLK remains active. In LPM4, all the clocks and oscillators are
disabled. Below is a diagram showing all the operating modes available for the Basic
clock.

33
Figure 13 Operating Modes of the MSP430F2132
2.5.3 Digital Input and Output
The MSP430F2132 has eight digital I/O ports that can read and written to. They appear
as pins on the PCB (Printed Circuit Board) can also be configured for input, output,
direction, Pull-up/Pull down Resistor Enable, Function Selection, Interrupt flag and
Interrupt enable capability. Only Pins 1 and 2 have Interrupt Capabilities, they share the
other capabilities with the other pins.
2.5.4 Timers
Timer A (TA) was used in this project for the timed charge routine. In figure 14, the 16bit
counter (TAR) has 3 capture/compare (TACCR0, 1, 2) registers and generates pulse
width modulated (PWM) signals which can be output to the digital output pins. It can
also provide interval timing as well to enable the execution of timed events. It also has
interrupt capabilities as well, enabling an interrupt when there is an overflow condition in
any of the capture compare registers.

34
Figure 14 Timer A
2.5.5 Analogue to Digital Converter (ADC)
The 10bit ADC supports fast A/D conversions The 10bit core converts analogue input to
10bit digital representation which is stored in the ADC10MEM register. This is done by
using two programmable/selectable voltage levels (VR+ and VR-) to define the upper and
lower limits of the converted value which in this project is the voltage signal of the
Lithium Ion-Battery pack. The process is controlled by the ADC10CTL registers that
possess control bits for configuring the A/D conversion. This process must be clocked
effectively and the ADC10CLK provides the sampling period which is sourced from the
ADC10OSC, MCLK, SMCLK or ACLK. Figure 15, shows the 10 Bit ADC. It also has
sample select control ADC10SSEL, Reference generator, Data Transfer Control (DTC)
so as to guarantee automatic data conversion without CPU intervention.

35
Figure 15 10bit ADC [15]
3.0 Methods and Materials
Inspiration for this project was drawn from the Texas Instrument Li-Ion battery charger
solution and the project was nicknamed volTRONe (VOLTRON is a Japanese cartoon
series I watched as a child. Voltron is formed by 5 Lion robots. Once the Lions are
integrated, they form a gigantic robot that defends the universe from its enemies).

36
The system design process in this project is modular. This means, the system is divided
into modules which are designed, built and tested separately. Once their viability is
confirmed, they are integrated to form the hybrid electrical serial drive system that was
designed for this project.
3.1 System Architecture and Modular Design
Figure 17a Schematic of the Hybrid Electric Serial Drive
On a more serious note, Figure 17a shows the electronic circuit of the system that was
designed. It is very important to note that this system was designed from cheap
components, except the Heliocentris FC50 which is an expensive system. In the figure
above, the MSP430F2132 provides a pulse that has a 50% duty cycle via P1.1 which is
one of the digital input/output pins described in the literature review. This enables
efficient dispatch of the fuel cell power during the charging program. Furthermore, the
pulse width modulated signal passes through the buck converter which acts like a low
pass filter and if the frequency is higher than the cut off frequency (which is 1.2kHz for

37
this circuit) of the Inductor and capacitor on the back end of the buck inverter, the voltage
of the capacitor is held constant and is equal to the mean input voltage to the buck
converter. Only 1 channel is monitored by the microcontroller program, A0. This channel
is directly connected to the positive terminal of the battery and the ADC interrupt service
routine was written to detect voltages as low as 0.3V and as high as 1.45V. At the 1.45V
level the battery has charged ending the interrupt routine and starting a terminate charge
subroutine. Thereby, stopping all the timers and the ADC sampling process. This will be
shown in subsequent subsections of this chapter.
The hybrid serial drive system consists of 5 main modules. They are: the Data
Acquisition module, Microcontroller Module, Voltage Regulator and Power Module, DC
Induction Motor Electric Drive and the PEM Hydrogen Fuel Cell System as shown in the
block diagram in figure 17b.
Figure 17b Block Diagram of Hybrid Electrical Serial Drive System (aka volTRONe)

38
The Microcontroller Module is composed of an Alienware Laptop PC equipped with a
dual core AMD Athlon computer which runs the IAR embedded workbench Integrated
Development Environment on which the Microcontroller source code was developed,
tested and deployed. This module also includes the MSP430F2132 Mixed signal
Microcontroller which provides the Pulse Width Modulated Pulsed Voltage signal to the
Lithium Ion Battery pack and acquires its voltage signal for A/D conversion. It is in this
module that the Sourcecode is downloaded to the MSP430F2132 and executed.
The Data Acquisition Module (see figure 18) is made up of basically my laptop which is
an acer Extensa 5220 with an intel Celeron processor and a Buffalo HDD with 300GB
capacity. The National Instruments Labview Program known as Signal Express runs the
Data Acquisition Task. It collects data from 4 streams via the NI USB 6088 DAQ, which
has 8 (12bit) inputs that can sample (digital and analogue) data streams at 10Kilo
Samples per second: The Voltage signal from the Li-Ion battery, the current signal from
the Li-Ion battery, the Voltage signal from the fuel cell and the digital pulses generated
by the pulse width modulation module. There is also a tachometer attached to the system
to measure the motor’s speed.
Figure 18 Data Acquisition Module

39
In figure 19, a panel of the data acquired during a charge program is played back showing
the four different channels that were sampled, including timestamps and signal behaviour
over the period of the program. Please, observe the 50% duty cycle signal at the bottom
part of the panel. This is evidence of the microcontrollers ability to pulse Port 1.1 and
create the PWM input of power from the FC50 PEM fuel cell. The signal has some noise,
which is acceptable because the circuit was built on a breadboard and other devices
sharing the board such as the electronic control unit from the Heliocentris and the
computers could have generated some noise.
Figure 19 NI-Signal Express Data Playback of charge program.
The voltage regulator module and power module was implemented with the 1.5A
Adjustable Output Positive Voltage regulator, known as the LM317 or NCV317. It can
provide voltage outputs up to 37V. It has 3 terminals and two 1Kohm resistors were used
to adjust the voltage supply (VCC) to the Microcontroller to provide the precise voltage

40
output. Figure 20, shows the configuration that was used in the serial hybrid system
designed for this project.
Figure 20 Voltage Regulation Module.
The DC Electric Drive Module is composed of the Li-Ion battery, the DC motor and the
switch gear for loading the motor to simulate different drive cycles. From figure 17b, the
system is loaded with a 1.2ohm-300W resistor to draw more current from the battery to
emulate different inclines if the motor was deployed to turn the wheels of a tire.
3.1.1 MSP430 Microcontroller Battery Charger Programme Design Environment
One major endeavour during this project was to design a battery charger controlled by the
MSP430F2132.This was achieved by writing a program in the IAR systems IDE to
efficiently deliver power from the FC50 to the Varta Li-ion batteries using pulse width
modulation from the MSP430 and the constant voltage charging method. Below is a
block diagram of this system.

41
Figure 20a Battery Charger Block diagram
The microcontroller programme was designed using the IAR systems Embedded
Workbench IDE (Integrated Development Environment). This IDE integrates the
following systems: a compiler, assembler, linker, builder, word editor, MS DOS utility
and a high level language debugger all managed by the efficient project manager. It is a
very versatile IDE and can be used for developing projects used by many of the
processors in the today’s market. This workbench can be deployed as a Flash Emulation
tool debugger or a Simulator. The assembler was used extensively for this project to write
the source code because it uses the same mnemonics and syntax as the TI MSP430
assembler allowing portability. This assembler has a C-Pre-processor, 255 significant
characters in symbol names, up to 65536 relocatable segments per module and support
for complex expressions with external references. The Linker links Assembler source
code to the Compiler to produce machine code for the MSP430 which is the object file
that is downloaded to the microcontroller. After the program has been written, it can be
built and then debugged [ref].
3.1.1a Charge control Algorithm
Figure 20a is a representation of the charge algorithm. Basically, the program starts with
the initialisation of the Stack pointer to CSTACK allowing access to memory locations
0x0002 to 0xFFFD. Then the 10bit ADC is enabled to do a repeated multichannel sample
of channel A0 and do a sample and hold of the analogue voltage values from channel A0.
The Basic Clock is them set up using the low frequency oscillator while the Master Clock
is set up to time the digitally controlled oscillator.

42
The ADC core is then checked for activity, with an LED at Port 1.1 coming on if data is
streaming through A0. The RAM location for the storage of the voltage data values is
initialised to 0x200. The Basic timer which will be used to do a safe time charge by
counting up to 30 minutes, which is the time for a stationary charge with the DC motor
disconnected. The BCSETUP subroutine sets up Timer-A to count up and initialise the
registers that will store the minute and second values.
Once this is all done the clock subroutine is executed in LPM0 and the count up (as
opposed to count down) is executed. Every time the loop is exited the voltage is checked
to see if the battery is charged. The CPU is then turned off to conserve power and then
The LED on Port 1.1 is pulsed at a 50% duty cycle to create the PWM effect necessary to
effectively dispatch power from the FC50 PEM fuel cell. The frequency of the signal is
designed for 1.5 kHz if the crystal oscillator is connected to the MSP430F2132.
Also included are snap shots of the Source code to match with the algorithm, See figure
20c.

43
Figure 20b Flowchart showing the charge algorithm

44

45

46
Figure 20c Battery charger source code
The ADC10 interrupt service routine is the software constant voltage charge
implementation. Basically, the MSP430F2132 is called out of LPM0 and sampling is
stopped to check the current value acquired by the ADC10. First we confirm that a
battery is connected by confirming that the voltage signal is between 0.3V and 1.5V. If
the signal is not within this range then the LED at Port 1.0 is lit.
The next loops are checks of the voltage value on A0 in increasing order from 0.85V to
1.42V to 1.45V. If the voltage check fails, the system puts out a 50% duty cycle pulse
width modulated signal on Port 1.1.
Once the interrupt service routine for the ADC10 is complete the mainloop is executed
again and the battery condition is checked to verify the battery is not fully charged. If it
is, then the terminate routine is jumped to, where the timers and ADC10 are stopped and
the PWM signal ceases. The microcontroller is then returned to LPM0.

47
3.1.1b Sourcecode design, build and test
Figure 22 describes the Sourcecode design process. The control program was designed
using a modular design approach in which the different tasks such as pulse width
modulation, A/D conversion and timing were completed as modules. Therefore 3
modules were designed and tested. The ADC module was designed first and tested to
read the signal from channel A0. This was checked by using an LED on the breadboard,
which would light up once a repeated sampling of the channel has been done.
Figure 21 Pulse Width Modulation of Li-Ion battery voltage.
Once, this was done, the pulse width modulation module was designed to act as a switch
that turned on and off at Port 1.1. It was tested with an LED and once the LED started
blinking, an oscilloscope was used to probe the signal to confirm that a 50% duty cycle
signal was being produced. See figure 22, which shows the effect of the PWM signal on
the battery voltage. The safe timer was designed to count up to 30 minutes using Timer A
as the clocking system with the Master Clock driving the Digital Clocking Oscillator.
Finally, the three modules where then integrated and built to create the final program that
was tested and deployed for this project.

48
Figure 22 Source Code Modular Design Process
3.2 Full System Integration
After the software was designed, it was tested first with a TT1 EL302D Dual Power
Supply Unit, see figure 23. This was necessary to confirm that the system actually could
handle a stable DC power source and that the large signal behaviour from the electronic
circuit matched the characteristics required, such as the 50% duty cycle signal which was
probed by the oscilloscope to ensure that it was actually a pulsed signal that was output at
the correct port. Figure 24 shows the digital settings of the Dual Power Supply that were
used for the initial test.

49
Figure 23 Initial Test Module with Dual Power Supply Unit and Oscilloscope
In figure 24, the test module circuit that was designed is in the middle while 2 different
Power supply settings on the left and right show the voltage input to the MSP430F2132
which is 3.7V and the other voltage setting is used to simulate the connection of a 4.2V
fully charged battery and a dead battery.

50
Figure 24.Dual Power Supply and Initial circuitry showing the Power Supply and Pulse
width Modulation Test Modules
Please note that the condition photographed is for a live-fully charged battery, that is why
the blue LED’s are lit.
3.2.2 Integration of Stand Alone System
One objective of the design process is to integrate the system so that it can standalone and
not receive power from the Dual Power Supply Unit. This was achieved by connecting
the different modules in figure 17b in a serial configuration and including the Data
Acquisition Module as shown in figure 25.

51
Figure 25 Fully Integrated Standalone system
Moving from left to right in figure 25, the blue laptop is the Alienware PC from which
the control program was debugged and run. The second laptop runs the Signal Express
program for the Data Acquisition endeavour and stores the data on the grey hard drive.
The NI USB 6088 is in the middle right behind the DC motor and double blade fan
(which has one blade painted black). The Heliocentris FC50 and Hydrogen Supply panel
is behind the electronic circuit that contains the power supply regulation system, the pulse
width module, the switch gear for the load and the green Varta Li-Ion battery. The
Oscilloscope shows a moving stream of the 50% duty cycle signal that charges the
battery.
3.3 Drive Cycle Emulation and Motor Load Design
This part of the system was designed to meet the final objective of generating drive
cycles. The drive cycle was simulated using a simple switch mechanism and a 1.2ohm

52
resistor as a load. In figure 26, the switch mechanism consists of two switches, J1 and J2.
J1 is used to connect the 10mW DC motor to the Li-Ion battery. When J1 is closed and J2
is open, the fan is energized and the blades begin to turn at maximum speed. When J1
and J2 are closed, the emulator simulates an increase in the load on the system or a steep
incline in the real world. This draws more energy from the battery, simulating a sustained
increased drainage of the battery’s energy.
Figure 26 the Drive Cycle Emulator
The Drive Cycles that will be discussed in the next chapter were generated by painting
one of the blades on the fan black and using a Tachometer to measure the number of
revolutions as the motor powered by a fully charged battery was run for a one hour
period. This drive cycle emulates the journey from Stornoway bus stop to Port Ness
which is the red route on the map in figure 27 which takes 1 hour to complete by bus over
26.1 miles. In chapter 4, the system will be scaled up and a complete analysis will be
done on this drive cycle.

53
Figure 27 Stornoway-Port Ness Route
4.0 Results and Discussions
4.1 Charge Cycle Analysis
In chapter 2, the constant voltage charging method was mentioned as the chosen method
for the battery charger system design. The results in this chapter will demonstrate the
efficacy of this method as it was implemented during the experimental procedures that
were carried out to test this prototype.
During the constant voltage charge process of the Varta Li-ion batteries, data was
collected from the Heliocentris and Varta Li-ion battery using the National Instruments
Labview Signal Express and played back. Figure 28 shows the data for the charge cycle
that was generated for a fully discharged battery.

54
Figure 28 Charge cycle of the battery
In figure 28, the white line is the voltage of the FC50, while the red line represents the
voltage of the Li-Ion battery. The y-axis is the voltage axis and the x-axis is the time in
seconds. It was observed that the charging process took only 44minutes (i.e.
2639seconds). This exposes the efficacy of the charger that was designed for this system
as it employs pulse width modulation to efficiently transfer the power from the FC50 to
the Li-ion battery during the charge process. It is important to note that the battery
reaches its minimum discharge voltage level at 2.75V (as mentioned in the literature
review). At this voltage level the protection circuit kicks in and limits any further
discharge. Since the data log was terminated to collect the charge cycle data, this
minimum discharge voltage level is only visible in subsequent data logs that will be
presented for the discharge cycles generated during this experiment.
Figure 29 is a much higher resolution of the voltage of the Li-Ion battery charged over
the 43minute period by the constant voltage process controlled by the MSP430F2132.

55
Figure 29 Voltage of the Li-Ion Battery during the constant voltage charge cycle
It was observed from the graph above that the voltage characteristics matched the
constant voltage characteristics described in the literature review. This is a very important
checkpoint as it validates the battery charger design and efficiency. The battery charges
up to its rated voltage, 3.7V. In subsequent sections, the protection circuit kicks in at the
maximum overcharge levels and maintains a plateau. The voltage signal might look
noisy, this is due to the resolution of the data acquired, which is 1000 samples per
second.
The voltage from the FC50 was also monitored on the NI-Labview Signal Express
platform. In figure 30, the FC50 supplies a relatively constant voltage and this voltage is
maintained throughout the constant voltage charge process. This is another checkpoint as
the FC50 voltage profile should remain constant during the charge and discharge cycles
of the Li-Ion battery. The average voltage of the FC50 during this process was 7.75V.

56
Figure 30 FC 50 voltage data during charge cycle
4.2 Discharge Cycle Analysis
The discharge cycle was generated in tandem with the drive cycles which will be
discussed in subsequent sections.
Figure 31 Discharge cycle of the battery showing FC50 and Battery voltages

57
Discharge of the battery was executed by switching on the 10mW fan to emulate a driven
motor and adding a 1.2 ohm resistor to the load to simulate inclines and sloped terrains.
In figure 31, the voltage profiles for the FC50 and the Varta battery were acquired via the
NI-Labview signal express platform showing the effect of the constant and varied loads
on the voltage profile during the drive cycle emulation. The FC50 is the white line, while
the battery is the red one.
Figure 32 Voltage of the Li-ion battery during charge cycle
The Discharge cycle in figure 32 was generated over a 53 minute period. The y-axis
represents the voltage signal, while the x-axis represents the time in seconds. The
discharge cycle is a representation of the drive cycle emulated during the project.

58
Figure 33 Initial loading of the battery to emulate sloped terrain
The steep voltage drops in figure 33 represent periods during the discharge cycle that
emulate a change in the slope of the terrain that would result in an increased load on the
battery. As mentioned in the previous chapter, this was accomplished by adding a 300W,
1.2 ohm resistor to the load. The first drop occurs 11.86 minutes into the journey and is
sustained for 2 minutes and 2 minutes later the same voltage drop is initiated by
switching on the resistor load. As the discharge continues, the battery voltage level passes
the minimum over-discharge voltage level in figure 33. This becomes apparent when the
load is increased by connecting the resistor. As soon as the load is increased, the motor
speed drops severely and the protection circuit module becomes activated.
Figure 34 Over-discharge of the battery and protection circuit activation

59
Any further increase in the load, results in delays of up to 40-200milliseconds, so that the
battery can charge quickly and drive the load. This is evident from the over-discharge
after loading the battery with the motor and resistor, in figure 34, the voltage signal
oscillates between a minimum of 0.6V and 2.95V. It was observed that the battery’s
protection circuit takes on some occasions 30.84 milliseconds to recharge back to 2.95V
before discharging again to 0.6V. At other times, the protection circuit takes longer, up to
60 milliseconds.
Figure 35 Short Stop and recharge
A 6 minute stop/start was executed to emulate a stop at Bavras which is on the route of
the drive cycle that was generated. In figure 35, the battery charged from 2.692V to
3.161V in 6.21minutes. This means that a short stop to pick up passengers (which is
within the 6 minute time window) results in a 17% increase in the state of charge
occurred. In a rural region like the Western Isles, where sheep roam the hills and
sometimes get on the roads, this could translate to minimum but essential recharge of the
battery pack. It was also observed that when the short stop occurred the recharge was
instantaneous. This is very important because drive cycle profiles such as urban profiles
would allow for quick recharge that will help keep the battery from reaching the
minimum over-discharge voltage.

60
Figure 36 Final discharge and end of drive cycle
In figure 36, right after the short stop at Bavras, as the drive cycle emulation continues
there is an emulation of a change in the slope of the terrain. It occurs below the minimum
discharge voltage level and the protection circuit becomes activated as is evident from
figure 37. The protection circuit causes a delay/resume sequence for the charge and
discharge of the battery. In the next subsection, this delay/resume will be discussed in
relevance to the motor speed.
Figure 37 Delay/Resume sequence for final discharge.

61
4.3 Drive Cycle Analysis
The Drive Cycle emulated for this project is known as a rural drive cycle. This is due to
the location in which the drive cycle was generated. Stornoway and the surrounding
towns in the Western Isles can be classified as rural with respect to the road and routes
for transport vehicles. In figure 38, the red route was emulated in the drive cycle that was
generated for this drive cycle.
Figure 38 Western Isles map and red route
To emulate this drive cycle in the lab, the DC motor was run for 1 hour. During this time,
changes in the slope of the terrain were emulated at the re-entrant on the map before
Bavras, at Ballanthrushal, at Melbost and at North Galson. The rest of the terrain on the
map looked flat and a real road trip on that route from Stornoway to Port Ness proved
this, as well.
The Drive Cycle generated in figure 39 shows the varying speeds of the motor over a 57
minute period. As the terrain changes, the load on the battery changes; this is evident

62
from the change in the motor speeds as an additional load of 1.2 ohms is added by
engaging the switch on the drive cycle emulator circuit.
Figure 39 Drive Cycle Emulation for the journey from Port Ness to Stornoway
The Drive cycle above will be compared to the discharge cycle of the battery during the
emulation process. It was observed that the speed of the motor decreased at a constant
rate from 2836 rpm to 2804 rpm during the first part of the journey to Laxdale. At the re-
entrant before Bavras (at point A), an increase in the gradient of the terrain was emulated
by connecting the 1.2ohm resistor to the battery while maintaining the connection to the
motor. This increase in the load on the battery is evident from the first steep voltage drop
in figure 40. The motor speed at this point decreases sharply from 2804 rpm to 2382rpm.

63
Figure 40 Discharge cycle of battery during Drive Cycle emulation shown in figure 39
A change back to flat terrain is emulated and another change back to a steep slope is
sustained for 3.71minutes. This results in another decrease in the motor speed in figure
39, from 2765rpm to 2331rpm. A voltage drop of 3.75V to 3.5V occurs as the load on the
battery is sustained, discharging the battery to the 3V level.
At Bavras, the motor is stopped and the battery is allowed to charge for 3 minutes. This is
the region below the C mark, where the motor speed goes to zero. The battery is observed
to charge from 3.45V to 3.75V as shown in figure 41.
Figure 41.Short Stop at Bavras (region C of drive cycle)

64
After the short stop the battery is loaded with the motor only. There is a sudden drop in
the voltage from 3.75 to 3.161 volts, this is as a result of the starting torque of the motor
which is highest as the motor transitions from static to dynamic states. The voltage is
stabilized at 3.47V as the counter electromotive force in the armature and the battery
voltage gradually equalize. It must be noted that this never happens, as the motor current
will be zero and the speed will become zero as well. At the moment the load torque
equals the torque generated by the armature current in the motor, the voltage stabilizes at
the 3.47V level.
At region D, a quick increase in the load is made, leading to a discharge to 0V, in figure
40. It is observed that the protection circuit does not get activated. More changes in the
slope of the terrain are emulated for in regions E and F and the battery is discharged to
zero volts, both times.
As the battery discharges below the minimum over-discharge level at 2.75V, the
protection circuit gets activated. In region G, the slope of the curve gradually approaches
infinity as a constant delay/resume sequence of charge and discharge occur. As the speed
of the motor falls below 2000 rpm, the motor speed oscillates with the voltage of the
battery as the protection circuit initiates this delay/resume sequence to prevent a full
over-discharge of the battery.
4.4 DC Motor Characteristics during Drive Cycle Emulation
The Mechanical Power, Torque and Efficiency were evaluated during the drive cycle
emulation.
Due to the fact that a small 10mW motor was deployed for this project, an assumption
was made to the effect that all IR losses were negligible as they would be very small
compared to the supply voltage.
This allowed the use of the supply voltage (Es) for the calculation of the mechanical
power, by equating it to the armature voltage (Eo).
Therefore, mechanical power = (Es) I

65
For this system the power curve will track the voltage curve of the discharge cycle in
figure 40.From Figure 42, which is the current that passes through a 1.2ohm resistor in
the drive cycle emulator. The maximum power dissipated when the switch is closed is
8.26W.
Figure 42 Current data for 1.2ohm resistor (current values were divided by 1000)
The Torque will also track the same curve in figure 40, with the minimum torque of
0.03N.m occurring at the lowest speed of 1532 rpm and the maximum torque of
0.038N.m occurring at the highest speed of 2836rpm. This is consistent with known DC
motor principles, as a higher torque must turn the motor’s shaft from a stationary position
until the torque from the load and the motor become equal.
The electrical efficiency of the system is a product of all three components of the hybrid
drive system. The FC50 supplied a maximum power of 50W over the course of the
discharge cycle in figure 31. At its peak, the efficiency of the FC50 is 63%. The Varta
batteries supplied a maximum power of 8.26W to the DC motor (during emulation of
sloped terrain). The system efficiency at maximum operation is very low. This is as a
result of poor sizing of the system load. The system efficiency as a product of the
hybridized energy sources is 10.4 %.

66
5.0 Conclusions and Recommendations
5.1 Conclusions
Based on the results acquired during the course of this project, the hybrid serial drive
system can be effectively deployed with a Fuel cell as the primary energy source and a
Lithium Ion Battery as the secondary energy source while the MSP430F2132
microcontroller efficiently dispatches power to the battery as it drives a motor.
One major achievement was the deployment of the battery charger, which was designed
from scratch in the labs and programmed to be controlled by the MSP430F2132. It took
less than 1 hour to charge a fully discharged battery to its rated voltage of 3.7V.
Another key achievement was the ability to sustain a constant energy drive from the fuel
cell, enabling it to charge the battery only and not deliver power directly to the primary
load. It is evident from the results that as long as the primary energy source (i.e. the fuel
cell) does not expire, the secondary energy source (i.e. the lithium ion battery) can drive
the motor. This is made possible by the employment of the constant voltage charge
method in the charge algorithm utilised by the MSP430F2132, which delivers a pulse
width modulated signal from the hardware to enable effective dispatch of power to the
battery. The constant voltage charge method was very effective and is the easiest method
for keeping the battery charged over the drive cycle emulated. A 17% increase in the state
of charge was observed over a 6 minute period during a short stop. In an urban setting
this could guarantee availability of battery power as there are more starts and stops in the
city, which would translate to more short periods for recharging the battery.
The Protection Circuit Module (PCM) is a very important component of the Lithium-ion
battery. This is where they surpass the Nickel Cadmium and Lead Acid solutions
because, the PCM helps to maintain the state of charge around 75%. This was very
essential for this prototype, because the motor kept running even when the voltage dipped
close to the 0V level. The PCM always initiated a delay/resume sequence of

67
approximately 50 milliseconds to enable a temporary charge and discharge of the battery,
even though the motor speeds oscillated with this sequence. However, no extra loading of
the system could be done as it would result in a full stop of the motor.
Finally, it was concluded that appropriate sizing of system components would result in a
more efficient hybrid. If the system was scaled up linearly while maintaining the same
materials, the efficiency will increase and so will the energy density. However, an
increase in size will also result in an increase in the surface area as well as the
temperature of the working system. This means more will have to be done to cool the
system effectively.
5.2 Limitations
The system was limited by the lack of a working crystal oscillator. This would have
ensured better pulse width modulation at a higher frequency, enabling the constant charge
process to occur faster and much more efficiently.
There was also a lack of proper sized motors. A 10mW motor was used for this project.
5.3. Recommendations
An increase in the scale of the prototype for future designs is very profitable as larger
loads ca be driven and the system could be ported to a transport vehicle. If this is done,
the design goal should be to drive 4 separate motors powered by the battery while it is
charged by the fuel cell. A better control algorithm should be deployed, to control the
dispatch of energy from the battery.
A second or third array of lithium-ion batteries can be deployed while using a load
dispatch system controlled by the MSP430F2132 to guarantee an operating reserve. This
operating reserve will prevent the activation of the PCM, enabling a smoother discharge
and drive cycle. Stationary applications are also a possibility, as the system has a battery

68
charge incorporated to it. If an alternator is incorporated to the system, then it could keep
one array of batteries charged, while another array drives the primary load.
Research into speed control and efficiency optimisation is very necessary as the speed
control component of this project is very rudimentary.
Regenerative Braking is also a major avenue for research, as the start/stops can generate
reactive power which can be captured by electric dual layer capacitors or super-
capacitors. The use of flywheels can also be investigated in the effort to maximise
efficiency and improve the energy storage potential of the drive system.

69
References
[1] Brent Crude Oil Prices www.thisismoney.co.uk
[2]A Crude Awakening-The Oil Crash (Produced and Directed by Basil Gelpke and Ray
McCormack in 2006)
[3] PEM fuel cell diagram http://www1.eere.energy.gov/hydrogenandfuelcells/
[4]PEM fuel cell
http://www1.eere.energy.gov/hydrogenandfuelcells/fuelcells/fc_types.html#pem
[5] Heliocentris Instructor
http://www.heliocentris.com/fileadmin/user_upload/Datenbl%C3%A4tter/EDU_TD_Inst
ructor_INT_eng_0907_web.pdf
[6] The battery university, Isidor Buchmann, founder and CEO of Cadex Electronics Inc.,
in Vancouver BC. http://www.batteryuniversity.com/partone.htm
[7]Texas Instruments Lithium-Ion Battery Charger Solution
http://focus.ti.com/lit/an/slaa287/slaa287.pdf
Automobile Electrical and Electronic Systems, Tom Denton, third edition, 2007
[8] Rechargeable Lithium Batteries:Li-Ion Technology Dr. Martin G. Hake et al,
VARTA Special Report 1/1996
[9] Electric and Hybrid Vehicles: Advanced Nickel-Metal-Hydride and Lithium-Ion
Batteries Uwe Köhler, Franz J. Kruger, Jörg Kämpers, Matthias Maul, Eberhard
Niggemann VARTA Special Report 3/1997
[10] Varta Lithium Ion Battery Design, http://docs-
europe.electrocomponents.com/webdocs/0ac9/0900766b80ac9773.pdf
[11] Electric Machines, Drives and Power Systems, Theodore Wildi, Fifth Edition, 2002
[12] Selection of Electric Motor Drives,for Electric Vehicles X. D. Xue, K. W. E. Cheng,
and N. C. Cheung,Department of Electrical Engineering, the Hong Kong Polytechnic
University,Hung Hom, Kowloon, Hong Kong, China
[13] Global Modelling of Different Vehicles, Keyu Chen, Alain Bouscayrol, Alain
Berthon, Philippe Delarue,Daniel Hissel, and Rochdi Trigui

70
[14] Future Fuels, Energy Institute, September 2009
[15] MSP430 Users guide http://focus.ti.com/lit/ug/slau049f/slau049f.pdf