design of a connected pipe test facility for … · design of a connected pipe test facility for...
TRANSCRIPT

DESIGN OF A CONNECTED PIPE TEST FACILITY
FOR RAMJET APPLICATIONS
A THESIS SUBMITTED TO
THE GRADUATE SCHOOL OF NATURAL AND APPLIED SCIENCES
OF
MIDDLE EAST TECHNICAL UNIVERSITY
BY
MUSTAFA NEVZAT SARIŞIN
IN PARTIAL FULFILLMENT OF THE REQUIREMENTS
FOR
THE DEGREE OF MASTER OF SCIENCE
IN
MECHANICAL ENGINEERING
APRIL 2005

Approval of the Graduate School of Natural and Applied Sciences
________________________
Prof. Dr. Canan ÖZGEN
Director
I certify that this thesis satisfies all the requirements as a thesis for the degree of
Master of Science.
________________________
Prof. Dr. S. Kemal İDER
Head of Department
This is to certify that we have read this thesis and that in our opinion it is fully
adequate in scope and quality, as a thesis for the degree of Master of Science.
___________________________ ___________________________
Prof. Dr. Kahraman ALBAYRAK Asst. Prof. Dr. Abdullah ULAŞ
Co-Supervisor Supervisor
Examining Committee Members:
Prof. Dr. M. Haluk AKSEL (METU, ME) ________________________
Asst. Prof. Dr. Abdullah ULAŞ (METU, ME) ________________________
Prof. Dr. Kahraman ALBAYRAK (METU, ME) ________________________
Prof. Dr. İ. Sinan AKMANDOR (METU, AEE) ________________________
Dr. H. Tuğrul TINAZTEPE (ROKETSAN) ________________________

iii
I hereby declare that all information in this document has been obtained and
presented in accordance with academic rules and ethical conduct. I also
declare that, as required by these rules and conduct, I have fully cited and
referenced all material and results that are not original to this work.
Name, Last name :
Signature :

iv
ABSTRACT
DESIGN OF A CONNECTED PIPE TEST FACILITY
FOR RAMJET APPLICATIONS
SARIŞIN, Mustafa Nevzat
M.S., Department of Mechanical Engineering
Supervisor: Asst. Prof. Dr. Abdullah ULAŞ
Co-Supervisor: Prof. Dr. Kahraman ALBAYRAK
April 2005, 164 pages
Development of the combustor of a ramjet can be achieved by connected pipe
testing. Connected pipe testing is selected for combustor testing because pressure,
temperature, Mach number, air mass flow rate can be simulated by this type of
testing. Real time trajectory conditions and transition from rocket motor (booster)
to ramjet operation can also be tested. The biggest advantage of connected pipe
testing is the low operation cost and simplicity. Air mass flow rate requirement is
less than the others which requires less air storage space and some components like
supersonic nozzle and ejector system is not necessary.
In this thesis, design of a connected pipe test facility is implemented. Three main
systems are analyzed; air storage system, air heater system and test stand.

v
Design of air storage system includes the design of pressure vessel and pressure &
flow regulation system. Pressure and flow regulation system is needed to obtain the
actual flow properties that the combustor is exposed to during missile flight.
Alternatives for pressure and air mass flow rate regulation are considered in this
study. Air storage system designed in this thesis is 27.8 m3 at 50 bar which allows a
test duration of 200 seconds at an average mass flow rate of 3 kg/s.
Air heater system is utilized to heat the air to simulate the aerodynamic heating of
the inlet. Several different combustion chamber configurations with different flame
holding mechanisms are studied. The most efficient configuration is selected for
this study. Combustion analysis of the air heater is performed by FLUENT CFD
Code. Combustion process and air heater designs are validated using experimental
data. Designed air heater system is capable of supplying air at a temperature range
of 400-1000 K and mass flow rate range of 1.5-8 kg/s at Mach numbers between
0.1-0.5 and pressure between 2-8 bar.
Finally the design of the test stand and ramjet combustor analysis are completed.
3D CAD models of the test stand are generated. Ramjet combustor that will be
tested in the test setup is modeled and combustion analysis is performed by
FLUENT CFD Code. The ramjet engine cruise altitude is 16 km and cruise Mach
number is 3.5.
Key-words: Air Breathing Engines, Ramjet, Connected Pipe, Direct Connect,
Vitiator.

vi
ÖZ
RAMJET UYGULAMALARI İÇİN BORU BAĞLANTILI
TEST DÜZENEĞİ TASARIMI
SARIŞIN, Mustafa Nevzat
Yüksek Lisans, Makine Mühendisliği Bölümü
Tez Yöneticisi: Y.Doç.Dr. Abdullah ULAŞ
Ortak Tez Yöneticisi: Prof. Dr. Kahraman ALBAYRAK
Nisan 2005, 164 sayfa
Ramjet yanma odasının geliştirilmesi boru bağlantılı testler ile gerçekleştirilir.
Boru bağlantılı test düzeneğinin seçilmesinin sebebi basınç, sıcaklık, Mach sayısı,
hava debisi gibi parametlerin benzetiminin yapılmasının mümkün olmasıdır.
Gerçek zamanlı yörüngede maruz kaldığı şartlar ve fırlatıcı motordan ramjet
motorunun çalışmasına geçiş evresi bu düzenek ile test edilebilmektedir. Boru
bağlantılı test düzeneğinin en önemli avantajı düşük operasyon maliyeti ve
basitliğidir. Hava debisi gereksinimi diğer test tekniklerine göre çok daha azdır, bu
sebeple sesüstü nozul ve yanma sonu gazları tahliye sistemi gibi elemanlara ihtiyaç
duyulmamaktadır.
Bu tez kapsamında boru bağlantılı test düzeneği tasarımı gerçekleştirilmiştir. Üç
ana alt sistem incelenmiştir; hava depolama sistemi, hava ısıtma sistemi ve test
rampası.

vii
Hava depolama sisteminin tasarımı basınç tankları ve akış kontrol sistemlerinin
tasarımını içerir. Akış kontrol sistemleri sayesinde ramjet motorunun gerçek uçuş
esnasında maruz kalacağı basınç ve debi miktarları benzetilir. Bu çalışmada akış
kontrol sistemi alternatifleri değerlendirilmiştir. Tasarlanan hava tankları 50 bar
basınçta ve 27.8 m3 hacminde olup 3 kg/s debide 200 saniye test imkanı
sağlamaktadır.
Hava ısıtma sistemi uçuş sırasında ramjet hava alığından kaynaklanan aerodinamik
ısınmanın benzetimi için kullanılmaktadır. Değişik yanma odası tasarımları
yapılmış ve en efektif sistem seçilmiştir. Yanma analizleri FLUENT HAD
(Hesaplamalı Akışkanlar Dinamiği) kodu ile yapılmıştır. Yanma ve yanma odası
tasarımları deneysel verilerle doğrulanmıştır. Tasarlanan hava ısıtma sisteminin
1.5-8 kg/s hava debisi kapasitesi olup 2-8 bar arasında ve 400-1000 K arası sıcaklık
üretebilmektedir.
Son olarak test rampası tasarımı ve ramjet motoru yanma odası analizleri
yapılmıştır. Test rampasının 3 boyutlu CAD çizimleri yapılmıştır. Tasarlanan test
düzeneğinde test edilecek olan ramjet yanma odasının modelleri oluşturulmuş ve
yanma analizleri yapılmıştır. Analizlerde FLUENT HAD kodu kullanılmıştır.
Ramjet motoru 16 km irtifa ve 3.5 Mach hız seyir şartları için tasarlanmıştır.
Anahtar Kelimeler: Hava solumalı motorlar, Ramjet, Boru bağlantı, direk bağlantı

viii
To Eylem Kılıç SARIŞIN

ix
ACKNOWLEDGEMENTS
I would like to express my deepest thanks and gratitude to Asst. Prof. Dr. Abdullah
ULAŞ and Prof. Dr. Kahraman ALBAYRAK for their supervision, encouragement,
understanding and constant guidance.
Also I would like to express my gratitude to Dr. H. Tuğrul TINAZTEPE for
initializing and supporting this thesis.
I would like to thank to Mr. Emre ÖZTÜRK for his assistance on using the Fluent
CFD flow solver.
I would like to express my sincere appreciation to Mr. Özdemir AYDIN, Mr. Uğur
ARKUN, Dr. Mine YUMUŞAK and Dr. Atılgan TOKER for their crucial advises
and invaluable efforts during the preparation of this thesis.
My gratitude is endless for my wife and my family, without whom this thesis
would not have been possible.
x
TABLE OF CONTENTS
ABSTRACT.....................................................................................................................................İV
ÖZ.....................................................................................................................................................Vİ
ACKNOWLEDGEMENTS............................................................................................................İX
TABLE OF CONTENTS................................................................................................................. X
LIST OF TABLES .......................................................................................................................Xİİİ
LIST OF FIGURES ...................................................................................................................... XV
LIST OF SYMBOLS ...................................................................................................................XİX
1. INTRODUCTION ................................................................................................................... 1
1.1. LITERATURE SEARCH........................................................................................................ 2 1.1.1. HISTORY OF THE RAMJET ENGINES....................................................................... 2 1.1.2. CLASSIFICATION OF RAMJETS ................................................................................ 3 1.1.3. OPERATION OF RAMJETS.......................................................................................... 6 1.1.4. RAMJET CONFIGURATIONS...................................................................................... 7 1.1.5. RAMJET TEST FACILITY COMPONENTS .............................................................. 11 1.1.6. RAMJET TEST FACILITIES....................................................................................... 17
1.2. VITIATED AIR HEATERS .................................................................................................. 26 1.2.1. HEATER REQUIREMENTS ................................................................................... 27 1.2.2. HEATER PERFORMANCE..................................................................................... 31 1.2.3. FLAME HOLDERS ...................................................................................................... 31
1.3. TECHNICAL METHOD....................................................................................................... 35 1.3.1. DESIGN INPUTS.......................................................................................................... 35 1.3.2. DESIGN METHODOLOGY......................................................................................... 39
2. AIR STORAGE SYSTEM DESIGN.................................................................................... 40
2.1. INTRODUCTION................................................................................................................. 40 2.1.1. SYSTEM REQUIREMENTS........................................................................................ 40

xi
2.1.2. SYSTEM COMPONENTS ........................................................................................... 40 2.1.3. AIR STORAGE SYSTEM DESIGN ALGORITHM.................................................... 41 2.1.4. AIR STORAGE SYSTEM SIZING .............................................................................. 41
2.2. PRESSURE VESSEL DESIGN............................................................................................. 42 2.3. FLOW CONTROL SYSTEM................................................................................................ 45
2.3.1. PRESSURE REGULATION BY VALVES.................................................................. 46 2.3.2. PRESSURE REGULATION FOR HIGH PRESSURE DROP..................................... 49
2.4. STORAGE SYSTEM CHOICE............................................................................................. 49 2.4.1. EVALUATION OF STORAGE SYSTEM CASE 1 ..................................................... 49 2.4.2. EVALUATION OF STORAGE SYSTEM CASE 2 ..................................................... 50
2.5. COMPRESSOR TO CHARGE THE AIR TANK.................................................................. 51
3. AIR HEATER SYSTEM DESIGN ...................................................................................... 53
3.1. AIR HEATER DESIGN ........................................................................................................ 53 3.1.1. VITIATOR ANALYSIS................................................................................................ 53 3.1.2. EVALUATION OF STUDIED CASES........................................................................ 75
3.2. DETAILED ANALYSIS OF CASE 2 ................................................................................... 77 3.2.1. 2 D Analysis .................................................................................................................. 77 3.2.2. 3D Analysis ................................................................................................................... 80
4. TEST STAND DESIGN ........................................................................................................ 91
4.1. TEST STAND DESIGN ........................................................................................................ 91 4.1.1. REQUIREMENTS ........................................................................................................ 91 4.1.2. COMPONENTS OF THE THRUST STAND............................................................... 92 4.1.3. 3D CAD MODELING OF THE TEST CENTER......................................................... 96
4.2. PIPING SYSTEM DESIGN .................................................................................................. 97 4.2.1. HEAD LOSS IN A PIPE ............................................................................................... 97 4.2.2. MINOR LOSSES IN PIPE SYSTEMS ......................................................................... 98 4.2.3. PRESSURE DROP AT AN ELBOW............................................................................ 99 4.2.4. PRESSURE DROP IN A PIPE.................................................................................... 100 4.2.5. MODELLING OF PIPING SYSTEM BY FLUENT .................................................. 104
4.3. RAMJET COMBUSTOR DESIGN..................................................................................... 105 4.3.1. Case 1 .......................................................................................................................... 105 4.3.2. Case 2 .......................................................................................................................... 109
5. CONCLUSION AND DISCUSSION ................................................................................. 113
5.1. SUMMARY OF THE WORK ............................................................................................. 113 5.2. SUGGESTIONS FOR FUTURE WORK ............................................................................ 114

xii
5.3. CONCLUSION ................................................................................................................... 115
REFERENCES.............................................................................................................................. 116
APPENDIX A : AIR TANK DESIGN......................................................................................... 119
APPENDIX B: AIR TANK DESIGN CALCULATIONS ......................................................... 128
APPENDIX C: COMBUSTION MODELLING BY FLUENT ................................................ 139
APPENDIX D: TEST CENTER DESIGN CODES ................................................................... 148
APPENDIX E: SAMPLE CALCULATIONS FOR PIPING SYSTEM................................... 157

xiii
LIST OF TABLES
Table 1-1. Comparison of Properties between the Test Centers............................. 27
Table 1-2. Compositions for Ideal Air .................................................................... 28
Table 1-3. Fuel and Oxidizers for Combusting Heaters [6].................................... 30
Table 2-1. Trade-Off Study for Tank Pressure Selection ....................................... 42
Table 2-2. Pressure Vessel Sizing........................................................................... 43
Table 2-3. Cv Analysis for Case 1 .......................................................................... 48
Table 2-4. Cv Analysis for Case 2 ......................................................................... 49
Table 3-1. Case 1 Inputs for FLUENT Boundary Conditions ................................ 56
Table 3-2. Flow Properties at the Outlet Plane (Case 1)......................................... 57
Table 3-3. Flow Properties at the Outlet Plane (Case 2)......................................... 59
Table 3-4. Case 3 Inputs for FLUENT Boundary Conditions ................................ 61
Table 3-5. Flow Properties at the Outlet Plane (Case 3)......................................... 62
Table 3-6. Flow Properties at the Outlet Plane (Case 4)......................................... 63
Table 3-7. Flow Properties at the Outlet Plane (Case 5)......................................... 66
Table 3-8. Flow Properties at the Outlet Plane (Case 6)......................................... 68
Table 3-9. Flow Properties at the Outlet Plane (Case 7)......................................... 70
Table 3-10. Flow Properties at the Outlet Plane (Case 8)....................................... 72
Table 3-11. Flow Properties at the Outlet Plane (Case 9)....................................... 75
Table 3-12. Outlet Plane Data Comparison ............................................................ 76
Table 3-13. Inlet-Off Design Performance Data..................................................... 77
Table 3-14. Mass Fractions Corresponding to Mass Flow Rates ........................... 78
Table 3-15. Results of the Air Heater Off-Design Analysis ................................... 79
Table 3-16. Final Mass Flow Rate and Mass Fraction Data................................... 79
Table 3-17. Results of the Air Heater Off-Design Analysis ................................... 80

xiv
Table 3-18. Case 1 Inputs for FLUENT Boundary Conditions .............................. 82
Table 3-19. Flow Properties at the Outlet Plane ..................................................... 84
Table 3-20. Case 2 Inputs for FLUENT Boundary Conditions .............................. 85
Table 4-1. Average Roughness of Commercial Pipes ............................................ 97
Table 4-2. K Factors for Fittings............................................................................. 99
Table 4-3. Nominal Pipe Sizes for Standard Pipes ................................................. 99
Table 4-4. Comparison of FLUENT Results with Experimental Results............. 106
Table 4-5. Comparison of FLUENT Results with Experimental Results............. 110
Table E-1. Summary of Results ...............................Error! Bookmark not defined.

xv
LIST OF FIGURES
Figure 1-1. Liquid Fuel Ramjet [5]........................................................................... 3
Figure 1-2. Solid Fuel Ramjet [5] ............................................................................. 4
Figure 1-3. Ducted Rocket with Integrated Gas Generator [5]................................. 5
Figure 1-4. Missile Launch ....................................................................................... 6
Figure 1-5. Booster Phase ......................................................................................... 6
Figure 1-6. Transition and Ramjet Ignition .............................................................. 7
Figure 1-7. Schematic of a Connected-Pipe Test Setup............................................ 9
Figure 1-8. Free-Jet Testing of a Scaled Down Test Article .................................. 10
Figure 1-9. Jet Stretcher Concept............................................................................ 10
Figure 1-10. Product Tree of Connected Pipe Test Facility ................................... 11
Figure 1-11. Sketch of a SUE Heater...................................................................... 13
Figure 1-12. Tube Type Cross Counter Flow Heater [1]........................................ 14
Figure 1-13. Pebble Bed Storage Heater................................................................. 15
Figure 1-14. Sketch of NASA Langley Test Facility [8]........................................ 18
Figure 1-15. Sketch of Chitose Semi-Free-Jet Ramjet Test Setup [9].................... 22
Figure 1-16. ARC Connected Pipe Ramjet Test Centre [11].................................. 23
Figure 1-17. Sketch of ONERA Connected-Pipe Test Setup [12].......................... 24
Figure 1-18. Sketch of Hypersonic Test Setup of APTU [7].................................. 25
Figure 1-19. Sketch of U.S. Air Force Connected Pipe Facility [13] ..................... 26
Figure 1-20. Recirculating Flow Behind a Sphere, a Gutter and a Strut ................ 33
Figure 1-21. Flame Propagation Downstream of a Baffle: (a) For A Uniform Fuel-
Air Mixture, (B) When The Fuel Is Confined To A Central Region...................... 33
Figure 1-22. Flow Behind a Baffle ......................................................................... 34
Figure 1-23. Stabilization Setup by Recirculation .................................................. 34

xvi
Figure 1-24. The Stabilization Setups by Pilot Flames........................................... 35
Figure 1-25. Flight Trajectory of Missile X............................................................ 36
Figure 1-26. Mach Number Evolution of Missile X............................................... 37
Figure 1-27. Mass Flow Rate Captured by Inlets vs. Time .................................... 37
Figure 1-28. Static Pressure at the Combustor Inlet vs. Time ................................ 38
Figure 1-29. Static Temperature at the Combustor Inlet vs. Time ......................... 38
Figure 1-30. Design Algorithm of the Connected Pipe Test Facility ..................... 39
Figure 2-1. Component Tree of Air Storage System .............................................. 41
Figure 2-2. Air Storage System Design Algorithm ................................................ 41
Figure 2-3. Pressure and Temperature Change During Discharge for Case 1........ 44
Figure 2-4. Pressure and Temperature Change During Discharge for Case 2........ 45
Figure 2-5. Pressure Regulation System................................................................. 46
Figure 2-6. Scheme for Valve Calculations ............................................................ 47
Figure 2-7. Example of High Pressure Regulator ................................................... 50
Figure 2-8. Example of High Pressure Compressor ............................................... 52
Figure 2-9. Air Flow Rates of EHNX GT Compressor .......................................... 52
Figure 3-1. Prediction of Temperature Using Different Grid Densities ................. 56
Figure 3-2. Sketch of Case 1................................................................................... 56
Figure 3-3. Contours of Static Temperature of Case 1. .......................................... 57
Figure 3-4. Sketch of Case 2................................................................................... 58
Figure 3-5. Contours of Static Temperature of Case 2. .......................................... 59
Figure 3-6. Sketch of Case 3................................................................................... 60
Figure 3-7. Contours of Static Temperature of Case 3. .......................................... 61
Figure 3-8. Sketch of Case 4................................................................................... 63
Figure 3-9. Contours of Static Temperature of Case 4. .......................................... 64
Figure 3-10. Sketch of Case 5................................................................................. 65
Figure 3-11. Contours of Static Temperature of Case 5. ........................................ 65
Figure 3-12. Sketch of Case 6................................................................................. 67
Figure 3-13. Contours of Static Temperature of Case 6. ........................................ 67
Figure 3-14. Sketch of Case 7................................................................................. 69
Figure 3-15. Contours of Static Temperature of Case 7. ........................................ 69

xvii
Figure 3-16. Sketch of Case 8................................................................................. 70
Figure 3-17. Contours of Static Temperature of Case 8. ........................................ 71
Figure 3-18. Contours of Velocity Magnitude of Case 8........................................ 72
Figure 3-19. Sketch of Case 9................................................................................. 73
Figure 3-20. Contours of Static Temperature of Case 9. ........................................ 74
Figure 3-21. Contours of Velocity Magnitude of Case 9........................................ 74
Figure 3-22. Mass Flow Rate Requirement of the Test Facility............................. 77
Figure 3-23. Final Configuration of the Air Heater ................................................ 80
Figure 3-24. Flame Holding Mechanism ................................................................ 81
Figure 3-25. Quarter of the Air Heater Combustion Chamber ............................... 81
Figure 3-26. Sketch of Combustion Chamber of Case 1 ........................................ 82
Figure 3-27. Contours of Static Temperature of Case 1 ......................................... 83
Figure 3-28. Contours of Static Temperature of Case 1 (Isometric View)............. 83
Figure 3-29. Sketch of Combustion Chamber of Case 2 ........................................ 84
Figure 3-30. Contours of Static Temperature of Case 2 ......................................... 85
Figure 3-31. Sketch of Combustion Chamber of Case 3 ........................................ 86
Figure 3-32. Contours of Static Temperature of Case 3 ......................................... 87
Figure 3-33. Sketch of combustion chamber of Case 4 .......................................... 87
Figure 3-34. Fuel Injector Studied in Case 4 .......................................................... 88
Figure 3-35. Contours of Static Temperature of Case 4 ......................................... 89
Figure 3-36. Contours of Static Temperature and Fuel Path Lines of Case 4 ........ 89
Figure 3-37. Final Configuration of the Vitiator .................................................... 90
Figure 3-38. Fuel Injector Configuration................................................................ 90
Figure 4-1. Wheel Configuration............................................................................ 93
Figure 4-2. Double Wheel Configuration ............................................................... 93
Figure 4-3. Cylindrical Rod and Sliding Pad Configuration .................................. 93
Figure 4-4. V-Blocks Configuration ....................................................................... 94
Figure 4-5. Vitiator Table ....................................................................................... 95
Figure 4-6. Piping Systems ..................................................................................... 95
Figure 4-7. 3D Model of the Test Center................................................................ 96
Figure 4-8. Sketch of an Elbow ............................................................................ 100

xviii
Figure 4-9. Sketch of a Pipe.................................................................................. 100
Figure 4-10. Piping Configuration Following the Vitiator ................................... 102
Figure 4-11. Piping Configuration Before the Vitiator......................................... 103
Figure 4-12. Temperature Contours on the Fluent Model of the Piping System.. 104
Figure 4-13. Sketch of Case 1............................................................................... 106
Figure 4-14. Contours of Static Temperature of Case 1. ...................................... 107
Figure 4-15. Contours of Mach Number of Case 1............................................... 108
Figure 4-16. Sketch of Case 2.............................................................................. 109
Figure 4-17. Contours of Mach Number of Case 1............................................... 110
Figure 4-18. Contours of Static Temperature of Case 2. ...................................... 111
Figure A-1. General Configuration for Vessel Shells and Head........................... 124
Figure A-2. Nozzle Reinforcement....................................................................... 125
Figure B-1. Technical Drawing of Case ............................................................... 124
Figure B-2. Technical Drawing of Head 1............................................................ 124
Figure B-3. Technical Drawing of Head 2............................................................ 124
Figure B-4. Technical Drawing of Nozzle and Air Pipe....................................... 124
Figure B-5. Assembly Drawing of Pressure Vessel.............................................. 124
Figure C-1. Schematic of the Combustor.............................................................. 143
Figure C-2. Grid Used in Fluent Analysis ............................................................ 143
Figure D-1.Main Window of the Program............................................................ 148
Figure D-2.Pipe Code Window............................................................................. 149
Figure D-3.Main Window Following the Pipe Code Window ............................. 150
Figure D-4.Discharge Code Window.................................................................... 151
Figure D-5.Main Window Following the Discharge Code Window.................... 152
Figure D-6.Replenishment Code Window............................................................ 153
Figure D-7.Main Window Following the Replenishment Code Window ............ 154
Figure D-8.Valve Code Window .......................................................................... 155
Figure D-9.Final Window of the Code ................................................................. 156
Figure E-1.Pipe Configuration of the Test Center ................................................ 157

xix
LIST OF SYMBOLS
A Surface area )( 2m
Q Load on one saddle )(N
ts Wall thickness of shell )(mm
th Wall thickness of head )(mm
θ Contact angle of saddle (deg)
iD Inside diameter )(mm
oD Outside diameter )(mm
iR Inside radius )(mm
0R Outside radius )(mm
E Joint efficiency
xσ Longitudinal stress )(MPa
φσ Circumferential stress )(MPa
atmair 1@ρ Density of air at 1 atm ( )3mkg
4CHQ Flow rate of 4CH )( 3 sm
airQ Flow rate of air )( 3 sm
4CHm& Mass flow rate of 4CH ( )skg
airm& Mass flow rate of air ( )skg
inletT Combustor inlet temperature )(K

xx
ϕ Equivalence Ratio
wallT Combustor wall temperature ( )K
T Temperature ( )K
airρ Density of air ( )3mkg
M Mach number
c Speed of sound ( )sm
V Velocity ( )sm
scmh Standard cubic meter per hour
scfh Standard cubic feet per hour
S Allowable or calculated stress ( )MPa
alt Missile cruise altitude (m)
M0 Missile cruise Mach Number
Me Inlet downstream Mach Number
Te Inlet downstream Static Temperature ( )K
Pe Inlet downstream Static Pressure ( )Pa

1
CHAPTER 1
1. INTRODUCTION
INTRODUCTION
It is more difficult to evaluate the performance of air breathing engines than
conventional rockets, because they vary strongly with the flight conditions (Mach
Number, altitude, atmospheric conditions, angle of attack, etc.). In the development
of the combustor and the complete engine, direct connect testing and freejet testing
techniques are used.
Many nations are conducting research and development of ramjets for supersonic,
extended range missiles and projectiles. Supersonic air breathing test facilities are
few in number. There has been a continuous improvement in techniques and
capability.
Full simulation is unnecessary in conducting component development tests. For
example, the aerodynamic and performance of inlets and exit nozzles can be
established with reduced scale models in wind tunnels and similar facilities, which
simulate the Mach and Reynold’s number but not the temperature, pressure or fluid
velocity. This approach is not possible with the combustor, where simulation of the
later parameters is also important. As a result, unique simulation requirements are
associated with direct connect testing and freejet testing involved in the
development of the combustor and the complete engine. [1]
Test Center Design in this study will be based on the Ramjet Engine designed
reported at [2].

2
1.1. LITERATURE SEARCH
Basic advantages of all ramjet configurations over conventional rocket propulsion
systems are:
• They have higher specific impulse than the classical rocket motors.
• They have the potential to achieve an increased range.
• They offer increased effectiveness against maneuvering targets by
maintaining thrust.
• They have lower fuel consumption than classical rocket motors. [3]
These advantages can be sufficient to justify the use of a ramjet over a
conventional rocket motor in certain applications.
1.1.1. HISTORY OF THE RAMJET ENGINES
The ramjet concept was invented in 1911 by a French scientist, R. Lorin. R. Leduc
applied it to the propulsion of aircraft, and subsonic tests were conducted in 1949.
Before and during the Second World War, the Germans studied the application
possibilities of the ramjet concept to the missiles. Between the end of the Second
World War and the middle of the 60’s, a large number of countries undertook a
major research effort, which took the shape (in France) of many flight tests of
experimental missiles called CT41, VEGA, R431 and Stataltex; and operational
developments of ground-to-air or surface-to-air missiles such as the BOMARC
(1957) and the TALOS (1959) in the United States; the BLOODHOUND(1959) in
Great Britain; and the SA4(1964) in the USSR. After that period, the research and
the development efforts were focused on other propulsion systems. Activities
began again around the 70’s with, in particular, the following: introduction in Great
Britain in 1975 of the SEA DART; the in-flight evaluation in the US of the ASLM
(advanced strategic air-launched missile) and ALVRJ (advanced low-volume
ramjet) experimental missiles; the development of the SLAT (supersonic low-
altitude target) in 1991; and in France, the flight test of the ANS missile

3
(supersonic anti-ship) and the operational missile ASMP (medium range air-to-
ground). [4].
1.1.2. CLASSIFICATION OF RAMJETS
Among the various configurations, a classification can be established according to
the nature of the fuel, either liquid with its high performance, or solid with its
operational simplicity and potentially lower cost.
1.1.2.1. Ramjets Using Liquid Fuel
The liquid fuel ramjet (Figure 1-1) can use classical kerosene, high density or
slurry fuels. The liquid fuel dominates the operational applications, mainly because
of its high throttle ability and excellent performance.
Figure 1-1. Liquid Fuel Ramjet [5]
1.1.2.2. Ramjets Using Solid Fuel
The solid fuel ramjet (SFRJ) has been considered as a propulsion device for missile
since 1930’s. It is possible to use special solid fuels in a solid fuel ramjet in order
to obtain conditions of maintenance and storage similar to that of ordinary
ammunitions or classical solid propellant rocket missiles. The engine uses only one
chamber, resulting in a very simple construction. The solid fuel, which is produced
without oxidizer, covers the wall of the combustor. By ablation in the hot air flow,
it is transformed into gases, which burn in a combustion chamber. It is particularly
well-suited for the high-acceleration environment of projectiles.

4
The SFRJ can provide specific impulse in the 900-1400 sec range and density
impulse in the 1150-2300 gm-s/cm3 range. This results in a 200-400% increase in
range over that of a solid rocket motor with comparable size and weight.
Figure 1-2 shows a classical configuration of the SFRJ. This configuration includes
air inlet diffusers, which slow down the supersonic air to low subsonic speeds, raise
the inlet air to a higher static temperature and pressure.
Figure 1-2. Solid Fuel Ramjet [5]
1.1.2.3. Ducted Rocket
The ducted rocket contains a solid propellant with a small portion of oxidizer (fuel
rich solid propellant - Gas Generator). This small quantity of the oxidizer is just
used to produce gases, which will be burned in the combustion chamber. The
ducted rocket, like the solid fuel ramjet, has the maintenance and storage
characteristics of a solid rocket motor. Like the liquid fuel ramjet, the ducted rocket
may also have a throttling ability, but have higher acceleration and longer range
than a liquid fuel ramjet. Two variants of the ducted rocket exist:
• Ducted rocket with separate gas generator: The fuel is stored in a separate
container, or gas generator, which works like a rocket. The gases produced,
relatively low in temperature, can be injected into the combustion chamber

5
through a control valve. As the burning rate of the solid fuel is influenced
by pressure, it is possible to regulate the gas flow.
• Ducted rocket with integrated gas generator: It has a single chamber, fuel
rich solid propellant being in direct contact with the combustion chamber.
The altitude variation capability is large because of self-regulation qualities
(as the burn rate is pressure dependant).
Figure 1-3 shows a classical ducted rocket with booster propellant. Booster
propellant is consumed before the ramjet operation and the missile reach to high
Mach numbers. At the end of booster operation, gas generator is ignited, booster
nozzle is ejected and inlet port cover is removed. Air flowing through the inlet is
mixed by the fuel generated at the gas generator and combustion occurs in the
combustor. Than the hot combustion products are expanded in the nozzle to create
the required thrust.
Figure 1-3. Ducted Rocket with Integrated Gas Generator [5]
1.1.2.4. The Scramjets (Supersonic combustion)
The ramjet is without any doubt the most suitable air-breathing propulsion system
for hypersonic flight in the atmosphere. Efficient operation of a ramjet is reached
by subsonic combustion up to vehicle Mach number of 6 or 7, and supersonic
combustion beyond; in the latter case, the engine is designated as a scramjet.[6]
Theoretically, on the basis of its power performance, it could reach orbital
velocities. In practice, it will be difficult to go beyond a hypersonic speed of about

6
Mach 10 to 12, because of the sensitivity of the engine thrust to small disturbances
at higher Mach numbers.
1.1.3. OPERATION OF RAMJETS
Following the ignition of the missile (generally dropping from the aircraft fighter
or firing from other platforms, Figure 1-4), the booster accelerates the missile up to
the speed that allows the start of ramjet (around Mach 2.5), as shown in Figure 1-5.
The booster is a conventional solid propelled rocket. The propellant grain that is
placed in the ramjet combustor burns and the hot gases are expanded in the rocket
nozzle. The rocket nozzle is fixed on the ramjet nozzle. Once the booster propellant
is burnt, the rocket nozzle is ejected, and the ramjet nozzle becomes the missile
operational nozzle (Figure 1-6). Since the missile has reached a sufficient velocity
for the ramjet start, the caps that close the inlets are ejected, and air is swallowed in
the combustor. This is called the transition phase that has to be tested in the freejet
facility. Then, the ramjet combustion begins, and the missile follows its trajectory.
Figure 1-4. Missile Launch
Figure 1-5. Booster Phase

7
Figure 1-6. Transition and Ramjet Ignition
1.1.4. RAMJET CONFIGURATIONS
1.1.4.1. Main Stages of Ramjet Development
As for any propulsion system, developing a ramjet engine goes first through
successive development phases, then through detailed design improvements and
demonstrations, and finally acceptance testing under all flight conditions. This
demands a great deal of experimental research and development.
For example, to debug one current operational ramjet powered missile and to
qualify it with its requirement under all flight conditions, 600 test runs were
required each year for seven years (90 % of blowdown tests lasted 30 seconds and
10% lasted longer), using nearly 80,000 kg of liquid fuel. [6]
The current trend is to qualify the missile on the ground, in the most realistic
environment possible, so that the flight tests, which are always very costly, have a
high probability of success.
During a ramjet development, the following steps are needed.
1.1.4.1.1. Design Test on Components
This includes tests of air intakes in a wind tunnel, optimization of the combustor
with the help of flow visualization techniques.

8
1.1.4.1.2. Connected Pipe Tests
This is a very important step of a development. Before the full propulsion system is
tested, ramjet combustors are generally tested alone. Hot subsonic air is ducted
directly into the combustor. Figure 1-7 shows a connected-pipe test facility sketch.
Connected pipe testing is conducted primarily to demonstrate combustor
thermal/structure design integrity and combustor performance, using a direct thrust
stand measurement. Precise input conditions of airflow, inlet temperature and fuel
flow to the combustor may be achieved during connected pipe tests using facility-
supplied air and fuel flow; consequently, accurate combustor performance
correlations may be derived from these tests.
In some connected pipe test facilities an entire trajectory time profile may be
simulated using computer-controlled valves for airflow, heater fuel flow, and
combustor fuel flow.
Fuel-injector arrangements may be altered in these tests to meet performance
requirements. Insulation and other thermal protection system may be altered to
meet endurance requirements.
Rocket-to-ramjet transition tests are also a major phase of development testing for
Integral Rocket Ramjet propulsion systems.
1.1.4.1.3. Semi-Free Jet Tests
The engine, including air intakes, is supplied with supersonic air coming from
nozzles just in front of each inlet. The air mass flow required is roughly 50% to
100% higher than in connected-pipe tests, due to external air flow.

9
Figure 1-7. Schematic of a Connected-Pipe Test Setup
1.1.4.1.4. Free-Jet Tests
This is the best simulation, because the entire vehicle forebody is surrounded with
supersonic air flow, as in flight.
Free-jet testing serves to integrate the whole propulsion system. Free-jet tests
primarily are conducted to verify the functional operation and performance of the
integrated propulsion system in a supersonic flowfield. Net engine thrust,
combustor performance and interactions between ramburner and inlet can be
evaluated in a free-jet facility. Flight-weight inlets can also be evaluated. Fuel
management systems and fuel tank expulsion systems can also be optionally added.
To take full advantage of the free-jet tests, the test article should include as many
flight designed systems as possible like vehicle forebody, equipment and telemetry
systems, pyrotechnic and ignition systems, inlets, fuel management systems,
auxiliary power systems, booster/combustor system, etc. Figure 1-8 shows a
supersonic test of a missile during a free-jet test.

10
In the basic free-jet setup the entire missile is tested. For forward-mounted inlet
configurations, the inlet is located in the nozzle test rhombus and exposed to the
flow Mach number. Semi-free jet testing is often used for aft-mounted inlets since
Mach numbers cannot be exactly reproduced at the aft end of the missile in the full
free-jet mode. Generally, the forebody is omitted and free jet inlets are mounted
directly in front of the inlets. This is also a cost effective technique for aft inlet
configurations, since free-jet testing of the full vehicle would require either a
scaled-down test article or an extra large facility with considerable airflow
requirements.
A jet stretcher can also be used for aft mounted inlets. The jet stretcher (Figure 1-9)
is an aerodynamically shaped surface, which simulates a free-jet streamline, extents
the test rhombus of the free jet nozzle by precluding shock or expansion waves
from the nozzle or jet boundary from being reflected into the flow upstream of the
inlet.
Figure 1-8. Free-Jet Testing of a Scaled Down Test Article
Figure 1-9. Jet Stretcher Concept

11
With the basic free-jet setup, both pitch and yaw angle of attack can be evaluated.
In the other two setups, the testing is restricted effectively to zero-degree angle of
attack.
1.1.4.1.5. Flight Tests
This is the final objective after several years of ground tests.
1.1.4.2. Test Facility Simulation
The followings are a number of parameters and flight conditions that are simulated
in the test facility.
• Stagnation pressure
• Stagnation temperature
• Mach number
• Pressure ratio
• Air mass flow rate
• Trajectory conditions
• External heating
• Maneuver loads
• Angle of attack
• Fore body flow field
• Transition sequence
1.1.5. RAMJET TEST FACILITY COMPONENTS
The product three of a typical connected pipe test facility is given in Figure 1-10.
Figure 1-10. Product Tree of Connected Pipe Test Facility

12
1.1.5.1. Air Storage System
Power requirements for continuous air flow are prohibitive; therefore, ramjet test
facilities are of the stored air blowdown type. The blowdown facility is an
economical method of meeting the high air mass flow and pressure ratio
requirements. Mass flow rate and test duration is limited with the air storage
capacity. For example test center at "Arnold Engineering Development Center"
store 450,000 lb (204 tons) of air at a maximum pressure of 4000 psi (275 bar) [7],
which allows a run duration of the facility from approximately 3 minutes to over 12
minutes, depending on the free-jet nozzle selected and the altitude simulated in the
test cell.
In direct connect testing, this run duration is higher due to the less pressure and
airflow requirements.
1.1.5.2. Air Heater
Different air heating methods are used in ramjet testing. They may be grouped into
three categories: combusting heaters (vitiators), non-combusting heaters (including
heat exchangers), and combinations of these heaters.
1.1.5.2.1. Heater Types
a. Combusting Heaters (Vitiators):
Combusting heaters heat air directly with a fuel-oxidizer reaction. Fuel is burned in
the air stream in a combustor similar to a ramjet combustor. The exhaust gases are
used for ramjet testing after the consumed oxygen is replenished.
The main advantages:
• Low fuel flow requirement, low cost
• Simple operation and maintenance.

13
The disadvantages:
• The effects of air heater combustion products on ramjet combustion
(unburned vitiator fuel can increase the ramjet performance)
• The changes of air properties like molecular weight.
The principle problem associated with vitiated air heater is that the resulting air,
after heating by combustion and oxygen replenishment, contains higher mass
fractions of water vapor and carbon dioxide than normal air. Fortunately, this has
proved to be only a minor problem in ramjet engine testing [6]. A major advance in
test technique, which facilities simulating low altitudes and high Mach numbers,
was provided by the Sudden Expansion (SUE) heater. The sudden expansion
vitiated air burner with oxygen replenishment was originally developed for ramjet
testing and has since been adapted by several facilities. SUE heater is more
compact than the other types. This permits it to be installed in close proximity to
the free-jet nozzle. Figure 1-11 shows a sketch of a SUE heater [1].
Figure 1-11. Sketch of a SUE Heater

14
b. Non-Combusting Heaters
Non-combusting heaters avoid contamination of the air stream with combustion
products and deliver clean air to the ramjet combustor. Non-combusting heaters
used in ramjet testing are as follows:
Tube Type Cross Counter Flow Heater: The tube heat exchanger type of heater can
supply clean air up to (1000 K) 1200°F [1]. The heat source may be electrical
resistance or combustion of a separate fuel and oxidizer. However structural
and maintenance problems, as well as heat transfer considerations, limit the
maximum operating temperature. Higher temperatures can be achieved by adding a
vitiated air heater downstream. A sketch of tube type cross counter flow heater is
given in Figure 1-12.
Figure 1-12. Tube Type Cross Counter Flow Heater [1]
Pebble Bed Storage Heater: Heat storage devices are heat exchangers of high
thermal mass that are gradually heated to operating temperature and during a test
run give up stored thermal energy to air passing through them. Commonly, large
vessels filled with ceramic or metal pebbles are used, heated by either electrical
resistance or hot combustion gases (Figure 1-13). These storage heaters can heat air
to higher temperatures than conventional heat exchangers because the pebbles are

15
more resistant to thermal damage than fragile heat exchanger tubes. Nevertheless,
repeated thermal expansion and contraction can rub the pebbles together and
introduce dust particles into the air stream. Heater life span is lengthened by
reducing the number and magnitude of these thermal cycles. The main challenge in
designing heat storage devices is obtaining a constant output temperature for the
required run time and range of test conditions. This usually results in large heaters
with a high heat capacity so that only a small fraction of the energy is extracted
during a run. [6]
Electric Air Heater: Electric arc heaters heat air through the release of energy
produced by an electric arc between two electrodes. Arc heaters are capable of
producing very high air temperatures. The facility capabilities depend primarily on
the limits of the anode and cathode producing the arc. Due to the extremely high
temperatures produced by the arc, ionized species are created that react to form
NOx and other undesired constituents that contaminate the air stream. The presence
of these contaminants, and the fact that oxygen dissociation begins at
approximately 2500K, sets the upper limits of combustion testing in arc facilities.
Above this temperature, care must be taken to account for the chemical effects of
the contaminants and dissociated species on combustion. The high power
requirements of arc heaters make them very expensive to operate.
Figure 1-13. Pebble Bed Storage Heater
Air in
Air out

16
c. Combination Heaters
Combination heaters use a combination of the previously discussed methods to take
advantage of the characteristic strengths of one method to offset the weaknesses of
the other. For example, one could use a vitiator to boost the temperature from an
electrically powered heat exchanger. This would allow higher temperatures without
damaging the heating elements in electric heater, and would deliver lower levels of
combustion products when compared to pure combustion heating. In addition this
combination allows temperature variation during a run (transient simulations).
1.1.5.3. Combustion Chamber
In the connected pipe test, combustor is tested alone, to evaluate combustion
efficiency, combustor pressure losses, fuel/air ratio flameout conditions, and
thermal protection system durability. Fuel-injectors and flame holders may be used
for these tests. Three types of combustors may be used:
• Heavy-wall performance combustors,
• Water-cooled performance combustors that can be run for longer time
periods,
• Flight-weight combustors to evaluate performance and endurance with the
flight thermal protection system.
1.1.5.4. Calorimeter
Energy losses through the various water-cooled components, coupled with the
temperature measurements from a steam calorimeter allow calculation of
combustion efficiency.

17
1.1.5.5. Ejector
The ejector system is used to evacuate the test cell volume to ensure that the
desired altitude pressure is available in the free-jet nozzle test rhombus and to
minimize the starting loads on the article during facility start-up. The ejector can
sometimes be connected to the facility to eject hot gases.
In some systems the air storage system is used to drive the ejector system. A
separate air source and steam generator may also be used for this application.
The ejector can also be connected to a muffler system to reduce the high intensity
sound effects which can damage the test equipment or environment.
1.1.6. RAMJET TEST FACILITIES
Some major direct connect ramjet test facilities are as follows:
1.1.6.1. NASA Langley Direct Connect Supersonic Combustion Test Facility
(USA)
Test Section and Performance: The Langley Direct-Connect Supersonic
Combustion Test Facility (DCSCTF) [8] is used to test ramjet and scramjet
combustor models in flows with stagnation enthalpies duplicating that of flight at
Mach numbers between 4 and 7.5. A sketch of the facility is given in Figure 1-14.
The facility is located in a 4.9x4.9x15.8 m (16x16x52 ft) test cell with 0.6 m (2 ft)
steel-reinforced concrete walls and forced-air ventilation. Test air is supplied from
a high-pressure bottle field and is regulated to 38 bar (550 psia) (nominal) prior to
entering the test cell. Gaseous hydrogen is supplied from 1700 m3 (60,000 ft3) tube
trailers at a maximum pressure of 165 bar (2400 psia) and is regulated to 50 bar
(720 psia). Oxygen is supplied from trailers at a maximum pressure of 165 bar
(2400 psia) and is regulated to 50 bar (720 psia) prior to entering the test cell. A
20-percent silane and 80-percent hydrogen mixture (by volume) is supplied from

18
cylinders (maximum storage pressure of 165 bar (2400 psia)) for use as an igniter
of the primary fuel in the combustor models.
Figure 1-14. Sketch of NASA Langley Test Facility [8]
Results of the tests are typically used to assess the mixing, ignition, flame holding,
and combustion characteristics of the combustor models.
The high stagnation enthalpy necessary to simulate flight is achieved through
hydrogen-air combustion with oxygen replenishment to obtain a test gas with the
same oxygen mole fraction as atmospheric air (0.2095). The flow at the exit of the
facility nozzle simulates the flow entering the combustor of a ramjet or a scramjet
in flight.
The facility normally operates at heater stagnation pressures between 7 and 35 bar
and at heater stagnation temperatures between 850 and 2100 K. Test gas mass flow

19
rates range from 0.45 to 3 skg . The normal test schedule is 2 or 3 test days per
week. Run duration averages 20 to 30 sec with multiple runs (5 to 20) per day.
The facility uses a hydrogen and air combustion heater with oxygen replenishment.
During facility heater operation, oxygen is injected into the air stream from 12 in-
stream injectors and premixed before injecting hydrogen. The hydrogen is injected
into the air and oxygen mixture from 12 in-stream injectors centered in holes
located in a baffle/mixing plate upstream of the water-cooled combustor section.
The gas mixture is ignited by electric-spark-activated hydrogen and oxygen torch
igniters.
Test gas compositions for the standard operating conditions of the DCSCTF are
calculated with finite-rate chemistry during the expansion through the facility
nozzle. The primary contaminant in the test gas is water vapor, which varies from
0.083 mole fraction at Mach 4 conditions to 0.358 at Mach 7.5 conditions. A small
amount of nitric oxide (0.004 mole fraction) is also present in the test stream at the
Mach 7.5 condition.
An air ejector or a 21.3 m (70-ft) diameter vacuum sphere and steam ejector system
(requiring up to 6800 kg (15,000 lbm) per hr of steam) provides vacuum for
altitude simulation. Gaseous hydrogen (at ambient temperature) is the primary fuel
used in the combustors tested in the facility, although other types of gaseous fuels
are used occasionally.
1.1.6.2. Chitose Ramjet Test Facility (Japan)
This is a facility to simulate an actual flight environment (altitude and the Mach
number) for next-generation supersonic engines and to evaluate their thermal
aerodynamic characteristics etc. on the ground. Main components of this facility
are a compressor, air tanks, a burner, a cooler, a test chamber, a cooler for exhaust
gas, ejectors, etc. High-pressure air generated by the compressor is accumulated in
the air tanks and fed to an engine to be tested in a form of airflow corresponding to

20
the actual flight speed. A temperature of the airflow can be set according to the
actual flight environment by the burner or cooler. In addition, the exhaust gas from
the engine can be cooled by the exhaust gas cooler and depressurized by the
ejectors so that a pressure in the test chamber can be set according to the actual
flight altitude. Sketch of the facility is given in Figure 1-15 [9].
Features:
• This facility is available for the comprehensive control of airflow
simulating the actual flight environment (flight altitude and the Mach
number).
• This is available for the comprehensive evaluation of engine performance
(thrust etc.) in the actual flight environment.
• Adoption of a hydrogen-combustion heating method for generating high-
temperature air.
• Adoption of a liquid nitrogen spraying method for generating cold air.
• Adoption of a method that water is injected into kerosene-combustion gas
for generating ejector drive gas.
1.1.6.3. Kakuda Space Propulsion Laboratory (Japan)
This is the only facility in Japan that can be used to test ramjet and scramjet
engines under simulated flight conditions of Mach 4, 6 and 8 at altitudes of 20, 25
and 35km, respectively [10].
In this facility, Ram/Scramjet engine systems can be tested under the simulated
flight conditions at hypersonic velocity and high altitude. It can be utilized also for
testing other types of hypersonic air breathing engines and various
materials/structures under severe aero-thermodynamic environment.
The thermal storage body "Core-de-bric" made of alumina with many holes along
the length is piled up internally. Air is thrown after this thermal storage body,
which is heated with the gas of LPG burner.

21
The flow of air becomes supersonic while passing through the nozzle. The nozzle
for testing condition Mach 8 is cooled by water because it is exposed to high heat.
The engine is installed in the low pressure room, and is operated in a high-speed
current of air which spouts from the nozzle, and thrust, pressure, and the
temperature, etc. are measured.
The nozzle outlet size is 51 cm x 51 cm.
1.1.6.4. Atlantic Research Corporation Facilities (USA)
Features of the Airbreathing Facility (Figure 1-16):
• Three ramjet test cells.
• 2500 N (600-lbm) propellant capacity.
• Altitude simulation.
• Full transition and mission simulation capable.
Features of the Eight static test cells
• 1350 kg (3,000 lbm) propellant capacity.
• 1100 kN (250,000-lbf) thrust capacity.
• 40,000-rpm spin capability.
• High Speed X-ray.
• High Altitude Chambers:
o Altitude simulation up to 55000 m (180,000 ft).
o 11 kg (25-lbm) propellant capacity.

22
Figure 1-15. Sketch of Chitose Semi-Free-Jet Ramjet Test Setup [9]

23
Figure 1-16. ARC Connected Pipe Ramjet Test Centre [11]
1.1.6.5. Onera S4MA Wind Tunnel (France)
The main features (Figure 1-17) [12]:
• The facility produces an air flow at a maximum stagnation pressure of 150
bars and a maximum stagnation temperature of 1800 K
• Usable run duration up to 90s (with vacuum downstream tank of 8000 m3 at
10 mbars).
• The accumulation heater contains 11 tons of alumina pebbles, heated before
the run by propane combustion.
• During the run, the air from the heater, dry and non-vitiated, passes through
a 10 µm mesh dust filter upstream of nozzle (available for stagnation
temperature below 1250 K).
• 3 interchangeable nozzles; the throat of each nozzle is water cooled.
• A quick model introduction device is used to protect the model from flow
initiation and breakdown effects.

24
• The model is mounted with sting and mast on a moving table (angle of
attack range 27° at a maximum rate 5.5°/s, sideslip range 150° at a
maximum rate 11°/s).
• Possible use of the facility as a hot gas generator, dry and clean, for ramjet
testing, with exhaust to atmosphere.
Typical Tests
• Force measurements (6 components) on complete models.
• Force measurements and hinge moment measurements on model elements
and control surfaces.
• Wall pressure measurements, air intake probing (pressure, flow
angularities).
• Heat flux measurements (on complete models or model elements).
• Mechanical or thermal testing of real elements (e.g. coating).
Figure 1-17. Sketch of ONERA Connected-Pipe Test Setup [12]
1.1.6.6. Arnold Aerodynamic and Propulsion Test Unit (APTU-USA)
APTU is a blowdown free-jet test facility designed for true temperature
aerodynamic, propulsion and material/structures free-jet testing. A vitiated air

25
heater (VAH) provides the required temperature. Liquid oxygen (LOX) is added
upstream of the VAH to provide the correct oxygen mole fraction at the free-jet
exit plane for use by the test article. The facility is completely computer controlled
during a run, and very rapid transitions in pressure and temperature can be
accomplished. A sketch of the facility is given in Figure 1-18.
A 620 m3 (22,000 ft3) air storage system, pressurized to 260 bar (3800 psia), allows
a run duration of the facility from approximately 3 minutes to over 12 minutes,
depending on the free-jet nozzle selected and the altitude simulated in the test cell.
The test capability upgrade for APTU plans to use an existing high-enthalpy
Sudden Expansion (SUE) burner that is currently in storage at AEDC. This burner
was designed to provide a flow total temperature of 2500 K (4700oR) at a total
pressure as high as 193 bar (2800 psia).
Figure 1-18. Sketch of Hypersonic Test Setup of APTU [7]
1.1.6.7. U.S. Air Force Direct Connect Research Laboratory (USA)
This test facility provides combustor inlet flow conditions corresponding to flight
Mach numbers between 3.5 and 5, at dynamic pressures up to 95.8 kPa. The test

26
cell receives continuous airflow of 13.6 kg/s at 5.17 MPa and a maximum
temperature of 922K with 20.7 kPa continuous exhaust from the research air
facility. A recirculated cooling water system provides 158 l/s at 483 kPa; raw dump
water at 2.41 MPa is also available. A variety of conventional and advanced
instrumentation, including a steam calorimeter and a thrust stand, exist for accurate
documentation of combustor inlet and exit condition and performance parameters.
A sketch of the facility is given in Figure 1-19. [13]
Figure 1-19. Sketch of U.S. Air Force Connected Pipe Facility [13]
1.1.6.8. Comparison of Test Centers
Comparison of test centers is given in Table 1-1.
1.2. VITIATED AIR HEATERS
Free stream air entering to the inlet of a ramjet goes through aerodynamic
compression process. This process increases the static temperature of the air. For
realistic simulation, air heating system has to be integrated to the test facility to
obtain the elevated temperatures caused by aerodynamic compression.
Since combustor inlet Mach numbers are quite low, the static temperature is almost
equal to the stagnation temperature. At a flight Mach number of 4, the combustor
inlet temperature is approximately 1000K, at Mach 6 it is near 2000K, and at Mach
8 the temperatures are in the 3000 K range. The precise amount of heating required
to simulate true flight conditions also varies with altitude. In order to examine
combustion performance at realistic flight conditions these combustor inlet

27
temperatures must be reproduced in test facilities, and a method for producing this
heated air must be found.[1]
Table 1-1. Comparison of Properties between the Test Centers NASA Chitose Kakuda
Simulated Flight Mach number 4-7.5 4 4 - 6 - 8
Nozzle Exit/ Combustor Inlet Mach number 2 - 2.7 - -
Test gas Hydrogen Hydrogen -
Heater Vitiator Vitiator Pepple Bed
Storage Heater
Total pressure 8 - 35 bar 0.7 - 37 Bar 10, 50, 100 bar
Total temperature 800 - 2100 K 250 - 930 K 800,1500,
2500 K
Airflow 0.4 - 3.5 kg/s 150 kg/s -
Air Storage - - -
ONERA APTU USAF
Simulated Flight Mach number 6 - 12 3 - 7
Nozzle Exit/ Combustor Inlet Mach number 2 - 4 2 - 4 3.5 - 5
Test gas - Butane
Heater Pepple Bed
Storage Heater Vitiator Vitiator
Total pressure 150 bar 200 bar 50 bar
Total temperature 1800 K 2500 K 920 K
Airflow - 80 kg/s 13.6 kg/s
Air Storage 270 Bar
29 m3
260 Bar
600 m3 -
1.2.1. HEATER REQUIREMENTS
The air heater should operate on different mass flow rates. It should supply the air
in a wide temperature and pressure ranges. Another requirement is that, the heater
should operate on different test durations. The air delivered should have a uniform
temperature profile and low turbulence levels and be free of air contaminants.
Ignition and control of the output flow should be simple and steady state conditions

28
should be achieved quickly. The heater should be small and have low operation and
maintenance costs. The fuel or energy source should also be economical, safe and
available. The heater should also be easy, safe and affordable to use.
It is difficult to achieve all these criteria together. An optimum solution has to be
found.
1.2.1.1. Special Considerations for Vitiators
1.2.1.1.1. Make-up Oxygen
While heating the air in a vitiator, combustion process depletes part of the available
oxygen. In order to conduct combustion experiments, the oxygen content of the
flow must be restored to the proper percentage.
Table 1-2. Compositions for Ideal Air
Species O2 N2 Ar
Composition of dry air by volume % 20.95 78.07 0.98
Composition of dry air by weight % 23.19 75.46 1.35
Mean molecular weight of air 28.97
The aim is to calculate the make-up oxygen flow rate so that the mole fraction of
oxygen in the vitiator products is equal to that in atmospheric air. Compositions for
ideal air are given in Table 1-2 [14]. To get this mole fraction the stoichiometric
chemical reaction for the vitiator fuel and oxidizer combination must be examined.
For a methane - air vitiator the reaction is:
AiryOOHCOAirxOCH +++→++ 22224 2
Maintaining the mole fraction of oxygen preserves its partial pressure, and
therefore reaction rates which may be important at low combustor pressures or high
combustor Mach numbers. If the mass fraction of oxygen is maintained instead, the
oxygen available to react in the combustor will be less.

29
The make-up oxygen may be mixed into the flow at any point upstream of the
ramburner. However, it is usually helpful to add the oxygen upstream of the vitiator
to ensure good mixing and help raise the heater's efficiency and broaden its
operating range.
1.2.1.1.2. Air Contaminants
The use of vitiated air instead of ideal air to study ramjet combustion in connected-
pipe testing will have an effect not only on the experimental performance but also
on the theoretical performance prediction.[1]
The most important problem associated with vitiated air tests is the influence of the
contaminants on the combustion process. Unreacted vitiator fuel will add energy to
the ramjet and species such as CO and H2O can change ignition, combustion
efficiency and flame holding characteristics measured in the combustor.
Concerning the theoretical performance, contaminants complicate the problem of
calculating properties such as the molecular weight, specific heat ratio and the
enthalpy of the air entering the combustor. However, if the air heater operates
efficiently these thermodynamic properties can be calculated with computer codes,
assuming the heater products are at equilibrium by the time they enter the
combustor.
1.2.1.1.3. Fuel and Oxidizer Choices
The choice of a fuel and oxidizer combination for heating in a particular test
facility is complicated by all the concerns listed in 1.2.1. Table 1-3 lists some
common fuels and oxidizers together with some of their positive and negative
attributes.
1.2.1.2. Heater Installation and Use
The performance of a heater is significantly affected by the way it is installed in the
facility. [6]

30
The flow quality of air to the ramjet combustor under test can be modified by
means of flow strengtheners, screens or plenums to reduce turbulence and spatial
variations in flow pressures and temperatures from the heater. If water cooling is
necessary for the heater and the ducting to the combustor, heat loss may induce a
temperature gradient in the flow. Insulating the hardware to limit heat loss
minimizes this problem.
Table 1-3. Fuel and Oxidizers for Combusting Heaters [6]
Hydrogen Advantages:
• Wide flammability and ignition ranges
• Efficient combustion
Disadvantages:
• Water vapor and low molecular weight in exhaust
Hydrocarbon (liquid
or gaseous)
Advantages:
• Minimal safety requirements
Disadvantages:
• Carbon dioxide and water vapor in exhaust
NH3 Disadvantages:
• Water vapor in exhaust
• Toxicity
NO2 Advantages:
• Exhaust is similar to air
• Heat release upon decomposition
Disadvantages:
• Special handling required
N2O2 Disadvantages:
• Toxicity
Acoustic decoupling of the air heater from the fuel and oxidizer feed lines and the
ramjet combustor is often necessary to avoid introducing acoustic oscillations
unique to the facility installation of the ramjet under test. A basket diffuser having

31
many small holes is often used in the air heater to suppress these pressure
oscillations. Sonic orifices between the combustor and heater prevent feed back
from the ramburner to the vitiator. This solution, however, requires higher vitiator
supply pressures for the air, fuel and make-up oxygen, which necessitates higher
pressure supply tanks and/or pumps.
1.2.2. HEATER PERFORMANCE
1.2.2.1. Performance Parameters
Combustion efficiency is the most important heater performance parameter since
unburned heater fuel will affect the results obtained with the ramjet tested.
Uniform temperature and pressure profiles in the vitiator exhaust are desirable.
The heater should have a smooth combustion behavior with a minimum of pressure
oscillations and be free of distinct resonance frequencies.
Heat loss to the heater structure or downstream devices is a performance related
parameter since it increases heater fuel flow and subsequently the air contaminants.
The envelope of heater operation should be wide enough to allow for the
temperature and mass flow variations needed for flight trajectory simulations.
1.2.3. FLAME HOLDERS
Typical velocities in vitiators or Ramjet combustors are greater than 30 sm , which
exceed the flame speed of hydrocarbon and air mixtures. Any flame initiated in a
high velocity region would be swept downstream. Consequently, to stabilize a
flame in the combustor, a low velocity region is required. [15]
It is of very great use that the flame-stabilization process is seen as nothing but the
interaction of high-temperature reaction kinetics with the aerodynamics of the
recirculation.

32
If the fluid stream is a gas capable of sustaining an exothermic reaction, moving at
an average velocity greatly in excess of the speed of laminar flame propagation of
the mixture, a steady flame can exist only if a flame-stabilising device is provided
in the stream. [16]
1.2.3.1. Common Flame Stabilizing Devices
• A jet of hot gas injected into the steam in the direction of flow
• A jet of gas at the same temperature as the oncoming stream, at such an
angle to it that recirculation is provoked
• A stream-lined surface, heated by external means to a high temperature
• A stream-lined catalytic surface, heated by the reaction of main-stream
gases in contact with it
• A steady stream of sparks
1.2.3.2. Flame Stabilization by Bluff Bodies
The most common flame-stabilising device is the “bluff body”. A “bluff body” is a
solid object of such a shape that, when it is suspended in a fluid stream, a re-
circulatory flow is formed in its immediate wake as shown in Figure 1-20.
Examples are:
• a sphere,
• a circular-sectioned cylinder with its axis at right angles to the direction of
flow,
• a cone with its axes parallel to the direction of flow,
• a V-sectioned “gutter” with its edges at right angles to the flow direction.
The essential feature is the recirculation found in the immediate wake of the body.
Another name for “bluff-body flame-stabilizer” is “baffle”.
If the whole fluid stream is combustible, the stabilization region is normally
followed by a propagation region, in which the flame spreads from the bluff-body

33
stabilizer to the wall. If the fuel air ratio of the stream is non-uniform, this
propagation may be of only limited extent (Figure 1-21).
Figure 1-20. Recirculating Flow Behind a Sphere, a Gutter and a Strut
Figure 1-21. Flame Propagation Downstream of a Baffle: (a) For A Uniform Fuel-
Air Mixture, (B) When The Fuel Is Confined To A Central Region.
1.2.3.3. Flow Pattern Behind a Bluff Body
The pattern of stream lines is roughly as shown in Figure 1-22. The reverse-flow
region is usually between two and five body widths long. The fluid within the
closed stream lines is highly turbulent at the velocities which are encountered in
flame-stabilization practice.

34
1.2.3.4. Flame Stabilization by Recirculation
An alternative to a bluff body is a recess in the wall of the combustor. Recesses
with leading edges that are adequately sharp produce flow separation to establish a
recirculation zone in the recess. The stabilization mechanism is like that of the
bluff body. The length of the wall recess plays the same role as the length of the
bluff-body recirculation zone in stabilization. The design is a duct with a small
cross-sectional area expanding coaxially into a duct with a larger cross-sectional
area (Figure 1-23). The flame is stabilized by the recirculation region that forms at
the step. Designs of this type are becoming popular since they offer benefits such
as reduced losses in total pressure; associated wall-heating problems are solvable,
for example, by transpiration cooling if necessary.[17]
Figure 1-22. Flow Behind a Baffle
Figure 1-23. Stabilization Setup by Recirculation

35
1.2.3.5. Pilot Flames
The immediate expansion of the mixture as soon as it leaves the central orifice of
the nozzle creates some depression around it. Secondary air is necessary both for
stabilizing the pilot flame and complete the combustion of gas. The combined
effect of the pressure drop through the pilot ports and the impact of the flames on
the outer rails act as a stabilizer on the flame. This type of construction prevents the
burner from overheating. Design alternatives for flame stabilization by pilot flames
are given in Figure 1-24.[17]
Figure 1-24. The Stabilization Setups by Pilot Flames
1.3. TECHNICAL METHOD
The design of the connected pipe ramjet test facility is based on the conceptual
design a ramjet missile which is reported in [2].
1.3.1. DESIGN INPUTS
The trajectory and flight data of the ramjet engine has been determined by guidance
study. The trajectory and Mach number evolution during flight is given in Figures
1-25 and 1-26.

36
Notice that for the chosen trajectory, the ramjet engine will stop at 200 s of flight.
After that it will fly horizontally by increasing its angle of attack and will start
diving at 250 s.
Design of the inlet of Missile X is performed for cruise conditions; flight altitude of
16 km and Mach number of 3.5. Off-design analysis of the inlet is also performed.
For the trajectory and Mach number evolutions presented in Figures 1-25 and 1-26,
the pressure, temperature and air mass flow rate values at the combustor inlet are
evaluated for entire flight. Pressure, temperature and air mass flow rate variation
versus time graphs are presented in Figures 1-27, 1-28 and 1-29, respectively.
0
2000
4000
6000
8000
10000
12000
14000
16000
18000
0 50 100 150 200 250 300
Time (s)
Alti
tude
(m)
Figure 1-25. Flight Trajectory of Missile X.

37
1
1.5
2
2.5
3
3.5
4
0 50 100 150 200 250 300
Time (s)
Mac
h N
umbe
r
Figure 1-26. Mach Number Evolution of Missile X.
Air Mass Flow Rate vs. Time
0
1
2
3
4
5
6
7
8
9
0 20 40 60 80 100 120 140 160 180 200
Time (s)
Air
Mas
s Flo
w R
ate
(kg/
s)
Figure 1-27. Mass Flow Rate Captured by Inlets vs. Time

38
0
1
2
3
4
5
6
7
8
9
0 20 40 60 80 100 120 140 160 180 200
Time (s)
Stat
ic P
ress
ure
(Bar
)
Figure 1-28. Static Pressure at the Combustor Inlet vs. Time
300
350
400
450
500
550
600
650
700
750
800
0 20 40 60 80 100 120 140 160 180 200
Time (s)
Stat
ic T
empe
ratu
re (K
)
Figure 1-29. Static Temperature at the Combustor Inlet vs. Time
Test facility designed in this study will be able to provide the air mass flow rate,
temperature and pressure variation presented in Figures 1-27, 1-28 and 1-29 for test
duration of 200 s.
Ramjet combustor air inlet area is 3673.4 cm2.

39
1.3.2. DESIGN METHODOLOGY
During design process three subsystems have been analyzed; air storage system, air
heater system and test chamber. Exhaust system is not considered in this test
facility. Design algorithm followed during the design process is given in Figure
1-30.
Figure 1-30. Design Algorithm of the Connected Pipe Test Facility

40
CHAPTER 2
2. AIR STORAGE SYSTEM DESIGN
AIR STORAGE SYSTEM DESIGN
2.1. INTRODUCTION
In this chapter, design of the air storage system is considered. Design of the
pressure vessel is initiated by vessel sizing for different pressures and wall
thickness. After an evaluation of the designed cases, some of the alternatives are
eliminated because of the high manufacturing cost, material limitation and difficult
manufacturing operations. Then the flow control system is designed for the
remaining alternatives and finally the best solution for pressure vessel and flow
control system is selected. Pressure vessel design is based on ASME Codes. Design
methodology and equations of ASME Code are given in Appendix A. Details of
pressure vessel design is given in Appendix B.
2.1.1. SYSTEM REQUIREMENTS
Air storage system should be able to supply the air mass flow rate profile presented
in Figure 1-27 and the pressure profile presented in Figure 1-28.
2.1.2. SYSTEM COMPONENTS
Component tree of air storage system is given in Figure 2-1. Main components of
the air storage system are as follows:
• Pressurized air tanks (to store air which is needed during the ground testing)
• Compressor (to charge the air tank with air)
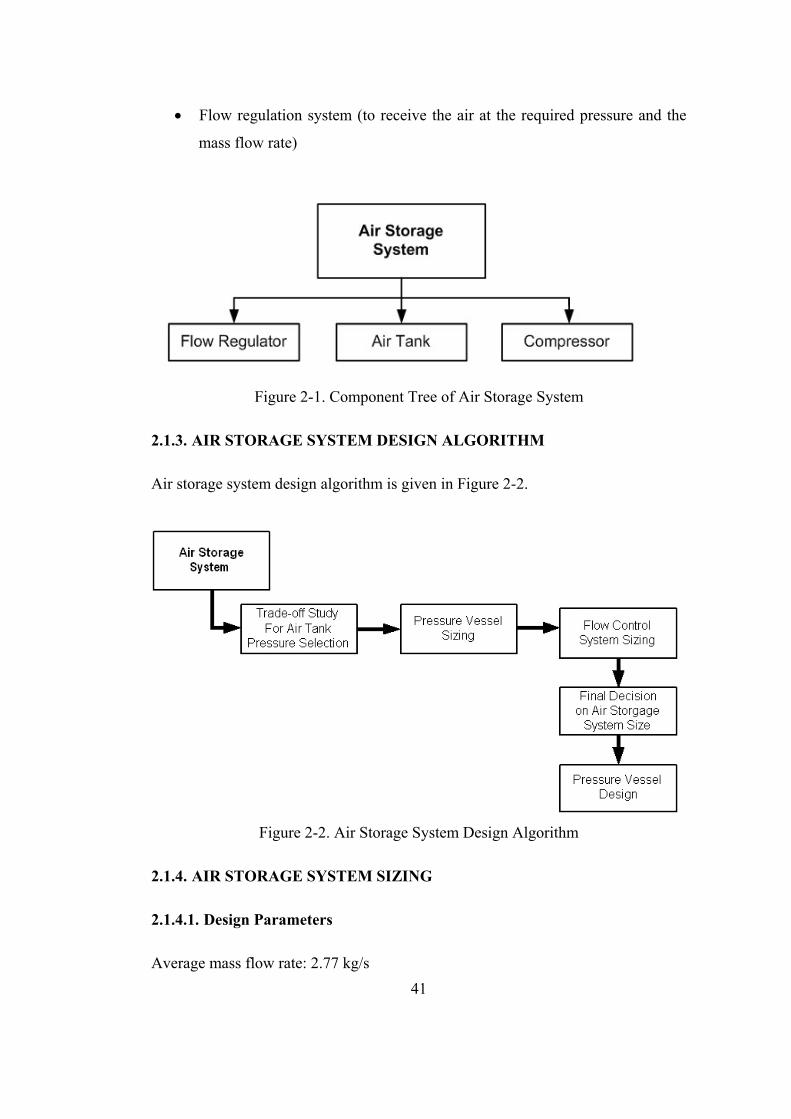
41
• Flow regulation system (to receive the air at the required pressure and the
mass flow rate)
Figure 2-1. Component Tree of Air Storage System
2.1.3. AIR STORAGE SYSTEM DESIGN ALGORITHM
Air storage system design algorithm is given in Figure 2-2.
Figure 2-2. Air Storage System Design Algorithm
2.1.4. AIR STORAGE SYSTEM SIZING
2.1.4.1. Design Parameters
Average mass flow rate: 2.77 kg/s

42
Test duration: 200 seconds
Total mass of air needed: 550 kg
Safety factor: 3
Total air to be stored: 1650 kg
Air critical temperature: 132.65 K [18]
Air critical pressure: 37.71 bar [18]
2.1.4.2. Sizing
Pressure of the air storage tank has to be determined to design the pressure vessels
and pressure regulation system. A tradeoff study is performed to choose the best
configuration for the present case. The results of the study are given in Table 2-1.
For four pressures alternative (50, 100, 150 and 200 bar), density and volume
required to store 1650 kg of air are calculated.
Table 2-1. Trade-Off Study for Tank Pressure Selection
Case 1 Case 2 Case 3 Case 4
Pressure (bar) 50 100 150 200
Reduced Pressure 1.326 2.65 3.97 5.29
Reduced Temperature 2.25 2.25 2.25 2.25
Compressibility Factor 0.9865 0.986 0.9982 1.022
Density (kg/m3) 59.26 118.5 175.7 228.8
Volume (m3) 27.8 14 9.39 7.21
Case 1 to Case 4 is studied during the air tank design.
2.2. PRESSURE VESSEL DESIGN
Case 1 to 4 given in Table 2-1 is studied in detail in this section. In the analysis,
quenched/tempered alloy steel is used. Ultimate Tensile Strength of the material is
828 MPa. Safety factor for the shell and head are taken as 3 and 4, respectively.

43
Shell contains a welding seam longitudinally and the head is connected to shell by
welding. The thickness of the shell and the head is limited by the weld technology.
In order to ease welding operation, thickness of the shell and the head is limited to
15 mm. Two conditions are considered, thickness for 10 and 15 mm. Then, the
volume of the tank is evaluated using the calculated radius. Length of the tank is
taken as 2 meters. Results are tabulated in Table 2-2.
Table 2-2. Pressure Vessel Sizing
Cylindrical Section Case 1 Case 2 Case 3 Case 4
Pressure (bar) 50 100 150 200
Volume (m3) 27.8 14 9.39 7.21
Thickness (mm) 10 15 10 15 10 15 10 15
Vessel Radius
(mm)
546 819 270 405 178 267 132 198
Unit Vessel
Volume (m3)
1.87 4.21 0.46 1.03 0.2 0.45 0.11 0.25
Number of Vessels 22 10 44 20 75 34 100 44
Elliptic Head
Thickness (mm) 14 20.6 14 21.5 14.6 22 15.5 23
As the internal pressure increases, the vessel radius decreases and the number of
vessel increases. On the other hand, the production is easy to handle for vessels that
are smaller in size. Also for high pressure vessels, pressure regulation is more
complicated.
Case 3 and Case 4 is eliminated at this point because of the high number of vessels
to be manufactured. Also the head with thickness greater than 20 mm is not easy to
manufacture. Pressure vessel alternatives will be considered as Case 1 and Case 2
with thickness 10 mm from this point on.

44
A computer code (Discharge Code) is written to evaluate the pressure and
temperature change during discharge. First law of thermodynamics and
compressible flow properties are used in this code. Details on the discharge code
are given in APPENDIX D. Results are given in Figures 2-3 and 2-4 for Case 1 and
Case 2, respectively.
Temperature at the end of 200 seconds is 255 K for both Case 1 and Case 2.
Pressure vessel material properties can perform efficiently between these operation
temperatures, 298 K to 255 K.
Vessel choice is also depends on the pressure regulation system.
0.00
50.00
100.00
150.00
200.00
250.00
300.00
350.00
0 20 40 60 80 100 120 140 160 180 200
Time (s)
Tem
p(K
), Pr
essu
re (b
ar)
TemperaturePressure
Figure 2-3. Pressure and Temperature Change During Discharge for Case 1

45
0
50
100
150
200
250
300
350
0 20 40 60 80 100 120 140 160 180 200
Time (s)
Tem
p(K
), Pr
essu
re (b
ar)
TemperaturePressure
Figure 2-4. Pressure and Temperature Change During Discharge for Case 2
2.3. FLOW CONTROL SYSTEM
In the connected pipe test stand, pressurized air has to be supplied to the heater.
Pressure of air stored in the vessel is higher than required. To obtain the required
pressure along with the required mass flow rate, a flow regulation system should be
used. Regulation can be obtained by using valve series. Air to be supplied to the
ramjet engine is around 5 bar. The valves available in the market offers pressure
drop between 5-25 bar. For pressure vessel pressure higher than 50 bar, special
flow regulators as well as a bundle of pipe that contains on-off control valves can
be used to decrease the pressure down to acceptable level to be handled by the
valve series. To couple pressure regulator and the valves, a resting chamber can be
utilized (Figure 2-5).

46
Figure 2-5. Pressure Regulation System
Flow regulation components are as follows:
• Pressure regulator (special regulator or bundle of pipe)
• Resting chamber
• Regular Valves for flow control
2.3.1. PRESSURE REGULATION BY VALVES
Mass flow rate and pressure of air can not be adjusted by one regulating valve. A
series of valves should be used as shown in Figure 2-5.
A valve can supply a certain pressure drop for specific mass flow rate. For two
valves with different characteristics, required pressure and mass flow rate can be
obtained.
2.3.1.1. Valve Sizing
2.3.1.1.1. Terminology
dp: Differential pressure across test valve, measured in kPa (psi).
Flow coefficient (Cv): The number of standard cubic meters of air (air at standart
pressure and temperature) per minute that can flow through the valve at a pressure
drop of one psi. (Note: The maximum Cv is determined with the valve in a fully
open position. However, intermediate flow coefficients can also be determined.)

47
N: The numerical constant for the units of measurement used in the general sizing
equations. N is 4.17 when q is expressed in m3/h, P is expressed in kPa, and T is
expressed in K. [Note: N is 1,360 when q is expressed in scfh, P in psia, and T in
°R.]
P: Absolute pressure at upstream test manifold tap, expressed in kPa (psia). [P(abs)
=P(gauge) + barometric pressure]
q: Volumetric flow rate (scmh).
Sg: The specific gravity of a gas relative to air, Sg approximately equals the ratio
of the mass of a gas to the mass of an equal volume of air at a specified
temperature. [Specific gravity of air =1.0 at 15.6°C(60°F).]
T: Absolute temperature of test gas, K (or °R).
x: the ratio of differential pressure to absolute inlet static pressure, dP/P.
Scheme for valve calculations is given in Figure 2-6.
Figure 2-6. Scheme for Valve Calculations
5.0.
.
=
xST
PNqC g
v [19]

48
2.3.1.1.2. Valve Selection
The Cv value should be used as a guide in the valve selection. A valve that is less
than half the pipe size shouldn’t be used. Also using the lower 10% and upper 20%
of the valve stroke should be avoided. The valve is much easier to control in the
10-80 % stroke range.
2.3.1.2. Pressure Regulation for Case 1
In this case, two valves are directly connected to pressure vessel one after each
other. Tank pressure and temperature given in Figure 2-3 is used in Cv analysis.
Results are given in Table 2-3.
Table 2-3. Cv Analysis for Case 1
1st valve 2nd valve
maxCv 8.8 6.0
minCv 33.2 22.2
maxP∆ 17 bar 30.5 bar
minP∆ 17 bar 7 bar
2.3.1.3. Pressure Regulation for Case 2
For Case 2, it is not possible to obtain required pressure regulation by only regular
valve series. In this situation, a prior regulation is required (First 100 bar will be
reduced to 50 bar). A resting chamber can be placed between the regulator and the
valves. Resting chamber helps to control the flow and ease the calculations. The
special regulator will keep the pressure of the resting chamber at a constant value
(50 bar) and the other two valves will act as in Case 1 to obtain the pressure profile
given in Figure 1-28.

49
Air temperature at the resting chamber is assumed to be the same with the vessel
temperature given in Figure 2-4. Results of the Cv values obtained are tabulated in
Table 2-4:
Table 2-4. Cv Analysis for Case 2
1st valve 2nd valve
maxCv 8.8 7.3
minCv 36.5 39.15
maxP∆ 20 bar 12.5 bar
minP∆ 20 bar 7.45 bar
2.3.2. PRESSURE REGULATION FOR HIGH PRESSURE DROP
Pressure regulation between tank pressure and resting chamber pressure can be
obtained by special pressure regulators for Case 2. Such regulators are available on
the market. An example is given is Figure 2-7.
Flow rate at standard conditions are calculated as:
scmhQ 390max =
scmhQ 90min =
Max Primary Pressure = 100 bar
Secondary Pressure (resting chamber) = 35 bar
2.4. STORAGE SYSTEM CHOICE
2.4.1. EVALUATION OF STORAGE SYSTEM CASE 1
• Internal pressure of the main tank is 50 bar. Pressure is easy to control.
• 22 tank with 546 mm radius can be used. Less tank is needed than Case 2.
• Radius is greater than Case 2. Manufacturing is more difficult.
• Pressure regulation is simple. It can be achieved by two regular valve.

50
Figure 2-7. Example of High Pressure Regulator
2.4.2. EVALUATION OF STORAGE SYSTEM CASE 2
• Internal pressure of the tank is 100 bar. Pressure is more difficult to control.
• 44 tank with 270 mm radius can be used.
• Manufacturing is easier for small size.
• Pressure regulation is more complex. A regulator and resting chamber is
needed in addition to the other two regular valve.

51
When Case 1 and Case 2 are compared, it is more feasible to employ Case 1.
Design method and equations are given in Appendix A. Details for mechanical
design is given in the Appendix B.
2.5. COMPRESSOR TO CHARGE THE AIR TANK
The compressor should be able to compress the air up to 50 bar which is the
pressure of the selected air tank. Such compressors are available on the market.
Technical data of one compressor manufactured by Atlas Corpo which can be used
in the system is as follows:
Gas: hydrocarcon, air, carbone dioxide, nitrogen
Compressor shaft power: 30-1500 kW / 40-2040 HP
Compressor speed: ≤ 1000 rpm
Maximum working pressure:
• 100 % oil-free : Pmax = 90 bar / 1300 psi
• Mini-lub : Pmax = 200 bar / 3000 psi
• Full lubrication : Pmax = 350 bar / 5000 psi
Minimum pressure ratio: 1.2
Minimum working pressure: 2 bar / 30 psi
Minimum suction temperature: -50°C / -60°F
A picture of the compressor is given in Figure 2-8 and air flow rates supplied by
the compressor is shown in Figure 2-9.

52
Figure 2-8. Example of High Pressure Compressor
Figure 2-9. Air Flow Rates of EHNX GT Compressor

53
CHAPTER 3
3. AIR HEATER SYSTEM DESIGN
AIR HEATER SYSTEM DESIGN
3.1. AIR HEATER DESIGN
For the current study, the best way to achieve temperature variation that
simulates the flight conditions is to use a vitiator or a combination of
vitiator and electric heaters.
Solutions for transient simulations can be as follows:
• A single vitiator with adjustable fuel flow rate: Computer controlled valves
adjusts the fuel flow rate. By adjusting the correct air to fuel ratio, the
required air temperature is obtained. The response of the fuel flow rate on
the output temperature is very quick.
• A vitiator following an electric resistance heater: An electric heater
has limiting conditions such as material strength and operation cost.
On the other hand, temperature variation can be controlled easily by
electric heater. This solution eliminates the need for computer
controlled valves but fast response from electric heater for air
temperature can not be obtained.
3.1.1. VITIATOR ANALYSIS
Several different vitiator design alternatives are studied for the three flame holding
mechanisms stated in section 1.2.3. Combustion analyses are performed by using
FLUENT CFD code. Modeling methodology and verification of FLUENT

54
combustion module is presented in APPENDIX C. Analysis are performed to
obtain the most suitable design by using the experimental results given in [6].
Measured test data from [6] are as follows:
Vitiator fuel: CH4
Air: 79% N2 – 21%O2 (mass fraction of O2 is 23.19%)
• Mass flows rates:
skgmvf 047.0=&
skgmO 262.02=&
skgmair 383.6=&
• Pressures and temperatures:
PaP 6502002 =
KTt 6062 =
Air inlet size is designed such that the flow Mach Number at the inlet is 0.3.
3.1.1.1. FLUENT MODELLING
In combustion analysis, Finite rate chemistry model is used. Species transport
model is selected for species handling and volumetric reactions are considered.
Eddy-Dissipation (for turbulent flows, computes the mixing rate) is chosen for the
“Turbulance – Chemistry Interaction” model. Mixture properties which are already
available in FLUENT database are used.
For physical properties of the species in the mixture like molecular weight,
viscosity, thermal conductivity etc., default values from the FLUENT database are
used.
A turbulent model has to be specified. The realizable k-ε model is used.
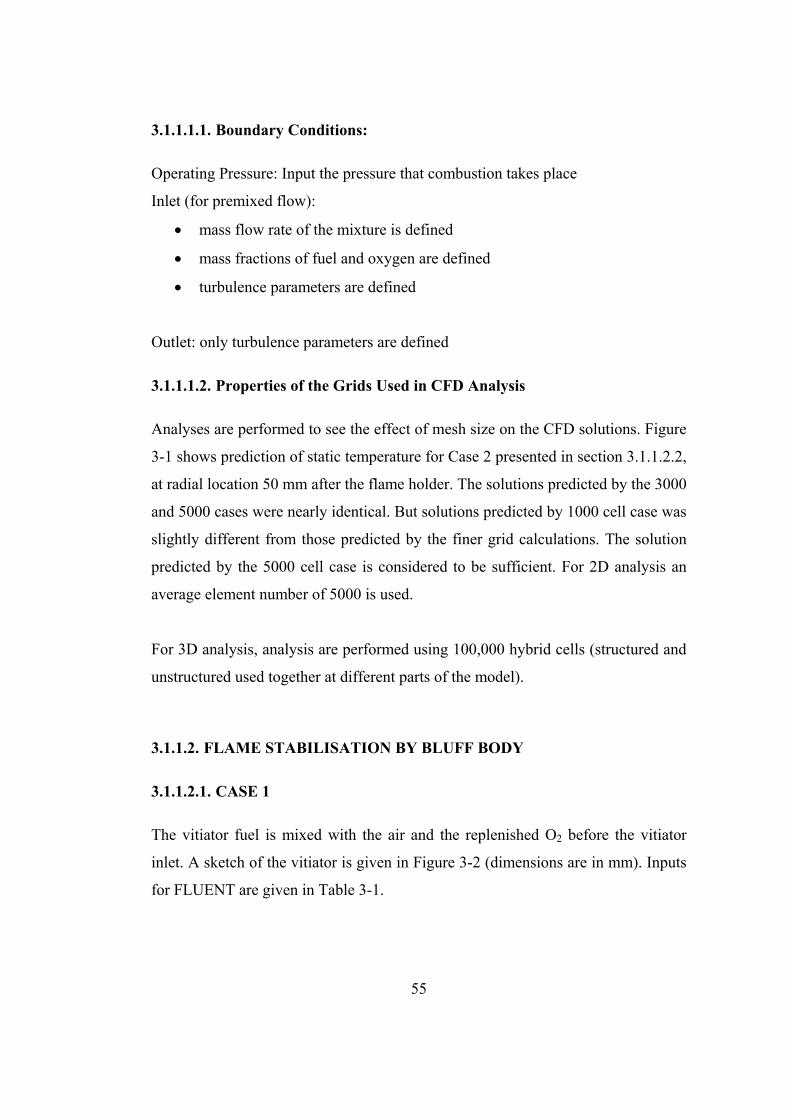
55
3.1.1.1.1. Boundary Conditions:
Operating Pressure: Input the pressure that combustion takes place
Inlet (for premixed flow):
• mass flow rate of the mixture is defined
• mass fractions of fuel and oxygen are defined
• turbulence parameters are defined
Outlet: only turbulence parameters are defined
3.1.1.1.2. Properties of the Grids Used in CFD Analysis
Analyses are performed to see the effect of mesh size on the CFD solutions. Figure
3-1 shows prediction of static temperature for Case 2 presented in section 3.1.1.2.2,
at radial location 50 mm after the flame holder. The solutions predicted by the 3000
and 5000 cases were nearly identical. But solutions predicted by 1000 cell case was
slightly different from those predicted by the finer grid calculations. The solution
predicted by the 5000 cell case is considered to be sufficient. For 2D analysis an
average element number of 5000 is used.
For 3D analysis, analysis are performed using 100,000 hybrid cells (structured and
unstructured used together at different parts of the model).
3.1.1.2. FLAME STABILISATION BY BLUFF BODY
3.1.1.2.1. CASE 1
The vitiator fuel is mixed with the air and the replenished O2 before the vitiator
inlet. A sketch of the vitiator is given in Figure 3-2 (dimensions are in mm). Inputs
for FLUENT are given in Table 3-1.

56
Figure 3-1. Prediction of Temperature Using Different Grid Densities
Figure 3-2. Sketch of Case 1
Table 3-1. Case 1 Inputs for FLUENT Boundary Conditions
Inlet O2 CH4
airm& ( )skg 6.383 1.48
2Om& ( )skg 0.262 0.262
vfm& ( )skg 0.047 0.047
totalm& ( )skg 6.692 1.742 0.047
Mass fraction 26% 0.7%

57
NOTE: Mass flow rate of O2 (1.48 skg ) is calculated by mass flow rate of air x
0.2319 (mass fraction of O2 in air as given in Table 1-2).
Contours of static temperature obtained from FLUENT are given in Figure 3-3.
Figure 3-3. Contours of Static Temperature of Case 1.
Table 3-2. Flow Properties at the Outlet Plane (Case 1)
Static Pressure 650209.1 Pa
Static Temperature (Average) 613.07 K
Mole fraction of O2 21.040 %
Mole fraction of CH4 0.083 %
Mole fraction of H2O 2.347 %
Mole fraction of CO2 1.173 %
Mole fraction of N2 75.356 %
Max. Temp. 633.45 K
Min. Temp. 582.71

58
Results
• Since the flow speed is higher than the flame speed, combustion starts after
the bluff body where the circulation occurs.
• Almost uniform temperature profile is obtained at the outlet.
• Mole fraction of oxygen at the exit plane is very close to the ideal air
conditions.
Comments
The results obtained from one single bluff body are acceptable. To obtain a better
temperature profile at the outlet plane, another configuration of bluff body flame
stabilization is studied in Case 2.
3.1.1.2.2. CASE 2
The vitiator fuel is mixed with the air and the replenished O2 before the vitiator
inlet. A sketch of the vitiator is given in Figure 3-4 (dimensions are in mm). Inputs
for FLUENT Boundary Conditions are the same with Case 1 (Table 3-1). Contours
of static temperature obtained from FLUENT are given in Figure 3-5.
Figure 3-4. Sketch of Case 2

59
Figure 3-5. Contours of Static Temperature of Case 2.
Table 3-3. Flow Properties at the Outlet Plane (Case 2)
Absolute Pressure 650121.6 Pa
Static Temperature 609.44 K
Mole fraction of O2 20.880 %
Mole fraction of CH4 0.000 % (less than 10-9)
Mole fraction of H2O 2.512 %
Mole fraction of CO2 1.256 %
Mole fraction of N2 75.350 %
Max. Temp. 614.68 K
Min. Temp. 606.86

60
Results
• Since the flow speed is higher than the flame speed, combustion starts after
the bluff body where the circulation occurs.
• Uniform temperature profile is obtained at the outlet.
• Mole fraction of oxygen at the exit plane is very close to the ideal air
conditions.
• No unburned fuel.
Comments
Results obtained from Case 2 are much better than those of Case 1.
In Case 1 and Case 2, air and fuel was premixed before entering the vitiator. In
Case 3, fuel will be injected from a nozzle inside the vitiator.
3.1.1.2.3. CASE 3
In this case, the vitiator fuel is injected behind the bluff body. The air and the
replenished O2 are fed to the combustor from the vitiator inlet. A sketch of the
vitiator is given in Figure 3-6 (dimensions are in mm). Inputs for FLUENT are
given in Table 3-4.
Figure 3-6. Sketch of Case 3

61
Table 3-4. Case 3 Inputs for FLUENT Boundary Conditions
Inlet O2 CH4
airm& ( )skg 6.383 1.48
2Om& ( )skg 0.262 0.262
vfm& ( )skg 0.047
totalm& ( )skg 6.65 1.742 0.047
Mass fraction 26.2 % 100 %
Contours of static temperature obtained from FLUENT are given in Figure 3-7.
Figure 3-7. Contours of Static Temperature of Case 3.

62
Table 3-5. Flow Properties at the Outlet Plane (Case 3)
Absolute Pressure 650201.8 Pa
Static Temperature 741.05 K
Mole fraction of O2 19.100 %
Mole fraction of CH4 0.967 %
Mole fraction of H2O 3.911 %
Mole fraction of CO2 1.958 %
Mole fraction of N2 74.064 %
Max. Temp. 2165.85
Min. Temp. 310.67
Results
• Combustion starts after the bluff body since the fuel is injected there.
• Temperature profile is not uniform at the outlet.
• Mole fraction of oxygen at the exit plane is lower than ideal air conditions.
• Unburned fuel percent is high.
• Maximum flame temperature is 2310 K, which is very high. For this case,
material selection for combustion chamber case is critical. Also insulation is
required to handle the high temperatures.
Comments
Injecting the fuel at the point of recirculation caused the combustion to start at that
place. Near the nozzle, air to fuel ratio reached close to stoichiometric value so that
the temperature reached to 2310 K. Also, the temperature at the exit plane is not
uniform.
For flame stabilization by bluff body, Case 2 supplied us the best results.
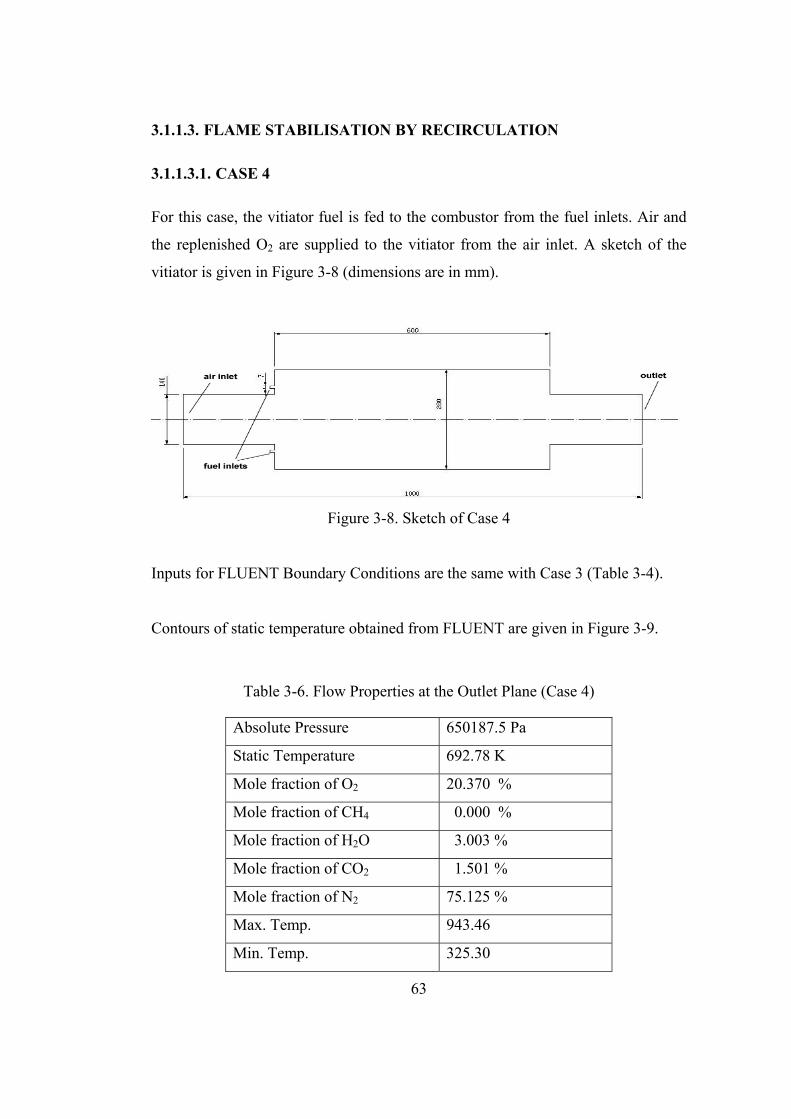
63
3.1.1.3. FLAME STABILISATION BY RECIRCULATION
3.1.1.3.1. CASE 4
For this case, the vitiator fuel is fed to the combustor from the fuel inlets. Air and
the replenished O2 are supplied to the vitiator from the air inlet. A sketch of the
vitiator is given in Figure 3-8 (dimensions are in mm).
Figure 3-8. Sketch of Case 4
Inputs for FLUENT Boundary Conditions are the same with Case 3 (Table 3-4).
Contours of static temperature obtained from FLUENT are given in Figure 3-9.
Table 3-6. Flow Properties at the Outlet Plane (Case 4)
Absolute Pressure 650187.5 Pa
Static Temperature 692.78 K
Mole fraction of O2 20.370 %
Mole fraction of CH4 0.000 %
Mole fraction of H2O 3.003 %
Mole fraction of CO2 1.501 %
Mole fraction of N2 75.125 %
Max. Temp. 943.46
Min. Temp. 325.30
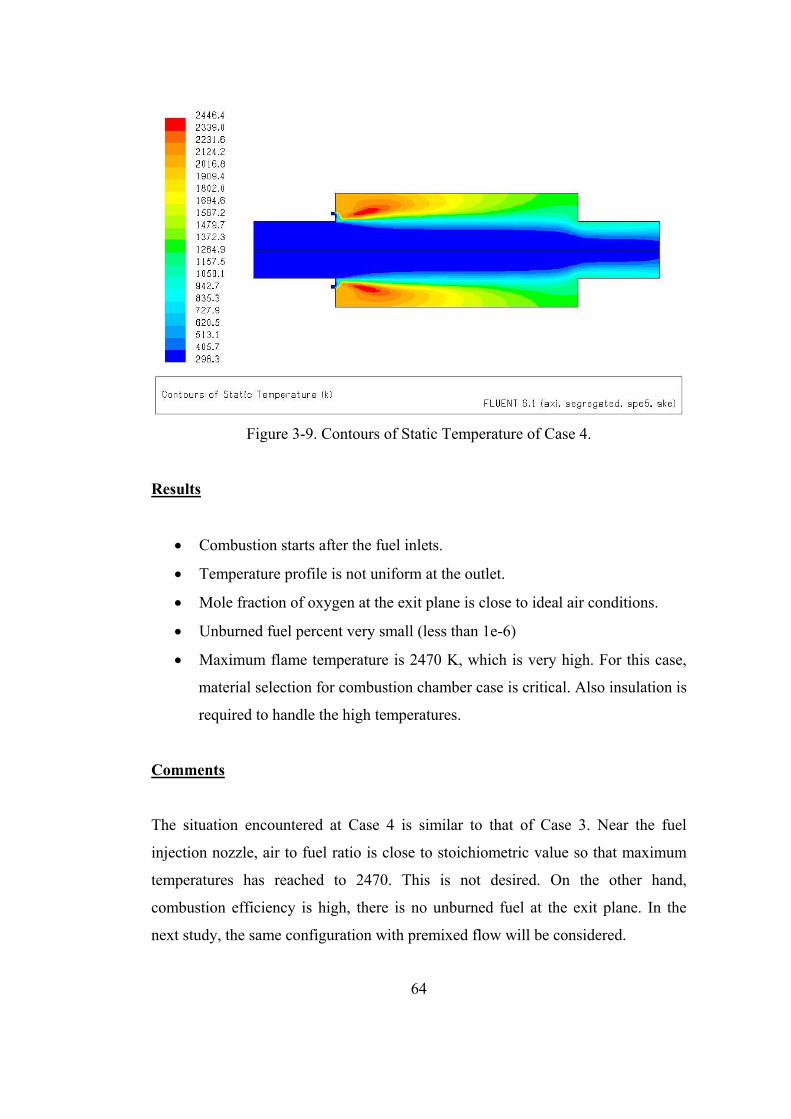
64
Figure 3-9. Contours of Static Temperature of Case 4.
Results
• Combustion starts after the fuel inlets.
• Temperature profile is not uniform at the outlet.
• Mole fraction of oxygen at the exit plane is close to ideal air conditions.
• Unburned fuel percent very small (less than 1e-6)
• Maximum flame temperature is 2470 K, which is very high. For this case,
material selection for combustion chamber case is critical. Also insulation is
required to handle the high temperatures.
Comments
The situation encountered at Case 4 is similar to that of Case 3. Near the fuel
injection nozzle, air to fuel ratio is close to stoichiometric value so that maximum
temperatures has reached to 2470. This is not desired. On the other hand,
combustion efficiency is high, there is no unburned fuel at the exit plane. In the
next study, the same configuration with premixed flow will be considered.

65
3.1.1.3.2. CASE 5
The vitiator fuel is mixed with the air and the replenished O2 before the vitiator
inlet. A sketch of the vitiator is given in Figure 3-10 (dimensions are in mm).
Figure 3-10. Sketch of Case 5
Inputs for FLUENT Boundary Conditions are the same with Case 1 (Table 3-1).
Contours of static temperature obtained from FLUENT are given in Figure 3-11.
Figure 3-11. Contours of Static Temperature of Case 5.

66
Table 3-7. Flow Properties at the Outlet Plane (Case 5)
Absolute Pressure 650199.7 Pa
Static Temperature 610.07 K
Mole fraction of O2 21.080 %
Mole fraction of CH4 0.090 %
Mole fraction of H2O 2.316 %
Mole fraction of CO2 1.158 %
Mole fraction of N2 75.356 %
Max. Temp. 640.02
Min. Temp. 454.7
Results
• Combustion starts after the area expansion where the recirculation occurs.
• Temperature profile is not uniform at the outlet.
• Mole fraction of oxygen at the exit plane is slightly higher than ideal air
conditions.
• There are some unburned fuel at the exit.
Comments
The air/fuel mixture entering the combustion chamber from the center of the inlet
leaves the combustion chamber without entering a combustion process. As a result,
oxygen and fuel mole fractions are higher than desirable.
At this point, a new combustion chamber design based on flame stabilization with
sudden expansion is studied.

67
3.1.1.3.3. CASE 6
The vitiator fuel is mixed with the air and the replenished O2 before the vitiator
inlet. A sketch of the vitiator is given in Figure 3-12 (dimensions are in mm).
Figure 3-12. Sketch of Case 6
Inputs for FLUENT Boundary Conditions are the same with Case 1 (Table 3-1).
Contours of static temperature obtained from FLUENT are given in Figure 3-13.
Figure 3-13. Contours of Static Temperature of Case 6.

68
Table 3-8. Flow Properties at the Outlet Plane (Case 6)
Absolute Pressure 650500.9 Pa
Static Temperature 634.19 K
Mole fraction of O2 21.070 %
Mole fraction of CH4 0.001 %
Mole fraction of H2O 2.511 %
Mole fraction of CO2 1.255 %
Mole fraction of N2 75.161 %
Max. Temp. 611.78
Min. Temp. 600.90
Results
• Combustion starts after the sudden expending section.
• Temperature profile is uniform at the outlet.
• Mole fraction of oxygen at the exit plane is slightly higher than ideal air
conditions.
• Unburned fuel percent is low.
Comments
The results obtained are close to the desired values.
To alter the results of case 6, a similar combustor design is developed for Case 7.
The cone at the middle is reversed to obtain another circulation zone.
3.1.1.3.4. CASE 7
The vitiator fuel is mixed with the air and the replenished O2 before the vitiator
inlet. A sketch of the vitiator is given in Figure 3-14 (dimensions are in mm).

69
Figure 3-14. Sketch of Case 7
Inputs for FLUENT Boundary Conditions are the same with Case 1 (Table 3-1).
Contours of static temperature obtained from FLUENT are given in Figure 3-15.
Figure 3-15. Contours of Static Temperature of Case 7.
Results
• Combustion starts after the sudden expending section.
• Temperature profile is uniform at the outlet.
• Mole fraction of oxygen at the exit plane is close to that of ideal air.
• Unburned fuel percent is very low.

70
Table 3-9. Flow Properties at the Outlet Plane (Case 7)
Absolute Pressure 650258.6 Pa
Static Temperature 621.22 K
Mole fraction of O2 20.890 %
Mole fraction of CH4 0.004 %
Mole fraction of H2O 2.505 %
Mole fraction of CO2 1.253 %
Mole fraction of N2 75.348 %
Max. Temp. 627.30 K
Min. Temp. 616.56 K
Comments
The results obtained are close to the desired values. This configuration (Case 7) is
the best design for flame holding by sudden expansion.
3.1.1.4. FLAME STABILISATION BY PILOT FLAMES
3.1.1.4.1. CASE 8
The vitiator fuel is mixed with the air and the replenished O2 before the vitiator
inlet. A sketch of the vitiator is given in Figure 3-16.
Figure 3-16. Sketch of Case 8

71
Inputs for FLUENT Boundary Conditions are the same with Case 1 (Table 3-1).
Contours of static temperature and velocity magnitude obtained from FLUENT are
given in Figure 3-17 and Figure 3-18 respectively.
Results
• Temperature profile is not uniform at the outlet.
• Mole fraction of oxygen at the exit plane is close to ideal air conditions.
• Unburned fuel percent is high.
Figure 3-17. Contours of Static Temperature of Case 8.

72
Figure 3-18. Contours of Velocity Magnitude of Case 8.
Table 3-10. Flow Properties at the Outlet Plane (Case 8)
Absolute Pressure 650200.9 Pa
Static Temperature 602.22 K
Mole fraction of O2 20.140 %
Mole fraction of CH4 0.110 %
Mole fraction of H2O 3.388 %
Mole fraction of CO2 1.691 %
Mole fraction of N2 74.671 %
Max. Temp. 633.91
Min. Temp. 296.24

73
Comments
Unburned fuel percent is higher than desired value. Also, the air/fuel mixture
entering the combustion chamber from the center of the inlet leaves the combustion
chamber without entering a combustion process.
3.1.1.4.2. CASE 9
The vitiator fuel is mixed with the air and the replenished O2 before the vitiator
inlet. A sketch of the vitiator is given in Figure 3-19.
Figure 3-19. Sketch of Case 9
Inputs for FLUENT Boundary Conditions are the same with Case 1 (Table 3-1).
Contours of static temperature and velocity magnitude obtained from FLUENT are
given in Figure 3-20 and Figure 3-21 respectively.
Results
• Temperature profile is not uniform at the outlet.
• Mole fraction of oxygen at the exit plane is lower than the ideal air.
• Unburned fuel percent is high.

74
Figure 3-20. Contours of Static Temperature of Case 9.
Figure 3-21. Contours of Velocity Magnitude of Case 9.

75
Table 3-11. Flow Properties at the Outlet Plane (Case 9)
Absolute Pressure 650199.7 Pa
Static Temperature 596.93 K
Mole fraction of O2 19.953 %
Mole fraction of CH4 0.133 %
Mole fraction of H2O 3.540 %
Mole fraction of CO2 1.767 %
Mole fraction of N2 74.607 %
Max. Temp. 634.56
Min. Temp. 296.35
Comments
Oxygen mole fraction at the exit plane is lower than the desired values. Also, the
air/fuel mixture entering the combustion chamber from the center of the inlet
leaves the combustion chamber without entering a combustion process.
3.1.2. EVALUATION OF STUDIED CASES
Nine different designs have been presented in the previous section. Case 1 to Case
3 were based on flame stabilization by bluff bodies, Case 4 to case 7 were based on
flame stabilization by recirculation, and Case 8 and Case 9 were based on flame
stabilization by pilot flames.
The results of these designs are compared with the experimental results and
tabulated in Table 3-12.

76
Table 3-12. Outlet Plane Data Comparison
Experiment Case 1 Case2 Case3 Static Pressure 650200.0 Pa 650209.1 Pa 650121.6 Pa 650201.8 Pa Static Temp. (Tout) 606 K 613.07 K 609.44 K 741.05 K Mole fraction of O2 20.946 % 21.040 % 20.880 % 19.100 % Mole fraction of CH4 0.0 % 0.083 % 0.000 % 0.967 % Mole fraction of H2O 2.532 % 2.347 % 2.512 % 3.911 % Mole fraction of CO2 1.295 % 1.173 % 1.256 % 1.958 % Mole fraction of N2 74.339 % 75.356 % 75.350 % 74.064 % Max. Temp. - 633.45 K 614.68 K 2165.85 Min. Temp. - 582.71 606.86 310.67 Uniformity 95.04 % 99.14 % 0 % Experiment Case 4 Case 5 Case 6 Static Pressure 650200.0 Pa 650187.5 Pa 650199.7 Pa 650500.9 Pa Static Temp. (Tout) 606 K 692.78 K 610.07 K 634.19 K Mole fraction of O2 20.946 % 20.370 % 21.080 % 21.070 % Mole fraction of CH4 0.0 % 0.000 % 0.090 % 0.001 % Mole fraction of H2O 2.532 % 3.003 % 2.316 % 2.511 % Mole fraction of CO2 1.295 % 1.501 % 1.158 % 1.255 % Mole fraction of N2 74.339 % 75.125 % 75.356 % 75.161 % Max. Temp. - 943.46 640.02 611.78 Min. Temp. - 325.30 454.7 600.90 Uniformity 46.95 % 74.53 % 94.75 % Experiment Case 7 Case 8 Case 9 Static Pressure 650200.0 Pa 650258.6 Pa 650200.9 Pa 650199.7 Pa Static Temp. (Tout) 606 K 621.22 K 602.22 K 596.93 K Mole fraction of O2 20.946 % 20.890 % 20.140 % 19.953 % Mole fraction of CH4 0.0 % 0.004 % 0.110 % 0.133 % Mole fraction of H2O 2.532 % 2.505 % 3.388 % 3.540 % Mole fraction of CO2 1.295 % 1.253 % 1.691 % 1.767 % Mole fraction of N2 74.339 % 75.348 % 74.671 % 74.607 % Max. Temp. - 627.30 633.91 634.56 Min. Temp. - 616.56 296.24 296.35 Uniformity 95.83 % 49.19 % 49.64 %
Uniformity is defined as 100xT
TTempindeviationMax
out
out+
When compared to the experimental data, the best results are obtained at Case 2.
This case is modified for the flow requirements of this study and analyzed for
different flight conditions in the next section.

77
3.2. DETAILED ANALYSIS OF CASE 2
3.2.1. 2 D Analysis
Air mass flow rate requirement of the ramjet missile [2] is given in Figure 3-22.
Figure 3-22. Mass Flow Rate Requirement of the Test Facility
Five different points from the missile flight trajectory is selected for heater
performance analysis. These points are marked on Figure 3-22. Inlets off design
analysis for the selected points are given in Table 3-13 [2].
Table 3-13. Inlet-Off Design Performance Data
time Alt (m) 0M eM )(KTe )(PaPe )( skgmair&
0 5000 2.49 0.35 560.2 783400 8.66
20 9250.0 2.6 0.34 540.6 542860 5.38
50 15850.0 2.8 0.32 567.8 258810 2.13
100 16000.0 3.5 0.30 748.6 512080 2.56
200 16000.0 3.4 0.30 722.8 481560 2.50

78
The heater should be able to operate on the conditions stated in Table 3-13. Design
of the vitiator should be based on the cruse condition to get the most efficient
performance during the entire testing. Conditions at time =100 s is selected for
vitiator design.
PaP 512080= KT 6.748= skgmair 56.2=&
36mkg
ZRTP
air ==ρ 3.0=M smRTc 346== γ
smcMV 100== 2== mmV
mAair
4616ρ&
mmD 76=
To obtain a flow at Mach number 0.3, the area of heater inlet should be around
76mm. For analysis, diameter is taken as 80 mm to provide a better dimensioning.
Grid used in Case 2 is scaled by 0.8 to get the inlet diameter 80 mm.
Using the NASA CET93 FORTRAN code [20], the amount of fuel to heat the
incoming air up to the required inlet exit temperature is calculated. With an
additional subroutine, iterations on the air to fuel (CH4 methane) ratio are
performed, the appropriate mix ratio for each time step is obtained. Details for
mass flow rate of air and fuel, mass fractions of CH4 and O2 are given in Table
3-14.
Table 3-14. Mass Fractions Corresponding to Mass Flow Rates
)(stime )( skgmair& )( skgm fuel& )(2. skgm Orep& fuelX
2OX
0 8.66 0.049 0.273 0.55 % 25.41 %
20 5.38 0.027 0.155 0.50 % 25.24 %
50 2.13 0.012 0.069 0.56 % 25.48 %
100 2.56 0.026 0.147 0.96 % 27.10 %
200 2.50 0.024 0.134 0.91 % 26.87 %

79
Analyses using the data in Table 3-14 are performed and the results obtained are
tabulated in
Table 3-15.
Table 3-15. Results of the Air Heater Off-Design Analysis
)(stime )(KTe )(requiredTe 2OY
0 511.07 560.2 20.90 %
20 495.89 540.6 20.93 %
50 543.04 567.8 20.91 %
100 728.25 748.6 20.92 %
192 708.46 722.8 20.90 %
Results of the initial analysis are not satisfying because the pressure differences
between the required and obtained values are quite high for high mass flow rates.
The reason for this is that, the heater is designed for mass flow rate value of 2.77
kg/s whereas at time=0, air mass flow rate is 8.66 kg/s. So an iterative analysis is
performed to get the required temperatures. Several runs are performed with
different mass fractions of CH4 and O2. Final mass fractions obtained after these
iterations are given in Table 3-16 and the results are tabulated in Table 3-17.
Table 3-16. Final Mass Flow Rate and Mass Fraction Data
)(stime airm& fuelm& 2.Orepm& totalm& fuelX
2OX
0 8.384 0.056 0.228 8.66 0.65 % 25.83 %
20 5.217 0.032 0.131 5.38 0.60 % 25.63 %
50 2.069 0.013 0.055 2.13 0.63 % 25.78 %
100 2.432 0.026 0.105 2.56 1.01 % 27.29 %
192 2.383 0.023 0.094 2.50 0.93 % 26.97 %

80
Table 3-17. Results of the Air Heater Off-Design Analysis
)(stime )(KTe )(requiredTe 2OY
0 557.01 560.2 20.94 %
20 543.04 540.6 20.91 %
50 567.87 567.8 20.94 %
100 747.64 748.6 20.95 %
192 721.03 722.8 20.90 %
Results obtained after iterations are quite satisfying. This configuration is good
enough for this study. Final configuration of the air heater is given in Figure 3-23
(dimensions are in mm).
Figure 3-23. Final Configuration of the Air Heater
3.2.2. 3D Analysis
3.2.2.1. Case 1
The flame holding mechanism used in 2D analysis is transformed into 3D. The best
solution is to use cylindrical bars and torus, which will exactly match the
axisymmetric solution of 2D analysis. A sketch of the flame holder is given in
Figure 3-24. Premixed air and fuel entering the combustor is studied in the first
case. Combustor configurations are shown in Figure 3-25 and Figure 3-26.
Symmetry boundary condition is specified on the side walls so, ¼ of the total
combustion chamber is studied. Analyses are performed for the properties at

81
time=100 seconds (cruise condition of the ramjet missile). Mass flow rates given in
Table 3-16 are used. Inputs to the code are given in Table 3-18.
Figure 3-24. Flame Holding Mechanism
Figure 3-25. Quarter of the Air Heater Combustion Chamber

82
Figure 3-26. Sketch of Combustion Chamber of Case 1
Contours of static temperature obtained from FLUENT are given in Figure 3-27
and Figure 3-28.
Table 3-18. Case 1 Inputs for FLUENT Boundary Conditions
Inlet O2 CH4
airm& ( )skg 2.56 0.59
2Om& ( )skg 0.147 0.147
vfm& ( )skg 0.026 0.026
totalm& ( )skg 2.733 0.738 0.026
Mass fraction 27% 0.951%
Results
• Since the flow speed is higher than the flame speed, combustion starts after
the bluff body where the circulation occurs.
• Almost uniform temperature profile is obtained at the outlet. Temperature
calculated by fluent (747.36 K) at the outlet plane is close to the expected
value (748.6 K).

83
• Mole fraction of oxygen at the exit plane is very close to the ideal air
conditions.
• There is no unburned fuel.
Figure 3-27. Contours of Static Temperature of Case 1
Figure 3-28. Contours of Static Temperature of Case 1 (Isometric View)

84
Table 3-19. Flow Properties at the Outlet Plane
Absolute Pressure 510688.2 Pa
Static Temperature 747.36 K
Mole fraction of O2 20.970 %
Mole fraction of CH4 0.000 %
Mole fraction of H2O 3.413 %
Mole fraction of CO2 1.706 %
Mole fraction of N2 73.910 %
Max. Temp. 747.58
Min. Temp. 747.16
Comments
The results obtained are satisfactory. In the following cases, fuel injection is
considered instead of premixed flow.
3.2.2.2. Case 2
Figure 3-29. Sketch of Combustion Chamber of Case 2

85
Sketch of the combustor geometry studied in this case is given in Figure 3-29.
Eight fuel pipes are placed before the flame holder. Quarter of the combustor is
modeled to decrease computation time. Inputs for the FLUENT code are as given
in Table 3-20.
Table 3-20. Case 2 Inputs for FLUENT Boundary Conditions
Inlet O2 CH4
airm& ( )skg 2.56 0.59
2Om& ( )skg 0.147 0.147
vfm& ( )skg 0.026
totalm& ( )skg 2.707 0.738 0.026
Mass fraction 27.26 % 100 %
Figure 3-30. Contours of Static Temperature of Case 2
Fuel path lines are shown on the temperature contours on Figure 3-30. Fuel does
not mix with the incoming air before the flame holder. At the points where fuel

86
paths intersect the flame holder, fuel to air ratio is close to 1 so at those locations,
temperature reach up to 1050 K. Average temperature at the exit is 776 K whereas
the required temperature is 747 K. Temperature at the exit is not uniform.
To improve the mixing, another fuel injector configuration is studied.
3.2.2.3. Case 3
In this case, four nozzle are placed at the end of the fuel lines studied in Case 2.
The temperature contours obtained is given in Figure 3-32.
A similar temperature profile is obtained as Case 2. Average temperature at the exit
is 774 K whereas the required temperature is 747 K. Temperature at the exit is not
uniform. Another fuel injector configuration is studied in case 4.
Figure 3-31. Sketch of Combustion Chamber of Case 3

87
Figure 3-32. Contours of Static Temperature of Case 3
3.2.2.4. Case 4
Combustion chamber studied in this case is given in Figure 3-33. Fuel injector
configuration is given in Figure 3-34. Also another flame holder configuration is
studied as seen in Figure 3-33.
Figure 3-33. Sketch of combustion chamber of Case 4

88
Figure 3-34. Fuel Injector Studied in Case 4
As in Case 2 and Case 3, fuel does not mix with the flow before flame holder. The
maximum local temperature in the combustion chamber reaches up to 1320 K. But
because of the new orientation of the flame holder, a uniform temperature profile is
obtained at the outlet plane. Average temperature at the exit is 756.54 K which is
close to the required temperature (747 K).
Best results are obtained in Case 4. This fuel injector and flame holder
configuration is selected for the test facility vitiator. Sketch of the combustion
chamber is given in Figure 3-37 and the sketch of the fuel injector is given in
Figure 3-38.

89
Figure 3-35. Contours of Static Temperature of Case 4
Figure 3-36. Contours of Static Temperature and Fuel Path Lines of Case 4

90
Figure 3-37. Final Configuration of the Vitiator
Figure 3-38. Fuel Injector Configuration

91
CHAPTER 4
4. TEST STAND DESIGN
TEST STAND DESIGN
Thrust stand is the part on which the ramjet combustors are tested. This part can be
stated as the hearth of the facility because after the installation of the facility, all
the test activities will take on that part.
Its purpose is to allow the measurements of thrust and must be efficiently
integrated in the whole facility. This stand must allow the missile and piping
displacement generated by the thrust.
The ramjet engine will be fixed on the sliding part. This part is designed in order to
slide with the less friction as possible. In that way, the more precise will be the
thrust measurement by the load cell.
The design of the test stand and the piping connection are linked in so far as the
vitiator positioning is essential and must be as closer as possible to the missile
inlets.
4.1. TEST STAND DESIGN
4.1.1. REQUIREMENTS
• The missile should slide freely with minimum friction along its main axis:
One of the parameters to be tested in the facility is nozzle thrust. Load cells
will be employed to measure the thrust. In order to get accurate values, a
design with minimum friction should be achieved.

92
• The effect of piping should be minimized: Since the air is supplied to the
engine to simulate ramjet inlets, a piping system is mandatory. In order to
measure thrust, flexible pipes have to be used. These pipes have to be
selected and oriented in such a way that, their contribution to the nozzle is
minimal.
• Air heated at the vitiator should be delivered to the combustor with
minimum cooling: If the vitiator is placed far from the ramjet combustion
chamber, the heated air will cool down. Also air at high temperatures may
have negative effects on flexible hoses, so it would be a good solution to
place the vitiator after the flexible hoses, as close to the ramjet engine as
possible.
4.1.2. COMPONENTS OF THE THRUST STAND
4.1.2.1. STAND SLIDING MECHANISM
An optimum solution is investigated to achieve a sliding mechanism with minimum
friction possible. Three alternatives are considered:
4.1.2.1.1. Wheel Rolling on Rails
The first alternative that is considered is to use a wheel which will slide on a rail.
The wheel should be designed to fit the rail as seen in Figure 4-1.
This alternative will be a good solution in terms of friction reduction but on the
other hand, the wheel can go off the rails in case of a thrust misalignment, which is
possible during development testing. To overcome this problem, a second wheel
can be used as shown in Figure 4-2, but this solution complicates the thrust stand
design.
4.1.2.1.2. Antifriction Bearings Rolling on Rails
To use antifriction bearing instead of wheels is another possibility. Antifriction
bearings are efficient against friction but on the other hand, they are not reliable.

93
Again, to overcome a thrust misalignment, a set of antifriction bearing as shown in
Figure 4-2 has to be used.
Figure 4-1. Wheel Configuration Figure 4-2. Double Wheel Configuration
4.1.2.1.3. Stand Sliding on Cylindrical Rods
An other alternative is to use a stand sliding on cylindrical rods as shown in Figure
4-3. Comparing the wheel and antifriction bearings, this alternative is poor in terms
of friction reduction, but on the other hand it is simple and can resist to misaligned
thrust. Friction is reduced by applying grease on the cylindrical rod and the sliding
pad.
Figure 4-3. Cylindrical Rod and Sliding Pad Configuration

94
4.1.2.2. SLIDING TABLE
This is the table placed on the sliding pad. It carries the ramjet engine to be tested,
v blocks, and the other equipments.
4.1.2.3. V BLOCKS
V blocks are the parts that fix the ramjet engine and the gas generator to the sliding
table. V blocks have two parts. The lower part is fixed to the sliding table by bolts.
Lower part contains 4 vertical threaded bars. The upper part has four holes which
match to the bars of the lower part. Ramjet engine is placed on the lower part, then
the upper part is put on the engine and the nuts are fastened as shown in Figure 4-4.
Figure 4-4. V-Blocks Configuration
The advantage of selecting v-blocks is that, it can fix the engines with different
diameters. So, these blocks can be used for several different engines.
4.1.2.4. VITIATOR TABLE
After the heated air leaves the vitiator, it flows through pipes to the ramjet engine.
Even if the pipes are well insulated, there will be a temperature loss during this
process. To overcome this, vitiator has to be placed close to the ramjet engine.
Additionally, flexible hoses generally can not stand the temperatures that are
generated by the air heater. The best place for the vitiator appears to be on the
V-Block
Ramjet Engine

95
thrust stand. This position will also provide the quickest response for the
temperature variation during a flight-envelope temperature simulation. Vitiator
table is the part that fix the vitiator to the sliding table, as shown in Figure 4-5.
Figure 4-5. Vitiator Table Figure 4-6. Piping Systems
4.1.2.5. PIPES
Pipe configuration is used to duct the air heated in the vitiator. The orientation of
the pipes should be designed to supply the air to the ramjet engine at correct Mach
number. While testing different engines, the pipe configuration should be partially
or completely changed to achieve the desired air properties at the ramjet entrance.
A typical pipe configuration is given in Figure 4-6. Details of piping are given in
section 4.2.
4.1.2.6. FLEXIBLE PIPES
Conventional rocket motor propellant grains contains the oxygen needed for
combustion, so during static testing, the only connection of the rocket motor is the
connection with the sliding table. There is no ducting to the engine. Whereas in air
breathing engines, air has to be supplied to the combustion chamber. This
requirement brings the need for piping system. With rigid pipes connected to the
ramjet engine, thrust can not be measured. So flexible pipes has to be used.
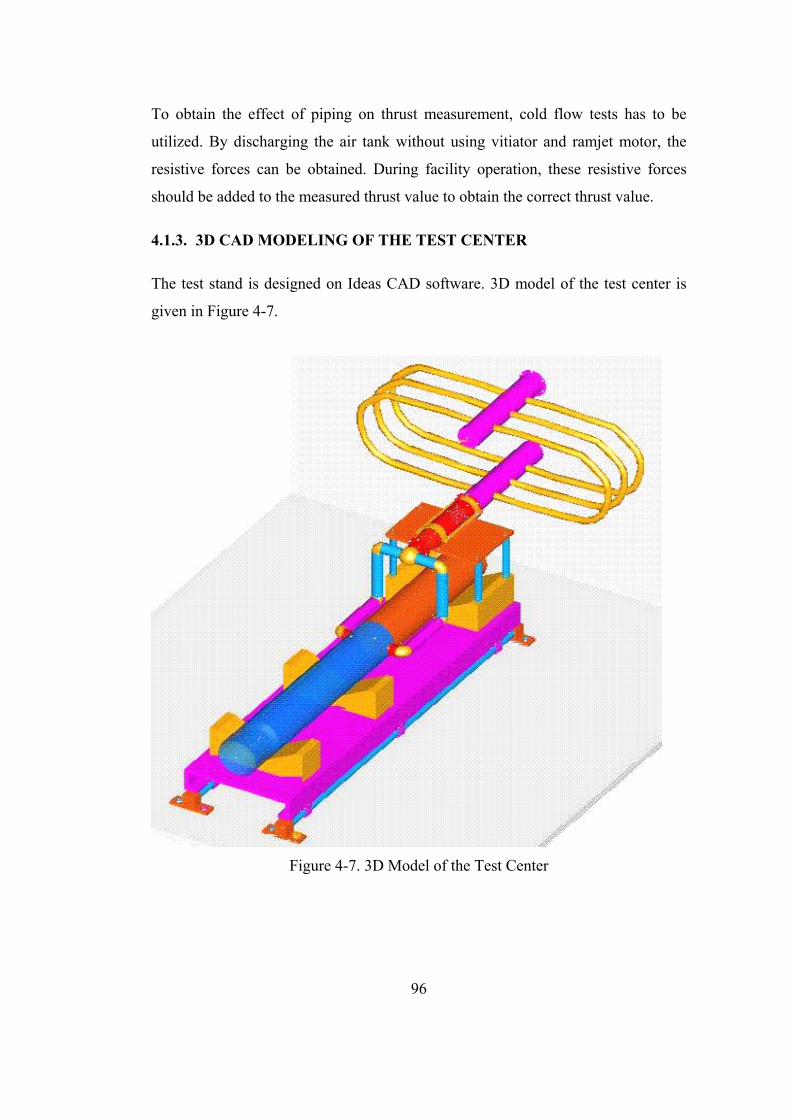
96
To obtain the effect of piping on thrust measurement, cold flow tests has to be
utilized. By discharging the air tank without using vitiator and ramjet motor, the
resistive forces can be obtained. During facility operation, these resistive forces
should be added to the measured thrust value to obtain the correct thrust value.
4.1.3. 3D CAD MODELING OF THE TEST CENTER
The test stand is designed on Ideas CAD software. 3D model of the test center is
given in Figure 4-7.
Figure 4-7. 3D Model of the Test Center

97
4.2. PIPING SYSTEM DESIGN
4.2.1. HEAD LOSS IN A PIPE
The pressure change ( P∆ ) along a pipe in turbulent flow depend on the following
quantities:
• 1. D, Pipe diameter
• 2. L, Length of pipe over which the pressure is to be determined
• 3. µ , coefficient of viscosity
• 4. V, mean time averaged velocity over the cross section (equivalent to
)/ Aq
• 5. ρ , density
• 6. e, the average variation in pipe radius (a measure of pipe roughness)
Average roughnesses of some commercial pipes are given in Table 4-1 [21] .
Table 4-1. Average Roughness of Commercial Pipes
e Material
ft mm
Glass 0.000001 0.0003
Drawn tubing 0.000005 0.0015
Steel 0.00015 0.046
Asphalted cast iron 0.0004 0.12
Galvanized iron 0.0005 0.15
Cast iron 0.00085 0.26
Wood stave 0.0006-0.003 0.18-0.9
Concrete 0.001-0.01 0.3-3.0
Riveted steel 0.003-0.03 0.9-9.0

98
There are different semi empirical correlation formulas to evaluate friction factor, f.
One recent formula valid for certain large ranges of e/D and Reynolds number is:
( ) ( )[ ]29.074.57.3ln
25.0
eyRDef
+= (eqn. 1) [21]
This formula is valid for the ranges: 83 10105 ≤≤ eyRx
26 1010 −− ≤
≤
De (eqn. 2) [21]
4.2.2. MINOR LOSSES IN PIPE SYSTEMS
The head loss of devices such as pipe bends, valves etc., has to be considered. This
must always be done using experimental results. Head loss is given as:
2
2VKhl = (eqn. 3)
where the coefficient K is given for commercial fittings. No difference is made
between laminar and turbulent flow.
In Table 4-2, K factors for a number of important fittings for pipes having certain
nominal diameters are listed [21]. Nominal diameter does not correspond exactly to
the inside diameter of the pipe. In Table 4-3, nominal diameters of some standard
pipes are listed with their inside diameters [21].

99
Table 4-2. K Factors for Fittings
Nominal diameter, in
21
43 1
211 2 3 4 5 6 8
Gate valve (open)
0.22 0.20 0.18 0.16 0.15 0.14 0.14 0.13 0.12 0.11
Globe valve (open)
9.20 8.50 7.80 7.10 6.50 6.10 5.80 5.40 5.10 4.80
Standartd elbow (screwed) 90º
0.80 0.75 0.69 0.63 0.57 0.54 0.51 0.48 0.45 0.42
Standartd elbow (screwed) 45º
0.43 0.40 0.37 0.34 0.30 0.29 0.27 0.26 0.24 0.22
Standartd tee (flow through)
0.54 0.50 0.46 0.42 0.38 0.36 0.34 0.32 0.30 0.28
Standartd tee (flow branched)
1.62 1.50 1.38 1.26 1.14 1.08 1.02 0.96 0.90 0.84
Table 4-3. Nominal Pipe Sizes for Standard Pipes Nominal pipe Diameter, in
Inside diameter, in
Nominal pipe Diameter, in
Inside diameter, in
21 0.364 3 3.068
43 0.824 4 4.026 1 1.049 5 5.047
211 1.610 6 6.065 2 2.067 8 7.981
4.2.3. PRESSURE DROP AT AN ELBOW
Sketch of an elbow is given in Figure 4-8.
Assumptions:
• Flow is incompressible in the elbow
• 21 yy =
• 21 AA =
Bernaully equation between 1 & 2:
lhgyPVgyPV+
++=
++ 2
22
21
12
1
22 ρρ (eqn. 4)

100
Continuity Equation:
222111 AVAV ρρ = ⇒ 21 VV = (eqn. 5)
Combining equations :
2
221 VKPP+=
ρρ
2
2VKP ρ=∆
Figure 4-8. Sketch of an Elbow
4.2.4. PRESSURE DROP IN A PIPE
One-dimensional flow with friction calculations are performed by using sonic flow
reference calculations, where flow properties are denoted by *. Sketch of a pipe is
given in Figure 4-9.
Figure 4-9. Sketch of a Pipe

101
( ) 2* 121
MTT
−++
=γγ (eqn.6.)
( )
21
2* 1211
−−+
=MMP
Pγγ (eqn.7.)
( ) 212
* 1121
+−+
=γγ
ρρ M
M (eqn. 8)
( )( )
−+
+++
−= 2
2
2
*
121ln
2114
MM
MM
DfL
γγγ
γ (eqn. 9)
Given the flow properties at station 1 and the length of the pipe, station 2 properties
can be calculated as follows:
1. Calculate f from (eqn.1)
2. Calculate DfL*4 from (eqn. 9)
3. Calculate *2L from LLL −= *
1*
2
4. Calculate 2M from (eqn. 9)
5. Calculate 2T from 11
*
*2
2 TTT
TTT = using (eqn.6)
6. Calculate 2P from 11
*
*2
2 PPP
PPP = using (eqn.7)
7. Calculate 2ρ from 11
*
*2
2 ρρρ
ρρρ = using (eqn.8)
Sample calculations for the piping system are given APPENDIX E. Piping
configuration after the vitiator is given in Figure 4-10. Piping configuration before
the vitiator is given in Figure 4-11.

102
Figure 4-10. Piping Configuration Following the Vitiator

103
Figure 4-11. Piping Configuration Before the Vitiator

104
4.2.5. MODELLING OF PIPING SYSTEM BY FLUENT
3D model of the piping system with the vitiator is generated. Inputs for FLUENT
are based on the sample calculations given in APPENDIX E. Inlet and outlet
pressures to the piping system are input to the code and the pressure values are
calculated. The temperature profile of the piping system obtained by FLUENT is
given in Figure 4-12. The average temperature at the outlet (combustor inlet) is
calculated as 762.45 K which is close to the required temperature (747 K). From
the calculation in APPENDIX E, a 7.5 K temperature drop is obtained in the
piping. Temperature at the combustor exit is 770.72 which gives a temperature
drop of 8.27 K. FLUENT Model agree with the calculations given in APPENDIX
E.
Figure 4-12. Temperature Contours on the Fluent Model of the Piping System

105
4.3. RAMJET COMBUSTOR DESIGN
In this section flame holding mechanism for ramjet combustion chamber is studied.
Ramjet combustion chamber analysis is based on the test data supplied by [6]. Data
supplied by [6] is as follows:
Geometric Data of Ramjet Motor: 2
2 010325.0 mA = (Combustor air inlet area)
24 022698.0 mA = (Combustion chamber cross section area)
25 013668.0 mA = (Nozzle throat area)
Measured Test Data:
skgmair 692.6=& (Air mass flow rate)
skgm fuel 311.0=& (Fuel (kerosene) mass flow rate)
NFLC 8400= (Load cell thrust)
4.3.1. Case 1
In this case, a combustion chamber similar to Case 2 presented in 3.1.1.2.2 is
selected. The sketch of the combustion chamber is given in Figure 4-13. Contours
of static temperatures obtained are given in Figure 4-14 and contours of Mach
Number are given in Figure 4-15.

106
Figure 4-13. Sketch of Case 1
One dimensional thrust equation is [22]:
( ) 6666 APPumT a−+= &
where 6 denotes the nozzle exit plane properties and Pa is the ambient pressure.
PaP 7.189906 =
smV 0.11876 =
skgm 0.76 =&
The thrust is calculated as : NT 48.8713=
Table 4-4. Comparison of FLUENT Results with Experimental Results
Experiment FLUENT
4P 568800 Pa 580863.9 Pa
4M 0.35 0.40
Thrust 8400 N 8713.48 N

107
Figure 4-14. Contours of Static Temperature of Case 1.

108
Figure 4-15. Contours of Mach Number of Case 1.
Results
• Since the flow speed is higher than the flame speed, combustion starts after
the bluff body where the circulation occurs.
• Pressure at the aft section of the combustion chamber is slightly higher than
the measured value.
• Mach number at the aft section of the combustion chamber is slightly
higher than the value stated in [6].
• Thrust calculated is higher than the measured value.
Comments
The results obtained are close to the measured value. The difference in the pressure
and the Mach number seems to be caused by the flame holder mechanism. The
flow is forced to flow through a narrow area which helps the flow to accelerate.

109
Higher pressure and Mach number effected the thrust calculation which is
calculated higher than the measured value. To overcome this problem, an
alternative flame holder mechanism is studied.
4.3.2. Case 2
In this case, an alternative flame holder is mounted on the same combustion
chamber presented in 4.3.1. A better nozzle contour is utilized in this case. The
sketch of the combustion chamber is given in Figure 4-16.
contours of Mach Number are given in Figure 4-17 and contours of static
temperatures obtained are given in Figure 4-18.
Figure 4-16. Sketch of Case 2
fuel
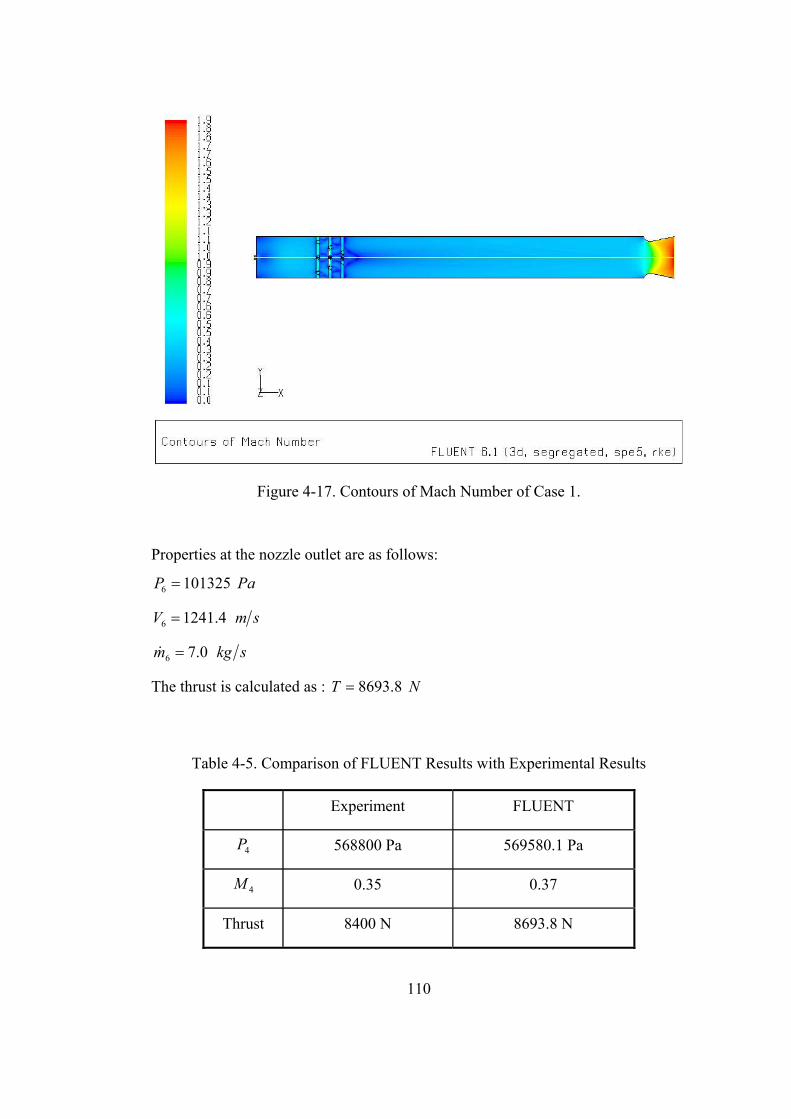
110
Figure 4-17. Contours of Mach Number of Case 1.
Properties at the nozzle outlet are as follows:
PaP 1013256 =
smV 4.12416 =
skgm 0.76 =&
The thrust is calculated as : NT 8.8693=
Table 4-5. Comparison of FLUENT Results with Experimental Results
Experiment FLUENT
4P 568800 Pa 569580.1 Pa
4M 0.35 0.37
Thrust 8400 N 8693.8 N

111
Figure 4-18. Contours of Static Temperature of Case 2.

112
Results
• Pressure at the aft section of the combustion chamber is close to the
measured value.
• Mach number at the aft section of the combustion chamber is close to the
value stated in [6].
• Thrust calculated is higher the measured value.
Comments
The results obtained are better than the ones obtained in case 1. Pressure and the
Mach number values are now close to the expected values. Thrust is again higher
than the measured one. The reason is that, the new nozzle utilized in this case
offered a better expansion.
113
CHAPTER 5
5. CONCLUSION AND DISCUSSION
CONCLUSION AND DISCUSSION
5.1. SUMMARY OF THE WORK
In this work, design calculations of a sample connected pipe ramjet test facility are
completed. Three main systems of the facility are detailed; air storage system, air
heater system and the test stand.
In the air storage system design part (Chapter 2), designs of pressure vessel and
flow regulation systems are detailed. Design of air tank is based on ASME Codes.
The volume of the air storage system is 27.8 m3 and the design pressure is 50 bar.
The stored air allows test duration of 200 seconds at an average mass flow rate of 3
kg/s.
Aerodynamic heating of the air in the missile inlet is simulated by the air heater
system. Combustion analysis of the air heater is performed by Fluent CFD Code.
First, combustion model of Fluent Code is validated by an experimental study.
Then in the air heater system design part (Chapter 3), several different vitiator
configurations are studied. Two dimensional combustion chambers are modeled by
Fluent. The most efficient flame holding configuration is selected. Then three
dimensional model of this configuration is modeled and optimized. A final
combustor configuration is obtained. Designed air heater system is capable of
supplying air at temperature range 400-1000 K and mass flow rate 1.5-8 kg/s at
Mach numbers between 0.1-0.5 and pressure between 2-8 bar.

114
Design of thrust stand, piping system and the ramjet combustor is examined in test
stand design section (Chapter 4). Three dimensional CAD model of the test center
is generated. Pressure and temperature losses in the pipe line are calculated in the
piping system design part. In the ramjet combustor design part, ramjet combustion
chamber is modeled by Fluent and the results are compared by an experimental
study.
Four Fortran codes are generated; discharge code, pipe code, valve code and
combustion code. Discharge code calculates the pressure and temperature variation
of the air tank during discharge. Mass flow rate – time data is input to the code. In
the pipe code, pressure and temperature losses in the pipe line is calculated and the
required properties in the vitiator and valve outlet are calculated. Valve code read
the pressure and temperature data from the discharge and pipe outputs and
calculates the valve coefficients. Finally combustion code calculates the mass flow
rate value to obtain the required temperature and the oxygen mass flow rate to
replenish the lost oxygen during vitiator combustion.
5.2. SUGGESTIONS FOR FUTURE WORK
For future development of the present design, the following topics can be proposed:
• If temperature requirement for the missile combustor is above 1500K, an
insulation or cooling system should be designed for the vitiator and the
piping system.
• Ramjet combustor model and valve models may be added to the FLUENT
piping system solution presented in section 4.2.5.
• Test duration is limited by the temperature drop of the air tank. Higher test
durations can be achieved by heating the air tanks. On the other hand, the
heater has to respond quickly to the rapid temperature drop, so it may not be
economical. A water recirculation system between the air tanks and vitiator
can help heating the tanks while cooling the vitiator.
• A detailed study on flex hose configuration may be necessary to minimize
their negative effect on the thrust measurement.
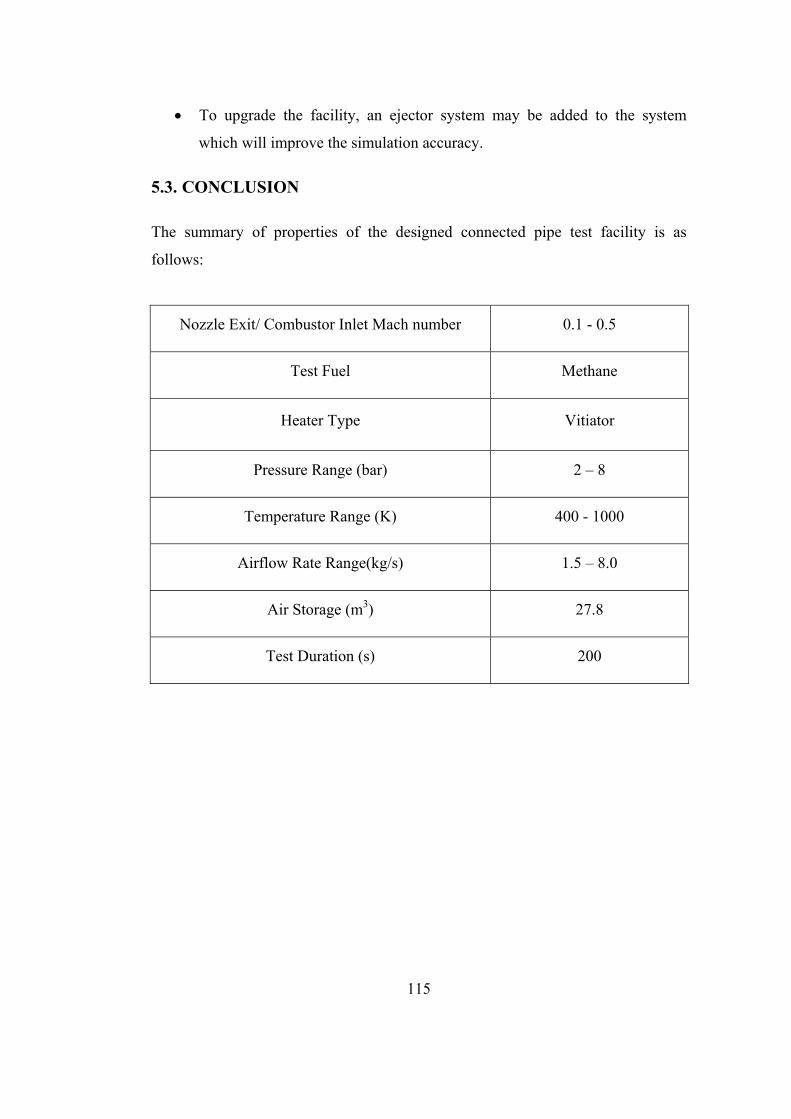
115
• To upgrade the facility, an ejector system may be added to the system
which will improve the simulation accuracy.
5.3. CONCLUSION
The summary of properties of the designed connected pipe test facility is as
follows:
Nozzle Exit/ Combustor Inlet Mach number 0.1 - 0.5
Test Fuel Methane
Heater Type Vitiator
Pressure Range (bar) 2 – 8
Temperature Range (K) 400 - 1000
Airflow Rate Range(kg/s) 1.5 – 8.0
Air Storage (m3) 27.8
Test Duration (s) 200

116
REFERENCES
[1] DUNSWORTH L.C., REED G.J., “Ramjet Engine Testing and Simulation
Techniques”, J. Spacecraft, Vol.16, No.6, 1978
[2] Bruno CORITON, "Design of a liquid fuel ramjet and a ducted rocket
engine", Internship ENSMA-ROKETSAN, 2002.
[3] Nurhan AYAZ-"Conceptual Design Of An Integral Rocket-Ramjet Air-
Launched Missile", METU Aerospace Dept Master Thesis, 2000.
[4] DAVENAS A., "Solid Rocket Propulsion Technology" Pergamon Press,
1993.
[5] Leisch,S. and Netzer, D.W., “Solid Fuel Ramjets”, Tactical Missile
Propulsion, AIAA Progress Series, Vol 170, 1996, Chapter 13, pp. 469-493.
[6] AGARD-AR-323-"Experimental and analytical methods for the
determination of connected-pipe ramjet and ducted rocket internal
performance", NATO 1994.
[7] ARNOLD ENGINEERING DEVELOPMENT CENTER,
“http://www.arnold.af.mil”, last accessed on 8 April 2005
[8] NASA LANGLEY RESEARCH CENTER, “http://www.larc.nasa.gov”,
last accessed on 8 April 2005
[9] MITSUBISHI HEAVY INDUSTRIES, LTD.
“http://www.sdia.or.jp/mhikobe-/products/etc/siken/high/jet/jisseki1.html”,
last accessed on 8 April 2005
[10] INSTITUTE OF SPACE TECHNOLOGY AND AERONAUTICS,
“http://www.nal.go.jp”, last accessed on 8 April 2005
[11] ATLANTIC RESEARCH CORPORATION,
“http://www.atlantic-research.com” , last accessed on 8 April 2005

117
[12] THE FRENCH AERONAUTICS AND SPACE RESEARCH CENTER
“http://www.onera.fr”, last accessed on 8 April 2005
[13] GRUBER M., DONBAR J., JACKSON K., “Newly Developed Direct-
Connect High-Entalpy Supersonic Combustion Research Facility”, Journal
of Propulsion and Power, Vol. 7, No.6, 2001
[14] KANURY M., ”Introduction to Combustion Phenomena”, Gordon and
Breach Science Publishers, 1977.
[15] MELLOR A., “Design of Modern Turbine Combustors”, Academic Press
Limited, 1990
[16] SPALDING B., “Combustion and Mass Transfer”, Pergamon Press, 1979
[17] ESAPYRONICS “http://www.esacombustion.it/esauk/manuals.asp”, last
accessed on 8 April 2005
[18] AIR LIQUIDE GROUP : INDUSTRIAL GAS AND MEDICAL GAS
DISTRIBUTION “http://www.airliquide.com/en/business/products/gases/
gasdata/”, last accessed on 8 April 2005
[19] FISHER.-ROSEMOUNT, “Control Valve Handbook”, Fisher Controls
International Inc., 1998
[20] GORDON S.-MCBRIDE B., ”NASA SP-273 Computer Program For
Calculation Of Complex Equilibrium Compositions, Rocket Performance,
Incident And Reflected Shocks,And Chapman-Jouguet Detonations”, NASA
1976
[21] SHAMES I., “Mechanics of Fluids”, McGraw Hill, 1982
[22] OATES G., “Aerothermodynamics of Gas Turbine and Rocket Propulsion,
Revised and Enlarged”, AIAA Education Series, 1988
[23] POPE E., “Rule of Thumb For Mechanical Engineers”, Gulf Publishing,
1996
[24] SHIGLEY J., “Mechanical Engineering Design”, McGraw Hill, 1986
[25] MEGYESY E., “Pressure Vessel Handbook”, Pressure Vessel Publishing
Inc., 1998
[26] CARSON B., CHUSE R., “The ASME Code Simplified Pressure Vessels”,
McGraw Hill, 1993

118
[27] Magnussen B. F., Hjertage B. H., “On mathematical models of turbulent
combustion with special emphasis on soot formation and combustion” 16th
Symp. (Int'l.) on Combustion. The Combustion Institute, 1976.
[28] Magnussen B. F., “On the Structure of Turbulence and a Generalized Eddy
Dissipation Concept for Chemical Reaction in Turbulent Flow”,
Nineteeth AIAA Meeting, St. Louis, 1981.
[29] S. M. CANNON, B. S. BREWSTER, and L. D. SMOOT, “PDF Modeling
of Lean Premixed Combustion Using In Situ Tabulated Chemistry”,
Combustion And Flame 119:233–252 (1999)

119
APPENDIX A A. APPENDIX A : AIR TANK DESIGN
APPENDIX A : AIR TANK DESIGN
AIR TANK DESIGN
A.1. STRESS ANALYSIS
Stress analysis is the determination of the relationship between the forces applied
to a vessel and the corresponding stress. The aim is to analyze vessels and their
component parts to arrive at an economical and safe design. The stresses are
analyzed to determine the thickness of material and sizes of members. It is not
necessary to find every stress but rather to know the governing stresses and how
they relate to the vessel or its respective parts, attachments, and supports. The
starting place for stress analysis is to determine all the design conditions for a given
problem and then determine all the related external forces. Then the forces should
be related to the vessel parts which must resist the corresponding stresses. [23]
A.2. MEMBRANE STRESS ANALYSIS
Pressure vessels commonly have the form of spheres, cylinders, cones, ellipsoids or
composites of these. The types of heads closing the vessel, effects of supports,
variation in thickness and cross section, nozzles, external attachments, and overall
bending due to weight, wind, and seismic all cause varying stress distributions in
the vessel. [24]
In any pressure vessel subjected to internal or external pressure, stresses are set up
in the shell wall. The state of stress is triaxial and the three principal stresses are:
σx = Longitudinal stress
σφ = Circumferential stress
σr = radial stress

120
The radial stress is a direct stress, which is a result of the pressure acting directly
on the wall, and causes a compressive stress equal to the pressure. In thin-walled
vessels this stress is so small compared to the other “principal” stresses that it is
generally ignored. Thus we assume for purposes of analysis that the state of stress
is biaxial. This greatly simplifies the method of combining stresses in comparison
to triaxial stress states. For thick-walled vessels (Rm/t < 10), the radial stress
cannot be ignored and formulas are quite different from those used in finding
“membrane stresses” in thin shells.
“Membrane stress analysis” is not completely accurate but allows certain
simplifying assumptions to be made while maintaining a fair degree of accuracy.
The main simplifying assumptions are that the stress is biaxial and that the stresses
are uniform across the shell wall. For thin-walled vessels these assumptions have
proven themselves to be reliable.
A.2.1. FAILURES IN PRESSURE VESSELS
Vessel failures can be grouped into four major categories [23]:
1. Material; Improper selection of material; defects in material.
2. Design; Incorrect design data; inaccurate or incorrect design methods;
inadequate shop testing.
3. Fabrication; Poor quality controls; improper or insufficient fabrication
procedures including welding; heat treatment or forming methods.
4. Service; Change of service condition by the user; inexperienced operations or
maintenance personnel.
A.2.2. LOADINGS
Loadings or forces are the “causes” of stresses in pressure vessels. The stresses
from the various loadings to arrive at the worst possible combination of stresses
should be obtained. Then the results to an acceptable stress level have to be
compared to obtain an economical and safe design.
121
The stresses due to pressure are the primary membrane stresses. These stresses
would cause the bursting or collapse of the vessel if allowed to reach an
unacceptably high level.
For steady loads, the vessel must support these loads more or less continuously
during its useful life. As a result, the stresses produced from these loads must be
maintained to an acceptable level.
For nonsteady loads, the vessel may experience some or all of these loadings at
various times but not all at once and not more or less continuously. Therefore a
temporarily higher stress is acceptable.
For general loads that apply more or less uniformly across an entire section, the
corresponding stresses must be lower, since the entire vessel must support that
loading. Loadings can be outlined as follows:
A. Categories of loadings
1. General loads-Applied more or less continuously across a vessel
section.
a. Pressure loads-Internal or external pressure (design, operating,
hydrotest, and hydrostatic head of liquid).
b. Moment loads-Due to wind, seismic, erection, transportation.
c. Compressive tensile loads-Due to dead weight, installed equipment,
ladders, platforms, piping, and vessel contents.
d. Thermal loads-Hot box design of skirt-head attachment.
2. Local loads-Due to reactions from supports, internals, attached piping,
attached equipment, i.e., platforms, mixers, etc.
a. Radial load-Inward or outward.
b. Shear load-Longitudinal or circumferential.

122
c. Torsional load.
d. Tangential load.
e. Moment load-Longitudinal or circumferential.
f. Thermal loads.
B. Types of loadings
1. Steady loads-Long-term duration, continuous.
a. Internal/external pressure.
b. Dead weight.
c. Loadings due to attached piping and equipment.
d. Thermal loads.
e. Wind loads.
2. Nonsteady loads-Short-term duration; variable.
a. Shop and field hydrotests.
b. Earthquake.
c. Erection.
d. Transportation.
e. Upset, emergency.
f. Thermal loads.
g. Start up, shut down.
A.2.3. PRESSURE VESSEL FORMULAS
Pressure vessel formulas are given in [25]
Notation:
=P internal pressure, psi
=oi DD , inside / outside diameter, in.
=S allowable or calculated stress, psi
=E joint efficiency
=0, RRi inside / outside radius, in.
=MK , coefficients
=xσ longitudinal stress, psi
=φσ circumferential stress, psi
=t thickness or thickness required
of shell, head, or cone, in.

123
A.2.3.1. CYLINDRICAL SHELL
Below equations are valid for SEP 385.0< and 2Rt <
Formulas in terms of inside dimensions:
PSEPRt
6.0−=
tRtSE
P6.0+
=
Formulas in terms of outside dimensions:
PSEPRt
4.0+=
tRtSE
P4.0−
=
A.2.3.2. ELLIPTICAL HEAD
Below equations are valid when the ratio of the major and minor axis is 2:1
Formulas in terms of inside dimensions:
PSEPDt
2.02 −=
tDtSE
P2.0
2+
=
Formulas in terms of outside dimensions:
PSEPDt
8.12 +=
tkDtSE
P8.1
2−
=
General configuration and dimensional data for vessel shells and head is given in
Figure A-1
A.2.3.3. OPENINGS
This chapter is from [26].
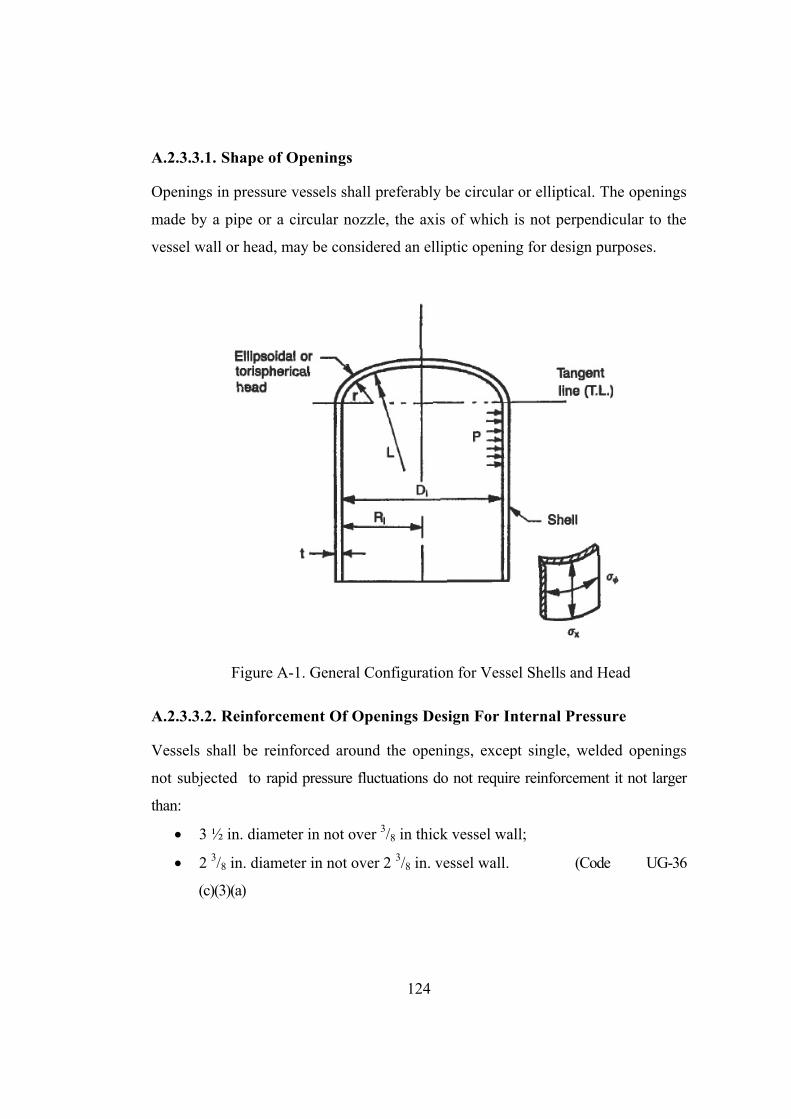
124
A.2.3.3.1. Shape of Openings
Openings in pressure vessels shall preferably be circular or elliptical. The openings
made by a pipe or a circular nozzle, the axis of which is not perpendicular to the
vessel wall or head, may be considered an elliptic opening for design purposes.
Figure A-1. General Configuration for Vessel Shells and Head
A.2.3.3.2. Reinforcement Of Openings Design For Internal Pressure
Vessels shall be reinforced around the openings, except single, welded openings
not subjected to rapid pressure fluctuations do not require reinforcement it not larger
than:
• 3 ½ in. diameter in not over 3/8 in thick vessel wall;
• 2 3/8 in. diameter in not over 2 3/8 in. vessel wall. (Code UG-36
(c)(3)(a)

125
The design procedure described below conforms to the Code UG-36 through UG-43,
which apply to openings not exceeding:
• One-half or 20 in. diameter in vessels of maximum 60 in. inside diameter.
• One-third or 40 in. diameter in vessels over 60 in. diameter.
The basic requirement is that around the opening the vessel must be reinforced with
an equal amount of metal which has been cut out for the opening. The reinforcement may
be an integral part of the vessel and nozzle, or may be an additional reinforcement pad.
(Figure A-2)
Figure A-2. Nozzle Reinforcement
This rule needs further refinements as follows:
• It is not necessary to replace the actually removed amount of metal, but
only the amount which is required to resist the internal pressure (A). This
required thickness of the vessel at the openings is usually less than at other points
of the shell or head.
• The plate actually used and nozzle neck usually are thicker than would be
required according to calculation. The excess in the vessel wall (A1) and
nozzle wall (A2) serve as reinforcements. Likewise the inside extension of
the opening (A3) and the area of the weld metal (A4) can also be taken into
consideration as reinforcement.
• The reinforcement must be within a certain limit.
• The area of reinforcement must be proportionally increased if its stress
value is lower than that of the vessel wall.

126
• The area required for reinforcement must be satisfied for all planes through
the center of opening and normal to vessel surface.
The required cross sectional area of the reinforcement shall then be the required area for
the shell or head to resist the internal pressure (A). From this area subtract the excess
areas within the limit (A1 A2 A3 A4). If the sum of the areas available for reinforcement
(A1+A2+ A3+ A4) is equal or greater than the area to be replaced (A), the opening is
adequately reinforced. Otherwise the difference must be supplied by reinforcing pad
(A5).
a. Area of Reinforcement
For vessels under internal pressure the total cross-sectional area required for
reinforcement of opening shall not be less than:
rxdA = where
=d The inside diameter of opening in its corroded condition.
=rt The required thickness of shell or head computed by the applicable formulas.
b. Available Area of Reinforcement
=1A Area of excess thickness in the vessel wall
“ dtt r )( − ” or “ 2))(( tttt nr +− ” use the larger value. If the stress value of
the opening’s material is less than that of the material, area 1A shall be decreased.
=2A Area of excess thickness in the nozzle wall
“ ttt rnn 5)( − ” or “ nrnn ttt 5)( − ” use the smaller value.
=3A Area of inside extension of nozzle: hctn 2)( −
=4A Area of welds.
If the sum of 321 ,, AAA and 4A is less than the area of reinforcement required,A the
difference must be supplied by reinforcing pad.

127
c. Limits of Reinforcement
The metal used as reinforcement must be located within the limits.
The limit measured parallel to the vessel wall “ dX = ” or “ ttR nn ++ ”. Use the
larger value.
The limit measured parallel to the nozzle wall “ tY 5.2= ” or “ nt5.2 ”. Use
smaller value.
When additional reinforcing pad is used, the limit, Y to be measured from the
outside surface of the reinforcing pad.
=nR inside radius of nozzle in corroded condition
d. Strength of Reinforcement
If the strength of materials in 4321 AAAA and 5A or the material of the reinforcing
pad are lower than that of the vessel material, their area considered as
reinforcement shall be proportionately decreased and the required area, A in
inverse proportion increased. The strength of the deposited weld metal shall be
considered as equivalent to the weaker material of the joint.
It is advisable to use for reinforcing pad material identical with the vessel material.
No credit shall be taken for additional strength of reinforcement having heigher
stress value than that of the vessel wall.

128
APPENDIX B
APPENDIX B: AIR TANK DESIGN CALCULATIONS B. AIR TANK DESIGN CALCULATIONS
AIR TANK DESIGN CALCULATIONS
B.1. DESIGN OF VESSEL SHELL
Dimensions
1100.0 Do - Outside Diameter (mm)
10.0 t - Nominal Wall Thickness (mm)
1080.0 Di - Inside Diameter (mm)
1000.0 Length
0.0 Corr, Corrosion allowence
Material and Conditions: 828.0 UTS, Steel (quenched/temperad alloy)
3.0 Safety Factor
276.0 S, Allowable Stress Level (MPa) 1 El - Longitudinal Efficiency (circ. stress)
1 Ec - Circ. Connecting Efficiency (longitudinal stress)
0.0% UTP, Undertolerance allowance (%)
0.000 UTI, Undertolerance allowance (m)
5 P, Interior Pressure (MPa)
0 Pa, Exterior Pressure
Variables:
UT = t*UTP+UTI = 10*0+0
undertollerance UT = 0.0 nt = t-Corr = 10-0
nominal thick nt = 10.0
Ri = Do/2-nt = 1100/2-10
effective inside radius Ri = 540.0
LDo = Le/Do = 1000/1100 LDo = 0.9
DoT = Do/nt = 1100/10 DoT = 110.0
Interior Pressure
ta = P*Ri/(S*El-0.6*P) = 5e6*0.540/(276e6*1-0.6*5e6) ta = 9.890

129
tb = P*Ri/(2*S*Ec+0.4*P) = 5e6*0.540/(2*276e6*1+0.4*5e6) tb = 4.874
tmin = Max(ta,tb,tminUG16b) tmin = 10.0 mm
PMaxA = (S*El*nt)/(Ri+0.6*nt) = (276e6*1*0.010)/(0.540+0.6*0.010)
PMaxA = 5.1
PMaxB = (2*S*Ec*nt)/(Ri-0.4*nt) = (2*276e6*1*0.010)/(0.540-0.4*0.010)
PMaxB = 10.299
PMax = Min(PMaxA,PMaxB) PMax = 5.1 MPa
B.2. DESIGN OF VESSEL HEAD
Dimensions 1100.0 Do - Outside Diameter (mm)
261.0 h (mm)
14.0 tf, Thickness after forming (mm)
0 Corr, Corrosion allowence
50.0 Skirt, straight skirt length (mm)
Material and Conditions:
828.0 UTS, Steel (quenched/temperad alloy)
4.0 Safety Factor
207.0 S, Allowable Stress Level (MPa)
1.0 Efficiency
7916.0 Dendity (kg/m^3)
5.0 P, Interior Pressure (MPa)
0.0 Pa, Exterior Pressure
Variables:
D = Do-2*t = 1100-2*14 D = 1072.0
ho = h+t = 261+14 h0 = 275.0
D/2h = D/(2*h) = 1072/(2*261) D/2h = 2.054
Do/2ho = Do/(2*ho) = 1100/(2*275) Do/2ho = 2.000
T=tf-corr = 14-0 t = 14.0 Interior Pressure
Tminl = (P*D*K)/(2*S*E-0.2*P)
= (5e6*1.072*1.064)/(2*207e6*1-0.2*5e6)

130
TMinl (min thickness) = 13.8 mm
Pmax = (2*S*E*t)/(K*D+0,2*t)
= (2*207e6*1*0.014)/(1.064*1.072+0.2*0.014) PMax = 5.1 MPa
B.3. QUICK DISCHARGE NOZZLE
Head: 207.0 <- Sv, allowable stress level
14.0 <- t, wall thick, uncorroded 13.8 <- tr, required wall thickness int. press.
0.0 <- trE, required wall thickness ext. press. 1.0 <- E1, efficiency of shell at nozzle 0.0 <- corr, corrosion allowance
Nozzle: 101.6 <- Do, outside diameter (3,5" standart pipe)
71.6 <- d, inside diameter 37.5 <- h, exterior Projection 15.0 <- tn, wall thick, uncorroded
1.0 <- E nozzle SS (302) <- Nozzle material (Cold Rolled)
117.9 <- Sn, allowable stress level (Sn) 5.0 <- P, internal design pressure
Reinforcing Flange Pad: 15.0 <- Leg41, size of weld fillet 15.0 <- Leg43, size of weld fillet
1.0 <- F
Pipe Dimensions : XX-STG inch mm Outside diameter 4 101.6
Nominal Pipe Size 3.5 88.9 Nom. Pipe Wall Thickness 0.636 16.1544 Min. Pipe Wall Thickness 0.557 14.1478 Max Allowable pressure 4701 32.41225
Variables: Rn = Do/2 - tn Rn = 35.8 trn = (P*Rn)/(Sn*E - 0.6*P) <= tn-UT trn = 1.5579 fr = MIN(Sn/Sv,1) fr = 0.5696 Geometry Constraints: tn*1.25 <= 0.7*(Leg41+Leg43) 18.75 <= 21 Okey 0.7*Leg41 >= 0.7*tn 0.0189 >= 0.014 Okey 0.7*Leg43 >= 0.7*tn 0.014 >= 0.014 Okey Area Replacement: mm2 A = d*tr*F 988.71
UW-16.1 (c) modified
Leg41
OD Nozzle
Nt
Leg41
Leg43
Leg43
Proj
Vt
Noz
zle
Shell
FullPenn.t

131
A1 = max((E1*t-F*tr)*d); (2*(E1*t-F*tr)*(t+tn)) A1 = 13.69 A2 = min((2*(2.5*tn)*(tn-trn));(2*(2.5*t)*(tn-trn)) A2 = 535.93 A3 = 2*h*tn*fr A3 = 640.76 A41 = Leg41^2*fr A41 = 128.15 A43 = Leg43^2*fr A43 = 128.15 Actual 1446.69 Actual- 457.98 Acceptable
B.4. AIR SUPPLY PIPE
Head: 207.0 <- Sv, allowable stress level
14.0 <- t, wall thick, uncorroded 13.8 <- tr, required wall thickness int. press.
0.0 <- trE, required wall thickness ext. press. 1.0 <- E1, efficiency of shell at nozzle 0.0 <- corr, corrosion allowance
Nozzle: 60.3 <- Do, outside diameter 49.3 <- d, inside diameter 20.0 <- h, exterior Projection
5.5 <- tn, wall thick, uncorroded SS (302) <- Nozzle material (Cold Rolled)
117.9 <- Sn, allowable stress level (Sn) 5.0 <- P, internal design pressure
Reinforcing Flange Pad: 15.0 <- Leg41, size of weld fillet 15.0 <- Leg43, size of weld fillet
1.0 <- F
Pipe Dimensions : XX-STG inch mm Outside diameter 2.375 60.32
Nominal Pipe Size 2 50.80 Nom. Pipe Wall Thickness 0.218 5.54 Min. Pipe Wall Thickness 0.191 4.85 Max Allowable pressure 2578 17.77
Variables: Rn = Do/2 - tn Rn = 24.63 trn = (P*Rn)/(Sn*E - 0.6*P) <= tn-UT trn = 1.071 fr = MIN(Sn/Sv,1) fr = 0.57 Geometry Constraints: tn*1.25 <= 0.7*(Leg41+Leg43) 6.9215 <= 21 Okey 0.7*Leg41 >= 0.7*tn 0.0189 >= 0.014 Okey
0.7*Leg43 >= 0.7*tn 0.014 >= 0.014 Okey
UW-16.1 (c) modified
Leg41
OD Nozzle
Nt
Leg41
Leg43
Leg43
Proj
Vt
Noz
zle
Shell
FullPenn.t

132
Area Replacement: mm2 A = d*tr*F 680.09 A1 = max((E1*t-F*tr)*d); (2*(E1*t-F*tr)*(t+tn)) A1 = 9.41 A2 = min((2*(2.5*tn)*(tn-trn));(2*(2.5*t)*(tn-trn)) A2 = 70.42 A3 = 2*h*tn*fr A3 = 126.15 A41 = Leg41^2*fr A41 = 128.15 A43 = Leg43^2*fr A43 = 128.15 Actual 462.29 Actual-Required = 217.80
Reinforcing Pad Required
Reinforcing: SA 516 70 <- Reinforcing plate material
137.9 <- Sp, allowable stress level 120.0 <- Dp, outside diameter
20.0 <- te, reinforcement thick 15.0 <- Leg41, size of weld fillet 15.0 <- Leg42, size of weld fillet 10.0 <- LegG, depth of groove
A41 = Leg41^2*fr A41 = 128.15 A42 = Leg42^2*fr A42 = 128.15 A5 = (Dp-d-2tn)*te*fr A5 = 679.77
A Required (internal) = 680.1
A1 = 9.4 A2 = 70.4
A41 = 128.2 A42 = 128.2
A5 = 679.8 Actual Area = 1015.9 Actual-Required = 335.8 Internal Weld Load: (UG-41) WmaxI = (A - A1 + 2*Tn*Fr1*(E1*t-F*tr))*Sv Max value for weld WmaxI = 139079.62 N W1-1 = MIN((A2 + A5 + A41 + A42)*Sv,WmaxI) W1-1 = 139079.62 N W2-2 = Min((A2 + A3 + A41 + A43 + 2*Tn*t*frone)*Sv,WmaxI)
W2-2 = 59383.62 NW3-3 = Min((A2 + A3 + A5 + A41 + A42 + A43 + 2*Tn*t*fr1)*Sv,WmaxI)
W3-3 = 139079.62 NComponent Strength (UG-45(c), UW-15(c))
Leg42
Leg41
Dp
te
Shell
Noz
zle
Ring
g
UW-16.1 (h) - modified
Leg41
Leg42
tWeld to connectto reinforcing pad
Do
Vt
Nt

133
A2 shear = PI()/2*(Do-tn)*tn*Sn*0.7 A2s = 39328.47 g tension = PI()/2*Do*LegG*Min(Sv,Sn)*0.74 gt = 82673.06 A41 shear = PI()/2*Do*Leg41*Min(Sn,Sp)*0.49 A41s = 82114.46 A42 shear = PI()/2*DP*Leg42*Min(Sv,Sp)*0.49 A42s = 191045.71 Failure mode along strength path S1-1 = A42s + A2s >= W1-1 S1-1 = 230374.19 Acceptable S2-2 = A41s + gt >= W2-2 S2-2 = 164787.52 Acceptable S3-3 = gt + A42s >= W3-3 S3-3 = 273718.77 Acceptable
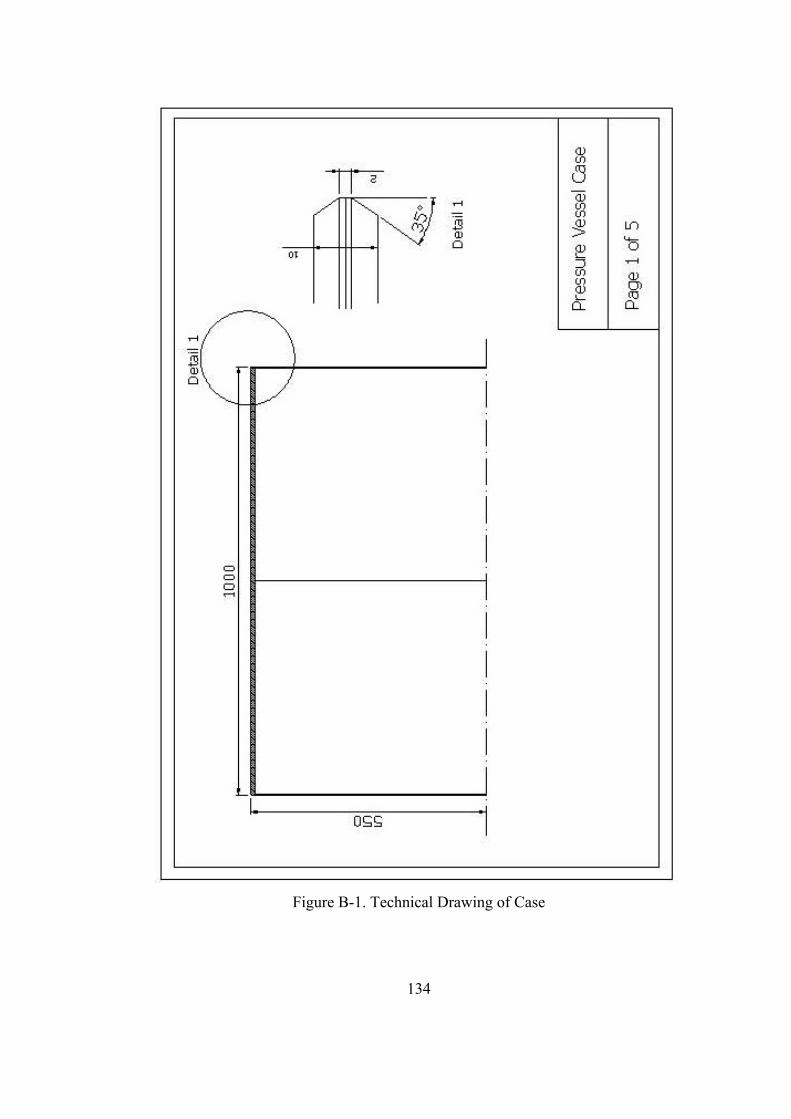
134
Figure B-1. Technical Drawing of Case

135
Figure B-2. Technical Drawing of Head 1

136
Figure B-3. Technical Drawing of Head 2

137
Figure B-4. Technical Drawing of Nozzle and Air Pipe

138
Figure B-5. Assembly Drawing of Pressure Vessel

139
APPENDIX C
APPENDIX C: COMBUSTION MODELLING BY FLUENT C. SLING BY FLUENT
COMBUSTION MODELLING BY FLUENT
C.1. COMBUSTION MODELLING BY FLUENT
FLUENT provides five approaches to modeling gas phase reacting flows:
• Generalized finite-rate model
• Non-premixed combustion model
• Premixed combustion model
• Partially premixed combustion model
• Composition PDF Transport model
C.1.1. GENERALIZED FINITE-RATE MODEL
This approach is based on the solution of transport equations for species mass
fractions, with the chemical reaction mechanism defined by the user. The reaction
rates that appear as source terms in the species transport equations are computed
from Arrhenius rate expressions, from the eddy dissipation model of Magnussen
and Hjertager [27] or from the EDC model [28]. Models of this type are suitable
for a wide range of applications including premixed, partially premixed, and non-
premixed turbulent combustion.
C.1.1.1. MODELING SPECIES TRANSPORT AND FINITE-RATE CHEMISTRY
FLUENT can model the mixing and transport of chemical species by solving
conservation equations describing convection, diffusion, and reaction sources for
each component species. Multiple simultaneous chemical reactions can be
modeled, with reactions occurring in the bulk phase (volumetric reactions) and/or
on wall or particle surfaces, and in the porous region.
140
C.1.2. PREMIXED COMBUSTION MODEL
This model has been specifically developed for turbulent combustion systems that
are of the purely premixed type. In these problems perfectly mixed reactants and
burned products are separated by a flame front. The ``reaction progress variable'' is
solved to predict the position of this front. The influence of turbulence is accounted
for by means of a turbulent flame speed.
In premixed flames, the fuel and oxidizer are intimately mixed before they enter
the combustion device. Reaction then takes place in a combustion zone that
separates unburnt reactants and burnt combustion products. Partially premixed
flames exhibit the properties of both premixed and diffusion flames. They occur
when an additional oxidizer or fuel stream enters a premixed system, or when a
diffusion flame becomes lifted off the burner so that some premixing takes place
prior to combustion.
C.1.2.1. LIMITATIONS
The following limitations apply to the premixed combustion model:
• You must use the segregated solver. The premixed combustion model is not
available with either of the coupled solvers.
• The premixed combustion model is valid only for turbulent, subsonic flows.
• The premixed combustion model can not be used to simulate reacting
discrete-phase particles, since these would result in a partially premixed
system. Only inert particles can be used with the premixed combustion
model.
C.1.3. CHOOSING A REACTION MODEL
The first step in solving any problem involving species transport and reacting flow
is to determine which model is appropriate. Consider the following guidelines:
• For cases involving the mixing, transport, or reaction of chemical species,
or reactions on the surface of a wall or particle (e.g., chemical vapor
deposition), generalized finite-rate model is used.

141
• For reacting systems involving turbulent diffusion flames that are near
chemical equilibrium where the fuel and oxidizer enter the domain in two or
three distinct streams, non-premixed combustion model is used.
• For cases with a single, perfectly premixed reactant stream, use the
premixed combustion model.
For cases involving premixed flames with varying equivalence ratio in the domain,
use the partially premixed combustion model. For turbulent flames where finite-
rate chemistry is important, use the laminar flamelet model
C.1.4. FLUENT MODELLING USED FOR MODELLING AIR HEATER MODEL
In combustion analysis, Finite rate chemistry model is used. Species transport
model is selected for species handling and volumetric reactions are considered.
Eddy-Dissipation (for turbulent flows, computes the mixing rate) is chosen for the
“Turbulance – Chemistry Interaction” model. For mixture properties, “methane-
air” mixture which is already available in FLUENT database is used.
Physical properties for the species in the mixture like molecular weight, viscosity,
thermal conductivity etc., default values from the FLUENT database is used.
A turbulent model has to be specified. The realizable k-ε model is used.
Boundary conditions :
Operating Pressure: Input the pressure that combustion takes place
Inlet (for premixed flow):
• mass flow rate of the mixture is defined
• mass fractions of fuel and oxygen are defined
• turbulence parameters are defined
Outlet: only turbulence parameters are defined

142
For non premixed flows, the same parameters are input at boundary conditions.
Fuel mass fraction at the fuel inlet is 1.
Mass fractions of fuel and oxygen are calculated from the mass flow rates. An
example is available in section C.2.
C.2. FLUENT COMBUSTION MODEL VERIFICATION
Combustion model of FLUENT is verified by an experimental study stated in [29].
Experimental data used in analysis is as follows:
The model assumed an axisymmetric geometry. The mass flow rate for the bluff-
body combustor model was specified by using the measured values reported for the
air (3960 standard liters per minute [slpm]) and the CH4 fuel (244 slpm). This
corresponded to a CH4–air equivalence ratio of 0.59. A turbulence grid was placed
at the entrance of the combustor section, upstream of the bluff body. The
corresponding uniform velocity and free stream turbulence at the inlet to the
combustor, just downstream of the turbulence grid, were 15 m/s and 24%,
respectively. An inlet temperature of 300 K and a combustor pressure of 1 atm
were also specified in the model. A combustor wall temperature of 500 K was used
in the simulations.
3960=airQ slpm KTinlet 300=
2444=CHQ slpm atmP 1=
59.0=ϕ KTwall 500=
Schematic and turbulent flame structure of bluff body stabilized lean premixed
combustor is given in Figure C-1 .
Grid generated for analysis is given in Figure C-2.

143
Figure C-1. Schematic of the Combustor
Figure C-2. Grid Used in FLUENT Analysis

144
C.2.1. INPUT ANALYSIS FOR FLUENT
( ) 222224 52.7276.32 NOHCONOCH ++→++
KelvinPascalQQ acmhscmh
24.294101325
=
3960=airQ slpm 6.237= scmh hm3234.242= 31@ 2.3 mkgatmair =ρ
2444=CHQ slpm 64.14= scmh hm3925.14=
31@ 819.1
4mkgatmCH =ρ
skghkgmCH 00754.015.25819.1925.144
==×=&
skghkgmair 2153.015.7752.3234.242 ==×=&
skgxmO 0499.0232.02153.02
==&
skgxmN 1654.0768.02153.02
==&
skgmtotal 22284.02153.000754.0 =+=&
==
==
==
23.74%22284.01654.0%
39.22%22284.00499.0%
38.3%22284.000754.0%
2
2
4
N
O
CH
Used as boundary condition in FLUENT

145
C.2.2. RESULTS
Temperature profiles at x/d=0.1
0
200
400
600
800
1000
1200
1400
1600
1800
0 0,2 0,4 0,6 0,8 1 1,2
Radial location (r/d)
Mea
n Te
mpe
ratu
re (K
)
actualPredicted by [1]Fluent
Temperature profiles at x/d=1.0
300
500
700
900
1100
1300
1500
1700
0 0,2 0,4 0,6 0,8 1
Radial location (r/d)
Mea
n Te
mpe
ratu
re (K
)
actualPredicted by [1]Fluent
@ x/d=0.1 Fluent prediction and the prediction stated in [29] are close to each
other. Also both methods solutions are cloase to the actual case.
@ x/d=1.0 again Fluent and [29] predictions are close to each other but Fluent
predictions are better.

146
Axial Velocity profiles at x/d=0.1
-15
-10
-5
0
5
10
15
20
25
30
35
0 0,2 0,4 0,6 0,8 1
Radial location (r/d)
Mea
n A
xial
Vel
ocity
(m/s
)
actualPredicted by [1]Fluent
Axial Velocity profiles at x/d=1.0
-15
-10
-5
0
5
10
15
20
25
30
0 0,2 0,4 0,6 0,8 1
Radial location (r/d)
Mea
n A
xial
Vel
ocity
(m/s
)
actualPredicted by [1]Fluent
@ x/d=0.1 for r/d<0.5 Fluent prediction and the prediction stated in [29] are close
to each other but deviated from the actual case. For r/d>0.5 Fluent predicts better
than the [29].
@ x/d=1.0 again Fluent and [29] predictions are close to each other but both
predictions can not get the actual result.

147
CH4 mole fraction profiles at x/d=0.1
0
0,01
0,02
0,03
0,04
0,05
0,06
0,07
0 0,2 0,4 0,6 0,8 1Radial location (r/d)
CH
4 m
ole
frac
tion
actualPredicted by [1]Fluent
CH4 mole fraction profiles at x/d=1.0
0
0,01
0,02
0,03
0,04
0,05
0,06
0,07
0 0,2 0,4 0,6 0,8 1Radial location (r/d)
CH
4 m
ole
frac
tion
actualPredicted by [1]Fluent
@ x/d=0.1 prediction stated in [29] predicts better than Fluent.
@ x/d=1.0 again Fluent predicts better than [29].
C.2.3. CONCLUSION
Fluent prediction of the experiment stated in [29] is quite good. Some of the results
obtained by Fluent is better than the results obtained in [29].

148
APPENDIX D
APPENDIX D: TEST CENTER DESIGN CODES D. SLING BY FLUENT
TEST CENTER DESIGN CODES
D.1. DESIGN CODES
FORTRAN codes are generated to evaluate pressure and temperature losses in the
pipe lines, to evaluate the temperature and pressure change during tank discharge,
to calculate fuel and oxygen mass flow rate for vitiator and to calculate required
valve coefficients.
A visual interface is generated to combine the codes. When the “mainvisual.exe” is
executed, main frame shown in Figure D-1 is opened.
Figure D-1. Main Window of the Program
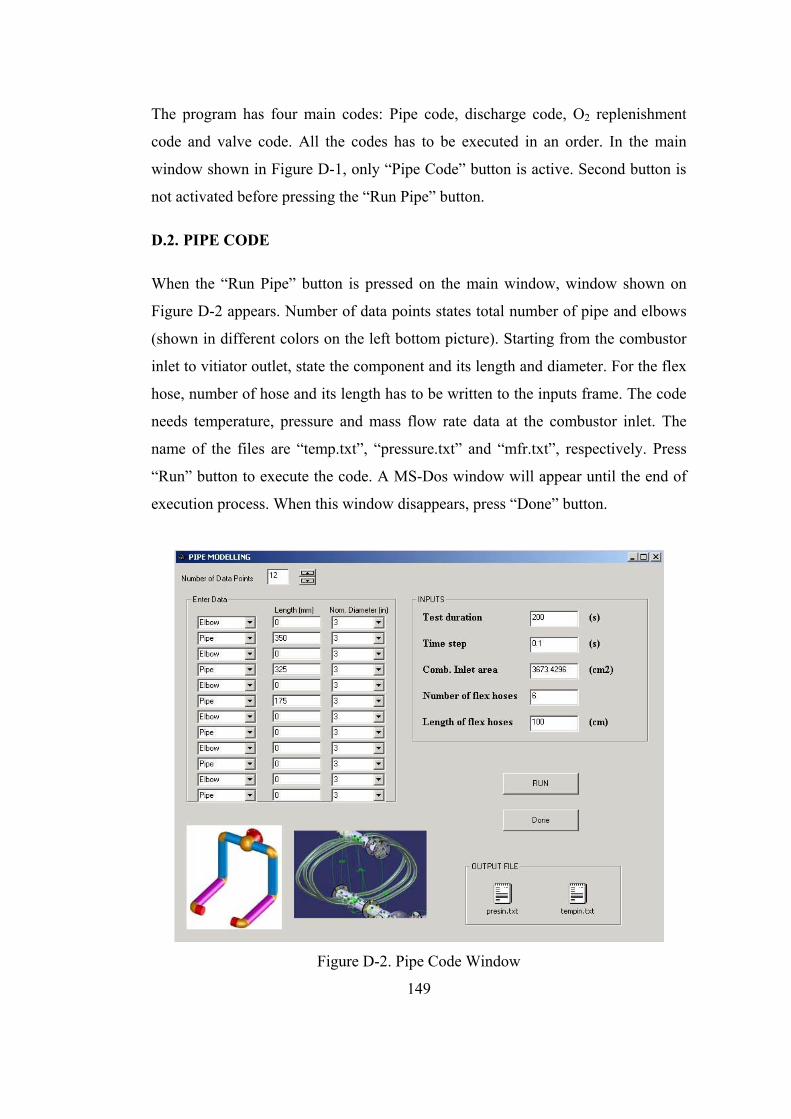
149
The program has four main codes: Pipe code, discharge code, O2 replenishment
code and valve code. All the codes has to be executed in an order. In the main
window shown in Figure D-1, only “Pipe Code” button is active. Second button is
not activated before pressing the “Run Pipe” button.
D.2. PIPE CODE
When the “Run Pipe” button is pressed on the main window, window shown on
Figure D-2 appears. Number of data points states total number of pipe and elbows
(shown in different colors on the left bottom picture). Starting from the combustor
inlet to vitiator outlet, state the component and its length and diameter. For the flex
hose, number of hose and its length has to be written to the inputs frame. The code
needs temperature, pressure and mass flow rate data at the combustor inlet. The
name of the files are “temp.txt”, “pressure.txt” and “mfr.txt”, respectively. Press
“Run” button to execute the code. A MS-Dos window will appear until the end of
execution process. When this window disappears, press “Done” button.
Figure D-2. Pipe Code Window

150
D.3. DISCHARGE CODE
After the pipe code window is closed, window shown in Figure D-. If the Pipe
Code window is closed before execution of the code, “Not Complete” warning will
given beside the “Run Pipe” button instead of “OK!”. Press “Run Discharge”
button to continue with the Discharge Code.
Figure D-3. Main Window Following the Pipe Code Window
Temperature and pressure history during discharge is obtained by discharge code.
This code use the same mass flow rate with the pipe code (mfr.txt). The calculation
process is as follows:
Assumption: Tank is insulated
Quasi-steady state solution of discharging tank has been completed.
( )cvii
iiee
ee ememgzV
hmgzV
hmWQ 1122
22
22−+
++−
++=−

151
0=Q , 0=W , 0=im , 0=∆ke , 0=∆pe
1122 umumhm ee −=
11221 umumhme −=
2
1112
..m
htmumu ∆+=
& where tmme ∆= .& and tmmm ∆−= .12 &
From 2u , 2T is obtained.
2P is obtained by: Vm2
2 =ρ and 222 ... TRZP ρ=
Repeating above procedure at t∆ intervals pressure-time history of the tank is
obtained.
Figure D-4. Discharge Code Window

152
Inputs required are stated in the INPUTS frame. After completing the inputs, press
the “Run” button. When the execution is complete, press the “Show Results”
button to see the results in the output frame. Press “Done” to close the window.
D.4. O2 REPLENISHMENT CODE
Once the discharge code window is closed, main window shown in Figure D- is
opened. Third step appears at this stage. If the Discharge Code window is closed
before execution of the code, “Not Complete” warning will given beside the “Run
Discharge” button instead of “OK!”. Press “Run O2 Replenishment” button to
continue with the O2 Replenishment Code.
Figure D-5. Main Window Following the Discharge Code Window
Combustion analysis in the vitiator is performed using the thermochemical code
Cet93. NASA Cet93 Code is used for calculations involving chemical equilibrium.
The method applied is based on a minimization of Gibbs free energy.

153
Two programs are written to work coupled with Cet93. One of them generates the
inputs for Cet93. The other calls the Cet93 code for each iteration. Program uses
two output file of pipe code and the mass flow rate data. For each time step,
temperature and pressure values are read from files and iterations for oxygen and
fuel mass flow rate. Methane-air combustion is performed. O2 Replenishment
Code Window is shown in Figure D-.
Figure D-6. O2 Replenishment Code Window
D.5. VALVE CODE
Once the O2 Replenishment Code Window is closed, main window shown in
Figure D-8 is opened. Fourth step appears at this stage. If the O2 Replenishment
Code Window is closed before execution of the code, “Not Complete” warning will

154
given beside the “Run O2 Replenishment” button instead of “OK!”. Press “Run
Valve” button to continue with the Valve Code. Frame shown in Figure D-8
appears.
Figure D-7. Main Window Following the O2 Replenishment Code Window
Solution procedure of the code is as explained in section 2.3. Pressure and
temperature data calculated by pipe code and discharge codes are used as input and
output temperatures of the valve system. Output file “cv.txt” includes the cv values
for the two valves for each time step. If a valid solution can not be obtained, “NOT
POSSIBLE” is written instead of “VALID SOLUTION”. Press “Done” to end the
program.

155
Figure D-8. Valve Code Window
Finally Figure D-9 appears. If all the notices beside the buttons are “OK!” (all
codes are run), text box returns to “COMPLETE” from “IN PROGRESS”. Output
files of all codes are given in the “Output Files” frame at the bottom of the window.
On the file menu, select “Restart” to restart the solution procedure. Press exit to
close the program.
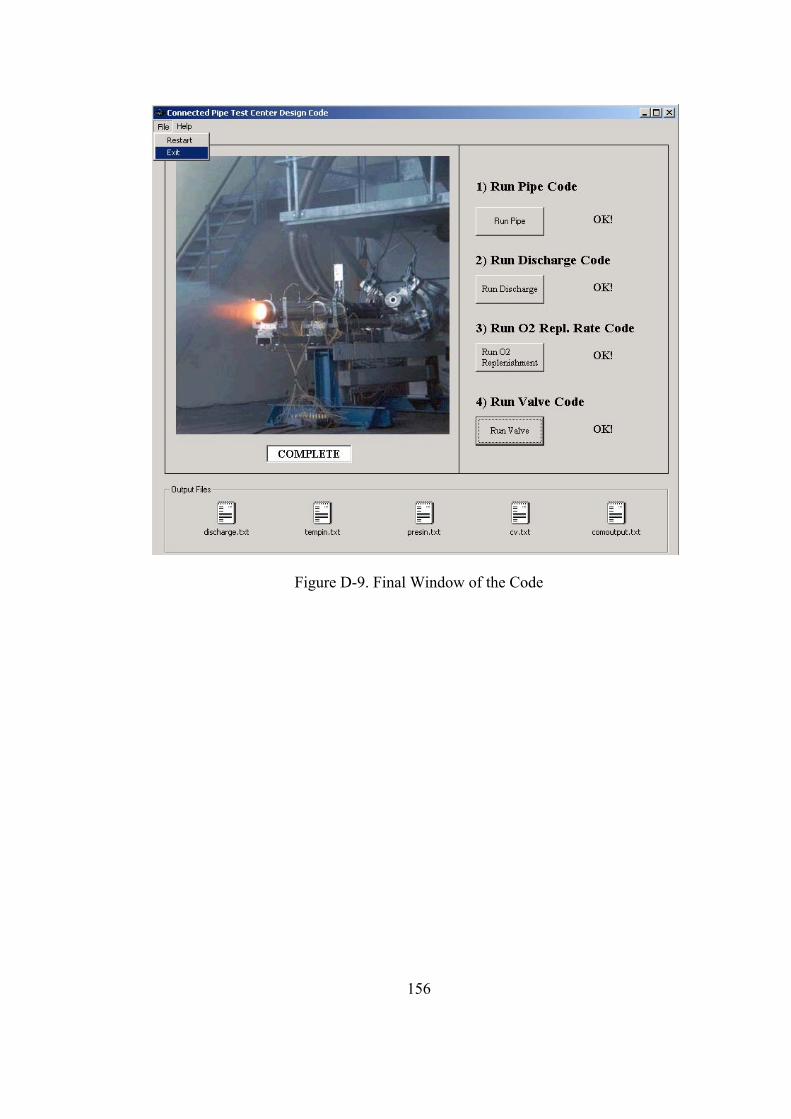
156
Figure D-9. Final Window of the Code

157
APPENDIX E
APPENDIX E: SAMPLE CALCULATIONS FOR PIPING
SYSTEM E. SLING BY FLUENT
SAMPLE CALCULATIONS FOR PIPING SYSTEM
Figure E-1. Pipe Configuration of the Test Center
E.1. SAMPLE CALCULATIONS
E.1.1. COMBUSTOR INLET TO 1ST ELBOW INTERFACE
Combustor air inlet area (A0): 20 42.3673 mmA = 68.4 mm
Nominal Pipe size: 3 inch ⇒ mminchDp 93.77068.3 ==

158
Mass flow rate at A0: skgm 56.21 =&
Temperature at A0: KT 7470 =
Pressure at A0: PaP 5100000 =
65.565.132
747==rT 135.0
771.351.0
==rP 002.1=Z
3
0
00 364.2
7501.287002.1510000 mkg
xxZRTP
===ρ
smxxRTc 05.5497501.2874.100 === γ
smxA
mV 95.294
003673.0363.256.2
00
00 ===
ρ&
537.005.54995.294
0
00 ===
cV
M
PaMPPT 5360922
1112
000 =
−+=
−γγ
γ
KMTTT 37.7602
11 2000 =
−+=γ
11
22* 2
111
21 −+
−+
+=
γ
γ
γγ
MMA
A
626.12
111
21 11
212
1*1 =
−+
+=
−
+γγ
γγ
MMA
A
21 44.4769
4mm
DA p ==
π

159
00
*
*1
1 AAA
AAA
= ⇒
908.2)626.1(42.367344.4769
*0
0
1*1 ==
=
AA
AA
AA
908.22
111
21 11
212
1*1 =
−+
+=
−
+γγ
γγ
MMA
A ⇒ 204.01 =M
barM
PP T 520960
)2
11( 121
01 =
−+
=−γγγ
KM
TT T 40.754
)2
11( 21
01 =
−+
=γ
E.1.2. 1ST ELBOW
3
1
11 406.2 mkg
RTP
==ρ
smxxRTMV 53.1114.75428738.1204.0111 === γ 54.0=K
PaVKP 80312
21
1 ==∆ ρ
PaPPP 2.529051803152096112 =+=∆+=

160
KTT 4.75412 ==
204.012 == MM
E.1.3. 1ST PIPE
smkg0001695.0=µ mmLpipe 3501 =
3
2
22 44.2 mkg
RTP
==ρ
000577462.007793.0
000045.0==
pDe
8.125298Re 22 ==µ
ρ pDV
0032541.0
Re74.5
7.3ln
25.02
9.0
=
+
=
pDe
f
( )( )
−+
+++
−=
2
22
2
2*
2
121
ln2
114M
MM
MD
Lf
p γγγ
γ mmL 11.61471*
2 =
mmLLL pipe 11.6182135011.614711*
2*
3 =+=+=
( )( )
−+
+++
−=
3
32
3
3*
3
121
ln2
114M
MM
MD
Lf
p γγγ
γ 203.03 =M
( ) 18.1121
22
*2 =
−++
=MT
Tγγ ( ) 18.1
121
23
*3 =
−++
=MT
Tγγ
KTTT
TT
T 4.75422
*
*3
3 ==
( ) 878.51211
222
*2 =
−−+
=MMP
Pγγ ( ) 89.5
1211
233
*3 =
−−+
=MMP
Pγγ
PaPPP
PP
P 2.53010322
*
*3
3 ==

161
E.1.4. 2ND ELBOW
3
3
33 448266.2 mkg
RTP
==ρ
smRTMV 3136.111333 == γ 54.0=K
PaV
KP 81912
23
3 ==∆ ρ
PaPPP 8.53724134 =∆+=
KTT 4316.75434 ==
203.024 == MM
E.1.5. 2ND PIPE
mmLpipe 3202 =
3
4
44 48.2 mkg
RTP
==ρ
000577462.007793.0
000045.0==
pDe
1.126980Re 22 ==µ
ρ pDV
0032541.0
Re74.5
7.3ln
25.02
9.0
=
+
=
pDe
f
( )( )
−+
+++
−=
4
42
4
4*
4
121
ln2
114M
MM
MD
Lf
p γγγ
γ mmL 14.61821*
4 =
mmLLL pipe 14.6214632514.618212*
4*
5 =+=+=
( )( )
−+
+++
−=
5
52
5
5*
5
121
ln2
114M
MM
MD
Lf
p γγγ
γ 203.05 =M
18.1*4 =
TT 18.1*
5 =TT

162
KTTT
TT
T 4.75444
*
*5
5 ==
89.5*4 =
PP 9.5*
5 =PP
PaPPP
PP
P 3.53830544
*
*5
5 ==
E.1.6. 3RD ELBOW
3
5
55 486069.2 mkg
RTP
==ρ
smRTMV 0919.111555 == γ 54.0=K
PaV
KP 82842
25
5 ==∆ ρ
PaPPP 3.54658956 =∆+=
KTT 45.75456 ==
203.056 == MM
E.1.7. 3RD PIPE
mmLpipe 1753 =
3
6
66 524327.2 mkg
RTP
==ρ
000577462.007793.0
000045.0==
pDe
1.128928Re 22 ==µ
ρ pDV
0032541.0
Re74.5
7.3ln
25.02
9.0
=
+
=
pDe
f
( )( )
−+
+++
−=
6
62
6
6*
6
121
ln2
114M
MM
MD
Lf
p γγγ
γ mmL 17.62171*
6 =

163
mmLLL pipe 17.623463*
5*
7 =+=
( )( )
−+
+++
−=
7
72
7
7*
7
121
ln2
114M
MM
MD
Lf
p γγγ
γ 203.07 =M
18.1*6 =
TT
18.1*7 =
TT
KTTT
TT
T 4.75466
*
*7
7 ==
9.5*6 =
PP
9.5*7 =
PP
PaPPP
PP
P 2.54712844
*
*5
7 ==
E.1.8. 4TH ELBOW
3
7
77 52.2 mkg
RTP
==ρ
smRTMV 9.110777 == γ 54.0=K
PaV
KP 84032
27
7 ==∆ ρ
PaPPP 2.55553178 =∆+=
KTT 4.75478 ==
KMM 203.078 ==
Summary of the results are tabulated in Table E-1.
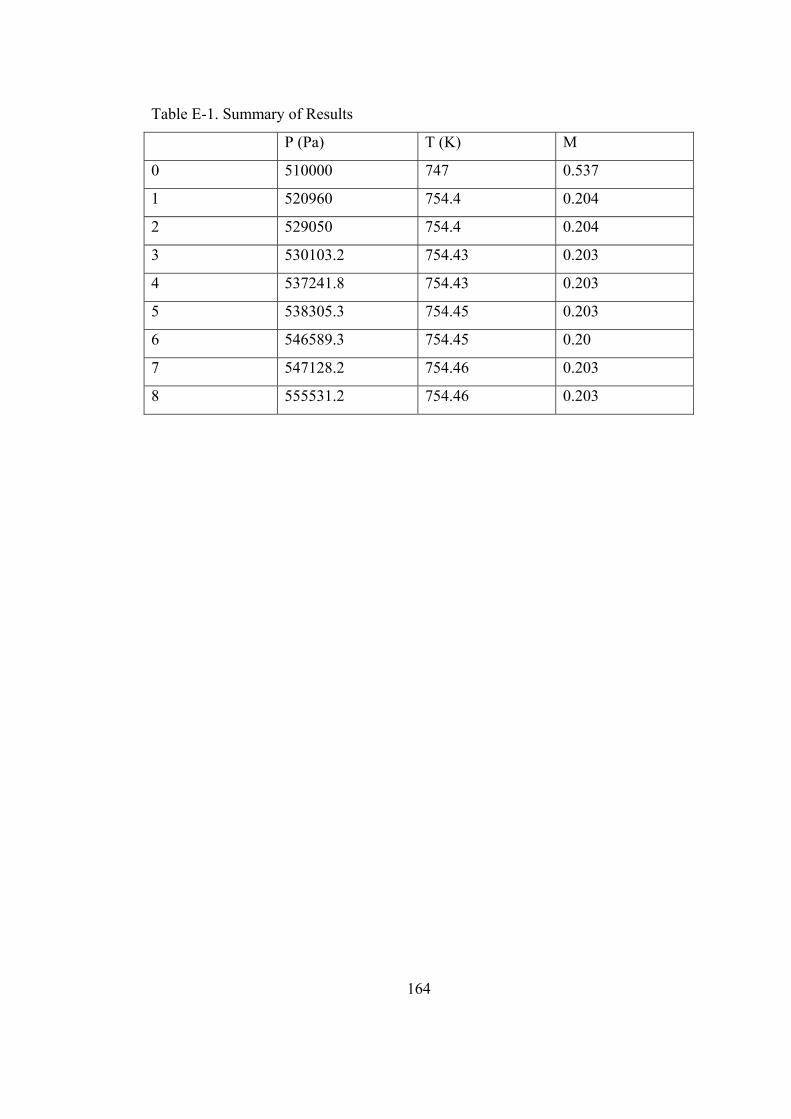
164
Table E-1. Summary of Results
P (Pa) T (K) M
0 510000 747 0.537
1 520960 754.4 0.204
2 529050 754.4 0.204
3 530103.2 754.43 0.203
4 537241.8 754.43 0.203
5 538305.3 754.45 0.203
6 546589.3 754.45 0.20
7 547128.2 754.46 0.203
8 555531.2 754.46 0.203