design guidelines creating infographics...
TRANSCRIPT

CREATING INFOGRAPHICS WITH IMPACT
DESIGN GUIDELINES

CONTENT PHASEContent phase 3Category 6
GRAPHIC ELEMENTSData visualisation 7 Process 8 Storytelling 9Typography and lines 10Colours 11Order of colours 12
ICONS Principles 13Detailed design principles 14Colours 15Collection 16Neutral icons 17
INSPIRATIONData visualisation 18Processes 20Storytelling 22

3
INFOGRAPHICS IS A VISUAL REPRESENTATION OF INFORMATION OR DATA WHICH MAKES IT EASIER TO UNDERSTAND AND REMEMBER
What characterises a good infographic?We encourage the use of infographics in Ramboll’s communication. Good infographics can be great at explaining complex information, and we want our communication to be approachable and easy to understand. It can be used across all communication channels, as long as it is adapted to the context in which it is to appear.
Making a complex message simpleWhen planning your infographic, you really have to focus on the core story to simplify your message as much as possible. As a rule of thumb, have in mind that the process of creating a great infographic typically consists up to 80% of conceptualising the content/message and only 20% of the actual design work.
80%Content
20%Design
URBAN TREES Tree oxes control
to gardens and help to filter and
URBAN GARDENS
Impurities are removed through filtration, sedimentation and biological absorbtion. They reduce flow speed and encourage infiltration while beautifying landscapes.
URBAN VEGETATED WATERBODIESUrban arks and egetated e urban beauty, control erosion and regulate water flow and sedimentation.
01
02
03
01 02 03
THE BLUE-GREEN CITY
CONTENT PHASE DESIGN GUIDELINES – CREATING INFOGRAPHICS WITH IMPACT
1.0 Content phase

4
GOOD DESIGN STARTS IN THE CONTENT PHASE
CONTENT PHASE DESIGN GUIDELINES – CREATING INFOGRAPHICS WITH IMPACT
1.1 Content phase
GOODINFOGRAPHIC
DATA
GOODINFOGRAPHICDESIGN STORY
SHAREABILITY
DATAYour infographic should contain some form of data to support your message. This may be in the form of numbers, but can also be key insights.
STORYIdentify which story you want to tell in your infographic and a clear message you want to convey.
SHAREABILITYWhen you start planning your infographic, you need to consider where you want to share it: online, in a brochure, power point? Which format (file type as well as design) would be most suitable depends on the medium you want to use it in.
DESIGNThe design has to complement and support the story you want to tell, catch the interest of the target group, and at the same time support the overall Ramboll brand in a powerful way.

5
5 STEPS TOA KILLERINFOGRAPHIC
CONTENT PHASE DESIGN GUIDELINES – CREATING INFOGRAPHICS WITH IMPACT
1.2 Content phase
01What is the (simple) story you want to tell in your infographic?
See page 2-3
02Determine which category of infographics you are planning on making
See page 6-9
03Where will you be using the infographic? Online, Power point, printed material?
Inspiration on page 18-23
04Make a draft of your idea(s)
Inspiration on page 18-23
05Follow the design guidelines in this guide when creating the infographic

6
DATA VISUALISATIONDisplaying data in e.g. pie charts, graphs etc.
See page 7 + 18-19
PROCESSShowing how things relate to each other in a flow or process. Things typically appear in an sequential order and relate to/influence each other. E.g. factors that influence the development of a liveable city.
See page 8 + 20-21
STORYTELLINGStrengthening a story or a point by means of an illustration. Something that makes the recipient think and creates a wow/stop effect.
See page 9 + 22-23
When working with infographics in Ramboll, there are three overall categories of types of infographics, depending on the type of message you have.
CONTENT PHASE DESIGN GUIDELINES – CREATING INFOGRAPHICS WITH IMPACT
2.0 Content phaseCategory
37%
Operation &Maintenance
Rolling StockInfrastructure
Systems
PublicParticipation
Procurement &Tendering
Safety &Security
CostEstimation
Construction Planning &Testing &
Commissioning
Architecture &Urban Design
SUSTAINABLELIGHT RAIL SOLUTIONS
A B
A B
A B

7
37%Fsposk
22%Jkso
10%Iksld
26%Elsoflskf
5%Lidsif oiafpo
0%Uidll
Data visualisations are used to display data in a e.g. pie charts, graphs etc.
These shapes can be combined with icons, but sometimes, you might want to stick to only highlighting your data.
SpacingWhenever icons and/or data are used together or in combination with other shapes, it is important to add space around the element to allow it to stand out.
Text and numbersAll text elements and numbers included in your data visualisation should use our corporate font. For online and printed material, Gotham Rounded bold is used for numbers/text you want to highlight. For smaller texts use Gotham Rounded book. In Word, Excel and Powerpoint, Verdana is used following the same principles.
TemplatesThere are a number of templates for creating data visualisations directly in Word, Powerpoint and Excel from the Ramboll tab and Ramboll Charts and Tables tab.
For design professionals, illustrator files are found on the Image Bank.
See more examples of data visualisations on page 18.
GRAPHIC ELEMENTS DESIGN GUIDELINES – CREATING INFOGRAPHICS WITH IMPACT
3.0 Graphic elements - CategoryData visualisation
Use of diagrams and showing data
Alternative way of showing data
Icon inside the diagram, % number in Bold, Dark Grey underneath the diagram.
% number inside the diagram, % number in Bold, Dark Grey.
37%
Space between the diagram and % number or icon.
Space around the icon and % number.
37%
50
80
60
90
100
70
3.4
4.0
3.6
4.2
4.4
3.8
2013 2014* 2015
Numbers in Book, Black, legend/text in Dark Grey in diagrams, lines, black, 0.25pt.

8
Process models illustrate how things relate to each other in a flow or process. Things typically appear in an sequential order and relate to/influence each other. E.g. factors that influence the development of a liveable city.
Using iconsIcons can be used to illustrate a point, but sometimes, it is better to keep the focus on your text. When icons are used, please remember to add some space between the icon and shape. Icons are not used on top of filled shapes.
ShapesThe actual shape of your process model depends on the story you want to illustrate. When using boxes, the Ramboll brand favours rounded corners.
ColoursWhen creating a process model, it is important to use the colour order described in section 3.1 to ensure a strong brand expression. You can choose to either used shapes with a fill colour, or use them in outline.
TemplatesThere are a number of templates for creating process models directly in Powerpoint from the Ramboll tab.
For design professionals, illustrator files are found in the Image Bank.See more examples of process models on page 20.
GRAPHIC ELEMENTS DESIGN GUIDELINES – CREATING INFOGRAPHICS WITH IMPACT
3.1 Graphic elements - CategoryProcess
Use of shapes and showing processes
Outline shape
Q1
Q2Q3
Q4
Text inside a round shape with arrows
Icons inside a round shape
Space between the shape and text or iconNo space between elements in modelDo not use icons on top of filled shapes
CATEGORISATIONCategorise risk level (CR level rating: low, medium, high)
FOLLOW UP & DOCUMENTATION Follow up on effectiveness of preventive/mitigating actions and document actions/decision in CR log and CR plan
COMMUNICATION Communicate
preventive/mitigating actions to project
team and continue/adapt dialogue
with stakeholders
SCREENINGIdentify Corporate Responsibility risks
PLANPreparing annual compliance plansIdentifying & recording compliance obligationsEstablishing focus areas & KPIsIdentifying training needs
ACTPlanning auditsProviding/organising training & communication
MONITORConducting auditsAssisting with group compliance auditsCompleting self-assessment of local processes
REPORTAnalysing & summarising compliance performanceRecommending next year’s focus areasConducting & submitting compliance reports
Filled shape

9
Storytelling infographics illustrate a story or a point by means of an illustration. Something that makes the recipient think and creates a wow/stop effect.
Creating an elaborate city model is a good way to illustrate your point, but remember to also consider whether a simpler visual story focusing on your main message is a better option. This choice depends on the story as well as where you want to use it.
Combining icons into a storyThe icons in our icon library have to be used as a basis for creating storytelling infographics. Our infographics have a flat design, so do not introduce any extra 3D effects, shadings or roundings.
Highlighting the important elementsFocus on the element you want to highlight in your story by using the colour versions of the icons for the elements that are important. Supplementing elements can be toned down by using the grey icons, and/or by making them smaller.
GRAPHIC ELEMENTS DESIGN GUIDELINES – CREATING INFOGRAPHICS WITH IMPACT
3.2 Graphic elements - CategoryStorytelling
Use of shapes and icons to show a story
URBAN TREES Tree oxes control
to gardens and help to filter and
URBAN GARDENS
Impurities are removed through filtration, sedimentation and biological absorbtion. They reduce flow speed and encourage infiltration while beautifying landscapes.
URBAN VEGETATED WATERBODIESUrban arks and egetated e urban beauty, control erosion and regulate water flow and sedimentation.
01
02
03
01 02 03
01
02
03
Use of coloured icons and Light Grey 50%
All icons are toned down by using Light grey 50% and the main story is highlighted in Cyan
Use of Icons to show a simple story
A B
A B
A B

10
All text elements and numbers included in your data visualisation should use our corporate font. For online and printed material, Gotham Rounded, all caps, bold is used for numbers/text you want to highlight. For smaller texts use Gotham Rounded, sentence case, book. For HTML generated text, Word, Excel and Powerpoint, Verdana is used following the same principles.
Arrows and linesRamboll has a set of standard arrows to be used in infographics. These can be found on the Image Bank.
Use thin lines or arrows together with the graphic elements and texts. This creates a lightness in the visual expression, and helps guide the recipient through the infographic.
See more examples on pages 18-23.
GRAPHIC ELEMENTS DESIGN GUIDELINES – CREATING INFOGRAPHICS WITH IMPACT
3.3 Graphic elementsTypography and lines
Fonts
Arrows and lines
GOTHAM ROUNDED
VERDANAMain typeface
HTML generated text, Powerpoint and Word
Examples: Thin arrow and thin lines 1 pt. Highlighted text and numbers use bold, all caps. Body text use sentence case, book or regular.
Bold arrow Medium arrow Light arrow Thin arrow
URBAN TREES Tree oxes control
to gardens and help to filter and
URBAN GARDENS
Impurities are removed through filtration, sedimentation and biological absorbtion. They reduce flow speed and encourage infiltration while beautifying landscapes.
URBAN VEGETATED WATERBODIESUrban arks and egetated e urban beauty, control erosion and regulate water flow and sedimentation.
01
02
03
01 02 03
Operation &Maintenance
Rolling StockInfrastructure
Systems
PublicParticipation
Procurement &Tendering
Safety &Security
CostEstimation
Construction Planning &Testing &
Commissioning
Architecture &Urban Design
SUSTAINABLELIGHT RAIL SOLUTIONS

11
RGB 0 157 224CMYK 100 0 0 0
Cyan
To ensure a strong link back to the Ramboll brand expression, use the Ramboll brand colours.
In order to achieve the correct balance and expression, the selection of colours to be used in infographics has been limited to the colours on this page.
RGBUse for online, Word, Power Point and Excel.
CMYKUse for print material.
GRAPHIC ELEMENTS DESIGN GUIDELINES – CREATING INFOGRAPHICS WITH IMPACT
3.4 Graphic elementsColours
RGB 121 119 102CMYK 0 0 25 65
Dark Grey
RGB 208 207 197CMYK 0 0 9 24
Light Grey
RGB 167 211 245CMYK 45 0 0 0
Light Blue
Primary colours
Additional colours
RGB 0 111 158CMYK 100 0 0 40
Dark Blue
RGB 161 191 54CMYK 50 0 100 0
Lime Green
Tint – Change the tint of Dark Grey or Light Grey
TINT
DARK GREY
TINT
LIGHT GREY

12
It is important to ensure the correct balance and a strong visual expression in the colours applied to graphic elements.
The grey and cyan should always be present as the two basic colours when designing graphic elements. Often with grey as the more dominant one.
Order of coloursFollow the colour order in the examples on this page when creating graphic elements with several colours. When more than six colours are needed, Dark Grey and Light Grey can be used in different tints as additional colours.
GRAPHIC ELEMENTS DESIGN GUIDELINES – CREATING INFOGRAPHICS WITH IMPACT
3.5 Graphic elementsOrder of colours
Order of colours
Order of colours – with additional colours
01 01
0101
02
02
03
03
04
04
05
05
06
06
07
07
08
08
09
10
02
02
0304
05
04 03
Tint – Change the tint of Dark Grey and Light Grey.
01 02
04 03
Toned down More colourful

13
GOTHAM ROUNDEDThe way our icons look is central for ensuring a distinct Ramboll style in our infographics.
We have built a central library of icons to be used across the business to ensure consistency. If additional icons are needed, please contact your design team.
For designers creating iconsWhen creating an icon, it should be obvious what it does or represents. It should be clearly recognisable for the recipient, also when it is not larger than 48x48 pixels square. Also, the icon should work equally well in colour and in Dark Grey 50% or white.
StyleOur icons are simplistic and no-nonsense without too many elaborate details. Despite of the simple style, they are still serious and not childish. The icons are two-dimensional, based on a flat design. They have rounded corners - inspired by our font, Gotham Rounded.
Do not scale icons in Illustrator Avoid scaling our icons in size directly in Illustrator, as some of the dimensions will be distorted. Please use the icons in their original size and then scale all of the elements in the document where you apply them.
ICONS DESIGN GUIDELINES – CREATING INFOGRAPHICS WITH IMPACT
4.0 IconsPrinciples
Corner shape

14
All icons strip down unnecessary details, as long as the visual message is not lost. Just enough details should be included to enhance the symbolism of the icon.
The level of detail in our icons has not been designed for use at level 1. If icons are needed in the smallest size (eg 16x16 px), they may have to be adjusted slightly.
Most of the corners of the icon shapes are rounded, which enhances the round and stout visual feeling of our brand. However, things that are fixed to the ground have a flat bottom.
Icon gridTo ensure uniformity in the shapes and sizes of the icons, all icons use a canvas grid of 48x48 pixels. Not all icons use the full width and height of the canvas, most icons are about 44x44 pixels, depending on the shape and symbol of the icon.
For example, a perfectly squared icon would be a bit smaller than a circle, though visually they will look exactly the same, because they take different circumference. Icons that are long or wide in nature can use the full height or width of the grid canvas. This approach enhances ratio consistency between icons.
ICONS DESIGN GUIDELINES – CREATING INFOGRAPHICS WITH IMPACT
4.1 IconsDetailed design principles
Level of detail
Level of detail used in our icons
Using the grid
Icon grid: 48x48 pixels. Most icons are 44x44 pixels, depending on the shape and symbol of the icon. See examples of how the grid is used below.
Level 1 Level 2 Level 3

15
RGB 0 157 224CMYK 100 0 0 0
Cyan
50%RGB 121 119 102CMYK 0 0 25 65
Dark Grey
RGB 161 191 54CMYK 50 0 100 0
Lime Green
A fundamental feature for creating a strong link back to our brand is the use of the Ramboll brand colours in the icons. The primary colours used in the icons are cyan and dark grey 50%. When new icons are created, these should as far as possible always be present. Most often the grey will be the more dominant one. These two colours may be supplemented with the light green when it makes sense.
This is to ensure that the icons are experienced as being bright and distinct, with a strong visual impact.
RGBUse for online, Word, Power Point and Excel.
CMYKUse for print material.
ICONS DESIGN GUIDELINES – CREATING INFOGRAPHICS WITH IMPACT
4.2 IconsColours
Primary colours
Use the Lime Green when it is natural
Colours
Grey is most dominantly used

16
Availability of basic iconsThe full set of basic icons to be used in material created in Microsoft Office is directly accessible in Power Point under the Ramboll tab.
Advanced icons for designersThe full set of more advanced icons in vector-based (scalable) format is available for design professionals in the Designer folder on the Image Bank.
ICONS DESIGN GUIDELINES – CREATING INFOGRAPHICS WITH IMPACT
4.3 IconsCollection
Basic icons
Advanced icons – vector
Basic icons in tree versions: coloured; Dark Grey 50% and White
Advanced icons in vector in tree versions: coloured, Dark Grey 50% and White
Additional icons in vector used for creating infographics

17
As a supplement to Ramboll’s primary icons with colours, there is a matching set of more neutral icons in Ramboll Dark Grey 50% and white.
These icons can be used to tone down the visual impact of the icons on designs in order to highlight other parts of your graphic elements.
Dark Grey 50% iconIf you have many different infographic elements together, for example in a brochure, the Dark Grey 50% icons can be used to tone down the visual impact and ensure that the main focus is placed on the most important elements.
White iconThe white icons are used on top of coloured backgrounds, where a more neutral expression is needed.
Light Grey 50%Icons in Light Grey 50% are only to be used as secondary elements in larger illustrations, and are not to be used as stand-alone elements.
ICONS DESIGN GUIDELINES – CREATING INFOGRAPHICS WITH IMPACT
4.4 IconsPrinciples – neutral icons
Dark Grey 50% and white icons
Use of Light Grey 50%

18
INSPIRATION DESIGN GUIDELINES – CREATING INFOGRAPHICS WITH IMPACT
6.0 Examples – DatavisualisationHow to use infographics
WHY LIGHT RAIL AND WHY NOW?
Cities all over the world are starting to look at light rail to relieve road congestion and improve liveability. Why? Because light rail systems meet some of the key requirements for today’s rapidly growing cities:
• It’s electric! Electrically powered light rail systems can be equipped to run exclusively on renewable energy sources, thereby lightening the city’s carbon footprint.
• Zero local emissions Unlike petrol- or diesel-powered vehicles, electrically powered light rail systems do not emit particles that pollute the air.
• High capacity and space efficiency Light rail is highly scalable to local capacity needs and generally provides a high quality as well as capacity compared to buses – thus being a real alternative to the private car.
• The rail effect Light rail is a comfortable way to travel. Experience shows that people tend to prefer light rail over buses even in cases where there is no significant difference in travel time.
• Enabler for urban growth Light rail and metro projects around the world have shown that permanent rail-based infrastructure potentially attracts long-term investments and influences patterns of settlement in a fundamental way.
32 ENABLING LIGHT RAIL SOLUTIONSRAMBOLL
Light rail provides efficient and sustainable public transport and is significantly more capacity-effective than a car or even a bus.
Today’s rapidly growing cities call for cost-effective, reliable and sustainable public transport solutions. And as a high capacity electrically powered transport system – that has also proven to act as a powerful enabler for urban growth – light rail seems to offer a desirable solution to these requirements in a wide range of cities around the world.
While a bus line can be changed or closed down, a rail-based transport system provides a permanent infrastructure that can attract long-term investments and influence patterns of settlement in a substantial way. In fact, Nordic cities such as Malmö, Lund, Helsingborg, Tampere, Turku, Stavanger, Copenhagen, Odense and Aarhus are all developing or considering light rail as part of urban development plans.
The light rail renaissanceWhile Germany still has one of the highest densities of tramway and light rail systems worldwide – counting 59 systems in total – light rail is becoming increasingly popular in particularly the Nordic countries. Several Norwegian and Swedish cities have already introduced light rail transportation, and cities such as Stockholm, Gothenburg, Norrköping, Helsinki, Bergen, Trondheim and Oslo are currently studying and conducting network extensions.
In France, like in many other countries in Europe, tramways had almost vanished from the streets by the late 1960s and were replaced by buses or underground metro systems. This changed with the introduction of tramways in cities such as Strasbourg, where one of the first new French light rail systems (called tramway in France) opened in 1994. Paris, Lyon, Nice, Rouen, Montpellier, Bordeaux and many others followed suit in developing modern tramway systems.
Since then, a veritable light rail ‘renaissance’ has spread to a large number of cities in France, in the UK, Ireland, Spain and Portugal. San Diego, California pioneered the re-introduction of light rail in the United States, with the first services of the San Diego Trolley operating in July 1981 initially with LRVs similar to those used in Frankfurt, Germany.
Following this spark, the US, Canada and Australia have recently introduced light rail in numerous metropolitan areas including Portland, Seattle, Phoenix, Minneapolis, Edmonton, Calgary, Melbourne, Sydney, Adelaide and the Gold Coast.
A SUSTAINABLE SOLUTION ON TRACKLight rail not only provides efficient and sustainable public transport – it also has a proven track record to vitalise the urban landscape and foster substantial urban development and growth. No wonder that cities all over the world are starting to look at light rail to relieve road congestion and improve liveability.
SUSTAINABLE PUBLIC TRANSPORTATION – HOW TO MOVE 200 PEOPLE IN AN EFFICIENT WAY
1.2 person per car on average
200 PEOPLE BY CAR
70 persons per bus on average
200 PEOPLE BY BUS
200 persons per tram on average
200 PEOPLE BY TRAM
Spread in a A4 brochure
Powerpoint slide
Powerpoint slide
ENVIRONMENTAL SUSTAINABILITY- FOCUS AREAS
• The Environmental Sustainability Strategy developed in 2015 prioritises the above four areas for the management of Ramboll’s facilities in Denmark based on material aspects.
• The strategy is supported by a yearly action plan that describes more specific and measurable actions to be taken.
26%Hjslposaf
22%Julkd
5%Opdkolkjdpf
10%Kkdoid
37%Jkdkap
0%Jiosf
PIE CHART WITH ICON OR MUMBER
• The Environmental Sustainability Strategy developed in 2015 prioritises the above
• Four areas for the management of Ramboll’s facilities in Denmark based
• The strategy is supported by a yearly action plan that describes more specific
35%Energy

19
INSPIRATION DESIGN GUIDELINES – CREATING INFOGRAPHICS WITH IMPACT
6.1 Examples – DatavisualisationHow to use infographics
Powerpoint slide
PIE CHART WITH ICON OR MUMBER
66%
• The Environmental Sustainability Strategy developed in 2015 prioritises the above
• Four areas for the management of Ramboll’s facilities in Denmark based
• The strategy is supported by a yearly action plan that describes more specific
35%
66%35%
Text Text
Text Text

20
INSPIRATION DESIGN GUIDELINES – CREATING INFOGRAPHICS WITH IMPACT
6.2 Examples – ProcessHow to use infographics
26 27CORPORATE RESPONSIBILITY REPORT 2015BUSINESS INTEGRITY
THE ANNUAL COMPLIANCE CYCLE
REPORTAnalysing & summarising compliance performance
Recommending next year’s focus areas Conducting & submitting compliance reports
MONITORConducting audits
Assisting with group compliance audits Completing self-assessment of local processes
PLANPreparing annual compliance plans Identifying & recording compliance obligations Establishing focus areas & KPIs Identifying training needs
ACTPlanning audits Providing/organising training & communication
Q1
Q2Q3
Q4
• Client discounts and ‘freebies’• Use of third parties to win and
retain business• Requests to waive rules when
supporting a bidding review process
• Offer of incentives from contractors to sign off on substandard works
• Offer of incentives from bidders to evaluate tender submissions favourably
• Assessment of corruption risk factors when entering new markets
• Cost-cutting on building materials (poor quality material used and surplus funds pocketed instead).
Operating in high-risk industries, while at the same time having a zero-tolerance policy towards bribery and corruption, is a challenge and a serious risk to Ramboll. In 2015, we developed a new Group Anti-Corruption Policy and Guidelines both to decrease corruption risks by providing specific guidance to employees on how to handle dilemmas, and to ensure that adequate policies and procedures are in place. The revised policy and supplementary guidelines will be implemented across the organisation in 2016.
Advocating anti-corrupt behaviourDemonstrating leadership and advocating for anti-corrupt behaviour
in the industry is a priority for Ramboll, for instance by engaging in close dialogue with governments, diplomats, civil society and other relevant parties in the markets we serve. For example, our Group CEO Jens-Peter Saul attended a roundtable discussion on anti-corruption with among others the Danish Prime Minister at the UN Private Sector Forum in New York.
Ramboll believes that the public and private sectors (as well as civil society) should join forces in the fight against corruption, as we all have an interest in doing things right. Ramboll supports and encourages transparency and a systematic approach in public tender processes. We are already engaged and ready to address the issues further with relevant authorities in the markets where we operate. Ramboll also supports industry organisations and international anti-corruption initiatives. For example, Ramboll is a supporting participant of Transparency International, Denmark.
Providing advice on anti-corruptionAs part of Ramboll’s consultancy services, we offer advice to governments around the world on anti-corruption and good governance practice. For example, we have developed and delivered several tailor-made training programmes on
behalf of Danida Fellowship Centre focusing on public sector leadership, financial management and good governance, including anti-corruption. In total, we have trained more than 300 managers from countries across Africa and Asia. We have also assessed public procurement systems, including the risk of corruption, on behalf of the World Bank in a number of countries (eg Zimbabwe, South Sudan, Ethiopia, Papua New Guinea).
COMPLIANCEThe Ramboll Global Compliance Programme is a natural development stemming from our foundational focus on business integrity. The programme was initiated in 2013 to address the increasing demands from our clients, partners and regulatory authorities to document compliance with legislation and Ramboll policies.
The ultimate goals of the programme:• Conduct training, awareness and
monitoring to mitigate the risk of employees and partners violating laws and Ramboll policies
• Respond to increasing client demands for an effective compliance programme
• Improve relations with employees and clients, and enhance the general reputation of the company.
The cornerstones of the programme are the 2014 ISO 19600 compliance management guidelines and the newly launched Ramboll Compliance Policy, which outlines the scope and content of the programme and expectations of the behaviour of all Ramboll employees. These have formed the basis for the development of an annual compliance cycle that illustrates how we in Ramboll work with compliance planning, acting, monitoring and reporting. The annual compliance cycle is supported by various compliance tools and processes and the newly launched Compliance Management System. The system will be used for the reading and signing of policies, training, testing, risk assessment and due diligence processes.
In 2014, we focused on defining processes and developing tools in order to establish the foundation for the rollout of the Global Compliance Programme. In 2015, we focused on establishing the compliance policy, training the newly appointed Local Compliance Managers responsible for all business units, and assisting them with setting the first compliance focus areas and Key Performance Indicators (KPIs) for all business units. The 2015 compliance focus areas and KPIs focused on training all managers in compliance, disseminating the first policies for reading and signing
and conducting the first compliance audits. Systematic monitoring and handling of compliance incidents have been implemented across Ramboll to ensure effective and professional responses to incidents as they arise.
2015 was dedicated to creating a shared understanding of compliance and its importance across Ramboll. We also worked on building a strong compliance capacity in all of our business units, with a focus on adapting global tools and processes to local conditions and different risk landscapes.
GRIEVANCE MECHANISMSA grievance mechanism, also known as a ‘dispute’, ‘complaint’ or ‘accountability’ mechanism, is a formal complaint process that employees or stakeholders can use if they are being negatively affected by business activities and operations or to report illegal acts, breaches of contract or policies that come to their attention.
As Ramboll wishes to have an open dialogue about dilemmas, non-compliance issues and potential negative impacts, we make a number of grievance mechanisms available. Ramboll encourages employees to take up any irregularities with their Manager and/or Local Compliance Manager. If they do not feel
GROUP POLICY
• Global Compliance Policy
ACHIEVEMENTS 2015
• Global Compliance System implemented and Local Compliance Managers appointed in each Principal Business Unit (PBU)
• Focus areas and KPIs set for all PBUs
• Compliance incident process and report in place
AMBITIONS 2016
• Global data privacy gap analysis• Assessment of compliance risks• Training to be tailored according
to specific global and PBU risks
Image: Øyvind Hagen, Statoil
Spread, A4 brochure
Powerpoint slide
ENVIRONMENTAL SUSTAINABILITY- FOCUS AREAS
• The Environmental Sustainability Strategy developed in 2015 prioritises the above four areas for the management of Ramboll’s facilities in Denmark based on material aspects.
• The strategy is supported by a yearly action plan that describes more specific and measurable actions to be taken.
Sustainable materials
Increasedrecycling
Reduction of waterconsumption
ReductionIn CO2
emissions
Powerpoint slide
ENVIRONMENTAL SUSTAINABILITY- FOCUS AREAS
Juipdfius fobnFic to molupiti blaerchil maio. Into bero et omnissi utea que occusearcienet quiderfernam alicit ut
UisdnFic to molupiti blaerchil maio. Into bero et omnissi utea que occusearcienet quiderfernam alicit ut
JekldpoFic to molupiti blaerchil maio. Into bero et omnissi utea que occusearcienet quiderfernam alicit ut
• The Environmental Sustainability Strategy developed in 2015 prioritisesthe above four areas for the management of Ramboll’sfacilities in Denmark based on material aspects.
• The strategy is supported by a yearly action plan that describes more specific and measurable actions to be taken.

21
INSPIRATION DESIGN GUIDELINES – CREATING INFOGRAPHICS WITH IMPACT
6.3 Examples – ProcessHow to use infographics
2
ANNUAL REPORT 2015 76 ACTIVITIES VALUE FOR CLIENTS AND SOCIETY
HELSINKI CENTRAL LIBRARY; MODEL OF PROCESS AND COLLABORATION
2 CREATING A NEW LANDMARKView from the top floor of the Helsinki Central Library. Visualisation: ALA Architects.
3 LEADING SUSTAINABLE CONSTRUCTIONDalston Lane in London is set to be the world’s tallest and largest cross-laminated timber building of its kind. Visualisation: Regal Homes.
4 Lars O. Riemann, Group Director, Buildings.
5 Gareth White, Ramboll Director, CLT Expert.
6 Johan Rosqvist, Project Director, Helsinki Central Library.
3
5
4
6
of timber stores carbon, the building structure in itself is of high value in the realm of climate change solutions. Lars O. Riemann, Group Director, Buildings, explains: “Dalston Lane is a premium example of how we deliver innovative solutions and sustainable designs that offer higher coefficents of utilisation.”
Leading sustainable constructionCLT holds many material benefits, a central one being its sustainability. In total, Ramboll’s CLT experts have calculated that Dalston Lane will save 2,400 tonnes of carbon, compared to an equivalent block with a concrete frame. By using CLT construction, the embodied carbon is 2.5 times less than that of an equivalent concrete
frame. Taking into account that timber stores carbon by absorbing carbon dioxide (CO2) from the atmosphere, also known as ‘sequestered or embodied carbon’, the structure can be considered as ‘carbon negative’. Its 3,852 cubic metres of CLT will form the external, party and core walls, floors and stairs.
Ramboll Director and CLT expert Gavin White comments: “It is exciting to see this milestone project get off the ground. The height and size of the Dalston Lane building shows how versatile CLT is, as well as its potential in leading the future of sustainable construction.” Dalston Lane will be one of several timber buildings in the area, thanks to the London borough of Hackney’s ‘timber first’ policy established in 2012, making this central part of London a world leader for timber construction.
STEP 2:PLANNINGGlobal team members from Finland, Denmark and the UK meet the client. The team and Ramboll Engineering Centre work on forming the main structure.
STEP 3: DESIGNINGDeveloping each structureof construction.
STEP 4: FINALISING THE STRUCTURE
Developing the design with the contractor.
Quality Assurance of contractor’s design.
Site supervision.
STEP 1:PROJECT SCOPE
Project and construction management, structural
engineering, cost estimation, quantity survey and energy calculations.
The four steps in the model show how the multi-disciplinary team contributed to the optimisation of the final design of the Helsinki Central Library, while keeping costs down.
Through design optimisation, Ramboll developed the truss bridge further into a twin arch structure (model with blue arches above). This lowered the cost of construction and widened the indoor space in the library.The position of the arches and other steel structures was developed in close co-operation with the architectural team.
Spread, A4 brochure
PROCESS WORK FLOW
Data collection Gap analysis design premises Hazid study Integrity
re-assesmentIs integrity acceptable
Integrrity management plan and
recommendations
Update pipeline management system
Initiate integrity management plan and
recommendations
Decommision at the end of design life Identify modifications
Phase 1 Phase 2
Phase 3
NoYes
No Modifications feasible
Powerpoint slide
22
INSPIRATION DESIGN GUIDELINES – CREATING INFOGRAPHICS WITH IMPACT
6.5 Examples – StorytellingHow to use infographics
UOPOISF OIS FIOUS IUS OUISGHIOS SI
Cities all over the world are starting to look at light rail to relieve road congestion and improve liveability. Why? Because light rail systems meet some of the key requirements for today’s rapidly growing cities:
• It’s electric! Electrically powered light rail systems can be equipped to run exclusively on renewable energy sources, thereby lightening the city’s carbon footprint.
• Zero local emissions Unlike petrol- or diesel-powered vehicles, electrically powered light rail systems do not emit particles that pollute the air.
• High capacity and space efficiency Light rail is highly scalable to local capacity needs and generally provides a high quality as well as capacity compared to buses – thus being a real alternative to the private car.
• The rail effect Light rail is a comfortable way to travel. Experience shows that people tend to prefer light rail over buses even in cases where there is no significant difference in travel time.
• Enabler for urban growth Light rail and metro projects around the world have shown that permanent rail-based infrastructure potentially attracts long-term investments and influences patterns of settlement in a fundamental way.
54 ENABLING LIGHT RAIL SOLUTIONSRAMBOLL
Today’s rapidly growing cities call for cost-effective, reliable and sustainable public transport solutions. And as a high capacity electrically powered transport system – that has also proven to act as a powerful enabler for urban growth – light rail seems to offer a desirable solution to these requirements in a wide range of cities around the world.
While a bus line can be changed or closed down, a rail-based transport system provides a permanent infrastructure that can attract long-term investments and influence patterns of settlement in a substantial way. In fact, Nordic cities such as Malmö, Lund, Helsingborg, Tampere, Turku, Stavanger, Copenhagen, Odense and Aarhus are all developing or considering light rail as part of urban development plans.
The light rail renaissanceWhile Germany still has one of the highest densities of tramway and light rail systems worldwide – counting 59 systems in total – light rail is becoming increasingly popular in particularly the Nordic countries. Several Norwegian and Swedish cities have already introduced light rail transportation, and cities such as Stockholm, Gothenburg, Norrköping, Helsinki, Bergen, Trondheim and Oslo are currently studying and conducting network extensions.
In France, like in many other countries in Europe, tramways had almost vanished from the streets by the late 1960s and were replaced by buses or underground metro systems. This changed with the introduction of tramways in cities such as Strasbourg, where one of the first new French light rail systems (called tramway in France) opened in 1994. Paris, Lyon, Nice, Rouen, Montpellier, Bordeaux and many others followed suit in developing modern tramway systems.
Since then, a veritable light rail ‘renaissance’ has spread to a large number of cities in France, in the UK, Ireland, Spain and Portugal. San Diego, California pioneered the re-introduction of light rail in the United States, with the first services of the San Diego Trolley operating in July 1981 initially with LRVs similar to those used in Frankfurt, Germany.
Following this spark, the US, Canada and Australia have recently introduced light rail in numerous metropolitan areas including Portland, Seattle, Phoenix, Minneapolis, Edmonton, Calgary, Melbourne, Sydney, Adelaide and the Gold Coast.
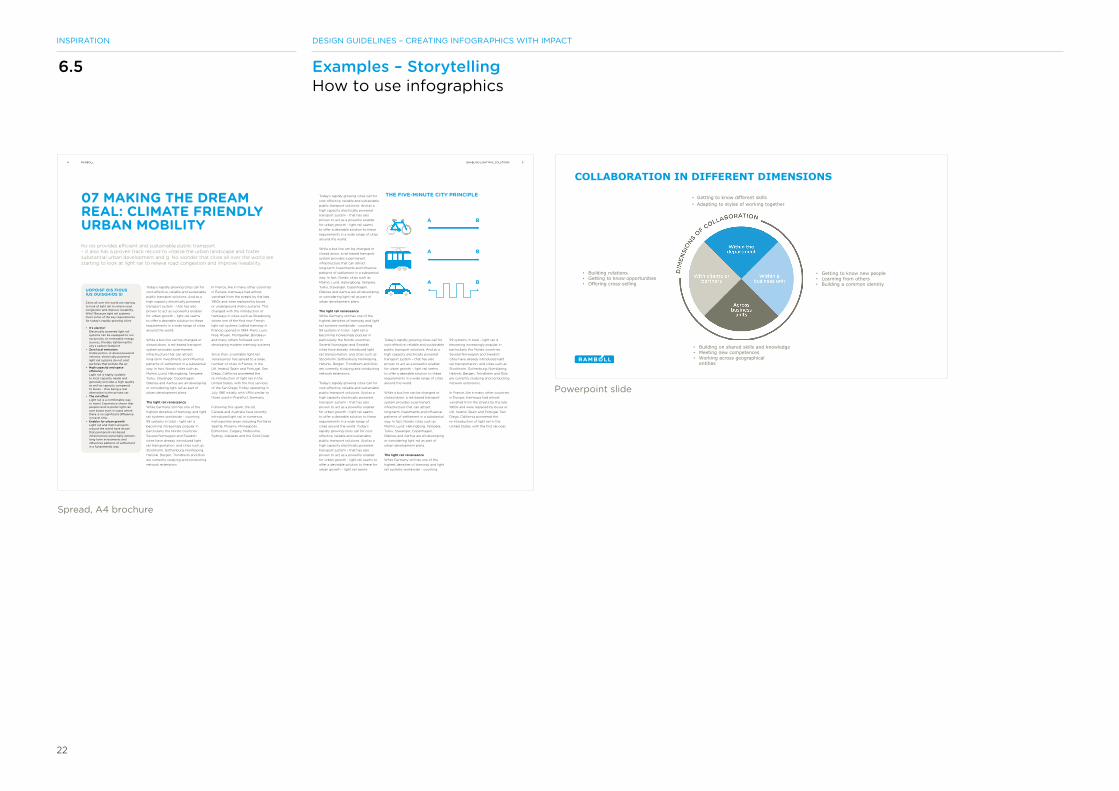
07 MAKING THE DREAM REAL: CLIMATE FRIENDLY URBAN MOBILITYKo ois provides efficient and sustainable public transport – it also has a proven track record to vitalise the urban landscape and foster substantial urban development and g. No wonder that cities all over the world are starting to look at light rail to relieve road congestion and improve liveability.
THE FIVE-MINUTE CITY PRINCIPLE
A B
A B
A B
Today’s rapidly growing cities call for cost-effective, reliable and sustainable public transport solutions. And as a high capacity electrically powered transport system – that has also proven to act as a powerful enabler for urban growth – light rail seems to offer a desirable solution to these requirements in a wide range of cities around the world.
While a bus line can be changed or closed down, a rail-based transport system provides a permanent infrastructure that can attract long-term investments and influence patterns of settlement in a substantial way. In fact, Nordic cities such as Malmö, Lund, Helsingborg, Tampere, Turku, Stavanger, Copenhagen, Odense and Aarhus are all developing or considering light rail as part of urban development plans.
The light rail renaissanceWhile Germany still has one of the highest densities of tramway and light rail systems worldwide – counting
Today’s rapidly growing cities call for cost-effective, reliable and sustainable public transport solutions. And as a high capacity electrically powered transport system – that has also proven to act as a powerful enabler for urban growth – light rail seems to offer a desirable solution to these requirements in a wide range of cities around the world.
While a bus line can be changed or closed down, a rail-based transport system provides a permanent infrastructure that can attract long-term investments and influence patterns of settlement in a substantial way. In fact, Nordic cities such as Malmö, Lund, Helsingborg, Tampere, Turku, Stavanger, Copenhagen, Odense and Aarhus are all developing or considering light rail as part of urban development plans.
The light rail renaissanceWhile Germany still has one of the highest densities of tramway and light rail systems worldwide – counting 59 systems in total – light rail is becoming increasingly popular in particularly the Nordic countries. Several Norwegian and Swedish cities have already introduced light rail transportation, and cities such as Stockholm, Gothenburg, Norrköping, Helsinki, Bergen, Trondheim and Oslo are currently studying and conducting network extensions.
Today’s rapidly growing cities call for cost-effective, reliable and sustainable public transport solutions. And as a high capacity electrically powered transport system – that has also proven to act as a powerful enabler for urban growth – light rail seems to offer a desirable solution to these requirements in a wide range of cities around the world. Today’s rapidly growing cities call for cost-effective, reliable and sustainable public transport solutions. And as a high capacity electrically powered transport system – that has also proven to act as a powerful enabler for urban growth – light rail seems to offer a desirable solution to these for urban growth – light rail seems
59 systems in total – light rail is becoming increasingly popular in particularly the Nordic countries. Several Norwegian and Swedish cities have already introduced light rail transportation, and cities such as Stockholm, Gothenburg, Norrköping, Helsinki, Bergen, Trondheim and Oslo are currently studying and conducting network extensions.
In France, like in many other countries in Europe, tramways had almost vanished from the streets by the late 1960s and were replaced by buses or UK, Ireland, Spain and Portugal. San Diego, California pioneered the re-introduction of light rail in the United States, with the first services
Spread, A4 brochure
• Getting to know different skills• Adapting to styles of working together
• Building relations• Getting to know opportunities• Offering cross-selling
• Getting to know new people• Learning from others• Building a common identity
• Building on shared skills and knowledge• Meeting new competences• Working across geographical
entities
COLLABORATION IN DIFFERENT DIMENSIONS
Powerpoint slide

23
INSPIRATION DESIGN GUIDELINES – CREATING INFOGRAPHICS WITH IMPACT
6.6 Examples – StorytellingHow to use infographics
URBAN TREES Tree oxes control
to gardens and help to filter and
URBAN GARDENS
Impurities are removed through filtration, sedimentation and biological absorbtion. They reduce flow speed and encourage infiltration while beautifying landscapes.
URBAN VEGETATED WATERBODIESUrban arks and egetated e urban beauty, control erosion and regulate water flow and sedimentation.
01
02
03
01 02 03