design, fabrication, and testing of a pdms micropump …
TRANSCRIPT

Virginia Commonwealth University Virginia Commonwealth University
VCU Scholars Compass VCU Scholars Compass
Theses and Dissertations Graduate School
2012
DESIGN, FABRICATION, AND TESTING OF A PDMS MICROPUMP DESIGN, FABRICATION, AND TESTING OF A PDMS MICROPUMP
WITH MOVING MEMBRANES WITH MOVING MEMBRANES
Charles Cartin Virginia Commonwealth University
Follow this and additional works at: https://scholarscompass.vcu.edu/etd
Part of the Engineering Commons
© The Author
Downloaded from Downloaded from https://scholarscompass.vcu.edu/etd/2742
This Dissertation is brought to you for free and open access by the Graduate School at VCU Scholars Compass. It has been accepted for inclusion in Theses and Dissertations by an authorized administrator of VCU Scholars Compass. For more information, please contact [email protected].

© CHARLES P. CARTIN 2012
All Rights Reserved
DESIGN, FABRICATION, AND TESTING OF A PDMS MICROPUMP WITH MOVING
MEMBRANES
A PhD Dissertation submitted in partial fulfillment of the requirements for the degree of Doctor
of Philosophy in Engineering at Virginia Commonwealth University
By
CHARLES P. CARTIN
M.S.M.E., Virginia Commonwealth University School of Engineering, 2007
B.S.M.E., Virginia Commonwealth University School of Engineering, 2006
Advisor/Director: Ramana M. Pidaparti, Ph.D.
Professor, Department of Mechanical Engineering
Virginia Commonwealth University
Richmond, Virginia
May 2012

ii
Acknowledgement
I would like to extend a heartfelt thank you to my advisor Dr. Ramana M. Pidaparti.
Over the past four years Dr. Pidaparti gracefully provided me tremendous support,
encouragement, mentorship, and guidance throughout my career as a graduate student. His
knowledge and experience allowed me to complete my goals and make my dissertation a reality.
Dr. Pidaparti has always encouraged me to attend conferences and student competitions where I
was allowed to display my research progress. Throughout the time I have been a graduate
student he has given me many opportunities to work on several research projects allowing my
skills as a researcher to grow and expand drastically. I truly cannot thank Dr. Pidaparti enough
for his never-ending support and guidance throughout the years.
I would also like to thank my committee members, Dr. P. Worth Longest, Dr. Gary M.
Atkinson, Dr. Karla M. Mossi, and Dr. Everett Carpenter. Dr. Longest and Dr. Atkinson
provided collaboration efforts on this project which in turn allowed the final realization of this
interesting and challenging concept. Dr. Longest provided the conceptual fluid theories that
assisted in the overall design of the micropump. His vast knowledge of computational fluid
dynamics provided me with a valuable asset and resource. Dr. Atkinson provided his expertise
and experience within the microfabrication laboratory at VCU to help develop and show the
ways to successfully produce the device. Secondly, I would like to thank Dr. Mossi for her
support, encouragement, and correspondence throughout my years at VCU. She has provided
me great knowledge not only in my research, but in my career as an educator. Lastly, Dr.
Carpenter provided interesting details concerning the characteristics of PDMS and possible
actuation methods to successfully drive the micropump.

iii
I also want to extend a special thank you to all of my colleagues within the Mechanical
Engineering Department. These range from all of the graduate students to the faculty. I had the
opportunity while at VCU to work on both sides of the spectrum, graduate student and faculty
member. This was a valuable learning experience, because I have learned so much from
everyone.
Lastly, I would like to thank my father and wife. My father has been there since the
beginning, never losing faith or hope in me. He always has been there to support me in my
endeavors and to push me when I had doubts. He gave me great guidance and encouragement to
keep moving ahead and progressing in a positive direction. My wife has been supportive
throughout my graduate career and has maintained patience, support, and strength. I must admit
that without them, I probably would not have accomplished what I have done thus far in my life.
iv
Table of Contents
Acknowledgement .................................................................................................................ii
List of Figures ........................................................................................................................viii
List of Tables .........................................................................................................................xiii
Abstract ..................................................................................................................................xiv
CHAPTER 1 Introduction .....................................................................................................1
1.1 Motivation ..................................................................................................................1
1.2 Background of Micropumps ......................................................................................3
1.3 Materials Utilized in Microfluidic Devices ...............................................................5
1.4 PDMS in Microfluidic Systems: Rapid Prototyping .................................................6
1.5 PDMS Surface Chemistry and Sealing Techniques...................................................8
1.5.1 Irreversible Sealing ...........................................................................................8
1.5.2 Reversible Sealing ............................................................................................9
1.6 Three Dimensional Fabrication of PDMS .................................................................9
1.6.1 Two-Level Lithography ....................................................................................10
1.6.2 Membrane Sandwich Method ...........................................................................10
1.6.3 Solid-Object Printing for PDMS Devices .........................................................13
1.7 Interfacing of PDMS Microfluidic Devices ...............................................................14
1.8 Advantages and Disadvantages of PDMS .................................................................15
1.9 Specific Objectives ....................................................................................................16
CHAPTER 2 Literature Review of Micropump Technologies..............................................17
2.1 Introduction ................................................................................................................17
2.1.1 Displacement Micropumps ...............................................................................19
2.1.2 Dynamic (Continuous) Flow Micropumps .......................................................21
2.2 Early Research of Reciprocating Micropumps ..........................................................21
2.3 Principles of Actuation ..............................................................................................25
2.3.1 Piezoelectric Actuation .....................................................................................25
2.3.2 Thermopneumatic Actuation ............................................................................26
2.3.3 Electrostatic Actuation ......................................................................................28

v
2.3.4 Electromagnetic Actuation................................................................................30
2.4 Valve Design (Flow Rectification) ............................................................................32
2.5 Dosing (Operating Properties) ...................................................................................39
2.6 Materials and Fabrication Technologies ....................................................................43
2.7 Continuous Flow Micropumps ..................................................................................45
2.8 Viscous Flow Micropumps ........................................................................................50
2.9 Micropumps and Micro-Total Analysis Systems ......................................................59
2.10 Conclusions ..............................................................................................................61
CHAPTER 3 Fabrication and Manufacturing Methods.........................................................65
3.1 Overview of PDMS Micropump Design ...................................................................65
3.2 PDMS Micropump Fabrication Method I – VMC Cleanroom MEMS Process ........71
3.2.1 Fabrication and Manufacturing of an Electrostatic Actuated Micropump .......71
3.2.1.1 Overview of the Electrostatic Actuation PDMS Micropump ..................72
3.2.1.2 PDMS Micropump with Electrostatic Actuation Fabrication Process ....73
3.2.1.3 Photo Mask (IC Station) Method .............................................................73
3.2.1.4 Wafer Identification and Cleaning ...........................................................76
3.2.1.5 SU-8 Negative Photoresist Application ...................................................76
3.2.1.6 Diffusion Lithography .............................................................................77
3.2.1.7 Dispensing of PDMS Material .................................................................79
3.2.1.8 Removal of PDMS from Mold ................................................................80
3.2.1.9 Metallization of PDMS ............................................................................81
3.2.1.10 Metallization of Glass Wafer .................................................................83
3.2.1.10.1 SPR-3012 Resist Application .......................................................83
3.2.1.10.2 Diffusion Lithography ..................................................................84
3.2.1.10.3 Metallization of Glass Wafer ........................................................84
3.2.1.11 Bonding of Structures ............................................................................86
3.2.2 Top Actuation Micropumps ..............................................................................87
3.2.2.1 Wafer Identification and Cleaning ...........................................................87
3.2.2.2 SU-8 Negative Photoresist Application ...................................................87
3.2.2.3 Diffusion Lithography .............................................................................88
3.2.2.4 PDMS Pouring .........................................................................................90
vi
3.3 PDMS Micropump Fabrication Method II Rapid-Prototyping ..................................91
3.4 Magnetic Actuation Fabrication ................................................................................99
3.4.1 Introduction to Magnetism ................................................................................99
3.4.2 Magnetic Dipoles ..............................................................................................100
3.4.3 Magnetic Field Vectors .....................................................................................101
3.4.4 Origins of Magnetic Moments ..........................................................................105
3.4.5 Magnetic Actuation PDMS Micropump ...........................................................107
3.4.6 Magnetic Force .................................................................................................108
3.5 Piezoelectric Actuation ..............................................................................................111
3.6 PDMS Mixing and Curing Process ............................................................................112
3.7 Sealing PDMS to a Substrate .....................................................................................117
3.8 Conclusions ................................................................................................................121
CHAPTER 4 Testing and Characterization ...........................................................................122
4.1 Introduction to the Types of Testing ..........................................................................122
4.2 Electrostatic Actuation ...............................................................................................122
4.3 Piezoelectric Actuation ..............................................................................................124
4.4 Magnetic Actuation ....................................................................................................127
4.5 Mechanical Motor Actuation .....................................................................................130
4.6 Pressurized Inlet Flow Characterization ....................................................................138
4.7 Statistical Results and Discussion ..............................................................................142
4.7.1 Theoretical Testing to Compare Experimental .................................................142
4.7.1.1 Micropump Design Concept ....................................................................142
4.7.1.2 Computational Methods ...........................................................................142
4.7.1.3 CFD Analysis ...........................................................................................144
4.7.1.4 Actuator Motion .......................................................................................146
4.7.1.5 Fluent Theoretical Results of Micropump ...............................................147
4.7.2 Statistical Comparison of Previous Study.........................................................152
4.8 Results and Discussion ..............................................................................................154
4.9 Conclusions ................................................................................................................156
CHAPTER 5 Conclusions......................................................................................................157
5.1 Conclusions ................................................................................................................157

vii
5.1.1 Design Concept .................................................................................................158
5.1.2 Fabrication Methods .........................................................................................158
5.1.3 PDMS Mixing, Curing, and Degassing ............................................................159
5.1.4 PDMS Sealing ...................................................................................................160
5.1.5 Electrostatic Actuation ......................................................................................161
5.1.6 Piezoelectric Actuation .....................................................................................162
5.1.7 Magnetic Actuation ...........................................................................................163
5.1.8 Mechanical Actuation .......................................................................................164
5.1.9 Pressure Actuation ............................................................................................166
5.1.10 Overall Conclusions ........................................................................................166
5.2 Summarization of Objectives .....................................................................................167
5.3 Research Contributions ..............................................................................................168
5.4 Recommendations and Future Work .........................................................................170
References ..............................................................................................................................180
Vita .........................................................................................................................................188
viii
List of Figures
Figure 1.1 2-D PDMS Chemical Structure ............................................................................1
Figure 1.2 3-D PDMS Chemical Structure ............................................................................1
Figure 1.3 Schemes for Rapid Prototyping ............................................................................6
Figure 1.4 Membrane Sandwich Method...............................................................................12
Figure 2.1 Current Micropump Classification .......................................................................18
Figure 2.2 Configuration of piston-type micropumps ...........................................................19
Figure 2.3 Structure and Operation of reciprocating pump ...................................................19
Figure 2.4 Schematic of Graphosoma Lineatum Saliva Dispensing Micropump .................21
Figure 2.5 Diagram of Cross-sectional cutaway of a micro-diaphragm pump ......................22
Figure 2.6 Planar Peristaltic micropump ...............................................................................23
Figure 2.7 Microdiaphragm pump that utilized piezoelectric actuation ................................24
Figure 2.8 Thermopneumatic Micropump Actuation ............................................................27
Figure 2.9 Electrostatic actuation principle for micropumps .................................................28
Figure 2.10 Electromagnetic micropump ..............................................................................31
Figure 2.11 Valveless micropump actuated with piezoelectric material ...............................34
Figure 2.12 Schematic diagram of pump chamber ................................................................35
Figure 2.13 Residing time, average mass flow rate versus the actuating frequency of the
micropump ..........................................................................................................36
Figure 2.14 Power required, average mass flow rate versus the actuating frequency of the
micropump ..........................................................................................................38
Figure 2.15 Typical Dosing Rates of a Micropump Diaphragm Pump .................................39
Figure 2.16 Typical Dosing Rates of a micropump diaphragm pump ...................................39
Figure 2.17 Self-priming and bubble-tolerant silicon microdiaphragm pump ......................42
Figure 2.18 EHD Micropump ................................................................................................46
Figure 2.19 Electrokinetic Micropump ..................................................................................47
Figure 2.20 Electrochemical Displacement Micropump .......................................................49
Figure 2.21 External and Internal Views of the Single-Disk Viscous Pump .........................52
Figure 2.22 Configuration of the Single-Disk Viscous Pump ...............................................52
ix
Figure 2.23 Top view of the Single-Disk...............................................................................52
Figure 3.1 Three-wall Micropump Concept ..........................................................................65
Figure 3.2 Fluid Velocity of Four Wall Micropump .............................................................65
Figure 3.3 Fluid Velocity Plot ...............................................................................................66
Figure 3.4 Fluid Vector Plot ..................................................................................................67
Figure 3.5 PDMS Micropump ...............................................................................................67
Figure 3.6 Dimensions of PDMS Micropump .......................................................................68
Figure 3.7 Dimensions of Micropump Mold .........................................................................70
Figure 3.8 Proposed Micropump Design with Nozzle/Diffuser Elements ............................72
Figure 3.9 IC Station Software depicting Electrostatic PDMS Micropump ..........................74
Figure 3.10 Photomask generator in VMC Cleanroom .........................................................74
Figure 3.11 Photomask generated for PDMS application .....................................................75
Figure 3.12 Photomask generated and created for Electrostatic Connections .......................75
Figure 3.13 SU-8 Negative Photoresist Application..............................................................77
Figure 3.14 Contact Lithography of SU-8 Negative Photoresist Application .......................78
Figure 3.15 Application of PDMS to photoresist mold .........................................................79
Figure 3.16 PDMS Removal ..................................................................................................80
Figure 3.17 PDMS Micropump Removed .............................................................................81
Figure 3.18 VMC Cleanroom Evaporator for Metallization .................................................82
Figure 3.19 Metallization of PDMS.......................................................................................82
Figure 3.20 Shadow Mask to Metalize the PDMS Material ..................................................83
Figure 3.21 Metal Connection Pattern in SPR3012 Photoresist ............................................84
Figure 3.22 Metallization of Connection Pattern in SPR3012 Photoresist ............................85
Figure 3.23 Metal Connections on Glass Wafer ....................................................................85
Figure 3.24 Bonding of Both Wafers .....................................................................................86
Figure 3.25 Complete Fabricated Electrostatic Actuated PDMS Micropump ......................86
Figure 3.26 Wafer Identification and Cleaning .....................................................................87
Figure 3.27 SU-8 Negative Photoresist Application..............................................................88
Figure 3.28 Diffusion Lithography ........................................................................................89
Figure 3.29 Pouring of PDMS ...............................................................................................90
Figure 3.30 SolidWorks Rendition of Micropump ................................................................94
x
Figure 3.31 SolidWorks Completed Micropump Mold .........................................................95
Figure 3.32 Stereolithography (SLA) Rapid Prototyping Machine .......................................96
Figure 3.33 Rapid Prototyped PDMS Micropump Mold ......................................................97
Figure 3.34 Removing PDMS from Mold .............................................................................97
Figure 3.35 PDMS Completely Removed from Mold ...........................................................98
Figure 3.36 Magnetic Field Lines around a current loop and bar magnet .............................100
Figure 3.37 Magnetic Moment designated by arrow .............................................................101
Figure 3.38 The magnetic flux density B is equal to µH .......................................................102
Figure 3.39 The magnetic field H created within a vacuum related by turns N ....................103
Figure 3.40 Magnetic Moment of an orbiting electron ..........................................................105
Figure 3.41 Magnetic moment associated with a spinning electron ......................................106
Figure 3.42 Fe2B Particulates ................................................................................................107
Figure 3.43 PDMS Magnetic Fabricated Micropump ...........................................................108
Figure 3.44 Randomly Oriented Fe2B in PDMS ...................................................................109
Figure 3.45 External magnetic field applied to PDMS/ Fe2B Mixture ..................................109
Figure 3.46 Piezoelectric Adhered to PDMS Micropump .....................................................111
Figure 3.47 PDMS Micropumps with Piezoelectric Material affixed ...................................111
Figure 3.48 PDMS Base and Cure with Microparticles ........................................................112
Figure 3.49 Procedure for Mixing PDMS..............................................................................113
Figure 3.50 Removal of Air Bubbles from PDMS ................................................................114
Figure 3.51 PDMS Baking and Removal ..............................................................................115
Figure 3.52 Nikon Imaging Microscope ................................................................................116
Figure 3.53 Images obtained from Nikon Imaging Microscope ............................................116
Figure 3.54 Piranha Etch Materials .......................................................................................117
Figure 3.55 Cleaning Procedure Two ....................................................................................118
Figure 3.56 Oxygen-Plasma Recipe for PDMS Sealing ........................................................119
Figure 3.57 Plasmalab 80 Plus utilized for Sealing PDMS ...................................................119
Figure 3.58 Pressing and Sealing PDMS to PDMS after Oxygen Plasma Treatment ...........120
Figure 3.59 PDMS Sealed to Glass........................................................................................120
Figure 4.1 Complete Fabricated Electrostatic PDMS Micropump ........................................123
Figure 4.2 Piezoelectric Testing Setup ..................................................................................125
xi
Figure 4.3 Piezoelectric PZT and PVDF Testing Setup ........................................................126
Figure 4.4 MFC Piezoelectric ................................................................................................127
Figure 4.5 Magnetic PDMS Pump prior to Magnet Application (side view) ........................128
Figure 4.6 Permanent Magnet Attraction...............................................................................129
Figure 4.7 Permanent Magnet Attraction Complete ..............................................................129
Figure 4.8 Magnetic Micropump Sealed to Substrate ...........................................................130
Figure 4.9 Mechanical Actuation test setup for the micropump performance evaluation .....130
Figure 4.10 Flow Rate versus SPM of the micropump performance ....................................133
Figure 4.11 Flow rate versus fluid viscosity of the micropump performance .......................133
Figure 4.12 The time taken for beads to flow through the micropump with actuation .........134
Figure 4.13 Flow rate versus the location of the actuator for optimum performance of the
micropump ..........................................................................................................135
Figure 4.14 Fabricated Micropumps ......................................................................................137
Figure 4.15 Pressure Test Setup for the micropump flow evaluation....................................138
Figure 4.16 Pressure rate versus Flow Rate of the micropump for Pressure Performance (Large
Pump) .................................................................................................................139
Figure 4.17 Pressure rate versus Flow Rate of the micropump for Pressure Performance (Medium
Pump) .................................................................................................................140
Figure 4.18 Pressure rate versus Flow Rate of the micropump for Pressure Performance (Small
Pump) .................................................................................................................141
Figure 4.19 SolidWorks Micropump Rendering ...................................................................143
Figure 4.20 Mesh of Micropump ...........................................................................................144
Figure 4.21 Micropump Actuated at 4.167 Hz ......................................................................147
Figure 4.22 Micropump Actuated at 8.33 Hz ........................................................................147
Figure 4.23 Micropump Actuated at 12.5 Hz ........................................................................148
Figure 4.24 Micropump Actuated at 16.67 Hz ......................................................................148
Figure 4.25 Micropump Actuated at 20.83 Hz ......................................................................149
Figure 4.26 Volumetric Flow Rate vs. Frequency .................................................................149
Figure 4.27 Flow Rate vs. Frequency ....................................................................................150
Figure 4.28 Mass Flow Rate vs. Frequency ...........................................................................150
Figure 4.29 Frequency vs. Flow Rate Comparison of Theoretical and Experimental ...........151
xii
Figure 4.30 Frequency vs. Flow Rate of Theoretical and Experimental ...............................153
Figure 5.1 Design Concept of 3-Dimensional Micropump ...................................................171
Figure 5.2 Meshed Symmetric 3D-Micropump .....................................................................172
Figure 5.3 Total Deformation with applied Load at First Wall (Left most) ..........................173
Figure 5.4 Total Stress experienced under applied Load at First Wall (Left Most) ..............173
Figure 5.5 Total Deformation with applied Load at Second Wall (Middle) .........................174
Figure 5.6 Total Stress experienced under applied Load at Second Wall (Middle) ..............174
Figure 5.7 Total Deformation with applied Load at Third Wall (Right Most) ......................175
Figure 5.8 Total Stress experienced under applied Load Third Wall ....................................175
Figure 5.9 Total Deformation with applied Load on all walls ...............................................176
Figure 5.10 Total Stress with applied Load on all walls........................................................176
Figure 5.11 Three-Dimensional Mesh of Micropump ...........................................................177
Figure 5.12 Fluid Flow Results of 3D pump .........................................................................178
Figure 5.13 Fluid Flow Results of 3D Pump (side view) ......................................................178
Figure 5.14 Three-dimensional micropump Fabricated.........................................................179
Figure 5.15 Three-dimensional micropump Fabricated.........................................................179

xiii
List of Tables
Table 4.1 Reynolds Number for Fluids Tested ......................................................................131
Table 4.2 Frequencies of Mechanical Actuator .....................................................................132
xiv
Abstract
DESIGN, FABRICATION, AND TESTING OF A PDMS MICROPUMP WITH MOVING
MEMBRANES
By: Charles P. Cartin, M.S.M.E.
A Dissertation submitted in partial fulfillment of the requirements for the degree of Doctor of
Philosophy in Engineering at Virginia Commonwealth University.
Virginia Commonwealth University, 2012
Advisor/Director: Ramana M. Pidaparti, Ph.D.
Professor, Department of Mechanical Engineering
This dissertation will discuss the design, fabrication, and testing of a
Poly(dimethylsiloxane) (PDMS) microfluidic pump. PDMS is commonly described as a soft
polymer with very appealing chemical and physical properties such as optical transparency, low
permeability to water, elasticity, low electrical conductivity, and flexible surface chemistry.
PDMS microfluidic device fabrication is done easily with the use of soft lithography and rapid
prototyping. PDMS microfluidic devices make it easier to integrate components and interface
devices with particular users, than using typically harder materials such as glass and silicon.
Fabrication and design of single and multilayer PDMS microfluidic devices is much easier and
straightforward than traditional methods.
A novel design of a PDMS micropump with multiple vibrating membranes has been
developed for application in drug delivery and molecule sorting. The PDMS micropump
consists of three nozzle/diffuser elements with vibrating membranes, which are used to create
xv
pressure difference in the pump chamber. Preliminary analysis of the fluidic characteristics of
the micropump was analyzed with ANSYS to investigate the transient responses of fluid
velocity, pressure distributions, and flow rate during the operating cycle of the micropump.
The design simulation results showed that the movement of the wall membranes
combined with rectification behavior of three nozzle/diffuser elements can minimize back flow
and improve net flow in one direction. To prove that the theoretical design is valid, the
fabrication and testing process of the micropump has been carried out and completed. This paper
will discuss in depth the design, fabrication, and testing of the PDMS micropump.
1
CHAPTER 1 Introduction
1.1: Motivation
Microfluidic systems have proved highly successful in biomedical applications by
minimizing the size of electrophoresis chips, drug delivery systems, microfluidic mixers, pumps
and valves, devices for cell or protein patterning, and microfluidic switches [1]. Specifically a
PDMS pump is a device that is optimized for rapid prototyping and has proven to be a good
material for microfluidic pump devices. First, one must know what PDMS means. PDMS
stands for Polydimethylsiloxane and is most widely used as a silicon-based organic polymer. It
is known for its unusual flow characteristics (rheological properties). The material is usually
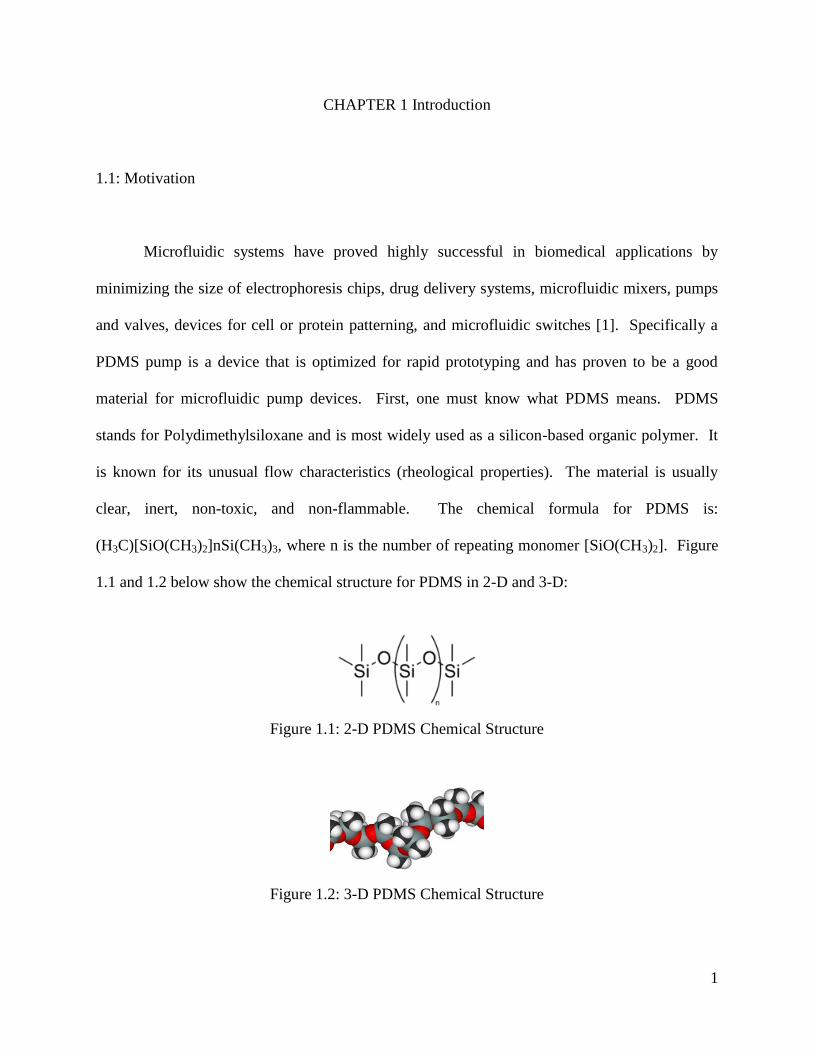
clear, inert, non-toxic, and non-flammable. The chemical formula for PDMS is:
(H3C)[SiO(CH3)2]nSi(CH3)3, where n is the number of repeating monomer [SiO(CH3)2]. Figure
1.1 and 1.2 below show the chemical structure for PDMS in 2-D and 3-D:
Figure 1.1: 2-D PDMS Chemical Structure
Figure 1.2: 3-D PDMS Chemical Structure
2
PDMS has mechanical properties that make it suitable for microelectromechanical
systems (MEMS). These properties occur at high and low temperatures of the PDMS material.
At high temperatures the PDMS material is viscoelastic (i.e., having long flow rates). An
analogy for how this material reacts at high temperatures can be compared to honey being
poured into a glass. On the other side of the spectrum, as PDMS experiences lower temperatures
it becomes an elastic solid (i.e., having short flow rates). This can be compared to rubber
material, such as a rubber ball.
PDMS material could be applied to several types of microfluidic devices such as mixers,
filters, channels, reactors, extractors, valves, flow sensors, droplets, and pumps. These types of
microfluidic devices can be applied to environmental scanning and monitoring, microreactors
and mixers, filtering, inkjet printing, chemical analysis and sensing, molecular separation,
biological sensing (in-vitro or in-vivo), and DNA analysis (amplification, sequencing, and
synthesis). The benefits of such microfluidic devices are smaller sizes, better performance,
reduction in power consumption, lowers costs, disposability, integration of control electronics,
and the new functionality and reaction possibilities. These types of microfluidic devices have
several characteristics and have flow that is generally laminar. They deal with smaller volumes
of fluid, which results in higher precision of mixing and is safer to use with toxic and hazardous
chemicals. Also these devices have high surface to volume ratio that results in efficient and
effective heating and cooling, as well as fast and complete reaction with the surface.
3
1.2: Background of Micropumps
Silicon and glass-based microelectromechanical systems (MEMS) are slowly being
replaced by polymer microfabrication methods. Presently limitations in the silicon and glass
processing methods are becoming more relevant due to newer and more complex fabrication
procedures, geometrical design restrictions, and escalating costs involved in reaching the goal of
the finished product [1]. Polymers provide a wider range of material characteristics biochemical
compatibility, ease of processing and prototyping, and lower cost [1]. Polymers are less expense
and easier to fabricate than silicon based substrates [2]. Microfluidic systems have proved highly
successful in biomedical applications by minimizing the size of electrophoresis chips, drug
delivery systems, microfluidic mixers, pumps and valves, devices for cell or protein patterning,
and microfluidic switches [1]. Advantages of microfluidics are enormous, while possessing very
few disadvantages. The field of microfluidics has four parents: molecular analysis, biodefense,
molecular biology and microelectronics [3]. Scientific investigations into the development of
fluidic devices have increased due to the ability to create structures and patterns on micron and
smaller length scales [2]. Development of new fluidic devices to transport, store, and manage
very small quantity of fluids has found increased applications in the fields of chemistry, biology,
and medicine [2].
Life science and materials communities are being rapidly drawn to microfluidic
technology. Currently many of these communities do not have the proper access to these new
revolutionary microfluidic chips and microfabrication facilities, which hinders their ability to
explore new polydimethlysiloxane (PDMS) technology in microfluidic devices, thus limiting
their contribution to the growth of the microfluidic field [4]. As a way to improve access to
4
PDMS microfluidic chips and facilities, studies are being conducted to eliminate the need for
cleanrooms, while at the same time producing higher quality microfluidic systems [4].
Experimentation with polydimethylsiloxane (PDMS) has provided varying properties that
are readily adaptable in microfluidic devices. Such devices far exceed those of known
“benchtop” systems and provide a range of plausible advantages. Advantages associated with the
PDMS include operating systems size reduction, faster analytical and probability data, savings in
the form of power reductions, broader design flexibility, and decrease in harmful byproducts.
Microfluidic device design and functionality hinge on the type of materials chosen for the design
and the manner in which the device will be fabricated [5]. When considering a microfluidic
device the material chosen should be compatible with sensitive methods of detection, enable easy
interfacing with the user, and allow integration of functional components [5]. As the need for
microfluidic devices increases and the necessity for fabrication for such devices become
imperative to attract the interest of industry and scientific communities, the cost efficiency of
such materials and the increasing ease of production will result in cost saving strategies [6].
5
1.3: Materials Utilized in Microfluidic Devices
Microfluidic systems fabricated in silicon and glass were the earliest microfluidic
systems designed to take advantage of existing technology in microelectronics and
mircoelectromechanical systems (MEMS). Although silicon and glass are outstanding materials
for use in the fabrication of microfluidic devices, polymers are becoming advantageous and less
expensive requiring simpler manufacturing processes [5]. The use of polymers to fabricate
microfluidic devices has been expanded to include polydimethylsiloxane (PDMS) [2]. Because
polymers have different physical and chemical property ranges than do silicon and glass they are
more adaptable to specific applications and polymers are more mechanically stronger than
silicon and glass [5].
PDMS, a soft polymer, is being developed for use in microfluidics. Soft polymers of this
caliber have advantages in the fabrication of MEMS devices. Soft lithography using elastomeric
polymer molding in PDMS devices allows for rapid prototyping of microfluidic devices [5].
Since polymer devices made of PDMS conforms to most materials and will conform uniformly
to smooth plastic or glass substrates, reversible and irreversible sealing are possible [5].
Transparency of PDMS allows compatibility with many optical detection methods because it is
unseen in the visible/UV region. PDMS channels are appropriate for cellular studies because
PDMS is nontoxic to proteins and cells and is gas-permeable [7].
6
1.4: PDMS in Microfluidic Systems: Rapid Prototyping
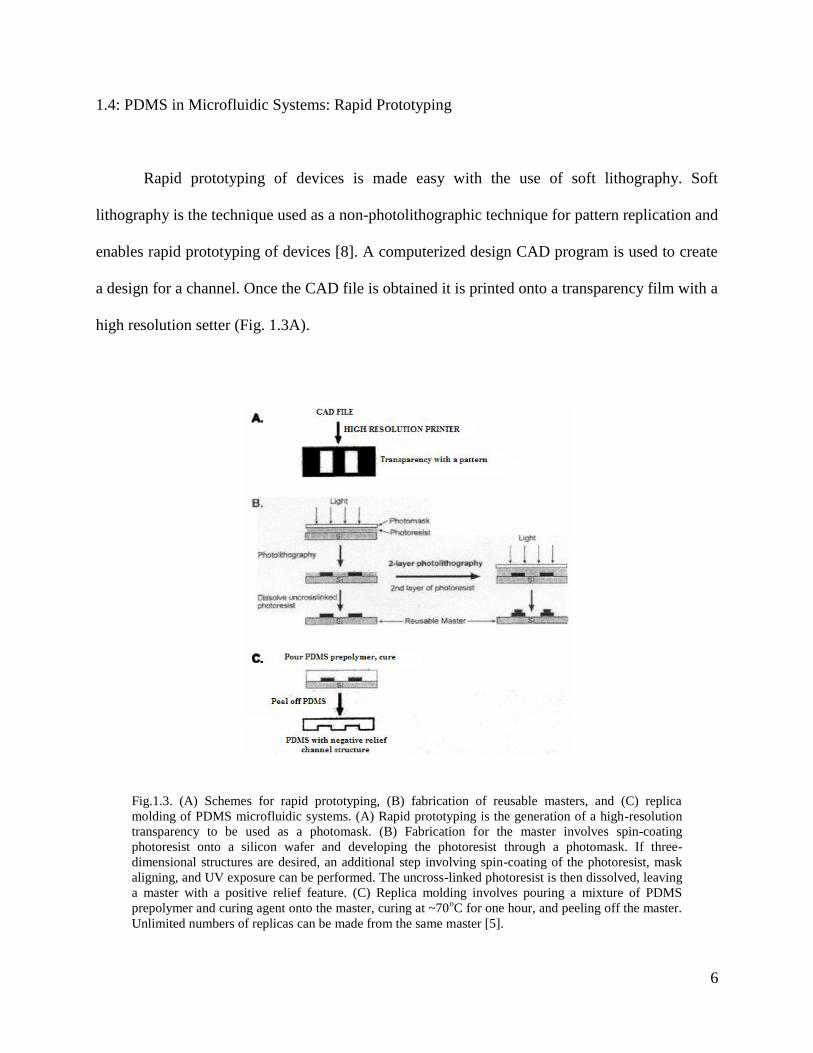
Rapid prototyping of devices is made easy with the use of soft lithography. Soft
lithography is the technique used as a non-photolithographic technique for pattern replication and
enables rapid prototyping of devices [8]. A computerized design CAD program is used to create
a design for a channel. Once the CAD file is obtained it is printed onto a transparency film with a
high resolution setter (Fig. 1.3A).
Fig.1.3. (A) Schemes for rapid prototyping, (B) fabrication of reusable masters, and (C) replica
molding of PDMS microfluidic systems. (A) Rapid prototyping is the generation of a high-resolution
transparency to be used as a photomask. (B) Fabrication for the master involves spin-coating
photoresist onto a silicon wafer and developing the photoresist through a photomask. If three-
dimensional structures are desired, an additional step involving spin-coating of the photoresist, mask
aligning, and UV exposure can be performed. The uncross-linked photoresist is then dissolved, leaving
a master with a positive relief feature. (C) Replica molding involves pouring a mixture of PDMS
prepolymer and curing agent onto the master, curing at ~70oC for one hour, and peeling off the master.
Unlimited numbers of replicas can be made from the same master [5].
7
The transparency film is then treated with a photo curable epoxy (SU-8) and exposed to
ultraviolet light to polymerize areas that are exposed. Once the dissolving effect of the
unpolymerized photoresist has been accomplished, a positive release of the reaction remains on
the wafer acting as a mold for future castings of PDMS channels. Multilayered structures of this
device can be accomplished by repeating the process for a two level photolithography, but
instead of dissolving the unpolymerized photoresist following its initial exposure, a second
photoresist layer is spun atop of first exposure. Following this step a second mask is setup in
alignment with the photoresist layers and then the second layer is polymerized, resulting in the
dissolution of the unpolymerized photoresist resulting in a multilayer channel structure. A silane
solution containing fluoride functional groups is then used to treat the surface of the master
fabricated wafer. The use of the silane prevents bonding between the PDMS and the silicon. A
negative relief of the original master structure is made in PDMS by replicating the molding (Fig.
1.3C). Replica molding involves pouring PDMS prepolymer over the master, curing the polymer
at 40-80oC for ~ 1 h, and peeling it off of the master. Channel inlets and outlets are drilled into
the PDMS using a borer (a small drill will do), and the channel is sealed (reversibly or
irreversibly) against a flat substrate [5], [9].
Expenses are reduced by using rapid prototyping and replica molding which reduces
future time required for designing, additional fabrication, and the necessary final testing of any
new channel configurations. Additional cost reductions equate to a lower overhead for operating
a microfluidics research program and the reduction in need for cleanroom and mask writers.
8
1.5: PDMS Surface Chemistry and Sealing Techniques
The chemical structure of PDMS is made up of repeating groups of –O-Si(CH3)2. Such a
chemical structure allows for a hydrophobic surface that is made hydrophobic by bombarding it
with air plasma or oxygen. Methyl groups (Si-CH3) [10], [11] is destroyed when the hydrophobic
surface is exposed to air plasma or oxygen. Once these channels have been treated with the
plasma they can be kept hydrophobic indefinitely by simply keeping the surfaces treated with
water or polar organic solvents. Lack of water or the necessary polar organic solvents will result
in surface rearrangements that will result in new hydrophobic groups coming to the surface to
lower the surface free energy. Using silanol groups allows surfaces of PDMS to react positively
to a wide selection of silanes (Si-R) which are terminated with important functional groups (i.e.,
R=NH2, COOH, SH). Tailoring the surfaces of PDMS to be hydrophobic or hydrophilic is
accomplished through the use of the aforementioned functional groups, reducing the no specific
absorption of proteins [12].
1.5.1 – Irreversible Sealing
Channels made in silicon thermoplastics or glass are much more difficult to seal then
PDMS channels. Sealing PDMS channels does not require the use of high temperatures, high
voltages, or high pressurization. Air or oxygen plasma exposed to both the surface PDMS and
the surface of the substrate allows the PDMS channels to be irreversibly sealed to glass, silicon,
silicon nitride, polystyrene, or polyethylene [13]. Oxidation using plasma produces silanol
groups on PDMS, and –OH-containing functional groups on the other materials; these polar
groups form covalent –O-Si-O-bonds with oxidized PDMS when these surfaces are brought into
9
contact [14]. Sealing the two slabs of PDMS can also be accomplished by the inclusion of an
excess amount of the monomer to one slab and the inclusion of excess of the curing agent to the
other slab. When cured the result is an irreversible seal that is indistinguishable from the bulk
properties of PDMS [15]. On the other hand to seal glass to glass or silicon to silicon demands
very high temperatures (`600oC for glass; > 800
oC for silicon) or voltages (500-1500 V for
anodic bonding of glass) [15], this differs greatly from sealing PDMS to glass or to itself.
1.5.2 – Reversible Sealing
Another positive advantage PDMS has over silicon, glass, and hard plastics is that it
allows the reversible van der Waals contact to smooth surfaces. This leads to demountable
microfluidic PDMS devices and are useful in patterning surfaces with biomolecules, proteins, or
cells by using fluid flows [16]. The use of silicone adhesive tapes makes a convenient sealing
agent for PDMS channels allowing for a reversible seal. Such tapes are flexible, and will allow
for the incorporation of non-sealing layers such as membranes and filter papers, and the tape is
very easy to cut as needed for various purposes. The particular silicone adhesive tapes are very
useful because they form stronger bonds (that are still reversible) than those between PDMS and
other flat surfaces [9].
1.6: Three Dimensional Fabrication of PDMS
Fabrication of three dimensional features in hard materials in prototyping and
manufacturing requires an expensive process such as stereolithography, laser-chemical 3-D
10
writing, or modular assembly. An inexpensive method is to fabricate 3-D channels in PDMS,
which is a versatile method of making complex geometries at cost savings. This has been
demonstrated by three methods of fabricating 3-D microchannel structures: (A) the use of two-
level photolithography, (B) the “membrane-sandwich” method, and (C) solid-object printing [5].
1.6.1 – Two-Level Lithography
When thinking about making topographic surface features within microfluidic channels,
two-level photolithography comes to mind. In two-level photolithography fabricating process,
two steps of mask alignment and polymerization of SU-8 photoresist (Fig. 1.3). This method
makes grooved structures inside channels for chaotic mixing [5].
1.6.2 – Membrane Sandwich Method
When working with hard materials layering is possible, but thermal stress, mechanical
stress, and adhesion failure can occur when bonding the various layers. Using soft polymers as
the layering component eliminates these problems because a simple chemical process seals the
layers. This process also allows for good contact between the surfaces by using low pressure.
The “membrane sandwich” was a method developed for fabricating topographically complex 3-
D channel structures in PDMS (Fig. 1.4) [8]. The “membrane sandwich” consisting of three
levels of features within a single thin layer of PDMS (approximately 100 µm) is place between
two thicker pieces of PDMS resulting in a very strong structural support. In this process two
masters are fabricated with the use of the membrane. The top master is made by replicating
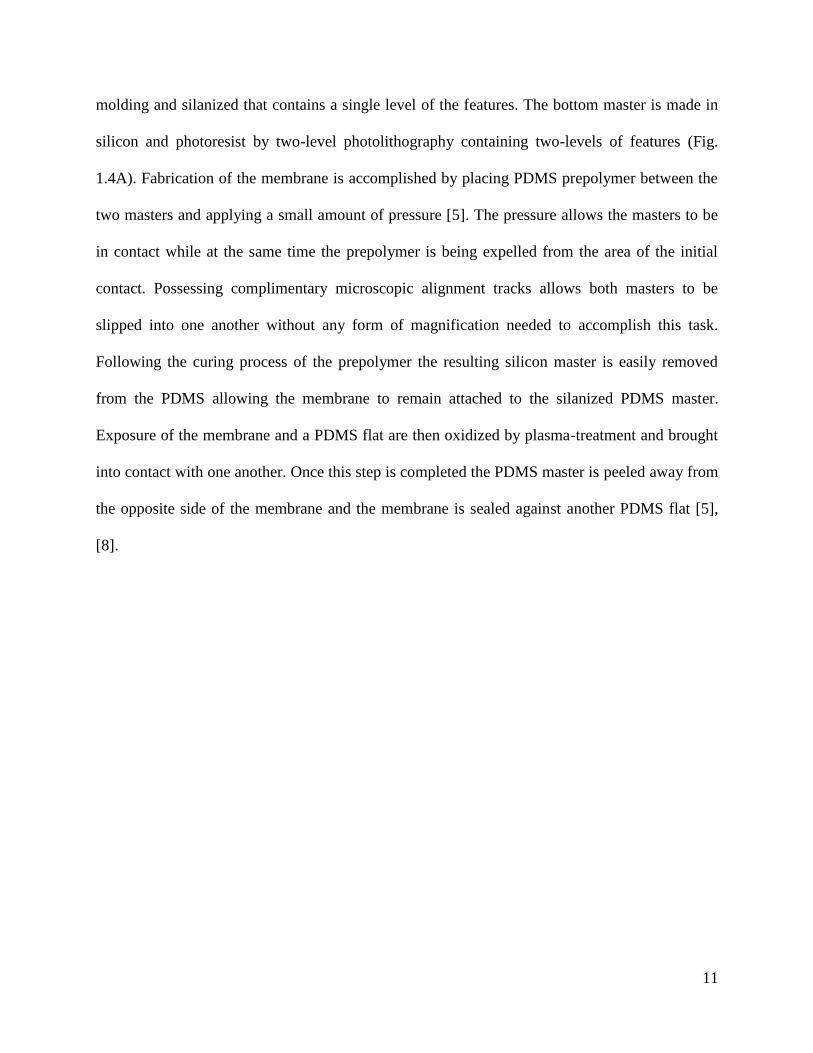
11
molding and silanized that contains a single level of the features. The bottom master is made in
silicon and photoresist by two-level photolithography containing two-levels of features (Fig.
1.4A). Fabrication of the membrane is accomplished by placing PDMS prepolymer between the
two masters and applying a small amount of pressure [5]. The pressure allows the masters to be
in contact while at the same time the prepolymer is being expelled from the area of the initial
contact. Possessing complimentary microscopic alignment tracks allows both masters to be
slipped into one another without any form of magnification needed to accomplish this task.
Following the curing process of the prepolymer the resulting silicon master is easily removed
from the PDMS allowing the membrane to remain attached to the silanized PDMS master.
Exposure of the membrane and a PDMS flat are then oxidized by plasma-treatment and brought
into contact with one another. Once this step is completed the PDMS master is peeled away from
the opposite side of the membrane and the membrane is sealed against another PDMS flat [5],
[8].

12
Fig.1.4. The membrane sandwich method for making a three-level channel system in a
single membrane. (A) The top master contains one level of features and is made in PDMS
by molding against a master. The bottom master is a positive relief of photoresist
containing two levels of features, and is made using two-level photolithography. The
channel system is made by placing PDMS prepolymer between the two masters, aligning
the masters, and applying pressure until the masters are in contact by excluding the PDMS.
For clarity, features on the master oriented in the y-direction are depicted with a darker
pattern than those in the x-direction. (B) Schematic diagram of the three-level channel
system in a PDMS membrane. (C) Optical image (looking down the z-axis) of the PDMS
membrane alone, which contains an 8 x 8 channel system. The channels are 100µm wide
(x- or y-direction), and each of the three levels used in the fabrication is 70µm high (z-
direction), but is not enclosed. To make the final channel structure, both sides of the
membrane are sealed to PDMS flats (not shown). (D) Scanning electron micrograph of the
channel system in epoxy polymer. The microstructure was formed by filing the channels
with epoxy prepolymer, curing under ultraviolet light for ten minutes, and dissolving the
PDMS casing in tetrabutylammonium fluoride [5].
13
1.6.3 – Solid-Object Printing for PDMS Devices
Solid-object printing (SOP) [17] is an alternative process to creating masters for molding
microfluidic channels. In this process a 3-D channel system is designed using a CAD program.
Once the CAD file is made it is easily read by any commercial solid-object printer resulting in a
fabrication of a master directly in a thermal plastic material without the use of a mask. The
alignment steps associated when 3-D structures are fabricated using membrane sandwich method
or the two-level photolithography are eliminated with the use of the CAD file. Following the
completion of the master PDMS prepolymer is dispensed over the mold, allowed to cure, and is
then peeled from the mold. Use of the SOP method for generating microfluidic devices allows
the devices to be distributed over a larger area up to 250 x 190 x 200 mm in the xyz plane, with
increased height in overall features. However, the resolution of the printer is low, 300 x 400 x
600 dpi, in the xyz plane). Therefore, the resolution limits this method to fabrication of features
≥ 250 µm, and generates masters who surfaces are rough (~8µm) [5],[17].
14
1.7: Interfacing of PDMS Microfluidic Devices
Microfluidic systems made in hard materials are very difficult to interface within the
realm of the world as a whole. An example is making a watertight seal between the device and
tubing for sample introduction often requires either inserting a polymer interface or using
expensive high precision micromachining, reactive ion etching, or related techniques [18]-[20].
Microfluidic devices that are fabricated in PDMS will interface with both internal components
and the outside world. This method has been demonstrated through the encapsulation of
components such as optical fibers, photodiodes, optical filters, glass capillaries, and silicon
tubing in PDMS [9]. Electrodes that are electroplated or evaporated on a substrate can also be
easily integrated because PDMS conforms to the electrodes if they are thing (<200 nm) [21].
PDMS elasticity allows various objects such as glass capillaries, polyethylene tubing, and
sippers to be tight, and at the same time easily inserted into holes made in PDMS by press fitting.
These particular holes must be fabricated to be roughly twenty to fifty percent smaller than the
actual diameter of the object being inserted. This will allow for the inserted object to fit securely
against the walls of the hole providing a leak proof seal. The simplistic ease associated with the
placement of an object into a predetermined hole allows for simple removal and ease of
operation in PDMS systems. The most commonly used tubing for connecting to PDMS devices
is polyethylene tubing. Polyethylene tubing allows easy connection to objects such as syringe
needles and is highly praised for its ability to allow fluids to be pumped through channels. The
access holes also fit micropipette tips for manual injection of samples [5].
15
1.8: Advantages and Disadvantages of PDMS
PDMS based microfluidic systems offer advantages over hard materials. Advantages
include low cost and the time necessary to fabricate a small number of devices. The nature of
PDMS allows for ease in modification and fabrication designs using soft lithography and replica
molding. The ability to produce compact sealing interfacing with optical fibers and inclusion of
organic membranes were made easy through the use of soft lithography with PDMS. Other
components or counterparts that are required to build functional devices are compatible with
PDMS. At times some properties associated with PDMS may be affected when working with
features less than twenty millimeters. Problems such as shrinking or sagging associated with
PDMS can be eliminated with features greater than or equal to twenty millimeters. In the near
future polymeric systems such as PDMS will replace glass and silicon systems for many
biological analyses. Soft lithographic technology is expected to become more commercialized in
the near future. Accompanying the projected commercialization of soft lithographic technology
the cost associated with current methods is expected to drop.
16
1.9: Specific Objectives
The overall research goals for the PDMS micropump are achieved through the following
objectives. Develop the PDMS microfluidic pump with two fabrication methods. Fabrication
Method I utilizes the VMC Microelectronics Laboratory. This method will utilize
microelectricalmechanical systems methodology, lithography, and sealing processes.
Fabrication Method II will use design optimization and rapid prototyping to optimize the
manufacturing process for the micropump. These two methods will be compared with to
determine the best method that will quickly produce this device. Develop a method for testing
and characterization. This involves methods for actuation of the pump that possibly involve
electrostatics actuation, magnetic actuation, piezoelectric actuation, pneumatic (mechanical
motor) actuation, and pressurized flow actuation. Experimental results can then be compared to
theoretical results.
17
CHAPTER 2 – Literature Review of Micropump Technologies
2.1: Introduction
Presently in today’s technology micropumps can be divided in to two distinctive
categories: displacement micropumps and dynamic micropumps. Displacement
micropumps are commonly referred to as mechanically actuated pumps. These types of
micropumps apply an oscillatory, periodic, and/or rotational pressure force on the fluid
through the use of a moving boundary. The boundary layer can be a solid to fluid
boundary, such as a vibrating diaphragm, rotary, and/or a peristaltic pump, or a fluid to
fluid boundary layer, similar to a phase change, ferrofluid, or gas permeation pump. In
some cases involving phase change and pneumatic actuation methods the pressure will
not necessarily be periodic. Aperiodic displacement pumps in most instances will only
pump a volume that is fixed. This form of actuation is similar to the action of a syringe.
Dynamic micropumps are classified as a micropump that continuously adds energy to the
working fluid to either increase its momentum (i.e., centrifugal micropumps) or its
pressure directly (i.e., electrohydrodynamic, electro-osmotic, electrowetting, , acoustic,
etc.). Due to the continuous energy transfer that is exhibited, dynamic pumps can
generate constant, steady flows.
18
Reciprocating
Diaphragm
Piston
MICROPUMPS
Displacement Dynamic
Rotary Aperiodic
Pneumatic
Phase Change
Electrowetting/ Thermocapillary
Centrifugal
Electrohydrodynamic
Electro-osmotic
Acoustic streaming/ Ultrasonic
Others (gas, jet, Hydraulic)
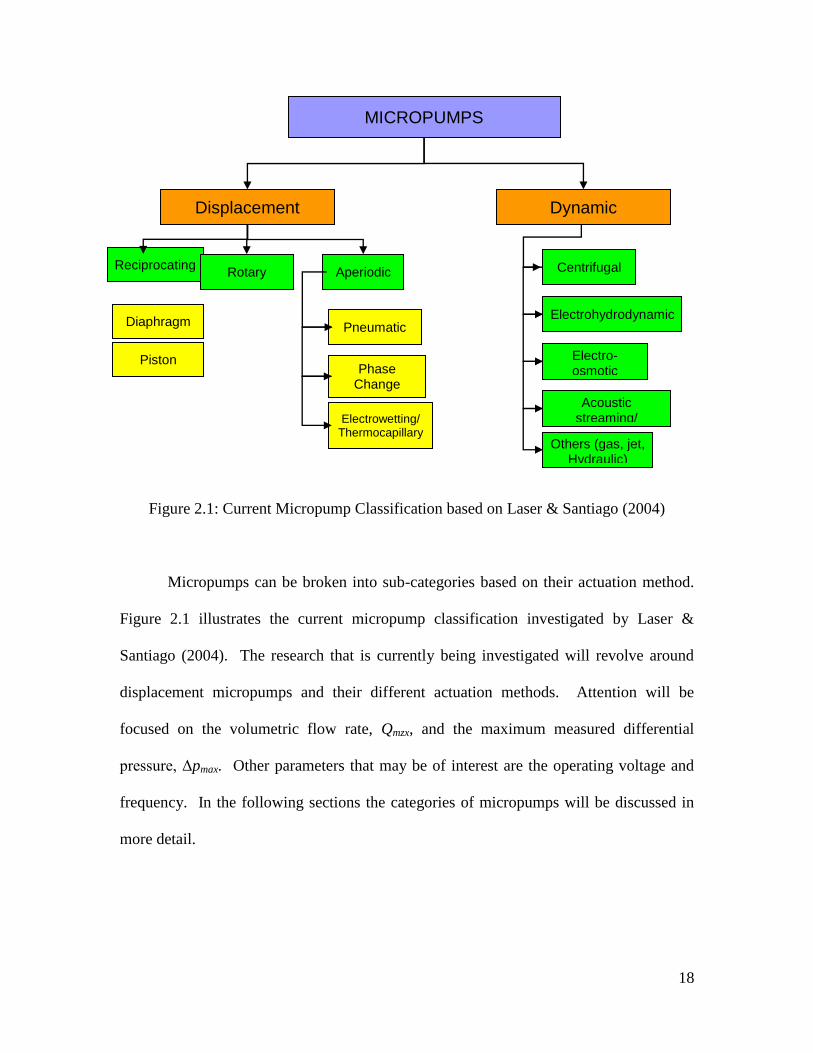
Figure 2.1: Current Micropump Classification based on Laser & Santiago (2004)
Micropumps can be broken into sub-categories based on their actuation method.
Figure 2.1 illustrates the current micropump classification investigated by Laser &
Santiago (2004). The research that is currently being investigated will revolve around
displacement micropumps and their different actuation methods. Attention will be
focused on the volumetric flow rate, Qmzx, and the maximum measured differential
pressure, Δpmax. Other parameters that may be of interest are the operating voltage and
frequency. In the following sections the categories of micropumps will be discussed in
more detail.
19
2.1.1 - Displacement Micropumps
Displacement (reciprocating) micropumps utilize a rotational or oscillatory movement of
mechanical parts to move fluid from an inlet to an outlet. Early development of
micropumps began with reciprocating piston actuation similar to peristaltic micropumps
and diaphragm micropumps that still make up the main representatives of the MEMS
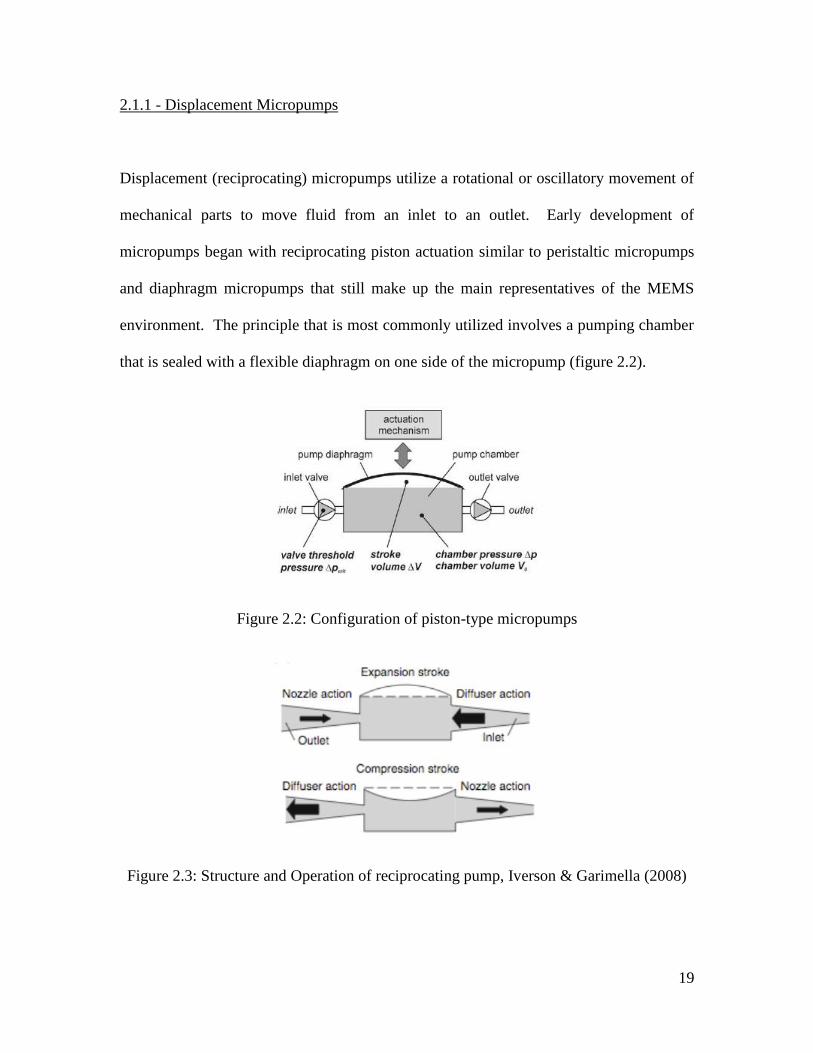
environment. The principle that is most commonly utilized involves a pumping chamber
that is sealed with a flexible diaphragm on one side of the micropump (figure 2.2).
Figure 2.2: Configuration of piston-type micropumps
Figure 2.3: Structure and Operation of reciprocating pump, Iverson & Garimella (2008)
20
Oscillating movement of the diaphragm generates a two-phase pump cycle with
periodic volume changes that result in under/overpressure transients Δp in the pumping
chamber. As the pump is being actuated it will experience a supply phase. The supply
phase is when the under-pressure in the pumping chamber sucks fluid through the inlet
into the chamber of the micropump. When this phase is reversed the micropump will
experience a pumping phase. The pumping phase is defined as an over-pressurization
within the pumping chamber that allows transfer of liquid into the outlet (figure 2.3).
Valves that are usually located at the inlet and outlet will block unwanted reverse flow
during the respective pumping phases. These valves mimic fluid rectifiers that guide and
direct the bi-directional fluid flow generated internally within the pumping chamber
towards a desired unidirectional flow. The fluid (liquid or gas) is delivered in a series of
discrete fluid volume whose magnitude is dependent upon the actuator stroke volume ΔV
(net volumetric displacement during one cycle).
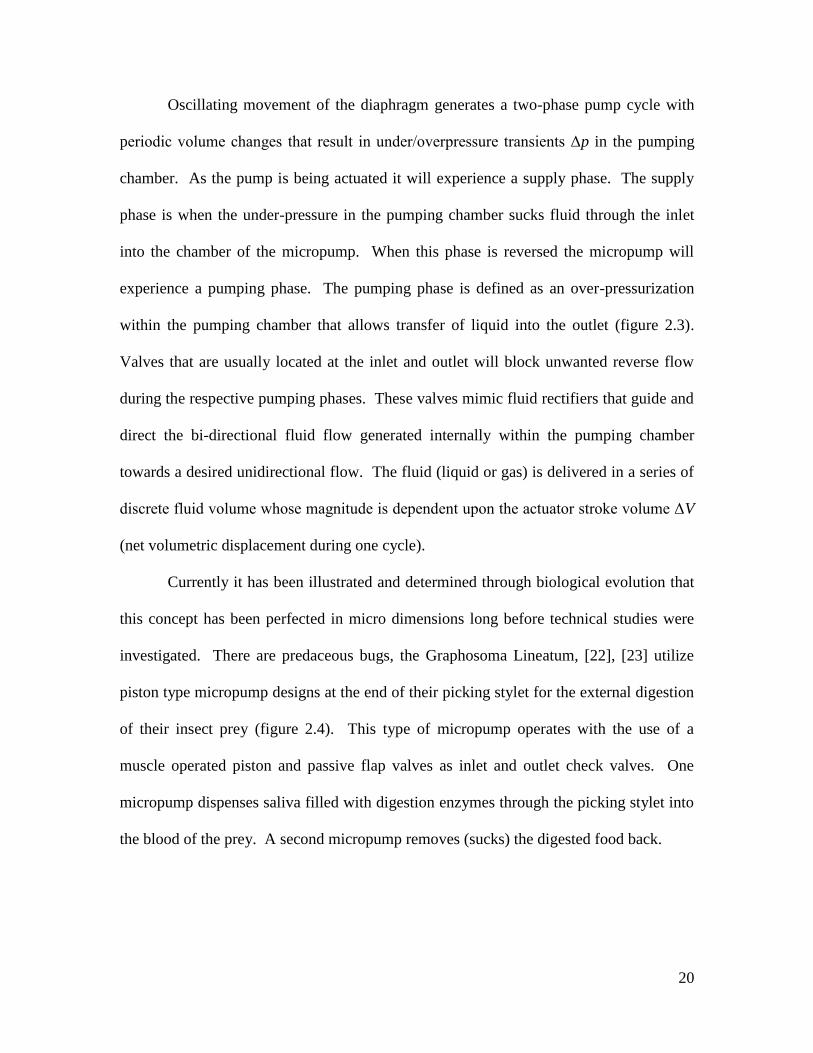
Currently it has been illustrated and determined through biological evolution that
this concept has been perfected in micro dimensions long before technical studies were
investigated. There are predaceous bugs, the Graphosoma Lineatum, [22], [23] utilize
piston type micropump designs at the end of their picking stylet for the external digestion
of their insect prey (figure 2.4). This type of micropump operates with the use of a
muscle operated piston and passive flap valves as inlet and outlet check valves. One
micropump dispenses saliva filled with digestion enzymes through the picking stylet into
the blood of the prey. A second micropump removes (sucks) the digested food back.
21
Figure 2.4: Schematic of Graphosoma Lineatum Saliva Dispensing Micropump [22]
2.1.2 - Dynamic (Continuous flow) Micropumps
Dynamic micropumps are based on a direct transformation of mechanical or
nonmechanical energy into a continuous fluid movement. These types of devices have
been currently developed focusing on ultrasonic, magnetohydrodynamic (MHD),
electrohydrodynamic (EHD), electroosmotic, or electrochemical actuation methods. The
design principles being vastly different depends upon the respective physical or chemical
principle which will be discussed within this chapter.
2.2: Early Research of Reciprocating Micropumps
In the beginning of micropump technology basic designs were based on an
actuation of both the valves and the pump diaphragms, instead of utilizing passive valves,
which was presented by Spencer et al. [25] in 1978. Spencer’s approach to design this
type of micropump is illustrated in figure 2.5. It is shown by the diagram that a

22
cylindrical micropump body was fabricated from stainless steel and sealed with a
piezoelectric actuated stainless steel shim to mimic a pump diaphragm.
Figure 2.5: Diagram of Cross-sectional cutaway of a micro-diaphragm pump with active
valves [25].
Activation flap valves were fabricated from piezoelectric bimorphs with
dimensions of 0.4 mm x 4 mm x 20 mm. To avoid electrical short circuits during
submersion in liquid the bimorph valves were coated with an electric resistive material.
Utilizing a high voltage actuation of 100V a theoretical stroke volume of 1.94 microliters
and an output pressure maximum of 100 mmHg were achieved. Measurements of
various data points were tested and a maximum stroke volume of 1.5 microliters with
90V actuation and a maximum pressure of 60 mmHg at 70V actuation were determined
[25]. It must be noted that only unidirectional flow was utilized, but this form of
23
micropump was capable of bidirectional fluid transport by changing the valve actuation
method.
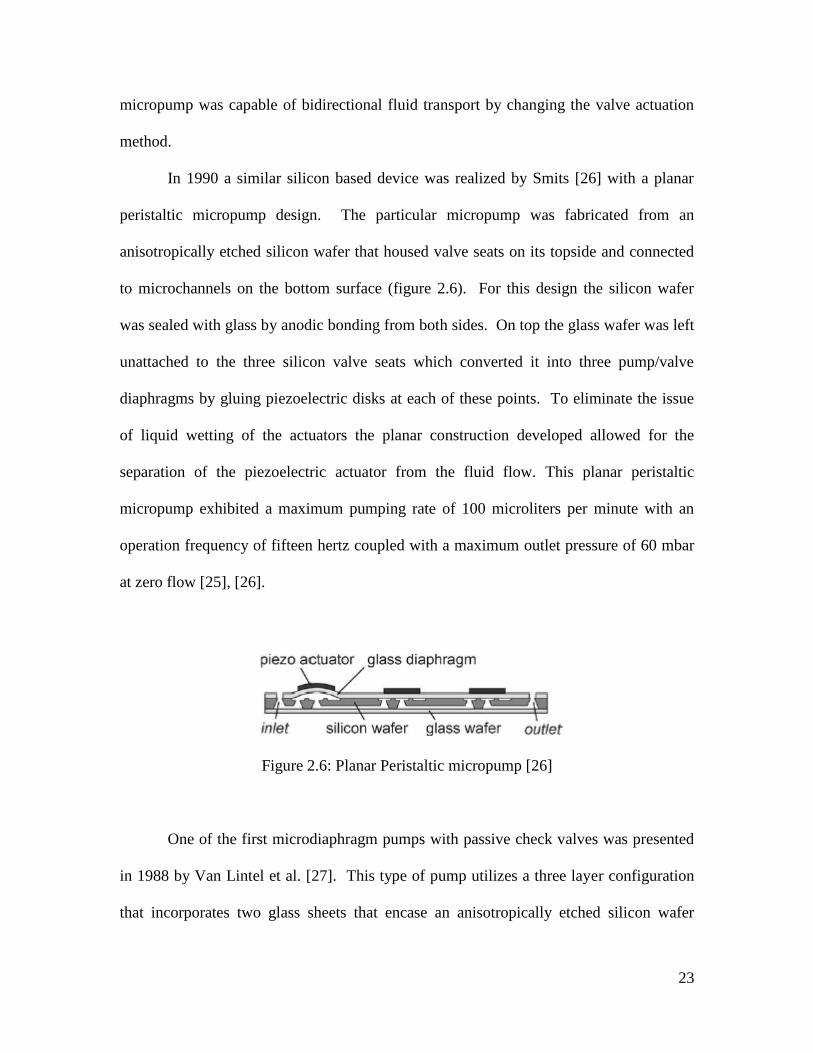
In 1990 a similar silicon based device was realized by Smits [26] with a planar
peristaltic micropump design. The particular micropump was fabricated from an
anisotropically etched silicon wafer that housed valve seats on its topside and connected
to microchannels on the bottom surface (figure 2.6). For this design the silicon wafer
was sealed with glass by anodic bonding from both sides. On top the glass wafer was left
unattached to the three silicon valve seats which converted it into three pump/valve
diaphragms by gluing piezoelectric disks at each of these points. To eliminate the issue
of liquid wetting of the actuators the planar construction developed allowed for the
separation of the piezoelectric actuator from the fluid flow. This planar peristaltic
micropump exhibited a maximum pumping rate of 100 microliters per minute with an
operation frequency of fifteen hertz coupled with a maximum outlet pressure of 60 mbar
at zero flow [25], [26].
Figure 2.6: Planar Peristaltic micropump [26]
One of the first microdiaphragm pumps with passive check valves was presented
in 1988 by Van Lintel et al. [27]. This type of pump utilizes a three layer configuration
that incorporates two glass sheets that encase an anisotropically etched silicon wafer

24
(figure 2.7). Overall dimensions that were characteristic of this device were 12.5 mm for
the pump diaphragm diameter and 7 mm for the diameter of the membrane valves.
Through experimental testing it was determined that a stroke volume of 0.21 microliters
was achievable with an actuation voltage of 100V. At this actuation level a maximum
flow rate of 8 microliters per minute at 1 Hz operation frequency and a maximum
pressure of 100 mbar were achieved.
Figure 2.7: Microdiaphragm pump that utilized piezoelectric actuation [27]
Although the early contributions of Spencer and Thomas were widely unknown,
the publications of Smits and Van Lintel firmly established the beginning of extensive
micropump research and fabrication in MEMS technology. As of late an astounding
amount of diaphragm and peristaltic micropumps are being developed. These
micropumps are developed with varying valve configurations and geometries, fabrication
technologies, and actuation principles. Numerous features and trends can be studied
concerning the functional elements and properties of these devices that will be discussed
in the following subsections.
25
2.3: Principles of Actuation
Currently and in past applications a wide-variety of actuation techniques for
micropump technology has been available. Most principles that are common consist of
piezoelectric [32-36, 38, 19, 21], thermopneumatic [28-31], electrostatic [39-41], and
electromagnetic actuation [37-38]. Some other methods that are in the beginning stages
revolve around shape memory alloys [23] and magnetostrictive effects. Each of these
topics will be discussed in detail in the following subsections.
2.3.1 – Piezoelectric Actuation
Piezoelectric actuation is the most commonly utilized actuation method for
micropump technology. This method was the first to be tested due to its attractive
characteristics. This type of material provides a comparatively high stroke volume, a
high actuation force, and a quick mechanical response. Also on a fabrication level
piezoelectric material, such as PZT, is commercially available for quick integration into
the particular fabricated device. Disadvantages of the piezoelectric material involve the
high actuation voltages required and the procedure for mounting the piezo to the surface
of the micropump device. It has been theorized that a systematic optimization of
mounting procedure could significantly improve yield and reliability of this form of
actuation [43-44]. Currently for hybrid integration procedure to be completed a very well
defined gluing is performed. The procedure is crucial for proper optimum actuator
performance, which is usually difficult to complete with minimal reproducibility. Due to
26
the difficulty in the placement of the piezoelectric material through gluing other studies
have been performed involving screen printing [45-46] and thin-film deposition of PZT
material as an alternative quasi-monolithic integration technique. Even though these
techniques prove to be feasible, the results ranging from 1 micrometer displacement at
100V [45] are relatively small as compared to glued PZT bulk material with 15
micrometers at 100V [32]. Optimization techniques have been utilized for the geometric
design to achieve higher strokes at lower voltages [32, 47]. In most instances in literature
the actuation voltages of the optimized designs are in the range of approximately 100V
with 130 voltage peak-to-peak [33]. This form of actuation demonstrates a vast
improvement as compared to other micropump actuation methods that sometimes utilize
commercial piezo buzzers without optimization. These types of devices demonstrate
results of 400 volts peak-to-peak [34]. Studies that have been completed involving
piezoelectric actuation that incorporate design optimization have provided lower
actuation voltages. These optimized designs assist for the development of highly
miniaturized electronic drives that allow low-power operation from a battery source.
2.3.2 – Thermopneumatic Actuation
Thermopneumatic actuation was first introduced and demonstrated by Van de Pol
et al. [28] with a micropump fabrication similar to Van Lintels device (figure 2.8). As
previously discussed the Van Lintels device utilized a piezoelectric disk of PZT. In the
case of thermopneumatic actuation the PZT disk is removed and an air-filled chamber
with an internal heat resistor was fabricated on the topside of the pump diaphragm. The
27
heat resistor is characterized as a free-hanging structure [28-30] achieving better thermal
efficiency or simply attached to the pump diaphragm [31]. This form of actuation is a
representation of a low voltage alternative to the piezoelectric actuation and eliminates
the high voltage deflections associated with the electronic drive [28].
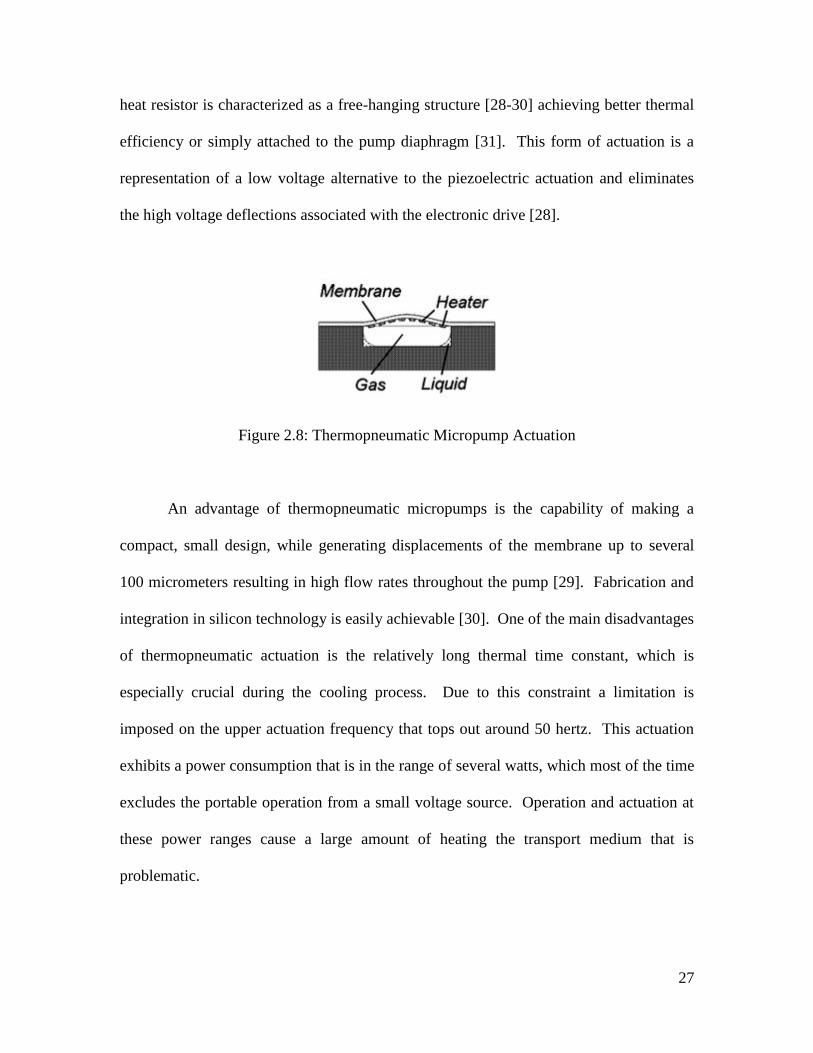
Figure 2.8: Thermopneumatic Micropump Actuation
An advantage of thermopneumatic micropumps is the capability of making a
compact, small design, while generating displacements of the membrane up to several
100 micrometers resulting in high flow rates throughout the pump [29]. Fabrication and
integration in silicon technology is easily achievable [30]. One of the main disadvantages
of thermopneumatic actuation is the relatively long thermal time constant, which is
especially crucial during the cooling process. Due to this constraint a limitation is
imposed on the upper actuation frequency that tops out around 50 hertz. This actuation
exhibits a power consumption that is in the range of several watts, which most of the time
excludes the portable operation from a small voltage source. Operation and actuation at
these power ranges cause a large amount of heating the transport medium that is
problematic.
28
2.3.3 – Electrostatic Actuation
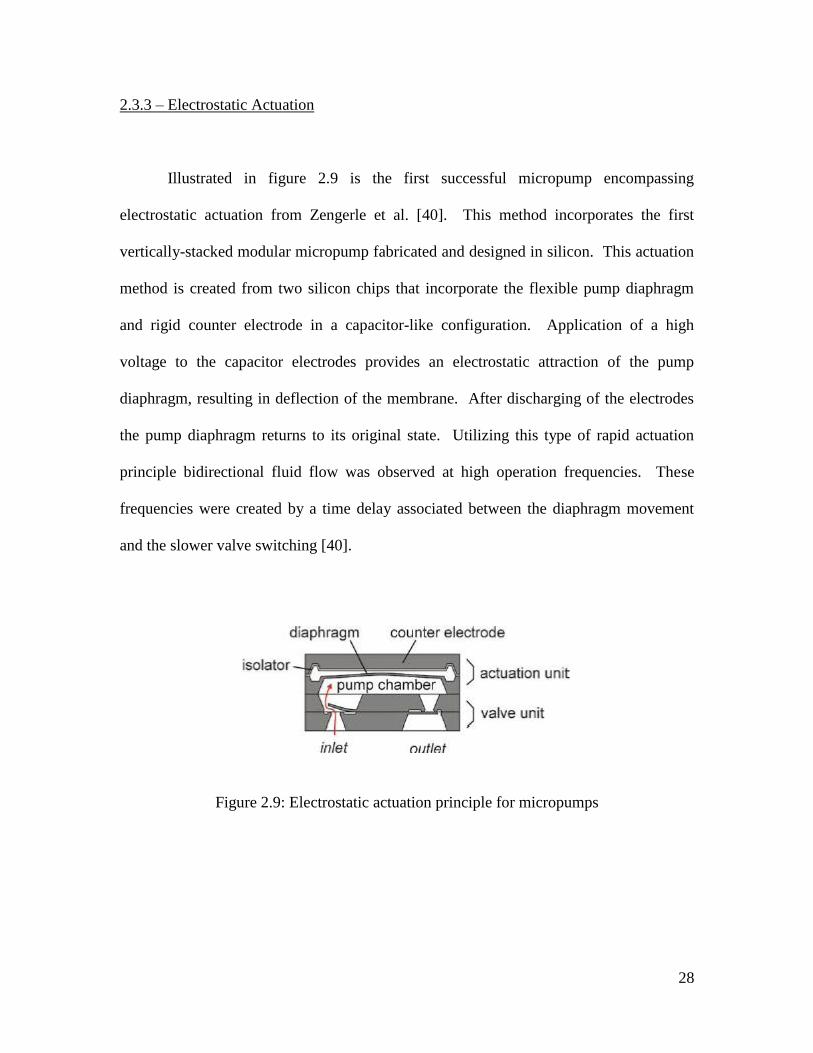
Illustrated in figure 2.9 is the first successful micropump encompassing
electrostatic actuation from Zengerle et al. [40]. This method incorporates the first
vertically-stacked modular micropump fabricated and designed in silicon. This actuation
method is created from two silicon chips that incorporate the flexible pump diaphragm
and rigid counter electrode in a capacitor-like configuration. Application of a high
voltage to the capacitor electrodes provides an electrostatic attraction of the pump
diaphragm, resulting in deflection of the membrane. After discharging of the electrodes
the pump diaphragm returns to its original state. Utilizing this type of rapid actuation
principle bidirectional fluid flow was observed at high operation frequencies. These
frequencies were created by a time delay associated between the diaphragm movement
and the slower valve switching [40].
Figure 2.9: Electrostatic actuation principle for micropumps

29
This periodic motion of the membrane changes the volume and thus the pressure
inside the micropump caused the fluid to propel in one direction. Preference of direction
is accomplished by similar flow rectification techniques as previously discussed in the
piezoelectric actuation methods. Capacitance between the diaphragm membrane and the
electrode can be calculated as follows:
The force being developed by the electrostatic actuation to achieve the attraction between
the two electrodes is given by:
where V is the voltage applied between the electrodes, ε is the permittivity of the
medium, d is the counter electrode diameter, and l is the distance separation between the
two electrodes. It must be noted that since the force is dependent upon the medium,
appropriate selection of the medium must be considered. A medium with appropriate
high permittivity facilitates the usage of the electrostatic actuation even when the plates
are far apart, due to the fact that force created will be sufficient to pump the fluid
throughout the pumps entirety.
l
dC
4
2
2
2
22
82
1V
l
dV
l
CF
30
Forms of various electrostatic actuation methods provide operation frequencies up
to several kilo-hertz, an extremely low power consumption, and full MEMS compatibility
[39-41]. Results studied and tested involving electrostatic actuation principles have
yielded major disadvantages. The major drawback is the significantly small actuator
stroke (displacement) that is usually limited to displacement values of five micrometers
actuated at 200V. Another disadvantage is the degradation of the electrode after long-
term high voltage operations. The reason this deterioration occurs is due to the build up
of surface charges on the insulator within the capacitor. This in turn reduces the internal
electric field strength, thus diminishing the stroke (displacement). To overcome this
problem studies are being conducted involving bipolar operation which is resulting in
studies involving more complex electronic drive systems.
2.3.4 – Electromagnetic Actuation
Actuation of micropumps utilizing electromagnetism and metallic particles has
been investigated briefly. This technology is in its early development stages and in most
instances not very compatible with micropump technology [37, 38]. In theory when an
electrical current flows through a wire under the action of a magnetic field, Lorentz
forces come into action. This phenomenon is utilized for electromagnetic actuation by
attaching a permanent magnet to the diaphragm and generating a current in the coil that
surrounds the diaphragm. Lorentz forces deflect the diaphragm based on the electric and
magnetic field interaction. This form of actuation requires voltages that are relatively
low (~5V) and the actuator designs are simplistic as compared to previous actuation
31
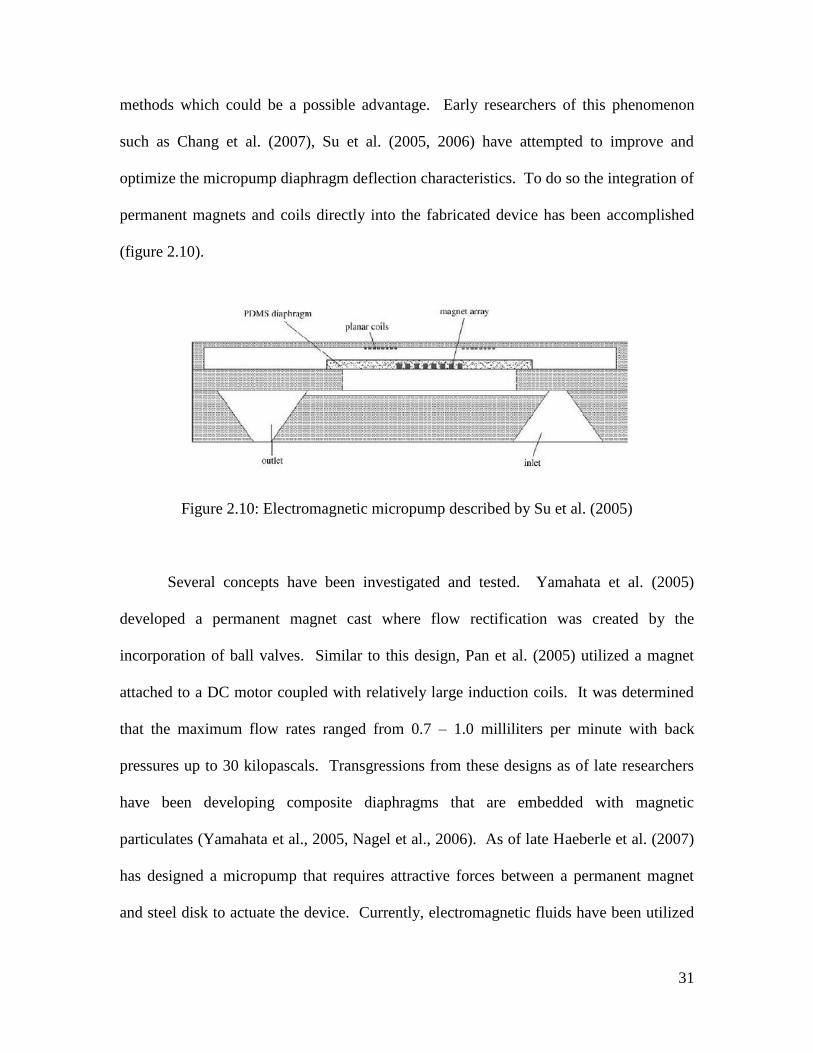
methods which could be a possible advantage. Early researchers of this phenomenon
such as Chang et al. (2007), Su et al. (2005, 2006) have attempted to improve and
optimize the micropump diaphragm deflection characteristics. To do so the integration of
permanent magnets and coils directly into the fabricated device has been accomplished
(figure 2.10).
Figure 2.10: Electromagnetic micropump described by Su et al. (2005)
Several concepts have been investigated and tested. Yamahata et al. (2005)
developed a permanent magnet cast where flow rectification was created by the
incorporation of ball valves. Similar to this design, Pan et al. (2005) utilized a magnet
attached to a DC motor coupled with relatively large induction coils. It was determined
that the maximum flow rates ranged from 0.7 – 1.0 milliliters per minute with back
pressures up to 30 kilopascals. Transgressions from these designs as of late researchers
have been developing composite diaphragms that are embedded with magnetic
particulates (Yamahata et al., 2005, Nagel et al., 2006). As of late Haeberle et al. (2007)
has designed a micropump that requires attractive forces between a permanent magnet
and steel disk to actuate the device. Currently, electromagnetic fluids have been utilized
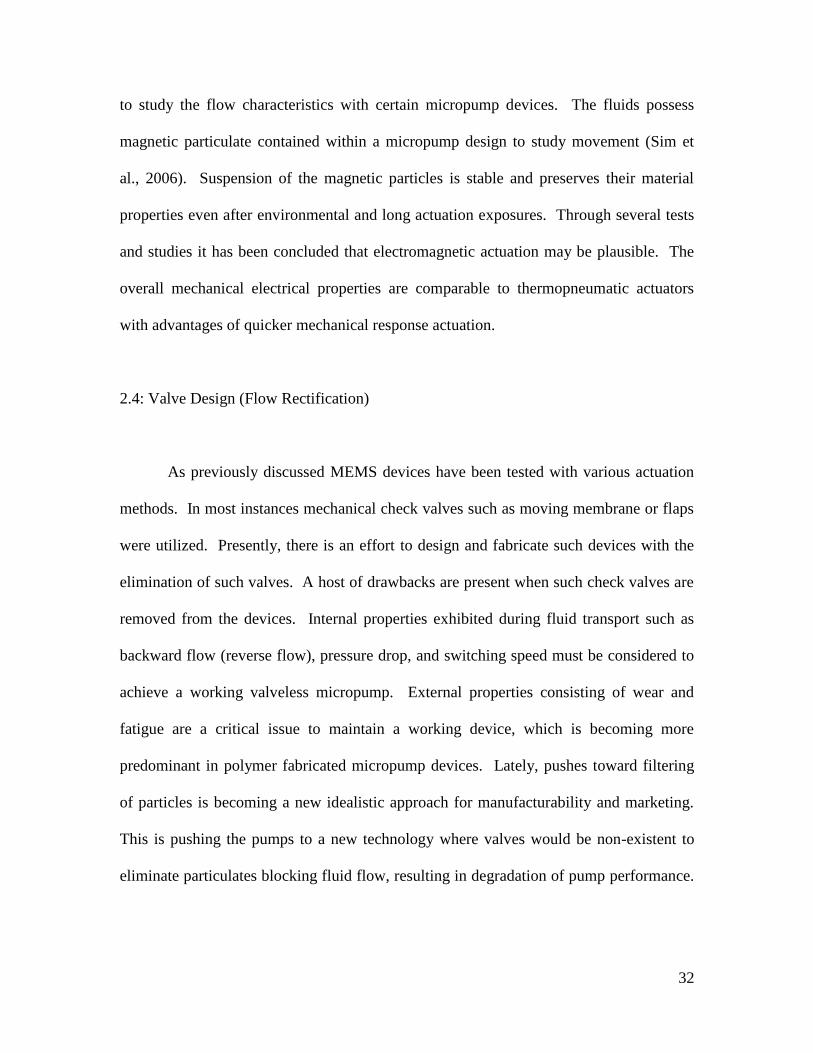
32
to study the flow characteristics with certain micropump devices. The fluids possess
magnetic particulate contained within a micropump design to study movement (Sim et
al., 2006). Suspension of the magnetic particles is stable and preserves their material
properties even after environmental and long actuation exposures. Through several tests
and studies it has been concluded that electromagnetic actuation may be plausible. The
overall mechanical electrical properties are comparable to thermopneumatic actuators
with advantages of quicker mechanical response actuation.
2.4: Valve Design (Flow Rectification)
As previously discussed MEMS devices have been tested with various actuation
methods. In most instances mechanical check valves such as moving membrane or flaps
were utilized. Presently, there is an effort to design and fabricate such devices with the
elimination of such valves. A host of drawbacks are present when such check valves are
removed from the devices. Internal properties exhibited during fluid transport such as
backward flow (reverse flow), pressure drop, and switching speed must be considered to
achieve a working valveless micropump. External properties consisting of wear and
fatigue are a critical issue to maintain a working device, which is becoming more
predominant in polymer fabricated micropump devices. Lately, pushes toward filtering
of particles is becoming a new idealistic approach for manufacturability and marketing.
This is pushing the pumps to a new technology where valves would be non-existent to
eliminate particulates blocking fluid flow, resulting in degradation of pump performance.
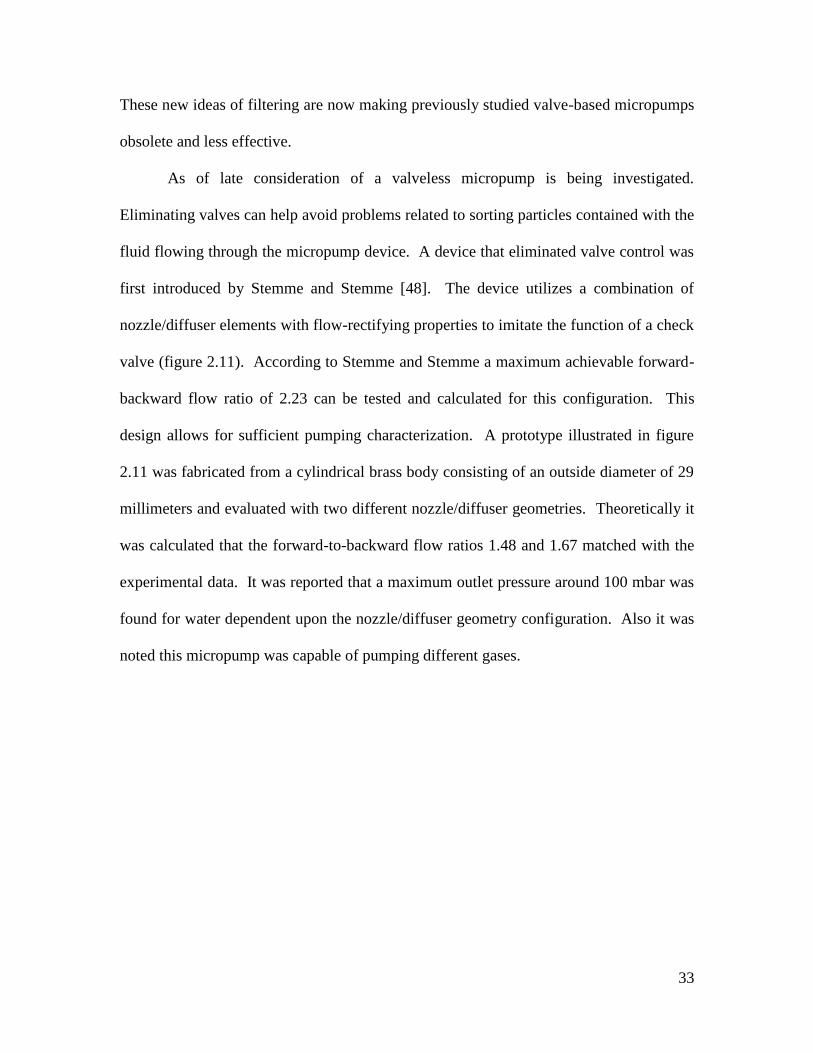
33
These new ideas of filtering are now making previously studied valve-based micropumps
obsolete and less effective.
As of late consideration of a valveless micropump is being investigated.
Eliminating valves can help avoid problems related to sorting particles contained with the
fluid flowing through the micropump device. A device that eliminated valve control was
first introduced by Stemme and Stemme [48]. The device utilizes a combination of
nozzle/diffuser elements with flow-rectifying properties to imitate the function of a check
valve (figure 2.11). According to Stemme and Stemme a maximum achievable forward-
backward flow ratio of 2.23 can be tested and calculated for this configuration. This
design allows for sufficient pumping characterization. A prototype illustrated in figure
2.11 was fabricated from a cylindrical brass body consisting of an outside diameter of 29
millimeters and evaluated with two different nozzle/diffuser geometries. Theoretically it
was calculated that the forward-to-backward flow ratios 1.48 and 1.67 matched with the
experimental data. It was reported that a maximum outlet pressure around 100 mbar was
found for water dependent upon the nozzle/diffuser geometry configuration. Also it was
noted this micropump was capable of pumping different gases.
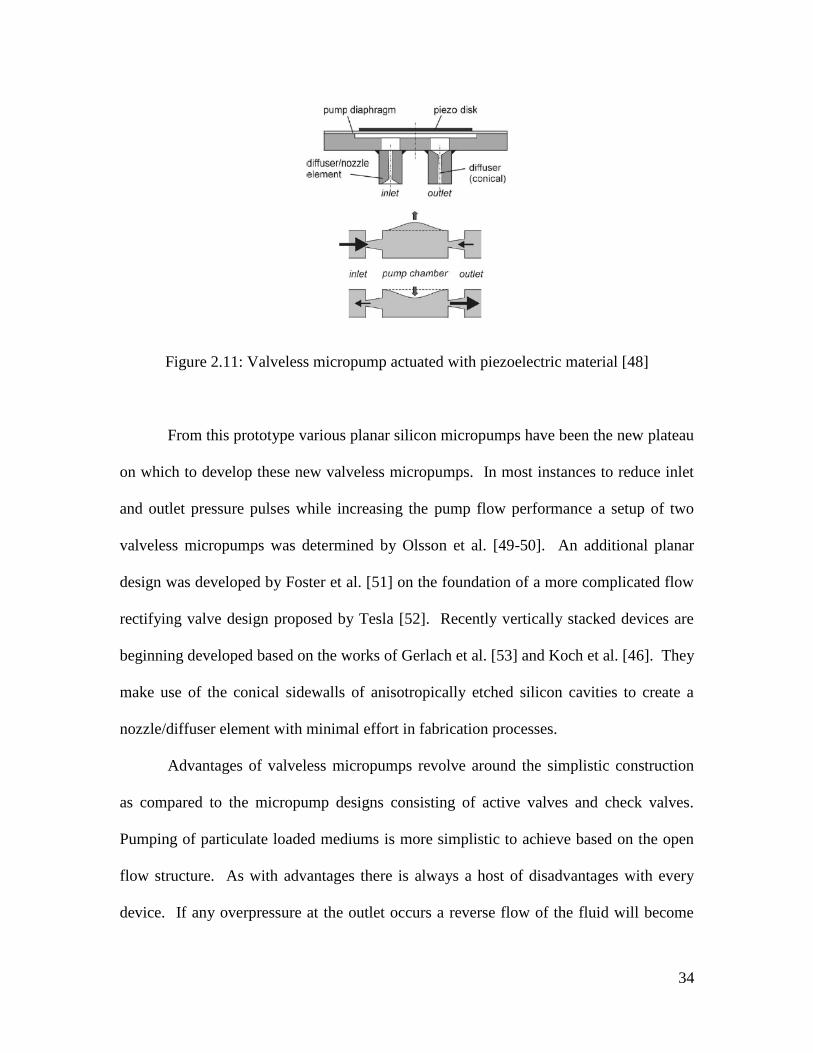
34
Figure 2.11: Valveless micropump actuated with piezoelectric material [48]
From this prototype various planar silicon micropumps have been the new plateau
on which to develop these new valveless micropumps. In most instances to reduce inlet
and outlet pressure pulses while increasing the pump flow performance a setup of two
valveless micropumps was determined by Olsson et al. [49-50]. An additional planar
design was developed by Foster et al. [51] on the foundation of a more complicated flow
rectifying valve design proposed by Tesla [52]. Recently vertically stacked devices are
beginning developed based on the works of Gerlach et al. [53] and Koch et al. [46]. They
make use of the conical sidewalls of anisotropically etched silicon cavities to create a
nozzle/diffuser element with minimal effort in fabrication processes.
Advantages of valveless micropumps revolve around the simplistic construction
as compared to the micropump designs consisting of active valves and check valves.
Pumping of particulate loaded mediums is more simplistic to achieve based on the open
flow structure. As with advantages there is always a host of disadvantages with every
device. If any overpressure at the outlet occurs a reverse flow of the fluid will become
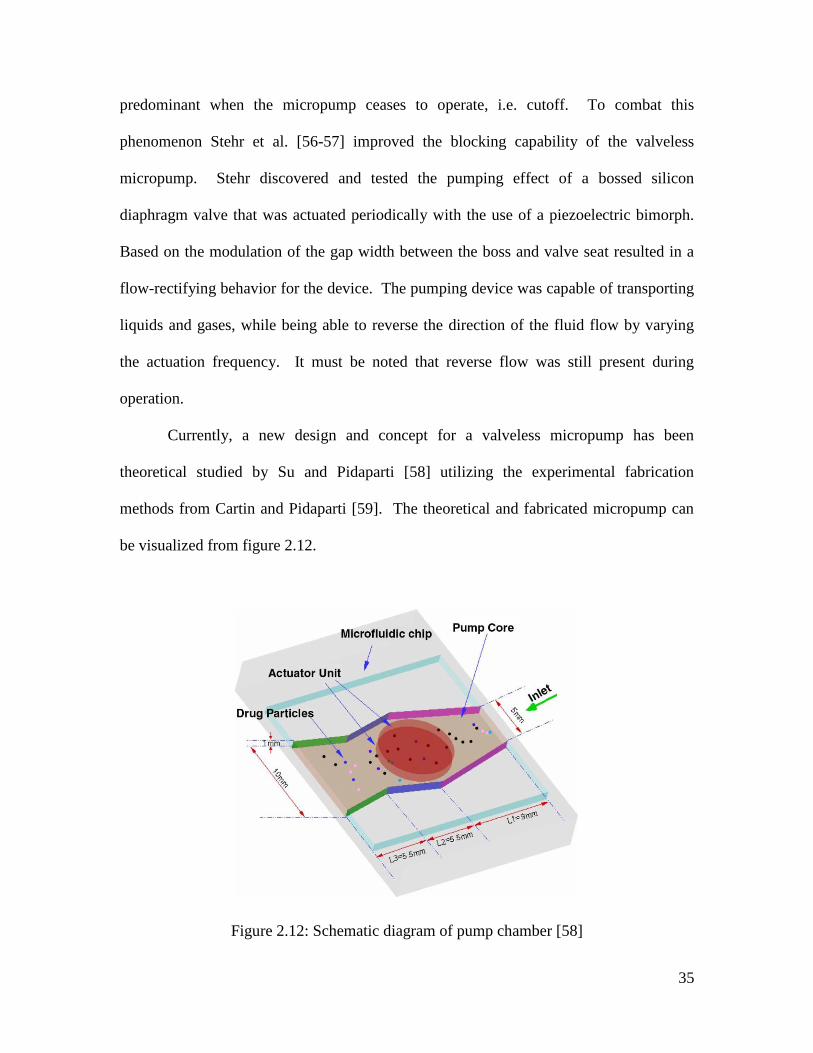
35
predominant when the micropump ceases to operate, i.e. cutoff. To combat this
phenomenon Stehr et al. [56-57] improved the blocking capability of the valveless
micropump. Stehr discovered and tested the pumping effect of a bossed silicon
diaphragm valve that was actuated periodically with the use of a piezoelectric bimorph.
Based on the modulation of the gap width between the boss and valve seat resulted in a
flow-rectifying behavior for the device. The pumping device was capable of transporting
liquids and gases, while being able to reverse the direction of the fluid flow by varying
the actuation frequency. It must be noted that reverse flow was still present during
operation.
Currently, a new design and concept for a valveless micropump has been
theoretical studied by Su and Pidaparti [58] utilizing the experimental fabrication
methods from Cartin and Pidaparti [59]. The theoretical and fabricated micropump can
be visualized from figure 2.12.
Figure 2.12: Schematic diagram of pump chamber [58]
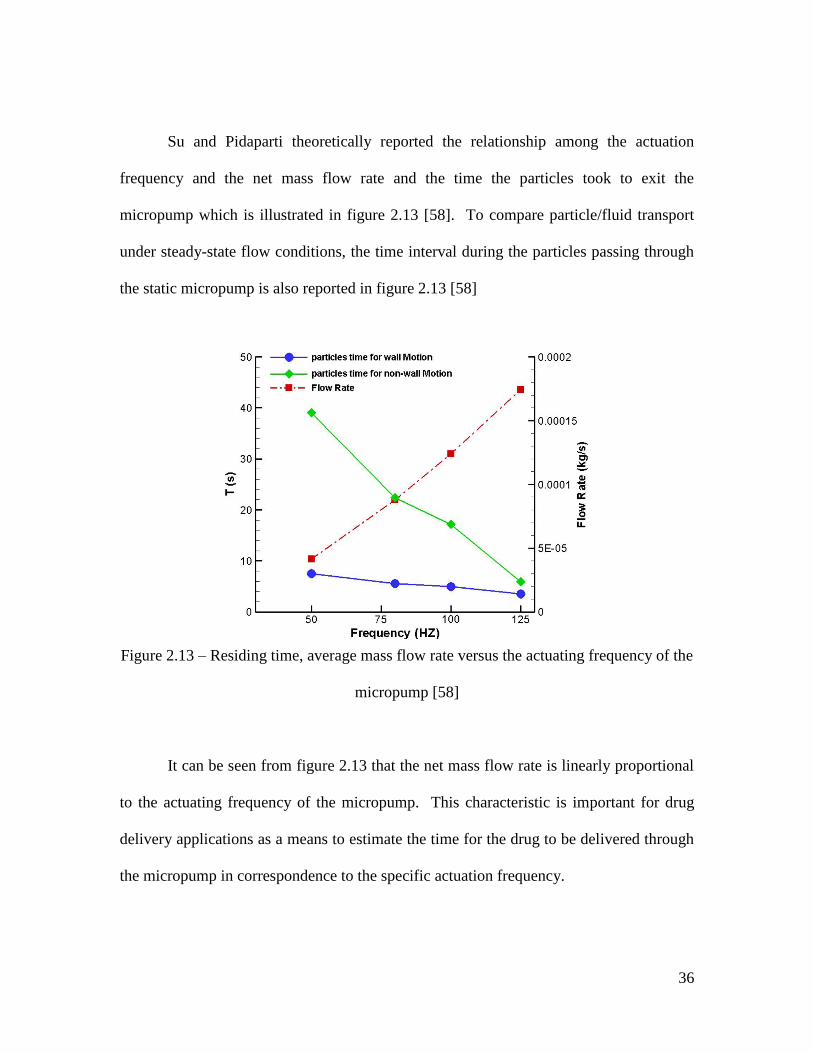
36
Su and Pidaparti theoretically reported the relationship among the actuation
frequency and the net mass flow rate and the time the particles took to exit the
micropump which is illustrated in figure 2.13 [58]. To compare particle/fluid transport
under steady-state flow conditions, the time interval during the particles passing through
the static micropump is also reported in figure 2.13 [58]
Figure 2.13 – Residing time, average mass flow rate versus the actuating frequency of the
micropump [58]
It can be seen from figure 2.13 that the net mass flow rate is linearly proportional
to the actuating frequency of the micropump. This characteristic is important for drug
delivery applications as a means to estimate the time for the drug to be delivered through
the micropump in correspondence to the specific actuation frequency.
37
For particle and fluid transport, the time that the particles move throughout the
static micropump passageway nonlinearly depends on the flow condition. On the other
hand, it was reported that the particle and fluid transport time versus the actuation
frequency of the micropump tended to possess a linear property. This relationship is
important for manipulation of particle drug delivery flow and estimation of the drug
delivery time [58]. These theoretical results presented for novel actuation of the
proposed valveless micropump may be suitable for both liquid and particle drug delivery
systems.
Power consumption was another study investigated by Su and Pidaparti. Figure
2.14 illustrates the power input for the micropump at multiple operating frequencies for
the present micropump with three nozzle-diffuser elements [59]. The power consumption
required for the micropump is utilized to operate the actuator, and the energy is
consumed during vibration of the fluid flow through viscous dissipation [58]. Through
these theoretical studies of Su and Pidaparti it was discovered that more viscous
dissipation is associated with the higher frequency vibration of flow, and the energy
consumption is increased with the increase of the actuation frequency as illustrated in
figure 2.14 [58]. To illustrate the advantages of the current micropump design the
average net flow rate and power consumption for the Anderson micropump [60] were
also calculated. It can be seen that the Anderson design provides less flow thus
consuming more energy, while the current design is capable of pumping more fluid with
less energy consumption.

38
Figure 2.14: Power required, average mass flow rate versus the actuating frequency of the
micropump [58]
In conclusion from Su and Pidaparti [58] a systematic theoretical computational
study was completed investigating the flow and particle transport characteristics through
a valveless micropump utilizing combined computational fluid dynamics and discrete
particle transport methods. Results obtained from their studies demonstrated the
feasibility of the valveless micropump for the transport of fluid and particulate drugs. It
was concluded that the novel micropump design with vibrating actuation could transport
fluid faster than previously studied micropumps. For fluid transport the complex flow
pattern within the micropump results in relationships between mass flow rate of the fluid
and actuation frequency which was linearly proportional. This proportionality depicts
that fluid flow will continue to increase with actuation frequency, thus providing more
and more flow. Additionally, the micropump exhibited less energy consumption during
actuation as compared to other pumps.

39
2.5: Dosing (Operating) Properties
Common characteristics of the dosing properties are similar throughout the large
number of micropump concepts and designs. Figure 2.15 and 2.16 illustrate the typical
behavior of the pump rate as a function of the actuation frequency as well as the typical
influence of varying outlet overpressure [32].
Figure 2.15: Typical Dosing Rates of a Micropump Diaphragm Pump
Pump rate as a function of the operation frequency [32]
Figure 2.16: Typical Dosing Rates of a micropump diaphragm pump
Pump rate as a function of the applied outlet backpressure [32]
40
In most instances the rate of pumping (microliters per minute) is linearly
increasing with operation frequency until a certain value is reached (figure 2.15 depicts
~150 Hz). Studying the linear behavior allows calculation of the stroke volume ΔV of the
diaphragm actuator (approximately 120 nanoliters in figure 2.15). In the linear regime
the actuation diaphragm possesses the capability to deliver the full stoke while the
duration of the pumping cycle is still long enough to allow a full relaxation of the valve
movement and all pressure-flow transients. Beyond the 150 Hz frequency it is observed
that flow saturation is occurring. Flow saturation results from an increasingly insufficient
relaxation and other effects associated with the individualized micropump design. The
drop in the curve indicates that an increased energy loss is apparent (e.g. squeeze film
damping) and the increasing time lag between the diaphragm and valve movement will
lead to reverse pumping [40]. Figure 2.16 illustrates a backpressure curve that is similar
among micropump devices. This curve illustrates a linear degradation of the present flow
rate as soon as the outlet pressure begins to increase. At a particular value,
approximately 800~900 mbar in this example, the pressure generated within the pump
can no longer be high enough to open the outlet valve, thus ceasing operation. Similar
characteristics have been studied for underpressure at the inlet.
Influence of varying pressure can pose a limit to the dosing accuracy of the
micropump. In certain applications the utilization of high force actuation assists to
extend the maximum backpressure values well beyond the operational values typically
expected. For these types of cases the pressure dependency flow curve may become
significantly flat ensuring an accurate dosing. Furthermore metric dosing can be made
available through design considerations. In literature studies have been performed
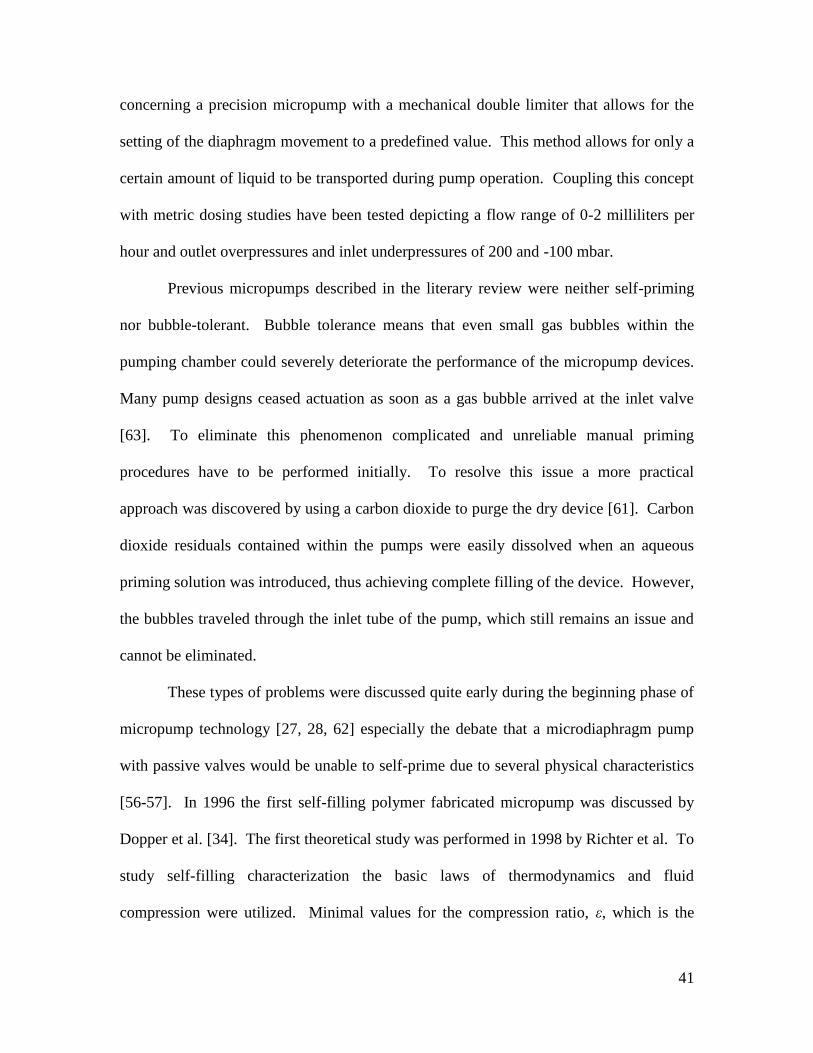
41
concerning a precision micropump with a mechanical double limiter that allows for the
setting of the diaphragm movement to a predefined value. This method allows for only a
certain amount of liquid to be transported during pump operation. Coupling this concept
with metric dosing studies have been tested depicting a flow range of 0-2 milliliters per
hour and outlet overpressures and inlet underpressures of 200 and -100 mbar.
Previous micropumps described in the literary review were neither self-priming
nor bubble-tolerant. Bubble tolerance means that even small gas bubbles within the
pumping chamber could severely deteriorate the performance of the micropump devices.
Many pump designs ceased actuation as soon as a gas bubble arrived at the inlet valve
[63]. To eliminate this phenomenon complicated and unreliable manual priming
procedures have to be performed initially. To resolve this issue a more practical
approach was discovered by using a carbon dioxide to purge the dry device [61]. Carbon
dioxide residuals contained within the pumps were easily dissolved when an aqueous
priming solution was introduced, thus achieving complete filling of the device. However,
the bubbles traveled through the inlet tube of the pump, which still remains an issue and
cannot be eliminated.
These types of problems were discussed quite early during the beginning phase of
micropump technology [27, 28, 62] especially the debate that a microdiaphragm pump
with passive valves would be unable to self-prime due to several physical characteristics
[56-57]. In 1996 the first self-filling polymer fabricated micropump was discussed by
Dopper et al. [34]. The first theoretical study was performed in 1998 by Richter et al. To
study self-filling characterization the basic laws of thermodynamics and fluid
compression were utilized. Minimal values for the compression ratio, ε, which is the
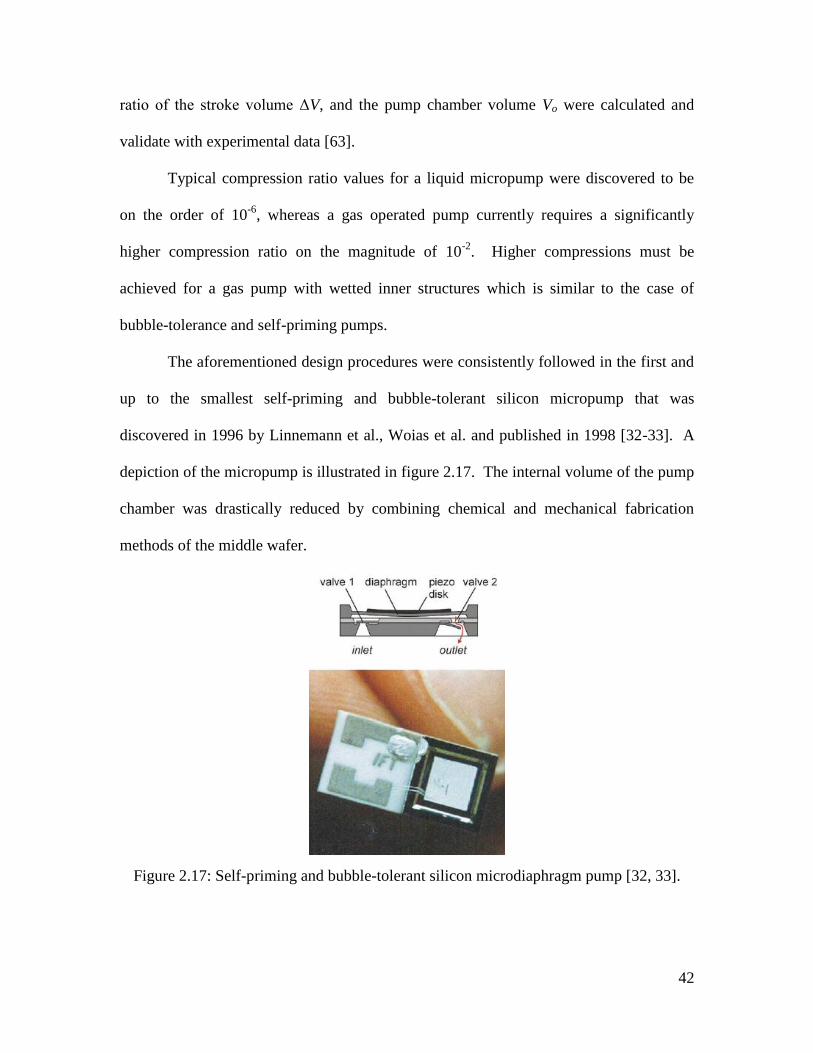
42
ratio of the stroke volume ΔV, and the pump chamber volume Vo were calculated and
validate with experimental data [63].
Typical compression ratio values for a liquid micropump were discovered to be
on the order of 10-6
, whereas a gas operated pump currently requires a significantly
higher compression ratio on the magnitude of 10-2
. Higher compressions must be
achieved for a gas pump with wetted inner structures which is similar to the case of
bubble-tolerance and self-priming pumps.
The aforementioned design procedures were consistently followed in the first and
up to the smallest self-priming and bubble-tolerant silicon micropump that was
discovered in 1996 by Linnemann et al., Woias et al. and published in 1998 [32-33]. A
depiction of the micropump is illustrated in figure 2.17. The internal volume of the pump
chamber was drastically reduced by combining chemical and mechanical fabrication
methods of the middle wafer.
Figure 2.17: Self-priming and bubble-tolerant silicon microdiaphragm pump [32, 33].
43
As seen in figure 2.17 the micropump is actuated with a piezoelectric disk.
Careful optimization was considered involving the piezoelectric actuator. The actuator
was designed with the capability to perform comparatively high strokes at low chip
dimensions. The first design exhibited a compression ratio of 1:9.4 that proved to be
significantly high for self-priming and bubble-tolerance [63]. As testing progressed, later
versions were continually optimized to achieve a compression ratio of 1:2 which is
relatively high in relation to the small chip size of 7 mm x 7 mm x 1 mm [33]. Many
other effective self-priming and bubble-tolerant designs have been discussed in literature
[29, 34-35, 38, 65-66]. Some approaches turn out to be only self-priming from the dry
state but no fully bubble-tolerant that results in a limited practical application [56 – 57].
2.6: Materials and Fabrication Technologies
From the early designs of micropumps that were designed via conventional
fabricating methods [22, 23], micropump development has recently become an exclusive
and novel domain for silicon microfabrication. In recent years microfabricated silicon
and glass have been utilized successfully for pump designs, because these processes
present high geometric precision. The drawback to micropumps in general is the long
term fatigue, wear, and failure of mechanical moving parts, such as valves or flaps, which
has been reduced by utilizing silicon micropump fabrication [33, 43]. Due to this
discovery many high performance silicon micromachined devices have been recently
demonstrated in industry [64, 65]. Even though positive advantages have been
discovered, disadvantages do exist. As with most manufacturing processes, the

44
drawbacks center on the high fabrication costs and limited material choice, thus
extending the search for a more affordable, effective, and efficient approach. Currently
strides are being made in polymer microfabrication techniques such as injection molding
[31, 34, 66], polymer hot embossing, and mainly stereolithography [36, 37]. Although
the goal of a true low-cost efficient micropump is promised the aforementioned
microfabrication techniques fall short of satisfactory results. Currently problems exist for
these fabrication techniques due to the complexity of fabrication, expense of the
procedures, and the material-aspect ratio that limits the life span of the device.
Since there has been high cost and complexities associated with silicon and glass
microfabrication techniques, an intriguing concept has been presented by Piet Bergveld’s
group with the work of Bohm et al. [35, 38] who has completed research on
electrochemical pumping principles. As an alternative to polymer microfabrication his
research has utilized a conventional polymer molding process as a true low cost method
to manufacture microdiaphragm pumps with electromagnetic and piezoelectric actuation.
Currently research in this field is using established printed circuit board technology for
microfluidic device development [29]. These relatively new ideas will not provide the
performance of thoroughly designed silicon devices, but will provide an experimental
result that is acceptable with moderate costs associated with fabrication. These
techniques appear to be a popular choice among moderate performance and low cost
applications, but still lack other requirements such as reproducibility and functioning
stability.
45
2.7: Continuous Flow Micropumps
Continuous flow micropumps provide a direct energy transfer and steady flow.
Several principles can be found in literature such as ultrasonic, magnetohydrodynamic
(MHD), electrohydrodynamic (EHD), electrochemical displacement, and electrokinetic
micropumps. The common characteristic that occurs between these micropumps is the
easiness of the microstructures involved since there are no moving parts. Performance on
the other hand is mainly influenced by the properties of the particular fluid which limits
selection and narrowing the fluid field. For most continuous flow pumps a gas is not a
possibility for fluid transportation through these devices.
Electrohydrodynamic (EHD) principle for fluid transportation was proposed in
the 1960s and later researched in the 1990s by Bart et al. [68] and Richter et al. [69, 70]
for their fabricated electrohydrodynamic micropump design. Bart and Richter utilized
the EHD induction effect [68]. This effect revolved around the concept of generating and
moving induced charges through at fluid-fluid or fluid-solid boundary layer and the EHD
injection effect that is based on the electrochemical formation and movement of charged
ions [69, 70]. Richter developed a micropump that consisted of silicon chips with
identical grid electrodes fabricated with the use of anisotropic etching and sputter
deposition of gold, sealed together in pairs, and placed into a flow channel (figure 2.18).
High voltages were applied to the electrodes to inject ions into the fluid, which allowed
the transportation of ions within the electric field between the electrodes to induce fluid
movement through the electrode grids.
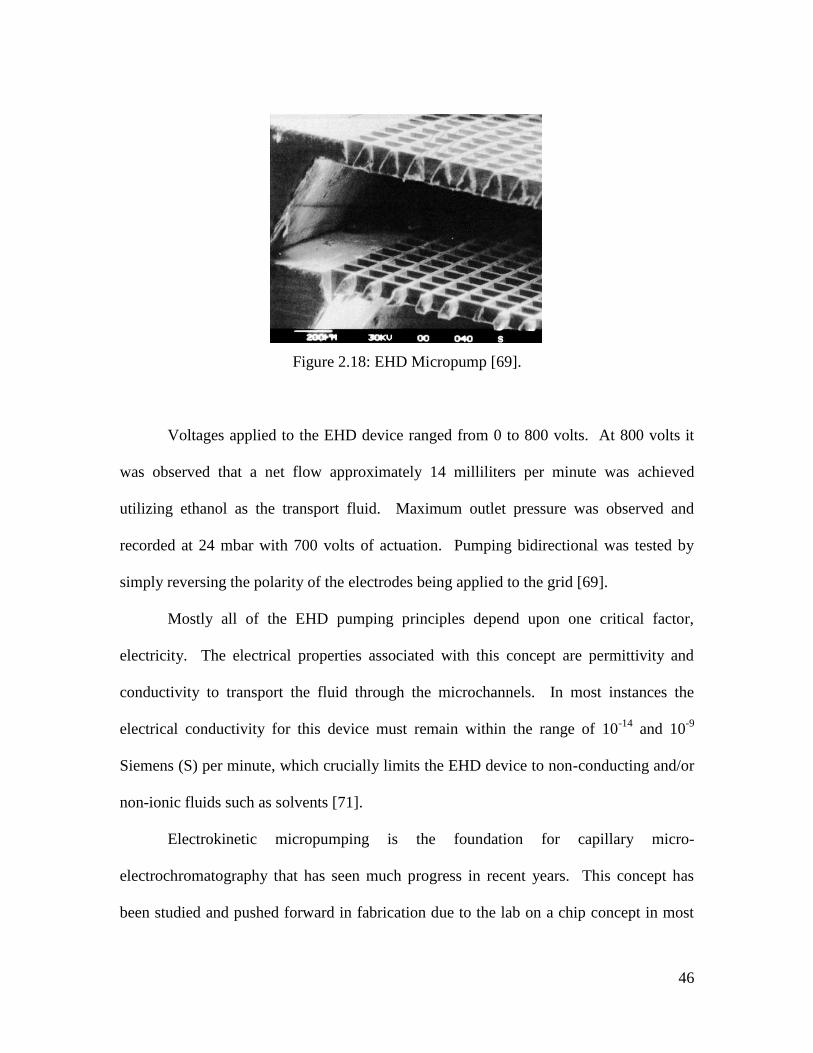
46
Figure 2.18: EHD Micropump [69].
Voltages applied to the EHD device ranged from 0 to 800 volts. At 800 volts it
was observed that a net flow approximately 14 milliliters per minute was achieved
utilizing ethanol as the transport fluid. Maximum outlet pressure was observed and
recorded at 24 mbar with 700 volts of actuation. Pumping bidirectional was tested by
simply reversing the polarity of the electrodes being applied to the grid [69].
Mostly all of the EHD pumping principles depend upon one critical factor,
electricity. The electrical properties associated with this concept are permittivity and
conductivity to transport the fluid through the microchannels. In most instances the
electrical conductivity for this device must remain within the range of 10-14
and 10-9
Siemens (S) per minute, which crucially limits the EHD device to non-conducting and/or
non-ionic fluids such as solvents [71].
Electrokinetic micropumping is the foundation for capillary micro-
electrochromatography that has seen much progress in recent years. This concept has
been studied and pushed forward in fabrication due to the lab on a chip concept in most
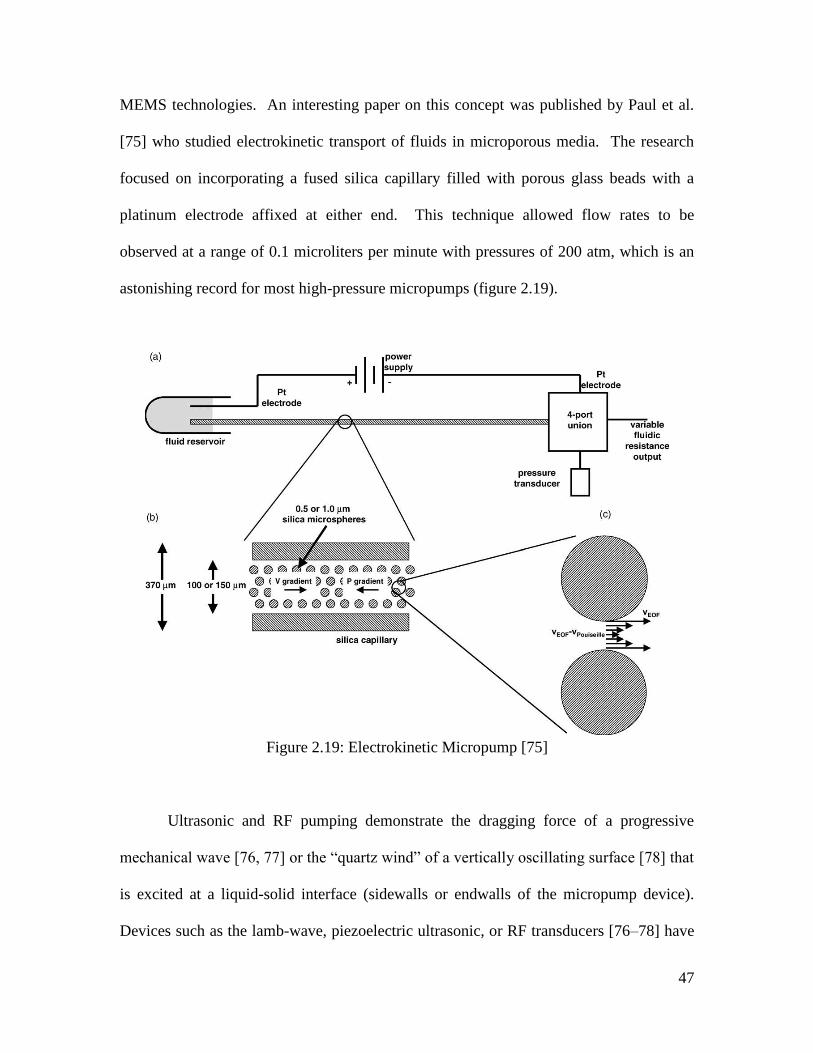
47
MEMS technologies. An interesting paper on this concept was published by Paul et al.
[75] who studied electrokinetic transport of fluids in microporous media. The research
focused on incorporating a fused silica capillary filled with porous glass beads with a
platinum electrode affixed at either end. This technique allowed flow rates to be
observed at a range of 0.1 microliters per minute with pressures of 200 atm, which is an
astonishing record for most high-pressure micropumps (figure 2.19).
Figure 2.19: Electrokinetic Micropump [75]
Ultrasonic and RF pumping demonstrate the dragging force of a progressive
mechanical wave [76, 77] or the “quartz wind” of a vertically oscillating surface [78] that
is excited at a liquid-solid interface (sidewalls or endwalls of the micropump device).
Devices such as the lamb-wave, piezoelectric ultrasonic, or RF transducers [76–78] have
48
been utilized for power generation resulting in frequencies reaching an ultrasonic range
up to 10 MHz. These principles share one common property in literature which is a small
flow rate in the range of microliters/minute coupled with minimal outlet pressure of
roughly 0.13 Pa [76–79]. Most recently these applications are being pursued more
extensively for fluid positioning or micromixing rather than the main search for fluid
transport.
Magnetohydrodynamic (MHD) pumping incorporates the Lorentz effect in
magnetic field theory. This method is focused on the use of an electric current that is
induced between two electrodes located at side walls facing each other within the
microchannel. The injection of charge helps create a transversal ionic current in the
microchannel walls that is concurrently subjected to a magnetic field oriented at an angle
of 90 degrees to current direction and microchannel axis. Based on the Lorentz effect, a
Lorentz force will be generated acting on the ionic current in the solution thus creating a
fluid flow within the microchannel of the device. By nature this pumping technique can
be reversed simply by reversing the magnetic field vector or the electric current
connections. Most micro-MHD pumps can only generate small values associated with
flow rate in the range of microliters per minute and pressures in the range of 1~2 mbar.
The flow rates depend strongly upon the ionic conductivity of the fluid being studied. In
some cases electrolytic bubble generation can occur during DC operation where the
injection electrode is placed. To correct this problem, further studies have concluded that
the issue can be resolved with AC current injection that uses electromagnetism rather
than a permanent magnet [81]. By operating both the magnetic coil and the current
injector from synchronized alternating current sources, the Lorentz vector and fluid flow
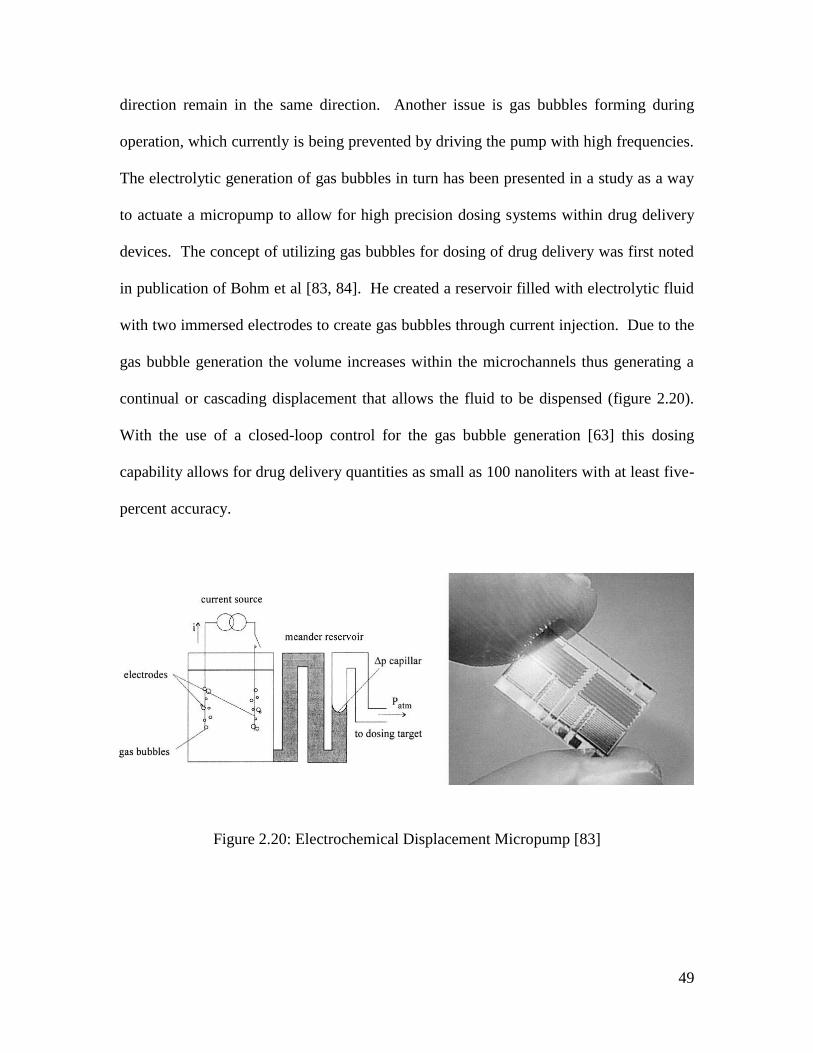
49
direction remain in the same direction. Another issue is gas bubbles forming during
operation, which currently is being prevented by driving the pump with high frequencies.
The electrolytic generation of gas bubbles in turn has been presented in a study as a way
to actuate a micropump to allow for high precision dosing systems within drug delivery
devices. The concept of utilizing gas bubbles for dosing of drug delivery was first noted
in publication of Bohm et al [83, 84]. He created a reservoir filled with electrolytic fluid
with two immersed electrodes to create gas bubbles through current injection. Due to the
gas bubble generation the volume increases within the microchannels thus generating a
continual or cascading displacement that allows the fluid to be dispensed (figure 2.20).
With the use of a closed-loop control for the gas bubble generation [63] this dosing
capability allows for drug delivery quantities as small as 100 nanoliters with at least five-
percent accuracy.
Figure 2.20: Electrochemical Displacement Micropump [83]
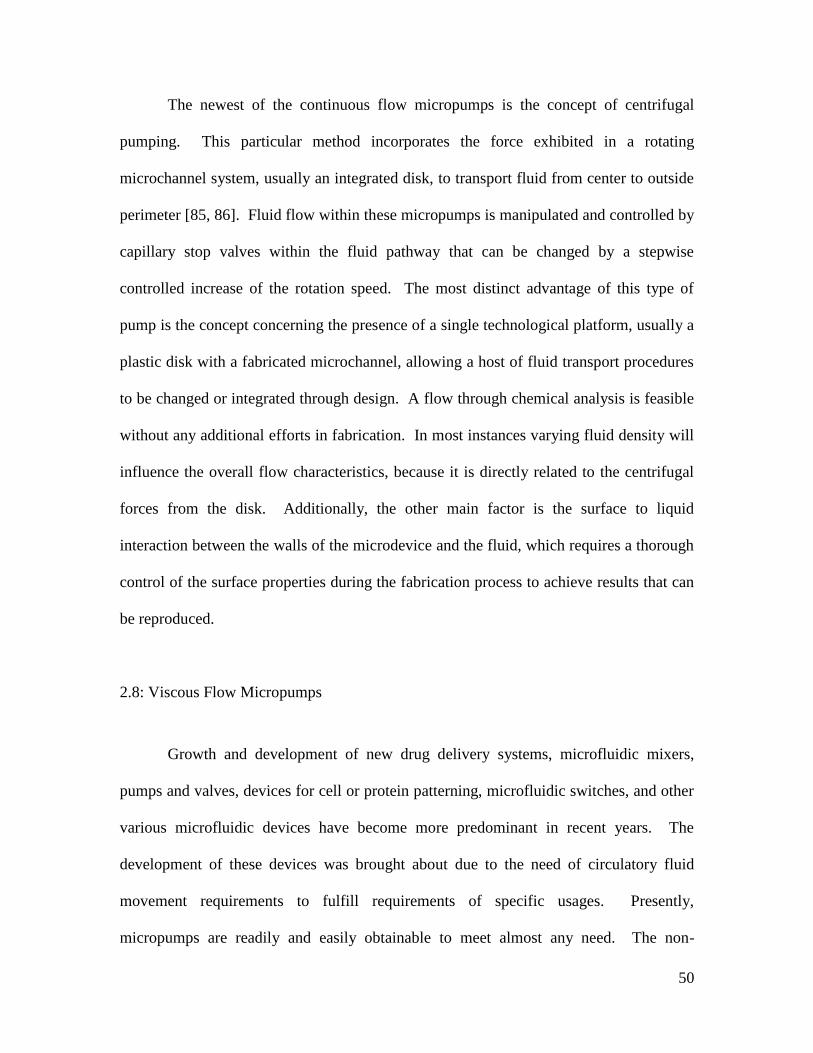
50
The newest of the continuous flow micropumps is the concept of centrifugal
pumping. This particular method incorporates the force exhibited in a rotating
microchannel system, usually an integrated disk, to transport fluid from center to outside
perimeter [85, 86]. Fluid flow within these micropumps is manipulated and controlled by
capillary stop valves within the fluid pathway that can be changed by a stepwise
controlled increase of the rotation speed. The most distinct advantage of this type of
pump is the concept concerning the presence of a single technological platform, usually a
plastic disk with a fabricated microchannel, allowing a host of fluid transport procedures
to be changed or integrated through design. A flow through chemical analysis is feasible
without any additional efforts in fabrication. In most instances varying fluid density will
influence the overall flow characteristics, because it is directly related to the centrifugal
forces from the disk. Additionally, the other main factor is the surface to liquid
interaction between the walls of the microdevice and the fluid, which requires a thorough
control of the surface properties during the fabrication process to achieve results that can
be reproduced.
2.8: Viscous Flow Micropumps
Growth and development of new drug delivery systems, microfluidic mixers,
pumps and valves, devices for cell or protein patterning, microfluidic switches, and other
various microfluidic devices have become more predominant in recent years. The
development of these devices was brought about due to the need of circulatory fluid
movement requirements to fulfill requirements of specific usages. Presently,
micropumps are readily and easily obtainable to meet almost any need. The non-
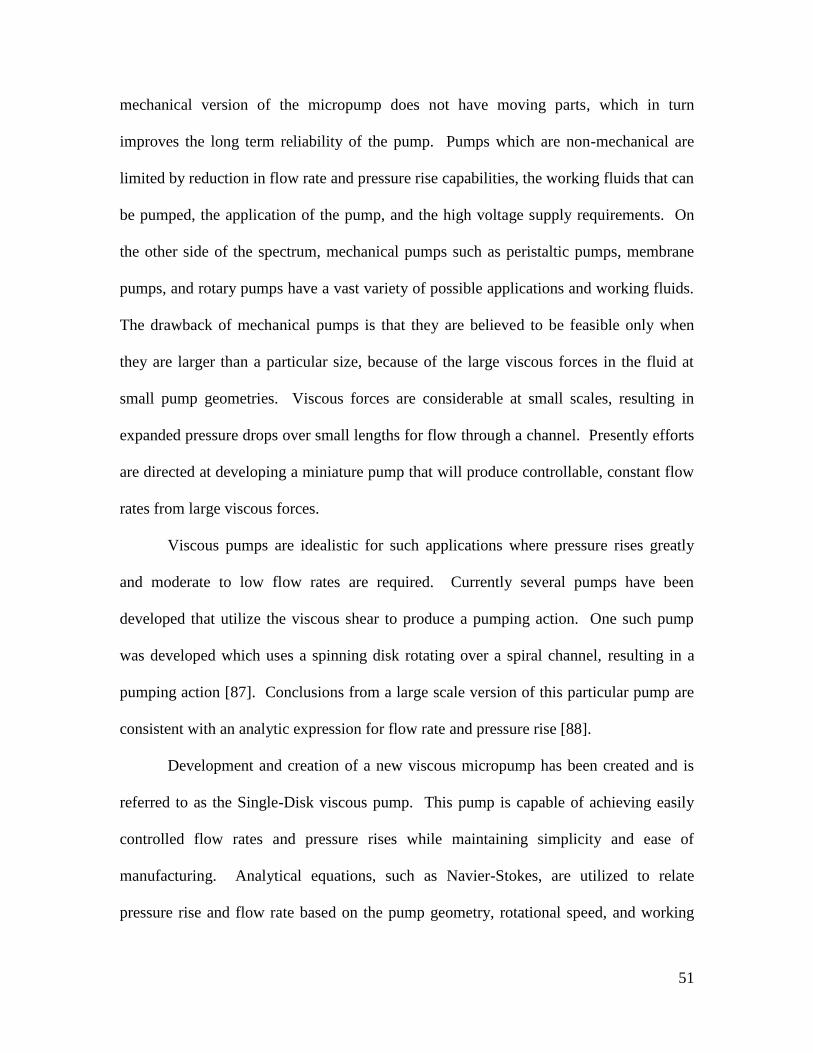
51
mechanical version of the micropump does not have moving parts, which in turn
improves the long term reliability of the pump. Pumps which are non-mechanical are
limited by reduction in flow rate and pressure rise capabilities, the working fluids that can
be pumped, the application of the pump, and the high voltage supply requirements. On
the other side of the spectrum, mechanical pumps such as peristaltic pumps, membrane
pumps, and rotary pumps have a vast variety of possible applications and working fluids.
The drawback of mechanical pumps is that they are believed to be feasible only when
they are larger than a particular size, because of the large viscous forces in the fluid at
small pump geometries. Viscous forces are considerable at small scales, resulting in
expanded pressure drops over small lengths for flow through a channel. Presently efforts
are directed at developing a miniature pump that will produce controllable, constant flow
rates from large viscous forces.
Viscous pumps are idealistic for such applications where pressure rises greatly
and moderate to low flow rates are required. Currently several pumps have been
developed that utilize the viscous shear to produce a pumping action. One such pump
was developed which uses a spinning disk rotating over a spiral channel, resulting in a
pumping action [87]. Conclusions from a large scale version of this particular pump are
consistent with an analytic expression for flow rate and pressure rise [88].
Development and creation of a new viscous micropump has been created and is
referred to as the Single-Disk viscous pump. This pump is capable of achieving easily
controlled flow rates and pressure rises while maintaining simplicity and ease of
manufacturing. Analytical equations, such as Navier-Stokes, are utilized to relate
pressure rise and flow rate based on the pump geometry, rotational speed, and working
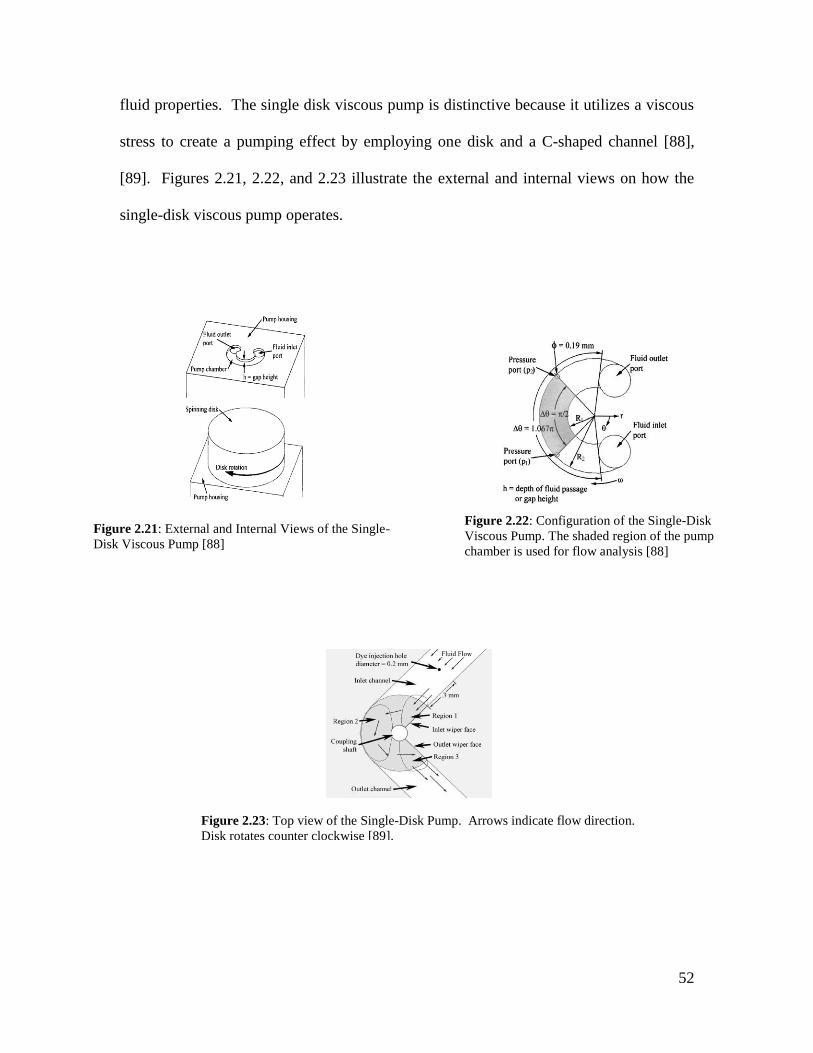
52
fluid properties. The single disk viscous pump is distinctive because it utilizes a viscous
stress to create a pumping effect by employing one disk and a C-shaped channel [88],
[89]. Figures 2.21, 2.22, and 2.23 illustrate the external and internal views on how the
single-disk viscous pump operates.
Figure 2.22: Configuration of the Single-Disk
Viscous Pump. The shaded region of the pump
chamber is used for flow analysis [88]
Figure 2.23: Top view of the Single-Disk Pump. Arrows indicate flow direction.
Disk rotates counter clockwise [89].
Figure 2.21: External and Internal Views of the Single-
Disk Viscous Pump [88]
53
The rotation of the single-disk creates a net movement of fluid due to viscous
stresses imposed on the fluid due to the spinning disk. If the height of the channel that
the fluid is flowing through decreases the Reynolds number reduces and the viscous
forces become much more significant than inertial forces. This leads one to employ an
assumption that allows the advection or inertial term in Navier-Stokes to be insignificant
as compared to the diffusion of momentum terms.
Flow analysis of the single-disk viscous pump requires the use of Navier-Stokes
equations. This involves derivation of an expression for pressure rise and flow rate in
terms of pump geometry, rotational speed of the disk, and fluid properties required to
properly design, develop, and analyze a function viscous single-disk pump [88]. The
analysis that was performed for the single-disk viscous pump resulted in an expression
for pressure rise and flow rate dependent on pump geometry, rotational speed of the disk,
and the fluid properties (refer to figure 2.22).
For the single-disk viscous pump, an incompressible, steady flow of a Newtonian
fluid, with constant viscosity and density was considered. Assumptions about height of
the fluid passage were made as follows: h << (R2 – R1). This assumption allowed for
edge effects near the inner radius and outer radius to be ignored. It was also assumed that
gravity was negligible and the rotational speed of the disks was slow enough such that the
body force due to centrifugal acceleration is negligible compared to the forces produced
by gradients of viscous stresses, and gradients of pressure (which is valid for low
Reynolds numbers) [88], [89]. It must be noted that the gradients of viscous stresses are
assumed to be more significant than the inertial or advection terms in the Navier-Stokes
equation because the fluid motion is produced by viscous forces, and because the flow
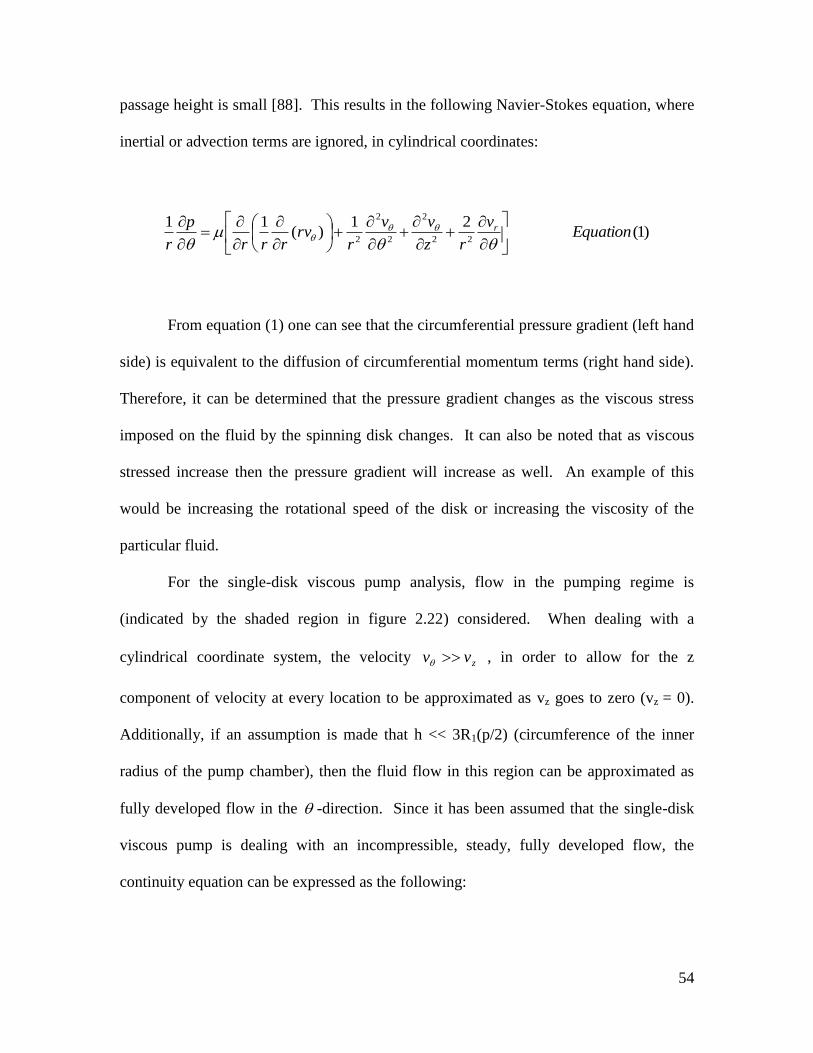
54
passage height is small [88]. This results in the following Navier-Stokes equation, where
inertial or advection terms are ignored, in cylindrical coordinates:
From equation (1) one can see that the circumferential pressure gradient (left hand
side) is equivalent to the diffusion of circumferential momentum terms (right hand side).
Therefore, it can be determined that the pressure gradient changes as the viscous stress
imposed on the fluid by the spinning disk changes. It can also be noted that as viscous
stressed increase then the pressure gradient will increase as well. An example of this
would be increasing the rotational speed of the disk or increasing the viscosity of the
particular fluid.
For the single-disk viscous pump analysis, flow in the pumping regime is
(indicated by the shaded region in figure 2.22) considered. When dealing with a
cylindrical coordinate system, the velocity zvv , in order to allow for the z
component of velocity at every location to be approximated as vz goes to zero (vz = 0).
Additionally, if an assumption is made that h << 3R1(p/2) (circumference of the inner
radius of the pump chamber), then the fluid flow in this region can be approximated as
fully developed flow in the -direction. Since it has been assumed that the single-disk
viscous pump is dealing with an incompressible, steady, fully developed flow, the
continuity equation can be expressed as the following:
)1(21
)(11
22
2
2
2
2Equation
v
rz
vv
rrv
rrr
p
r
r
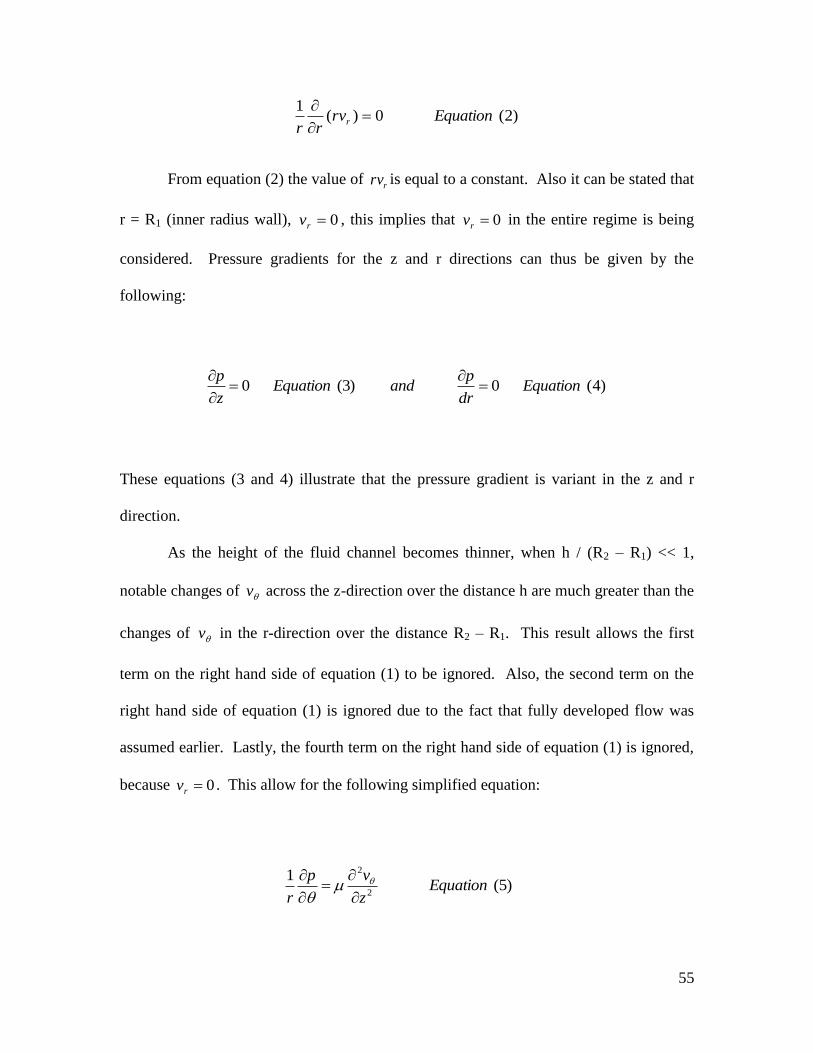
55
From equation (2) the value of rrv is equal to a constant. Also it can be stated that
r = R1 (inner radius wall), 0rv , this implies that 0rv in the entire regime is being
considered. Pressure gradients for the z and r directions can thus be given by the
following:
These equations (3 and 4) illustrate that the pressure gradient is variant in the z and r
direction.
As the height of the fluid channel becomes thinner, when h / (R2 – R1) << 1,
notable changes of v across the z-direction over the distance h are much greater than the
changes of v in the r-direction over the distance R2 – R1. This result allows the first
term on the right hand side of equation (1) to be ignored. Also, the second term on the
right hand side of equation (1) is ignored due to the fact that fully developed flow was
assumed earlier. Lastly, the fourth term on the right hand side of equation (1) is ignored,
because 0rv . This allow for the following simplified equation:
)2(0)(1
Equationrvrr
r
)4(0)3(0 Equationdr
pandEquation
z
p
)5(1
2
2
Equationz
vp
r
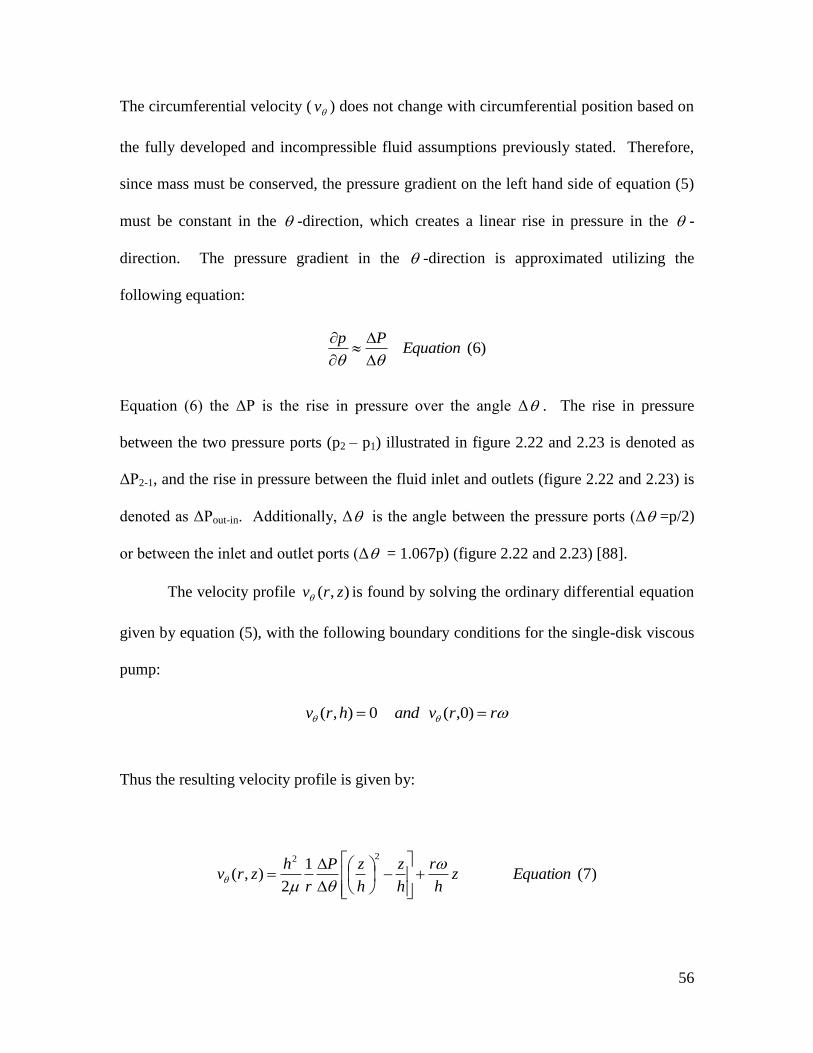
56
The circumferential velocity ( v ) does not change with circumferential position based on
the fully developed and incompressible fluid assumptions previously stated. Therefore,
since mass must be conserved, the pressure gradient on the left hand side of equation (5)
must be constant in the -direction, which creates a linear rise in pressure in the -
direction. The pressure gradient in the -direction is approximated utilizing the
following equation:
Equation (6) the ΔP is the rise in pressure over the angle Δ . The rise in pressure
between the two pressure ports (p2 – p1) illustrated in figure 2.22 and 2.23 is denoted as
ΔP2-1, and the rise in pressure between the fluid inlet and outlets (figure 2.22 and 2.23) is
denoted as ΔPout-in. Additionally, Δ is the angle between the pressure ports (Δ =p/2)
or between the inlet and outlet ports (Δ = 1.067p) (figure 2.22 and 2.23) [88].
The velocity profile ),( zrv is found by solving the ordinary differential equation
given by equation (5), with the following boundary conditions for the single-disk viscous
pump:
Thus the resulting velocity profile is given by:
)6(EquationPp
rrvandhrv )0,(0),(
)7(1
2),(
22
Equationzh
r
h
z
h
zP
r
hzrv
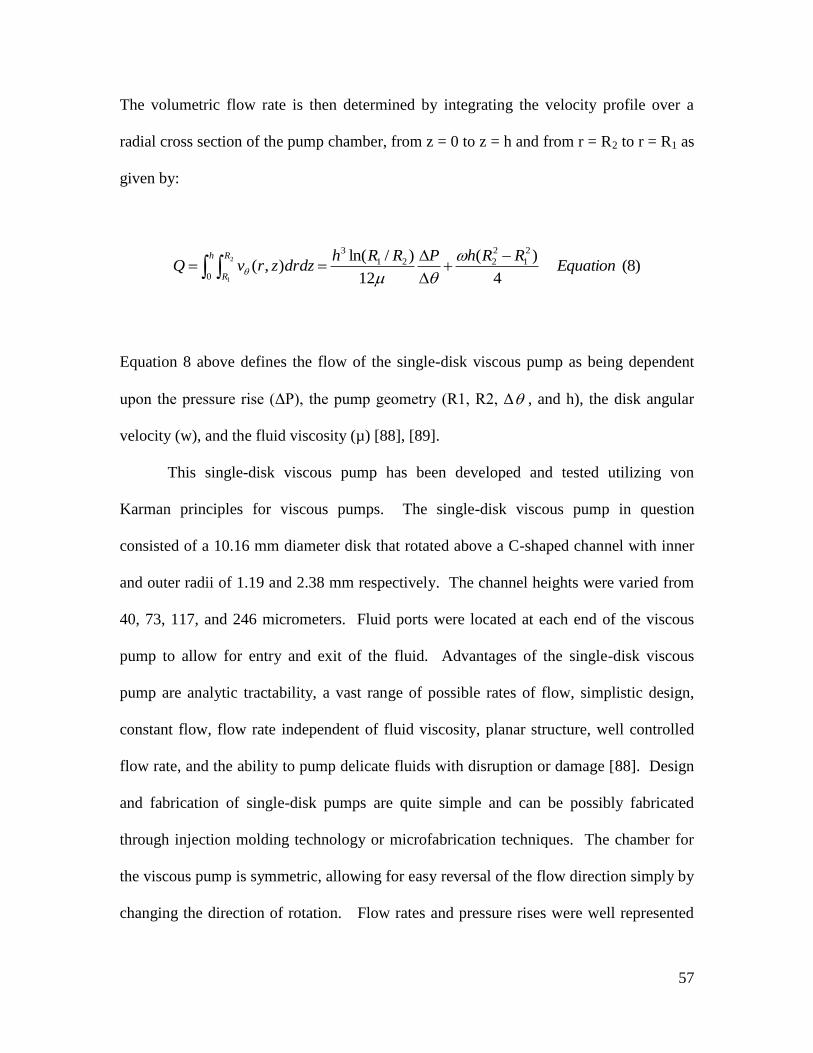
57
The volumetric flow rate is then determined by integrating the velocity profile over a
radial cross section of the pump chamber, from z = 0 to z = h and from r = R2 to r = R1 as
given by:
Equation 8 above defines the flow of the single-disk viscous pump as being dependent
upon the pressure rise (ΔP), the pump geometry (R1, R2, Δ , and h), the disk angular
velocity (w), and the fluid viscosity (µ) [88], [89].
This single-disk viscous pump has been developed and tested utilizing von
Karman principles for viscous pumps. The single-disk viscous pump in question
consisted of a 10.16 mm diameter disk that rotated above a C-shaped channel with inner
and outer radii of 1.19 and 2.38 mm respectively. The channel heights were varied from
40, 73, 117, and 246 micrometers. Fluid ports were located at each end of the viscous
pump to allow for entry and exit of the fluid. Advantages of the single-disk viscous
pump are analytic tractability, a vast range of possible rates of flow, simplistic design,
constant flow, flow rate independent of fluid viscosity, planar structure, well controlled
flow rate, and the ability to pump delicate fluids with disruption or damage [88]. Design
and fabrication of single-disk pumps are quite simple and can be possibly fabricated
through injection molding technology or microfabrication techniques. The chamber for
the viscous pump is symmetric, allowing for easy reversal of the flow direction simply by
changing the direction of rotation. Flow rates and pressure rises were well represented
)8(4
)(
12
)/ln(),(
2
1
2
2
0
21
32
1
EquationRRhPRRh
drdzzrvQh R
R
58
by equation (8) for rotational speeds of 100 – 5000 rpm, fluid viscosities of 1 – 62 mPa
s, flow passage heights of 40 – 246 micrometers, pressure rises of 0 – 31.1 kPa, and flow
rates of 0 – 4.75 ml/min. It must be noted that deviation between equation 8 and
experimental data increases for Reynolds numbers that exceed 110 [88], [89].
The theoretical and experimental rises in pressure show a nearly linear
relationship for variation in flow rate. Pressure rise increases as the flow passage height
reduces for a particular speed of rotation. When ΔP = 0, maximum volumetric flow rate
is achieved and is found to vary linearly with rotational speed. Volumetric flow rate for
the single-disk viscous pump is independent of the fluid viscosity. Also, the pressure rise
through the pumping chamber can be raised by increasing the span of the circumference
of the shear channel or by reducing the height of the fluid passage. On the other hand,
flow rate in the pumping chamber can be increased by increasing the height of the fluid
passage, increasing the width of the pumping chamber, or by increasing the speed of
rotation [88].
The overall efficiency of the single-disk viscous pump was determined using the
equation TPQ / . Usually a typical efficiency of 0.25 or 25% occurs at a
rotational speed of 1000 rpm, a pump chamber height of 117 µm, and water as the
working fluid. Such a value does not take into account for any type of motor losses [88],
[89]. This type of pump can be utilized for an array of applications such as mixing fluids,
transport of chemical and biomedical fluids, drug delivery, electronic cooling, and sorting
particles.
59
2.9: Micropumps and Micro-Total Analysis Systems
Micro total analysis systems (µTAS) is a concept first introduced and proposed by
Manz et al. [90] that has created widespread research to incorporate chemical sensors and
sample processes into highly fabricated miniaturized self-sufficient analytical systems.
Stepping away from the microfabrication (miniaturization) idea and focusing mainly on
the integration of fluid flow analysis and chemical sensors has provided several
advantageous ideals. Combining ion-sensitive field-effect transistors (ISFETs) and
micropump fabrication technology with micro total analysis systems research has helped
develop these issues.
In the 1990s Gumbrecht et al. [91] established a microfluidic concept that became
quite popular and well known in the micro-total analysis systems research dealing with
an ISFET based pH detection system for clinical monitoring. The approach was founded
on the combination of microchannels, syringe pumps, and monolithic ISFET arrays. This
approach utilizes the excellent pairing of chemical and electrical properties within a
monolithic sensor array coupled with an appropriate liquid handling component to
suppress the common noise disturbances. Additionally, a stable electrochemical
reference potential is matched that permits the application of metal reference electrode as
opposed to the fragile, redundant maintenance of glass reference electrodes.
These fabrication techniques have been studied and evaluated. The fabrication
studied [92] used ISFET sensors coupled with Si3N4 gate insulators that are identified as
possessing relatively high drift and hysteresis properties. Even though these gate
insulators exhibited such traits, it turned out that a pH detection accuracy of 0.002 was
able to be achieved in series measurements with a constant sample pH. As the study was
60
evaluated using alternate pH steps of +/- 1 unit, which provided a worst case scenario, the
hysteresis effect of the ISFET sensor was still greatly reduced to approximately 0.01 –
0.02 pH degrees. This type of behavior is highly favored during the study and was also
tested under more practical conditions, such as organ systems, where pH deviations of
0.04 could easily be detected [93].
Besides the high measurement precision exhibited, Gumbrecht’s principle does
not require a physical contact between the solution sample and the micropump. His
approach is well suited for a realization with micropump technology which is more
frequently prone to contamination from external sources. This advantage was first
studied by van der Schoot et al. [94] with a hybrid micro total analysis system fabricated
from two microdiaphragm pumps and potassium (K+) sensitive ISFET as the sensing
element. Based on measurement curves established from this research the systems were
capable of measuring potassium concentrations with high precision and consistent
reproducibility [94]. A number of similar micro total analysis systems have been studied
recently in the 1990s, based either on micropump technology [95, 96] or on conventional
pumps [97]. The vast rise of research on such devices created the foundation for a
dedicated conference series on micro total analysis systems in the mid-1990s. During
this conference some predominant results were concerning the micro-total analysis
system concept as a combination of mechanical micropumps, microchannel systems, and
chemical sensors resulting in similar concepts of flow-through chemical analysis [98, 99].
From these studies a major drawback came to be known involving performance
deficiencies associated with these devices. Several of the studies at this time were not
including basic requirements such as self-priming, bubble tolerance, high system
61
complexities, interferences between sensors and actuators, and problems associated with
hybrid or monolithic integration. These factors that were overlooked and not well
presented have slowed the progression toward fully integrated systems.
Currently the focus on micro-total analysis systems research has begun to
progress towards electrochromatography. Advancement in this direction has prompted
further development of electrokinetic microfluidic pumping in association with all
microfluidic devices. Traditional flow-through analysis ideas of centrifugal fluid
transport have become a better alternative to mechanical micropumps [100, 101].
Although recent studies have focused toward micro-total analysis systems, it must be
noted that research involving fluid handling, fluid transport, and chemical analysis
through microdevices has provided a very effective and constant simulation of
microfluidic research.
2.10: Conclusions
It can be seen from the literary review of micropumps that an amazing multitude
of pump designs have been fabricated with various technologies. The beginning research
and development of these devices began in the 1970s and was pushed toward the MEMs
technology in the early 1990s. The main component of this research focuses on the
exploration of new ideas concerning the conceptual design of these micropumps.
Research that has been conducted provides a positive view on the whole spectrum of
micropump concepts, fabrication technologies, actuation principles, and valve designs for
these types of devices. The overall goal of each investigation was to obtain a novel
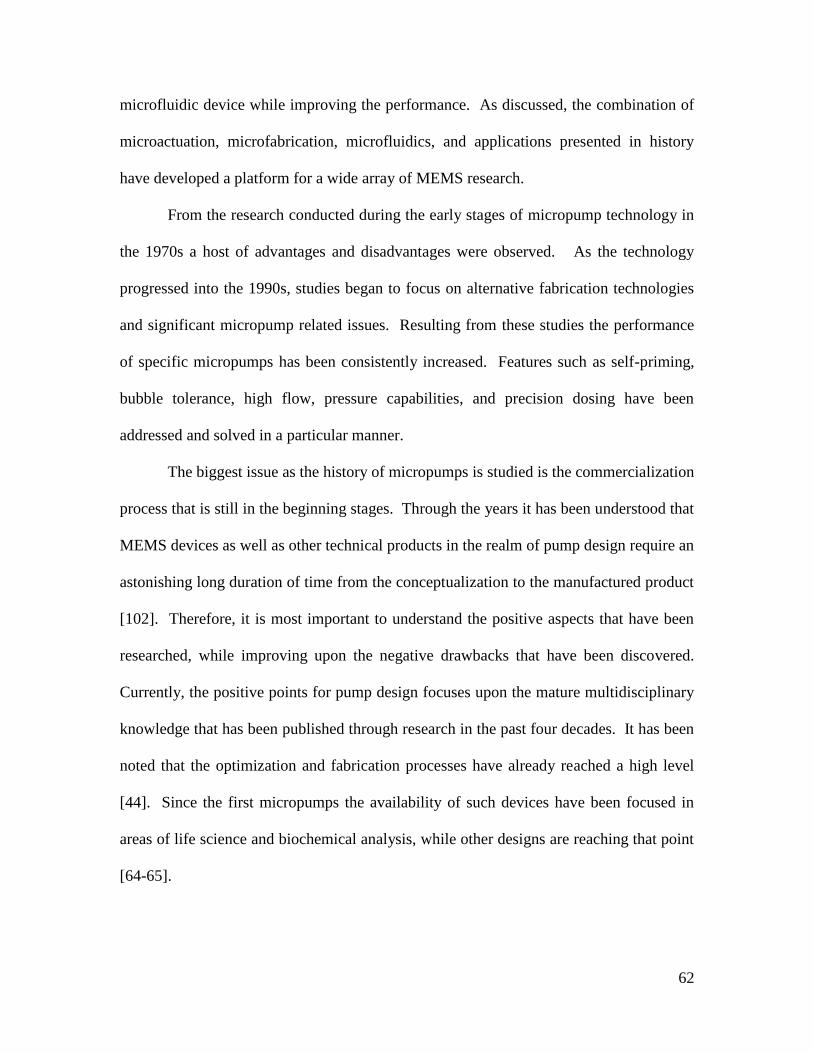
62
microfluidic device while improving the performance. As discussed, the combination of
microactuation, microfabrication, microfluidics, and applications presented in history
have developed a platform for a wide array of MEMS research.
From the research conducted during the early stages of micropump technology in
the 1970s a host of advantages and disadvantages were observed. As the technology
progressed into the 1990s, studies began to focus on alternative fabrication technologies
and significant micropump related issues. Resulting from these studies the performance
of specific micropumps has been consistently increased. Features such as self-priming,
bubble tolerance, high flow, pressure capabilities, and precision dosing have been
addressed and solved in a particular manner.
The biggest issue as the history of micropumps is studied is the commercialization
process that is still in the beginning stages. Through the years it has been understood that
MEMS devices as well as other technical products in the realm of pump design require an
astonishing long duration of time from the conceptualization to the manufactured product
[102]. Therefore, it is most important to understand the positive aspects that have been
researched, while improving upon the negative drawbacks that have been discovered.
Currently, the positive points for pump design focuses upon the mature multidisciplinary
knowledge that has been published through research in the past four decades. It has been
noted that the optimization and fabrication processes have already reached a high level
[44]. Since the first micropumps the availability of such devices have been focused in
areas of life science and biochemical analysis, while other designs are reaching that point
[64-65].
63
Presently and in the future the main concern for the devices to be acceptable and
readably useable relies on two main points. The first is the fabrication techniques and the
second is a combination of performance and reproducibility. Utilizing an optimum
fabrication process coupled with a fast, precise, reproducible process will assist in
obtaining a micropump device that will possess high performance characteristics. Even
though perfection and constant reproducibility through manufacturing is still needed a
strong focus is still required within the commercialization and basic research. There is
still a vast amount of knowledge required to understand the fundamentals processes
occurring within micropumps and microfluidic devices such as influences of medium
properties, liquid-surface interactions, and long term effects from usage. While
micropump technology appears to be almost forty years old it is still a relatively new
idea. Micropump technology is still in its infancy requiring more research concerning the
design, fabrication, actuation, and manufacturability techniques to make this type of
device a commercialized product that is effective globally in the technological field.
As discussed in this chapter micropumps, part of most microfluidic systems,
typically control the movement of small fluid volumes. A number of micropumps have
been designed, fabricated and investigated for use in many applications including drug
delivery systems [22-24], insulin injectors [25], artificial prostheses [26, 27], liquid
cooling systems [28, 29], fuel cells [30], space missions [31, 32], as well as
macromolecular and cell analysis [33]. In general, micropumps consist of two
nozzle/diffuser elements, which transport fluids from an inlet to an outlet, through
pumping action, and have been successfully employed in many applications. One of the
drawbacks of the nozzle/diffuser micropump is the back flow resulting from the operating
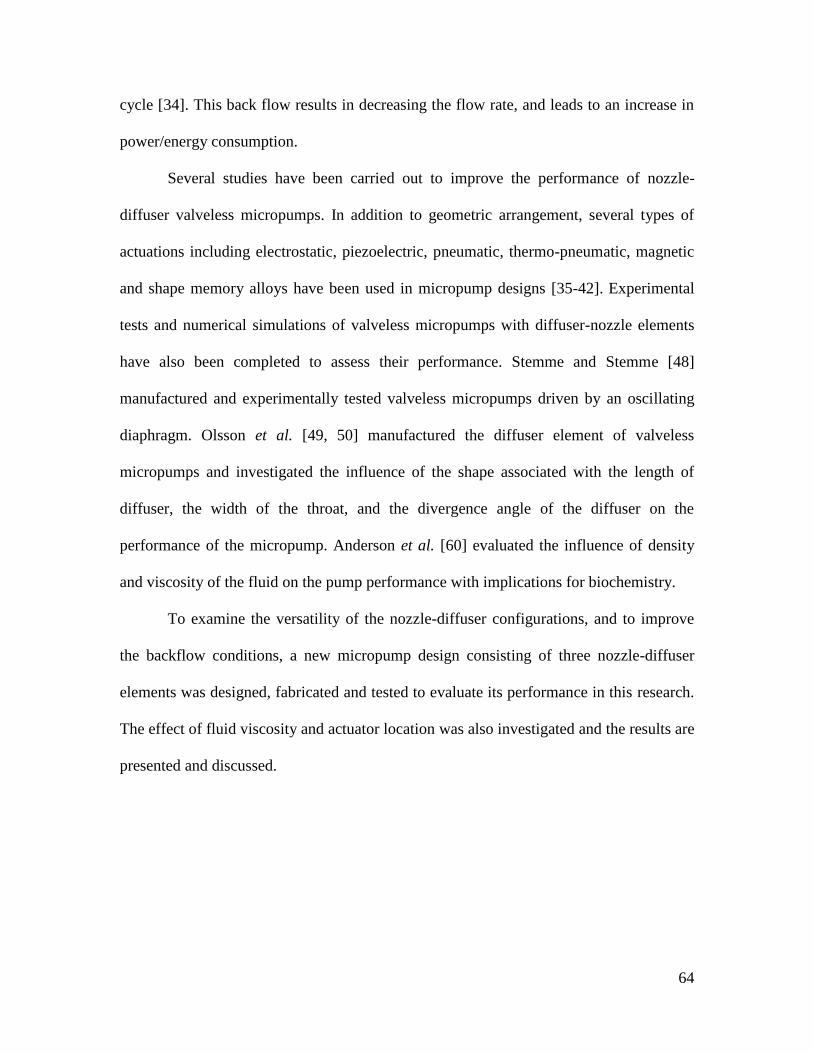
64
cycle [34]. This back flow results in decreasing the flow rate, and leads to an increase in
power/energy consumption.
Several studies have been carried out to improve the performance of nozzle-
diffuser valveless micropumps. In addition to geometric arrangement, several types of
actuations including electrostatic, piezoelectric, pneumatic, thermo-pneumatic, magnetic
and shape memory alloys have been used in micropump designs [35-42]. Experimental
tests and numerical simulations of valveless micropumps with diffuser-nozzle elements
have also been completed to assess their performance. Stemme and Stemme [48]
manufactured and experimentally tested valveless micropumps driven by an oscillating
diaphragm. Olsson et al. [49, 50] manufactured the diffuser element of valveless
micropumps and investigated the influence of the shape associated with the length of
diffuser, the width of the throat, and the divergence angle of the diffuser on the
performance of the micropump. Anderson et al. [60] evaluated the influence of density
and viscosity of the fluid on the pump performance with implications for biochemistry.
To examine the versatility of the nozzle-diffuser configurations, and to improve
the backflow conditions, a new micropump design consisting of three nozzle-diffuser
elements was designed, fabricated and tested to evaluate its performance in this research.
The effect of fluid viscosity and actuator location was also investigated and the results are
presented and discussed.

65
CHAPTER 3 – Fabrication and Manufacturing Methods
3.1: Overview of PDMS Micropump Design
The proposed design of the micropump is shown in Figure 3.1 in the beginning stages as
an idealized concept shown in SolidWorks. This micropump has gone through several different
design concepts. Initially the first design (Figure 3.2) consisted of four walls.
Figure 3.1: Three-wall Micropump Design Concept
Figure 3.2: Fluid Velocity of Four Wall Micropump

66
From the analysis of the four wall micropump it was determined that the fluid velocity
was very minimal from the inlet to the outlet side of the micropump. From this simulation it was
determined that a four-wall pump would not give the proper flow that is desired. Also the height
that was tested was approximately one-hundred micrometers. At this height the micropump
would collapse from pressure applied to the top. Sidewall actuation was studied and the walls
were not high enough to give proper deformation to provide the proper fluid flow. To generate
optimal fluid flow it was determined that a three-wall micropump should be designed with inlet
angles between 5 ~ 20 degrees. The height of the micropump chambers must be approximately
four-hundred micrometers or greater to eliminate collapsing of the pump.
Studies of the three-wall micropump were initially tested and results were formed with
the use of ANSYS as previously explained in chapter 2. From this analysis it can be determined
that the flow rate will be optimal and the micropump will possess good flow characteristics. An
example of this analysis is shown in figures 3.3 and 3.4.
Figure 3.3: Fluid Velocity Plot
67
Figure 3.4: Fluid Vector Plot
Two methods for fabricating and designing the micropump have been initiated and
completed. The first process involves the VMC Microelectronics Laboratory at VCU, and the
second involves Design Optimization and Rapid prototyping Techniques. In the VMC
Microelectronics Lab, an IC Station file of the micropump design was created and used in the
clean room to create a mask. A silicon wafer was then chosen to begin the build of the
micropump. On the wafer a layer of SU-8 negative photoresist was applied with an overall
thickness of fifty micrometers. Diffusion lithography was then performed to create the
micropump pattern in the photoresist layer. PDMS was then successfully poured into the pattern,
resulting in the desired micropump in Figure 3.5.
Figure 3.5: PDMS Micropump
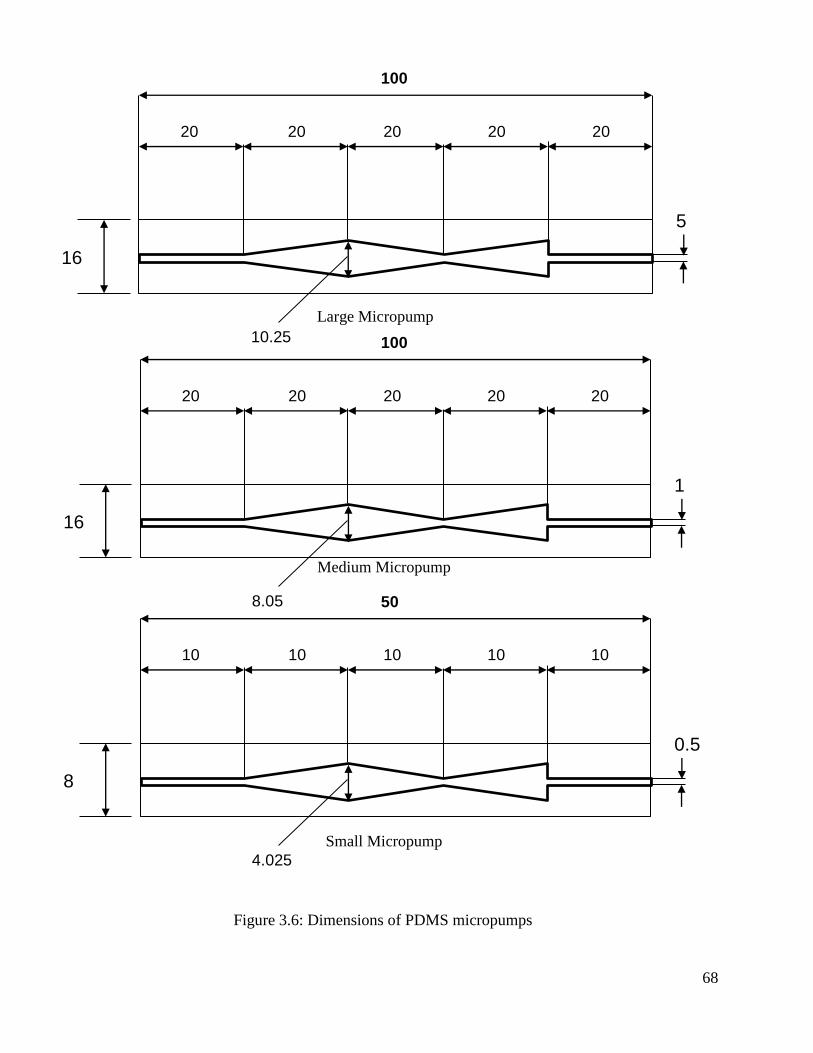
68
Figure 3.6: Dimensions of PDMS micropumps
Medium Micropump
100
20 20 20 20 20
1
8.05
16
Large Micropump
100
20 20 20 20 20
5
10.25
16
50
10 10 10 10 10
0.5
4.025
8
Small Micropump

69
The second fabrication process involves SolidWorks and Rapid Prototyping Machinery.
A particular rapid prototyping machine was utilized in the fabrication, which involves
stereolithography. Stereolithography is a common rapid prototyping technique used for
producing parts with high accuracy and good surface finish. This form of rapid prototyping is
performed by a Stereolithography Apparatus (SLA). Stereolithography is an additive
fabrication process that utilizes a vat of liquid UV curable photopolymer “resin” and a UV laser
to construct parts or models one layer at a time. For each layer, the UV laser beam traces a part
cross-section pattern on the surface of the liquid resin. The exposure to the UV laser light
solidifies and cures the pattern traced on the resin, thus, adhering it to the previous layer below it.
Once a pattern has been outlined (traced), the Stereolithography’s Apparatus elevator
platform descends by a single layer thickness, typically 0.05 millimeter to 0.15 millimeter
(0.002” to 0.006”). After the platform has descended into the resin, a resin filled blade
squeegees across the part or model’s cross-section. This allows the part or model to be recoated
with fresh resin material. Once the part or model has been recoated with a new resin layer, the
subsequent layer pattern is traced, thus adhering to the previous layer. A complete three-
dimensional part or model can be formed by this process. After the parts are built, they are
removed and cleaned of excess resin by simply immersing the part in a chemical bath. Once the
part has been fully clean it is then cured in an ultraviolet oven.
Stereolithography requires the use of support structures to adhere the part or model to the
elevator platform. These support structures also prevent certain part geometries from deflecting
due to gravity as well as accurately holding the two-dimensional cross sections in place to resist
lateral pressure from the re-coater squeegee blade. Supports are usually generated automatically
during the preparation of the three-dimensional CAD files for use in the stereolithography
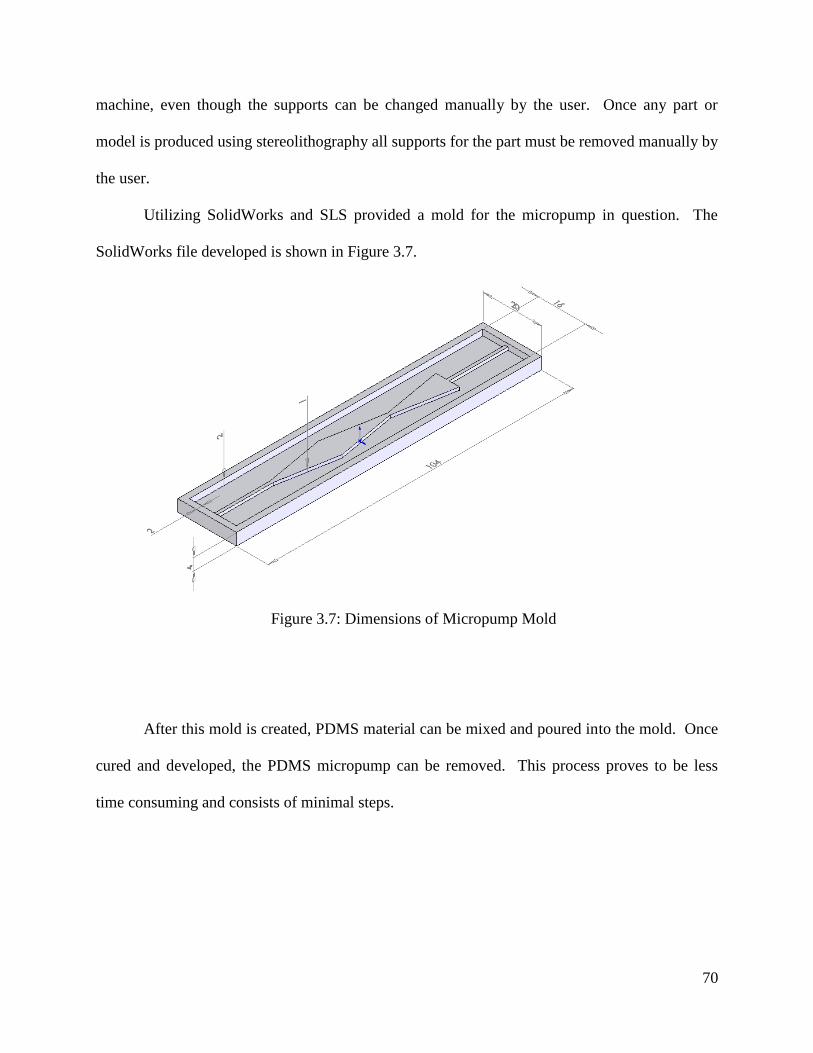
70
machine, even though the supports can be changed manually by the user. Once any part or
model is produced using stereolithography all supports for the part must be removed manually by
the user.
Utilizing SolidWorks and SLS provided a mold for the micropump in question. The
SolidWorks file developed is shown in Figure 3.7.
Figure 3.7: Dimensions of Micropump Mold
After this mold is created, PDMS material can be mixed and poured into the mold. Once
cured and developed, the PDMS micropump can be removed. This process proves to be less
time consuming and consists of minimal steps.

71
3.2: PDMS Micropump Fabrication Method I - VMC Cleanroom MEMS Process
3.2.1 – Fabrication and Manufacturing of an Electrostatic Actuated Micropump
Fabrication of an electrostatic actuated micropump has been proposed and is illustrated in
figure 3.8. The flow region of the micropump is actuated by six electrostatic pump chambers.
Each pump chamber will exhibit a thin flexible wall separating it from the central fluid flow
region. These pumping chambers will consist of an electrode on top and bottom surfaces. The
top surface will consist of PDMS which will allow flexibility of the chambers during actuation.
Each of these electrodes can be actuated with independent voltage sources to drive the pump. As
voltage is applied the electrostatic phenomenon will attract the two electrodes together. This
movement will allow pressure to increase within the chamber and result in the thin wall
surrounding the chamber to expand into the flow regime. The flow region is divided into three
walls with chambers for pumping located on each side to apply a pulsating sequence of
activation. Actuation electrostatically will exhibit a cascading motion for moving the fluid.
Fabrication processes which are the main focus of the research are centered on a novel
fabrication technique for microfluidic devices based on a common polymer material
polydimethylsiloxane (PDMS). The micropump will be created, constructed, and fabricated
from a generated wafer procedure in the VMC cleanroom. Metal electrodes will be placed upon
the PDMS fabricated pump and sealed to another glass wafer with electrical connections. This
process will be discussed in detail within this section.
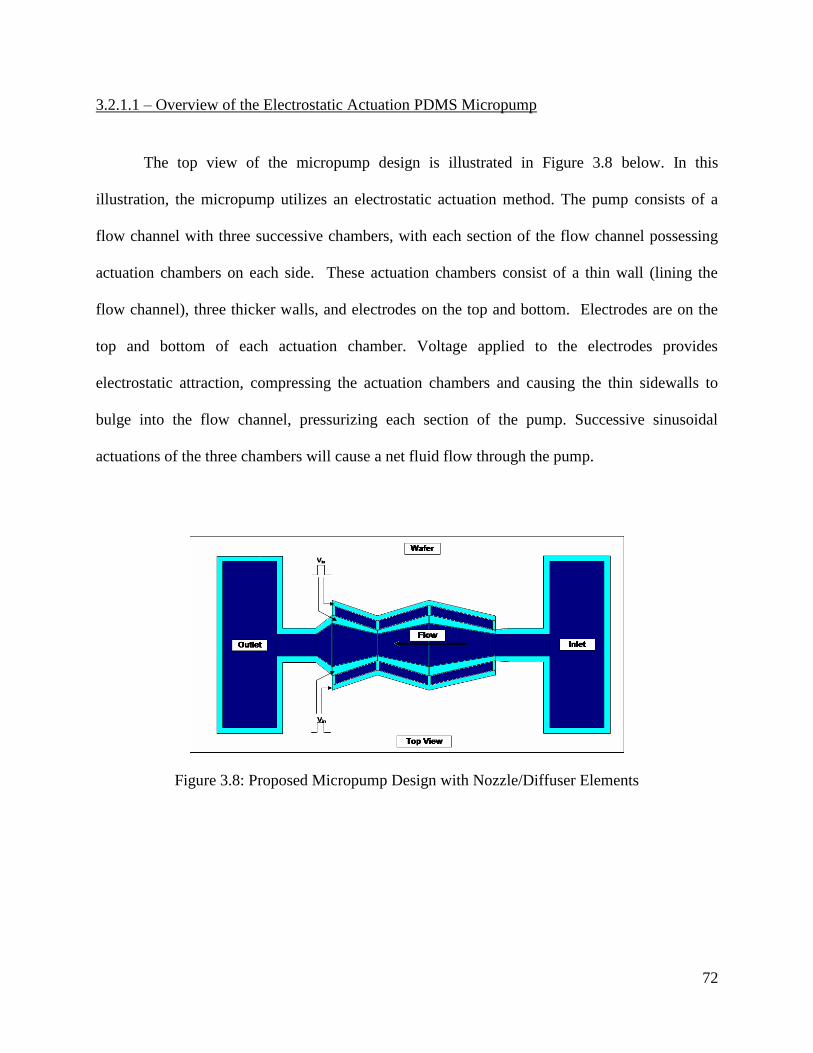
72
3.2.1.1 – Overview of the Electrostatic Actuation PDMS Micropump
The top view of the micropump design is illustrated in Figure 3.8 below. In this
illustration, the micropump utilizes an electrostatic actuation method. The pump consists of a
flow channel with three successive chambers, with each section of the flow channel possessing
actuation chambers on each side. These actuation chambers consist of a thin wall (lining the
flow channel), three thicker walls, and electrodes on the top and bottom. Electrodes are on the
top and bottom of each actuation chamber. Voltage applied to the electrodes provides
electrostatic attraction, compressing the actuation chambers and causing the thin sidewalls to
bulge into the flow channel, pressurizing each section of the pump. Successive sinusoidal
actuations of the three chambers will cause a net fluid flow through the pump.
Figure 3.8: Proposed Micropump Design with Nozzle/Diffuser Elements
73
3.2.1.2 – PDMS Micropump with Electrostatic Actuation Fabrication Process
The PDMS micropump is fabricated in two parts: one molded PDMS layer and a second
metalized glass substrate. The PDMS molded layer contains the flow channel, actuation
chambers with top electrodes and inlet and outlet reservoirs. This molded PDMS layer was
created and peeled from a silicon wafer with an SU-8 negative resist pattern. The bottom
substrate is a glass wafer with the lower electrode pattern. Bonding both wafers together creates
a sealed, functional micropump.
3.2.1.3 – Photo Mask (IC Station) Method
Layouts for the micropump design were generated using the Mentor Graphics layout tool
(IC Station) and a mask set for the micropump design was created using an Electromask pattern
generator. Integrated Circuit (IC) station is UNIX based software that allows the user to design
the particular layout for microelectronic devices. Illustrated below in figure 3.9 below is the IC
station software with the electrostatic PDMS micropump design layout. This particular layout
consisted of a reference layer (utilized to align all layers), PDMS layer, Metallization Layer, and
Wafer Metallization layer. Each of these layers required a separate photomask generated and
created in the VMC cleanroom. The photomask generator that must be operated with care and
the photomasks that were generated and created are shown in figures 3.10, 3.11, and 3.12.

74
Figure 3.9: IC Station Software depicting Electrostatic PDMS Micropump
Figure 3.10: Photomask generator in VMC Cleanroom
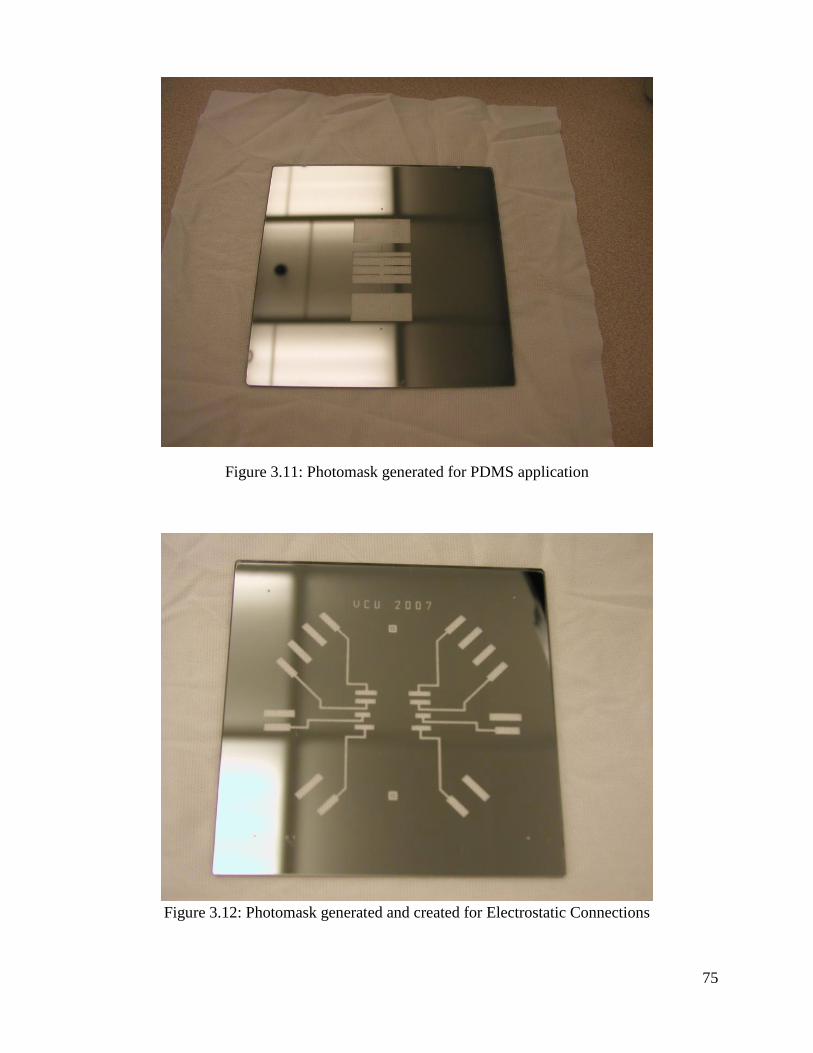
75
Figure 3.11: Photomask generated for PDMS application
Figure 3.12: Photomask generated and created for Electrostatic Connections
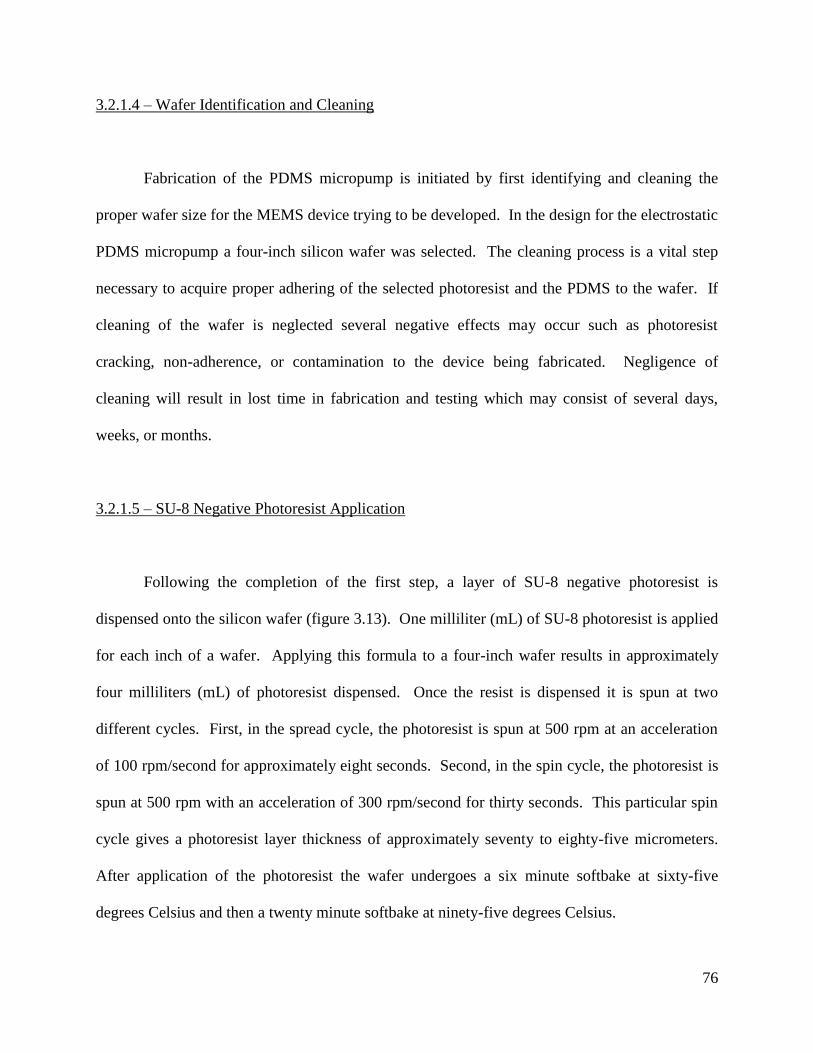
76
3.2.1.4 – Wafer Identification and Cleaning
Fabrication of the PDMS micropump is initiated by first identifying and cleaning the
proper wafer size for the MEMS device trying to be developed. In the design for the electrostatic
PDMS micropump a four-inch silicon wafer was selected. The cleaning process is a vital step
necessary to acquire proper adhering of the selected photoresist and the PDMS to the wafer. If
cleaning of the wafer is neglected several negative effects may occur such as photoresist
cracking, non-adherence, or contamination to the device being fabricated. Negligence of
cleaning will result in lost time in fabrication and testing which may consist of several days,
weeks, or months.
3.2.1.5 – SU-8 Negative Photoresist Application
Following the completion of the first step, a layer of SU-8 negative photoresist is
dispensed onto the silicon wafer (figure 3.13). One milliliter (mL) of SU-8 photoresist is applied
for each inch of a wafer. Applying this formula to a four-inch wafer results in approximately
four milliliters (mL) of photoresist dispensed. Once the resist is dispensed it is spun at two
different cycles. First, in the spread cycle, the photoresist is spun at 500 rpm at an acceleration
of 100 rpm/second for approximately eight seconds. Second, in the spin cycle, the photoresist is
spun at 500 rpm with an acceleration of 300 rpm/second for thirty seconds. This particular spin
cycle gives a photoresist layer thickness of approximately seventy to eighty-five micrometers.
After application of the photoresist the wafer undergoes a six minute softbake at sixty-five
degrees Celsius and then a twenty minute softbake at ninety-five degrees Celsius.

77
SU-8 Negative Photoresist
Application
Cross-Section Top View
SU-8 Negative Photoresist
Application
Cross-Section Top View
Figure 3.13: SU-8 Negative Photoresist Application
3.2.1.6 – Diffusion Lithography
Next the wafer undergoes contact lithography. A photomask (which was developed
using IC station and a mask generator) is utilized to pattern the desired PDMS micropump into
the SU-8 photoresist. The photomask is placed over the SU-8 photoresist utilizing a contact
lithography machine and then subjected to UV light for approximately fourteen seconds before
being removed. Upon removal the wafer then undergoes a post-exposure bake consisting of two
phases. First, the wafer is baked on a hotplate at sixty-five degrees Celsius for one minute.
Second, the wafer is then baked at ninety-five degrees Celsius for nine minutes. This procedure
is done to make sure that the photoresist is fully cured, hardened, and solidified before it
undergoes development.
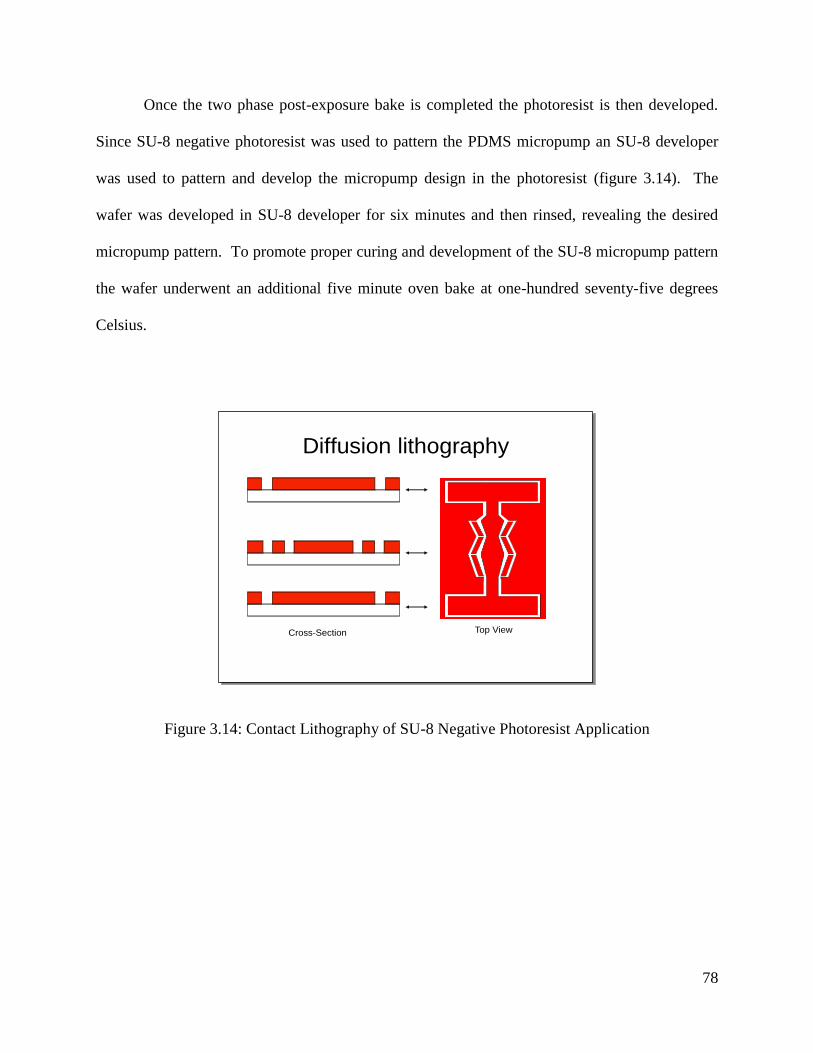
78
Diffusion lithography
Cross-Section Top View
Diffusion lithography
Cross-Section Top View
Once the two phase post-exposure bake is completed the photoresist is then developed.
Since SU-8 negative photoresist was used to pattern the PDMS micropump an SU-8 developer
was used to pattern and develop the micropump design in the photoresist (figure 3.14). The
wafer was developed in SU-8 developer for six minutes and then rinsed, revealing the desired
micropump pattern. To promote proper curing and development of the SU-8 micropump pattern
the wafer underwent an additional five minute oven bake at one-hundred seventy-five degrees
Celsius.
Figure 3.14: Contact Lithography of SU-8 Negative Photoresist Application
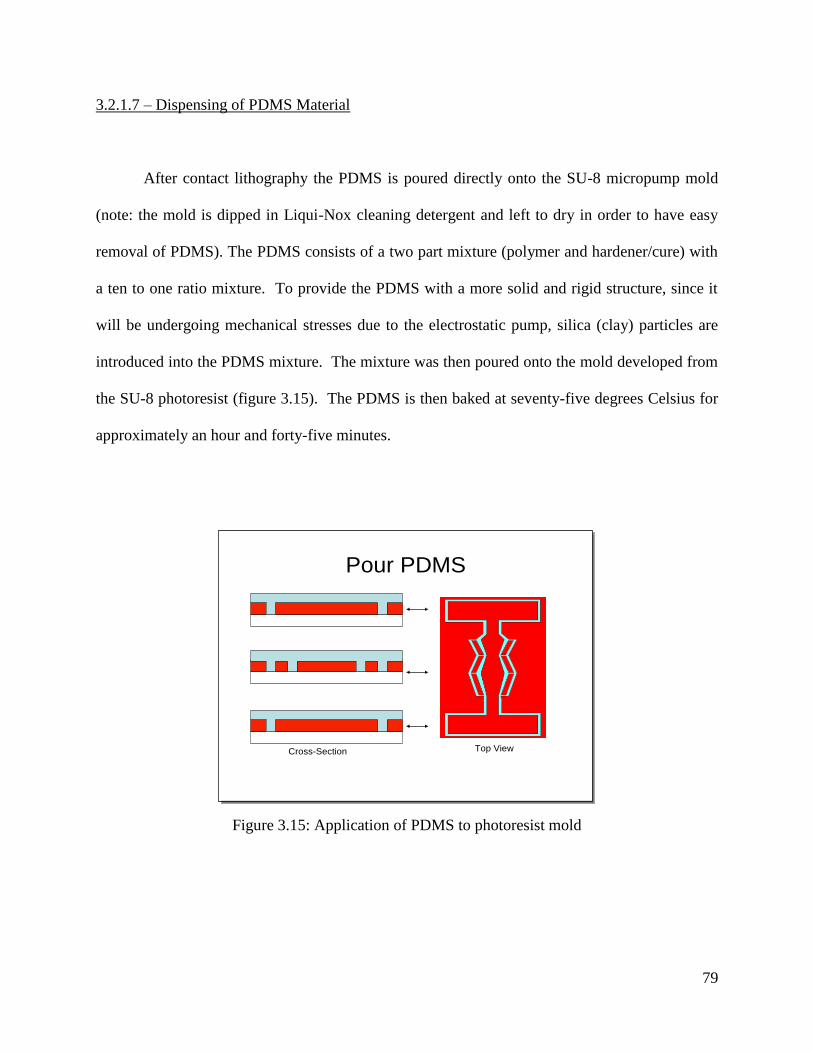
79
Pour PDMS
Cross-Section Top View
Pour PDMS
Cross-Section Top View
3.2.1.7 – Dispensing of PDMS Material
After contact lithography the PDMS is poured directly onto the SU-8 micropump mold
(note: the mold is dipped in Liqui-Nox cleaning detergent and left to dry in order to have easy
removal of PDMS). The PDMS consists of a two part mixture (polymer and hardener/cure) with
a ten to one ratio mixture. To provide the PDMS with a more solid and rigid structure, since it
will be undergoing mechanical stresses due to the electrostatic pump, silica (clay) particles are
introduced into the PDMS mixture. The mixture was then poured onto the mold developed from
the SU-8 photoresist (figure 3.15). The PDMS is then baked at seventy-five degrees Celsius for
approximately an hour and forty-five minutes.
Figure 3.15: Application of PDMS to photoresist mold
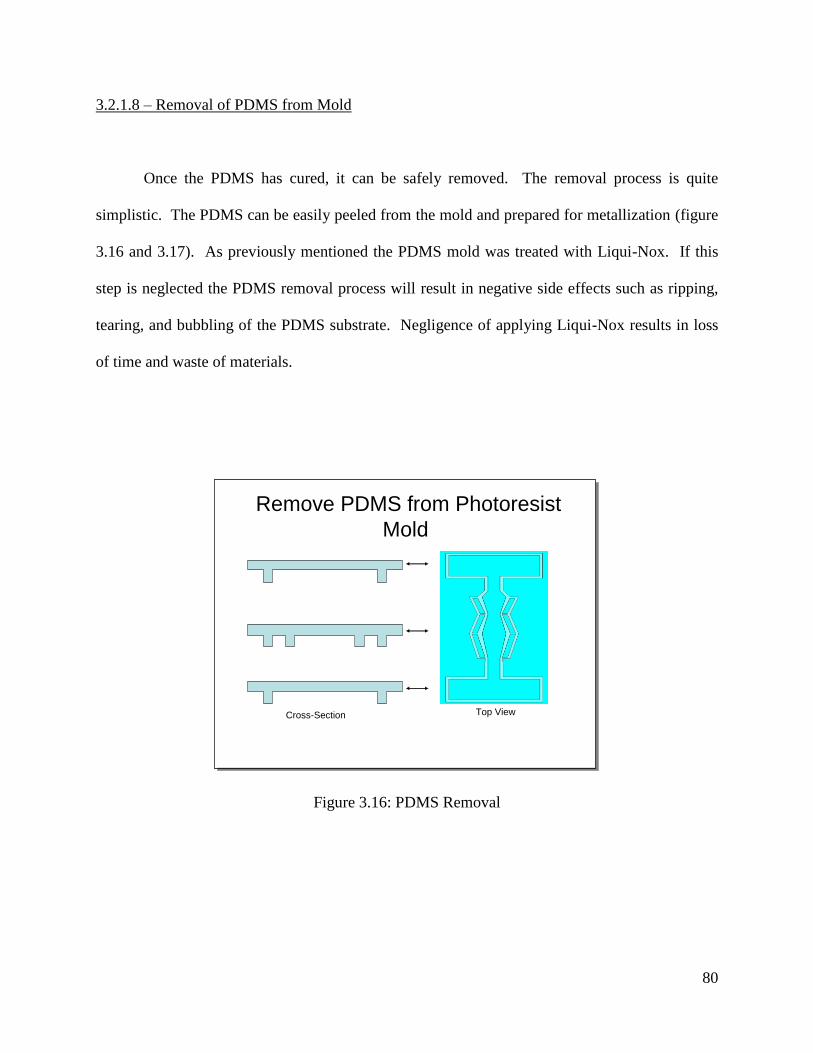
80
Remove PDMS from Photoresist
Mold
Cross-Section Top View
Remove PDMS from Photoresist
Mold
Cross-Section Top View
3.2.1.8 – Removal of PDMS from Mold
Once the PDMS has cured, it can be safely removed. The removal process is quite
simplistic. The PDMS can be easily peeled from the mold and prepared for metallization (figure
3.16 and 3.17). As previously mentioned the PDMS mold was treated with Liqui-Nox. If this
step is neglected the PDMS removal process will result in negative side effects such as ripping,
tearing, and bubbling of the PDMS substrate. Negligence of applying Liqui-Nox results in loss
of time and waste of materials.
Figure 3.16: PDMS Removal
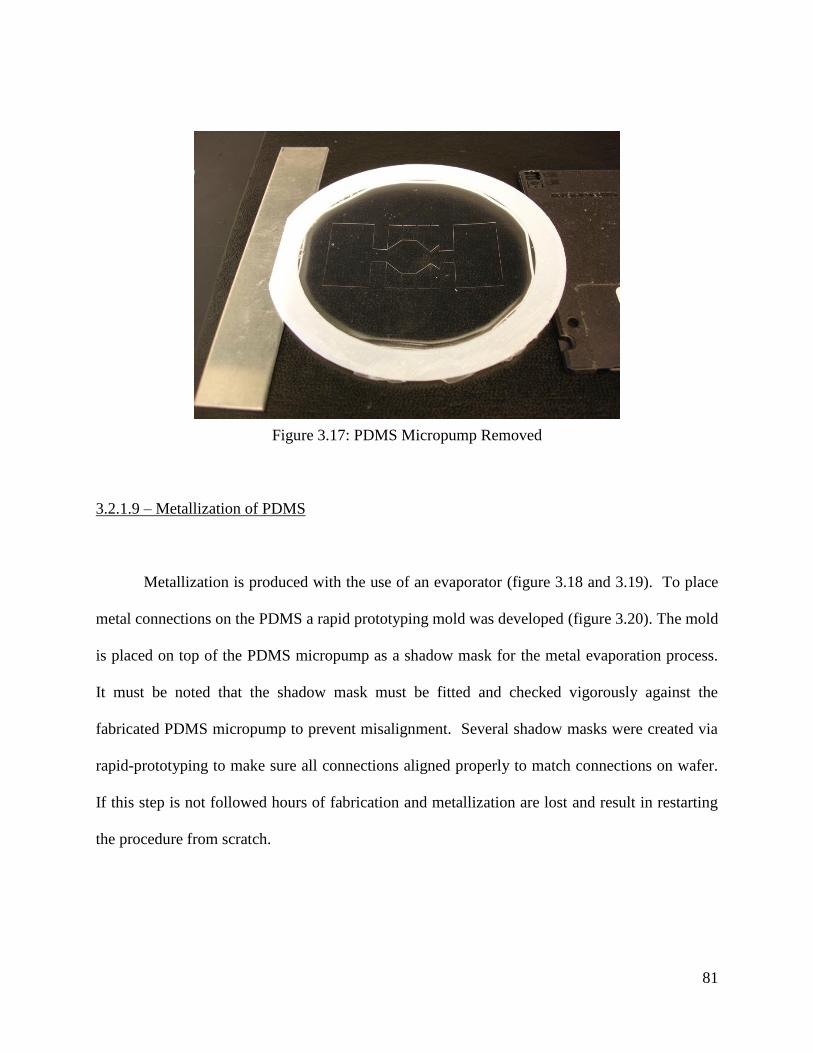
81
Figure 3.17: PDMS Micropump Removed
3.2.1.9 – Metallization of PDMS
Metallization is produced with the use of an evaporator (figure 3.18 and 3.19). To place
metal connections on the PDMS a rapid prototyping mold was developed (figure 3.20). The mold
is placed on top of the PDMS micropump as a shadow mask for the metal evaporation process.
It must be noted that the shadow mask must be fitted and checked vigorously against the
fabricated PDMS micropump to prevent misalignment. Several shadow masks were created via
rapid-prototyping to make sure all connections aligned properly to match connections on wafer.
If this step is not followed hours of fabrication and metallization are lost and result in restarting
the procedure from scratch.
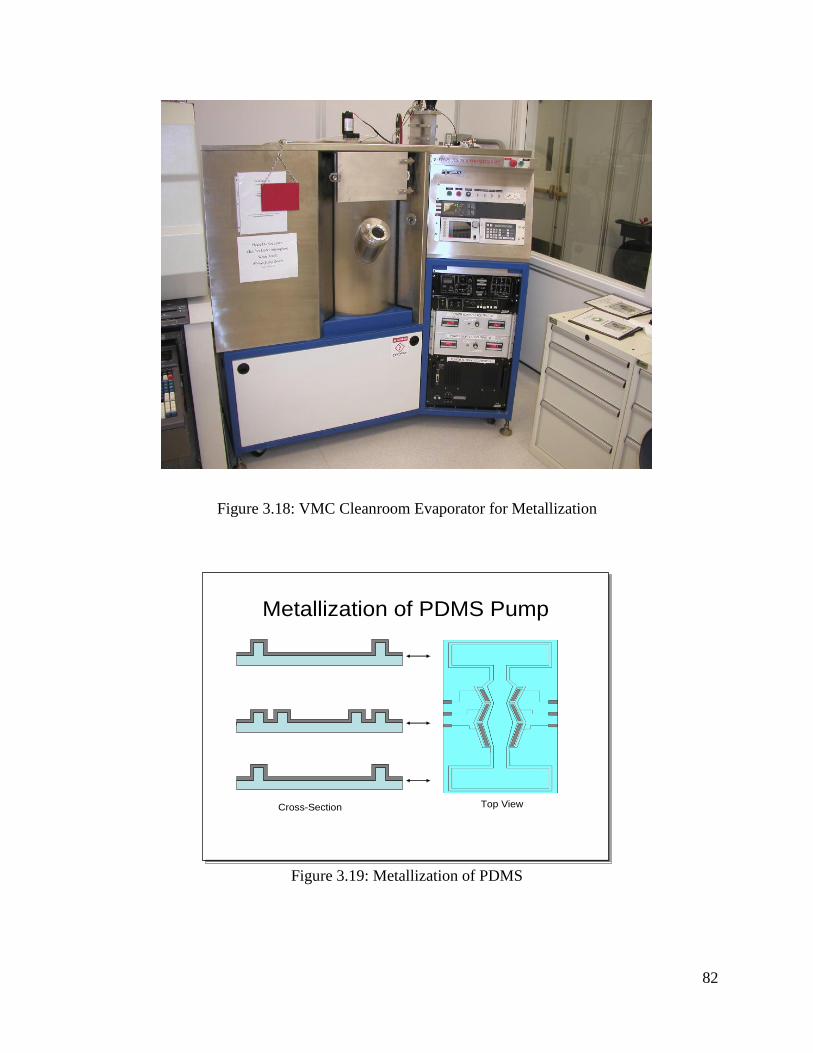
82
Metallization of PDMS Pump
Cross-Section Top View
Metallization of PDMS Pump
Cross-Section Top View
Figure 3.18: VMC Cleanroom Evaporator for Metallization
Figure 3.19: Metallization of PDMS

83
Figure 3.20: Shadow Mask to Metalize the PDMS Material
3.2.1.10 – Metallization of Glass Wafer
3.2.1.10.1 – SPR-3012 Resist Application
A second glass wafer will have voltage connections placed on it in a manner in which it
will initiate the proposed electrostatic pump. Approximately four milliliters (mL) of SPR3012
photoresist is dispensed onto the glass wafer. The wafer is then softbaked at ninety-five degrees
Celsius for ninety seconds.
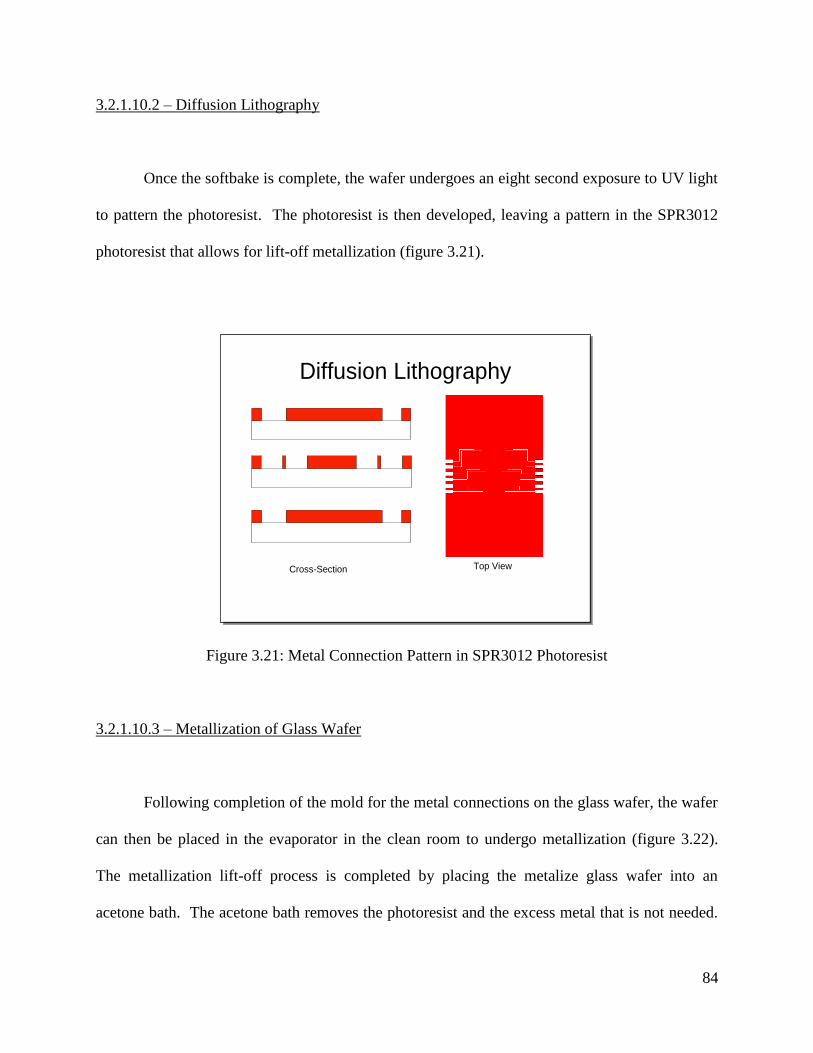
84
Diffusion Lithography
Cross-Section Top View
Diffusion Lithography
Cross-Section Top View
3.2.1.10.2 – Diffusion Lithography
Once the softbake is complete, the wafer undergoes an eight second exposure to UV light
to pattern the photoresist. The photoresist is then developed, leaving a pattern in the SPR3012
photoresist that allows for lift-off metallization (figure 3.21).
Figure 3.21: Metal Connection Pattern in SPR3012 Photoresist
3.2.1.10.3 – Metallization of Glass Wafer
Following completion of the mold for the metal connections on the glass wafer, the wafer
can then be placed in the evaporator in the clean room to undergo metallization (figure 3.22).
The metallization lift-off process is completed by placing the metalize glass wafer into an
acetone bath. The acetone bath removes the photoresist and the excess metal that is not needed.
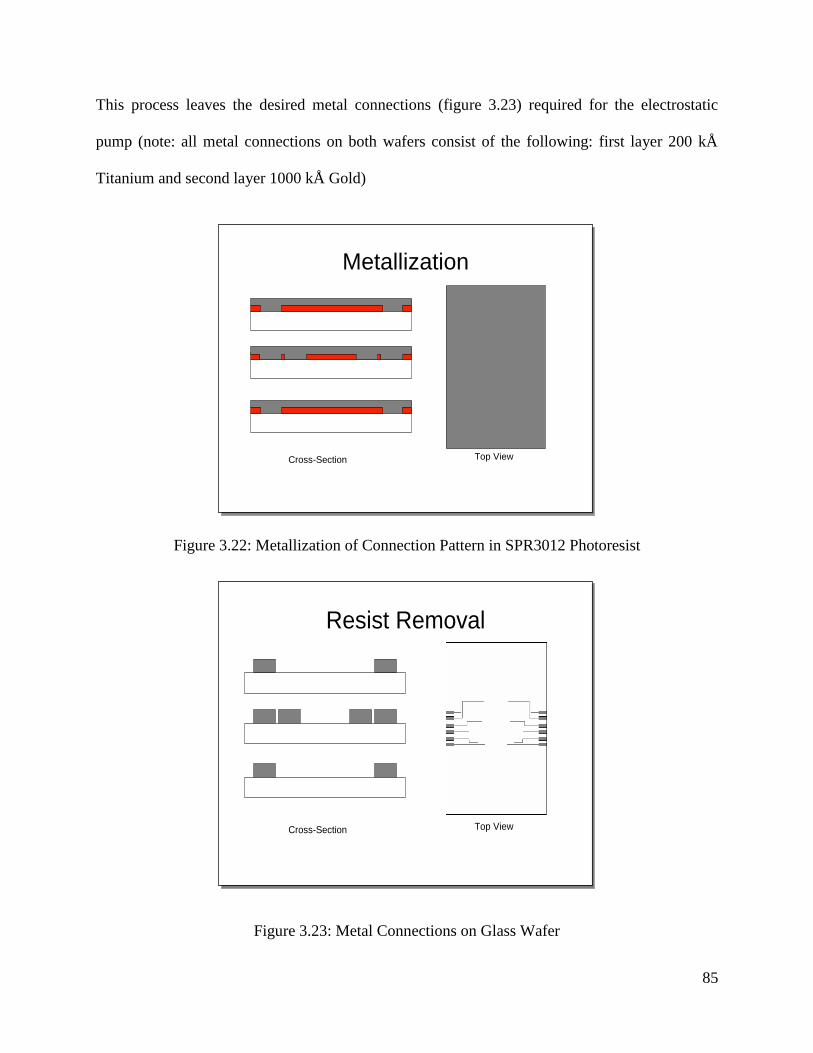
85
Metallization
Cross-Section Top View
Metallization
Cross-Section Top View
This process leaves the desired metal connections (figure 3.23) required for the electrostatic
pump (note: all metal connections on both wafers consist of the following: first layer 200 kÅ
Titanium and second layer 1000 kÅ Gold)
Figure 3.22: Metallization of Connection Pattern in SPR3012 Photoresist
Figure 3.23: Metal Connections on Glass Wafer
Resist Removal
Cross-Section Top View
Resist Removal
Cross-Section Top View
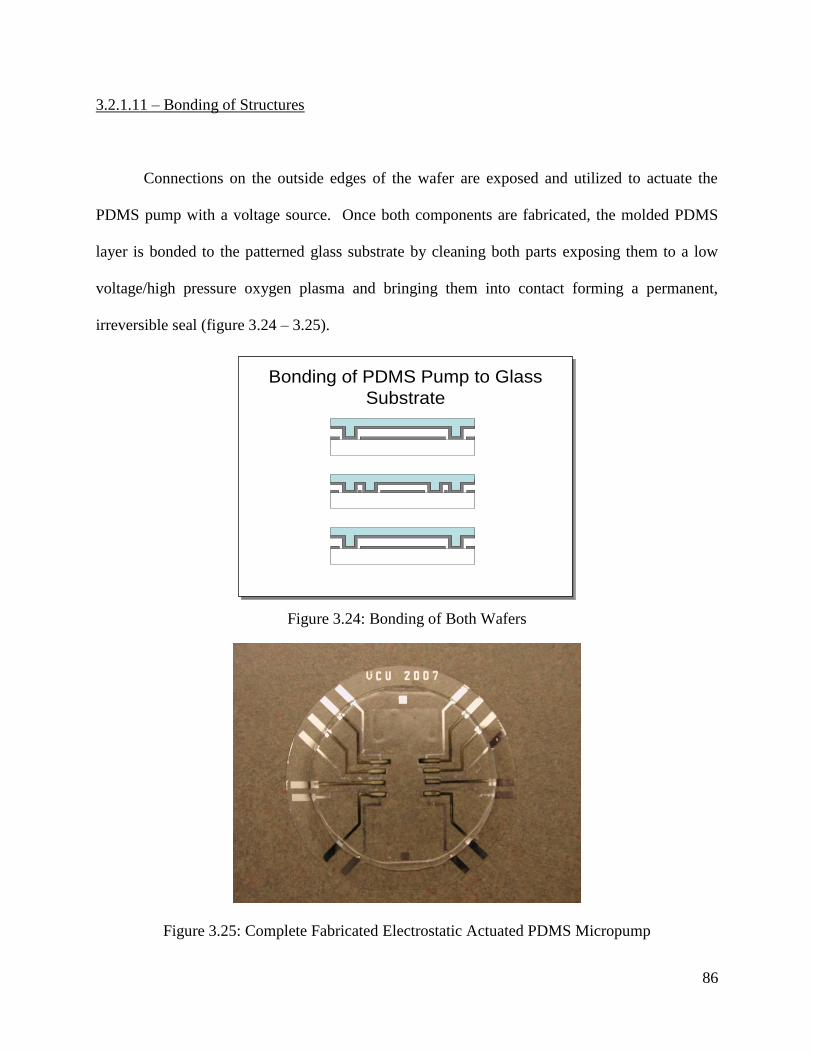
86
Bonding of PDMS Pump to Glass
Substrate
Bonding of PDMS Pump to Glass
Substrate
3.2.1.11 – Bonding of Structures
Connections on the outside edges of the wafer are exposed and utilized to actuate the
PDMS pump with a voltage source. Once both components are fabricated, the molded PDMS
layer is bonded to the patterned glass substrate by cleaning both parts exposing them to a low
voltage/high pressure oxygen plasma and bringing them into contact forming a permanent,
irreversible seal (figure 3.24 – 3.25).
Figure 3.24: Bonding of Both Wafers
Figure 3.25: Complete Fabricated Electrostatic Actuated PDMS Micropump
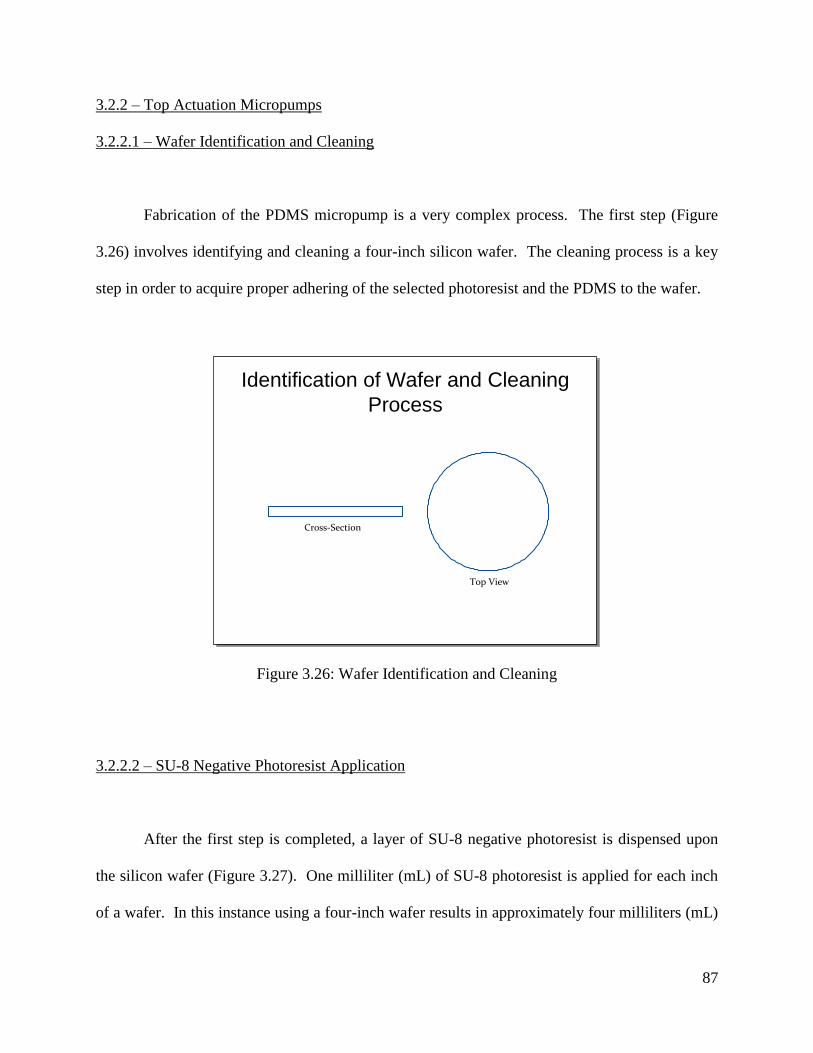
87
3.2.2 – Top Actuation Micropumps
3.2.2.1 – Wafer Identification and Cleaning
Fabrication of the PDMS micropump is a very complex process. The first step (Figure
3.26) involves identifying and cleaning a four-inch silicon wafer. The cleaning process is a key
step in order to acquire proper adhering of the selected photoresist and the PDMS to the wafer.
Figure 3.26: Wafer Identification and Cleaning
3.2.2.2 – SU-8 Negative Photoresist Application
After the first step is completed, a layer of SU-8 negative photoresist is dispensed upon
the silicon wafer (Figure 3.27). One milliliter (mL) of SU-8 photoresist is applied for each inch
of a wafer. In this instance using a four-inch wafer results in approximately four milliliters (mL)
Identification of Wafer and Cleaning
Process
Cross-Section
Top View
Identification of Wafer and Cleaning
Process
Cross-Section
Top View
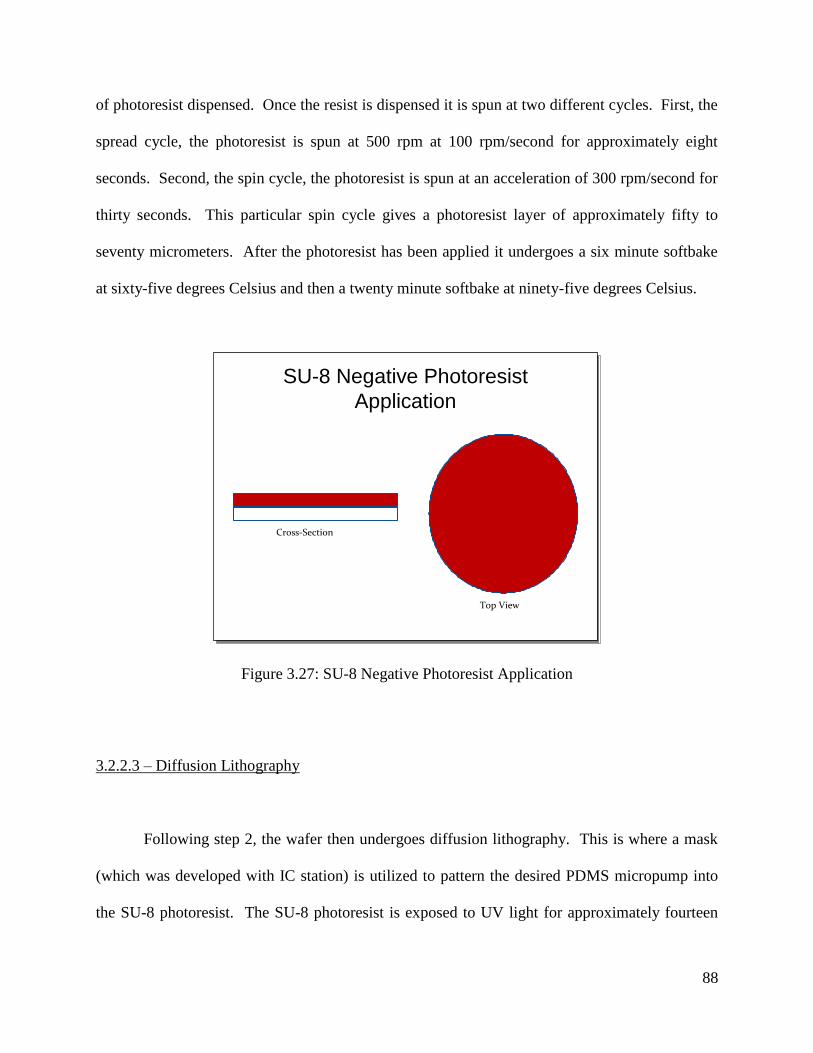
88
of photoresist dispensed. Once the resist is dispensed it is spun at two different cycles. First, the
spread cycle, the photoresist is spun at 500 rpm at 100 rpm/second for approximately eight
seconds. Second, the spin cycle, the photoresist is spun at an acceleration of 300 rpm/second for
thirty seconds. This particular spin cycle gives a photoresist layer of approximately fifty to
seventy micrometers. After the photoresist has been applied it undergoes a six minute softbake
at sixty-five degrees Celsius and then a twenty minute softbake at ninety-five degrees Celsius.
Figure 3.27: SU-8 Negative Photoresist Application
3.2.2.3 – Diffusion Lithography
Following step 2, the wafer then undergoes diffusion lithography. This is where a mask
(which was developed with IC station) is utilized to pattern the desired PDMS micropump into
the SU-8 photoresist. The SU-8 photoresist is exposed to UV light for approximately fourteen
SU-8 Negative Photoresist
Application
Cross-Section
Top View
SU-8 Negative Photoresist
Application
Cross-Section
Top View
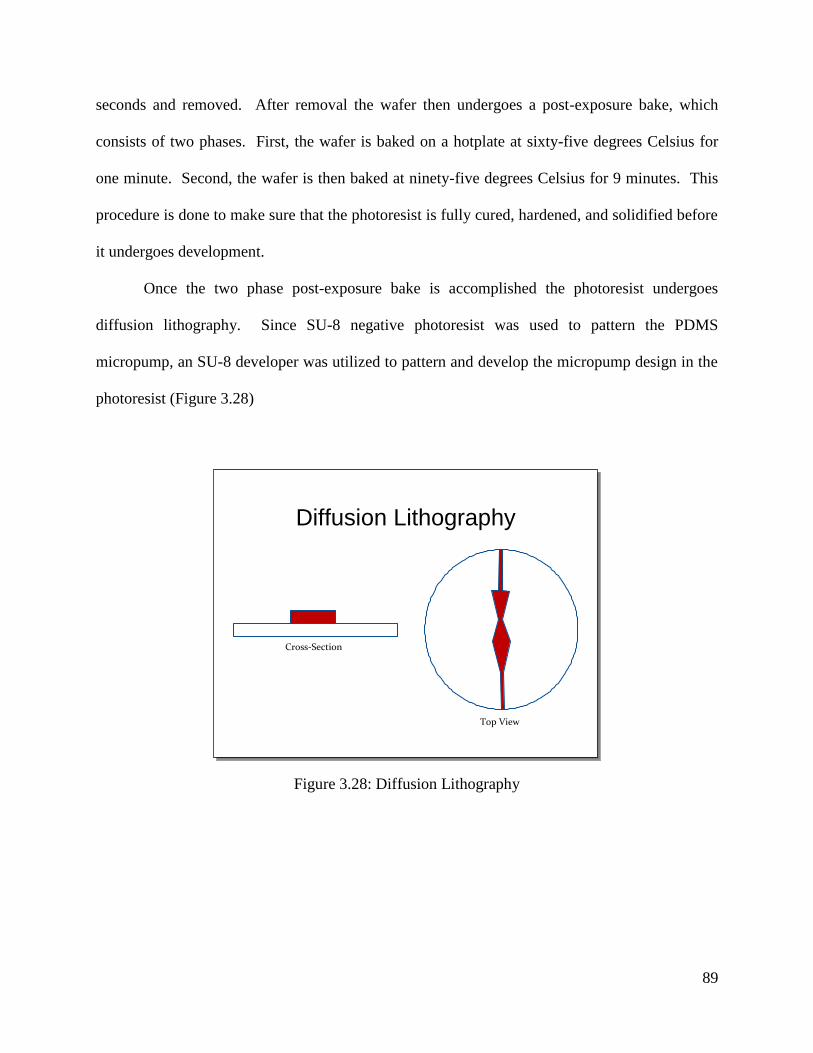
89
seconds and removed. After removal the wafer then undergoes a post-exposure bake, which
consists of two phases. First, the wafer is baked on a hotplate at sixty-five degrees Celsius for
one minute. Second, the wafer is then baked at ninety-five degrees Celsius for 9 minutes. This
procedure is done to make sure that the photoresist is fully cured, hardened, and solidified before
it undergoes development.
Once the two phase post-exposure bake is accomplished the photoresist undergoes
diffusion lithography. Since SU-8 negative photoresist was used to pattern the PDMS
micropump, an SU-8 developer was utilized to pattern and develop the micropump design in the
photoresist (Figure 3.28)
Figure 3.28: Diffusion Lithography
Diffusion Lithography
Cross-Section
Top View
Diffusion Lithography
Cross-Section
Top View
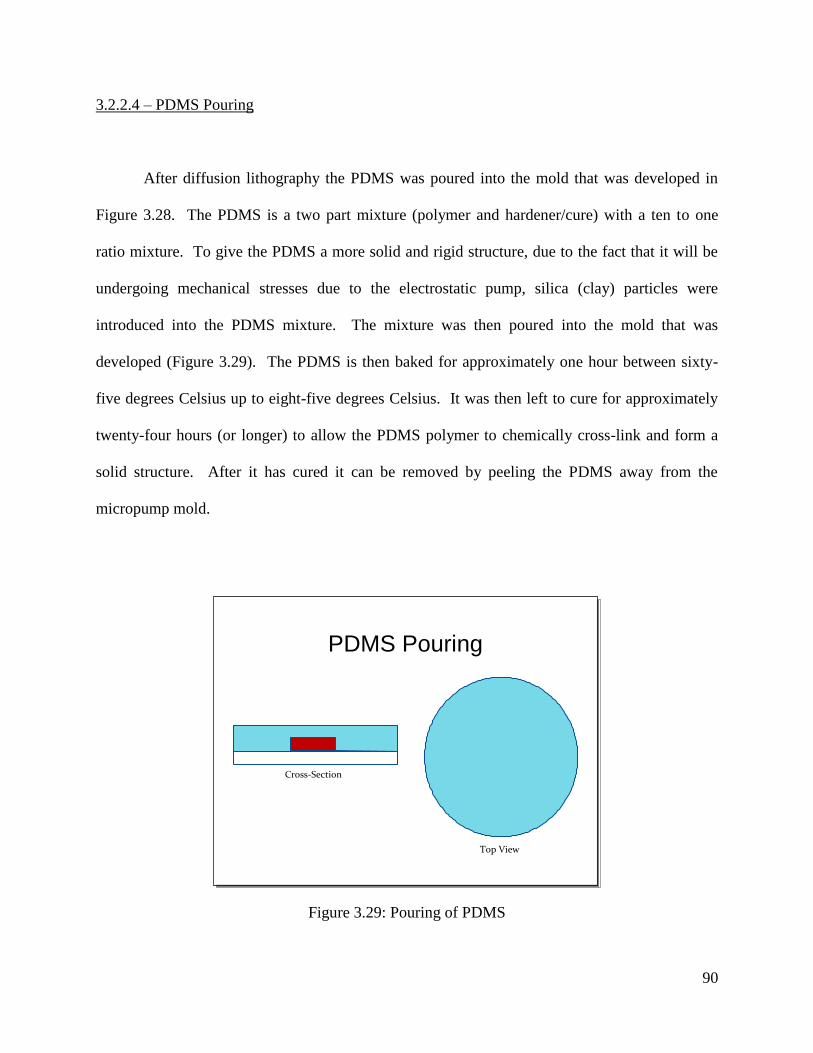
90
3.2.2.4 – PDMS Pouring
After diffusion lithography the PDMS was poured into the mold that was developed in
Figure 3.28. The PDMS is a two part mixture (polymer and hardener/cure) with a ten to one
ratio mixture. To give the PDMS a more solid and rigid structure, due to the fact that it will be
undergoing mechanical stresses due to the electrostatic pump, silica (clay) particles were
introduced into the PDMS mixture. The mixture was then poured into the mold that was
developed (Figure 3.29). The PDMS is then baked for approximately one hour between sixty-
five degrees Celsius up to eight-five degrees Celsius. It was then left to cure for approximately
twenty-four hours (or longer) to allow the PDMS polymer to chemically cross-link and form a
solid structure. After it has cured it can be removed by peeling the PDMS away from the
micropump mold.
Figure 3.29: Pouring of PDMS
PDMS Pouring
Cross-Section
Top View
PDMS Pouring
Cross-Section
Top View
91
3.3: PDMS Micropump Fabrication Method II Rapid Prototyping Process
In today’s engineering world it is vital to use the method of rapid prototyping. Rapid
prototyping allows an engineer to physically construct and test a design that he or she has
developed through hours of research. Using this method allows an engineer to determine if the
design will withstand and hold up to the design criteria that revolves around a particular design.
This is why in engineering and in the real world it is important to prototype an idea or design to
determine if it will be able to function for worldwide marketability and meet the standards of the
consumer.
Rapid prototyping is defined as being the automatic construction of physical objects
using solid freeform fabrication. Techniques for rapid prototyping began to evolve in the late
1980s and were utilized to prototype parts and models. In today’s society, rapid prototyping is
used for a wide range of applications such as manufacturing quality production parts in relatively
small numbers. Also, outside of the engineering spectrum, artists (such as sculptors) use rapid
prototyping to produce complex shapes for fine art exhibitions.
The technique of rapid prototyping uses virtual designs from computer-aided design
(CAD) or solid modeling software (SolidWorks), transforming them into virtual, thin, horizontal
cross-sections and creating each cross-section in physical space (one after another until the
prototyped model is completed). This type of process where the virtual model and the physical
model correspond identically is referred to as the WYSIWYG process.
Additive fabrication allows the rapid prototyping machine to read data from a CAD
drawing and lay down consecutive layers of liquid, powder, or sheet material. This is the
process that allows the model to be constructed through a series of cross-sectional layers. Each
92
of these layers correspond to the virtual cross section from the CAD model and are joined or
fused together automatically to create the final prototyped part or model. A primary advantage
of using rapid prototyping technology is the ability it has to create any shape or geometric feature
with ease.
Standard data interface between the rapid prototyping machines and the CAD software is
use of STL file format. STL files approximate the shape of the assembly or model using
triangular facets. The smaller these facets, the higher the quality surface of the part or assembly.
When one refers to the word “rapid” in rapid prototyping, it is quite relative. The reason
is because construction of a part or model with contemporary methods can take from several
hours to several days. This depends on the method used, the size of the part, and the complexity
of the model. Additive systems for rapid prototyping typically can produce parts or models in a
few hours, even though the time to produce these parts can vary widely depending on the type of
prototyping machine that is being used, as well as the size and number of parts being produced
simultaneously.
Various solid freeform fabrication techniques use two materials during the construction
of parts or models. The first material is the support material, which is used to support the
features of the particular part or model during construction, while the second material is the part
material. After a part or model is prototyped the support material for the model is usually
removed from the finished prototyped part.
Another technique that is used in polymer based processes, which is similar to rapid
prototyping, is injection molding. Injection molding is a cheaper, less expensive form of
manufacturing plastic/polymer products in high quantities. Even though injection molding
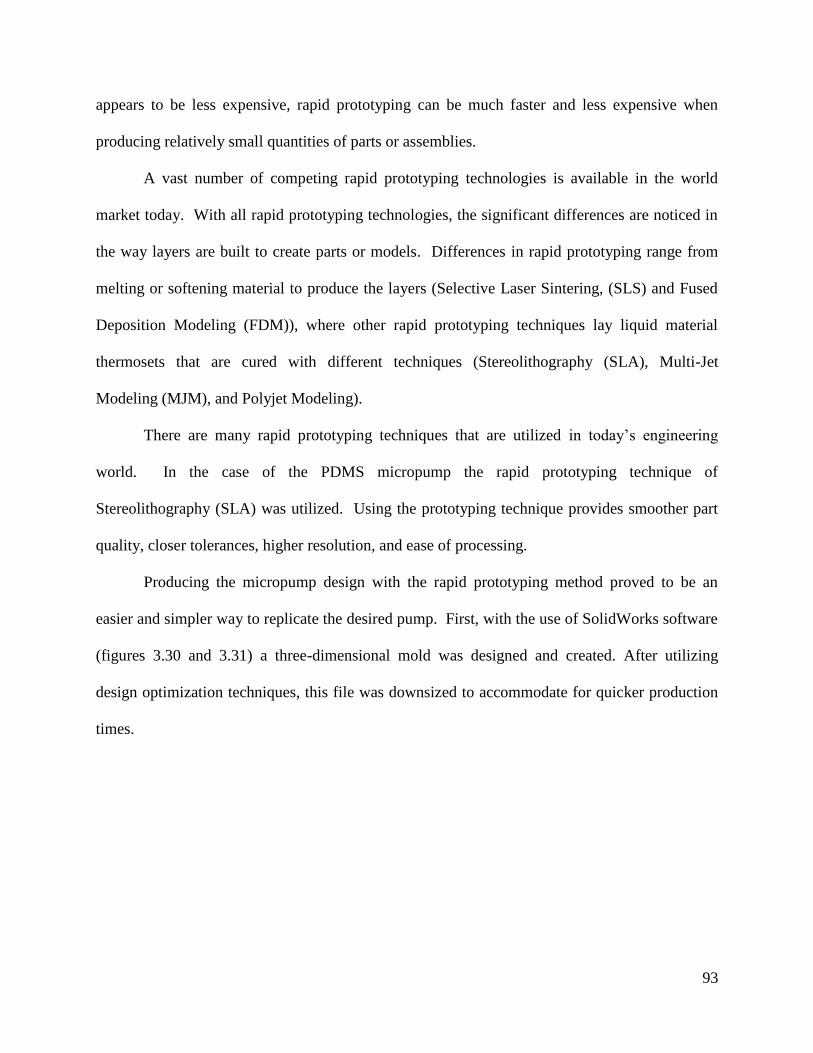
93
appears to be less expensive, rapid prototyping can be much faster and less expensive when
producing relatively small quantities of parts or assemblies.
A vast number of competing rapid prototyping technologies is available in the world
market today. With all rapid prototyping technologies, the significant differences are noticed in
the way layers are built to create parts or models. Differences in rapid prototyping range from
melting or softening material to produce the layers (Selective Laser Sintering, (SLS) and Fused
Deposition Modeling (FDM)), where other rapid prototyping techniques lay liquid material
thermosets that are cured with different techniques (Stereolithography (SLA), Multi-Jet
Modeling (MJM), and Polyjet Modeling).
There are many rapid prototyping techniques that are utilized in today’s engineering
world. In the case of the PDMS micropump the rapid prototyping technique of
Stereolithography (SLA) was utilized. Using the prototyping technique provides smoother part
quality, closer tolerances, higher resolution, and ease of processing.
Producing the micropump design with the rapid prototyping method proved to be an
easier and simpler way to replicate the desired pump. First, with the use of SolidWorks software
(figures 3.30 and 3.31) a three-dimensional mold was designed and created. After utilizing
design optimization techniques, this file was downsized to accommodate for quicker production
times.

94
Figure 3.30: SolidWorks Rendition of Micropump
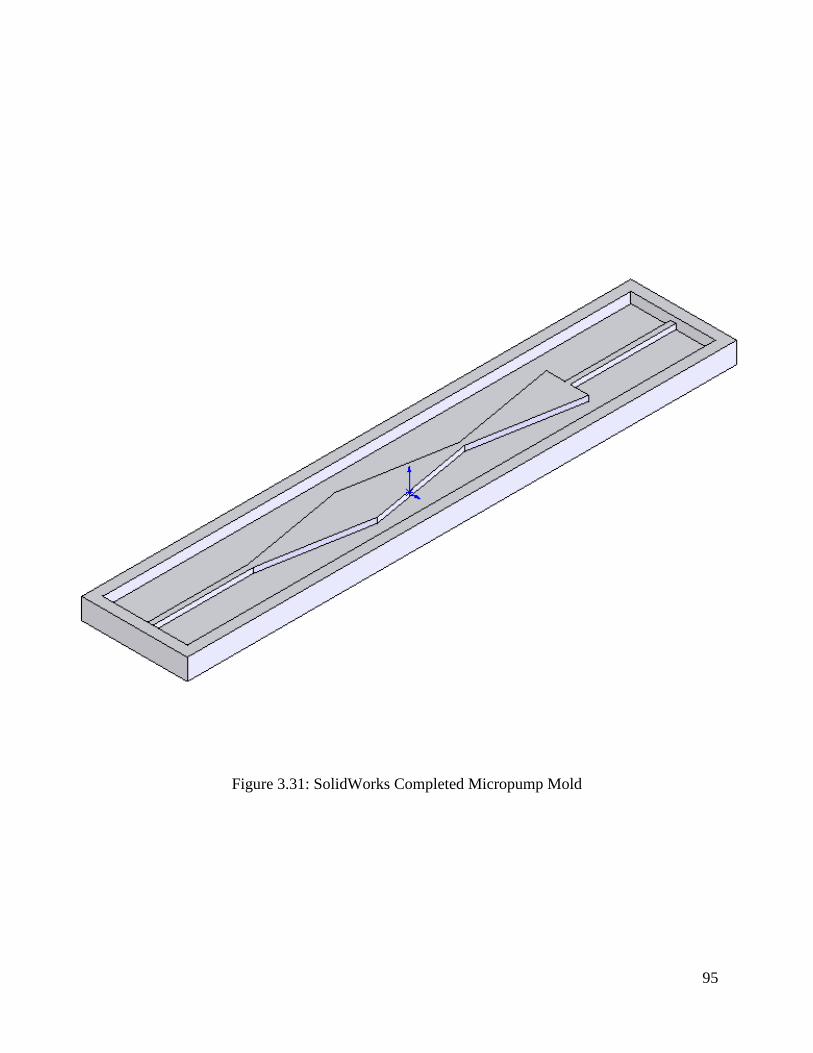
95
Figure 3.31: SolidWorks Completed Micropump Mold
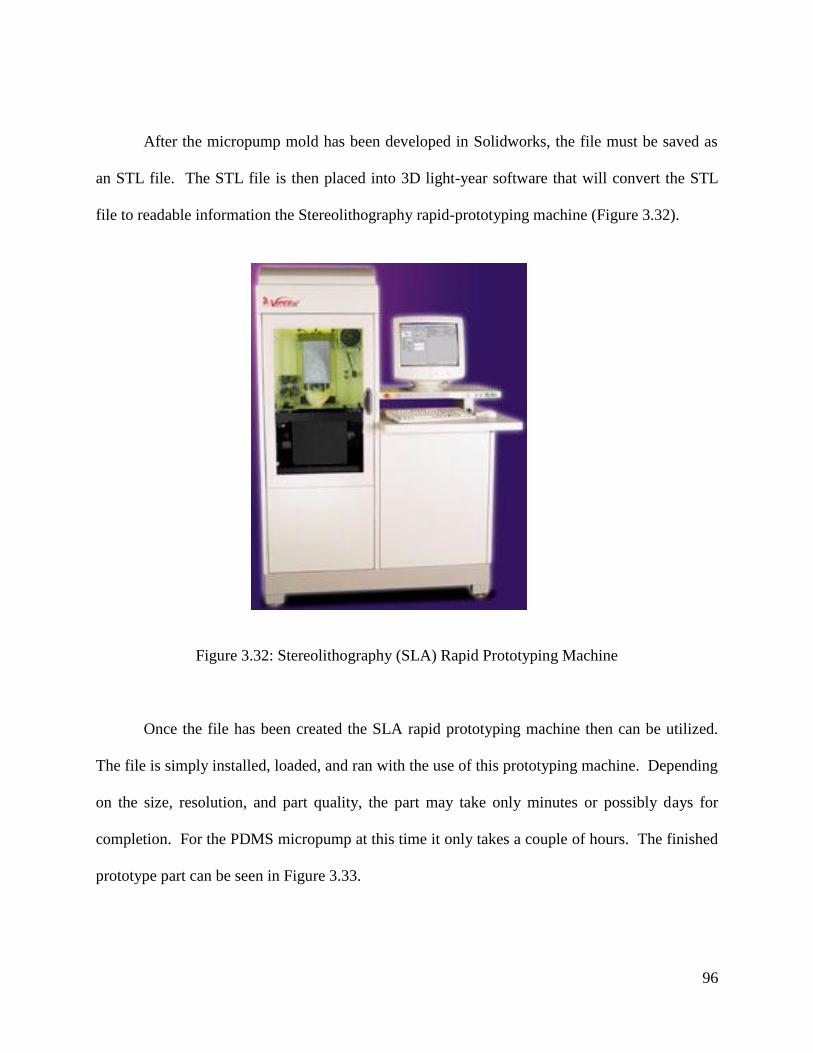
96
After the micropump mold has been developed in Solidworks, the file must be saved as
an STL file. The STL file is then placed into 3D light-year software that will convert the STL
file to readable information the Stereolithography rapid-prototyping machine (Figure 3.32).
Figure 3.32: Stereolithography (SLA) Rapid Prototyping Machine
Once the file has been created the SLA rapid prototyping machine then can be utilized.
The file is simply installed, loaded, and ran with the use of this prototyping machine. Depending
on the size, resolution, and part quality, the part may take only minutes or possibly days for
completion. For the PDMS micropump at this time it only takes a couple of hours. The finished
prototype part can be seen in Figure 3.33.
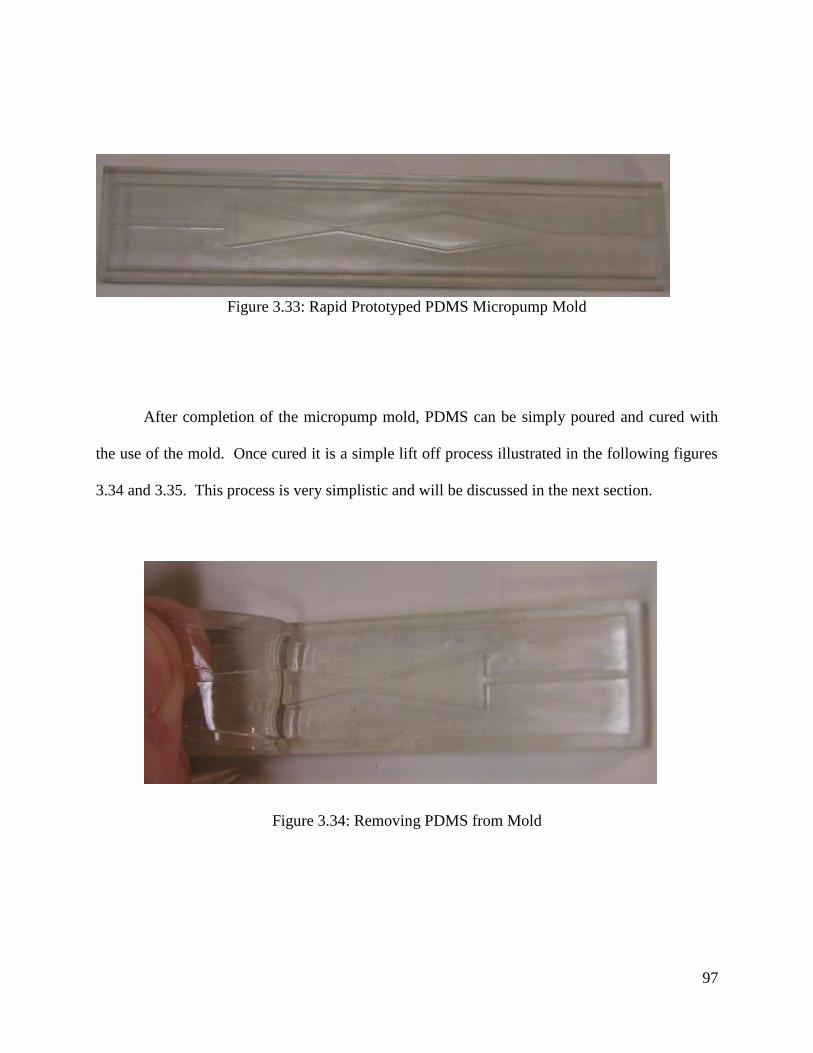
97
Figure 3.33: Rapid Prototyped PDMS Micropump Mold
After completion of the micropump mold, PDMS can be simply poured and cured with
the use of the mold. Once cured it is a simple lift off process illustrated in the following figures
3.34 and 3.35. This process is very simplistic and will be discussed in the next section.
Figure 3.34: Removing PDMS from Mold

98
Figure 3.35: PDMS Completely Removed from Mold
99
3.4: Magnetic Actuation Fabrication
3.4.1 – Introduction to Magnetism
Magnetism is a topic that is considered to be relatively difficult to understand in some
instances. The main concepts of magnetic field (H), magnetic flux density (B), and
magnetization (M) are considered to be the essential concepts within the fundamental theoretical
concepts of magnetism in general physics and engineering. Therefore, it is rather important that
one understand the concept of magnetism when utilizing it to actuate microfluidic devices.
Magnetism has been present in the scientific and engineering world for thousands of
years that involve a phenomenon by which materials assert a repulsive or attractive influence or
force on other materials. The theory and principles that explain the magnetic phenomenon are
still complex and subtle. Several modern technological devices rely on magnetism and magnetic
materials, such devices can range from electric generators, transformers, electric motors, radios,
televisions, telephones, computers, and components within sound and video equipment [103 –
105].
Examples of materials that exhibit magnetic properties range from iron, some steels, and
naturally occurring minerals. On the other hand, it has been studied that all substances are
influenced in some degree within the presence of a magnetic field. This section will discuss the
origin of magnetic fields and the various magnetic field vectors and magnetic parameters.
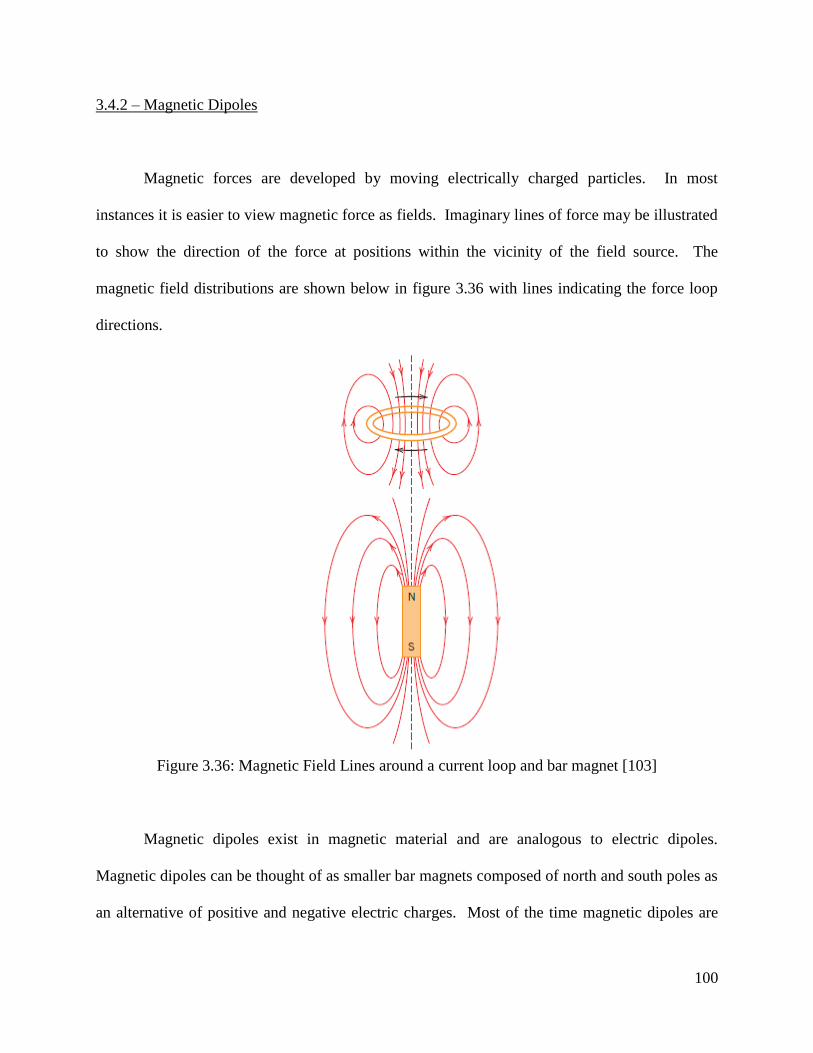
100
3.4.2 – Magnetic Dipoles
Magnetic forces are developed by moving electrically charged particles. In most
instances it is easier to view magnetic force as fields. Imaginary lines of force may be illustrated
to show the direction of the force at positions within the vicinity of the field source. The
magnetic field distributions are shown below in figure 3.36 with lines indicating the force loop
directions.
Figure 3.36: Magnetic Field Lines around a current loop and bar magnet [103]
Magnetic dipoles exist in magnetic material and are analogous to electric dipoles.
Magnetic dipoles can be thought of as smaller bar magnets composed of north and south poles as
an alternative of positive and negative electric charges. Most of the time magnetic dipoles are
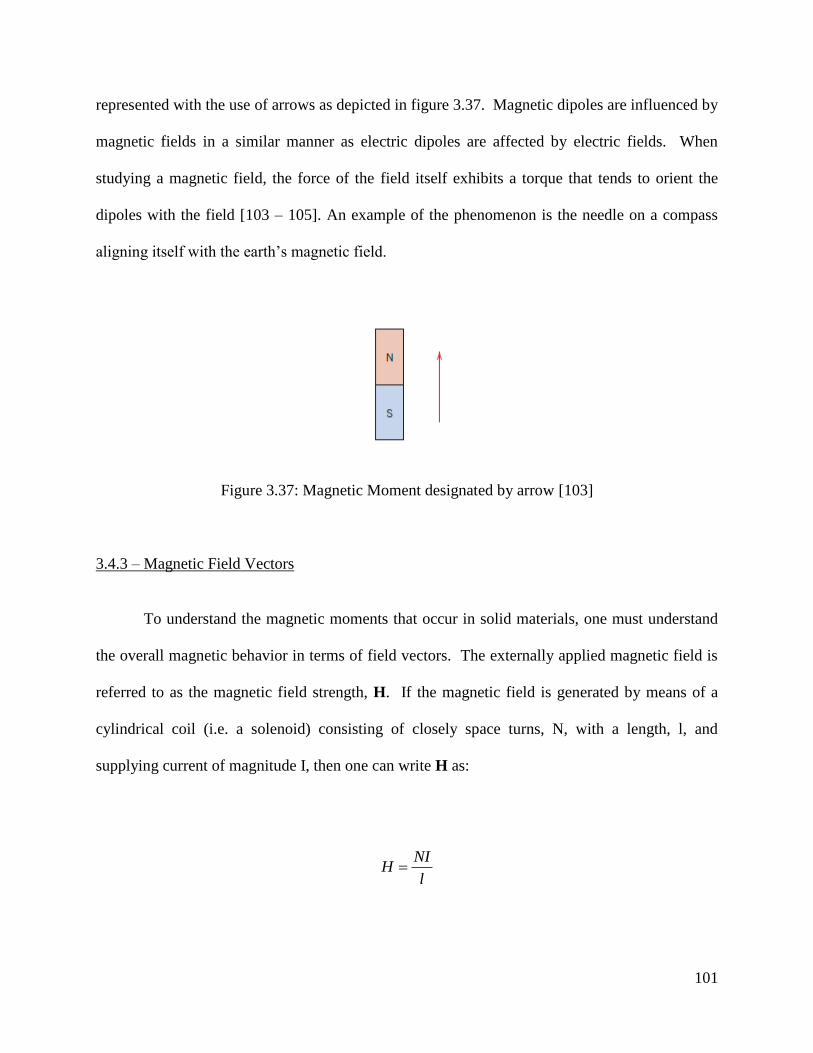
101
represented with the use of arrows as depicted in figure 3.37. Magnetic dipoles are influenced by
magnetic fields in a similar manner as electric dipoles are affected by electric fields. When
studying a magnetic field, the force of the field itself exhibits a torque that tends to orient the
dipoles with the field [103 – 105]. An example of the phenomenon is the needle on a compass
aligning itself with the earth’s magnetic field.
Figure 3.37: Magnetic Moment designated by arrow [103]
3.4.3 – Magnetic Field Vectors
To understand the magnetic moments that occur in solid materials, one must understand
the overall magnetic behavior in terms of field vectors. The externally applied magnetic field is
referred to as the magnetic field strength, H. If the magnetic field is generated by means of a
cylindrical coil (i.e. a solenoid) consisting of closely space turns, N, with a length, l, and
supplying current of magnitude I, then one can write H as:
l
NIH
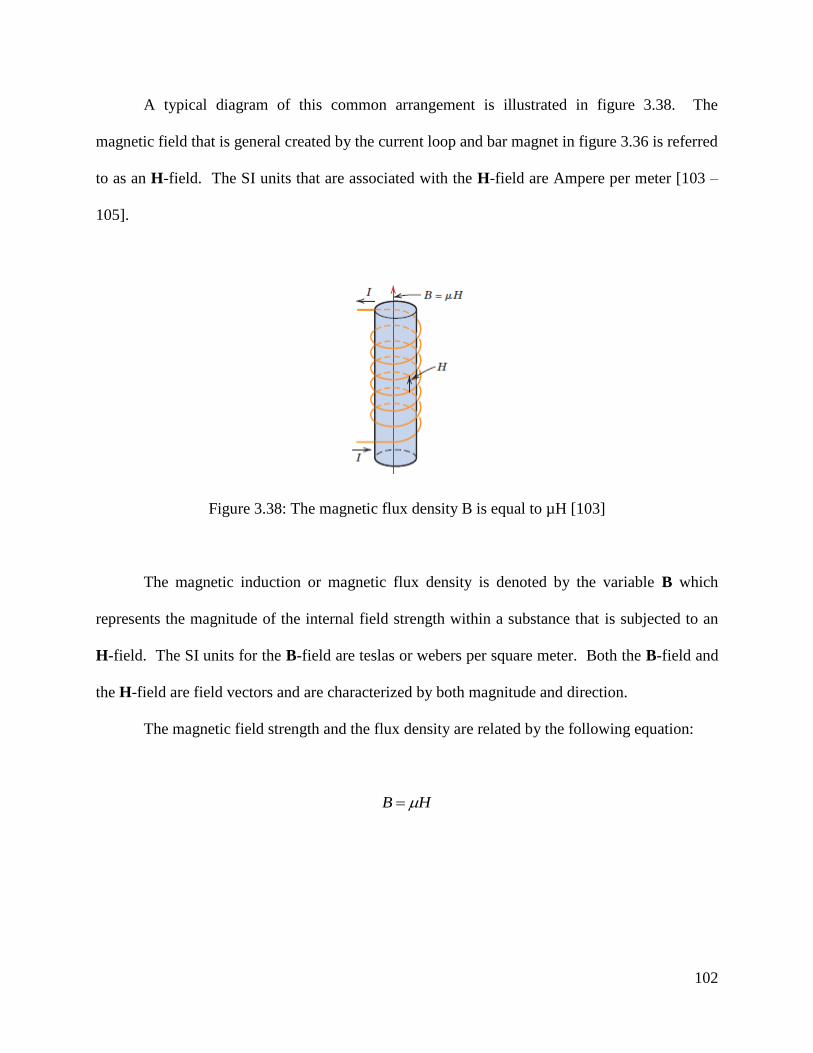
102
A typical diagram of this common arrangement is illustrated in figure 3.38. The
magnetic field that is general created by the current loop and bar magnet in figure 3.36 is referred
to as an H-field. The SI units that are associated with the H-field are Ampere per meter [103 –
105].
Figure 3.38: The magnetic flux density B is equal to µH [103]
The magnetic induction or magnetic flux density is denoted by the variable B which
represents the magnitude of the internal field strength within a substance that is subjected to an
H-field. The SI units for the B-field are teslas or webers per square meter. Both the B-field and
the H-field are field vectors and are characterized by both magnitude and direction.
The magnetic field strength and the flux density are related by the following equation:
HB
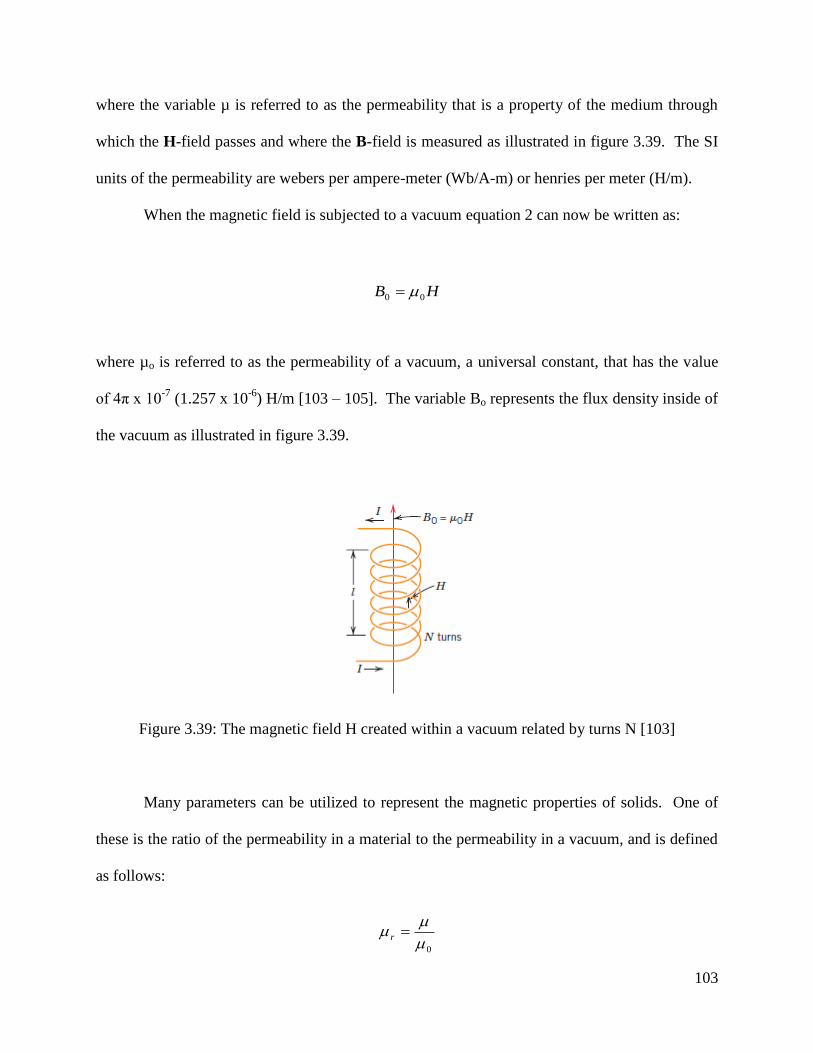
103
where the variable µ is referred to as the permeability that is a property of the medium through
which the H-field passes and where the B-field is measured as illustrated in figure 3.39. The SI
units of the permeability are webers per ampere-meter (Wb/A-m) or henries per meter (H/m).
When the magnetic field is subjected to a vacuum equation 2 can now be written as:
where µo is referred to as the permeability of a vacuum, a universal constant, that has the value
of 4π x 10-7
(1.257 x 10⁻⁶
) H/m [103 – 105]. The variable Bo represents the flux density inside of
the vacuum as illustrated in figure 3.39.
Figure 3.39: The magnetic field H created within a vacuum related by turns N [103]
Many parameters can be utilized to represent the magnetic properties of solids. One of
these is the ratio of the permeability in a material to the permeability in a vacuum, and is defined
as follows:
HB 00
0
r
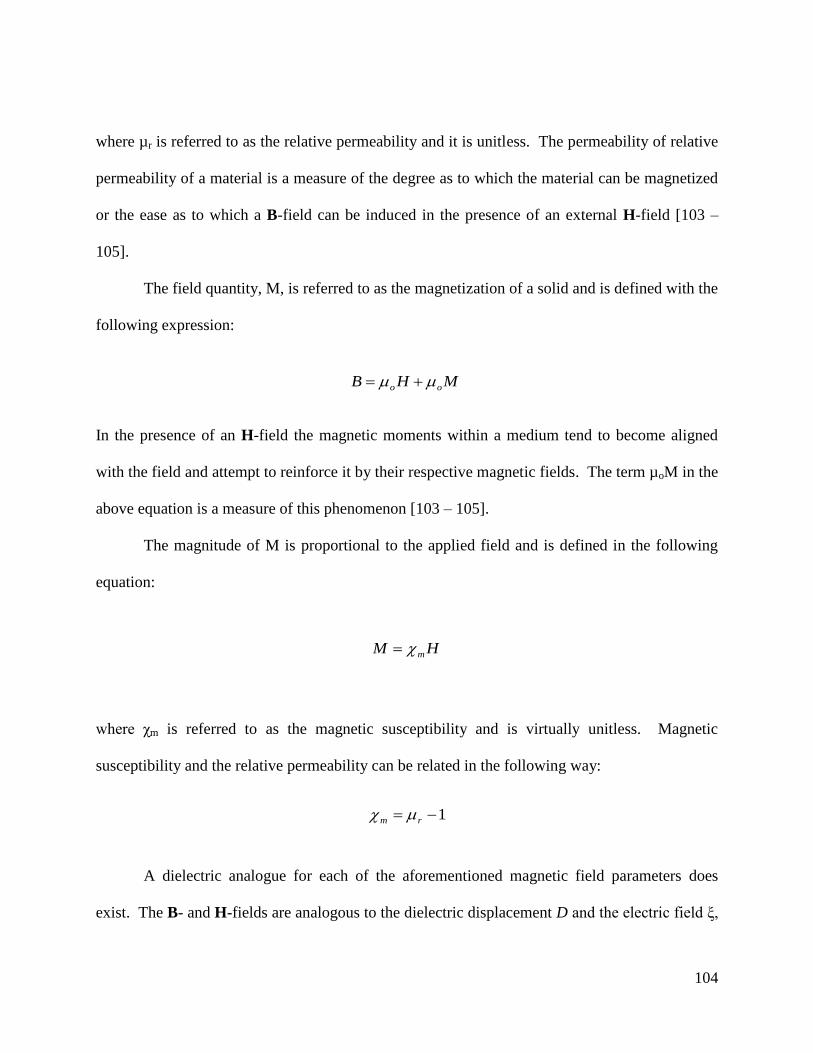
104
where µr is referred to as the relative permeability and it is unitless. The permeability of relative
permeability of a material is a measure of the degree as to which the material can be magnetized
or the ease as to which a B-field can be induced in the presence of an external H-field [103 –
105].
The field quantity, M, is referred to as the magnetization of a solid and is defined with the
following expression:
In the presence of an H-field the magnetic moments within a medium tend to become aligned
with the field and attempt to reinforce it by their respective magnetic fields. The term µoM in the
above equation is a measure of this phenomenon [103 – 105].
The magnitude of M is proportional to the applied field and is defined in the following
equation:
where χm is referred to as the magnetic susceptibility and is virtually unitless. Magnetic
susceptibility and the relative permeability can be related in the following way:
A dielectric analogue for each of the aforementioned magnetic field parameters does
exist. The B- and H-fields are analogous to the dielectric displacement D and the electric field ξ,
MHB oo
HM m
1 rm
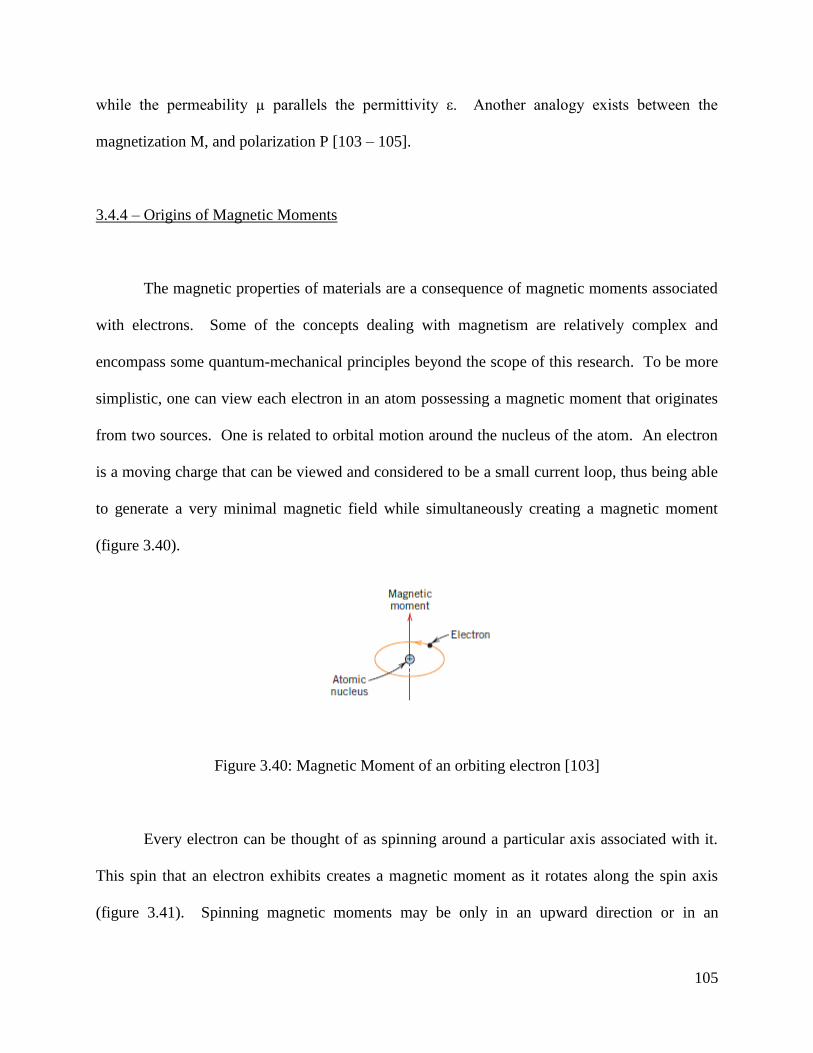
105
while the permeability µ parallels the permittivity ε. Another analogy exists between the
magnetization M, and polarization P [103 – 105].
3.4.4 – Origins of Magnetic Moments
The magnetic properties of materials are a consequence of magnetic moments associated
with electrons. Some of the concepts dealing with magnetism are relatively complex and
encompass some quantum-mechanical principles beyond the scope of this research. To be more
simplistic, one can view each electron in an atom possessing a magnetic moment that originates
from two sources. One is related to orbital motion around the nucleus of the atom. An electron
is a moving charge that can be viewed and considered to be a small current loop, thus being able
to generate a very minimal magnetic field while simultaneously creating a magnetic moment
(figure 3.40).
Figure 3.40: Magnetic Moment of an orbiting electron [103]
Every electron can be thought of as spinning around a particular axis associated with it.
This spin that an electron exhibits creates a magnetic moment as it rotates along the spin axis
(figure 3.41). Spinning magnetic moments may be only in an upward direction or in an
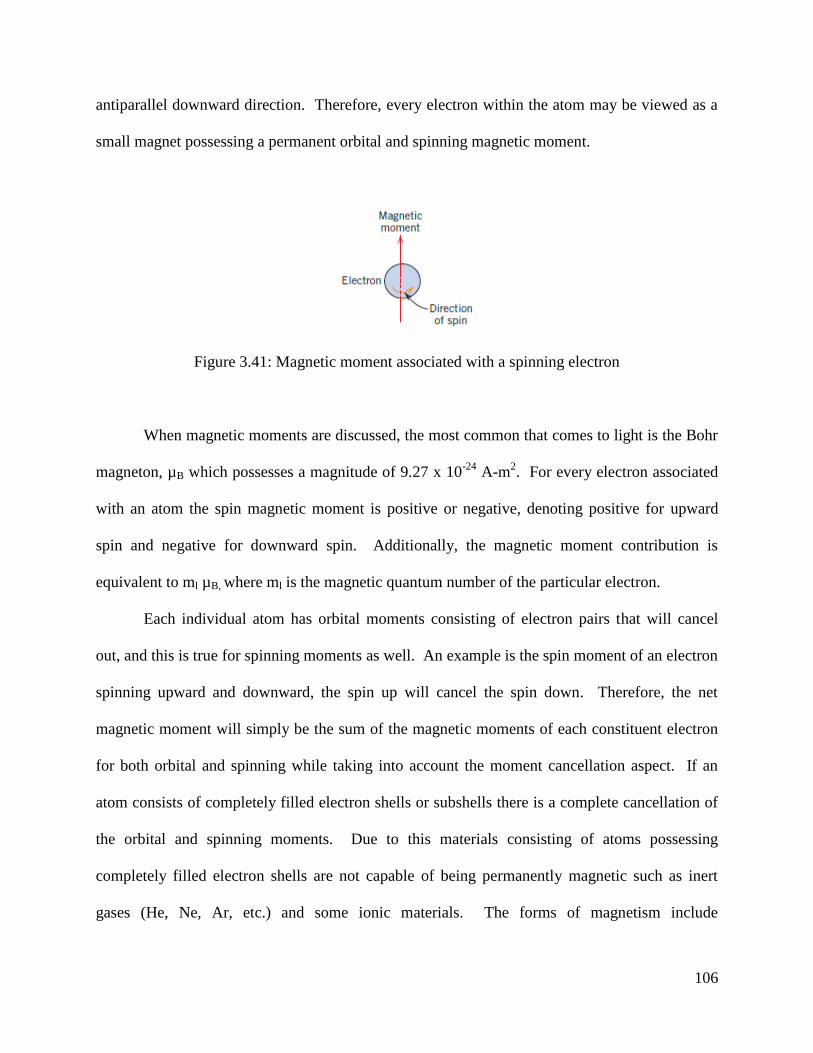
106
antiparallel downward direction. Therefore, every electron within the atom may be viewed as a
small magnet possessing a permanent orbital and spinning magnetic moment.
Figure 3.41: Magnetic moment associated with a spinning electron
When magnetic moments are discussed, the most common that comes to light is the Bohr
magneton, µB which possesses a magnitude of 9.27 x 10⁻²⁴
A-m2. For every electron associated
with an atom the spin magnetic moment is positive or negative, denoting positive for upward
spin and negative for downward spin. Additionally, the magnetic moment contribution is
equivalent to ml µB, where ml is the magnetic quantum number of the particular electron.
Each individual atom has orbital moments consisting of electron pairs that will cancel
out, and this is true for spinning moments as well. An example is the spin moment of an electron
spinning upward and downward, the spin up will cancel the spin down. Therefore, the net
magnetic moment will simply be the sum of the magnetic moments of each constituent electron
for both orbital and spinning while taking into account the moment cancellation aspect. If an
atom consists of completely filled electron shells or subshells there is a complete cancellation of
the orbital and spinning moments. Due to this materials consisting of atoms possessing
completely filled electron shells are not capable of being permanently magnetic such as inert
gases (He, Ne, Ar, etc.) and some ionic materials. The forms of magnetism include

107
diamagnetism, paramagnetism, and ferromagnetism. A couple of subclasses of ferromagnetism
do exist and they are antiferromagnetism and ferrimagnetism. All materials do exhibit a form of
magnetism and the overall behavior is dependent upon the response of electron and atomic
magnetic dipoles to the externally applied magnetic field.
3.4.5 – Magnetic Actuation PDMS Micropump
The magnetic PDMS micropump can be fabricated utilizing the methods of
microfabrication and rapid-prototyping facilities. The flow region for the PDMS micropump is
actuated with the use of magnetic material, Fe2B (figure 3.42) incorporated into the PDMS
mixture.
Figure 3.42: Fe2B Particulates
The procedure for blending in the particulate is the same as previously discussed where varying
percentages of the magnetic material was utilized to determine whether or not the magnetic

108
strength would increase if the particulate amount was increased. After following the mixing and
curing procedures a magnetic micropump was developed as seen in figure 3.43.
Figure 3.43: PDMS Magnetic Fabricated Micropump
3.4.6 – Magnetic Force
When an object or material is in the presence of a magnetic field, the single-domain
magnetic particles suspended in the PDMS begin to feel a magnetic attract or repulsive force. In
figure 3.44 a theoretical schematic is shown of the randomly oriented north poles of the Fe2B
particles within the PDMS material before curing and being absent of an external magnetic field.

109
Figure 3.44: Randomly Oriented Fe2B in PDMS
In theory if the Fe2B magnetic particles were coupled with a permanent magnet, the
magnetic poles would align themselves as theorized in figure 3.45. This would allow the PDMS
micropump to exhibit a well-established magnetization as it interacts with an external magnetic
field to produce attractive and/or repulsive forces on each Fe2B particulate within the PDMS
mixture.
Figure 3.45: External magnetic field applied to PDMS/ Fe2B Mixture
110
The attractive/repulsive magnetic forces that are exhibited on the PDMS material acts
similar to a body force on the PDMS, similar to the body force on a solid due to gravity.
Magnetic force can be defined as follows:
where µ is the magnetic permeability of free space (Teslas-minute per Ampere, Tm/A), M is the
magnetization (A/m), is the gradient, and H is the magnetic field (A/m) [104], [105].
Magnetization occurs when the Fe2B become polarized in the presence of an external
magnetic field. When the strength of the external magnetic field increases from zero A/m, the
Fe2B particles encapsulated within the PDMS will become magnetized to a degree, ultimately
controlled by the strength of the external field being applied as well as the particles utilized
(Fe2B).
HMF

111
3.5: Piezoelectric Actuation Fabrication
Piezoelectric actuation is another method that is currently under investigation. Three
types of piezoelectric materials are being investigated, PZT, PVDF (Polyvinylidene Fluoride),
and MFC (Macro Fiber Composite). Each of these materials has characteristics that could be
possibly utilized for the actuation of the micropump. To affix the piezoelectric material to the
micropump it can either be adhered with gluing or fabricated into the PDMS during
curing/mixing. An example of the piezoelectric placement on the micropumps can be seen in
figures 3.46 and 3.47. After the PDMS underwent the application of the piezoelectric materials
testing was done. The testing and characterization methods will be discussed in later chapters.
Figure 3.46: Piezoelectric Adhered to PDMS Micropump
Figure 3.47: PDMS Micropumps with Piezoelectric Material affixed
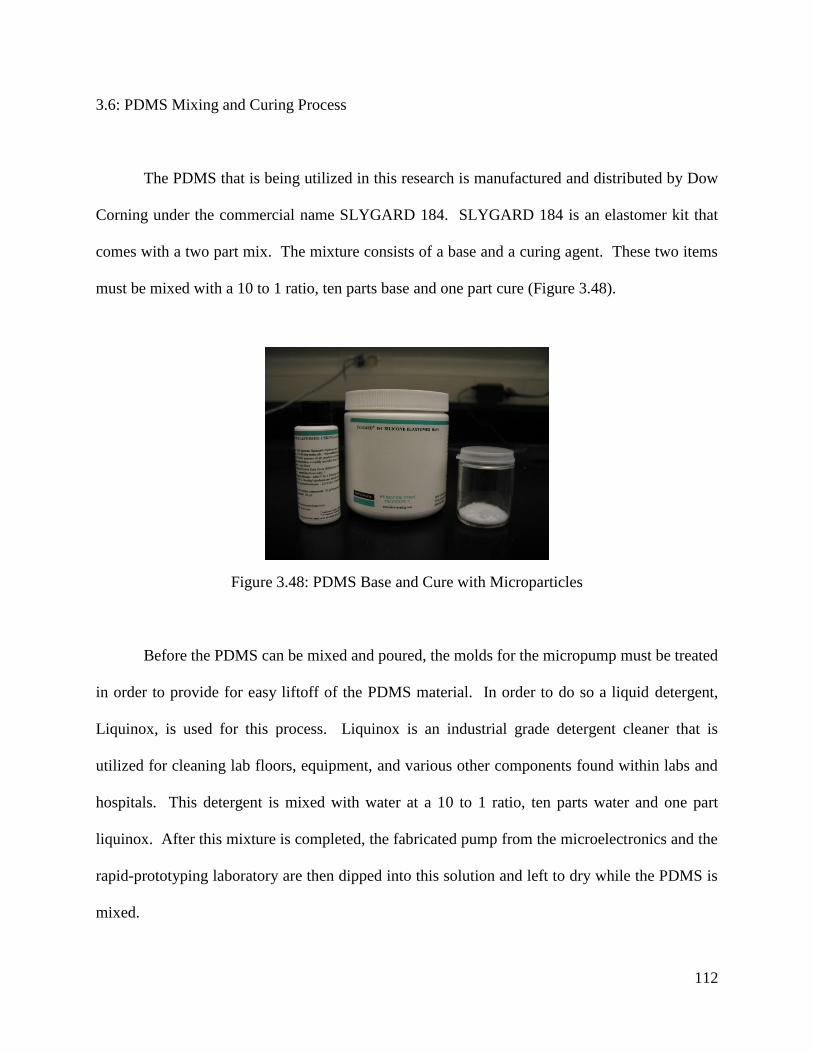
112
3.6: PDMS Mixing and Curing Process
The PDMS that is being utilized in this research is manufactured and distributed by Dow
Corning under the commercial name SLYGARD 184. SLYGARD 184 is an elastomer kit that
comes with a two part mix. The mixture consists of a base and a curing agent. These two items
must be mixed with a 10 to 1 ratio, ten parts base and one part cure (Figure 3.48).
Figure 3.48: PDMS Base and Cure with Microparticles
Before the PDMS can be mixed and poured, the molds for the micropump must be treated
in order to provide for easy liftoff of the PDMS material. In order to do so a liquid detergent,
Liquinox, is used for this process. Liquinox is an industrial grade detergent cleaner that is
utilized for cleaning lab floors, equipment, and various other components found within labs and
hospitals. This detergent is mixed with water at a 10 to 1 ratio, ten parts water and one part
liquinox. After this mixture is completed, the fabricated pump from the microelectronics and the
rapid-prototyping laboratory are then dipped into this solution and left to dry while the PDMS is
mixed.
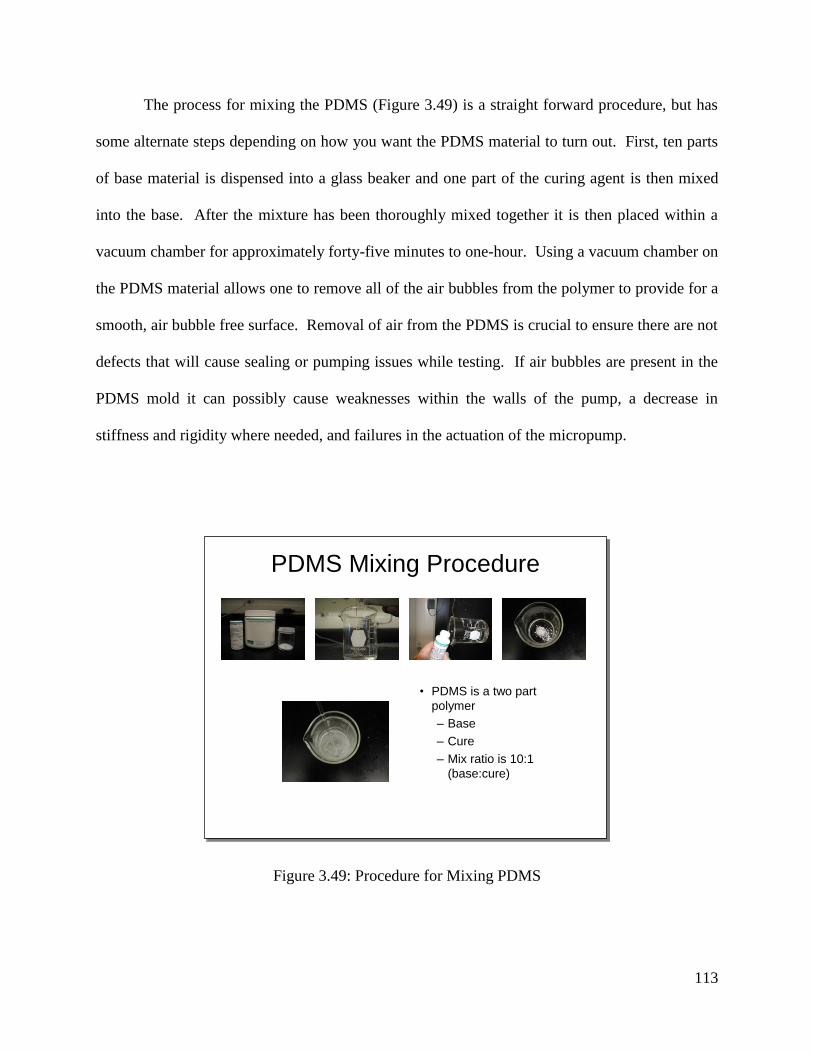
113
The process for mixing the PDMS (Figure 3.49) is a straight forward procedure, but has
some alternate steps depending on how you want the PDMS material to turn out. First, ten parts
of base material is dispensed into a glass beaker and one part of the curing agent is then mixed
into the base. After the mixture has been thoroughly mixed together it is then placed within a
vacuum chamber for approximately forty-five minutes to one-hour. Using a vacuum chamber on
the PDMS material allows one to remove all of the air bubbles from the polymer to provide for a
smooth, air bubble free surface. Removal of air from the PDMS is crucial to ensure there are not
defects that will cause sealing or pumping issues while testing. If air bubbles are present in the
PDMS mold it can possibly cause weaknesses within the walls of the pump, a decrease in
stiffness and rigidity where needed, and failures in the actuation of the micropump.
Figure 3.49: Procedure for Mixing PDMS
PDMS Mixing Procedure
• PDMS is a two part
polymer
– Base
– Cure
– Mix ratio is 10:1
(base:cure)
PDMS Mixing Procedure
• PDMS is a two part
polymer
– Base
– Cure
– Mix ratio is 10:1
(base:cure)

114
Figure 3.50: PDMS Degassing Procedure
Once the PDMS has been degassed (air-bubble removal, Figure 3.50) it can be simply
dispensed onto the fabricated micropump molds (that were treated with Liquinox) until the
desired quantity is achieved. After the PDMS has been poured the molds are placed into an oven
(Figure 3.51). The oven temperatures can range from seventy degrees Celsius to eight five
degrees Celsius. The part is baked for one-hour and then removed from the oven. During a
twenty-four hour period it is left to cure at room temperature. Sometimes there have been issues
with this procedure, and other possibilities do exist, such as allowing the part to bake twenty-four
hours and let it cure at room temperature for another twenty-four hours. Depending on the
mixture, temperatures, and other factors the bake times can fluctuate. Incorporation of
microparticles can be placed within the PDMS giving the material a more rigid and stronger
polymer. This can be done if strength of the PDMS is not sufficient and the material appears
weak.
PDMS Degassing Procedure
• Degassing process:
– Place PDMS in Vacuum chamber
– Apply a vacuum for
approximately 30
minutes
PDMS Degassing Procedure
• Degassing process:
– Place PDMS in
Vacuum chamber
– Apply a vacuum for
approximately 30
minutes
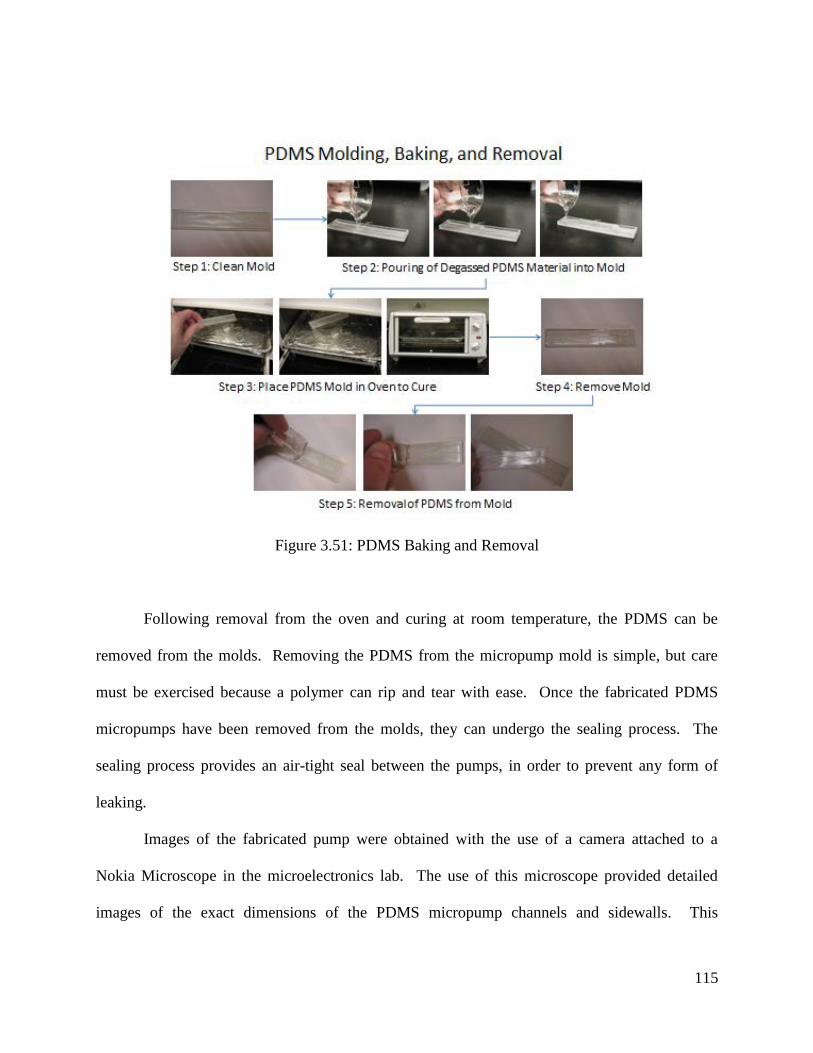
115
Figure 3.51: PDMS Baking and Removal
Following removal from the oven and curing at room temperature, the PDMS can be
removed from the molds. Removing the PDMS from the micropump mold is simple, but care
must be exercised because a polymer can rip and tear with ease. Once the fabricated PDMS
micropumps have been removed from the molds, they can undergo the sealing process. The
sealing process provides an air-tight seal between the pumps, in order to prevent any form of
leaking.
Images of the fabricated pump were obtained with the use of a camera attached to a
Nokia Microscope in the microelectronics lab. The use of this microscope provided detailed
images of the exact dimensions of the PDMS micropump channels and sidewalls. This
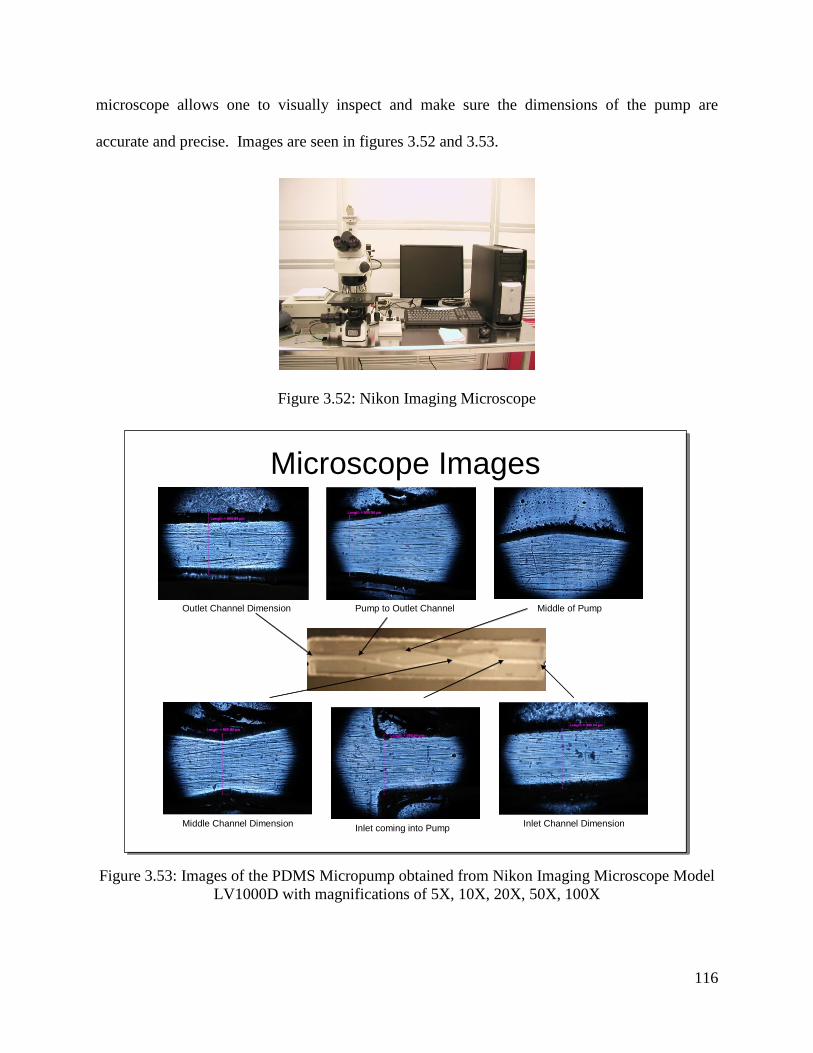
116
microscope allows one to visually inspect and make sure the dimensions of the pump are
accurate and precise. Images are seen in figures 3.52 and 3.53.
Figure 3.52: Nikon Imaging Microscope
Figure 3.53: Images of the PDMS Micropump obtained from Nikon Imaging Microscope Model
LV1000D with magnifications of 5X, 10X, 20X, 50X, 100X
Outlet Channel Dimension
Middle Channel DimensionInlet coming into Pump
Inlet Channel Dimension
Pump to Outlet Channel Middle of Pump
Microscope Images
Outlet Channel Dimension
Middle Channel DimensionInlet coming into Pump
Inlet Channel Dimension
Pump to Outlet Channel Middle of Pump
Microscope Images
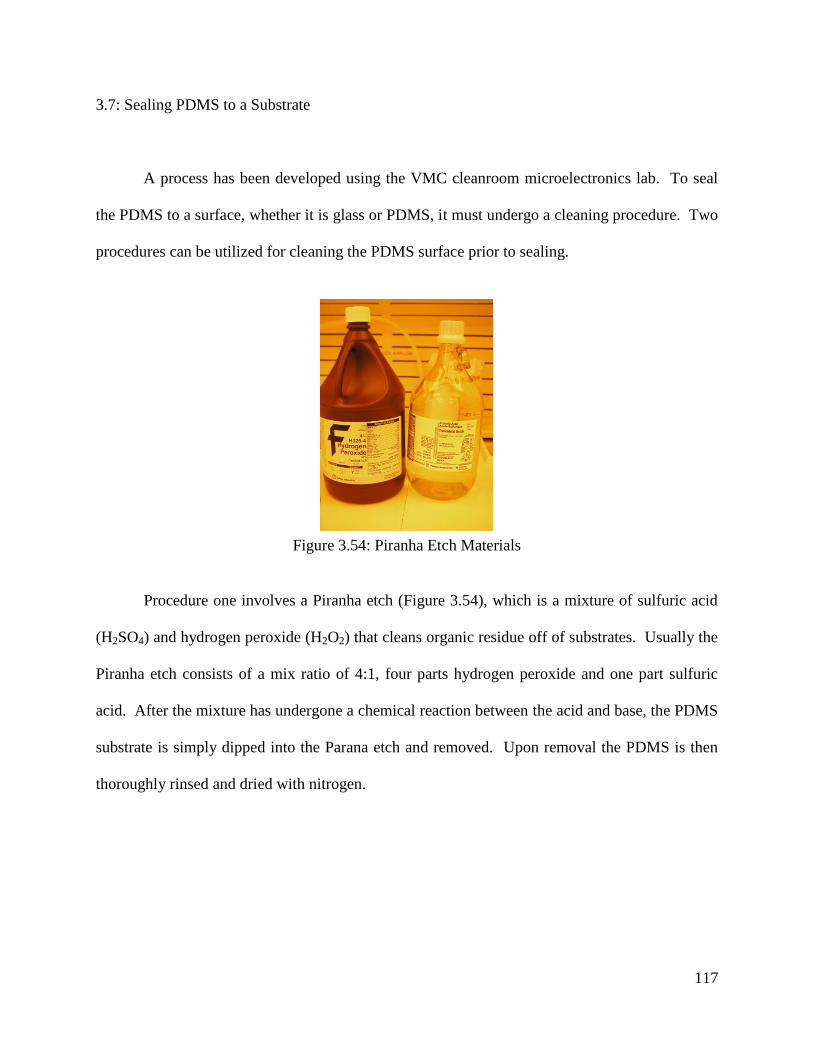
117
3.7: Sealing PDMS to a Substrate
A process has been developed using the VMC cleanroom microelectronics lab. To seal
the PDMS to a surface, whether it is glass or PDMS, it must undergo a cleaning procedure. Two
procedures can be utilized for cleaning the PDMS surface prior to sealing.
Figure 3.54: Piranha Etch Materials
Procedure one involves a Piranha etch (Figure 3.54), which is a mixture of sulfuric acid
(H2SO4) and hydrogen peroxide (H2O2) that cleans organic residue off of substrates. Usually the
Piranha etch consists of a mix ratio of 4:1, four parts hydrogen peroxide and one part sulfuric
acid. After the mixture has undergone a chemical reaction between the acid and base, the PDMS
substrate is simply dipped into the Parana etch and removed. Upon removal the PDMS is then
thoroughly rinsed and dried with nitrogen.
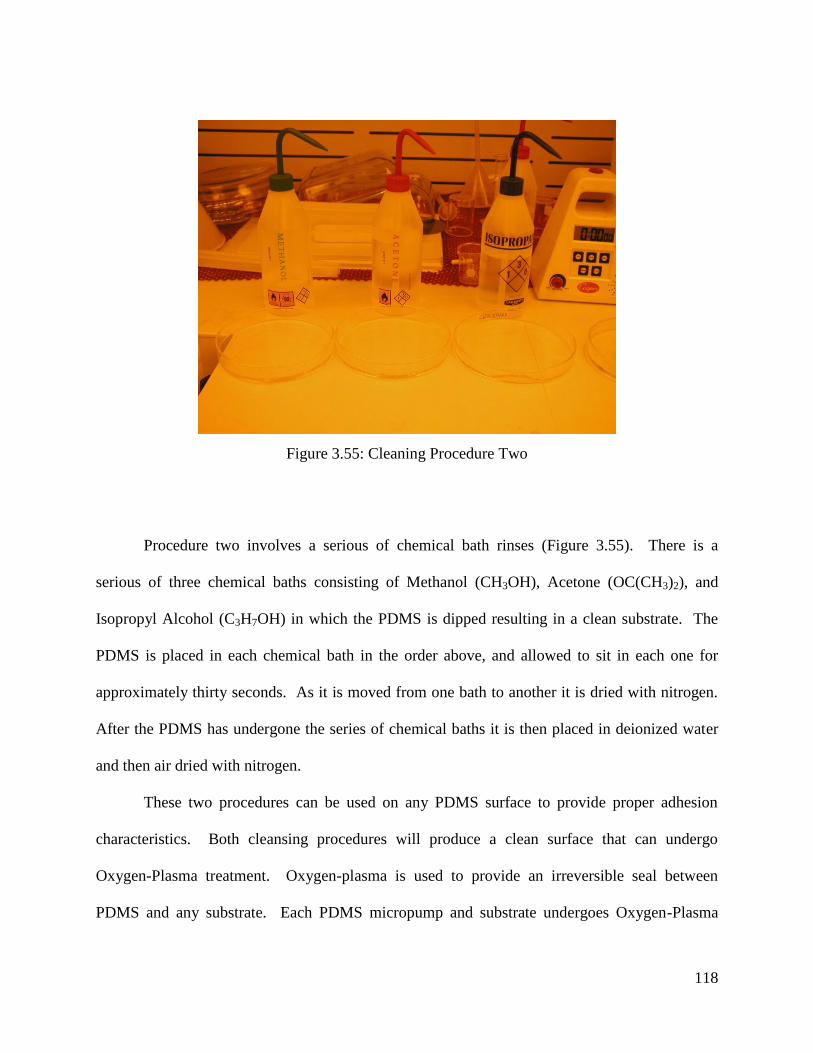
118
Figure 3.55: Cleaning Procedure Two
Procedure two involves a serious of chemical bath rinses (Figure 3.55). There is a
serious of three chemical baths consisting of Methanol (CH3OH), Acetone (OC(CH3)2), and
Isopropyl Alcohol (C3H7OH) in which the PDMS is dipped resulting in a clean substrate. The
PDMS is placed in each chemical bath in the order above, and allowed to sit in each one for
approximately thirty seconds. As it is moved from one bath to another it is dried with nitrogen.
After the PDMS has undergone the series of chemical baths it is then placed in deionized water
and then air dried with nitrogen.
These two procedures can be used on any PDMS surface to provide proper adhesion
characteristics. Both cleansing procedures will produce a clean surface that can undergo
Oxygen-Plasma treatment. Oxygen-plasma is used to provide an irreversible seal between
PDMS and any substrate. Each PDMS micropump and substrate undergoes Oxygen-Plasma
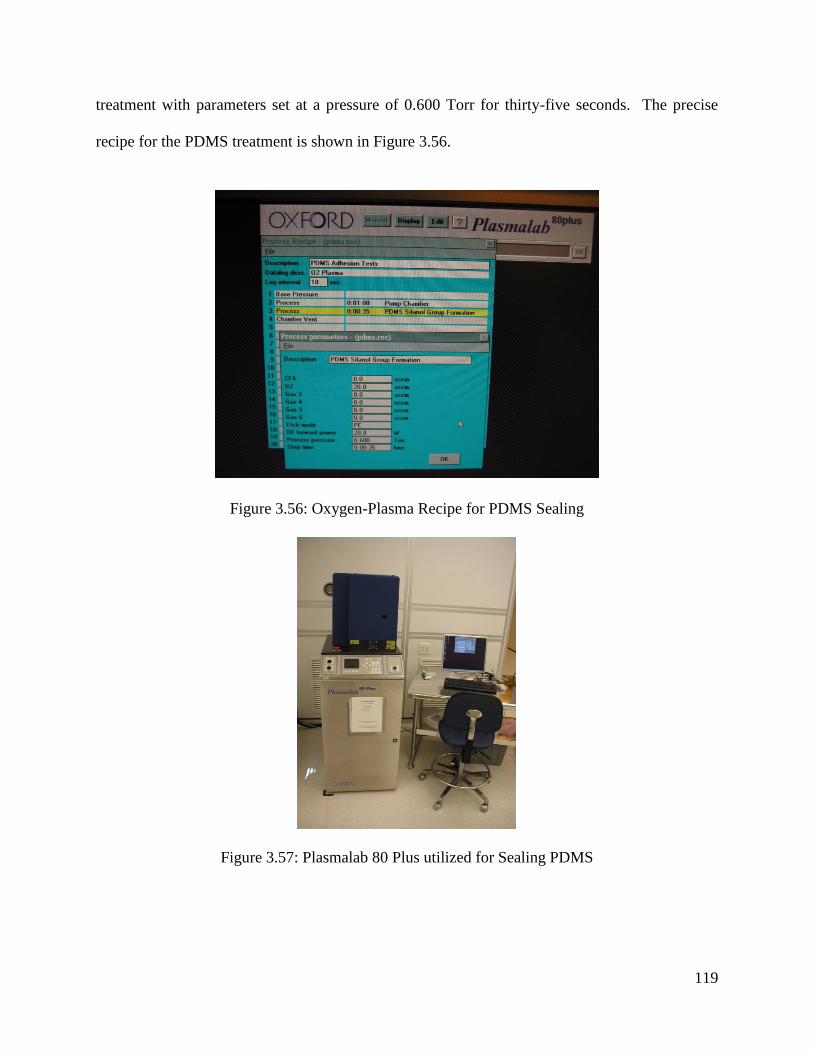
119
treatment with parameters set at a pressure of 0.600 Torr for thirty-five seconds. The precise
recipe for the PDMS treatment is shown in Figure 3.56.
Figure 3.56: Oxygen-Plasma Recipe for PDMS Sealing
Figure 3.57: Plasmalab 80 Plus utilized for Sealing PDMS
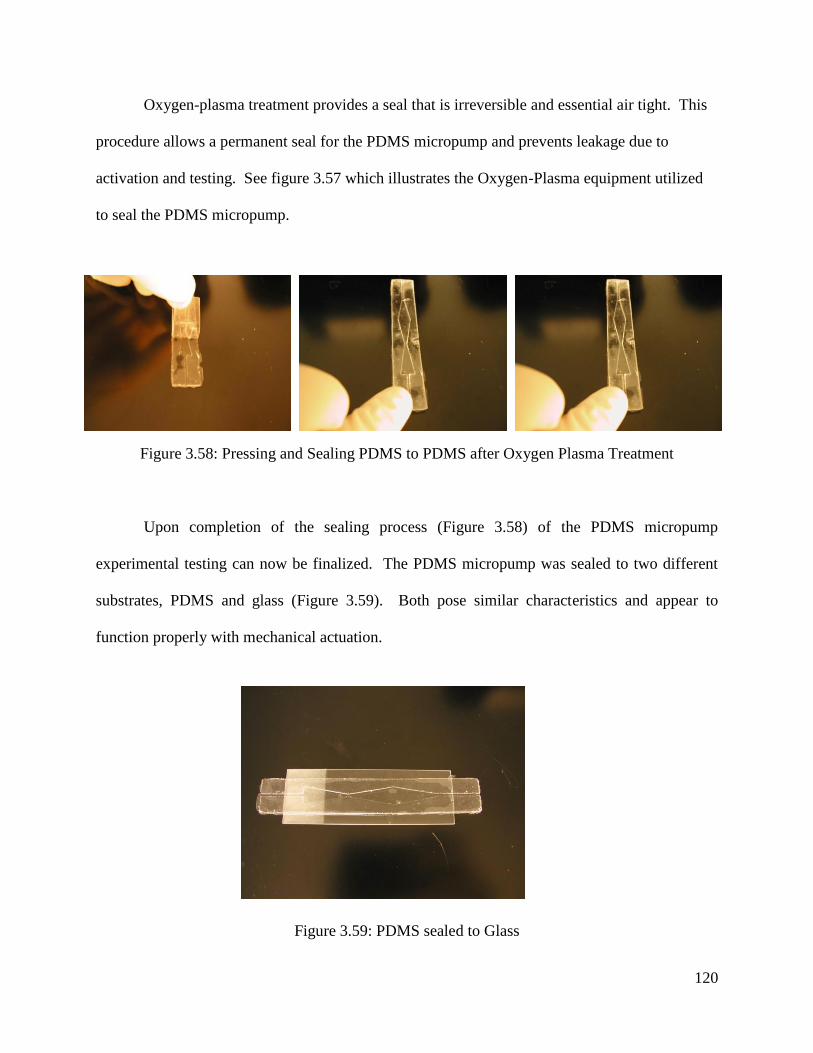
120
Oxygen-plasma treatment provides a seal that is irreversible and essential air tight. This
procedure allows a permanent seal for the PDMS micropump and prevents leakage due to
activation and testing. See figure 3.57 which illustrates the Oxygen-Plasma equipment utilized
to seal the PDMS micropump.
Figure 3.58: Pressing and Sealing PDMS to PDMS after Oxygen Plasma Treatment
Upon completion of the sealing process (Figure 3.58) of the PDMS micropump
experimental testing can now be finalized. The PDMS micropump was sealed to two different
substrates, PDMS and glass (Figure 3.59). Both pose similar characteristics and appear to
function properly with mechanical actuation.
Figure 3.59: PDMS sealed to Glass
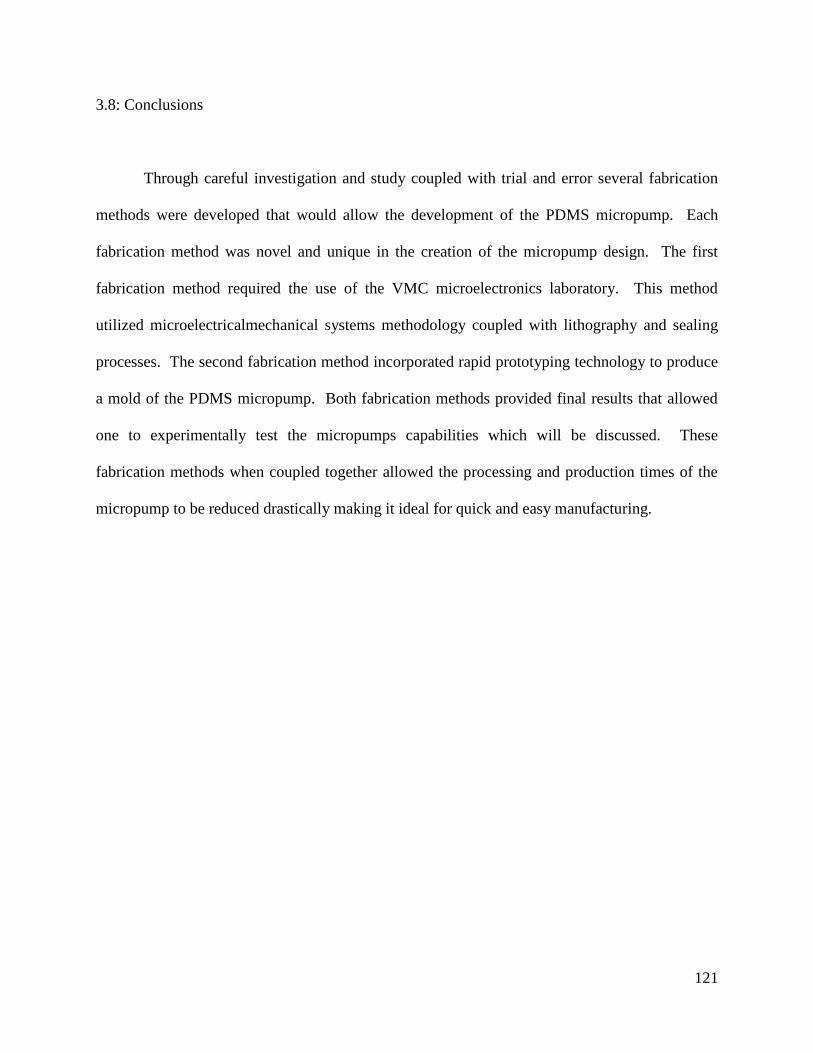
121
3.8: Conclusions
Through careful investigation and study coupled with trial and error several fabrication
methods were developed that would allow the development of the PDMS micropump. Each
fabrication method was novel and unique in the creation of the micropump design. The first
fabrication method required the use of the VMC microelectronics laboratory. This method
utilized microelectricalmechanical systems methodology coupled with lithography and sealing
processes. The second fabrication method incorporated rapid prototyping technology to produce
a mold of the PDMS micropump. Both fabrication methods provided final results that allowed
one to experimentally test the micropumps capabilities which will be discussed. These
fabrication methods when coupled together allowed the processing and production times of the
micropump to be reduced drastically making it ideal for quick and easy manufacturing.
122
CHAPTER 4 Testing and Characterization
4.1: Introduction to the Types of Testing
After the PDMS micropump was designed and fabricated, it underwent various forms of
testing and characterization. The methods of actuation that were investigated involved the use of
electrostatic actuation, piezoelectric actuation, magnetic actuation, pneumatic (mechanical
reciprocating motor) actuation, and a pressurized vessel actuation method to deliver a fluid under
a particular pressure. Each of these methods will be discussed in detail in the following sections.
4.2: Electrostatic Actuation
As previously discussed the fabrication method for the electrostatic pump was quite
extensive and novel. The fabrication technique utilized a commonly used polymer,
polydimethylsiloxane (PDMS). The pump was constructed from a molded PDMS wafer process,
coupled with metal electrodes. After the pump was finished and connections in place it was then
sealed to a glass substrate with corresponding metal connections. Sealing of the two structures
utilized a unique oxygen plasma treatment between the PDMS and glass wafer structure. A
complete electrostatic fabrication wafer is shown in figure 4.1.
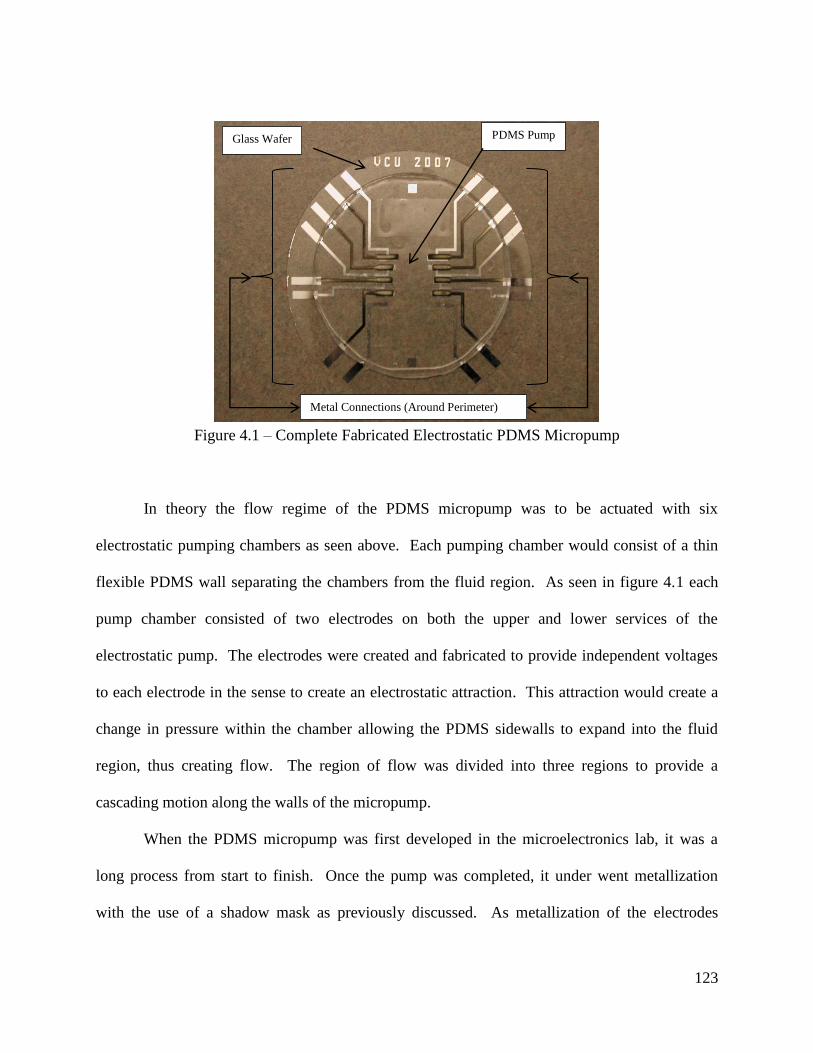
123
Metal Connections (Around Perimeter)
Glass Wafer PDMS Pump
Figure 4.1 – Complete Fabricated Electrostatic PDMS Micropump
In theory the flow regime of the PDMS micropump was to be actuated with six
electrostatic pumping chambers as seen above. Each pumping chamber would consist of a thin
flexible PDMS wall separating the chambers from the fluid region. As seen in figure 4.1 each
pump chamber consisted of two electrodes on both the upper and lower services of the
electrostatic pump. The electrodes were created and fabricated to provide independent voltages
to each electrode in the sense to create an electrostatic attraction. This attraction would create a
change in pressure within the chamber allowing the PDMS sidewalls to expand into the fluid
region, thus creating flow. The region of flow was divided into three regions to provide a
cascading motion along the walls of the micropump.
When the PDMS micropump was first developed in the microelectronics lab, it was a
long process from start to finish. Once the pump was completed, it under went metallization
with the use of a shadow mask as previously discussed. As metallization of the electrodes
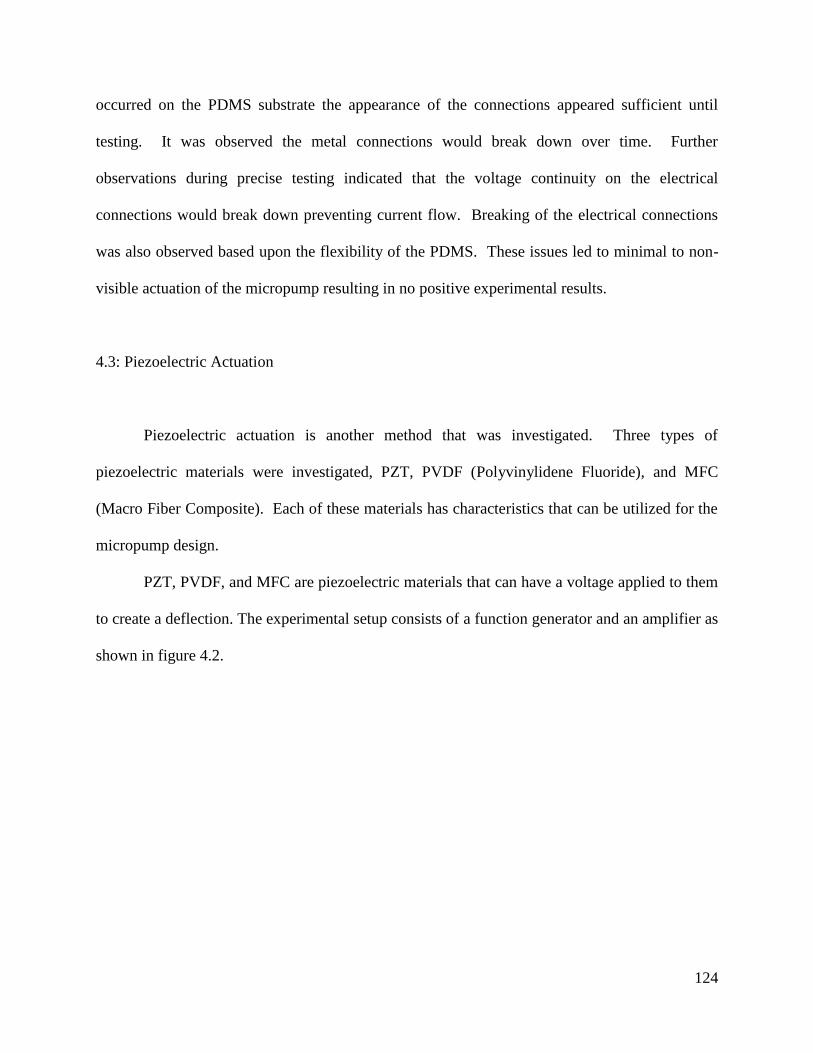
124
occurred on the PDMS substrate the appearance of the connections appeared sufficient until
testing. It was observed the metal connections would break down over time. Further
observations during precise testing indicated that the voltage continuity on the electrical
connections would break down preventing current flow. Breaking of the electrical connections
was also observed based upon the flexibility of the PDMS. These issues led to minimal to non-
visible actuation of the micropump resulting in no positive experimental results.
4.3: Piezoelectric Actuation
Piezoelectric actuation is another method that was investigated. Three types of
piezoelectric materials were investigated, PZT, PVDF (Polyvinylidene Fluoride), and MFC
(Macro Fiber Composite). Each of these materials has characteristics that can be utilized for the
micropump design.
PZT, PVDF, and MFC are piezoelectric materials that can have a voltage applied to them
to create a deflection. The experimental setup consists of a function generator and an amplifier as
shown in figure 4.2.
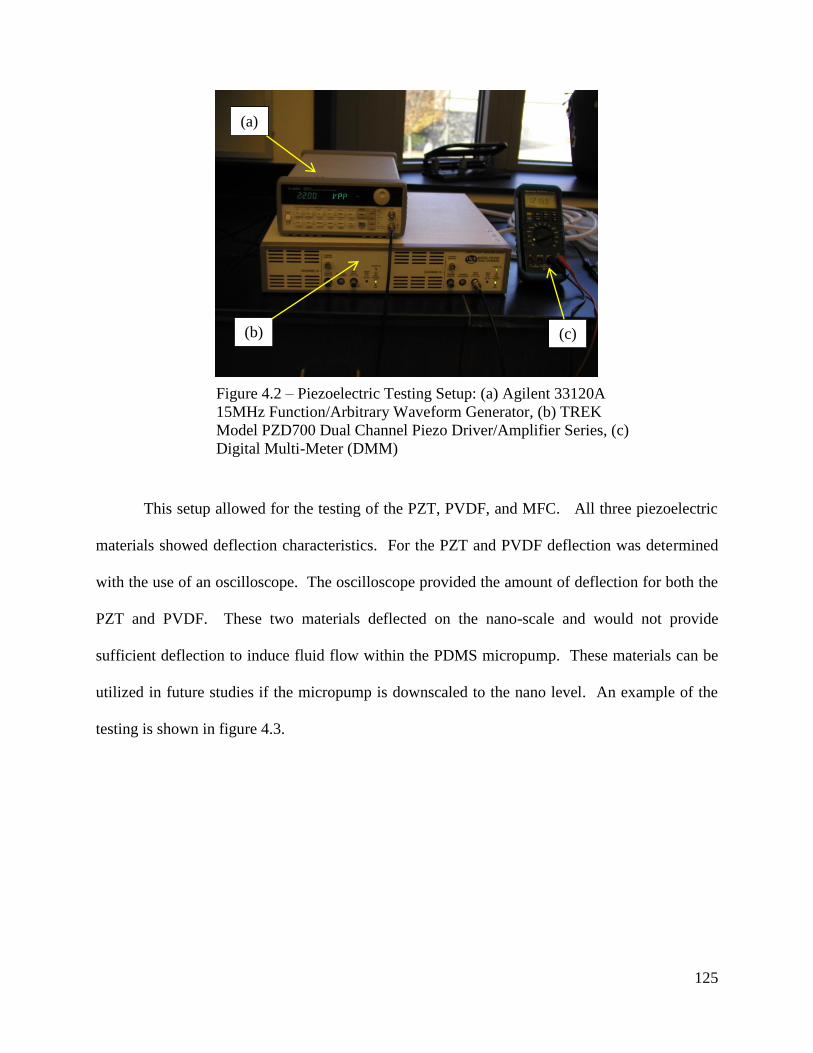
125
This setup allowed for the testing of the PZT, PVDF, and MFC. All three piezoelectric
materials showed deflection characteristics. For the PZT and PVDF deflection was determined
with the use of an oscilloscope. The oscilloscope provided the amount of deflection for both the
PZT and PVDF. These two materials deflected on the nano-scale and would not provide
sufficient deflection to induce fluid flow within the PDMS micropump. These materials can be
utilized in future studies if the micropump is downscaled to the nano level. An example of the
testing is shown in figure 4.3.
(a)
(b) (c)
Figure 4.2 – Piezoelectric Testing Setup: (a) Agilent 33120A
15MHz Function/Arbitrary Waveform Generator, (b) TREK
Model PZD700 Dual Channel Piezo Driver/Amplifier Series, (c)
Digital Multi-Meter (DMM)
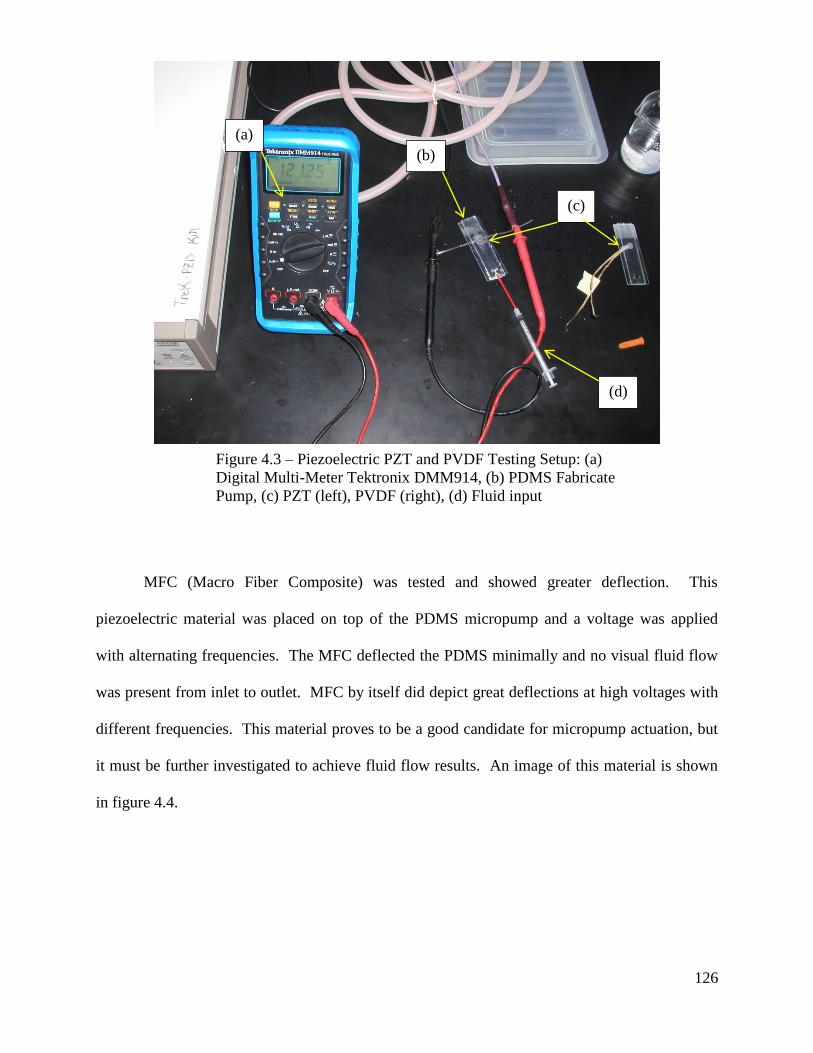
126
(a)
(b)
(d)
(c)
Figure 4.3 – Piezoelectric PZT and PVDF Testing Setup: (a)
Digital Multi-Meter Tektronix DMM914, (b) PDMS Fabricate
Pump, (c) PZT (left), PVDF (right), (d) Fluid input
MFC (Macro Fiber Composite) was tested and showed greater deflection. This
piezoelectric material was placed on top of the PDMS micropump and a voltage was applied
with alternating frequencies. The MFC deflected the PDMS minimally and no visual fluid flow
was present from inlet to outlet. MFC by itself did depict great deflections at high voltages with
different frequencies. This material proves to be a good candidate for micropump actuation, but
it must be further investigated to achieve fluid flow results. An image of this material is shown
in figure 4.4.
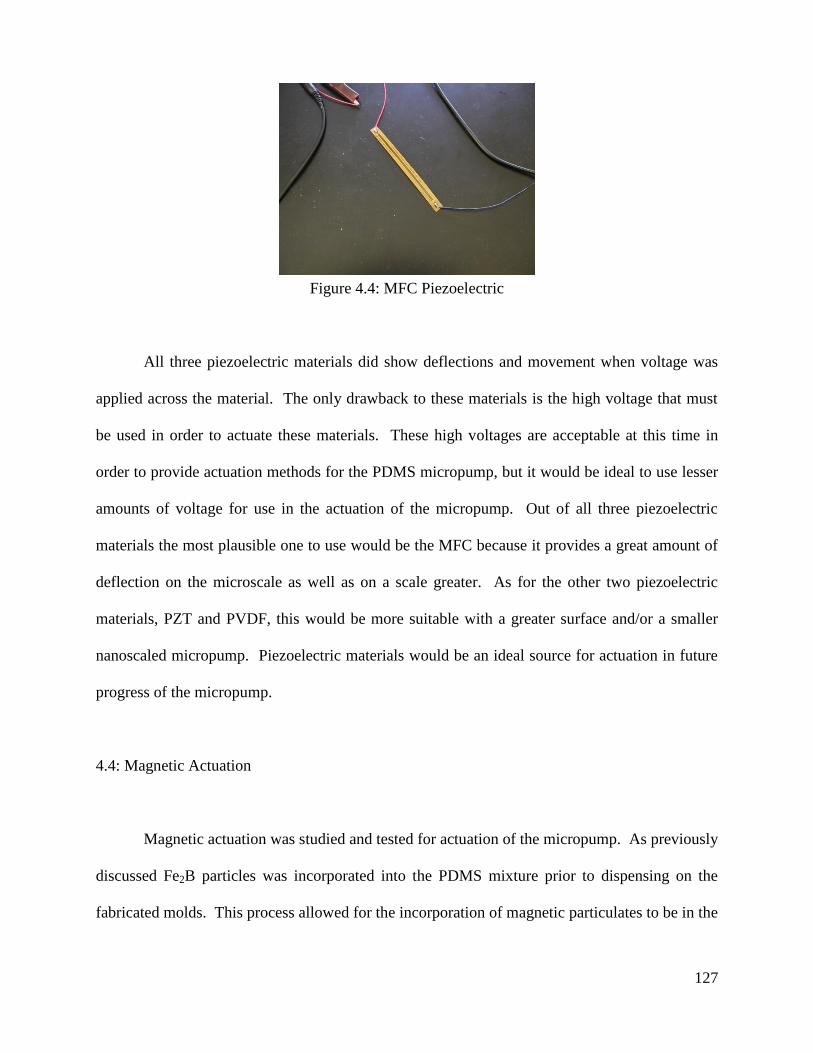
127
Figure 4.4: MFC Piezoelectric
All three piezoelectric materials did show deflections and movement when voltage was
applied across the material. The only drawback to these materials is the high voltage that must
be used in order to actuate these materials. These high voltages are acceptable at this time in
order to provide actuation methods for the PDMS micropump, but it would be ideal to use lesser
amounts of voltage for use in the actuation of the micropump. Out of all three piezoelectric
materials the most plausible one to use would be the MFC because it provides a great amount of
deflection on the microscale as well as on a scale greater. As for the other two piezoelectric
materials, PZT and PVDF, this would be more suitable with a greater surface and/or a smaller
nanoscaled micropump. Piezoelectric materials would be an ideal source for actuation in future
progress of the micropump.
4.4: Magnetic Actuation
Magnetic actuation was studied and tested for actuation of the micropump. As previously
discussed Fe2B particles was incorporated into the PDMS mixture prior to dispensing on the
fabricated molds. This process allowed for the incorporation of magnetic particulates to be in the
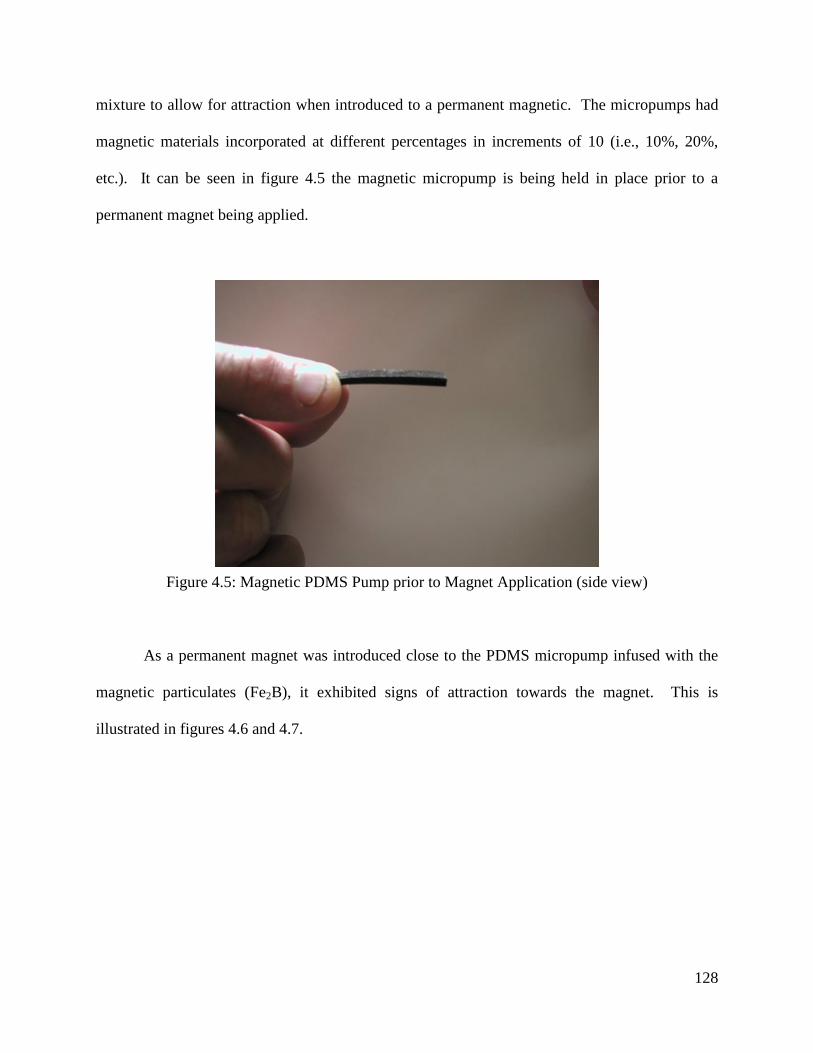
128
mixture to allow for attraction when introduced to a permanent magnetic. The micropumps had
magnetic materials incorporated at different percentages in increments of 10 (i.e., 10%, 20%,
etc.). It can be seen in figure 4.5 the magnetic micropump is being held in place prior to a
permanent magnet being applied.
Figure 4.5: Magnetic PDMS Pump prior to Magnet Application (side view)
As a permanent magnet was introduced close to the PDMS micropump infused with the
magnetic particulates (Fe2B), it exhibited signs of attraction towards the magnet. This is
illustrated in figures 4.6 and 4.7.
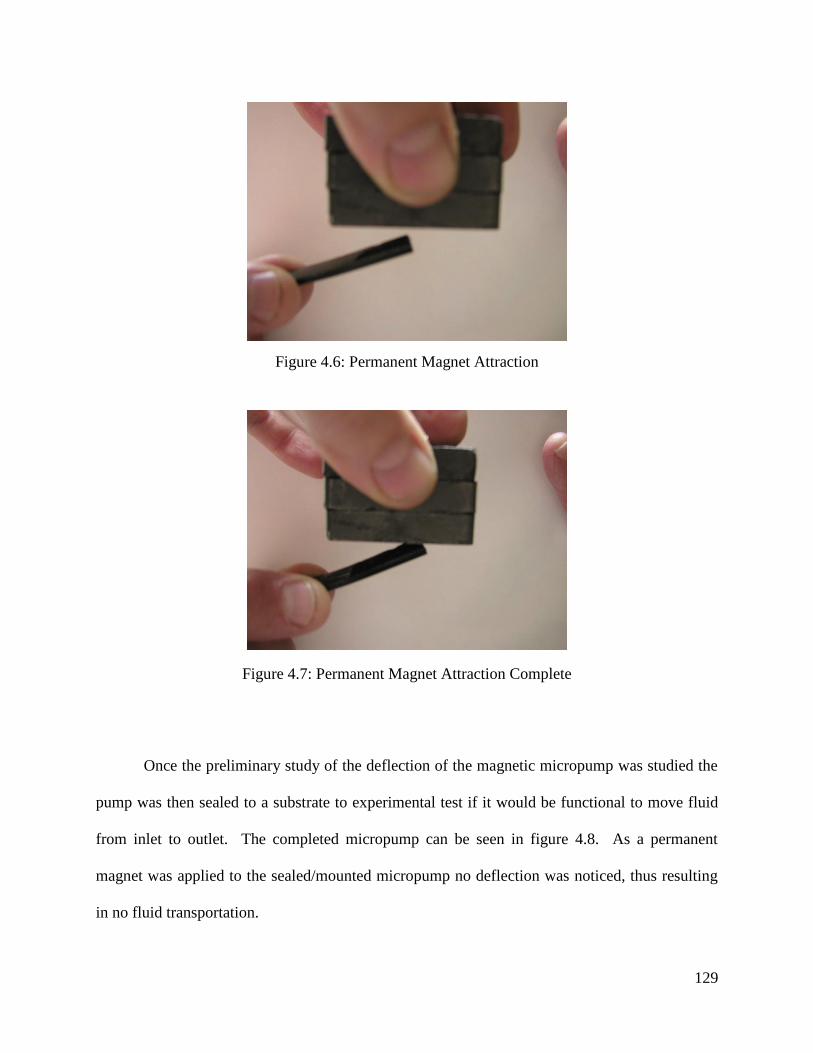
129
Figure 4.6: Permanent Magnet Attraction
Figure 4.7: Permanent Magnet Attraction Complete
Once the preliminary study of the deflection of the magnetic micropump was studied the
pump was then sealed to a substrate to experimental test if it would be functional to move fluid
from inlet to outlet. The completed micropump can be seen in figure 4.8. As a permanent
magnet was applied to the sealed/mounted micropump no deflection was noticed, thus resulting
in no fluid transportation.
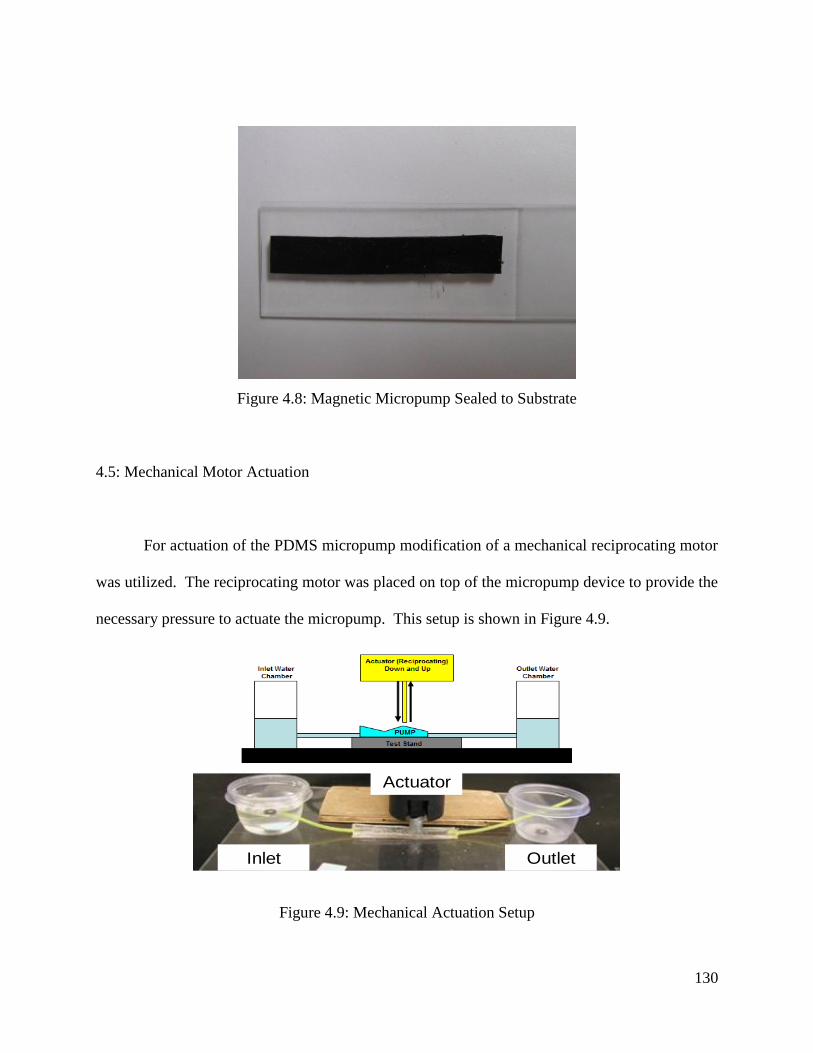
130
Figure 4.8: Magnetic Micropump Sealed to Substrate
4.5: Mechanical Motor Actuation
For actuation of the PDMS micropump modification of a mechanical reciprocating motor
was utilized. The reciprocating motor was placed on top of the micropump device to provide the
necessary pressure to actuate the micropump. This setup is shown in Figure 4.9.
Figure 4.9: Mechanical Actuation Setup
Actuator
Inlet Outlet
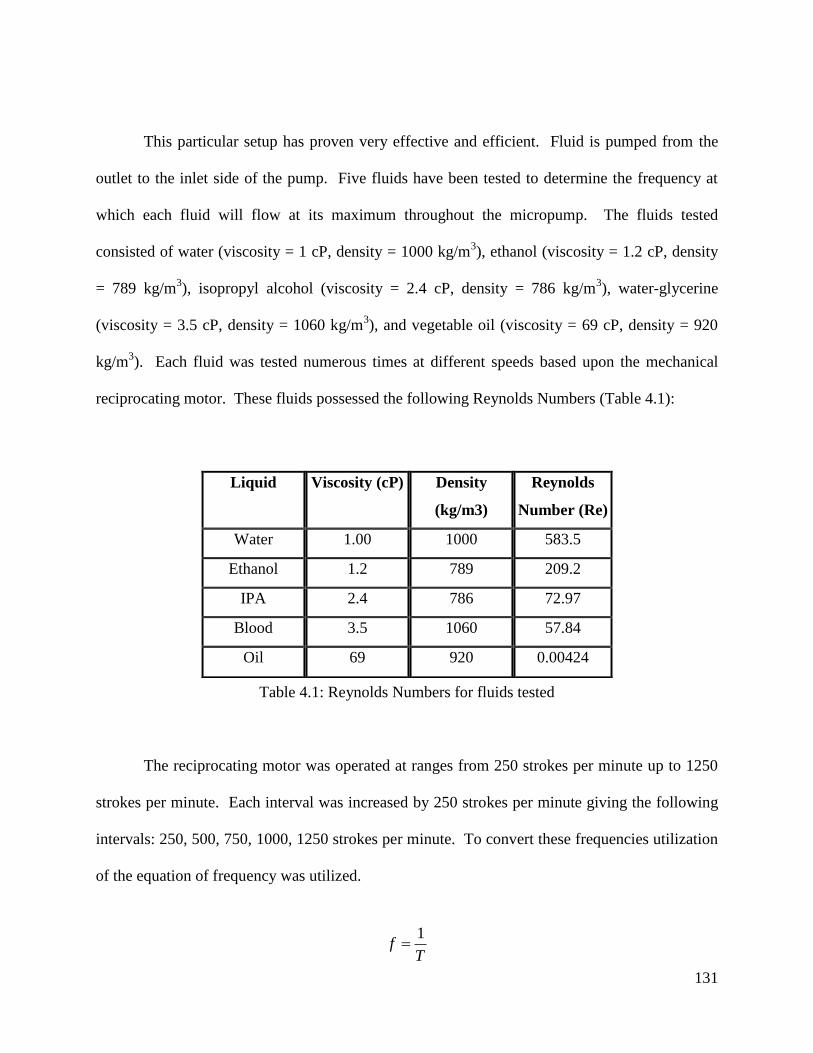
131
This particular setup has proven very effective and efficient. Fluid is pumped from the
outlet to the inlet side of the pump. Five fluids have been tested to determine the frequency at
which each fluid will flow at its maximum throughout the micropump. The fluids tested
consisted of water (viscosity = 1 cP, density = 1000 kg/m3), ethanol (viscosity = 1.2 cP, density
= 789 kg/m3), isopropyl alcohol (viscosity = 2.4 cP, density = 786 kg/m
3), water-glycerine
(viscosity = 3.5 cP, density = 1060 kg/m3), and vegetable oil (viscosity = 69 cP, density = 920
kg/m3). Each fluid was tested numerous times at different speeds based upon the mechanical
reciprocating motor. These fluids possessed the following Reynolds Numbers (Table 4.1):
Table 4.1: Reynolds Numbers for fluids tested
The reciprocating motor was operated at ranges from 250 strokes per minute up to 1250
strokes per minute. Each interval was increased by 250 strokes per minute giving the following
intervals: 250, 500, 750, 1000, 1250 strokes per minute. To convert these frequencies utilization
of the equation of frequency was utilized.
Liquid Viscosity (cP) Density
(kg/m3)
Reynolds
Number (Re)
Water 1.00 1000 583.5
Ethanol 1.2 789 209.2
IPA 2.4 786 72.97
Blood 3.5 1060 57.84
Oil 69 920 0.00424
Tf
1
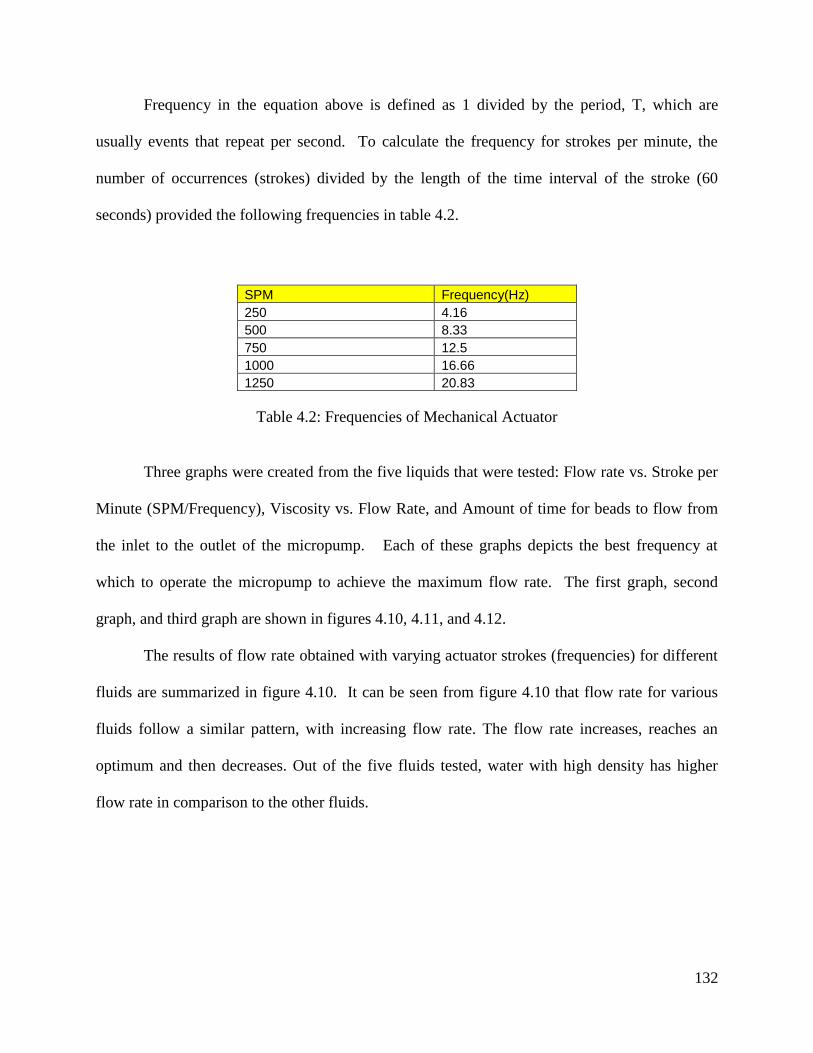
132
Frequency in the equation above is defined as 1 divided by the period, T, which are
usually events that repeat per second. To calculate the frequency for strokes per minute, the
number of occurrences (strokes) divided by the length of the time interval of the stroke (60
seconds) provided the following frequencies in table 4.2.
Table 4.2: Frequencies of Mechanical Actuator
Three graphs were created from the five liquids that were tested: Flow rate vs. Stroke per
Minute (SPM/Frequency), Viscosity vs. Flow Rate, and Amount of time for beads to flow from
the inlet to the outlet of the micropump. Each of these graphs depicts the best frequency at
which to operate the micropump to achieve the maximum flow rate. The first graph, second
graph, and third graph are shown in figures 4.10, 4.11, and 4.12.
The results of flow rate obtained with varying actuator strokes (frequencies) for different
fluids are summarized in figure 4.10. It can be seen from figure 4.10 that flow rate for various
fluids follow a similar pattern, with increasing flow rate. The flow rate increases, reaches an
optimum and then decreases. Out of the five fluids tested, water with high density has higher
flow rate in comparison to the other fluids.
SPM Frequency(Hz)
250 4.16
500 8.33
750 12.5
1000 16.66
1250 20.83
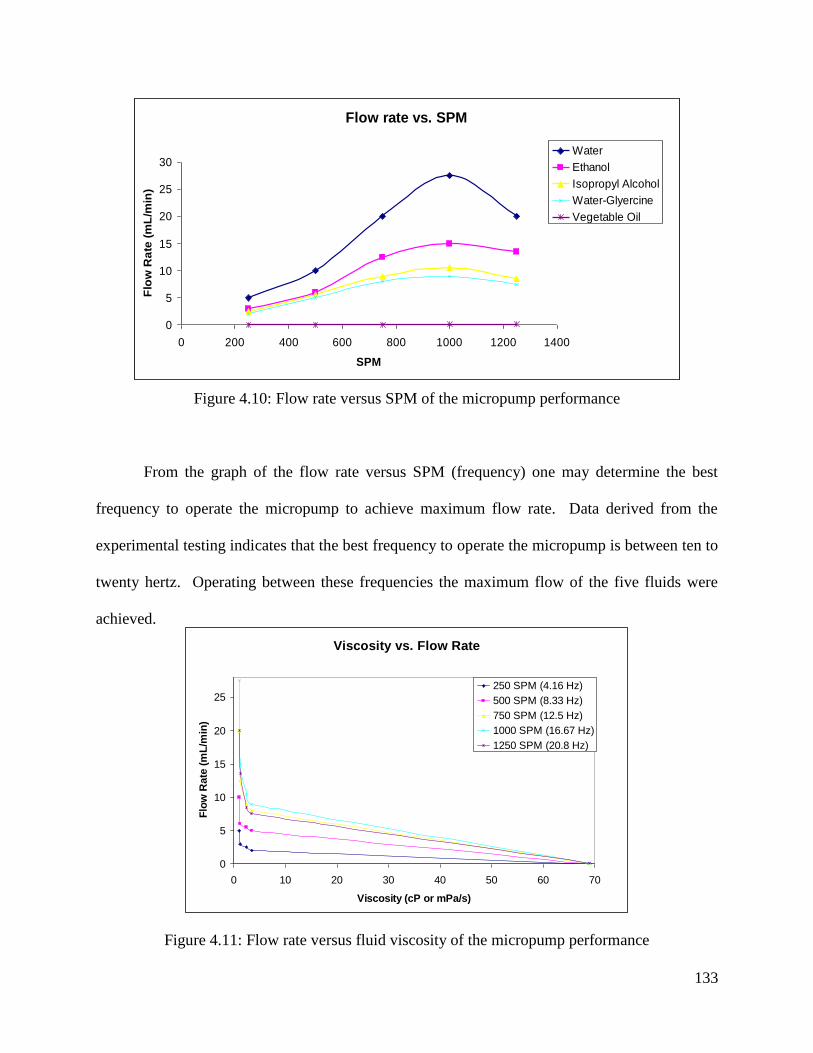
133
Viscosity vs. Flow Rate
0
5
10
15
20
25
0 10 20 30 40 50 60 70
Viscosity (cP or mPa/s)
Flo
w R
ate
(m
L/m
in)
250 SPM (4.16 Hz)
500 SPM (8.33 Hz)
750 SPM (12.5 Hz)
1000 SPM (16.67 Hz)
1250 SPM (20.8 Hz)
Figure 4.10: Flow rate versus SPM of the micropump performance
From the graph of the flow rate versus SPM (frequency) one may determine the best
frequency to operate the micropump to achieve maximum flow rate. Data derived from the
experimental testing indicates that the best frequency to operate the micropump is between ten to
twenty hertz. Operating between these frequencies the maximum flow of the five fluids were
achieved.
Figure 4.11: Flow rate versus fluid viscosity of the micropump performance
Flow rate vs. SPM
0
5
10
15
20
25
30
0 200 400 600 800 1000 1200 1400
SPM
Flo
w R
ate
(m
L/m
in)
Water
Ethanol
Isopropyl Alcohol
Water-Glyercine
Vegetable Oil
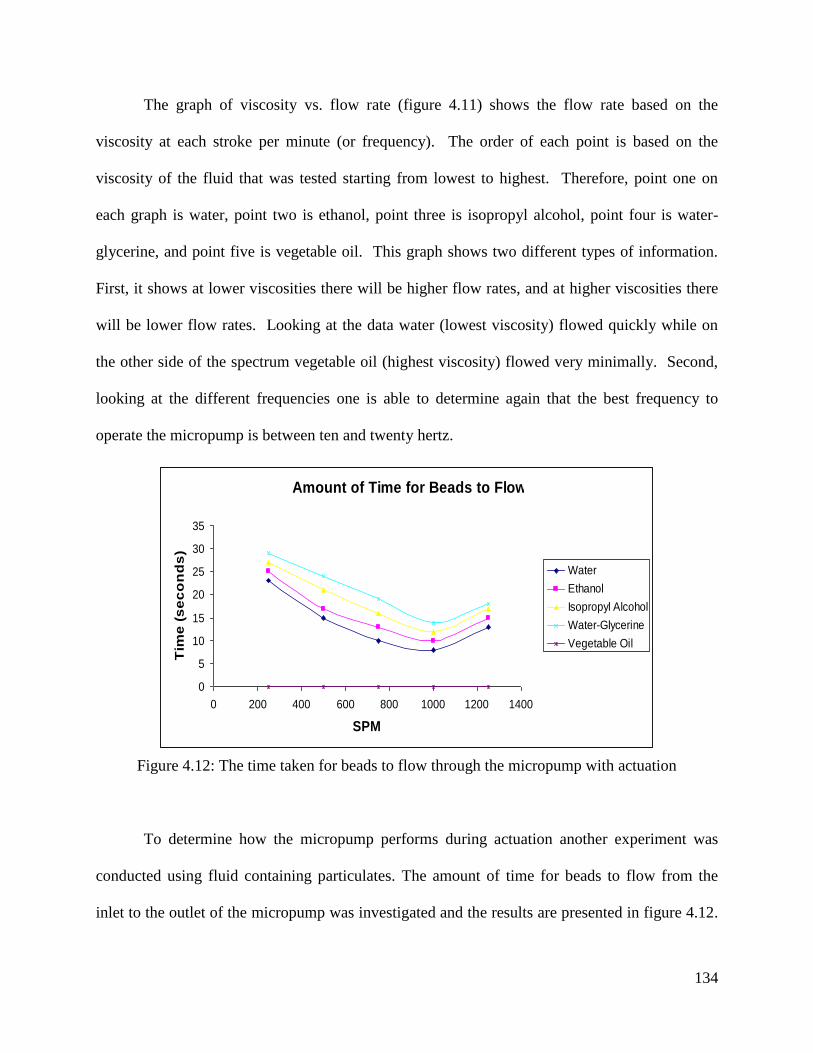
134
The graph of viscosity vs. flow rate (figure 4.11) shows the flow rate based on the
viscosity at each stroke per minute (or frequency). The order of each point is based on the
viscosity of the fluid that was tested starting from lowest to highest. Therefore, point one on
each graph is water, point two is ethanol, point three is isopropyl alcohol, point four is water-
glycerine, and point five is vegetable oil. This graph shows two different types of information.
First, it shows at lower viscosities there will be higher flow rates, and at higher viscosities there
will be lower flow rates. Looking at the data water (lowest viscosity) flowed quickly while on
the other side of the spectrum vegetable oil (highest viscosity) flowed very minimally. Second,
looking at the different frequencies one is able to determine again that the best frequency to
operate the micropump is between ten and twenty hertz.
Figure 4.12: The time taken for beads to flow through the micropump with actuation
To determine how the micropump performs during actuation another experiment was
conducted using fluid containing particulates. The amount of time for beads to flow from the
inlet to the outlet of the micropump was investigated and the results are presented in figure 4.12.
Amount of Time for Beads to Flow
0
5
10
15
20
25
30
35
0 200 400 600 800 1000 1200 1400
SPM
Tim
e (
se
co
nd
s)
Water
Ethanol
Isopropyl Alcohol
Water-Glycerine
Vegetable Oil
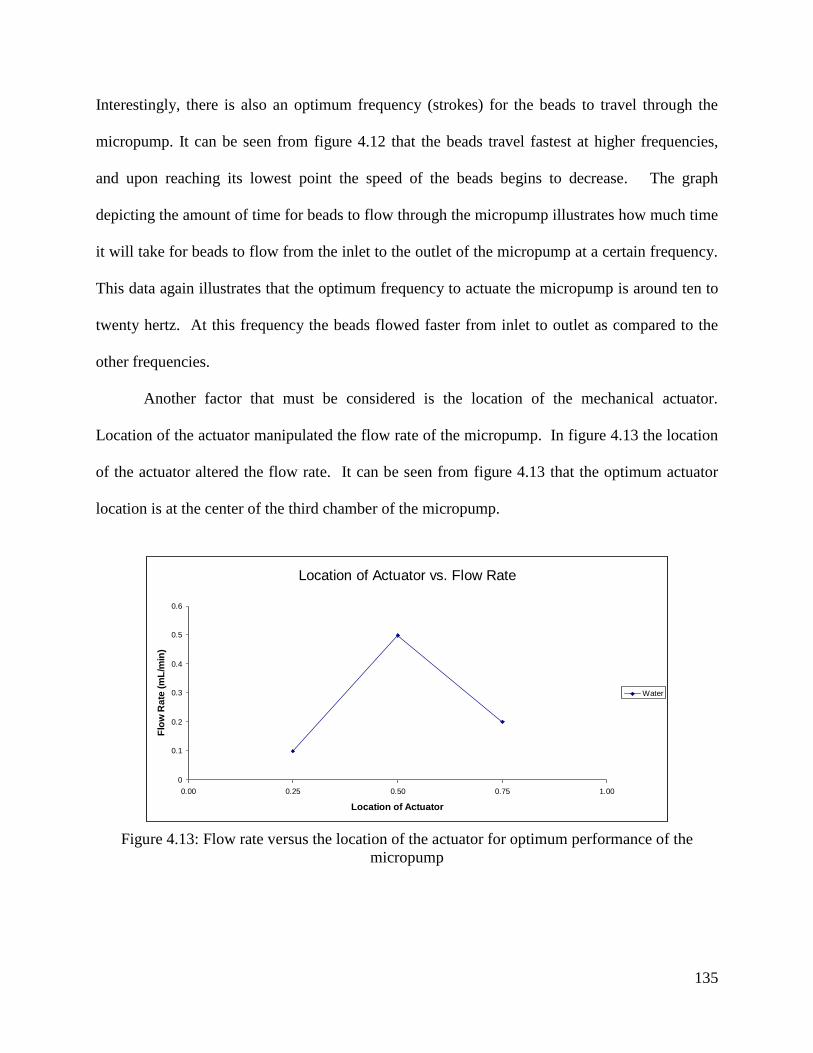
135
Location of Actuator vs. Flow Rate
0
0.1
0.2
0.3
0.4
0.5
0.6
0.00 0.25 0.50 0.75 1.00
Location of Actuator
Flo
w R
ate
(m
L/m
in)
Water
Interestingly, there is also an optimum frequency (strokes) for the beads to travel through the
micropump. It can be seen from figure 4.12 that the beads travel fastest at higher frequencies,
and upon reaching its lowest point the speed of the beads begins to decrease. The graph
depicting the amount of time for beads to flow through the micropump illustrates how much time
it will take for beads to flow from the inlet to the outlet of the micropump at a certain frequency.
This data again illustrates that the optimum frequency to actuate the micropump is around ten to
twenty hertz. At this frequency the beads flowed faster from inlet to outlet as compared to the
other frequencies.
Another factor that must be considered is the location of the mechanical actuator.
Location of the actuator manipulated the flow rate of the micropump. In figure 4.13 the location
of the actuator altered the flow rate. It can be seen from figure 4.13 that the optimum actuator
location is at the center of the third chamber of the micropump.
Figure 4.13: Flow rate versus the location of the actuator for optimum performance of the
micropump
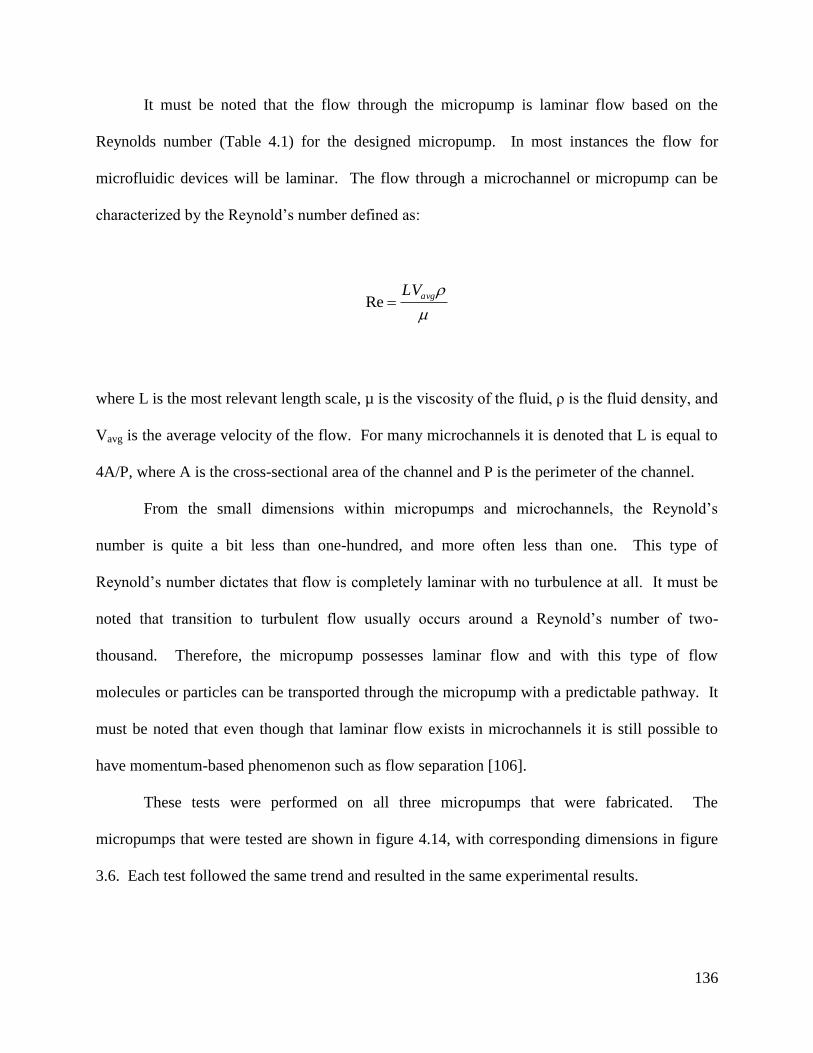
136
It must be noted that the flow through the micropump is laminar flow based on the
Reynolds number (Table 4.1) for the designed micropump. In most instances the flow for
microfluidic devices will be laminar. The flow through a microchannel or micropump can be
characterized by the Reynold’s number defined as:
where L is the most relevant length scale, µ is the viscosity of the fluid, ρ is the fluid density, and
Vavg is the average velocity of the flow. For many microchannels it is denoted that L is equal to
4A/P, where A is the cross-sectional area of the channel and P is the perimeter of the channel.
From the small dimensions within micropumps and microchannels, the Reynold’s
number is quite a bit less than one-hundred, and more often less than one. This type of
Reynold’s number dictates that flow is completely laminar with no turbulence at all. It must be
noted that transition to turbulent flow usually occurs around a Reynold’s number of two-
thousand. Therefore, the micropump possesses laminar flow and with this type of flow
molecules or particles can be transported through the micropump with a predictable pathway. It
must be noted that even though that laminar flow exists in microchannels it is still possible to
have momentum-based phenomenon such as flow separation [106].
These tests were performed on all three micropumps that were fabricated. The
micropumps that were tested are shown in figure 4.14, with corresponding dimensions in figure
3.6. Each test followed the same trend and resulted in the same experimental results.
avgLVRe
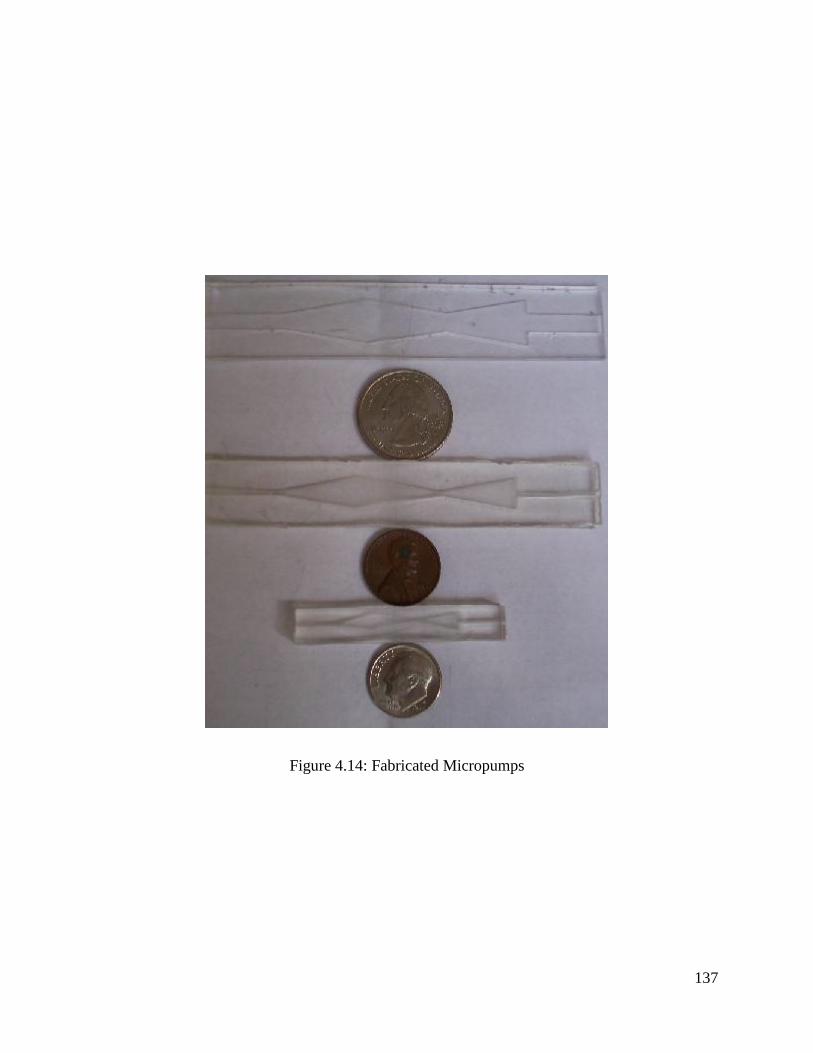
137
Figure 4.14: Fabricated Micropumps
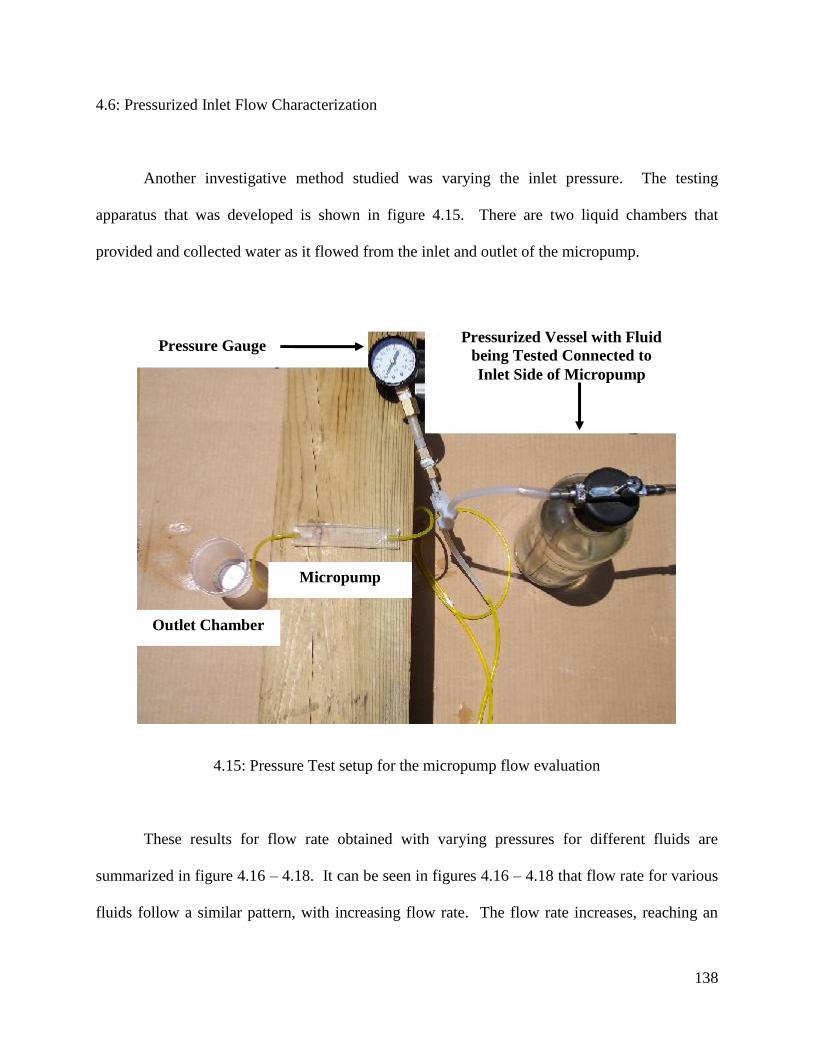
138
4.6: Pressurized Inlet Flow Characterization
Another investigative method studied was varying the inlet pressure. The testing
apparatus that was developed is shown in figure 4.15. There are two liquid chambers that
provided and collected water as it flowed from the inlet and outlet of the micropump.
4.15: Pressure Test setup for the micropump flow evaluation
These results for flow rate obtained with varying pressures for different fluids are
summarized in figure 4.16 – 4.18. It can be seen in figures 4.16 – 4.18 that flow rate for various
fluids follow a similar pattern, with increasing flow rate. The flow rate increases, reaching an
Pressure Gauge Pressurized Vessel with Fluid
being Tested Connected to
Inlet Side of Micropump
Micropump
Outlet Chamber
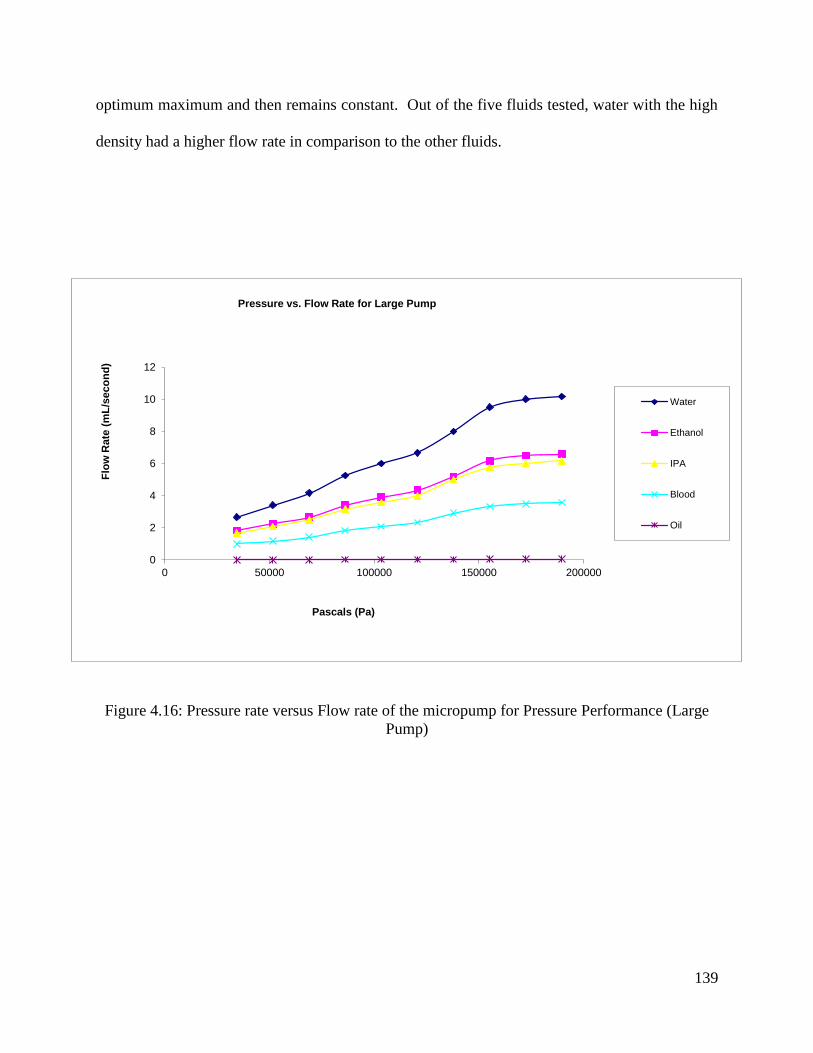
139
0
2
4
6
8
10
12
0 50000 100000 150000 200000
Flo
w R
ate
(m
L/s
eco
nd
)
Pascals (Pa)
Pressure vs. Flow Rate for Large Pump
Water
Ethanol
IPA
Blood
Oil
optimum maximum and then remains constant. Out of the five fluids tested, water with the high
density had a higher flow rate in comparison to the other fluids.
Figure 4.16: Pressure rate versus Flow rate of the micropump for Pressure Performance (Large
Pump)
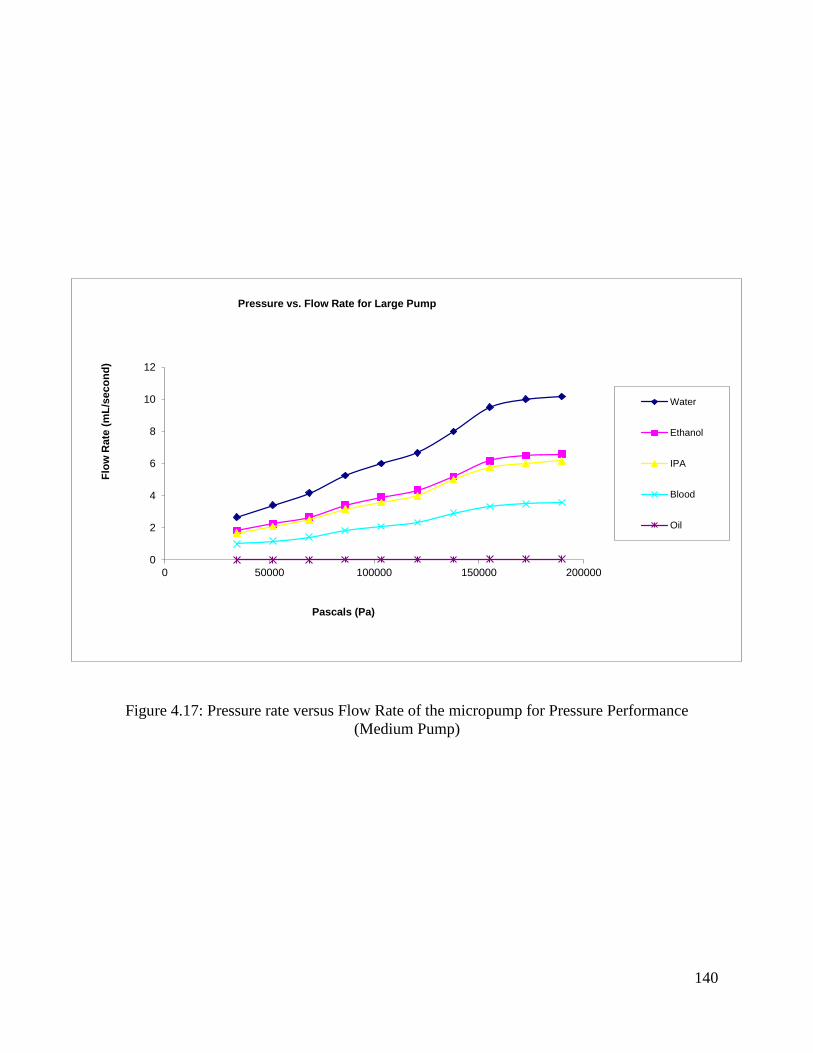
140
0
2
4
6
8
10
12
0 50000 100000 150000 200000
Flo
w R
ate
(m
L/s
eco
nd
)
Pascals (Pa)
Pressure vs. Flow Rate for Large Pump
Water
Ethanol
IPA
Blood
Oil
Figure 4.17: Pressure rate versus Flow Rate of the micropump for Pressure Performance
(Medium Pump)
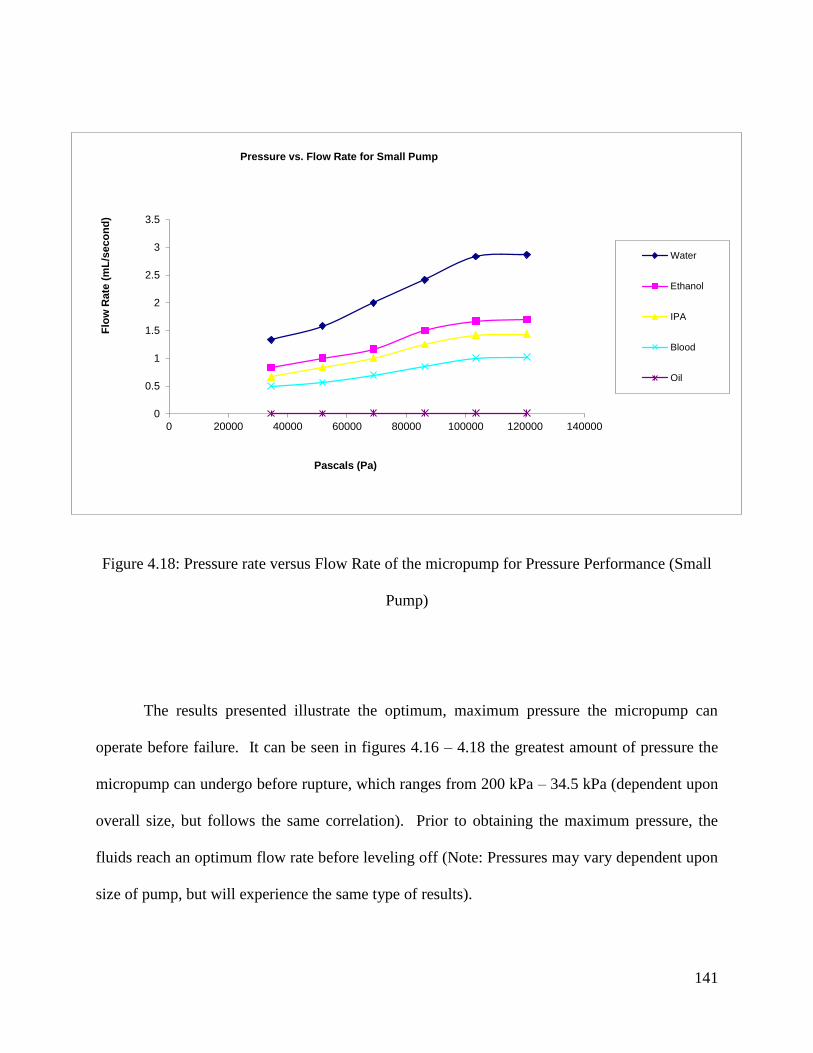
141
0
0.5
1
1.5
2
2.5
3
3.5
0 20000 40000 60000 80000 100000 120000 140000
Flo
w R
ate
(m
L/s
eco
nd
)
Pascals (Pa)
Pressure vs. Flow Rate for Small Pump
Water
Ethanol
IPA
Blood
Oil
Figure 4.18: Pressure rate versus Flow Rate of the micropump for Pressure Performance (Small
Pump)
The results presented illustrate the optimum, maximum pressure the micropump can
operate before failure. It can be seen in figures 4.16 – 4.18 the greatest amount of pressure the
micropump can undergo before rupture, which ranges from 200 kPa – 34.5 kPa (dependent upon
overall size, but follows the same correlation). Prior to obtaining the maximum pressure, the
fluids reach an optimum flow rate before leveling off (Note: Pressures may vary dependent upon
size of pump, but will experience the same type of results).
142
4.7: Statistical Results and Discussion
4.7.1 – Theoretical Testing to Compare to Experimental
4.7.1.1 – Micropump Design Concept
The design concept for the micropump consists of a three nozzle/diffuser element that is
actuated on top as previously discussed in this paper. The proposed valveless micropump design
configuration for transporting drug particles was based on the fabrication process of the
polydimethylsiloxane micropump device for fluidic applications by Cartin et. al. [59], with
further theoretical studies completed by Su and Pidaparti [58] dealing with top actuation. The
specified actuation in the micropump was achieved mainly by a pneumatic actuator. The overall
performance of the micropump is determined by specific actuation mechanism and the resulting
flow through the micropump. As opposed to existing valveless micropumps, the proposed
design provides a new way for transporting liquid drug delivery using three nozzle/diffuser
elements with actuating membranes.
4.7.1.2 – Computational Methods
To understand the characteristics of drug delivery through the proposed micropump
design three-dimensional flow characterization studies were conducted using combined
computational fluid dynamics (CFD) analysis based on Eulerian-Lagrangian methods. The first
step to begin this analysis was to create a three-dimensional model of the micropump with the
use of a modeling software (figure 4.19).
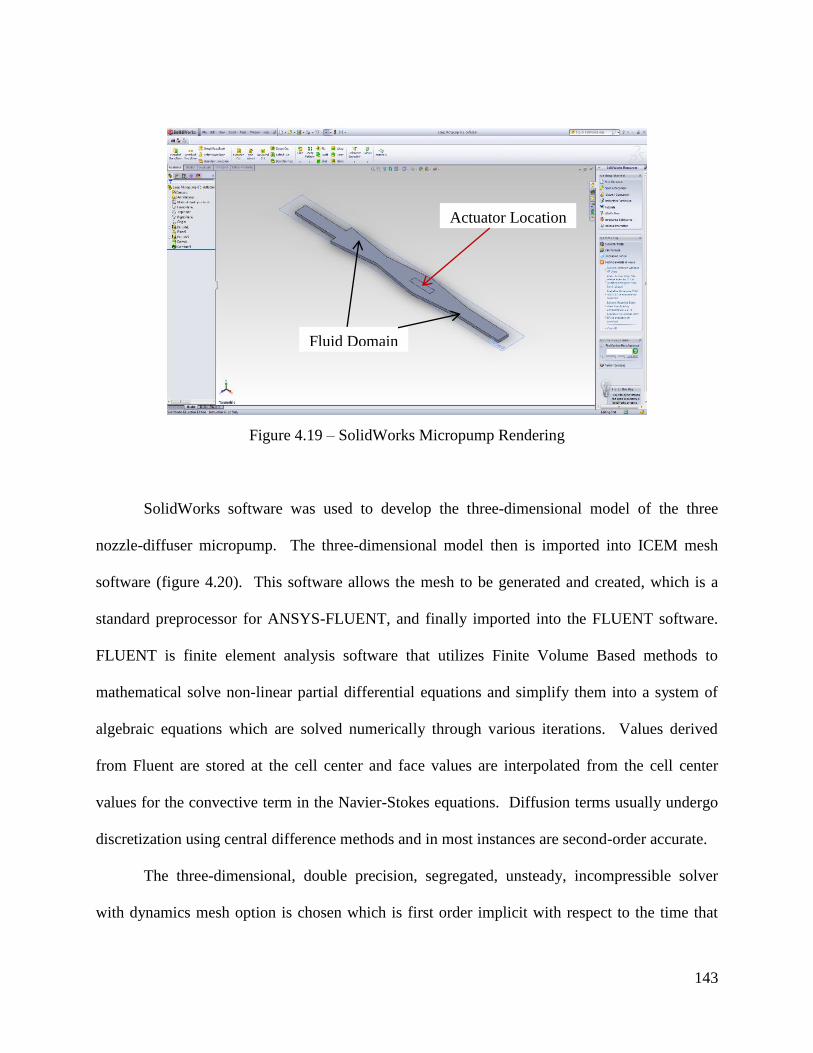
143
Actuator Location
Fluid Domain
Figure 4.19 – SolidWorks Micropump Rendering
SolidWorks software was used to develop the three-dimensional model of the three
nozzle-diffuser micropump. The three-dimensional model then is imported into ICEM mesh
software (figure 4.20). This software allows the mesh to be generated and created, which is a
standard preprocessor for ANSYS-FLUENT, and finally imported into the FLUENT software.
FLUENT is finite element analysis software that utilizes Finite Volume Based methods to
mathematical solve non-linear partial differential equations and simplify them into a system of
algebraic equations which are solved numerically through various iterations. Values derived
from Fluent are stored at the cell center and face values are interpolated from the cell center
values for the convective term in the Navier-Stokes equations. Diffusion terms usually undergo
discretization using central difference methods and in most instances are second-order accurate.
The three-dimensional, double precision, segregated, unsteady, incompressible solver
with dynamics mesh option is chosen which is first order implicit with respect to the time that
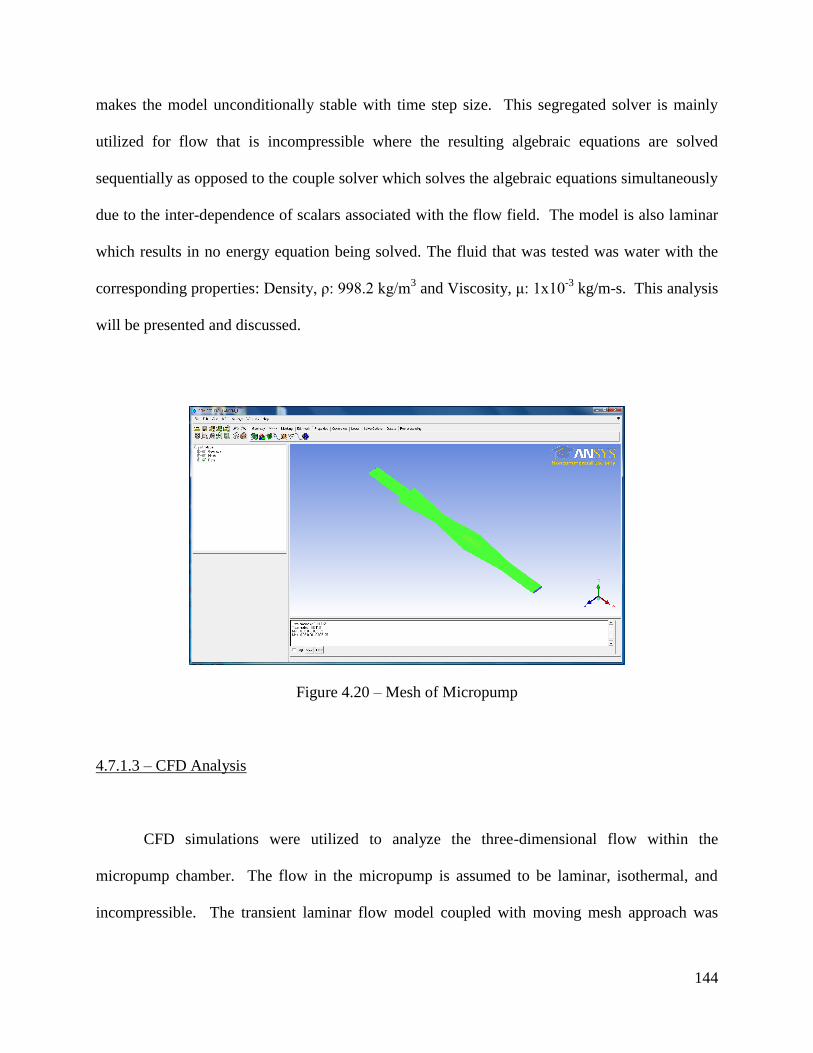
144
makes the model unconditionally stable with time step size. This segregated solver is mainly
utilized for flow that is incompressible where the resulting algebraic equations are solved
sequentially as opposed to the couple solver which solves the algebraic equations simultaneously
due to the inter-dependence of scalars associated with the flow field. The model is also laminar
which results in no energy equation being solved. The fluid that was tested was water with the
corresponding properties: Density, ρ: 998.2 kg/m3 and Viscosity, μ: 1x10
-3 kg/m-s. This analysis
will be presented and discussed.
Figure 4.20 – Mesh of Micropump
4.7.1.3 – CFD Analysis
CFD simulations were utilized to analyze the three-dimensional flow within the
micropump chamber. The flow in the micropump is assumed to be laminar, isothermal, and
incompressible. The transient laminar flow model coupled with moving mesh approach was
145
employed to simulate the flow field in the micropump with moving boundaries actuated
mechanically. The governing equations for the three-dimensional laminar flow are described by
the conservation and momentum equations which are expressed as:
where
V is the velocity vector, P is the pressure, ρ is the fluid density, B is the body force, and µ
is the dynamic viscosity. Assuming that the fluid density is homogeneous coupled with
incompressible flow, the mass conservation, equation (1), becomes the divergence of the flow
velocity vector. Conversely, when the flow field varies transiently with the moving membrane,
the momentum equation (2) must include the transient velocity vector to acquire the unsteady
physics. Since fluid flows within the closed boundaries of the micropump, body forces due to
gravity do not influence the motion of the fluid. Therefore, the gravitational effects on the
continuous phase are neglected in equation (2). To achieve the flow field characteristics the
aforementioned equations were solved numerically on a fluid domain with a moving membrane
actuator.
The simulations were completed with the use of computational fluid dynamics software
called FLUENT (ANSYS/FLUENT, Inc.). The SIMPLE algorithm was used to solve the
pressure-velocity coupling. This procedure is repeated at every time step until a converged
solution for instantaneous flow is obtained.
)2(
)1(0
2 equationVBPDt
VD
equationVt
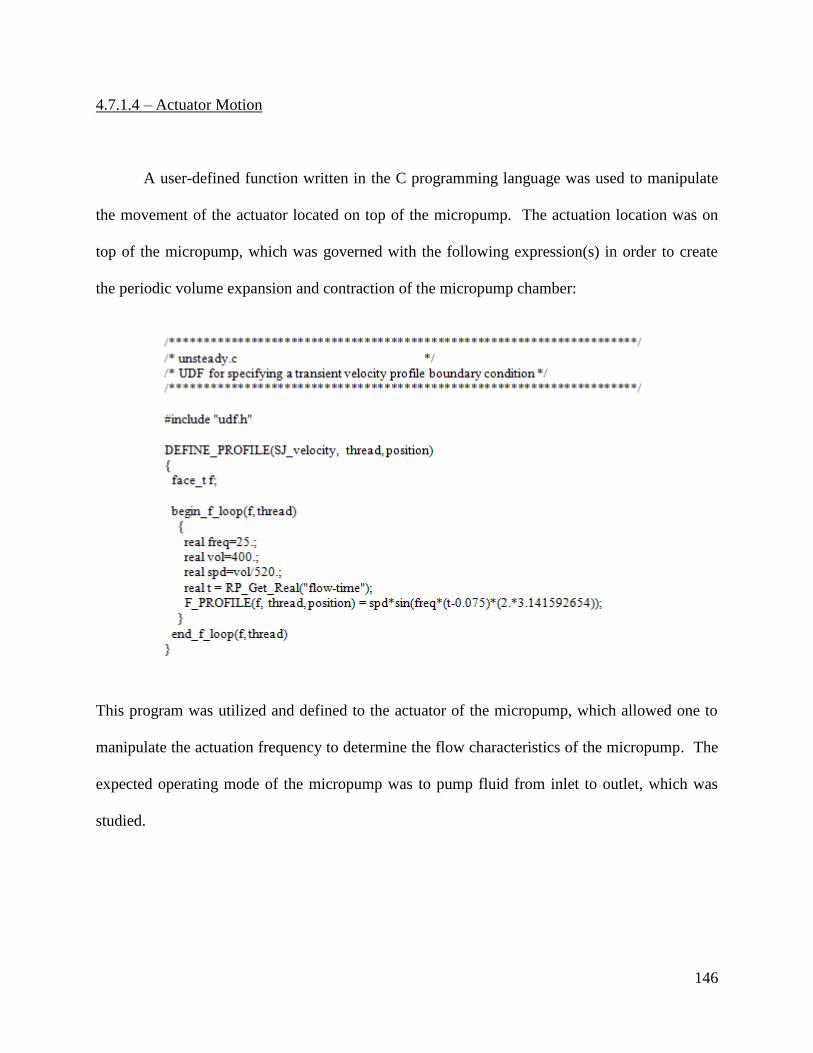
146
4.7.1.4 – Actuator Motion
A user-defined function written in the C programming language was used to manipulate
the movement of the actuator located on top of the micropump. The actuation location was on
top of the micropump, which was governed with the following expression(s) in order to create
the periodic volume expansion and contraction of the micropump chamber:
This program was utilized and defined to the actuator of the micropump, which allowed one to
manipulate the actuation frequency to determine the flow characteristics of the micropump. The
expected operating mode of the micropump was to pump fluid from inlet to outlet, which was
studied.

147
4.7.1.5 – Fluent Theoretical Results of Micropump
Conclusive results obtained for the micropump configuration consisting of a three
nozzle/diffuser element were calculated with the use of ANSYS Fluent Analysis (figures 4.21 –
4.28). These results are listed below and will be discussed.
Figure 4.21: Micropump Actuated at 4.167 Hz
Figure 4.22: Micropump actuated at 8.33 Hertz (Hz)
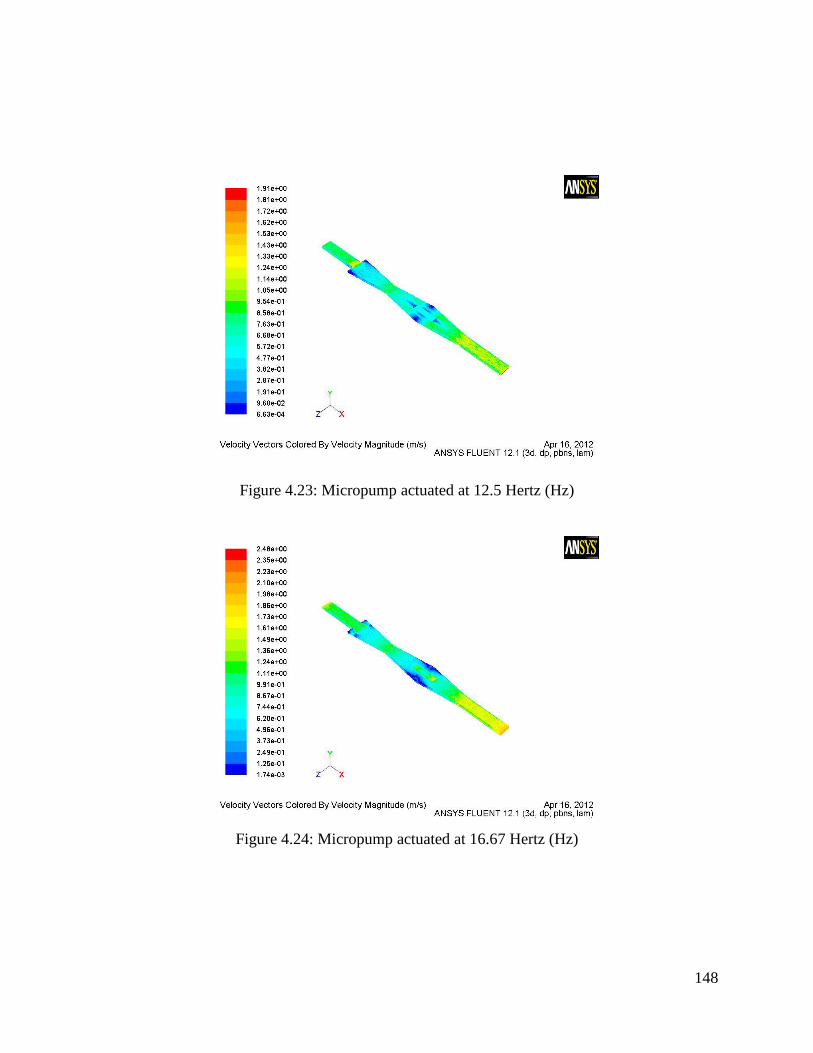
148
Figure 4.23: Micropump actuated at 12.5 Hertz (Hz)
Figure 4.24: Micropump actuated at 16.67 Hertz (Hz)

149
0.00E+00
2.00E-06
4.00E-06
6.00E-06
8.00E-06
1.00E-05
1.20E-05
0 5 10 15 20 25
Vo
lum
etr
ic F
low
Rat
e (
m^3
/s)
Frequency (Hz)
Volumetric Flow Rate vs. Frequency
Figure 4.25: Micropump actuated at 20.83 Hertz (Hz)
Figure 4.26 – Volumetric Flow Rate vs. Frequency
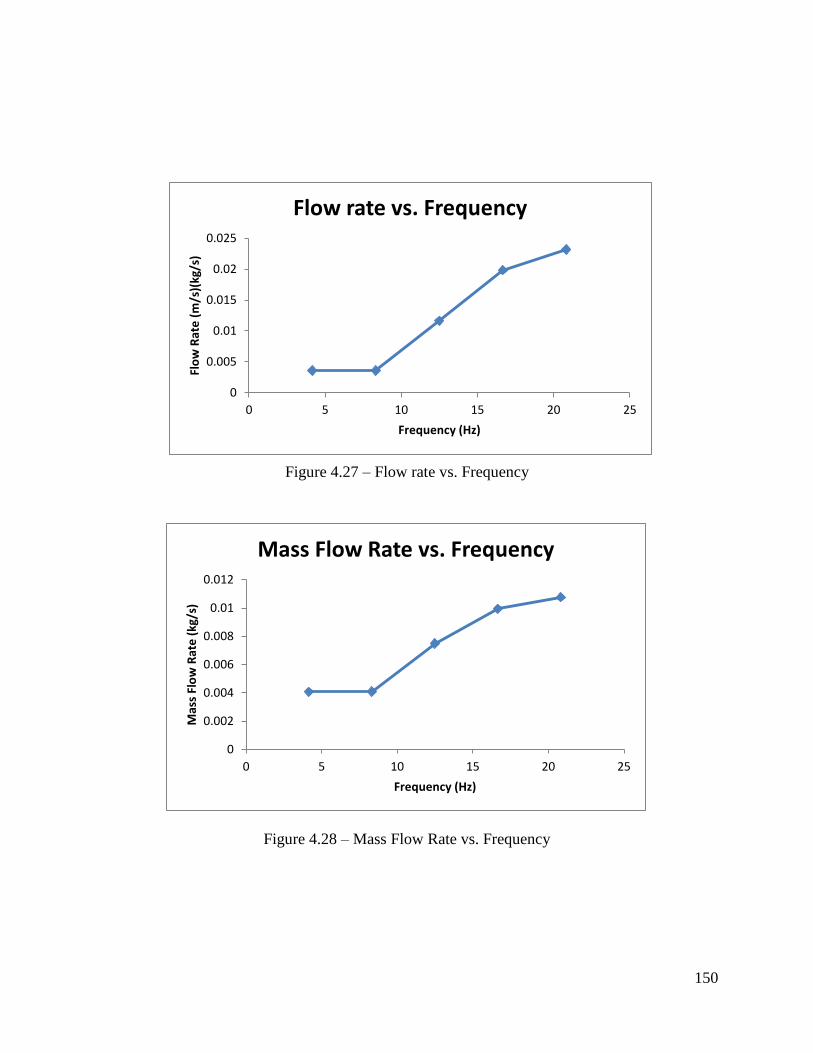
150
Figure 4.27 – Flow rate vs. Frequency
Figure 4.28 – Mass Flow Rate vs. Frequency
0
0.005
0.01
0.015
0.02
0.025
0 5 10 15 20 25
Flo
w R
ate
(m
/s)(
kg/s
)
Frequency (Hz)
Flow rate vs. Frequency
0
0.002
0.004
0.006
0.008
0.01
0.012
0 5 10 15 20 25
Mas
s Fl
ow
Rat
e (
kg/s
)
Frequency (Hz)
Mass Flow Rate vs. Frequency

151
From figure 4.26 – 4.28 it can be seen that there is a relationship between the actuation
frequency of the actuator located on top of the micropump and the flow rate through the
micropump. The results from FLUENT illustrate proportionality between the flow rate and the
actuation frequency of the micropump. These graphs depict as actuation frequency increases the
flow rate through the micropump increases. The results shown in figure 4.26 – 4.28 illustrate
that the novel actuation proposed and tested for the valveless micropump is a suitable candidate
for fluid delivery applications.
Figure 4.29 – Frequency vs. Flow Rate comparison of Theoretical and Experimental
From figure 4.29 comparison of the theoretical values and experimental values of the
smallest pump tested one can see that the flow rates tend to increase with actuation frequency.
Also it must be noted the flow rates experimentally tested were slight higher than the theoretical
values obtained. It appears from both sets of results that micropump will continue to perform
effectively and efficiently as frequency is increased.
0
0.00001
0.00002
0.00003
0.00004
0.00005
0.00006
1 10 100
Flo
w r
ate
(kg/
s)
Frequency (Hz)
Frequency vs. Flow Rate (kg/s)
Water
Ethanol
Alcohol
Glycerol
Theoretical
152
In conclusion a systematic study to compare the theoretical and experimental results has
been completed. The results obtained demonstrate the feasibility of the valveless micropump to
deliver fluids for possible drug delivery applications. For fluid transport it is apparent that the
mass flow rate of the liquid pumped by the micropump is proportional to the actuation
frequency. Therefore, when frequency continues to increase so will the fluid flow seen
theoretical and experimentally.
4.7.2 – Statistical Comparison of Previous Study
The experimental results that were developed with top actuation from the reciprocating
motor can be compared to theoretical results that are presented in the paper written by Su and
Pidaparti [58]. Their paper takes dimensions, fabrication, and testing procedures presented in
Cartin and Pidaparti [59]. Su compared the relationship between the top actuation frequency of
the micropump and the net mass flow rate. These results were presented and compared with
experimental data collected from the reciprocating motor testing. Figure 4.30 illustrates the
statistical data between the theoretical results and experimental results in an exponential curve
relationship.
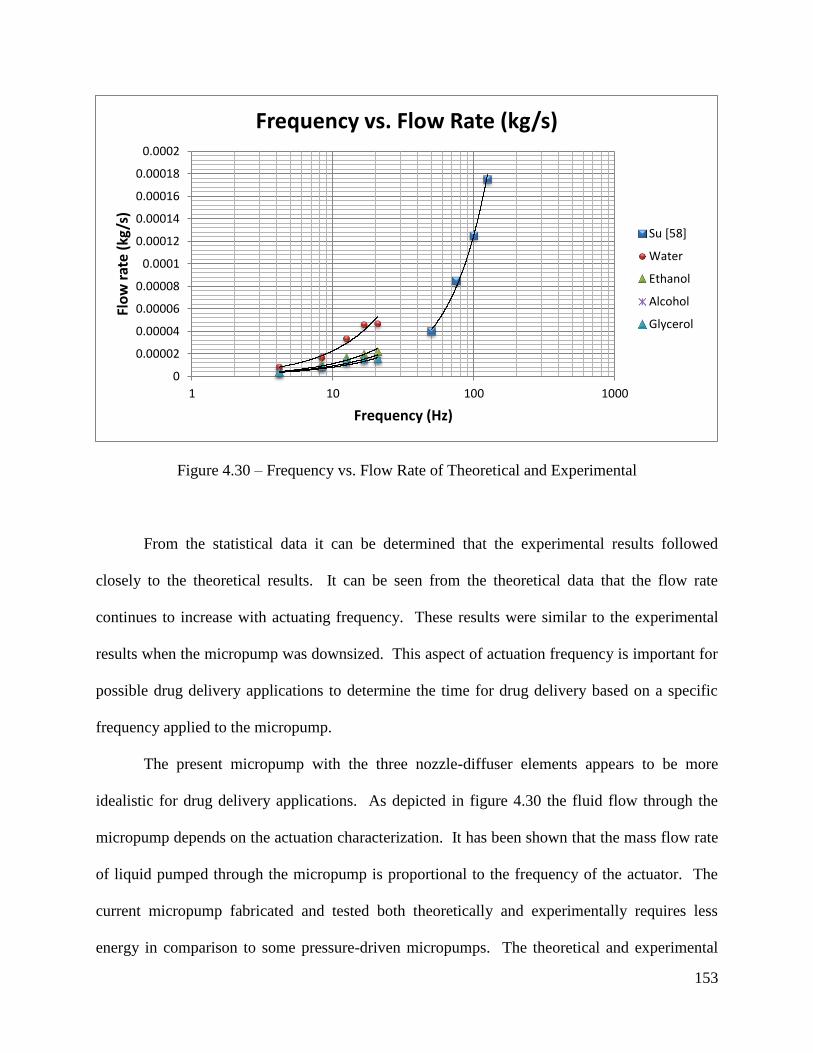
153
Figure 4.30 – Frequency vs. Flow Rate of Theoretical and Experimental
From the statistical data it can be determined that the experimental results followed
closely to the theoretical results. It can be seen from the theoretical data that the flow rate
continues to increase with actuating frequency. These results were similar to the experimental
results when the micropump was downsized. This aspect of actuation frequency is important for
possible drug delivery applications to determine the time for drug delivery based on a specific
frequency applied to the micropump.
The present micropump with the three nozzle-diffuser elements appears to be more
idealistic for drug delivery applications. As depicted in figure 4.30 the fluid flow through the
micropump depends on the actuation characterization. It has been shown that the mass flow rate
of liquid pumped through the micropump is proportional to the frequency of the actuator. The
current micropump fabricated and tested both theoretically and experimentally requires less
energy in comparison to some pressure-driven micropumps. The theoretical and experimental
0
0.00002
0.00004
0.00006
0.00008
0.0001
0.00012
0.00014
0.00016
0.00018
0.0002
1 10 100 1000
Flo
w r
ate
(kg/
s)
Frequency (Hz)
Frequency vs. Flow Rate (kg/s)
Su [58]
Water
Ethanol
Alcohol
Glycerol
154
analysis has presented similar results, thus resulting in a final fabricated product that can be
replicated.
4.8: Results and Discussion
Results of flow rates obtained with varying actuator strokes (frequencies) for different
fluids are summarized in figure 4.10. Figure 4.10 also shows that flow rate for various fluids
follow a similar pattern. As the flow rates of the various tested fluids increased an optimum
maximum flow rate was determined within a particular frequency range. Once this range was
established and surpassed, flow rates began to drop.
Based on results obtained from the Flow vs. Frequency, Viscosity vs. Flow Rate, and
Amount of time for beads to flow from the inlet to the outlet of the micropump one was able to
determine the optimum frequency at which to operate the micropump to achieve the maximum
flow rate. It can be seen in figure 4.10 that the flow rate versus the frequency is able to
determine the best frequency to operate the micropump to maximize the flow rate. The
micropump best operated between the ranges of 750 and 1250 SPM resulting in the maximum
flow of the five fluids.
The results of flow rate versus fluid viscosity for the five different fluids are shown in
figure 4.11, which indicates the flow rate based on the viscosity at each stroke per minute (or
frequency). From Fig 4.11 it can be seen that the lower viscosity fluid results in lower flow rate
and vice versa. It is also observed that water having low viscosity flowed quicker, in comparison
to vegetable oil which has higher viscosity and flowed less.
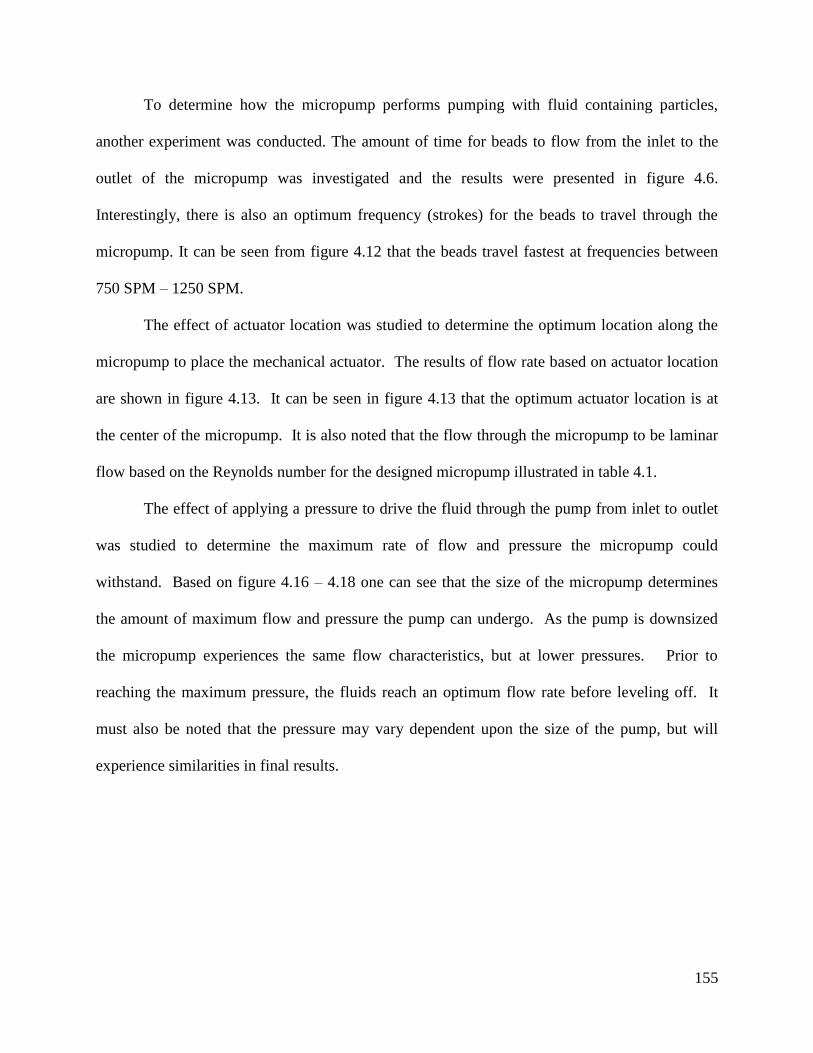
155
To determine how the micropump performs pumping with fluid containing particles,
another experiment was conducted. The amount of time for beads to flow from the inlet to the
outlet of the micropump was investigated and the results were presented in figure 4.6.
Interestingly, there is also an optimum frequency (strokes) for the beads to travel through the
micropump. It can be seen from figure 4.12 that the beads travel fastest at frequencies between
750 SPM – 1250 SPM.
The effect of actuator location was studied to determine the optimum location along the
micropump to place the mechanical actuator. The results of flow rate based on actuator location
are shown in figure 4.13. It can be seen in figure 4.13 that the optimum actuator location is at
the center of the micropump. It is also noted that the flow through the micropump to be laminar
flow based on the Reynolds number for the designed micropump illustrated in table 4.1.
The effect of applying a pressure to drive the fluid through the pump from inlet to outlet
was studied to determine the maximum rate of flow and pressure the micropump could
withstand. Based on figure 4.16 – 4.18 one can see that the size of the micropump determines
the amount of maximum flow and pressure the pump can undergo. As the pump is downsized
the micropump experiences the same flow characteristics, but at lower pressures. Prior to
reaching the maximum pressure, the fluids reach an optimum flow rate before leveling off. It
must also be noted that the pressure may vary dependent upon the size of the pump, but will
experience similarities in final results.
156
4.9: Conclusions
In this study, the performance of a micropump consisting of three nozzle/diffuser
elements designed and fabricated from PDMS material and actuated on top by a reciprocal motor
and pressurization was evaluated. The performance characteristics of flow rate obtained from
testing demonstrated the efficiency of the micropump. The results obtained illustrate the
relationship between actuation frequency and fluid flow through the micropump. Final results
indicate the flow rate increases with actuation frequency, reaches an optimum and then decreases
after that. Based on the performance studies conducted, the designed micropump performs
reasonably well.

157
CHAPTER 5 Conclusions and Recommendations
5.1: Conclusions
The theoretical research utilizing ANSYS software proved that the three-wall micropump
(nozzle/diffuser/nozzle) would outperform other micropumps consisting of only one-wall
(nozzle) or two-wall configurations (nozzle/diffuser). Each test conducted and analyzed with the
use of ANSYS confirmed that the experimental micropump developed both in the VMC
microfabrication lab and the SolidWords/Rapid-Prototyping labs performed similar to the
projected theoretical experiments. It must also be noted that top actuation and piezoelectric
actuation was theoretically studied and proven to be effective in solid and fluid interaction,
allowing one to determine the optimum frequency to actuate the micropump.
Overall research for fabricating the micropump was successful on two levels. The first
level utilized the microfabrication techniques that focused on a method for coating SU-8
photoresist to develop the pump. Secondly, the use of SolidWorks and Rapid prototyping
allowed for development of the micropump in half the time. Investigation of these two
fabrication techniques allowed one to select the best fabrication process to reduce production
time and cost to potential consumers.
Several positive outcomes can be concluded from the overall research. First, PDMS
molding and PDMS sealing methods are used to reduce the process time for production, thus
reducing the cost for mass production possibilities. Second, the fabrication methods are easy to
manipulate and control in order to change dimensions based on overall design considerations.

158
Third, the transportation of the fluids throughout the micropump is laminar with optimum flow
rates which allow for a higher accuracy of fluid flow.
5.1.1 – Design Concept
The design concept was originally developed as a four wall micropump, but from
analysis was changed to a three wall micropump. The pump would be actuated on the top and
sides of the micropump. Pump actuation on the top was hypothesized to be done with a pressure
applied to the top surface of the micropump. Designs were simulated and tested with ANSYS
and proved to be theoretically possible.
5.1.2 – Fabrication Methods
Two fabrication methods were investigated: VMC cleanroom fabrication and Rapid-
prototyping. The VMC cleanroom fabrication proved to be quite difficult and time consuming.
A great amount of time was placed in development of the design and processing the fabrication
procedure through cleanroom procedures. The procedures and protocols in the cleanroom
proved to be possible, but with difficulties. Difficulties revolved around learning how to use
equipment, equipment down time, and processing failures. Other issues that occurred were
determining the best photoresist to use for fabrication, the overall lithography process, exact
development times of the PDMS mold, and removal procedures. All of the cleanroom
fabrication methods were utilized to produce several pump designs already discussed in this
paper. These processes did require much time and several months of preparation. As with any
159
fabrication and process development there will be many failures. Many of the fabrication
methods led to failures in the end, but yielded ideas on how to improve the micropump
fabrication methods resulting in a more desirable and reliable device. Even though many
drawbacks and failures did exist, these failures allowed revisions to be implemented in the
process resulting in a final product.
Rapid-prototyping methods proved to lessen the amount of time to create the micropump,
but still resulted in a time consuming procedure. A SolidWorks file had to be designed and
uploaded into the SLA rapid-prototyper. The prototyping procedure could take anywhere from
two hours to six hours depending on the resolution and tolerances required for the micropump.
After the prototype is accomplished PDMS was poured and cured for approximately a couple of
days. Even though this procedure required less lab facilities, time for part production still took
the same amount of time.
5.1.3 – PDMS Mixing, Curing, and Degassing
PDMS was a two part mixing process that took a considerable amount of time to
determine the best mixing and curing process. At the beginning of the PDMS mixing process
several defects occurred such as air-bubbles, micropump weakness, cracking, and micropump
sagging. Due to these issues the introduction of a vacuum chamber and microparticles was
incorporated. The vacuum chamber was utilized to remove air bubbles from the mixture and the
microparticles were integrated to provide more strength to the PDMS polymer. These changes
helped reduce defects and molding problems, but in some instances during the baking procedure
defects at times still occurred such as bubbling due to excess heat. It should be noted that the
160
mixing process must be done precisely with an electronic mass scale to make sure the ratio is
10:1. The use of an electronic scale allowed for one to precisely add the microparticles in
percentages of 10, 20, etc. Depending on how one desires the PDMS to be, rigid or flexible, the
mix ratio and microparticles can be altered to produce results that are desirable to one’s
experiment. Curing the PDMS resulted in bubbling or overbaking of the PDMS. After several
test runs with curing the PDMS, the best results were obtained by baking it a lower temperatures
then allowing it to cure an additional twenty-four to forty-eight hours at room temperature. This
method produced the best results after numerous times of experimentation with curing the PDMS
micropumps. It was also observed that simply allowing the PDMS to cure at room temperature
for several days (approximately three) produced extraordinary results. Dependent upon time
constraints and desired results the best theory is to produce quality over quantity. Therefore,
allowing the PDMS to sit several days would yield better micropumps free of defects. Thus,
several micropump molds were developed to allow for several to be made simultaneously.
5.1.4 – PDMS Sealing
Sealing of PDMS to a substrate took a substantial amount of time to determine and yield
a sealed pump. This type of sealing has not been tested or investigated that much prior to the
fabrication of the PDMS Micropump. To determine the sealing recipe, several steps were taken
using the oxygen-plasma machine to develop the best procedure necessary to seal the PDMS to a
substrate. The process pressure that final gave adequate sealing results was approximately 600
mTorr. At this pressure sealing of the PDMS was capable and satisfactory.
161
Other issues that revolved around the sealing process were the cleaning of the PDMS and
substrate in order to provide a clean surface for proper adhesion. The cleaning procedure was
investigated and two procedures were developed in order to provide proper adhesion. These two
methods were a Piranha etch and a Methanol/Acetone/Isopropyl Alcohol/DI Water dipping.
Each of these methods was tested numerous times to determine the amount of time and how long
the PDMS and the substrate had to undergo cleaning to acquire good adhesion characteristics. It
must be noted that the above methods for cleaning may cause negative characteristic changes to
the PDMS. PDMS when introduced to chemicals, such as Methanol and Acetone results in
undesirable outcomes. The negative side effects that occur when PDMS is introduced to these
chemicals are expansion/swelling, tackiness (stickiness), deformations, and overall destruction of
the device. This was observed a few times prior to finally determining some of these methods
were not the best. In the end the best method was to clean the PDMS was with slight IPA and DI
water rinse.
5.1.5 – Electrostatic Actuation
The fabrication method for the electrostatic pump was quite extensive and novel. The
fabrication technique utilized a commonly used polymer, polydimethylsiloxane (PDMS). The
pump was constructed from a molded PDMS wafer process, coupled with metal electrodes.
After the pump was finished and connections in place it was then sealed to a glass substrate with
corresponding metal connections. Sealing of the two structures utilized a unique oxygen plasma
treatment between the PDMS and glass wafer structure. A complete electrostatic fabrication
wafer was shown in figure 4.1.
162
The PDMS micropump was developed in the microelectronics lab and required a large
amount of time from start to finish. Once the pump was completed, it under went metallization
with the use of a shadow mask as previously discussed. As metallization of the electrodes
occurred on the PDMS substrate the appearance of the connections appeared sufficient until
testing. It was observed the metal connections would break down over time. Further
observations during precise testing indicated that the voltage continuity on the electrical
connections would break down preventing current flow. Breaking of the electrical connections
was also observed based upon the flexibility of the PDMS. These issues led to minimal to non-
visible actuation of the micropump resulting in no positive experimental results.
5.1.6 – Piezoelectric Actuation
Actuation with the use of piezoelectric has been investigated. A total of three
piezoelectric materials have been focused upon, PZT, PVDF, and MFC. The first two, PZT and
PVDF, piezoelectric materials provided no considerable movement of fluid through the
micropump that was tested. The piezoelectric materials were tested with an oscilloscope to
determine if they were functioning properly. Each was functional and had deflections that were
in the nano-scale. These piezoelectric materials could be utilized in future work if the
micropump is downsized to smaller scales and dimensions. If nanoscale micropumps are sought
in the future, then these materials may provide useful characteristics.
MFC the last piezoelectric tested provided some movement of the micropump top wall,
but with virtually no fluid movement. This piezoelectric material needs to be investigated
further to determine if it will eventually provide fluid flow through the micropump. This is a
163
relatively new material and appears to be a very flexible, moveable piezoelectric that would
complement the PDMS material.
5.1.7 – Magnetic Actuation
Magnetic actuation of the micropump was considered during fabrication and testing.
Incorporation of Fe2B magnetic particles was accomplished and completed for the PDMS
micropump as previously discussed. After the magnetic PDMS micropump was sealed to PDMS
and/or glass the application of a permanent magnetic did not provide a deflection or fluid
transportation through the micropump. Possible reasons for no deflection can be a host of issues
dealing with magnetics, which could lead to a new research topic.
Some of the problems with magnetic actuation for this research for actuating the
micropump can be due to the particles used and the magnet or magnetic force applied. As
previously discussed the incorporation of magnetic particles in the PDMS mixture was
performed. The issue most likely involving the incorporation was applying a magnetic field
during the curing process. Applying a magnetic field would allow the magnetic particles to align
themselves within the PDMS mixture. This was attempted with a permanent magnet, but did not
lead to consistent results.
Recall that the magnetic force is related to magnetic permeability (µ), H-field (magnetic
field), the gradient, and the magnetization (M). Determining the field gradient is not a short term
process. Characterization of the magnetic field just to determine a plausible actuation method
for this PDMS micropump structure would be not only time consuming, but would lead to a new
research method for micropump actuation. If this actuation method is studied and executed in

164
the future the incorporation of an electromagnet would be ideal. An electromagnet consists of an
electric current that can be utilized for making temporary magnets. Electromagnets work on the
magnetic effect associated with current flow. It has been studied that a soft iron core (rod) can
be situated within a solenoid (wound wire), resulting in a strong magnetic field due to the iron
core being magnetized by induction. Combination of the iron core and solenoid is considered an
electromagnet.
Electromagnets act as a magnet only when current is flowing through the solenoid. Once
the current is turned off, the solenoid becomes demagnetized. The core of the electromagnet
must be soft iron (in most instances) because soft iron tends to lose all of its magnetization
characteristics once the coil is turned off. This design consisting of iron cores and solenoids can
allow electromagnets to consist of various shapes and sizes for different applications. The main
factors affecting the strength of an electromagnet is directly proportional to the number of turns
in the coil (solenoid), directly proportional to the current flow, and inversely proportional to the
length of air gap between the poles. In conclusion, an electromagnet would be more ideal than a
permanent magnetic due to the fact that it can produce very strong magnetic fields and its
strength can be manipulated by varying the number of turns in the coil or by simply changing the
current flow through the coil.
5.1.8 – Mechanical Actuation
This method of actuating the micropump resulted in much time in figuring out how to
provide top actuation. A reciprocating mechanical motor was acquired in order to provide the
top actuation method for the micropump. This method allowed the micropump to be tested.
165
Testing allowed one to determine the best frequency to acquire the maximum flow rate. From
the three graphs that were developed one is able to determine several characteristics.
Three conclusions can be formed from the data acquired through mechanical testing. The
first conclusion from the graph of flow rate versus frequency is that as frequency increases the
flow rate for a fluid will increase up to a point where the optimum flow rate and frequency
occurs. After the optimum flow rate and frequency is achieved, one can see that as frequency
continues to increase flow rate beings to drop back down. This date allows one to determine that
optimum frequency to operate the micropump to achieve the maximum flow rate.
From the graph of viscosity versus flow rate, one can come to the second conclusion that
proves the basic theory of viscosity. As viscosity decreases the flow rate increases and as
viscosity increases the flow rate decreases. This is seen through the testing of the five fluids that
were investigated within the micropump.
The last graph depicting the amount of time for beads to flow from inlet to outlet
provides one with conclusion three. From this graph it can be shown that as frequency increases
the amount of time for beads to flow from the inlet to the outlet of the pump will decrease. This
means that as frequency increases the time for the beads to travel the overall micropump will be
quicker. Eventually an optimum frequency will give the fastest time that is required for particle
travel. Once this optimum frequency is passed and continues to increase the time for particle
travel will increase as well. This means that once we surpass the optimum value the time for
particle travel will go from a fast regime to a slower regime.
166
5.1.9 – Pressure Actuation
The results presented illustrate the optimum, maximum pressure the micropump can
operate before failure. As previously discussed in the previous chapter the greatest amount of
pressure the micropump can undergo before rupture, which ranges from 200 kPa – 34.5 kPa
(dependent upon overall size, but follows the same correlation). Prior to obtaining the maximum
pressure, the fluids reach an optimum flow rate before leveling off (Note: Pressures may vary
dependent upon size of pump, but will experience the same type of results). The results obtained
from this experimental test resulted in flaws in the sealing and PDMS curing. It was observed
that the sealing of the PDMS may be irreversible, but not permanent when environment and
pressure is altered. As it was observed the pressure increase resulted in rupture of the seal or
PDMS where defects were not visible, such as microcracks or bubbling associated with curing.
Theses defects allow one to understand material flaws and possibly material selection. It may be
wise to investigate other polymer materials and/or process that may withstand higher pressures,
stresses, and strains over time.
5.1.10 – Overall Conclusions
Development and design of the micropump consumed much time. Fabrication methods
for the micropump were difficult and very time consuming. The material utilized for this
project, PDMS, is a material that has not been utilized much in processing procedures. Much
time was taken to determine the best methods to fabricate the micropump in the fastest amount of
time. Each method of fabrication proved to be time consuming and consisted of many days.
167
After both methods were fine-tuned and tested numerous times, each still resulted in
approximately a one week to two week turn around time. The time to make the pump could also
be delayed farther depending on equipment downtime and failure.
Sealing and testing the micropump required more time in order to obtain the optimum
method and results. Testing and characterization was able to be completed with top actuation.
Sidewall actuation was unable to be achieved at this time due to the desired thickness not being
acquired. Improper thickness resulted in sidewalls that would not move or flex properly to
provide fluid interaction. Actuation of the sidewalls will be further investigated in the future
with a better, more devised actuation method. Even though there were many issues and
drawbacks during the design, fabrication, and testing of the micropump, it has been proven that it
can be accomplished as seen in figures 4.1 and 4.2.
5.2: Summarization of Objectives
The main objective was to determine fabrication methods that would allow the
development of the theoretical three-wall micropump studied in ANSYS. Each fabrication
method was novel and unique in the creation of the micropump design. The first fabrication
method required the use of the VMC microelectronics laboratory. This method utilized
microelectricalmechanical systems methodology coupled with lithography and sealing processes.
The second fabrication method incorporated rapid prototyping technology to produce a mold of
the PDMS micropump. Both fabrication methods provided optimum final results that allowed
one to experimentally test the micropumps capabilities. These fabrication methods when
168
coupled together allowed the processing and production times of the micropump to be reduced
drastically making it ideal for quick and easy manufacturing.
Finally the last objective was to experimentally test the micropump to determine the best
actuation methods for fluid flow. Several experimental pumps were created, such as
electrostatic, piezoelectric, magnetic, mechanical, and pressurized. From all of these testing
methods the two that produced the best results were mechanical actuation and pressurized
actuation. Mechanical actuation of the micropump was investigated and corresponded with
theoretical results computed with ANSYS. From experimentally data it was proven that the
optimum frequencies to operate the device ranged from ten to twenty hertz, with best flow rates
falling at an operating frequency of fourteen to sixteen hertz. Theoretically it was proven that
the flow rate through the micropump was proportional to the actuation frequency. Comparison
of both theoretical and experimental results proved that the frequencies to actuate the micropump
were similar.
5.3: Research Contributions
The main goal of this project was to investigate the feasibility of a valveless micropump
and study its performance experimentally that would pump fluids of different viscosities
efficiently and effectively. Based on previous micropump design simulations the pump was
redesigned and fabricated to investigate further the performance characteristics.
Two fabrication methods were studied and created to bring the three nozzle/diffuser
micropump into a functioning prototype. The cleanroom process incorporated techniques that
allowed the design to be fabricated through a step by step process to achieve a finished product.
169
This procedure allowed the development of an irreversible sealing technique that had not been
developed prior to this research. This technique was done with low voltage and pressure to
provide a permanent seal for the PDMS fabricated pump. Coupling the cleanroom processes
with rapid-prototyping the overall fabrication and development of the micropump was
accomplished. This type of design and fabrication process can be extended for the development
and testing of new design models for many applications.
Through experimental testing it was determined that the micropump would require a
displacement to the walls of the pump to achieve desired flow characteristics through the entire
pump, such as laminar flow, minimal backflow, and continual increase of flow. Several
techniques were investigated such as electrostatics, piezoelectric, magnetic, mechanical, and
pressure actuation to produce wall motion. From electrostatic actuation a method was created to
actually metalize the PDMS material for a short time with proper connections to supply current.
This technique was virtually a novel concept that was developed to actuate the pump. It was
discovered that after the metal was placed on the PDMS it would deteriorate over time due to
characteristics of the material itself. For piezoelectric actuation it was studied for actuation
methods concerning the micropump. It was observed that piezoelectric materials would not
achieve the desired displacement required to manipulate fluid flow through the micropump
chamber. Next magnetic actuation did provide movement of the PDMS membrane, but lacked
consistent results for attraction/deflection. It was determined and concluded that the
incorporation of magnetic medium with the PDMS mixture must undergo a constant
electromagnetic field in order to align the particulates within the PDMS material. This concept
would involve fabricating and constructing an electromagnetic setup to create enough magnetism
to cure and actuate the micropump. This in turn would be bulky and not very efficient in terms
170
of moving fluid through the micropump. The main actuation method that provided ample results
was mechanical. With this method a pneumatic motor was utilized to acquire displacement on
the top of the micropump. As previously stated and reported this method provided the desired
results that were expected as compared to the theoretical. It was observed on the bigger
micropump designs that backflow was present, but as the micropump went smaller and smaller
the backflow characteristic gradually decreased. It was observed that as frequency increased
flow increased through the pump as well. This was shown both theoretically from previous
studies and experimentally through the research presented.
5.4: Recommendations and Future Work
This study has proven the micropump must be developed with at least three-walls to
achieve maximum flow rate with minimal backflow characteristics. A future prospect would
focus on developing the micropump into an advanced three-dimensional device that can be
actuated around the whole perimeter. Also, incorporation of a filtering device would be a future
design that would allow for sorting within drug delivery or biological devices. Installation or
fabrication of a flap in the interior of the micropump chamber would eliminate any possible
backflow.
As previously stated future research possibilities include an attempt to expand the horizon
of the PDMS micropump from a simple three-dimensional to a more complex three-dimensional
conical design. To date this new concept has been theorized with the use of SolidWorks and
ANSYS. The design created in SolidWorks is shown below with accompanied dimensions.

171
Note: this is a conceptual theory that is currently being investigated for future graduate students
(figure 5.1).
Figure 5.1: Design Concept of 3-Dimensional Micropump
The aforementioned micropump is made up of PDMS material. The following properties
were utilized to begin analysis on this conceptual design.
Material – PDMS
Young's Modulus - 750 kPa
Poisson's Ratio - 0.49
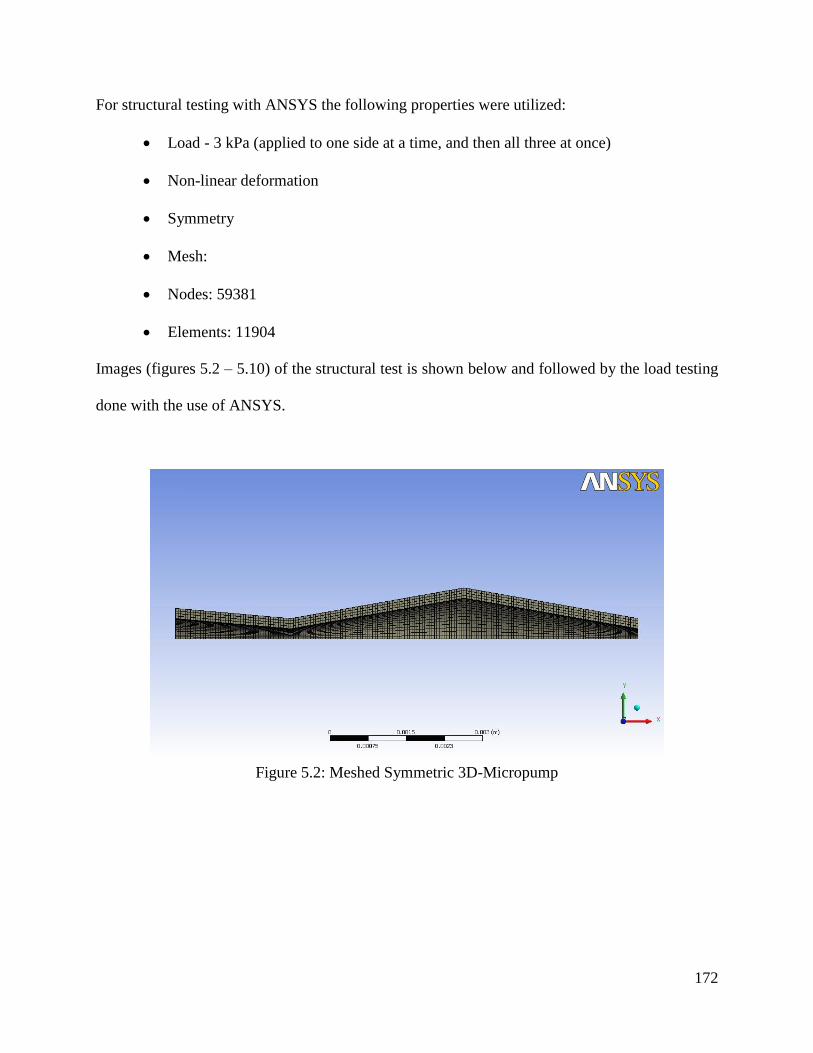
172
For structural testing with ANSYS the following properties were utilized:
Load - 3 kPa (applied to one side at a time, and then all three at once)
Non-linear deformation
Symmetry
Mesh:
Nodes: 59381
Elements: 11904
Images (figures 5.2 – 5.10) of the structural test is shown below and followed by the load testing
done with the use of ANSYS.
Figure 5.2: Meshed Symmetric 3D-Micropump
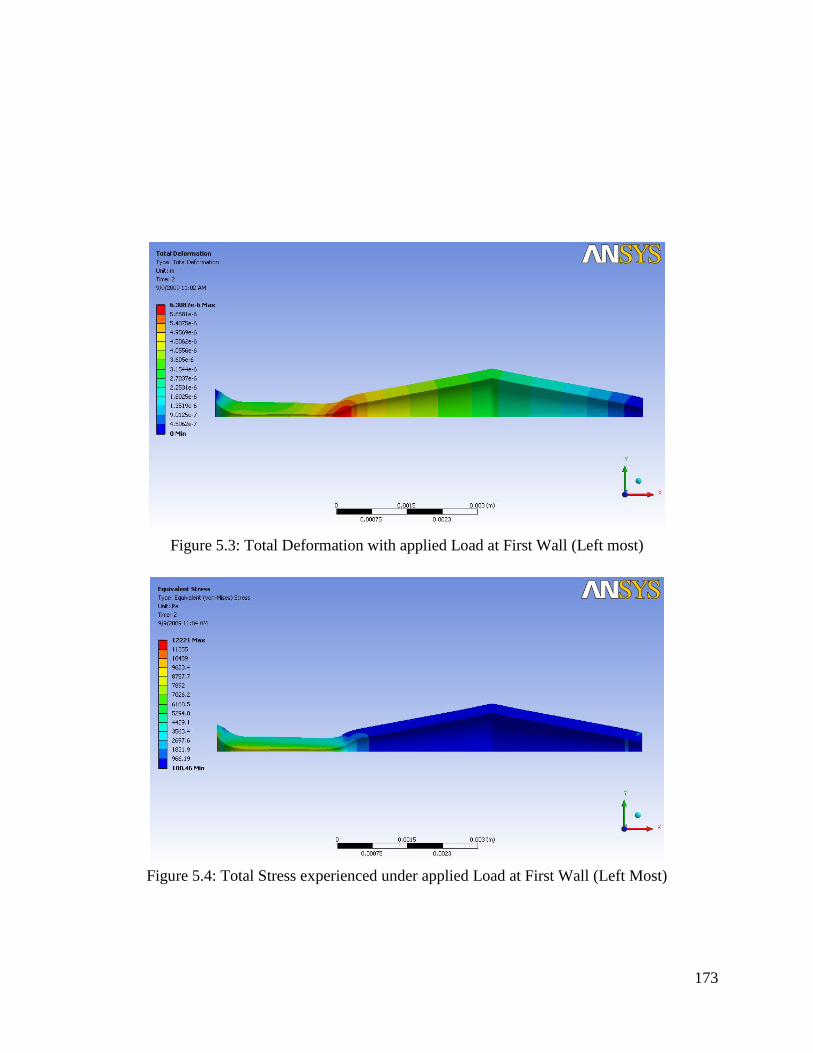
173
Figure 5.3: Total Deformation with applied Load at First Wall (Left most)
Figure 5.4: Total Stress experienced under applied Load at First Wall (Left Most)

174
Figure 5.5: Total Deformation with applied Load at Second Wall (Middle)
Figure 5.6: Total Stress experienced under applied Load at Second Wall (Middle)

175
Figure 5.7: Total Deformation with applied Load at Third Wall (Right Most)
Figure 5.8: Total Stress experienced under applied Load Third Wall (Right Most)
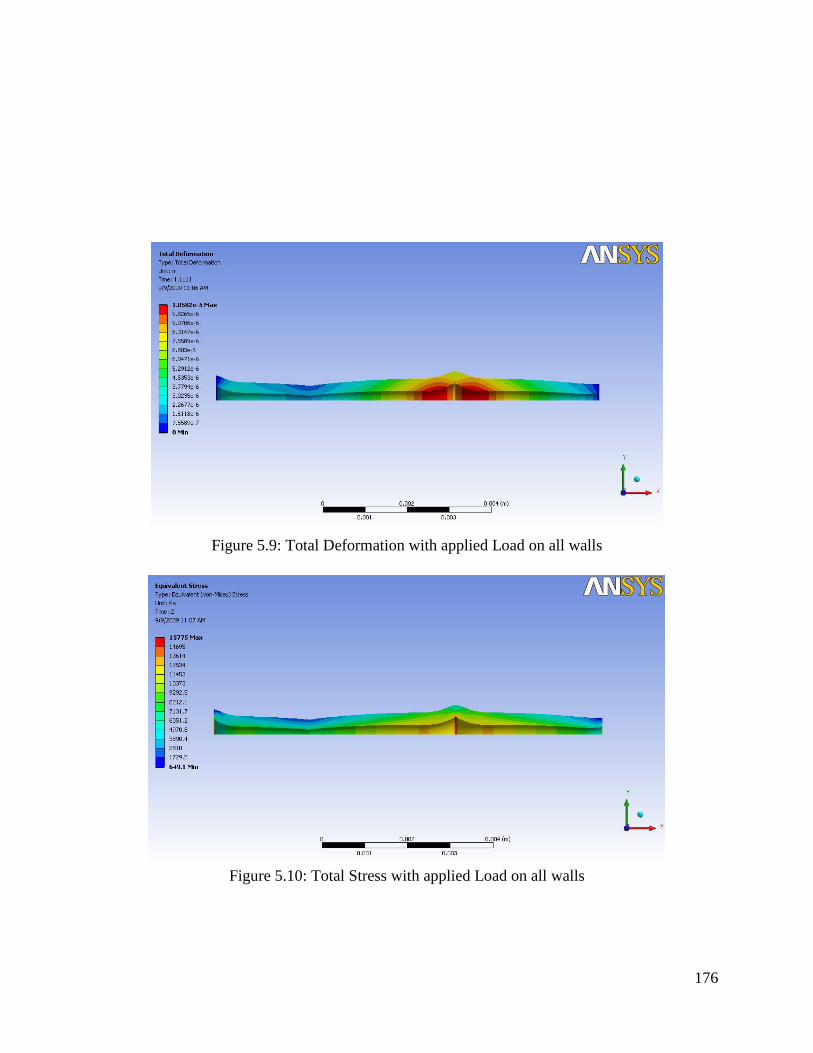
176
Figure 5.9: Total Deformation with applied Load on all walls
Figure 5.10: Total Stress with applied Load on all walls
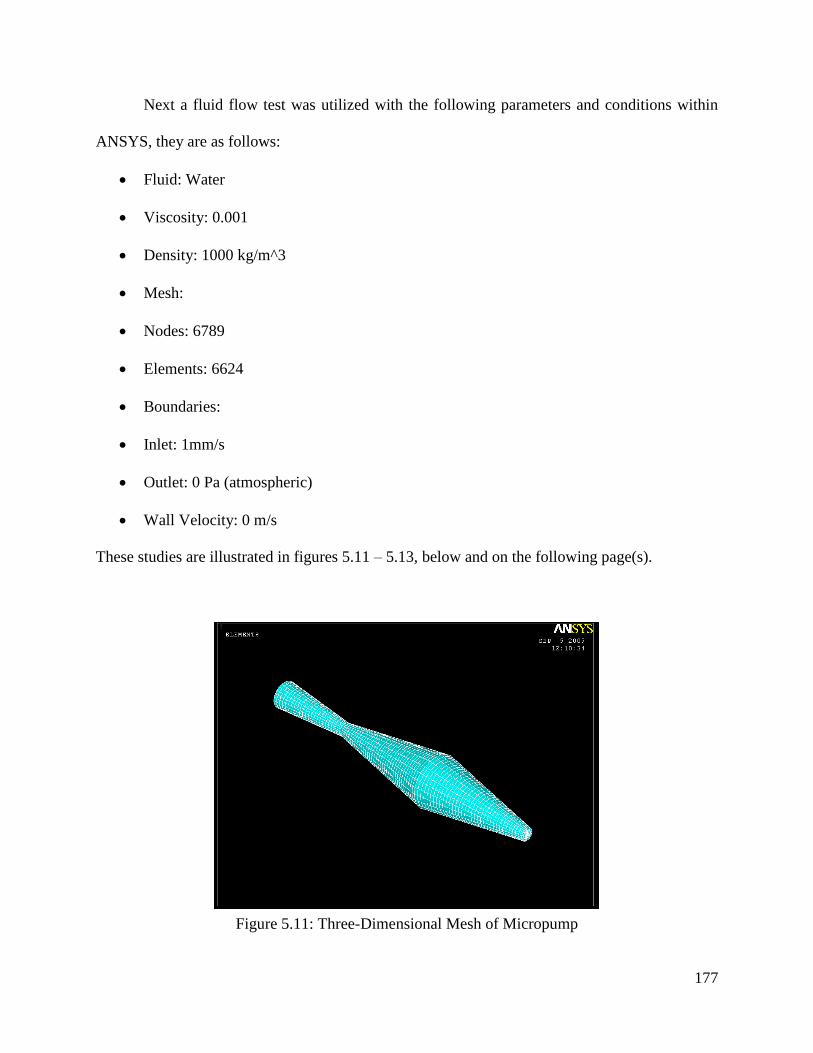
177
Next a fluid flow test was utilized with the following parameters and conditions within
ANSYS, they are as follows:
Fluid: Water
Viscosity: 0.001
Density: 1000 kg/m^3
Mesh:
Nodes: 6789
Elements: 6624
Boundaries:
Inlet: 1mm/s
Outlet: 0 Pa (atmospheric)
Wall Velocity: 0 m/s
These studies are illustrated in figures 5.11 – 5.13, below and on the following page(s).
Figure 5.11: Three-Dimensional Mesh of Micropump
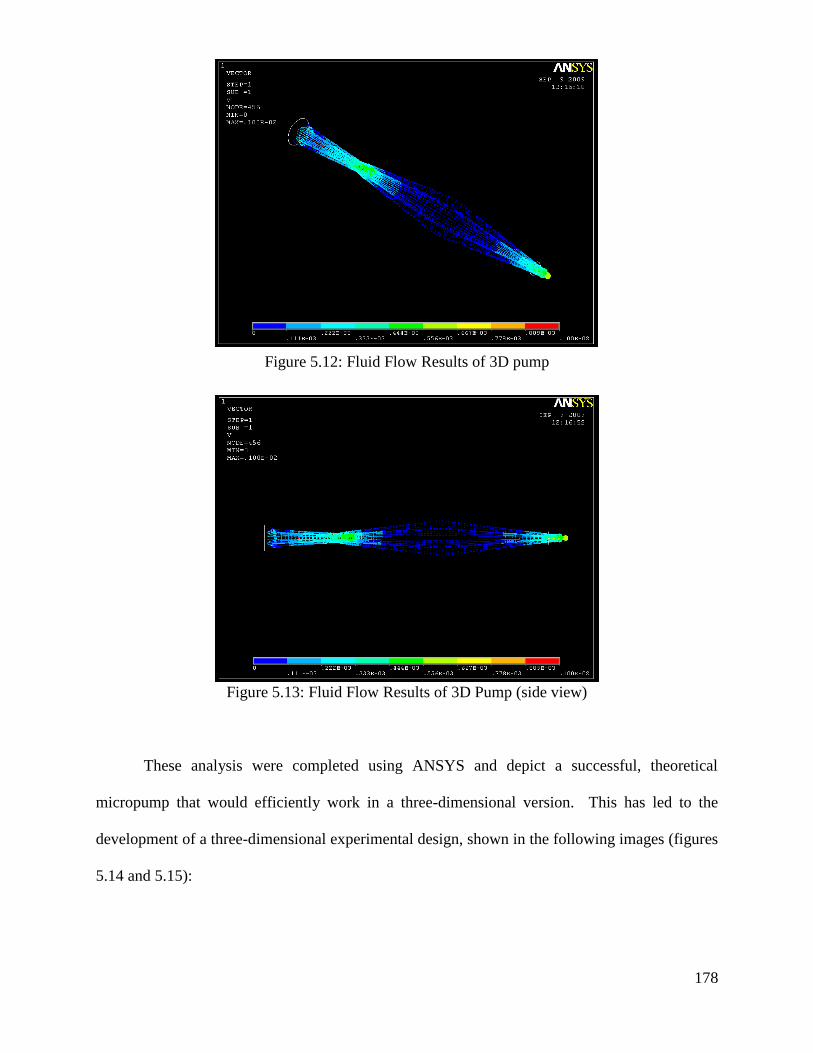
178
Figure 5.12: Fluid Flow Results of 3D pump
Figure 5.13: Fluid Flow Results of 3D Pump (side view)
These analysis were completed using ANSYS and depict a successful, theoretical
micropump that would efficiently work in a three-dimensional version. This has led to the
development of a three-dimensional experimental design, shown in the following images (figures
5.14 and 5.15):

179
Figure 5.14: Three-dimensional micropump Fabricated
Figure 5.15: Three-dimensional micropump Fabricated
The three-dimensional micropump is currently undergoing testing and experimentation.
If it is successful, it can then be downsized and tested in order to provide a more economical,
microscale device that can be utilized in DNA analysis, chemical analysis, and drug delivery
applications.

180
REFERENCES
[1] Narasimhan, J., Papautsky, I., J. Micromech. Microeng., 2002, 14, pp. 96 – 103
[2] Yussuf, A., Sbarski, I., Hayes, J., Solomon, M., Sealing and Bonding Techniques for
Polymer-Based Microfluidic Devices, 2001, pp. 269-275.
[3] Whitesides, G. M., (2006, July) The origins and the future of microfluidics. Nature.
[Online]. 442, pp. 368-373. Available:
http://ww.nature.com/nature/journal/v442/n7101/full/nature05058.html
[4] Shaikh, K. A., Ryu, K. S., Goluch, E. D., Nam, J. M., Liu, J., Lu, Y., Mirkin, C. A.,
Liu, C., A Methodology for Rapid Prototyping Microfluidic Devices with Sophisticated
Functionality. 2005, pp. 1063-1065.
[5] Ng, J. M. K., Gitlin, I., Stroock, A. D., Whitesides, G. M., Electrophoreis 2002, 23, pp.
3461-3473
[6] Vlachopoulou, M. E., Tserepi, A., Vourdas, N., Gogolides, E., Misiakos, K., Journal of
Physics: Conference Series 10, 2005, pp. 293-296.
[7] Lu, H., Koo, L. Y., Wang, Lauffenburger, D. A., Griffith, L. G., Jensen, K. F., Anal.
Chem. 2004, 76, pp. 5257-5264
[8] Anderson, J. R., Chiu, D. T., Jackman, R. J., Cherniavskaya, O., McDonald, J. C., Wu,
H., Whitesides, S. H., Whitesides, G. M., Anal. Chem. 2000, 72, pp. 3158-3164.
[9] McDonald, J. C., Whitesides, G. M., Acc. Chem. Res. Res. 2002, 35, pp. 491-499.
[10] Chaudary, M. K., Whitesides, G. M., Langmuir 1991, 7, pp. 1013-1025
[11] Morra, M., Occhiello, E., Marola, R., Garbassi, F., Humphrey, P., Johnson, D., J.
Colloid Interface Sci. 1990, 137, pp. 11-24.
[12] Papra, A., Bernar, A., Juncker, D., Larsen, N. B., Michel, B., Delamarche, E.,
Langmuir 2002, 19, pp. 1518-1527
[13] McDonald, J. C., Duffy, D. C., Anderson, J. R., Chiu, D. T., Wu, H., Whitesides, G.
M., Electrophoresis 2000, 21, pp. 27-40.
[14] Owen, M. J., Smith, P. J., J. Adhesion Sci. Technol. 1994, 9, pp. 1063-1075.
[15] Unger, M. A., Chou, H., Thorsen, T., Schere, a., Quake, S. R., Science 2000, 288, pp.
113-116.
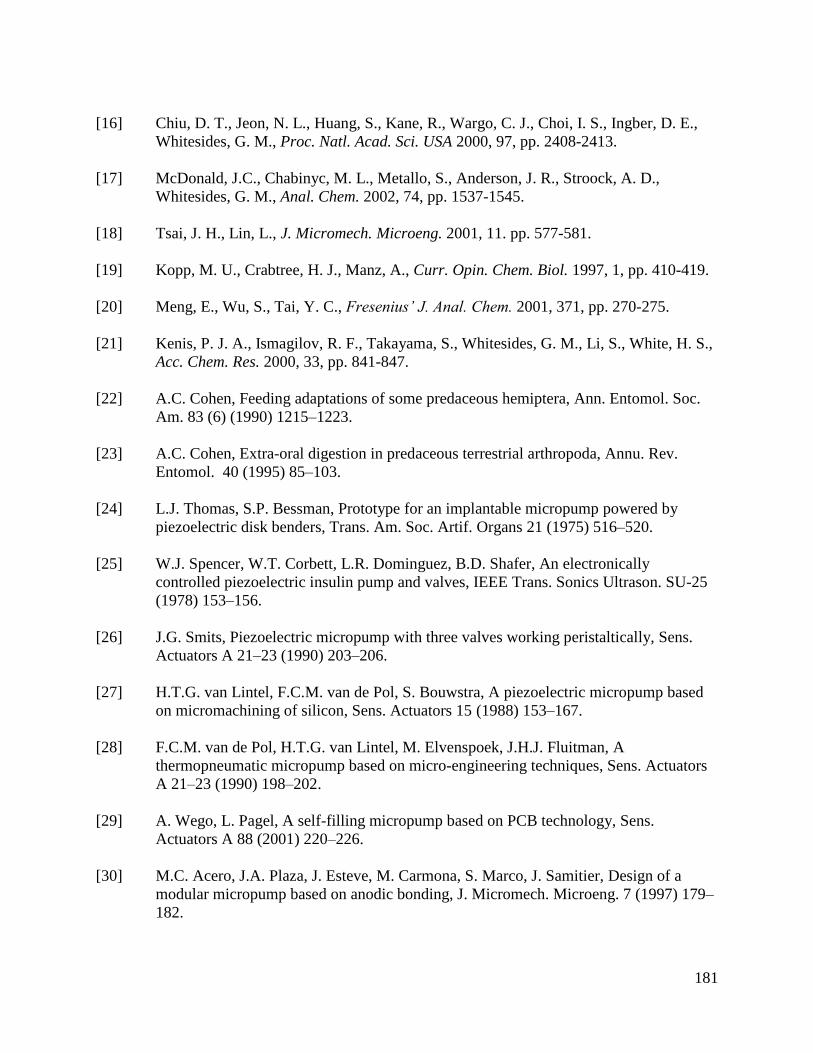
181
[16] Chiu, D. T., Jeon, N. L., Huang, S., Kane, R., Wargo, C. J., Choi, I. S., Ingber, D. E.,
Whitesides, G. M., Proc. Natl. Acad. Sci. USA 2000, 97, pp. 2408-2413.
[17] McDonald, J.C., Chabinyc, M. L., Metallo, S., Anderson, J. R., Stroock, A. D.,
Whitesides, G. M., Anal. Chem. 2002, 74, pp. 1537-1545.
[18] Tsai, J. H., Lin, L., J. Micromech. Microeng. 2001, 11. pp. 577-581.
[19] Kopp, M. U., Crabtree, H. J., Manz, A., Curr. Opin. Chem. Biol. 1997, 1, pp. 410-419.
[20] Meng, E., Wu, S., Tai, Y. C., Fresenius’ J. Anal. Chem. 2001, 371, pp. 270-275.
[21] Kenis, P. J. A., Ismagilov, R. F., Takayama, S., Whitesides, G. M., Li, S., White, H. S.,
Acc. Chem. Res. 2000, 33, pp. 841-847.
[22] A.C. Cohen, Feeding adaptations of some predaceous hemiptera, Ann. Entomol. Soc.
Am. 83 (6) (1990) 1215–1223.
[23] A.C. Cohen, Extra-oral digestion in predaceous terrestrial arthropoda, Annu. Rev.
Entomol. 40 (1995) 85–103.
[24] L.J. Thomas, S.P. Bessman, Prototype for an implantable micropump powered by
piezoelectric disk benders, Trans. Am. Soc. Artif. Organs 21 (1975) 516–520.
[25] W.J. Spencer, W.T. Corbett, L.R. Dominguez, B.D. Shafer, An electronically
controlled piezoelectric insulin pump and valves, IEEE Trans. Sonics Ultrason. SU-25
(1978) 153–156.
[26] J.G. Smits, Piezoelectric micropump with three valves working peristaltically, Sens.
Actuators A 21–23 (1990) 203–206.
[27] H.T.G. van Lintel, F.C.M. van de Pol, S. Bouwstra, A piezoelectric micropump based
on micromachining of silicon, Sens. Actuators 15 (1988) 153–167.
[28] F.C.M. van de Pol, H.T.G. van Lintel, M. Elvenspoek, J.H.J. Fluitman, A
thermopneumatic micropump based on micro-engineering techniques, Sens. Actuators
A 21–23 (1990) 198–202.
[29] A. Wego, L. Pagel, A self-filling micropump based on PCB technology, Sens.
Actuators A 88 (2001) 220–226.
[30] M.C. Acero, J.A. Plaza, J. Esteve, M. Carmona, S. Marco, J. Samitier, Design of a
modular micropump based on anodic bonding, J. Micromech. Microeng. 7 (1997) 179–
182.
182
[31] B. Büstgens, W. Bacher, W. Bier, R. Ehnes, D. Maas, R. Ruprecht, W.K. Schomburg,
L. Keydel, Micromembrane pump manufactured by molding, in: Proceedings of the
Actuator ‘94, Bremen, Germany, 15–17 June 1994, pp. 86–90.
[32] R. Linnemann, P. Woias, C.-D. Senfft, J.A. Ditterich, A self-priming and bubble-
tolerant silicon micropump for liquids and gases, in: Proceedings of the MEMS ‘98,
Heidelberg, Germany, 25–29 January 1998, pp. 532–537.
[33] P. Woias, R. Linnemann, M. Richter, A. Leistner, B. Hillerich, in: D.J. Harrison, A. van
den Berg (Eds.), Micro Total Analysis Systems ‘98, Kluwer Academic Publishers,
Dordrecht, 1998, pp. 383–386.
[34] J. Döpper, M. Clemens, W. Ehrfeld, K.-P. Kämper, H. Lehr, Development of low-cost
injection moulded micropumps, in: Proceedings of the Actuator ‘96, Bremen, Germany,
26–28 June 1996, pp. 37–40.
[35] S. Böhm, M. Dierselhuis, W. Olthuis, P. Bergveld, in: D.J. Harrison, A. van den Berg
(Eds.), Micro Total Analysis Systems ‘98, Kluwer Academic Publishers, Dordrecht,
1998, pp. 391–394.
[36] M.C. Carrozza, N. Croce, B. Magnani, P. Dario, A piezoelectricallydriven
stereolithography-fabricated micropump, J. Micromech. Microeng. 5 (1995) 177–179.
[37] P. Dario, N. Croce, M.C. Carrozza, G. Varallo, A fluid handling system for a chemical
microanalyzer, Technical Digest of the MME ’95, Sixth Workshop on Micromachining,
Micromechanics and Microsystems, Copenhagen, Denmark, 3–5 September 1995, pp.
140–143.
[38] S. Böhm, W. Olthuis, P. Bergveld, A plastic micropump constructed with conventional
techniques and materials, Sens. Actuators 77 (1999) 223–228.
[39] J. Judy, T. Tamagawa, D.L. Polla, Surface-machined micromechanical membrane
pump, in: Proceedings of the MEMS ‘91, Nara, Japan, 30 January–2 February 1991, pp.
182–186.
[40] R. Zengerle, S. Kluge, M. Richter, A. Richte, A bidirectional silicon micropump, in:
Proceedings of the MEMS ‘95, Amsterdam, The Netherlands, 29 January–2 February
1995, pp. 19–24.
[41] T. Bourouina, A. Bosseboeuf, J.-P. Grandchamp, Design and simulation of an
electrostatic micropump for drug-delivery applications, J. Micromech. Microeng. 7
(1997) 186–188.
[42] E. Makino, T. Mitsuya, T. Shibata, Fabrication of TiNi shape memory micropump,
Sens. Actuators A 88 (2001) 256–262.
183
[43] S. Kluge, G. Neumayer, U. Schaber, M. Wackerle, M. Maichl, P. Post, M. Weinmann,
R. Wanner, Pneumatic silicon microvalves with piezoelectric actuation, in: Proceedings
of the Transducers ‘01/Eurosensors XV, Munich, Germany, 10–14 June 2001, pp. 924–
927.
[44] M. Richter, J. Kruckow, J. Weidhaas, M. Wackerle, A. Drost, U. Schaber, M. Schwan,
K. Kühl, Batch fabrication of silicon micropumps, in: Proceedings of the Transducers
‘01/Eurosensors XV, Munich, Germany, 10–14 June 2001, pp. 936–939.
[45] M. Koch, N. Harris, A.G.R. Evans, N.M. White, A. Brunnschweiler, A novel
micromachined pump based on thick-film piezoelectric actuation, in: Proceedings of
the Transducers ‘97, vol. 1, Chicago, USA, 16–19 June 1997, pp. 353–356.
[46] M. Koch, A.G.R. Evans, A. Brunnschweiler, The dynamic micropump driven with a
screen printed PZT actuator, J. Micromech. Microeng. 8 (1998) 119–122.
[47] C.J. Morris, F.K. Forster, Optimization of a circular piezoelectric bimorph for a
micropump driver, J. Micromech. Microeng. 10 (2000) 459–465.
[48] E. Stemme, G. Stemme, A valveless diffuser/nozzle-based fluid pump, Sens. Actuators
A 39 (1993) 159–167. P. Woias / Sensors and Actuators B 105 (2005) 28–38 37
[49] A. Olsson, Valve-less diffuser pumps for liquids, Ph.D. Thesis, Stockholm, 1996.
[50] A. Olsson, P. Enoksson, G. Stemme, E. Stemme, A valve-less planar pump in silicon,
in: Proceedings of the Transducers ‘95/Eurosensors IX, Stockholm, Sweden, 25–29
June 1995, pp. 291–294.
[51] F.K. Foster, R.L. Bardell, M.A. Afromowitz, N.R. Sharma, A. Blanchard, Design,
fabrication and testing of fixed-valve micro-pumps, in: Proceedings of the ASME
Fluids Engineering Division, IMECE 95, vol. 234, 1995, pp. 39–44.
[52] N. Tesla, Valvular conduit, US patent 1 329 559 (1920).
[53] T. Gerlach, M. Schuenemann, H. Wurmus, A new micropump principle of the
reciprocating type using pyramidic micro flowchannels as passive valves, J.
Micromech. Microeng. 5 (1995) 199–201.
[54] A. Olsson, G. Stemme, E. Stemme, A numerical design study of the valveless diffuser
pump using a lumped-mass model, J. Micromech. Microeng. 9 (1999) 34–44.
[55] M. Heschel, M. Muellenborn, S. Bouwstra, Fabrication and characterization of truly 3-
D diffuser/nozzle microstructures in silicon, IEEE J. Microelectromech. Syst. 6 (March
(1)) (1997) 41–47.
184
[56] M. Stehr, S. Messner, H. Sandmaier, R. Zengerle, The VAMP—a new device for
handling liquids or gases, Sens. Actuators A 57 (1996) 153–157.
[57] M. Stehr, H. Gruhler, H. Straatmann, S. Messner, H. Sandmaier, R. Zengerle, The
selfpriming VAMP, in: Proceedings of the Transducers ‘97, vol. 1, Chicago, USA, 16–
19 June 1997, pp. 351–352.
[58] Guoguang Su and Ramana M. Pidaparti, “Drug Particle Delivery Investigation through
a Valveless Micropump,” Journal of Microelectromechanical Systems, vol. 19, no. 6,
pp. 1390 – 1399, December 2010
[59] C. Cartin, R. M. Pidaparti, and G. M. Atkinson, “Design and fabrication of a PDMS
micropump with moving membranes,” in Proc. Univ., Gov., Ind. Micro-Nano Symp.,
Louisville, KY, Jul. 13–16, 2008, pp. 249–253.
[60] H. Andersson, W. van der Wijngaart, P. Nilsson, P. Enoksson, and G. Stemme, “A
valve-less diffuser micropump for microfluidic analytical systems,” Sens. Actuators B,
Chem., vol. 72, no. 3, pp. 259–265, Feb. 2001.
[61] R. Zengerle, M. Leitner, S. Kluge, A. Richter, Carbon dioxide priming of micro liquid
systems, in: Proceedings of the MEMS ‘95, Amsterdam, The Netherlands, 29 January–
2 February 1995, pp. 340–343.
[62] P. Gravesen, J. Branebjerg, O.S. Jensen, Microfluidics—a review, J. Micromech.
Microeng. 3 (1993) 168–182.
[63] M. Richter, R. Linnemann, P. Woias, Robust design of gas and liquid micropumps,
Sens. Actuators A 68 (1998) 480–486.
[64] D. Maillefer, H. van Lintel, G. Rey-Mermet, R. Hirschi, A high-performance silicon
micropump for an implantable drug delivery system, in: Proceedings of the MEMS ‘99,
Orlando, USA, 17–21 January 1999, pp. 541–546.
[65] D. Maillefer, S. Gamper, B. Frehner, P. Balmer, H. van Lintel, P. Renaud, A high-
performance silicon micropump for disposable drug delivery systems, in: Proceedings
of the MEMS ‘01, Interlaken, Switzerland, 21–25 January 2001, pp. 413–417.
[66] K.-P. Kämper, J. Döpper, W. Ehrfeld, S. Oberbeck, A self-filling low-cost membrane
micropump, in: Proceedings of the MEMS ‘98, Heidelberg, Germany, 25–29 January
1998, pp. 322–327.
[67] A. Olsson, O. Larsson, J. Holm, L. Lundbladh, O. Oehman, G. Stemme, Valve-less
diffuser micropumps fabricated using thermoplastic replication, Sens. Actuators A 64
(1998) 63–68.
185
[68] S.F. Bart, M. Mehregany, L.S. Tavrow, J.H. Lang, Microfabricated
electrohydrodynamic pumps, Transducers ‘89, Book of Abstracts, Montreux,
Switzerland, 25–30 June 1989, p. 113.
[69] A. Richter, H. Sandmaier, An electrohydrodynamic micropump, in: Proceedings of the
MEMS ‘90, Napa Valley, USA, 11–14 February 1990, pp. 99–104.
[70] A. Richter, A. Plettner, K.A. Hoffmann, H. Sandmaier, Electrohydrodynamic pumping
and flow measurement, in: Proceedings of the MEMS ‘91, Nara, Japan, 30 January–2
February 1991, pp. 271–276.
[71] S.E. McBride, R.M. Moroney, W. Chiang, in: D.J. Harrison, A. van den Berg (Eds.),
Micro Total Analysis Systems ‘98, Kluwer Academic Publishers, Dordrecht, 1998, pp.
45–48.
[72] A. Manz, E. Verpoorte, D.E. Raymond, C.S. Effenhauser, N. Burggraf, H.M. Widmer,
in: A. van den Berg, P. Bergveld (Eds.), Micro Total Analysis Systems, Mesa-
Monograph, vol. 1, Kluwer Academic Publishers, Dordrecht, 1995, pp. 5–27.
[73] A. Manz, The secret behind electrophoresis microstructure design, in: Proceedings of
the 2nd International Symposium on Miniaturized Total Analysis Systems, Basel,
Switzerland, 19–22 November 1996, pp. 28–30.
[74] D.J. Harrison, C. Wang, P. Thibeault, F. Ouchen, S.B. Bang, in: A. van den Berg, et al.
(Eds.), Micro Total Analysis Systems 2000, Kluwer Academic Publishers, Dordrecht,
2000, pp. 195–204.
[75] P.H. Paul, D.W. Arnold, D.J. Rakestraw, in: D.J. Harrison, A. van den Berg (Eds.),
Micro Total Analysis Systems ‘98, Kluwer Academic Publishers, Dordrecht, 1998, pp.
49–52.
[76] R.M. Moroney, R.M. White, R.T. Howe, Ultrasonically induced microtransport, in:
Proceedings of the MEMS ‘91, Nara, Japan, 30 January–2 February 1991, pp. 277–282.
[77] S. Miyazaki, T. Kawai, M. Araragi, A piezo-electric pump driven by a flexural
progressive wave, in: Proceedings of the MEMS ‘91, Nara, Japan, 30 January–2
February 1991, pp. 283–288.
[78] J.C. Rife, M.I. Bell, J.S. Horwitz, M.N. Kabler, R.C.Y. Auyeung, W.J. Kim, Miniature
valveless ultrasonic pumps and mixers, Sens. Actuators 86 (2000) 135–140.
[79] N.T. Nuyen, R.M. White, Design and optimization of an ultrasonic flexural plate wave
micropump using numerical simulation, Sens. Actuators 77 (1999) 229–236.
[80] J. Jang, S.S. Lee, Theoretical and experimental study of MHD (magnetohydrodynamic)
micropump, Sens. Actuators 80 (2000) 84–89.
186
[81] A.V. Lemoff, A.P. Lee, An AC electrohydrodynamic micropump, Sens. Actuators B 63
(2000) 178–185.
[82] D. O’Keefe, C.O. Herlihy, Y. Gross, J.G. Kelly, Patient-controlled analgesia using a
miniature electrochemically driven infusion pump, Br. J. Anaesth. 73 (1994) 843–846.
[83] S. Böhm, The comprehensive integration of microdialysis membranes and silicon
sensors, Ph.D. Thesis, University of Twente, The Netherlands, 2000.
[84] S. Böhm, B. Timmer, W. Olthuis, P. Bergveld, in: A. van den Berg, et al. (Eds.), Micro
Total Analysis Systems 2000, Kluwer Academic Publishers, Dordrecht, 2000, pp. 347–
350.
[85] G.J. Kellogg, T.E. Arnold, B.L. Carvalho, D.C. Duffy, N.F. Sheppard Jr., in: A. van
den Berg, et al. (Eds.), Micro Total Analysis Systems 2000, Kluwer Academic
Publishers, Dordrecht, 2000, pp. 239-242.
[86] N. Thomas, A. Ocklind, I. Blikstad, S. Griffiths, M. Kenrick, H. Derand, G. Ekstrand,
C. Ellström, A. Larsson, P. Andersson, in: A. van den Berg, et al. (Eds.), Micro Total
Analysis Systems 2000, Kluwer Academic Publishers, Dordrecht, 2000, pp. 249–252.
[87] Kilani, M., Demming, S., Feldmann, M., Buttgenbach, S., Al-Salaymeh, and Al
Halhouli, A. 2008, “Performance characterization of a miniature spiral-channel viscous
pump,” Science Direct, Sensors and Actuators A 142, pp. 256 – 262.
[88] Blanchard, D., Ligrani, P., and Gale, B. 2006, “Miniature Single-Disk Viscous Pump
(Single-DVP), Performance Characterization,” ASME, Vol. 128 pp. 602 – 610.
[89] Blanchard, D., Ligrani, P., and Gale, B. 2005, “Single-disk and double-disk viscous
micropumps,” Science Direct, Sensors and Actuators A 122 pp. 149 – 158.
[90] A. Manz, N. Graber, H.M. Widmer, Miniaturized total chemical analysis systems: a
novel concept for chemical sensing, Sens. Actuators B 1 (1990) 244–248.
[91] W. Gumbrecht, W. Schelter, B. Montag, Online blood electrolyte monitoring with a
ChemFET microcell system, Sens. Actuators B 1 (1990) 477–480.
[92] P. Woias, Ionensensitive Feldeffekttransistoren als Meßwandler in chemischen
Analysensystemen auf Fließinjektionsbasis, Ph.D. Thesis, TU Munich, 1995.
[93] P. Woias, S. Koch, E. Müller, D. Barrow, J. Cefai, G. Curtis, H. Hughes, An ISFET-
FIA system for high precision pH recording, Sens. Actuators B 15–16 (1993) 68–74.
[94] B. van der Schoot, S. Jeanneret, A. van den Berg, N.F. de Rooij, A silicon integrated
miniature chemical analysis system, Sens. Actuators B 6 (1992) 57–60.
187
[95] M. Richter, A. Prak, J. Naundorf, M. Eberl, H. Leeuwis, P. Woias, A. Steckenborn, A
chemical microanalysis system as a microfluid system demonstrator, in: Proceedings of
the Transducers 97, vol. 1, Chicago, USA, 16–19 June 1997, pp. 303–306.
[96] S. Drost, W. Wörmann, P. Woias, B. Ross, O. Köster, W. Konz, B. Edler, W.
Schuhmann, L. Meixner, R. Ferretti, Microanalytical system for environmental control,
in: Proceedings of the Transducers 97, vol. 2, Chicago, USA, 16–19 June 1997, pp.
931–934.
[97] E. Verpoorte, A. Manz, H.M. Widmer, B. van der Schoot, N.F. de Rooij, A three-
dimensional micro flow system for a multi-step chemical analysis, Technical Digest,
Transducers ‘93, Yokohama, 7–10 June 1993, pp. 939–942.
[98] A. van den Berg (Ed.), Micro Total Analysis Systems ‘94, Proceedings of the _TAS ‘94
Workshop, 22–24 November 1994, Enschede, Netherlands, Kluwer Academic
Publishers, 1994.
[99] H.M. Widmer (Ed.), _TAS ‘96, Proceedings of the 2nd International Symposium on
Miniaturized Total Analysis Systems, Basel, Switzerland, 19–22 November 1996.
[100] D.J. Harrison, A. van den Berg (Eds.), Micro Total Analysis Systems ‘98, Proceedings
of the _TAS ‘98 Workshop, 13–16 October 1998, Banff, Canada, Kluwer Academic
Publishers, 1998.
[101] A. van den Berg, W. Olthuis (Eds.), Micro Total Analysis Systems 2000, Proceedings
of the _TAS 2000 Symposium, 14–18 May 2000, Enschede, Netherlands, Kluwer
Academic Publishers, 2000.
[102] P. Bergveld, Thirty years of ISFETOLOGY - What happened in the past 30 years and
what may happen in the next 30 years, Sens. Actuators B 88 (2003) 1–20.
[103] Azaroff, L.V. and J. J. Brophy, Electronic Processes in Materials, McGraw-Hill Book
Company, New York, 1963, Chapter 13. Reprinted by CBLS Publishers, Marietta, OH,
1990.
[104] “The Physics of Magnetism.” http://www.ucpress.edu/content/chapters/11183.ch01.pdf,
Web 24 Feb. 2012.
[105] “The Magnetic Field.”
http://media.wiley.com/product_data/excerpt/9X/07803602/078036029X.pdf, Web 24
Feb. 2012
[106] “Basic Microfluidic Concepts.” (September 7, 2001): Online.
http://faculty.washington.edu/yagerp/microfluidicstutorial/basicconcepts/basicconcepts.
htm . Nov. 21, 2009.
188
VITA
Charles Patrick Cartin was born on June 27th
, 1982, in Hopewell, Virginia and is an
American Citizen. He graduated from Hopewell High School, Hopewell, Virginia in
2000. He received his Associates in Arts from Richard Bland College, Petersburg, VA in
2002. He obtained his Bachelor of Science in Mechanical Engineering from Virginia
Commonwealth University, Richmond, Virginia in 2006 and his Master of Science in
Mechanical Engineering from Virginia Commonwealth University, Richmond, Virginia
in 2007. Since 2007 he has been working as a faculty member at various colleges and
universities around the Richmond metro area, while continuing on track to complete his
PhD requirements.
EDUCATION:
Ph.D., Mechanical Engineering, Virginia Commonwealth University, 2012
Dissertation: Fabrication and Simulation of a PDMS Micropump with moving
membranes
M.S., Mechanical Engineering, Virginia Commonwealth University, 2007
Concentrations: Design Optimization and Solid Mechanics
B.S., Mechanical Engineering, Virginia Commonwealth University, 2006
A.A., Richard Bland College, 2002
EXPERIENCE:
Collateral Mechanical Engineering Instructor, 2010 – Present
Virginia Commonwealth University, Richmond, VA
Adjunct Engineering Faculty, 2011 – Present
J. Sargeant Reynolds Community College, Richmond, VA
Electronic Course Designer, 2011 – Present
J. Sargeant Reynolds Community College, Richmond, VA
Adjunct Mathematics and Physics Faculty, 2007 – 2010
John Tyler Community College JTCC, Chester, VA
Research Assistant, 2006 – Present
Virginia Commonwealth University, Richmond, VA
Teaching Assistant, 2008
Virginia Commonwealth University, Richmond, VA
Course: Mechatronics
189
Engineer Technician, 2006 – Present
G & C Engineering, Hopewell, VA
Technician, 1997 - 2006
VAMED Technical Center, Hopewell, VA
RESEARCH SKILLS:
Extensive knowledge of microfabrication, manufacturing, polymer, and cleanroom
procedures.
PRESENTATIONS:
“Fabrication and Simulation of PDMS Valveless Micropump.” GSA 12th
Annual
Research Symposium and Exhibit, April 21, 2009, Virginia Commonwealth University,
Richmond, VA
“Design and Fabrication of PDMS Micropump with Moving Membranes.” IEEE Poster
Conference, April 30, 2007, Virginia Commonwealth University, Richmond, VA
PUBLICATIONS:
Cartin, C.P. and Pidaparti, R. M., “Design, Fabrication, and Testing of a Nozzle/Diffuser
PDMS Micropump with Top Actuation,” Micro and Nanosystems Journal 2011.
C. P. Cartin, K. Koombua, R. M. Pidaparti, and G. M. Atkinson, “Fabrication and
Simulation of PDMS Valveless Micropump,” ICMEMS 2009 - International
Conference on MEMS, Chennai, India (2009)
Cartin, C. P., K. Koombua, Pidaparti, R. M., Atkinson, G. M., “Fabrication and
Simulation of a PDMS Valveless Micropump,” Proceedings of the 2009 International
Conference on MEMS, IIT Madras, Jan 3-5, 2009.
K. Koombua, Cartin, C. P., Pidaparti, R. M., and Atkinson, G. M., “Evaluation of the
Fabricated PDMS Micropump with Multiple Actuators using Computations," Sensors
and Actuators Journal 2008.
C. Cartin, R.M. Pidaparti, and G.M. Atkinson, “Design and fabrication of a PDMS
micropump with moving membranes,” in Proc. Univ., Gov., Ind. Micro-Nano Symp.,
Louisville, KY, Jul. 13 – 16, 2008, pp. 249 – 253.
Cartin, C. P., Pidaparti, R. M., Atkinson, G. M., “Design and Fabrication of a PDMS
Micropump with Moving Membranes,” University/Government/Industry Micro/Nano
Symposium (UGIM), 17th
Biennial Volume, Issue 13 – 16 July 2008, pp. 249 – 253.
190
GRANTS AND FELLOWSHIPS:
National Science Foundation (NSF), ECCS – 0725496
AWARDS AND HONORS:
Second Place, IEEE Poster Contest, Richmond Section, IEEE Chapter, April 30, 2008
SKILLS AND QUALIFICATIONS:
SolidWorks, ANSYS, AutoCad, AutoCad Inventor, Mathcad, Matlab, OrCad Pspice,
Microsoft Office Suite (Excel, Word, Powerpoint), IC Station.
Windows 95-XP/7, Unix
Basic, C, C++, Turbo Pascal
MEMS (microelectromechanical systems) technology and cleanroom fabrication
PROFESSIONAL SOCIETIES
American Society of Mechanical Engineers, Student Member
IEEE, Student Member
PERSONAL DETAILS
US Citizen and Married
REFERENCES:
Available upon request