design, development and performance of thermoplastic …
TRANSCRIPT

DESIGN, DEVELOPMENT AND PERFORMANCE OF
THERMOPLASTIC COMPOSITE LEAF SPRINGS
A thesis
submitted in partial fulfillment of the
requirements for the degree of
DOCTOR OF PHILOSOPHY
by
C.SUBRAMANIAN
(06610302)
DEPARTMENT OF MECHANICAL ENGINEERING
INDIAN INSTITUTE OF TECHNOLOGY GUWAHATI
GUWAHATI 781 039
NOVEMBER 2010
CERTIFICATE
It is certified that the work contained in the thesis entitled Design, Development and
Performance of Thermoplastic Composite Leaf Springs by C.Subramanian, a
student in the Department of Mechanical Engineering, Indian Institute of Technology
Guwahati, India, for the award of the degree of Doctor of Philosophy has been
carried out under my supervision and this work has not been submitted elsewhere
for the degree.
Dr. S. Senthilvelan
Associate Professor
Department of Mechanical Engineering
Indian Institute of Technology Guwahati
Guwahati – 781039, Assam, India.
TH-978_06610302

Dedicated to my parents,
wife and daughter
TH-978_06610302
v
TABLE OF CONTENTS
Page No.
ACKNOWLEDGEMENTS……………………………………………………….
i
ABSTRACT………………………………………………………………………..
iii
LIST OF TABLES…………………………………………………………………
x
LIST OF FIGURES………………………………………………………………..
xi
ABBREVIATIONS………………………………………………………………...
xix
NOTATIONS…………………………………………………………………........ xxi
CHAPTER 1 INTRODUCTION
1.1
Overview on Composite Leaf Springs ……………………………
1
1.2
Motivation…………………………………………………………
3
1.3
Objective ………………….………………………………………
6
1.3.1 Major Steps Accomplished to achieve Objectives………………... 6
1.4
Organization of the Thesis ………………………………………..
7
CHAPTER 2 LITERATURE SURVEY
2.1
Introduction………………………………………………………..
10
2.2
Characterization of Thermoplastic Composites …………………..
10
2.2.1
Adhesive Wear Characteristics…………………………………....
10
2.2.2
Abrasive Wear Characteristics……………………………….........
12
2.2.2.1
Influence of Fiber Reinforcement on Abrasive Wear……………..
13
2.2.3
Damping Characteristics of Thermoplastic Composites………......
14
2.2.3.1
Damping Evaluation through Free and Forced Vibrations ……….
15
2.2.3.2
Damping Evaluation through Dynamic Mechanical Analysis….....
16
2.2.4 Fatigue Performance of Thermoplastic Composites…………........ 17
TH-978_06610302
vi
2.2.4.1
Hysteretic Heating of Thermoplastic Composites…………...........
19
2.2.5
Creep Performance of Thermoplastic Composites…………..........
20
2.2.5.1
Creep Models……………............................................................,..
21
2.2.6
Engineering Application of Long Fiber Reinforced
Thermoplastics ……………............................................................
22
2.3
Metallic Leaf Spring ……………...................................................
23
2.4
Composite Leaf Spring Design……………....................................
25
2.5
Development and Performance of Composite Leaf Springs…........
27
2.6
Bolted Joint Performance of Composite Materials…………..........
29
2.6.1
Composite Joint Design……………...............................................
30
2.6.2
Influence of Clamping, Clearance and Notch on Composite joint..
31
2.7
Summary……………......................................................................
32
CHAPTER 3 MATERIALS FOR THERMOPLASTIC LEAF SPRINGS
3.1
Introduction……………..................................................................
34
3.2
Materials and Processing Conditions…………...............................
35
3.3
Fiber Length Distribution…………….............................................
38
3.4 Summary……………......................................................................
40
CHAPTER 4 FRICTION AND WEAR CHARACTERISTICS OF THERMOPLASTIC
LEAF SPRING MATERIAL
4.1 Introduction ………….....................................................................
41
4.2
Adhesive Friction Wear …………...……………...........................
42
4.2.1
Transient Friction Mechanism…………….....................................
43
4.2.2
Influence of Fiber Length on Friction……………..........................
45
4.2.3
Influence of Loading Conditions on Coefficient of Friction and
Specific Wear Rate………..............................................................
50
4.2.4
Wear Mechanisms of Test Specimens…………….........................
53
TH-978_06610302
vii
4.3
Abrasive Wear Test …………….....................................................
55
4.3.1
4.3.2
Effect of Fiber Length on Abrasive Wear…………........................
Effect of Load and Grit Size on the Abrasive Wear
Performance.....................................................................................
56
64
4.3.3
Wear Topography……………........................................................
65
4.4
Summary…………….....................................................................
72
CHAPTER 5 DAMPING CHARACTERISTICS OF THERMOPLASTIC LEAF
SPRING MATERIAL
5.1
Introduction……………..................................................................
73
5.2
Hysteresis Damping ……………....................................................
75
5.3
Damping Due to Fiber-Matrix Interface……………......................
77
5.4
Damping Under Free Vibration……………...................................
78
5.5
Damping Under Forced Vibration……………...............................
81
5.6
Dynamic Mechanical Analysis……………....................................
87
5.7
Hysteretic Heating……………........................................................
92
5.8
Summary……………......................................................................
96
CHAPTER 6 DESIGN, MANUFACTURE AND STATIC PERFORMANCE OF
THERMOPLASTIC LEAF SPRINGS
6.1
Introduction……………..................................................................
98
6.2
Leaf Spring Design……………......................................................
99
6.2.1 Material Design................................................................................
99
6.2.2
Leaf Spring Geometry Design.........................................................
100
6.2.2.1
Mono Leaf Spring Geometry...........................................................
104
6.3
Computer Aided Simulation of Leaf Spring Molding.....................
112
6.3.1
Details of Leaf Spring Model and Molding Conditions..................
112
6.3.2
Gate Design......................................................................................
113
6.3.3 Mold Shrinkage of Test Leaf Springs.............................................. 115
TH-978_06610302
viii
6.3.4 Warpage Analysis of Test Leaf springs...........................................
117
6.4
Processing of Thermoplastic Leaf Springs......................................
115
6.5
Thermoplastic Leaf Spring Inspection.............................................
121
6.6
Fixture for Leaf Spring Performance Evaluation.............................
124
6.7
Static Performance Evaluation of Leaf Springs...............................
126
6.7.1
Load Deflection Behavior of Leaf Springs......................................
127
6.7.2
Influence of Strain Rate on Load Deflection Behavior of Leaf
Springs.............................................................................................
128
6.7.3
Energy Storage Capacity of Leaf Springs........................................
129
6.7.4
Hysteresis Characteristics of Composite Leaf Springs....................
130
6.7.5
Load Relaxation Characteristics of Composite Leaf Springs..........
133
6.8
Summary..........................................................................................
134
CHAPTER 7 FATIGUE AND CREEP PERFORMANCE OF THERMOPLASTIC
LEAF SPRINGS
7.1
Introduction……………..................................................................
135
7.2
Fatigue Performance Evaluation Methodology...............................
136
7.3
Fatigue Performance of Thermoplastic Leaf Springs......................
137
7.3.1
Energy Dissipation of Test Leaf Springs.........................................
137
7.3.2
Spring Rate of Test Leaf Springs.....................................................
142
7.3.3
Fatigue Strength of Molded Leaf Springs........................................
145
7.4
Creep Performance...........................................................................
153
7.4.1
Background on Creep Models..........................................................
153
7.4.1.1
Findley’s Power Law Model............................................................
153
7.4.1.2
HRZ Model......................................................................................
154
7.4.2
Creep Performance Evaluation Methodology..................................
155
7.5
Flexural Creep Performance of Thermoplastic Composite Leaf
Springs.............................................................................................
155
TH-978_06610302
ix
7.5.1
Experimental Creep Performance....................................................
155
7.5.2
Spring Rate of Thermoplastic Composite Leaf Spring....................
157
7.5.3
Empirical Model for Predicting Short Term Creep Behavior..........
159
7.5.4
Influence of Material Crystallinity on Power Law Coefficient.......
166
7.6
Summary..........................................................................................
167
CHAPTER 8 JOINT PERFORMANCE OF THERMOPLASTIC LEAF SPRINGS
8.1
Introduction……………..................................................................
169
8.2
Design of Joint Configuration..........................................................
170
8.2.1
Joint Geometry and Design Methodology.......................................
170
8.2.2
Parametric Study using Finite Element Analysis.............................
171
8.3
Joint Strength Evaluation Methodology..........................................
177
8.4
Static Joint Strength Performance....................................................
180
8.4.1
Effect of Fiber Length on Static Joint Strength...............................
180
8.4.2
Effect of Bolt-Hole Clearance on Bearing Strength........................
187
8.5
Fatigue Joint Strength Performance.................................................
189
8.5.1
Effect of Fiber Length on Fatigue Joint Strength.............................
189
8.5.2
Effect of Fiber Length on Fatigue Failure Morphology...................
199
8.6
Summary..........................................................................................
203
CHAPTER 9 SUMMARY AND CONCLUSIONS
9.1
Summary……………......................................................................
204
9.2
Conclusions……………..................................................................
204
9.3
Future Scope……………................................................................
206
REFERENCES…………….....................................................................................
208
LIST OF PUBLICATIONS BASED ON THE RESEARCH WORK ………… 228
CURRICULUM VITAE.......................................................................................... 230
TH-978_06610302
i
Acknowledgements
I am deeply indebted to my thesis supervisor, Dr. S. Senthilvelan, for his valuable
guidance and steady encouragement throughout my Ph.D program. His constant
encouragement, enormous goodwill and unruffled patience made me work at ease and
kept me highly motivated throughout my stay with him. Starting from formulating the
problems to the final experimental results and their physical interpretations, he remained
profoundly involved in my thesis work. He provided me with innovative ideas, helpful
books and journals that were very helpful in successfully completing the present thesis. I
have immensely benefited from each and every moment of my association with him.
I would like to thank Prof. Debabrata Chakraborty, Prof. Sashindra K. Kakoty and
Dr. G. Pugazhenthi members of my Doctoral Committee who had steered me into the
right path by providing comments, ideas and sharing their expertise throughout my
tenure.
I thank the Head, Department of Mechanical Engineering, IIT Guwahati for providing
me all the necessary facilities and funding to carry out this research work.
I would like to express my sincere thanks to Prof. P. S. Robi and Dr. S. Kanagaraj for
their valuable discussions and suggestions during my experimental work.
I am also deeply indebted to Prof. Eng. R. Gnanamoorthy, Director, IIITDM, Chennai
for permitting me to avail the facilities in his laboratory. I thank Prof. R. M. Guedes
Department of Mechanical Engineering, University of Porto for helping in the
characterization of materials. I thank CIPET Guwahati for permitting me to avail the
facilities for my research work.
TH-978_06610302
ii
I would like to thank Dr. Deba Kr. Sarma and his teammates for helping me a lot during
the fabrication process in the workshop. I express my wholehearted gratitude to the
technical staff of Mechanical Engineering Department, Mr. Rituraj Saikia, Mr. Sanjib
Sarma, Mr. Jiten Basumatary, Mr. Pranjol Paul and Mr. Dhruba Jyoti Bordoloi for
their contribution and tireless help rendered throughout my research work.
I am sincerely thankful to Mr. Monash and Mr. Anto Pradeep for their kind help during
the course of experiments. Mr. V. Satheeshkumar needs a special mention for providing
valuable and timely help rendered during the research work. My heart felt thanks to my
research colleagues and friends Dr. Santhosh Kumar,
Dr. S.P. Laxmanan, M. Eswaran, D.A. Perumal, A. Satheesh, S. Anbarasu,
Ratnakar Das, P. Adaleesan and A. Ashok Kumar for their remarkable moral support
without which it would have been difficult for me to stay 3000 km far away from home.
I would like to express my gratitude to my parents Mr. S. Chithambaram Pillai and
Mrs. C. Maheswari for their patience, wishes and the enormous trust they repose in my
abilities at all times. I extend my heart full thanks to my wife Mrs. S. M. Janisha for her
patience and understanding during my tough times of research work.
I appreciate the warmth and motivation extended by my sister Mrs. C. Ambujam and
sister-in-law Mr. Dinesh. I thank my father-in-law Mr. S. Mathevan and mother-in- law
Mrs. J. Saraswathi for encouraging me to join the Ph.D program.
Above all I thank the Almighty who bestowed me this opportunity for acquiring a
research qualification.
C SUBRAMANIAN
TH-978_06610302
iii
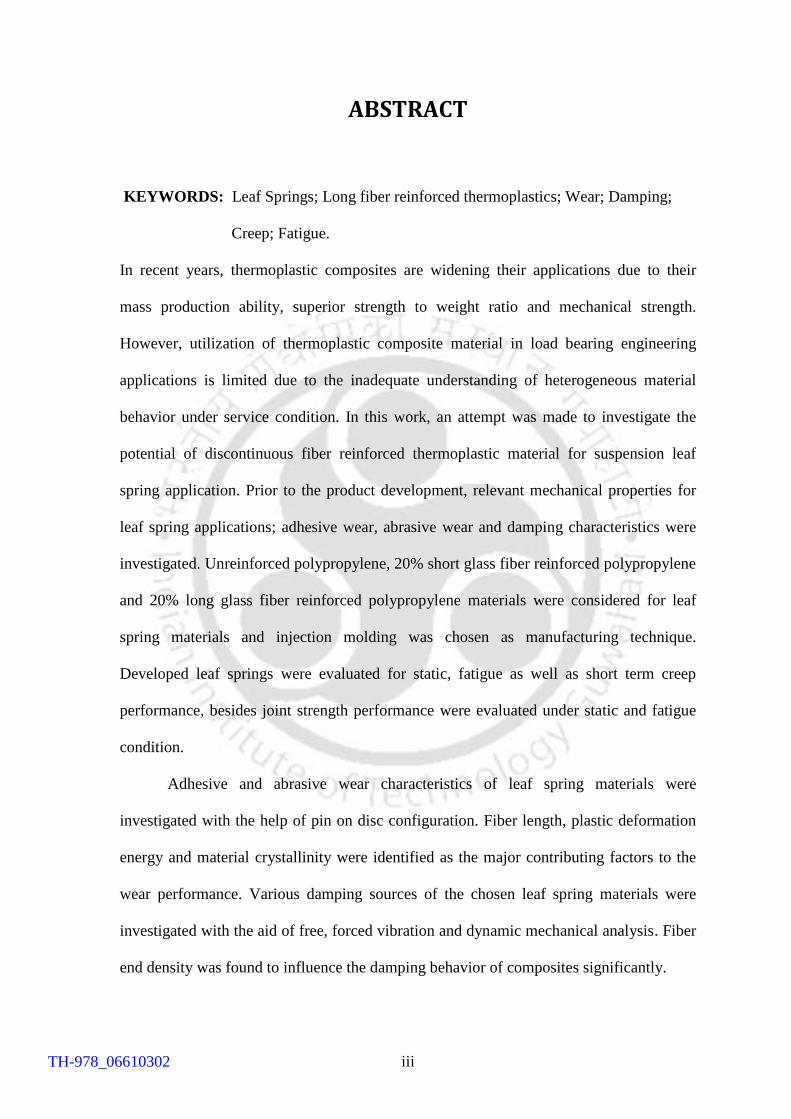
ABSTRACT
KEYWORDS: Leaf Springs; Long fiber reinforced thermoplastics; Wear; Damping;
Creep; Fatigue.
In recent years, thermoplastic composites are widening their applications due to their
mass production ability, superior strength to weight ratio and mechanical strength.
However, utilization of thermoplastic composite material in load bearing engineering
applications is limited due to the inadequate understanding of heterogeneous material
behavior under service condition. In this work, an attempt was made to investigate the
potential of discontinuous fiber reinforced thermoplastic material for suspension leaf
spring application. Prior to the product development, relevant mechanical properties for
leaf spring applications; adhesive wear, abrasive wear and damping characteristics were
investigated. Unreinforced polypropylene, 20% short glass fiber reinforced polypropylene
and 20% long glass fiber reinforced polypropylene materials were considered for leaf
spring materials and injection molding was chosen as manufacturing technique.
Developed leaf springs were evaluated for static, fatigue as well as short term creep
performance, besides joint strength performance were evaluated under static and fatigue
condition.
Adhesive and abrasive wear characteristics of leaf spring materials were
investigated with the help of pin on disc configuration. Fiber length, plastic deformation
energy and material crystallinity were identified as the major contributing factors to the
wear performance. Various damping sources of the chosen leaf spring materials were
investigated with the aid of free, forced vibration and dynamic mechanical analysis. Fiber
end density was found to influence the damping behavior of composites significantly.
TH-978_06610302
iv
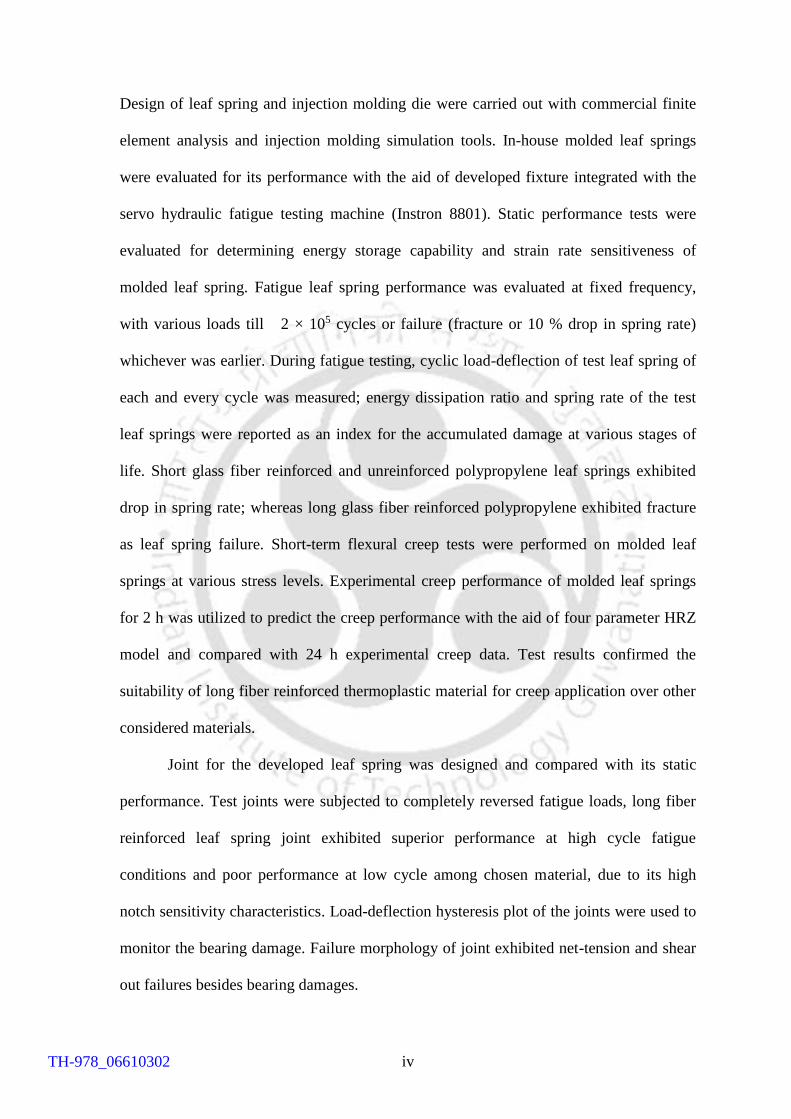
Design of leaf spring and injection molding die were carried out with commercial finite
element analysis and injection molding simulation tools. In-house molded leaf springs
were evaluated for its performance with the aid of developed fixture integrated with the
servo hydraulic fatigue testing machine (Instron 8801). Static performance tests were
evaluated for determining energy storage capability and strain rate sensitiveness of
molded leaf spring. Fatigue leaf spring performance was evaluated at fixed frequency,
with various loads till 2 × 10⁵ cycles or failure (fracture or 10 % drop in spring rate)
whichever was earlier. During fatigue testing, cyclic load-deflection of test leaf spring of
each and every cycle was measured; energy dissipation ratio and spring rate of the test
leaf springs were reported as an index for the accumulated damage at various stages of
life. Short glass fiber reinforced and unreinforced polypropylene leaf springs exhibited
drop in spring rate; whereas long glass fiber reinforced polypropylene exhibited fracture
as leaf spring failure. Short-term flexural creep tests were performed on molded leaf
springs at various stress levels. Experimental creep performance of molded leaf springs
for 2 h was utilized to predict the creep performance with the aid of four parameter HRZ
model and compared with 24 h experimental creep data. Test results confirmed the
suitability of long fiber reinforced thermoplastic material for creep application over other
considered materials.
Joint for the developed leaf spring was designed and compared with its static
performance. Test joints were subjected to completely reversed fatigue loads, long fiber
reinforced leaf spring joint exhibited superior performance at high cycle fatigue
conditions and poor performance at low cycle among chosen material, due to its high
notch sensitivity characteristics. Load-deflection hysteresis plot of the joints were used to
monitor the bearing damage. Failure morphology of joint exhibited net-tension and shear
out failures besides bearing damages.
TH-978_06610302

x
LIST OF TABLES
Table Title Page No.
3.1 Injection molding parameters for test specimens………………….. 36
3.2 Details of reinforcements and mechanical properties of test
materials…………………………………………………………….
37
4.1 Crystallite size for leaf spring materials……………………………
68
6.1 Properties of steel and polypropylene composites…………………
100
6.2 Optimal values of composite leaf spring at the axle seat…………..
104
6.3 Parameters of various F type profile mono leaf springs……………
108
6.4 Injection molding parameters for the leaf springs………………….
121
6.5 Volumetric shrinkage by 3-D Scanner and weight measurement….
124
7.1 Power law parameters for leaf spring………………………………
161
7.2 Comparison of HRZ model predicted strain and experimental
strain………………………………………………………………...
166
TH-978_06610302
xi
LIST OF FIGURES
Figure Title Page No.
3.1 Schematic of fibers in thermoplastic composite pellets (a) extruded
short fiber reinforced pellet and (b) pultruded long fiber reinforced
pellet………………………………………………………………...
36
3.2 Separated fibers from test materials (a) short fiber reinforced PP
and (b) long fiber reinforced PP…………………………………….
38
3.3 Fiber length distribution in long and short fiber reinforced
polypropylene……………………………………………………….
39
4.1 Coefficient of friction at (a) 19.62 N and (b) 29.43 N………………
43
4.2 Transfer layer formed on stainless steel at 29.43 N after sliding
distance of 3000m on the counter face due to sliding of (a) UFPP,
(b) SFPP and (c) LFPP……………………………………………...
44
4.3 Effect of fiber length on surface roughness………............................
45
4.4 Stress-strain curve of unreinforced and reinforced polypropylene….
47
4.5 SEM of fractured surface of short fiber reinforced polypropylene
test specimen showing more fiber pullout failure...............................
48
4.6 SEM of fractured surface of long fiber reinforced polypropylene
test specimen showing no fiber pullout failure...................................
49
4.7 Hardness of reinforced and unreinforced test specimens…...............
50
4.8 Effect of load on coefficient of friction of test materials…...............
51
4.9 Effect of PV on specific wear rate of test materials………………...
51
4.10 Topography of worn surface of long fiber reinforced PP at 29.43N 51
4.11 Topography of worn surface of short fiber reinforced PP at 29.43N
53
4.12 SEM of topography of worn surface of long fiber reinforced PP at
29.43N................................................................................................
54
TH-978_06610302

xii
4.13 SEM of topography of worn surface of unreinforced PP material at
29.43 N...............................................................................................
54
4.14 Wear volume at load of 9.81 N for 400 # grit size…….....................
57
4.15 Experimental setup for constant load indentation test (a) schematic
diagram (b) photograph view……......................................................
57
4.16 Load - deflection curves for test specimens at 250 N indentation
load…….............................................................................................
58
4.17 Plastic deformation energy as a function of fiber length……………
59
4.18 Relation between the wear volume and deformation energy..............
59
4.19 Clogging of abrasive grits for 400# at 9.81 N with (a) LFPP
(b) SFPP (c) UFPP.............................................................................
60
4.20 SEM of abrasive wear debris of (a) LFPP (b) SFPP (c) UFPP
against abrasive grit size of 400# at 9.81N………………………….
61
4.21 On-line abrasive wear volume of test materials at 9.81 N for 400#
abrasive grit........................................................................................
62
4.22 Effect of grit size on friction coefficient of test materials at
14.72 N (a) 400# (b) 320#.................................................................
63
4.23 Effect of grit size on abrasive wear volume at 9.81 N........................
64
4.24 Effect of load on wear volume of test materials at grit size of 320#
65
4.25 SEM of Worn out pin surface of UFPP against abrasive grit size of
400# showing (a) microploughing at 4.91 N (b) abrasive wear
debris at 4.91 N (c) microploughing region at 9.81 N and (d) wear
particles at 9.81 N..............................................................................
66
4.26 X-ray diffraction pattern for leaf spring materials..............................
68
4.27 SEM of Worn out pin surface of SFPP showing (a) smooth worn
out surface at 4.91N (b) groove formation at 4.91 N (c) micro
cracking at 9.81 N (d) micro cutting at 14.72 N (e) fiber pullout at
14.72 N and (f) matrix debris in 320# abrasive sheet at
14.72N................................................................................................
69
4.28 SEM of Worn out pin surface of LFPP showing (a) smooth surface
TH-978_06610302
xiii
at 4.91 N (b) wear debris in 320# abrasive sheet (c) fiber breakage
at 4.91 N (d) fiber breakage at 9.81N and (e) fiber breakage at
14.72 N...............................................................................................
71
5.1 Hysteretic loop of unreinforced and reinforced polypropylene..........
75
5.2 Schematic of fibers in a matrix for the same volume fraction
(a) short fiber reinforced polymer and (b) long fiber reinforced
polymer...............................................................................................
76
5.3 Schematic arrangement of experimental setup for free vibration
condition...............................................................................................
78
5.4 Decay curve of (a) unreinforced PP (b) short fiber reinforced PP
and (c) long fiber reinforced PP..........................................................
80
5.5a Schematic diagram of experimental setup for forced vibration
condition.............................................................................................
81
5.5b Experimental setup for forced vibration condition.............................
82
5.5c Close up view of test setup for forced vibration condition.................
82
5.6 Schematic of excitation force and its response...................................
83
5.7 FFT analyzer signal depicting the natural frequency for
(a) unreinforced (b) short fiber reinforced PP and (c) long fiber
reinforced PP......................................................................................
84-85
5.8 Phase lag plot between excited force and its response for
(a) unreinforced PP (b) short fiber reinforced PP and (c) long fiber
reinforced PP......................................................................................
85-86
5.9 Phase lag between excited force and its response of the test
specimens............................................................................................
87
5.10a Storage modulus of leaf spring materials at various temperature…... 89
5.10b Loss modulus of leaf spring materials at various temperature...........
89
5.11 Effect of frequency on storage modulus for leaf spring materials......
90
5.12 Loss factor for leaf spring materials under (a) various frequencies
(b) various temperature.......................................................................
91
5.13 Hysteretic heating of unreinforced and reinforced polypropylene
TH-978_06610302
xiv
specimens during fatigue....................................................................
94
5.14 Load drop during constant deflection mode for unreinforced and
reinforced polypropylene specimens..................................................
95
6.1 Specific strain energy of the leaf spring materials..............................
100
6.2 Optimization results for (a) leaf spring width and thickness at the
center (b) leaf spring weight...............................................................
103-104
6.3
Schematic loading condition of a typical symmetric leaf spring........ 106
6.4 Meshed model of typical symmetric leaf spring.................................
106
6.5 Bending stress plot of various leaf spring configurations.................. 107
6.6 Convergence test results for stress and deflection for the proposed
model..................................................................................................
109
6.7a
Bending stress contour of the proposed model................................... 110
6.7b Deflection contour of the proposed model.........................................
110
6.8 Geometry of injection molded leaf spring..........................................
111
6.9 Fusion meshed model of leaf spring with triangular elements...........
113
6.10 Best gate location analysis..................................................................
114
6.11 Melt flow in unreinforced leaf spring with pointed gate....................
114
6.12 Influence of reinforcement on volumetric shrinkage
(a) unreinforced polypropylene leaf spring and (b) 20 % glass fiber
reinforced polypropylene leaf spring..................................................
116
6.13 Influence of fiber reinforcement on warpage deflection
(a) unreinforced polypropylene leaf spring and (b) 20 % glass fiber
reinforced polypropylene leaf spring..................................................
118
6.14 Model showing the details of the die developed................................ 119
6.15a Photograph of the developed die........................................................
120
6.15b Photograph of the developed leaf springs...........................................
120
6.16a Schematic of the scanning process..................................................... 122
TH-978_06610302
xv
6.16b Close-up view of the 3-D scanner with leaf spring............................
123
6.17 Scanned model of leaf spring............................................................
123
6.18a View of servo hydraulic fatigue testing machine..............................
125
6.18b Close up view of fixture with leaf spring...........................................
126
6.19 Load - deflection curve for glass fiber reinforced and unreinforced
leaf springs.........................................................................................
128
6.20 Effect of strain rate on reinforced and unreinforced leaf spring........
129
6.21 Effect of fiber reinforcement on energy absorbed by thermoplastic
leaf springs.........................................................................................
130
6.22 a Loading-unloading curve for molded long fiber reinforced leaf
springs................................................................................................
132
6.22b Hysteretic component of molded leaf springs...................................
132
6.23 Influence of fiber length on load relaxation behavior in
thermoplastic leaf springs..................................................................
133
7.1 Schematic representation of hysteretic curve obtained from fatigue
testing of leaf spring..........................................................................
138
7.2a Cyclic load-deflection curve for unreinforced leaf spring at Pmax.....
139
7.2b Cyclic load-deflection curve for short glass fiber reinforced
leaf spring at Pmax .............................................................................
139
7.2c Cyclic load-deflection curve for long glass fiber reinforced leaf
spring at Pmax.....................................................................................
140
7.3 Cyclic load-deflection curve for long glass fiber reinforced leaf
spring at (a) 0.8 Pmax (b) 0.9 Pmax (c) 1.2Pmax....................................
140-141
7.4 Spring rate reduction in reinforced and unreinforced leaf springs for
(a) Pmax and 0.8Pmax (b) 0.9Pmax...................................................
144
7.5 Fatigue stress - life curve of reinforced and unreinforced leaf
springs................................................................................................
146
TH-978_06610302
xvi
7.6 Failure morphology of long fiber reinforced leaf spring
(a) schematic cracks on the tensile surface (b) cracks in the
direction transverse to the leaf spring length (c) cracks on the leaf
spring (d) crazing on the leaf spring..................................................
147
7.7 Schematic of the investigated fractured surface of leaf spring..........
148
7.8a Failure morphology of LFLS at 33.5MPa indicating ductile and
brittle failure feature..........................................................................
149
7.8b Failure morphology of LFLS at 45 MPa indicating ductile and
brittle failure feature..........................................................................
149
7.9a Failure morphology of LFLS at 33.5MPa showing completely
ductile failure feature (Area corresponding to tensile stress)............
150
7.9b Failure morphology of LFLS at 33.5MPa showing completely
brittle failure feature ( Area corresponding to compressive stress)...
150
7.10 Predicted fiber orientation for the molded short glass fiber leaf
spring................................................................................................
152
7.11 SEM of fractured surface of long glass fiber reinforced leaf spring
showing fiber alignment....................................................................
152
7.12 Experimental creep performance of molded test leaf springs at Pmax
157
7.13 Spring rate performance of molded test leaf springs.........................
158
7.14a Short-term experimental creep performance of LFLS......................
159
7.14b Short-term experimental creep performance of SFLS.......................
160
7.14c Short-term experimental creep performance of UFLS......................
160
7.15 Variation of power law coefficient over leaf spring stress................
162
7.16 Variation of power law exponent over leaf spring stress..................
163
7.17a Experimental and predicted creep performance of LFLS.................
164
7.17b Experimental and predicted creep performance of SFLS..................
164
7.17c Experimental and predicted creep performance of UFLS.................
165
8.1 Geometry of molded leaf spring and the proposed joint (a) front
TH-978_06610302

xvii
view indicating straight portion (marked) (b) sectioned flat portion..
171
8.2 Finite element model of the proposed joint (a) boundary condition
and loading position of the composite plate (b) fine radial mesh
near the hole........................................................................................
172
8.3 Major types of joint failure (a) net-tension failure (b) shear-out
failure (c) bearing failure....................................................................
173
8.4 Influence of design parameter over bearing strength and failure
modes..................................................................................................
174
8.5 Failure modes on the end joint (a) cleavage failure at E = 4 mm
M=10 mm (b) cleavage failure at E = 4 mm M =18 mm (c) net -
tension failure at E = 7 mm M =10 mm (d) net -tension failure at
E = 7 mm M =18 mm.........................................................................
176
8. 6 Geometry of flat end portion of molded leaf spring for the joint
strength evaluation...............................................................................
177
8.7 Experimental test setup to evaluate the performance of bolted end
joint of leaf spring end (a) schematic figure (b) view of fixture
holding leaf spring end and steel plate...............................................
178
8.8 Schematic end joint load-deflection hysteresis plot during
fatigue.................................................................................................
180
8.9 Bearing stress -strain curve of test joints............................................
181
8.10 Failure morphology of leaf spring joint (a) bearing damage along
with net tension failure for SFLS (b) hole extension indicating
bearing damage for LFLS (c) net tension failure in LFLS (d)
whitening region in UFLS (e) matrix failure along with fiber
breakage in SFLS................................................................................
183
8. 11 Bearing surface of the leaf spring end................................................
185
8.12 Failure morphology of (a-b) fractured bearing surface of SFLS (c-
d) fractured bearing surface of LFLS (e) fractured surface of the
SFLS tensile specimen (f) flat fractured surface of the LFLS tensile
specimen.............................................................................................
186
8.13 Load -deflection curve of tested joint with various fits......................
187
8.14 Influence of bolt-hole clearance of the tested joint on bearing
strength...............................................................................................
188
TH-978_06610302
xviii
8.15 Joint failure morphology of bolt-hole fits (a) -20µm (b) 200
µm (c) 400 µm (d) 600 µm…….........................................................
189
8.16 Bearing stress-life curve of test joints for completely reversed
loading condition...............................................................................
190
8.17 Load-deflection curve of notched and unnotched curve for the leaf
spring joint materials.........................................................................
191
8.18 (a-d) Load-deflection hysteresis loop of UFLS joint at an alternating
stress of 28 MPa corresponding to 60% ultimate bearing strength…
194
8.19 (a-d) Load-deflection hysteresis loop of SFLS joint at an alternating
stress of 19.7 MPa corresponding to 45% ultimate bearing strength
195
8.20 (a-d) Load-deflection hysteresis loop of LFLS joint at an alternating
stress of 27.5 MPa corresponding to 45% ultimate bearing strength
196
8. 21a Hole extension of UFLS joint.............................................................
197
8.21b Hole extension of SFLS joint.............................................................
198
8.21c Hole extension of LFLS joint.............................................................
198
8.22 Fatigue failure morphology of test joint at various bearing stress
(a) net-tension failure in LFLS at 30.7MPa (b) net-tension failure in
LFLS at 21.5 MPa (c) net-tension failure of UFLS at 45MPa
(d) shear-out failure of UFLS at 28MPa (e) shear-out failure of
SFLS at 30.7 MPa...............................................................................
200
8.23 Bearing surface failure morphology of test joint during fatigue
(a) matrix fibrillation along with wear debris of SFLS joint at
alternating stress of 19.7 MPa (b) excessive matrix fibrillation of
SFLS joint at alternating stress of 26.3 MPa (c-d) absence of matrix
stretching in LFLS at alternating stress of 24.5 MPa (e) failure
surface at 45% UTS of SFLS tensile specimen (f) failure surface at
60% UTS of SFLS tensile specimen..................................................
202
TH-978_06610302

xix
ABBREVIATIONS
ASTM American Society for Testing and Materials
B Bearing
C Cleavage
FFT Fast Fourier Transform
FLD Fiber Length Distribution
HMWPE High Molecular Weight Polyethylene
ISO International Organization for Standardization
LFLS Long Fiber Reinforced Leaf Spring
LFPP Long Glass Reinforced Polypropylene
LFRT Long Fiber Reinforced Thermoplastics
NT Net-Tension
PA Polyamide
PC Polycarbonate
PE Polyethylene
PEEK Polyether ether ketone
PMMA Polymethylmethacrylate
POM Polyoxymethylene
PP Polypropylene
PPE Propylene-co-Ethylene
PPS Polypropylene Sulfide
PTFE Polytetrafluoroethylene
TH-978_06610302
xx
RH Relative Humidity
SAE Society of Automotive Engineering
SFLS Short Fiber Reinforced Leaf Spring
SFPP Short Glass Reinforced Polypropylene
STL Stereolithographic
UFLS Unreinforced Leaf Spring
UFPP Unreinforced Polypropylene
UHMWPE Ultrahigh Molecular Weight Polyethylene
TH-978_06610302

xxi
NOTATIONS
English Symbols
A Amplitude ratio
a, b ,c , e Curve fitting parameters
bc Width at the center
bw Full width at half maximum
d Hole diameter
dp Pin diameter
E Modulus of elasticity
Edef Deformation energy
Fi Number of fiber count
H Hardness of the material
Hc Energy dissipation ratio
ho Change in pin length
J (t) Creep Compliance
K Spring rate
Kc Unit cell geometry dependent constant
Kd Wear volume dimension loss
Km Wear volume mass loss
Kw Specific wear rate
Ko Initial spring rate
TH-978_06610302

xxii
Ks Strength reduction factor
Kt Theoretical/elastic stress concentration factor
L Length of the spring
Lc Crystallite size
Le Effective length of the spring
Ln Number average length of fiber
Lw Weight average length of fiber
m Fatigue sensitivity parameter
m1 Specimen mass before testing
m2 Specimen mass before after testing
n Power law exponent
Nf Total number of cycles prior to failure.
P Normal load
Q Notch sensitivity factor
R stress ratio
R2 Correlation index
Ra Average surface roughness
S Sliding distance
Sb Leaf spring bending stress
Se Specific elastic strain energy
So Static strength
t Thickness of leaf spring
T Time period for one cycle
TH-978_06610302
xxiii
tan δ Loss factor
tl Time lag between exciting forcing and response
tp Thickness of the composite plate
V Wear rate
Wb Weight of the beam
X1 Vibration amplitude of the first cycle
Xn Vibration amplitude after nth cycle is
Y Deflection
Greek Symbols
e Elongation to break
ω Forced exciting frequency
nω Natural frequency
ξ Damping factor
ε(t) Time dependent strain
'
tε Power law coefficient
Phase lag
Density of the material
Logarithmic decrement
δ (t) Deflection at instantaneous time
δi Fastener translation at initial cycle
δN Fastener translation after Nf fatigue cycle
TH-978_06610302

xxiv
ΔN Hole elongation
δp Fastener/pin displacement
θ Incident angle
λ Wavelength of X-ray beam
μ Coefficient of friction
ξb Bearing strain
ρ Density of the material
ρg Specific gravity of the specimen
σ Applied stress level
σb Bearing stress
σt Tensile stress at break
σu Ultimate strength
TH-978_06610302
Chapter 1 Introduction
1
CHAPTER 1
INTRODUCTION
1.1 OVERVIEW ON COMPOSITE LEAF SPRINGS
Leaf springs are used in automobiles as suspension system to isolate shocks and
vibrations transmitted due to the undulation in road conditions to the vehicle in
service. Due to the superior performance of specific strain energy, damping and
corrosion resistance of composite materials over steel, composite leaf springs are
being widely used in light weight vehicles, passenger cars, heavy tank trailer
suspension systems and in vibrating machineries (Beardmore, 1986; Morris, 1986;
Sancaktar and Gratton, 1999; Qureshi, 2001; Rajendran and Vijayarangan, 2001; Hou
et al., 2005). Composite leaf springs are manufactured by any of the following
techniques; filament winding, compression molding, pultrusion and hand lay-up
vacuum bag process. Filament winding process provides excellent mechanical
properties due to utilization of continuous fibers. However, leaf springs with varying
thickness and varying contours constrained the higher degree of design flexibility
(Qureshi, 2001). Leaf springs of various shapes and sizes can be produced by
compression molding; however, manufacturing time involved in compression
molding limits the mass production capability (Mallick, 1997). Hand lay-up vacuum
bag process involves high level of skills for mixing and control of resin contents
which also limit the mass production features of composite leaf springs (Crawford,
1997). Epoxy, polyester and polyimide resins were used for the fabrication of
composite leaf spring in the past. Unidirectional E-glass, S-glass and carbon fibers
were being used as the reinforcement for leaf springs. The optimal combination of
TH-978_06610302
Chapter 1 Introduction
2
cost and performance for E-glass fibers provides better potential for commercial leaf
spring applications over S-glass and carbon fibers. In the matrix resins, polyester
dominates over epoxy resins on the basis of cost and ease of processability
(Beardmore and Johnson, 1986). In short, the major limitations of thermoset
composite leaf springs are limited production capability.
Hence there is a need to identify new material and manufacturing technique
for the composite leaf spring. In the recent years, thermoplastic composite materials
are replacing steel and thermoset composite materials due to its low manufacturing
cost combined with mass production capability (Deaver and Mcllvaine, 2005; Bartus
et al., 2006; Noh et al., 2006; Ning et al., 2007). Due to the mass production
requirement in the automotive industries, discontinuous long fiber reinforced
thermoplastics (LFRT) have shown significant role in replacing metals, short fiber
reinforced thermoplastics, thermoset sheet molding and bulk molding composites
(Markarian, 2005). The major difference between short fiber reinforced
thermoplastics and LFRT lies in the manufacturing technique. Short fiber reinforced
thermoplastic pellets are manufactured by extrusion technique where fibers within
pellets are randomly oriented. However due to the pultrusion technique, fibers are
well aligned within the pellets of long fiber reinforced thermoplastics (LFRT).
Increased length and fiber orientation within pellets help to increase the modulus and
strength of the material as high as 90% of that obtained when using continuous fibers
(Thomason et al., 2002). The matrices commonly used in engineering application
include polypropylene (PP), polyethylene (PE), polyamide (PA) polyether ether
ketone (PEEK) etc. (Thomason and Vlug, 1995) due to their superior structural
properties. Polypropylene matrix is generally used with E-glass fibers for structural
applications due to its cost/performance ratio and ease of processing (Bartus et. al.,
TH-978_06610302
Chapter 1 Introduction
3
2006). The potential for high volume processing combined with high levels of end use
and its associated lower manufacturing costs have spurred the current expansion of
research activities with polypropylene composites (Thomason, 2002).
1.2 MOTIVATION
In the recent years, long fiber reinforced thermoplastic material are being used
extensively in mass transit industrial components which includes; dashboard carriers,
front ends, seat shells, battery trays, spare wheel dwells, running boards (Krause et.
al., 2003; Bartus et. al., 2006; Thattaiparthasarathy et. al., 2008). In this direction, due
to its mass production capability and good endurance strength, the present
investigation attempted to recognize and evaluate injection mouldable discontinuous
fiber reinforced thermoplastic material for suspension leaf spring application.
Utilization of new materials and manufacturing processes for the functionally
critical machine elements necessitates complete systematic understanding of required
relevant mechanical properties of the new materials under the service condition. Due
to the inadequate available data of the discontinuous fiber reinforced thermoplastics
for load bearing application, critical properties for the leaf spring application were
investigated for the chosen materials.
In the automobile suspension system, spring ends are bent to form eye through
which leaf spring is fixed to the automobile body by the bolts. Since leaf springs
experience contact load while in service condition, understanding friction and wear
behavior of the leaf spring material under adhesive and abrasive mode with steel
material becomes important. Predominant wear occurs through adhesive and abrasive
modes (ASM Handbook, 1988; Karger-Kocsis et al., 2010). In adhesive wear mode,
the surface energy and shear strength significantly influences the wear mechanism,
TH-978_06610302

Chapter 1 Introduction
4
while in an abrasive wear mode, the toughness and hardness plays a major role
(Bayer, 1994).
The inherent damping characteristic of thermoplastic materials aids to be an
excellent alternative material over steel and thermoset material for leaf spring
application. However, incorporation of discontinuous fibers in the thermoplastic
material may significantly influence the damping characteristics of material. Increase
in fiber volume fraction increases the storage and loss modulus and reduces the
damping behavior of thermoplastic composites (Crema et al., 1989; Wray et. al.,
1990; Rezaei et al., 2009). As the main function of leaf spring in the automobile is to
absorb shock and vibration, damping performance of the chosen leaf spring materials
was investigated in detail. Due to the viscoelastic nature of the chosen thermoplastic
leaf spring material, comprehensive understanding of time and temperature dependent
mechanical properties is of practical importance.
Some of the major design parameters that decide energy storage capacity of
the leaf springs are material and shape (Yu and Kim, 1988). Various forms of leaf
springs as suggested by SAE standards were considered and their structural behaviors
were predicted using commercial finite element analysis tool. Thermoplastic
composite material properties are time dependent due to the viscoelastic behavior
(Rosato et. al., 2000). Since suspension leaf springs are subjected to time varying
load, performance evaluation of leaf spring at various strain rates becomes crucial.
Less hysteresis is generally preferred for leaf springs at service conditions (Yu and
Kim, 1988). Presence of discontinuous fibers may alter the material and leaf spring
performance, thus static performance of leaf springs viz. load carrying capability,
strain rate sensitivity and hysteretic behavior need to be investigated in details.
Suspension leaf springs are subjected to repetitive cyclic loads while the vehicle is in
TH-978_06610302
Chapter 1 Introduction
5
operation, thus identifying safe operating regime under fatigue condition is one of the
major requirements. Apart from the composite endurance strength, accumulated
damage in the form of stiffness loss and energy dissipation should also be addressed
(Orth et al., 1993). Presence of discontinuous fibers in a matrix contributes to the
microscopic stress concentrations at fiber ends and fiber/matrix interface which
significantly alters the fatigue behavior (Bureau and Denault, 2004; Bernasconi et al.,
2007). Hence the failure mechanism and damage progression for the developed
product is to be clearly understood.
In the service conditions, suspension leaf springs are subjected to constant
stress for long duration as the chassis weight is taken by the suspension system.
Besides, leaf springs are also subjected to various stress levels due to the different
payload conditions. Thus, creep response investigation of leaf springs made of new
material and process is important.
Successful utilization of composite leaf spring lies equally important on the
joint performance. Leaf spring should have appropriate joints so that it can be fixed
to the axle and the vehicle body to provide a reliable suspension system. The joint
strength should have sufficient strength in view of the design load of leaf spring (Yu
and Kim, 1988). Bolted joints are preferred for effective end joint over adhesive joint
owing to low cost and simplicity in manufacturing (Shokreih and Rezaei, 2003).
However, the potential site of stress concentration due to drilling in the joint region
determines the strength of a structure. Hence there is a need to identify the joint
strength and identify the safe operating regime under fatigue loading conditions.
In a summary an ideal leaf spring should possess the following requirements
TH-978_06610302

Chapter 1 Introduction
6
Leaf springs are subjected to contact loads at the ends as well as middle portion,
hence wear resistance under adhesive and abrasive condition is one the
requirement of leaf spring material.
Amount of energy storage and release would determine the quality of the
suspension system; hence the damping performance of leaf spring material is
important.
Spring rate and static deflection of leaf springs significantly affect the suspension
quality; hence load deflection characteristics need to be evaluated.
Suspension leaf springs are subjected to repetitive fluctuating loads under service
conditions hence developed leaf springs must have fatigue resistance.
Leaf springs are subjected to constant stress for long duration as the chassis
weight is taken by the suspension system and hence an ideal leaf spring must have
creep resistance.
Developed leaf springs should be fastened with automobile body, hence joint
performance under static and fatigue conditions are important.
1.3 OBJECTIVE
The main objective of the present work is to recognize and evaluate injection
moldable discontinuous long fiber reinforced thermoplastic material for leaf spring
application.
1.3.1 Major Steps Accomplished to Achieve Objectives
Following major activities were carried out to achieve the above said main objectives
Friction and wear behavior of leaf spring materials under adhesive and abrasive
modes were investigated using standard pin-on disc configuration.
TH-978_06610302

Chapter 1 Introduction
7
Damping performance of the leaf spring materials were evaluated with the aid of
dynamic mechanical analysis besides free and forced vibration experiments.
Varying width, constant thickness mono leaf spring geometry was designed with
the aid of commercial finite element analysis software, ANSYS®. Die for injection
molding was designed and analyzed using commercial plastic part manufacturing
software, MOLDFLOW®.
Injection molding die was fabricated and leaf springs were injection molded using
chosen materials in the laboratory.
Static, fatigue and short term creep performance of the molded test leaf springs
were evaluated with the aid of in-house developed fixture integrated with servo
hydraulic fatigue testing facility.
Leaf spring end joint was designed with aid of commercial finite element analysis
software, ANSYS®. Designed joints were evaluated experimentally under static
and fatigue conditions with the aid of developed fixture integrated with servo
hydraulic testing facility.
1.4 ORGANISATION OF THE THESIS
First chapter briefly discusses the motivation of the present work which includes
limitation of thermoset composite leaf spring, need for new class of material and
manufacturing technique for leaf spring. Methodology adopted to achieve major
objectives of the present work is outlined in this chapter.
Literature review on wear, damping, fatigue and creep performance of chosen class of
leaf spring materials and thermoplastic composites were discussed in the second
TH-978_06610302
Chapter 1 Introduction
8
chapter. Prior works related to design; manufacturing and evaluation of thermoset
composite leaf springs are also discussed in this chapter.
Third chapter discussed the materials used for developing thermoplastic leaf springs
and test specimens. Efforts carried out to determine the fiber length distribution is also
highlighted in this chapter.
Experimental friction and wear performance of discontinuous fiber reinforced leaf
spring materials under adhesive and abrasive modes is discussed in chapter four.
Fifth chapter reported various damping sources of leaf spring material with various
experimental techniques; free vibration, forced vibration, dynamic mechanical
analysis. Correlation of hysteretic heating with material damping is also reported in
this chapter.
Design of leaf spring as per society of Automotive Engineering (SAE) standards and
finite element analysis are discussed in chapter six. Computer aided simulation results
of leaf spring manufacturing and manufacturing details of die and leaf spring are
included in this chapter. Preliminary static performance of developed leaf spring with
the aid of developed fixture is also reported in this chapter.
Fatigue performance along with the failure morphology of test leaf spring is presented
in chapter seven. Damage progression during service with the aid of cyclic load-
deflection plot is also discussed. Chapter seven also presented short term flexural
creep performance of test leaf springs.
Chapter eight presented static and fatigue performance of leaf spring end joint.
Influence of clearance and notch on joint performance is also reported along with the
failure mechanisms.
TH-978_06610302

Chapter 1 Introduction
9
Major conclusions drawn from the present work and scope for the future work are
outlined in the last chapter.
TH-978_06610302
Chapter 2 Literature survey
10
CHAPTER 2
LITERATURE SURVEY
2.1 INTRODUCTION
Research and development of thermoset composite leaf springs progressed
significantly for the past three decades. Present work attempted to identify the scope
of using thermoplastic composite material for leaf spring application. Since there is a
need to review the prior work to understand the relevant mechanical behaviors of
thermoplastic composite for leaf spring applications; adhesive wear, abrasive wear,
damping, static, fatigue and creep behavior of thermoplastic materials were presented
in this chapter. In the present work, long fiber reinforced thermoplastic material is
considered for leaf spring, hence its various engineering application was also dealt in
the chapter. This chapter also presented prior work on metallic and thermoset
composite leaf spring to understand the methodology followed in design,
manufacturing and performance evaluation. Joint performance is one of the crucial
issues in the composite part performance evaluation of leaf springs for the structural
application; hence prior work on joint design and performance evaluation of polymer
composites is also presented in this chapter.
2.2 CHARACTERIZATION OF THERMOPLASTIC COMPOSITES
2.2.1 Adhesive Wear Characteristics
Relative motion between the mating surface and fracture of adhesive bonded junction
contributes to the adhesive wear (Clerico and Patierno, 1979).
TH-978_06610302
Chapter 2 Literature survey
11
In contact applications, low friction coefficient, self lubrication, good chemical
resistance of polymers provides a greater scope over metals (Throp, 1982). The major
parameters that affect the sliding wear characteristics of polymers are normal load,
sliding velocity, counter face roughness, surface energy, temperature, molecular
orientation of the polymers and viscoelastic nature of polymer (Stachowiak and
Batchelor, 2001).
Formation of transfer film on the metal counter face influences the coefficient
of friction to a greater extent (Owei and Schipper, 1991). Higher sliding speed and
normal load resulted in higher wear rate due to the formation of thicker molten film in
ultrahigh molecular weight polyethylene (UHMWPE) (Barrett et al., 1992). Bahadur
(2000) visualized that the formation of transfer layer in polytetrafluoroethylene
(PTFE) on the counter face reduced the friction and wear characteristics of the
polymer and reported that wear performance depends on the stability of transfer film.
Mergler et al. (2004) investigated the adhesive wear of polyoxymethylene (POM) and
reported that the formation of transfer layer is due to mechanical interlocking of
polymer material and metal asperities.
Addition of glass and carbon fibers significantly enhances the wear resistance
of polymers (Clerico and Patierno, 1979; Palabiyik and Bahadur, 2002; Unal et al.,
2004). Bahadur and Polineni (1996) visualised the fluctuations of friction coefficient
with respect to sliding distance for glass fabric-reinforced polyamide composites and
reported the influence of changing conditions at the interface caused by periodic
ploughing and rolling action of debris. The wear behaviour of short fiber-reinforced
composites is dominated by the process of fiber peeling-off (Voss and Friedrich,
1987). Zhang et al. (2000) studied the influence of fiber length on glass fiber-epoxy
composites and reported the enhanced ability of longer fibers to avoid fiber peeling.
TH-978_06610302
Chapter 2 Literature survey
12
Zhang et al. (2006) investigated the effect of fiber length on tribological properties of
short carbon fiber reinforced epoxy composites and confirmed that longer fiber
composite possessed better resistance than shorter fiber thermoset composites.
Mathew et al. (2007) conducted wear tests on a reciprocating sliding test rig with ball-
on-plate configuration for four types of directionally oriented warp knit glass
performs with polyester, vinylester and epoxy resin and reported the enhanced wear
resistance of epoxy resin compared to counterparts. Mathew et al. (2009) have studied
the effect of sliding frequency on the reciprocating sliding wear behavior of 3D-
plywoven interlocked structures with varying interlacement for nylon fiber/polyester
resin composites and identified the best composite based on the arrangement of
interlacement
2.2.2 Abrasive Wear Characteristics
Abrasive wear is the material loss due to the passage of hard material over the soft
surface. Abrasive wear process in polymers involves dissipation of frictional work
and its resultant damage is relatively larger volume than adhesive wear (Briscoe,
1981). Mechanical properties; hardness and material crystallinity found to improve
the abrasive wear resistance (Briscoe and Evans, 1989). Arnold et al. (1991)
investigated the importance of interfacial adhesion to improve the wear resistance of
glass filled rubber. Helen et al. (1996) investigated the influence of crystallinity over
wear resistance of nylon matrix. Experimental observations revealed that higher
percentage of crystallinity in the polyamide matrix due to optimized cooling history
provided higher wear resistance and higher scratch coefficient. Due to repeated
passage of pin over the same wear track, the wear debris formed accumulates between
the spaces between the abrasive grits (Rabinowicz, 1995).
TH-978_06610302
Chapter 2 Literature survey
13
Abrasive wear of reinforced polymers is influenced by the matrix, reinforcement and
the operating parameters; load, velocity and abrasive grit size (Harsha and Tiwari,
2002). Harsha and Tewari (2003) found that the specific wear rate of
polyaryletherketone composites under multi pass condition was less than that of
single pass condition and identified the influence of counter face modification under
multi pass abrasive condition. Clogging of abrasive grits depends upon the wear
debris size and also the abrasive grit size for nylon clay composites (Srinath and
Gnanamoorthy, 2006).
2.2.2.1 Influence of Fiber Reinforcement on Abrasive Wear
The abrasive wear behavior of PEEK/polypropylene sulfide (PPS) blended
thermoplastic polymer reinforced with short carbon and glass fiber was investigated
by Lhymn et al. (1985) and reported that the wear rate was sensitive to the orientation
of the fiber axis with respect to the sliding direction. Cirino et al. (1987) studied the
abrasive wear behavior of unidirectional continuous glass fiber and focused the effect
of operating variables on the polymer matrices. Sole and Ball (1996) reported that the
addition of mineral fillers to the polypropylene matrix decreased the wear resistance
during the single pass abrasive wear test. It was also found that the shape and size of
the reinforcing filler influences the wear performance under abrasive wear condition.
McGee et al. (1997) investigated the importance of fiber matrix adhesion in reducing
the abrasive wear resistance in the graphite filled nylon matrix configuration.
Bijwe et al. (2001) reported that the addition of glass, aramid and carbon
fibers in polyetherimide composites improved the abrasive wear characteristics and
reported the influence of operating parameters on abrasive wear resistance. Barkoula
and Karger (2002) investigated the erosive wear of polypropylene reinforced with
TH-978_06610302
Chapter 2 Literature survey
14
glass fibers with length of 2 and 10 mm and reported fiber length did not affect the
erosive wear at high impact angle. Tong et al. (2006) reported the influence of aspect
ratio on wear resistance; with the addition of wollastonite fibers with a large aspect
ratio, the abrasive wear resistance was improved by hindering the easy removal of
fibers from high molecular weight polyethylene (HMWPE) matrix. Suresha et al.
(2007) investigated the worn out surface of carbon epoxy and glass epoxy composites
using scanning electron microscope and visualized the breakage of more glass fibers
compared to carbon fiber due to improved interfacial adhesion between epoxy and
carbon fiber. Kanagaraj et al. (2010) observed the decrease in wear coefficient and
wear volume with the addition of carbon nano tubes in ultrahigh molecular weight
polyethylene (UHMWPE) polymer and reported that wear volume increases with the
sliding distance.
2.2.3 Damping Characteristics of Thermoplastic Composites
Discontinuous fibers in the composite material alter damping characteristics owing to
the presence of fiber-matrix interfacial bond, voids and stress concentrations around
fiber ends (Nelson and Hancock, 1978; Kenny and Marchetti, 1995; Chandra et al.,
1999). Damping behavior of short glass and boron fiber epoxy composite material
was high compared to continuous fiber material for the same volume fraction of fibers
due to high stress concentration near the fiber tips and friction loss due to fiber matrix
interface (Hashin,1970). Damping characteristics of short steel fiber reinforced silicon
rubber was carried out with both bonded and unbonded fiber/matrix interfaces by
Nelson (1976). It was observed that the influence of interfacial slip in unbonded
material was more pronounced in affecting the damping and stiffness of the
composite. Gupta et al. (1990) identified various sources of energy absorbing
TH-978_06610302
Chapter 2 Literature survey
15
mechanisms in short glass fiber reinforced polypropylene from tensile test due to
plastic deformation of the matrix, de bonding and fiber pull-out. Interfacial strength in
fiber reinforced thermoplastics alters the damping values to a greater extent
(Carwalho and Bretas, 1990; Kubat et al., 1990). High shear stress at the end of the
fiber with a bonded interface found to be most viable mechanism for increased
damping (Chandra et al., 1999). Gassan and Bledzki (2000) investigated jute fiber
reinforced polypropylene and reported that the influence of fiber matrix adhesion
plays a vital role on dynamic modulus and specific damping capacity. Adams and
Maheri (2003) proposed a model to understand the basic damping mechanisms of
laminated composite plates, in which the damping capacity for various fiber
orientations was estimated and compared with experimental results. Understanding
the interaction between fatigue damage and damping is necessary to improve the
composite microstructure (Kultural and Eryurek, 2007).
2.2.3.1 Damping Evaluation through Free and Forced Vibrations
Free vibrations characteristic of visco-elastic materials were evaluated through
Fourier analysis (Ruland, 1984). Saurez et al. (1986) reported the influence of fiber
length on the damping characteristics of discontinuous aramid and boron fiber
reinforced epoxy laminates and observed that composite with low fiber aspect ratios
exhibited good damping behavior. Hadi and Ashton (1986) investigated the influence
of fiber orientation on the damping properties of glass epoxy material through flexural
resonance method at various frequencies and reported the increase in loss factor with
the decrease in fiber volume fraction. Crema et al. (1989) evaluated damping
coefficient by exciting a cantilever specimen made of short glass fiber reinforced
thermoplastics with different fiber orientations and experimental results were
TH-978_06610302
Chapter 2 Literature survey
16
compared with classical models. Wray et al. (1990) investigated the influence of fiber
orientations and volume fractions towards logarithmic decrement for short glass fiber
reinforced polypropylene. A reduction of logarithmic decrement with increased
storage and loss modulus with increase in fiber volume fraction was observed. Lee et
al. (1994) investigated the dynamic characteristics of carbon fiber reinforced
polyether-ether-ketone through flexural and torsional vibration tests; measured natural
frequency and specific damping capacity were compared with finite element analysis
results. Gu et al. (2000) used vibration damping technique for evaluating the
properties in the interfacial region and observed an inverse relationship between
damping and interface for glass-fiber-reinforced epoxy resin composites. Material
damping reduces structural vibrations and thereby moderate propagation of fatigue
damage (Croce et al., 2001; Zhang and Hartwig, 2001). Chandradass et al. (2007)
investigated the damping characteristics of hybrid nanocomposite laminates by
reinforcing short fiber chopped strand mat and organically modified montmorillonite
clay by conducting free vibration tests. Improvement in damping factor was observed
up to 3% by weight of organically modified clay.
2.2.3.2 Damping Evaluation through Dynamic Mechanical Analysis
Dynamic mechanical analysis permits to understand the viscoelastic behavior of
polymers over a wide range of temperatures and frequencies. Thomason and
Groenewoud (1996) highlighted the importance of fiber length in the retention of
stiffness between the glass transition and melting temperatures of polypropylene
matrix. Addition of short sisal fibers in the polypropylene matrix increases the storage
and loss modulus but lowers the damping factor due to reduced molecular mobility
(Joseph et al., 2003). Sefrani and Berthelot (2005) investigated the temperature effect
TH-978_06610302
Chapter 2 Literature survey
17
on the stiffness and damping of glass fiber epoxy material manufactured through hand
layup process. Near the glass transition temperature of the matrix, the material rapidly
becomes very soft and dampened over a short temperature range. The glass transition
temperature of carbon fiber polypropylene composite increased with the increase in
fiber length (Rezaei et al., 2009).
2.2.4 Fatigue Performance of Thermoplastic Composites
Utilization of glass fiber thermoplastic composites in structural applications demands
the understanding of fatigue behavior in service conditions. Due to the viscoelastic
characteristics of the matrix material, fatigue behavior of thermoplastic composites is
significantly influenced by alternating stress, frequency, mean stress, temperature,
surface condition and environment (Manson et al., 1975; Sauer and Richardson, 1976;
Martin and Gerberich, 1976).
Polymer structure, molecular weight, fillers and reinforcement also influences
the fatigue strength considerably (Dally and Carrillo, 1969; Warty et al., 1979;
Karger-Kocsis and Friedrich, 1988). Mandell (1983) observed accumulating creep
strain and decreasing modulus until failure for nylon 66 glass fiber composites during
fatigue testing. Mandell and Chevaillier (1985) observed that failure of pure polyvinyl
chloride involves craze, crack initiation growth and coalescence during fatigue and
reported the formation of crazes in stabilizing the crack growth. It was also reported
that the major mechanism of cumulative damage for reinforced thermoplastics are the
creep-rupture of the matrix combined with debonding of the fibers. Fatigue damage in
discontinuous fiber reinforced engineering thermoplastics under alternating loading is
induced by the initiation and crack propagation in the matrix and destruction of
bonding at the polymer/matrix interface (Karger-Kocsis and Friedrich, 1988).
TH-978_06610302
Chapter 2 Literature survey
18
Apart from composite endurance strength of the composites evaluated from fatigue
tests, accumulated damage in the form of stiffness loss, energy dissipation and rise in
temperature were also addressed by Orth et al. (1993). Lin et al. (1996) investigated
the stiffness loss of long glass reinforced polyamide composites and observed the
crack formation along with stiffness deterioration. Ferreira et al. (1999) observed the
temperature rise during fatigue testing of glass fiber reinforced polypropylene and
correlated with the deteriorating stiffness of the composite. Long glass fiber
thermoplastics exhibited high fatigue crack propagation resistance than short glass
fiber due to the less stress concentration sites (fiber ends) for a given fiber volume
fraction (Karger-Kocsis and Friedrich, 1988). Czigany and Karger-Kocsis (1993)
investigated the failure mode of short and long glass fiber polypropylene and reported
an increase in fracture toughness of the long glass fibers composite due to the
improved fiber/matrix coupling and stress transfer capability. Khanh and Denault
(1994) used post yield fracture mechanics theory to investigate the fracture
performance in long glass fiber reinforced polypropylene and reported that the crack
growth resistance was improved with the fiber volume fraction and an performance
plateau was reached when the glass fiber volume fraction reached 35%. Wyzgoski
and Novak (1995) reported that the presence of long glass fibers imparted improved
fatigue resistance than short fiber reinforced nylon 66 due to the presence of higher
modulus long glass fibers.
Interfacial strength of a composite plays a significant role in the fatigue
behavior. Gamstedt et al. (1998) observed no significant improvement of static
strength but significant improvement of fatigue performance for the maleic-anhydride
grafted polypropylene matrix. Bureau and Denault (2004) studied the dependence of
temperature on flexural fatigue of continuous glass fiber polypropylene and observed
TH-978_06610302
Chapter 2 Literature survey
19
the major role of fiber–matrix interface on mechanical properties. Rajeesh et al.
(2010) studied the influence of relative humidity on indentation hardness and flexural
fatigue of polyamide 6 nanocomposites and reported a reduction in hardness and
modulus of the composite with the increase in humidity. Hysteresis heating and
molecular orientations were spotted as the main reason for drop in modulus during
fatigue.
2.2.4.1 Hysteretic Heating of Thermoplastic Composites
Viscoelastic nature of thermoplastic composites dissipates energy in the form of
hysteretic heating during fatigue and cause thermal softening (Sauer and Richardson,
1979). Presence of fibers in the matrix reduces thermal softening (Rosato et al.,
2001). Rittel et al. (2003) examined the hysteretic thermal response of modified
polymethylmethacrylate (PMMA) at high stress level and chain mobility was
identified as contributing parameter under cyclic loading. Moisa et al. (2005) reported
the heat generation of polymethylmethacrylate (PMMA) and polycarbonate (PC)
material under cyclic compressive loading and observed the significant influence of
frequency and applied stress on heat generation.
Bellenger et al. (2006) investigated the bending fatigue performance of glass
fiber reinforced polyamide 66 and measured specimen temperature using infra red
camcorder. Experimental observations revealed that damage was initiated at fiber
ends close to sample edges where the stress concentration was high and the damage
propagates from sample edges to sample core during fatigue. Kultural and Eryurek
(2007) observed an increase in fatigue life with the addition of calcium carbonate in
polypropylene matrix under high frequency loading conditions. In this work,
influence of loading frequency and percentage of calcium carbonate over material
TH-978_06610302
Chapter 2 Literature survey
20
temperature rise was also investigated. Addition of long glass fibers in the
polypropylene matrix reduced the temperature rise during dynamic loading conditions
due to the hysteretic phenomenon and provides higher fatigue life (Goel et al., 2008).
2.2.5 Creep Performance of Thermoplastic Composites
Common problem associated with the unreinforced thermoplastics is creep under
moderate to severe stress at elevated temperature. Creep resistance of thermoplastic
composites is significantly improved by increase in fiber loadings (Gupta and Lahiri,
1980; Silverman, 1987). Silverman (1987) compared and investigated the flexural
creep response for long glass and short glass fiber-reinforced polycarbonate and
polypropylene polymers at various temperatures. Reduction in creep performance at
elevated temperature was visualized for short fiber materials. Dynamic mechanical
analysis (DMA) was utilized to investigate the viscoelasticity of injection-molded
nylon 6/6 material reinforced with short and long glass fibers by Sepe (1994) and
reported an increase in creep resistance for long glass fiber reinforced nylon
composites.
Challa and Progelhof (1995) investigated the effect of temperature on the
creep characteristics of polycarbonate and developed a relationship based on
Arrhenius theory to develop creep master curves. Long-glass-fiber-reinforced
thermoplastics offer advantages in components that are subject to creep because of
their superior creep resistance and more isotropic performance in comparison with
short-fiber counterparts (Kim et al., 1997). Pegoretti and Ricco (2001) studied the
propagation of crack under creep for varying temperature conditions for
polypropylene composites and observed that speed with which the crack progresses
was dependent on the test temperature. Krishnaswamy (2005) performed extensive
TH-978_06610302
Chapter 2 Literature survey
21
creep rupture testing on high density polyethylene pipes at various hoop stress levels
and temperatures and observed the dependency of density and crystallinity towards
failure. Houshyar (2005) reported the improvement in creep properties with the
addition of long polypropylene fibers in propylene-co-ethylene (PPE) matrix and
visualized the improvement in interfacial properties. Trans-crystallization of the
polypropylene matrix was observed in the PPE samples due to the thin layer of matrix
on the reinforcement, which was attributed to good impregnation and wetting of the
fibers. Greco et al. (2007) investigated the flexural creep behavior for compression
molded glass fiber reinforced polypropylene at various applied stress level. The effect
of matrix crystallinity was highlighted for the improvement in creep properties for
glass fiber reinforced polypropylene in their work. Acha et al. (2007) studied the
influence of interfacial adhesion in discontinuous jute fiber reinforced polypropylene.
Relation between interfacial properties and creep deformation were investigated.
Higher creep resistance was observed for polypropylene composites with good
interfacial bonding which was confirmed by the observation of the composite
fractured surfaces.
2.2.5.1 Creep Models
Findley and Khosla (1955) conducted creep tests for unreinforced thermoplastics;
polyethylene, polyvinyl chloride and polystyrene. Approximation was carried out for
the linear viscoelastic region by power law and compared the creep performance by
estimating the power law coefficient and power law exponent. Liou and Tseng (1997)
used Findley power law to estimate the creep compliance of carbon fiber nylon
composites in hygrothermal condition. Power law model was modified by Hadid et al.
(2002) by incorporating the time and stress dependence during creep loading of
TH-978_06610302
Chapter 2 Literature survey
22
polyamide specimens and estimated four parameters for describing the deformation
occurring in the material. Hadid et al. (2004) used stress–time superposition principle
to predict long-term material creep behavior of injection molded fiber glass reinforced
polyamide. Master curves were developed and a perfect superposition of the curves at
various stress levels was visualized. Fan and Novak (2006) used strain energy
equivalence theory and developed a creep predictive model to predict the creep
behavior of talc filled polypropylene.
Experiments were performed at various strain rates and later predicted for
creep performance at various stresses. Banik et al. (2008) reported the improvement
in creep resistance due to unidirectional reinforcement for polypropylene-
polypropylene composites. Burger and Findley power law model were used to predict
the short term creep behavior and the underlying deformation mechanisms were also
investigated. Liu et al. (2008) used multi-Kelvin element theory and power law
functions to predict creep compliance in polyethylene material and compared with the
tensile creep experiments. Chevali et al. (2009) studied the flexural creep response of
nylon 6/6, polypropylene and high-density polyethylene long fiber thermoplastic
composites. Four parameter model proposed by Hadid et al. (2002) was used to fit the
experimental data and good agreement was visualized. Nylon 6/6 had the least creep
compliance than polypropylene and high-density polyethylene.
2.2.6 Engineering Application of Long Fiber Reinforced Thermoplastics
Injection molded long-fiber reinforced thermoplastic products possess mechanical
properties that approach to those of a component made by continuous fiber
reinforcement (Marshal, 1987). Long fiber reinforced pellets for injection molding
enhance fatigue strength, impact, temperature resistance than that of conventional
TH-978_06610302
Chapter 2 Literature survey
23
short-fiber compounds (Thomason, 2002). Deaver and Mcllvaine (2005) replaced
steel with long fiber reinforced polypropylene in running boards and reported
significant weight reduction, corrosion resistance, scratch resistance and cost
reduction due to the replacement. Bartus et al. (2006) used long glass fiber
thermoplastic polypropylene to develop bus seat by extrusion-compression molding
and confirmed 43% weight reduction and 18% cost reduction. Process simulation
was carried out to study the extent of filling and fiber orientation.
Noh et al. (2006) developed a door module with 40% long glass fiber
reinforced polypropylene and reported a weight reduction of 12% for the door module
assembly. The developed door module was subjected to various tests; waterproof test,
drop-weight test and stiffness test. Weight reduction of 60 % was achieved by
Thattaiparthasarathy et al. (2008) with the replacement of metallic battery door by
long glass fiber polypropylene for mass transit application; fiber orientation in the
final molded part was verified experimentally and stiffness measurement was
compared with the finite element results. Vaidya et al. (2008) used 40% weight of
long glass fiber nylon thermoplastic for developing tailcone for military application.
Finite element analysis was carried out for the design and evaluation of the composite
tailcone considering pressure, gravitational and temperature load during the flight.
Field tests were also conducted to verify the design and manufacturing aspects of long
fiber composite tailcone.
2.3 METALLIC LEAF SPRING
Rajendran and Vijayarangan (2001) carried out static and modal analysis for
graduated seven leaf springs joined by two U-bolts to evaluate the strength and
vibration behavior. Leevy and Cao (2004) explored the fundamentals of combining
TH-978_06610302
Chapter 2 Literature survey
24
dissimilar materials and showed the role of combined equivalent modulus on overall
stiffness characteristics of multi leaf spring design. Sugiyama et al. (2005)
demonstrated the use of nonlinear finite element formulations to study the
performance of leaf spring under dynamic conditions. Moon (2007) carried out
simulation to plot the hysteretic curve of steel leaf springs and validated with the
experimental results. Dynamic stress analysis was on the taper steel leaf spring with
the developed multi-body dynamic model. Yoo et al. (2007) proposed a numerical
procedure to estimate the fatigue life of leaf springs and identified crucial design
parameters in influencing the fatigue life. Liu (2009) studied the stress, stiffness and
inter-leaf slippage of tapered leaf spring using finite element tool and reported the
stiffness change due to slippage between individual leafs.
Santika et al. (1988) performed durability test on leaf spring with shock
absorbers using servo hydraulic test machine at constant amplitude. Leaf spring
characteristics; spring rate and damping force were evaluated. In general metallic leaf
spring failure diagnosis involves examination of manufacturing and failure histories
through macroscopic inspection, chemical analysis, metallographic analysis and
hardness measurements (Mukhopadhyay et al., 1997; Graham, 2004; Herrera et al.,
2004). Belogur et al. (2004) examined the characteristics of steel and titanium alloy
leaf springs towards corrosion resistance, thermo mechanical properties and relaxation
capacity. Fuentes et al. (2008) investigated the fracture behavior due to mechanical
fatigue and observed that crack nucleated at the region of the central hole in
secondary leaf of the spring.
Tanaka et al. (1985) observed a reduction in fatigue strength due to fretting for
high strength spring steel and effectively utilized J-integral theory to predict the crack
propagation. Mutoh et al. (1986) reported the deterioration of surface quality due to
TH-978_06610302
Chapter 2 Literature survey
25
fretting fatigue between mating leaves of multi leaf steel leaf spring and reported the
substantial decrease in the fatigue strength of the component. The modification of leaf
spring tensile surface by shot-peening created residual compressive stresses resulted
in fatigue life and stress corrosion resistance improvement (Siswosuwarno et al.,
1985; Todinov, 2000). The effect of shot peening on full scale testing of leaf springs
was conducted by Aggarwal et al. (2006) and developed a fatigue model based on the
surface modification on the leaf spring. The model addressed the influence of various
shot peening conditions on the leaf spring performance and reported the influence of
fretting fatigue between mating leaves in decreasing the fatigue life.
2.4 COMPOSITE LEAF SPRING DESIGN
Leaf spring accounts for 10-20 % of the unsprung weight and hence reduction of
unsprung mass helps to improve ride characteristics and increased fuel efficiency
(Tanabe et al., 1982). Various design works on thermoset leaf springs have been
reported in the past. Morris (1986) developed a program to determine the thickness at
the center, maximum stress and maximum shear stress for a single transverse leaf
spring made of glass fiber epoxy material. In addition, the developed program was
utilized to obtain load deflection values for zero to full bump loads. Lo et al. (1987)
analyzed the glass fiber epoxy leaf spring as a curved beam with various sections
carrying a concentrated load, later expressions were derived along the length of the
leaf spring at various sections and design was used for tank trailer suspension system.
Yu and Kim (1988) considered leaf spring as two tapered cantilever beam and
estimated the optimal taper ratio as 0.5. Beam dimensions for the glass fiber
reinforced epoxy leaf spring were determined by considering the vertical end force
and later finite element analysis was carried out. Corvi (1990) utilized Timoshenko
TH-978_06610302
Chapter 2 Literature survey
26
beam theory for developing composite beam for leaf spring application by
considering vertical and transverse loading conditions. Effect of fiber volume fraction,
fiber lamination angle on leaf spring behavior was also evaluated. Sancaktar and
Gratton (1999) used spread sheet solver for optimizing the glass fiber epoxy leaf
spring for solar vehicle application and highlighted the importance of providing high
moment of inertia at the center of the leaf spring where it is subjected to high
moments. Rajendran and Vijayarangan (2001) used genetic algorithm to determine
the width and thickness at the axle seat for the designed glass fiber epoxy leaf spring.
Qureshi (2001) used Tsai-Hill failure criterion for developing an expression as a
function of thickness and position along the spring. Later the developed equation for
the glass epoxy leaf spring was utilized to determine the thickness at any section
along the leaf spring length. Shokrieh and Rezaei (2003) used finite element tool to
optimize fiber glass epoxy resin leaf spring by considering Tsai-Wu failure criterion
and reported a higher natural frequency and weight reduction for the proposed
thermoset leaf spring compared to that of metallic leaf spring.
Mold part quality is significantly influenced by the gate location as it
influences the plastic flow into the mold cavity. Luscher and Houser (2000)
investigated the influence of gating position and packing pressure on the transmission
error and shrinkage of Polyketone gears and validated the results with mold flow
software. Transmission error was found to be dependent on the gating position and
shrinkage was found to be maximum on the gated side of the gear. Imihezri et al.
(2006) analyzed two different types of profile with and I and T cross-sections using
mould flow analysis for automotive clutch pedal made from glass fiber reinforced
polyamide and reported that I cross-section is superior to T section in terms of load
carrying capability. Zainudin et al. (2002) reviewed the numerical and experimental
TH-978_06610302
Chapter 2 Literature survey
27
investigations carried out on short glass fiber reinforced injection molded
thermoplastics towards fiber orientation distribution (FOD) and reported the influence
of injection speed, fiber concentration, cavity thickness and gate location in deciding
the FOD. Simoes (2001) developed a prototype vehicle by considering the aesthetics
and ergonomic design. Composite sandwich structure made of woven carbon fabric
and commercial polyvinyl chloride foam material was utilized for the cockpit and
chassis.
2.5 DEVELOPMENT AND PERFORMANCE OF COMPOSITE LEAF
SPRINGS
During the past two decades, significant effort has been made by the automotive
industries to utilize thermoset material for leaf spring application. Commonly used
manufacturing techniques in the past were filament winding, compression molding,
combination of both and hand lay-up vacuum bag process. Delphi (1981) used
filament winding technique with epoxy resin and unidirectional fiber glass (Liteflex®)
for rear suspension of corvette cars. Road test conducted on Liteflex® composite
springs confirmed the potential of improved durability, ride and shock isolation.
Daughtery (1981) studied the hybrid combination of steel with fiber glass-epoxy
leaves and reported cost-effective solution. Beardmore and Johnson (1986) used glass
fiber reinforced epoxy resin for composite leaf springs and stressed the importance of
enhanced ultimate and fatigue strength compared to metals. Morris (1986) used 50 %
volume of glass fibers in epoxy matrix for fabricating leaf spring with the aid of
filament-winding as well as compression molding process. The springs were installed
in the vehicle and the spring rate was checked statically. Real time tests were carried
out under harsh road conditions to simulate the accelerated fatigue tests and observed
TH-978_06610302
Chapter 2 Literature survey
28
local delamination due to fiber damage on the tensile side of leaf spring. Beardmore
(1986) demonstrated three types of manufacturing process involved in fabricating leaf
springs by compression molding, hand lay-up and pultrusion. The advantage of using
pultrusion technique in manufacturing constant cross section spring was highlighted
in his methodology.
Lo et al. (1987) developed constant width, variable thickness glass fiber
reinforced epoxy leaf spring for tank trailer suspensions by compression molding.
Spring rate was measured in the laboratory and delamination was observed adjacent to
clamping area due to the existence of excessive torque. Yu and Kim (1988) used
filament winding technique followed by compression molding process for fabricating
glass fiber epoxy leaf spring. Static test was conducted using electro-hydraulic spring
testing machine and observed a good agreement between experimental and designed
spring rate. Fatigue performance test was carried out and stiffness retention was
visualized for the design load. Theren and Lundin (1990) replaced three leaf steel
springs with filament wounded glass fiber epoxy leaf spring and conducted static and
fatigue test. The static test was carried out by subjecting the leaf springs to vertical
loads, lateral loads, braking loads, rolling loads and observed a satisfactory
performance. Fatigue tests were conducted using a developed fatigue test rig and
observed a satisfactory performance. Sancaktar and Gratton (1999) used hand lay-up
technique for fabricating glass epoxy leaf spring and the stiffness was measured using
three point bending technique. Qureshi (2001) developed variable thickness leaf
spring made of glass fiber epoxy material using vacuum bag lay-up technique and
road test was performed and reported the enhanced flexibility and reduced noise and
harshness level compared to that of steel leaf springs. Hou et al. (2005) developed
polyester glass fiber leaf springs using resin transfer molding and performed static
TH-978_06610302
Chapter 2 Literature survey
29
tests and showed that the composite leaf springs satisfactorily carry the maximum
design load. A dedicated shaker rig was used to investigate dynamic response of the
leaf spring under various loading conditions. Shankar and Vijayarangan (2006)
reported the development of glass fiber epoxy leaf spring using hand lay-up technique
and static performance was investigated with the aid of developed test rig and
observed similar spring rate to that of steel leaf spring. Cherruault et al. (2010)
developed glass fiber-reinforced polyester leaf suspension for rail way freight vehicles
using resin transfer molding. Shaker rig testing methodology was utilized to estimate
the rail suspension dynamic properties and reported that viscous damping and low
dynamic stiffness of glass fiber-reinforced polyester leaf spring provides as an
effective solution for track friendly suspension system.
2.6 BOLTED JOINT PERFORMANCE OF COMPOSITE MATERIALS
Joint strength between leaf spring and eye end must have superior strength than that
of the designed leaf spring so that composite leaf springs can be a viable suspension
system (Yu and Kim, 1988). Bolted joints were found to be more useful than adhesive
bonded joints, due to the superior load transfer and less sensitive to the surface
preparation characteristics (Camanho and Matthews, 1997). Shokrieh and Rezai
(2003) proposed four different types of end joints for the leaf spring application and
highlighted the manufacturing easiness and significance of bolted joints. Bolted joints
and adhesively bonded joints are commonly being utilized for joining the composite
structures. Common failure observed in mechanical joints of polymer composite parts
are tension, shear, bearing, cleavage and pull-through failures (ASTM D5961, 2005).
Various aspects of joint performance such as geometric configurations, fastener
preload, failure mode under static and fatigue conditions, effects of service conditions
TH-978_06610302

Chapter 2 Literature survey
30
(temperature and moisture) on joint performance and non-destructive evaluation
techniques have been carried out in the past (Thoppul et al., 2008).
2.6.1 Composite Joint Design
Geometric configuration of joint significantly alters the bearing strength and failure
mode. Collings (1977) investigated the influence of geometric parameters viz. width,
hole diameter, end distance and thickness on the joint strength performance and
reported that the bearing strength of carbon fiber reinforced plastics can be improved
by increasing the lateral compressive stress around the loaded hole. Godwin et al.
(1982) used glass fiber reinforced polyester material for multi-bolt joints and reported
pitch as an important design parameter in the bolted joint performance. Kretsis and
Matthews (1985) observed the change in failure mode from bearing to tension when
the specimen width decreases for glass fiber reinforced epoxy laminates.
Chen and Lee (1995) investigated the effect of friction, clamping pressure,
clearance and stacking sequence of pin loaded joints using finite element technique on
glass fiber epoxy laminates. The maximum load that can be sustained before failure
was predicted using the maximum stress theory and later confirmed with the
experimental results. It was also observed that the dependency of failure mode was
dependent on lay-up characteristics rather than fiber/resin combination. Similar
observation was substantiated by Park (2001), Okutan (2002), and Lim et al. (2006)
for E-glass epoxy laminate. McCarthy et al. (2005) developed a three dimensional
finite element model for multi-bolt, double-lap composite joints and addressed the
progressive damage induced due to the effect of clearance and studied the damage
mechanisms of the joint. The influence of traction forces by two parallel rigid pin for
two parallel circular holes in woven glass fiber - vinylester was investigated by
TH-978_06610302

Chapter 2 Literature survey
31
Karakuzu et al. (2008) and reported the influence of end distance on failure mode.
Yavari et al. (2009) evaluated the stress distribution around the hole of epoxy
laminates and reported that the higher friction and smaller plate width would offer
safe joint. Atkas et al. (2009) observed good agreement between experimental and
numerical predictions during the joint performance for glass-epoxy laminate and
observed maximum bearing load for the glass fiber epoxy composite plates in double
pinned joints, when the ratio of end distance to the hole center was greater than four.
2.6.2 Influence of Clamping, Clearance and Notch on Composite joint
Clamping torque alters the static and fatigue performance of bolted joints. Stockdale
and Matthews (1976) investigated the effect of clamping pressure on bolt bearing
loads for glass fiber epoxy polymer parts. Static and fatigue strength of the graphite-
epoxy laminate was found to be improved with higher clamping torque (Crews,
1981). Sun et al. (2002) observed the effect of clamping area on improving the failure
load of the graphite epoxy laminate joint. Khashaba et al. (2006) investigated the
effect of washer size on the strength of composite bolted joints made of glass fiber
reinforced epoxy laminates. For a constant clamping torque, the stiffness and the
failure load of the joint decreases with the increase in washer diameter due to the
reduction in contact pressure with increasing clamping area. Pakdil et al. (2007)
reported different failure mode at various clamping torque of glass fiber epoxy
laminated plate and highlighted the importance of increasing the preload for obtaining
safe bolted joint characteristics.
Clearance plays an important role in altering the stiffness and damage
encountered in bolted composites (Naik and Crews, 1986). Clearance fits should be
avoided due to reduced contact area between the bolt and the bolt-hole, which causes
TH-978_06610302
Chapter 2 Literature survey
32
higher compressive contact stresses on the bearing surface (Scalea et al., 1998).
McCarthy et al. (2005) investigated the bolt hole clearance effect on single bolted,
single lap carbon fiber epoxy joint and reported the reduction in joint stiffness due to
the increase in clearance.
Material discontinuities due to hole in bolted composite joints produce areas
of high stress concentrations which reduce the load-carrying capability of the
composite structure. Composite constituent properties play a significant role in
deciding the notched-strength performance. Carlsson et al. (1989) confirmed higher
notch sensitivity in graphite polyetherketone composite than graphite epoxy
composite and highlighted the importance of stress relieving mechanism in reducing
the notch sensitivity. Swanson et al. (1993) observed superior performance of open
hole under fatigue loading for toughened matrix system and also reported the
enhancement in retaining the residual strength. Pinnell (1996) observed higher open
and filled hole tensile strength in thermoplastic than thermoset composites and
reported a greater stress relief at the hole edge in thermoplastic material. It was also
reported that higher notch sensitivity of thermoset than thermoplastic material
provides lower bearing strength to the composite for the same amount of reinforced
graphite fibers. Ferreira et al. (1997) confirmed that stress concentration was found
be more prominent in static and low cycle fatigue for fiber reinforced polypropylene
material.
2.7 SUMMARY
Research work carried out on manufacturing and performance of discontinuous fiber
reinforced polymer composite leaf springs indicated many intricate issues unlike
metallic leaf springs. Literature review was carried out on various material
TH-978_06610302
Chapter 2 Literature survey
33
characteristics relevant to the leaf spring application; wear, damping, energy
absorbing capability, fatigue, creep and joint strength characteristics. Time and
temperature dependent behavior of polymer material influences the performance
characteristics. Addition of fibers affects the heat generation and dissipation
characteristics of composites. Incorporation of discontinuous fibers in the polymer
matrix alters the material ductility and homogeneity, which alters the performance
characteristics and failure mechanisms.
TH-978_06610302

Chapter 3 Materials for Thermoplastic Leaf Springs
34
CHAPTER 3
MATERIALS FOR THERMOPLASTIC LEAF SPRINGS
3.1 INTRODUCTION
Ideal spring materials must have high specific strain energy capacity, excellent fatigue
life and corrosion resistance. In the recent years, long fiber reinforced thermoplastic
material are being used extensively in mass transit industrial components, due to its mass
production capability ,good endurance strength ,creep strength etc. which are the major
requirement for leaf springs. Injection molded long-fiber reinforced thermoplastic
products possess mechanical properties that approach to component made by continuous
fiber reinforcement (Marshal, 1987). Increased length and fiber orientation within pellets
help to increase the modulus and strength of the material as high as 90% of that obtained
when using continuous fibers (Thomason et al., 2002). Long fiber reinforced pellets for
injection molding enhance fatigue strength, impact, temperature resistance than that of
conventional short-fiber compounds (Thomason, 2002). The performance of any
injection molded component depends on the retained fiber length after molding process
and hence investigation of fiber degradation by measuring fiber length distribution in the
molded samples has been carried out in the past by fiber ash test followed by image
processing techniques (Bureau and Denault, 2004; Bartus et al., 2006; Bernasconi et al.,
2007).
TH-978_06610302

Chapter 3 Materials for Thermoplastic Leaf Springs
35
Materials used for developing leaf springs and test specimens are presented in this
chapter. Processing conditions used for preparing the test specimens and determination of
fiber length is also presented in this chapter.
3.2 MATERIALS AND PROCESSING CONDITIONS
Unreinforced polypropylene (UFPP), 20% short glass reinforced polypropylene (SFPP)
and 20% long glass reinforced polypropylene (LFPP) were considered for the
development of thermoplastic leaf springs. Prior to the development of leaf spring, leaf
spring material characteristics like friction and damping were also evaluated for the
above materials. SFPP pellets are made from extrusion process where fibers are randomly
oriented as shown in figure 3.1 a. LFPP pellets were made from pultrusion technique
where fibers are well oriented along the pellet length as shown in figure 3.1 b. Pellets
were obtained from Saint-Gobain India, according to the product data sheet (Saint
Gobain/Twintex, 2005), the base resin PP was having same molecular weight and same
amount of silane type coupling agent was used for the glass fibers in LFPP and SFPP
pellets. Since the amount of void content is considerably small and difficult to quantify
with the test facility available, void is assumed to be same for both short and long fiber
reinforced composites .Since the investigated reinforced materials have the same type and
amount of coupling agent, material behavior discussions were limited only to the fiber
length.
TH-978_06610302
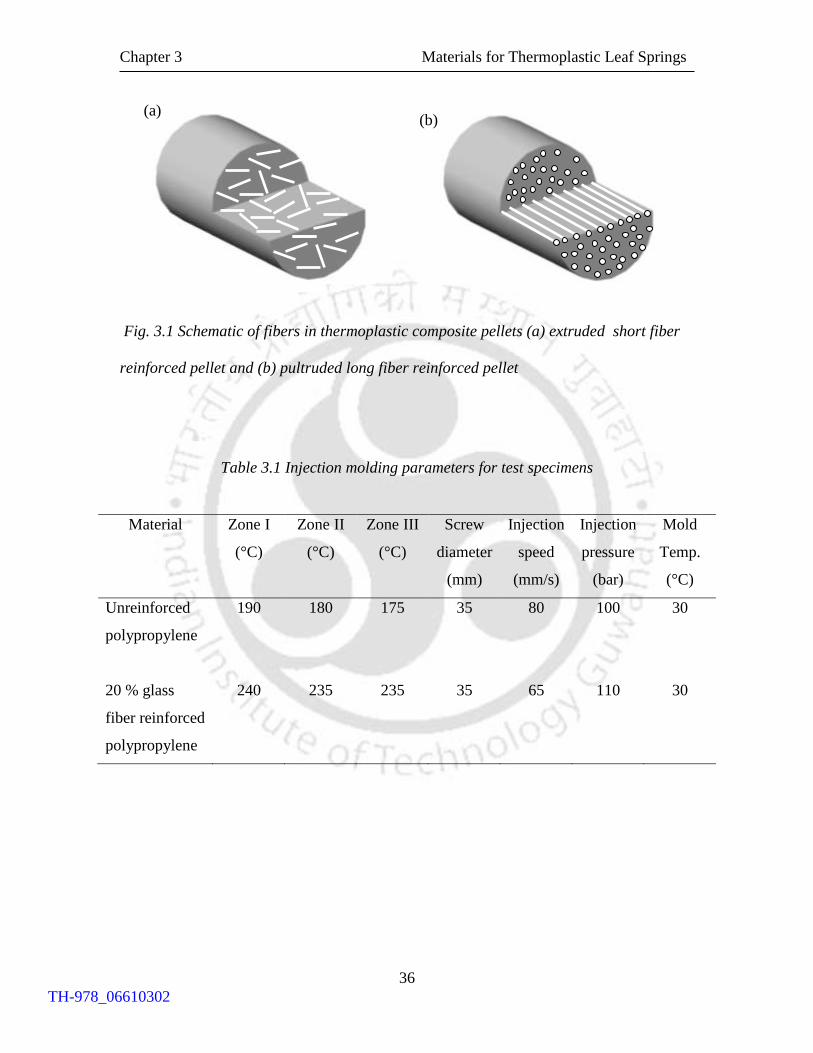
Chapter 3 Materials for Thermoplastic Leaf Springs
36
Fig. 3.1 Schematic of fibers in thermoplastic composite pellets (a) extruded short fiber
reinforced pellet and (b) pultruded long fiber reinforced pellet
Table 3.1 Injection molding parameters for test specimens
Material Zone I
(°C)
Zone II
(°C)
Zone III
(°C)
Screw
diameter
(mm)
Injection
speed
(mm/s)
Injection
pressure
(bar)
Mold
Temp.
(°C)
Unreinforced
polypropylene
190 180 175 35 80 100 30
20 % glass
fiber reinforced
polypropylene
240 235 235 35 65 110 30
(a) (b)
TH-978_06610302
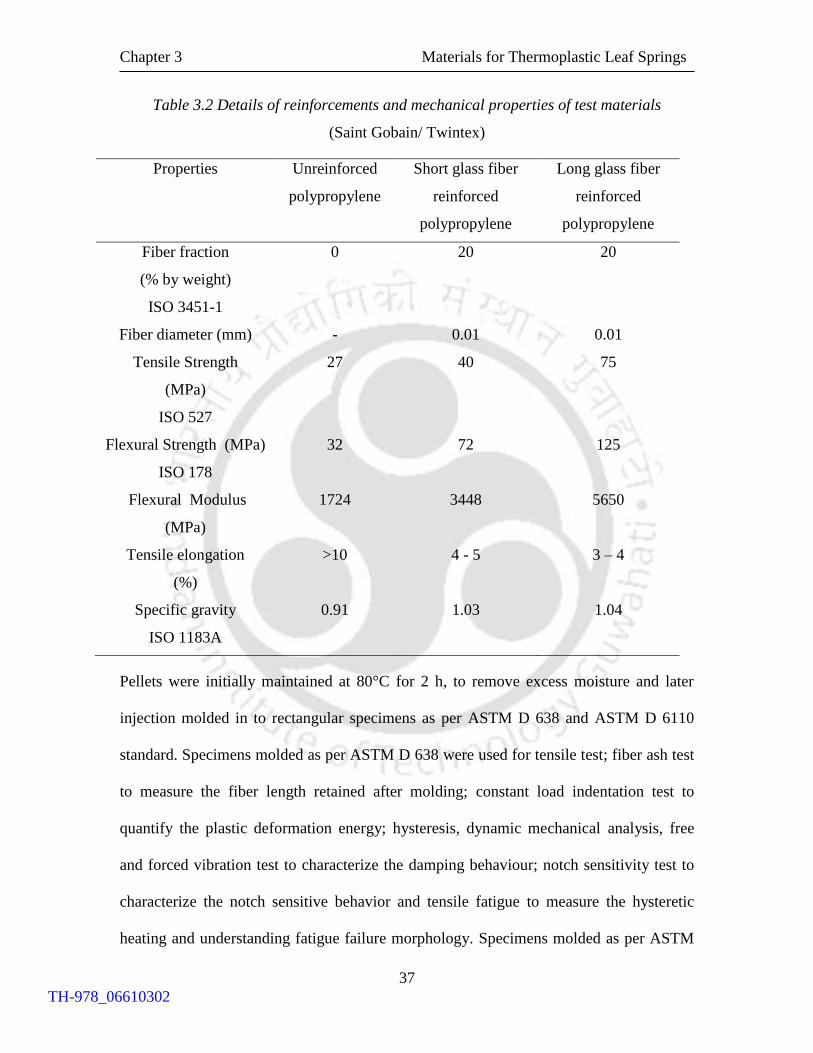
Chapter 3 Materials for Thermoplastic Leaf Springs
37
Table 3.2 Details of reinforcements and mechanical properties of test materials
(Saint Gobain/ Twintex)
Properties Unreinforced
polypropylene
Short glass fiber
reinforced
polypropylene
Long glass fiber
reinforced
polypropylene
Fiber fraction
(% by weight)
ISO 3451-1
0 20 20
Fiber diameter (mm) - 0.01 0.01
Tensile Strength
(MPa)
ISO 527
27 40 75
Flexural Strength (MPa)
ISO 178
32 72 125
Flexural Modulus
(MPa)
1724 3448 5650
Tensile elongation
(%)
>10 4 - 5 3 – 4
Specific gravity
ISO 1183A
0.91 1.03 1.04
Pellets were initially maintained at 80°C for 2 h, to remove excess moisture and later
injection molded in to rectangular specimens as per ASTM D 638 and ASTM D 6110
standard. Specimens molded as per ASTM D 638 were used for tensile test; fiber ash test
to measure the fiber length retained after molding; constant load indentation test to
quantify the plastic deformation energy; hysteresis, dynamic mechanical analysis, free
and forced vibration test to characterize the damping behaviour; notch sensitivity test to
characterize the notch sensitive behavior and tensile fatigue to measure the hysteretic
heating and understanding fatigue failure morphology. Specimens molded as per ASTM
TH-978_06610302

Chapter 3 Materials for Thermoplastic Leaf Springs
38
D 6110 were used for characterizing the adhesive and abrasive wear behaviour. Molding
conditions for preparing the specimen are shown in table 3.1. Mechanical properties of
the test materials are listed in table 3.2 (Saint Gobain/Twintex).
3.3 FIBER LENGTH DISTRIBUTION
Rectangular test specimens were heated in a muffle furnace to 600 C for a period of
about 6 h to burn out the matrix material and the extracted fibers are shown in figure 3.2.
The extracted fibers were dispersed uniformly on a microscopic glass slide. Lengths of at
least five hundred fibers were measured using a Zeiss microscope (KS 300) with an
image analysis system. Fiber length distribution (FLD) histograms for the test materials
are shown in figure 3.3. The number average length (Ln) and weight average length (Lw)
were estimated.
Fig. 3.2 Separated fibers from test materials (a) short fiber reinforced PP and (b) long fiber
reinforced PP
(a) (b)
100μm
100μm
TH-978_06610302

Chapter 3 Materials for Thermoplastic Leaf Springs
39
Fig. 3.3 Fiber length distribution of long and short fiber reinforced polypropylene
The number average length was estimated by the following equation
i in
i
(F L )L
F=
(3.1)
and the weight average length was estimated using
2i i
wi i
(F L )L
F L=
(3.2)
where Fi is the number of fiber count (frequency) of fibers of species i with length Li. For
the SFPP material, number average length (Ln)SFPP and weight average length (Lw)SFPP
were 0.32 and 0.44 mm respectively. Similarly for LFPP material, number average length
(Ln)LFPP and weight average length (Lw)LFPP were 1.083 and 1.251 mm. Weight average
0
5
10
15
20
25
0.05 0.25 0.45 0.65 0.85 1.05 1.25 1.45 1.65 1.85
Fiber length (mm)
Fib
er f
req
uen
cy (
%).
LFPP
SFPP
TH-978_06610302
Chapter 3 Materials for Thermoplastic Leaf Springs
40
length (Lw) is commonly used to relate fiber length to mechanical behavior (Bernasconi et
al., 2007). Hence weight average length was used for further discussions.
3.4 SUMMARY
Materials used for the development of leaf springs and test specimens were highlighted in
this chapter. Injection molding processing conditions used for preparing the test
specimens was also discussed. Fiber length was measured using fiber ash test followed by
image processing. Test results revealed that LFPP possessed approximately three times
the retained fiber length than SFPP after injection molding.
TH-978_06610302
Chapter 4 Friction and Wear Characteristics
41
CHAPTER 4
FRICTION AND WEAR CHARACTERISTICS OF
THERMOPLASTIC LEAF SPRING MATERIAL
4.1 INTRODUCTION
Suspension leaf springs are attached to the axle seat by clamps at the center and the
ends are attached to the vehicle chassis through fasteners. During service condition,
relative sliding motion between leaf spring with clamps and bolts necessitates to
understand the friction and wear performance of the leaf spring material. Leaf spring
material must be reasonably wear resistant against the vehicle chassis material, steel
under adhesive and abrasive sliding condition (Yamada, 2007). Many attempts
(Bahadur and Polineni, 1996; Bijwe et al., 2001; Unal et al., 2004) have been made in
the past to understand the friction and wear performance of thermoplastic composite
materials. However, investigations on the influence of fiber length on friction and
wear characteristics of discontinuous fiber reinforced composite materials are limited
(Bekhet, 1999; Zhang et al., 2006). Addition of fibers affect the friction and wear
properties of polypropylene and the inclusion of varying fiber length need to be
understood for the better utilization.
In this chapter, adhesive and abrasive wear behavior of leaf spring materials
was examined with the aid of pin on disc test set up. The effect of fiber reinforcement
on plastic energy of deformation, matrix crystallinity and clogging behavior under
multi pass abrasive wear condition were investigated. The adhesive and abrasive wear
TH-978_06610302
Chapter 4 Friction and Wear Characteristics
42
mechanisms of chosen thermoplastic composites were identified with the aid of wear
morphology.
4.2 ADHESIVE FRICTION WEAR
Pin on disc tribometer developed by Srinath and Gnanamoorthy (2005) was utilized to
investigate the adhesive friction wear performance for the chosen leaf spring materials
and the testing was done as per ASTM G 99 standard. Specimens pertaining to ASTM D
6110 standard were machined to cylindrical pin of 5 mm diameter and 20 mm length.
Stainless steel disc (AISI 314) having centre line average surface roughness (Ra) of
0.1433 μm was used as the counter material. Initial hardness (Shore D) of the test
materials were measured as per ASTM D 2240 standard. The friction force was measured
with the force transducer fixed on the loading lever arm and stored using a personal
computer based data acquisition system. Adhesive friction and wear tests were conducted
at 19.62 and 29.43 N normal loads with a constant sliding velocity of 0.5 ms-.1 Tests were
conducted under dry conditions (32 ± 3°C, RH 57 ± 6 %). Data sampling rate for friction
force and displacement measurement was kept as 1 Hz. Silica carbide emery paper was
used to polish the test specimen to the average surface roughness value of 0.9 Ra (MarSurf
M1). Test specimen mass was measured using an electronic balance of 0.1 mg accuracy.
Wear tests were conducted up to a sliding distance of 3000 m. At least three tests were
conducted at similar test conditions and the average values of frictional force and mass
loss were used for further analysis. The specific wear rate (Kw) was calculated using
equation 4.1
21w
g
(m -m )K = X 1000
ρ PS (4.1)
where m1 and m2 are specimen mass before and after testing in g, ρg is the density of
the specimen (g/cm3), P is the normal load in N and S is the sliding distance in m.
TH-978_06610302

Chapter 4 Friction and Wear Characteristics
43
Worn surfaces of the pins were observed with scanning electron microscope (Make:
LEO) after sputtering with gold coating.
4.2.1 Transient Friction Mechanism
Figures 4.1 (a-b) show the coefficient of friction for UFPP, SFPP and LFPP material
under different loading condition.
Fig. 4.1 Coefficient of friction at (a) 19.62 N and (b) 29.43 N
0
0.1
0.2
0.3
0.4
0.5
0 500 1000 1500 2000 2500 3000 3500
Sliding distance (m)
Coef
fici
ent of
fric
tion-
UFPP
SFPP
LFPP
(a)
(b)
0
0.1
0.2
0.3
0.4
0.5
0 500 1000 1500 2000 2500 3000 3500Sliding distance (m)
Co
eff
icie
nt
of
fric
tio
nn
UFPP
SFPP
LFPP
TH-978_06610302
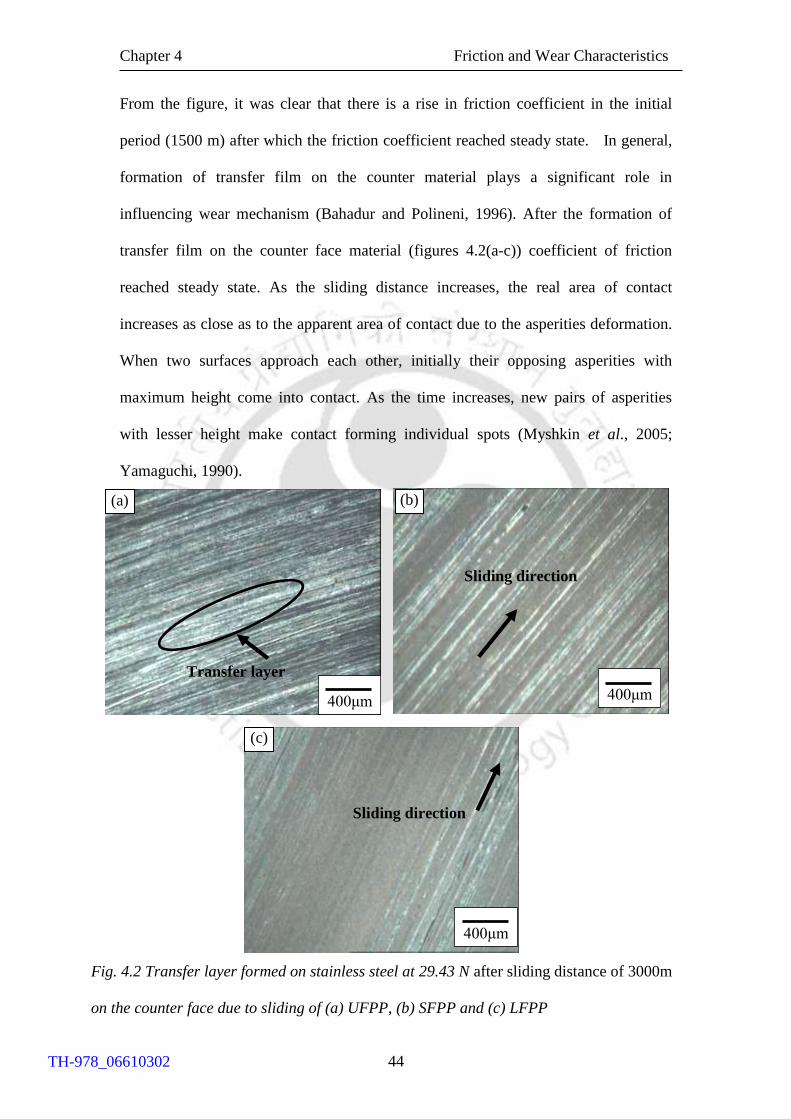
Chapter 4 Friction and Wear Characteristics
44
From the figure, it was clear that there is a rise in friction coefficient in the initial
period (1500 m) after which the friction coefficient reached steady state. In general,
formation of transfer film on the counter material plays a significant role in
influencing wear mechanism (Bahadur and Polineni, 1996). After the formation of
transfer film on the counter face material (figures 4.2(a-c)) coefficient of friction
reached steady state. As the sliding distance increases, the real area of contact
increases as close as to the apparent area of contact due to the asperities deformation.
When two surfaces approach each other, initially their opposing asperities with
maximum height come into contact. As the time increases, new pairs of asperities
with lesser height make contact forming individual spots (Myshkin et al., 2005;
Yamaguchi, 1990).
Fig. 4.2 Transfer layer formed on stainless steel at 29.43 N after sliding distance of 3000m
on the counter face due to sliding of (a) UFPP, (b) SFPP and (c) LFPP
Sliding direction
(b)
Sliding direction
(c)
400μm
Transfer layer
(a)
400μm
400μm
TH-978_06610302

Chapter 4 Friction and Wear Characteristics
45
Fig. 4.3 Effect of fiber length on surface roughness
Measurement of surface roughness before and after sliding confirmed this behavior
(figure 4.3). The existence of fibers and the breakage of fibers during sliding over the
steel counter face obstruct the reduction of surface roughness in fiber reinforced
polypropylene when compared to UFPP, hence Ra for soft UFPP was smallest
compared to its counterparts. In the initial period of contact, more number of
asperities contributes for the dominant abrasive wear. As the sliding distance/time
increases, number of asperities was reduced, wherein adhesion wear dominates.
Therefore for all the test materials, there was an initial rise in coefficient of friction
due to the dominant abrasive friction and later attains stable value due to the dominant
adhesive friction.
4.2.2 Influence of Fiber Length on Friction
It was observed from the figures 4.1(a-b), that the fiber length played a significant
role in influencing the frictional coefficient of the investigated materials after running
0.4
0.6
0.8
1
1.2
19.62 29.43
Surf
ace
roughnes
s R
a (µ
m)
.
Load (N)
Intial LFPP SFPP UFPP
TH-978_06610302
Chapter 4 Friction and Wear Characteristics
46
in period (1500 m). The material transfer phenomenon is predominant due to the
adhesion between the contacting surfaces. Transfer of material is governed by
mechanical interlocking of polymer material to the metal asperities. Generally,
particle transfer occurs from weaker to stronger material. From the figures 4.2 (a-c),
transfer film thickness was found to be thin in the case of glass fiber reinforced PP
than unreinforced PP. Among the reinforcement, LFPP showed thin transfer film than
SFPP due to its improved fiber matrix bonding as shown in figures 4.2(b-c). Similar
behavior of transfer film was reported by Srivastava and Pathak (1996) for the
graphite filled composites, wherein the frictional coefficient initially increased and
then dropped to stable value, which confirmed the formation of a graphite transfer
film on the counter face. Vaziri et al. (1988) reported the increase in polymer
specimen weight after sliding with stainless steel disc. In spite of same category of
fibers and same amount of coupling agent, LFPP exhibited superior mechanical
properties than that of LFPP compared to SFPP. In general the interfacial shear
strength is directly proportional to fiber length. For effective composite strengthening,
the fiber must have a minimum length through which efficient load transfer is
possible. Fibers shorter than this critical length do not serve as load-bearing
constituents (Thomason, 2002). Since the fiber length in LFPP is three times more
than SFPP, the fiber-matrix bonding was found to be improved which ultimately
improved its mechanical properties .To substantiate the above discussions on fiber
matrix bonding ,tensile test was carried out on chosen material and fractured surfaces
were investigated to understand the fiber- matrix interface. Tests were performed at
atmospheric condition (23 C and 50 % RH). The gauge length of the test material
was 50 mm and the crosshead was moved at 1 mm/min speed. Figure 4.4 shows the
stress-strain curve of the test materials. Addition of reinforcement increased material
TH-978_06610302
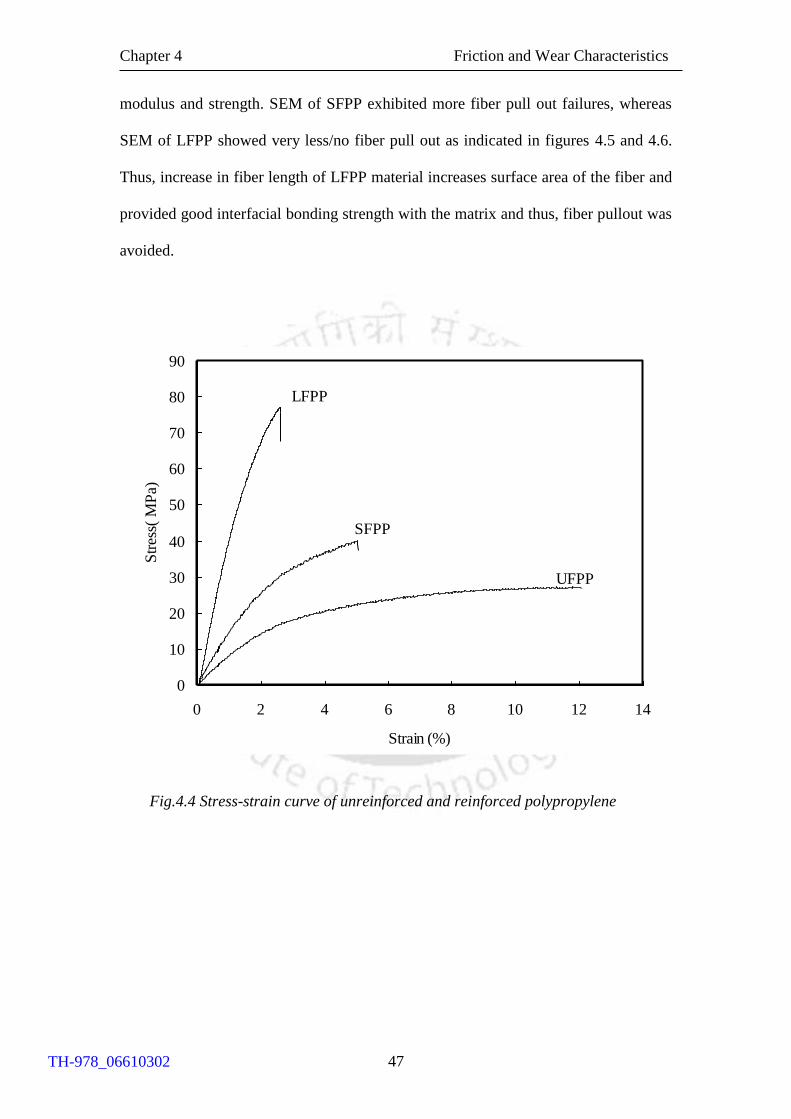
Chapter 4 Friction and Wear Characteristics
47
modulus and strength. SEM of SFPP exhibited more fiber pull out failures, whereas
SEM of LFPP showed very less/no fiber pull out as indicated in figures 4.5 and 4.6.
Thus, increase in fiber length of LFPP material increases surface area of the fiber and
provided good interfacial bonding strength with the matrix and thus, fiber pullout was
avoided.
Fig.4.4 Stress-strain curve of unreinforced and reinforced polypropylene
0
10
20
30
40
50
60
70
80
90
0 2 4 6 8 10 12 14
Strain (%)
Str
ess(
MP
a)
LFPP
SFPP
UFPP
TH-978_06610302
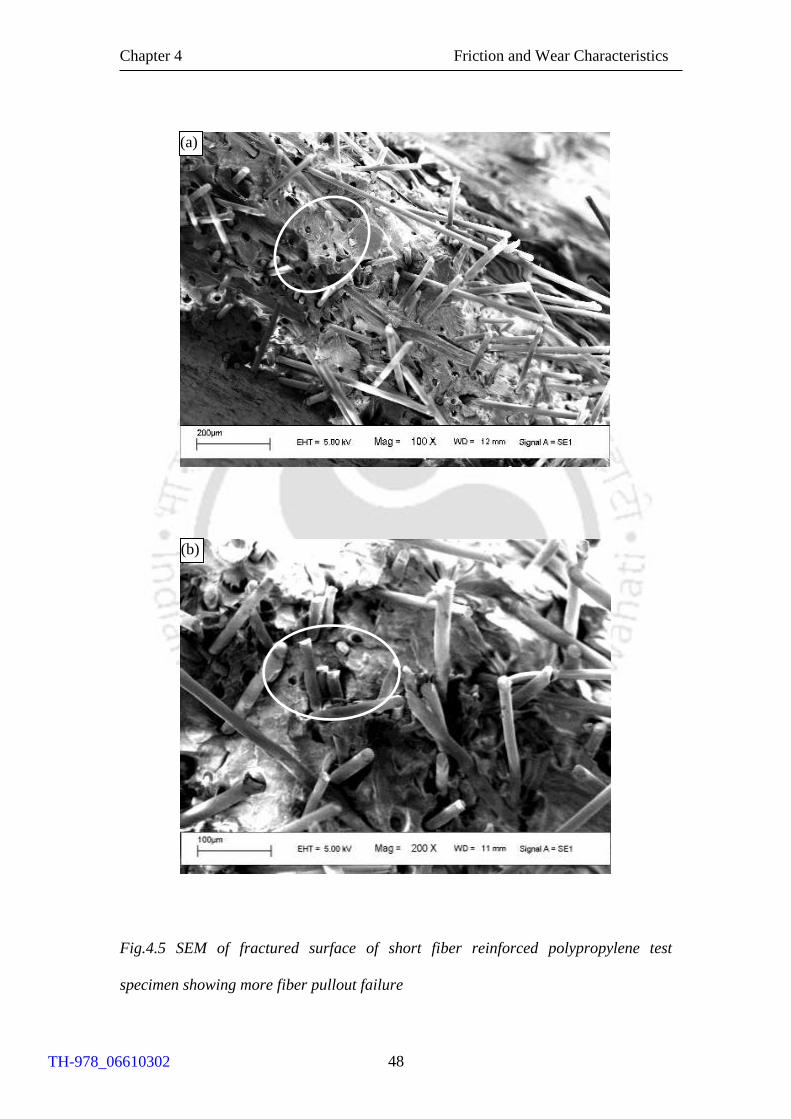
Chapter 4 Friction and Wear Characteristics
48
Fig.4.5 SEM of fractured surface of short fiber reinforced polypropylene test
specimen showing more fiber pullout failure
(b)
(a)
TH-978_06610302
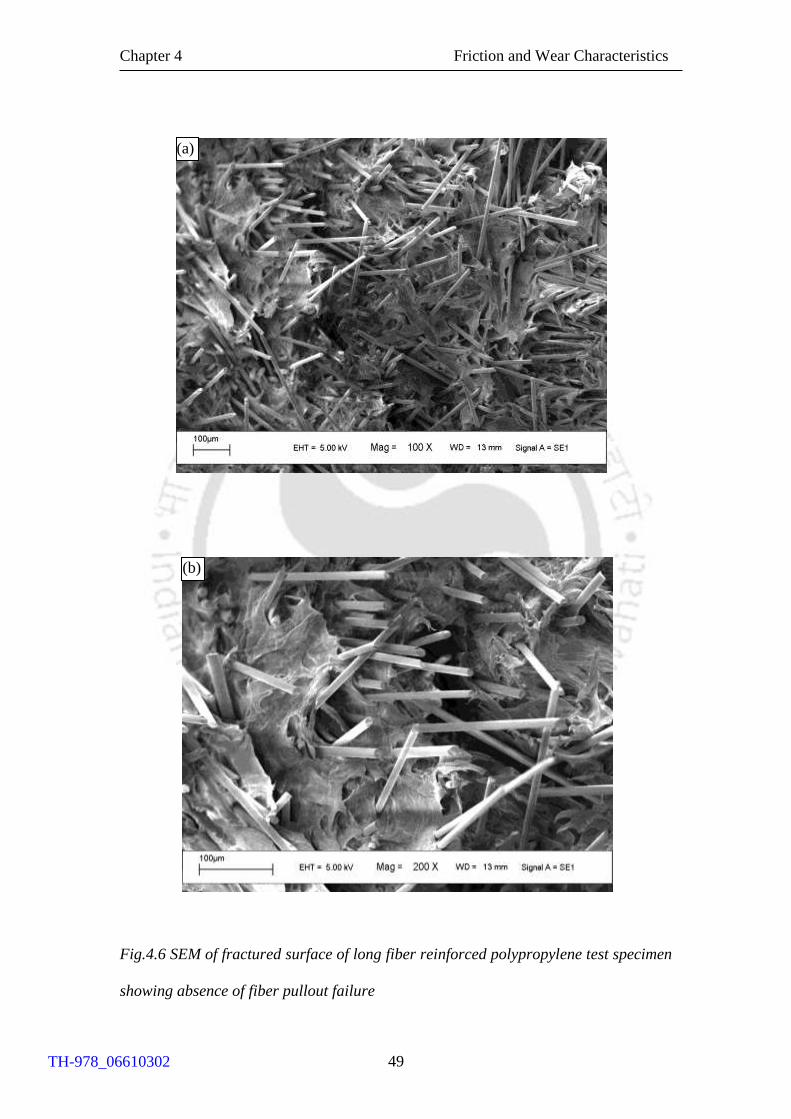
Chapter 4 Friction and Wear Characteristics
49
Fig.4.6 SEM of fractured surface of long fiber reinforced polypropylene test specimen
showing absence of fiber pullout failure
(a)
(b)
TH-978_06610302
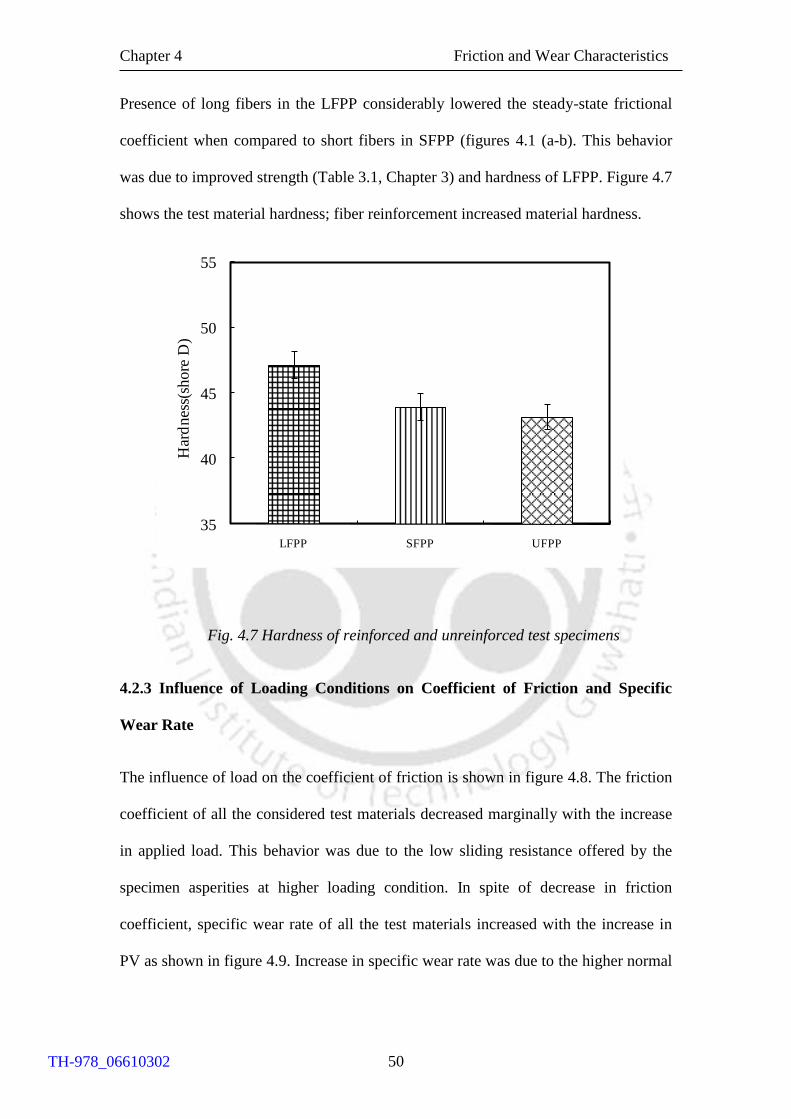
Chapter 4 Friction and Wear Characteristics
50
Presence of long fibers in the LFPP considerably lowered the steady-state frictional
coefficient when compared to short fibers in SFPP (figures 4.1 (a-b). This behavior
was due to improved strength (Table 3.1, Chapter 3) and hardness of LFPP. Figure 4.7
shows the test material hardness; fiber reinforcement increased material hardness.
Fig. 4.7 Hardness of reinforced and unreinforced test specimens
4.2.3 Influence of Loading Conditions on Coefficient of Friction and Specific
Wear Rate
The influence of load on the coefficient of friction is shown in figure 4.8. The friction
coefficient of all the considered test materials decreased marginally with the increase
in applied load. This behavior was due to the low sliding resistance offered by the
specimen asperities at higher loading condition. In spite of decrease in friction
coefficient, specific wear rate of all the test materials increased with the increase in
PV as shown in figure 4.9. Increase in specific wear rate was due to the higher normal
35
40
45
50
55
LFPP SFPP UFPP
Har
dn
ess(
sho
re D
)
TH-978_06610302
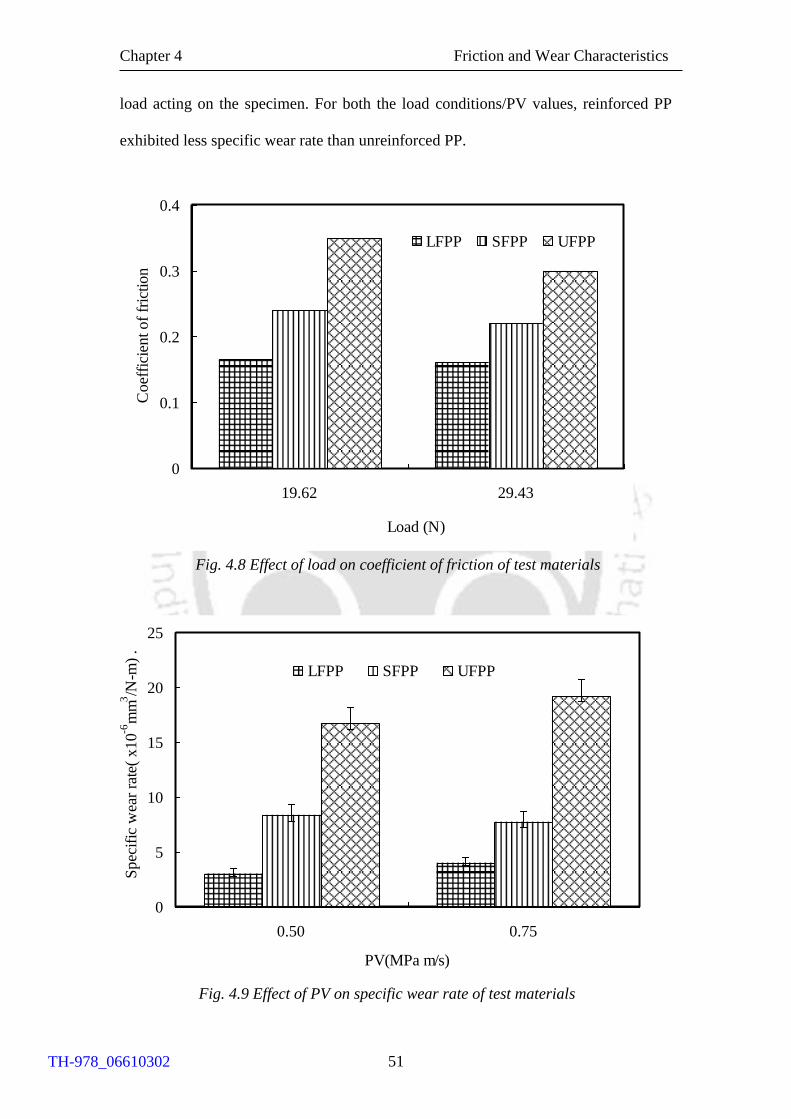
Chapter 4 Friction and Wear Characteristics
51
load acting on the specimen. For both the load conditions/PV values, reinforced PP
exhibited less specific wear rate than unreinforced PP.
Fig. 4.8 Effect of load on coefficient of friction of test materials
0
5
10
15
20
25
0.50 0.75
PV(MPa m/s)
Sp
ecif
ic w
ear
rate
( x
10 -6
mm
3/N
-m)
.
LFPP SFPP UFPP
Fig. 4.9 Effect of PV on specific wear rate of test materials
0
0.1
0.2
0.3
0.4
19.62 29.43
Load (N)
Co
effi
cien
t o
f fr
ictio
nn
LFPP SFPP UFPP
TH-978_06610302

Chapter 4 Friction and Wear Characteristics
52
Unal et al. (2004) confirmed that addition of glass fiber to polytetrafluoroethylene
(PTFE) reduced the wear rate. Among the reinforced PP, LFPP exhibited less specific
wear than SFPP and UFPP. This behavior was due to the improved fiber matrix
bonding. Khedkar et al. (2002) observed enhanced wear resistance in long glass fiber
polytetraflouroethylene and reported the importance of higher aspect ratio in
improving the adhesion between fiber to the matrix due to more surface area of the
fiber in contact. Dwivedi and Chand (2009) visualized the improved wear resistance
in sisal fiber reinforced polypropylene with the addition of maleic anhydride and
highlighted the enhanced fiber matrix bonding strength between fiber and matrix.
Figure 4.10(a) showed the smooth shiny surface embedded with fine worn particles of
glass fiber, upon sliding smooth surface was created which considerably reduced the
specific wear rate than other two considered materials. Scratch marks in the sliding
direction of long fiber reinforced PP (figure 4.10b) depicts the ability of long
reinforced glass fibers in withstanding the hard protuberance due to counterface.
Fig. 4.10 Topography of long fiber reinforced PP at 29.43N
Shinning embedded
glass particles
(a)
100μm
Scratch marks
(b)
100μm
TH-978_06610302
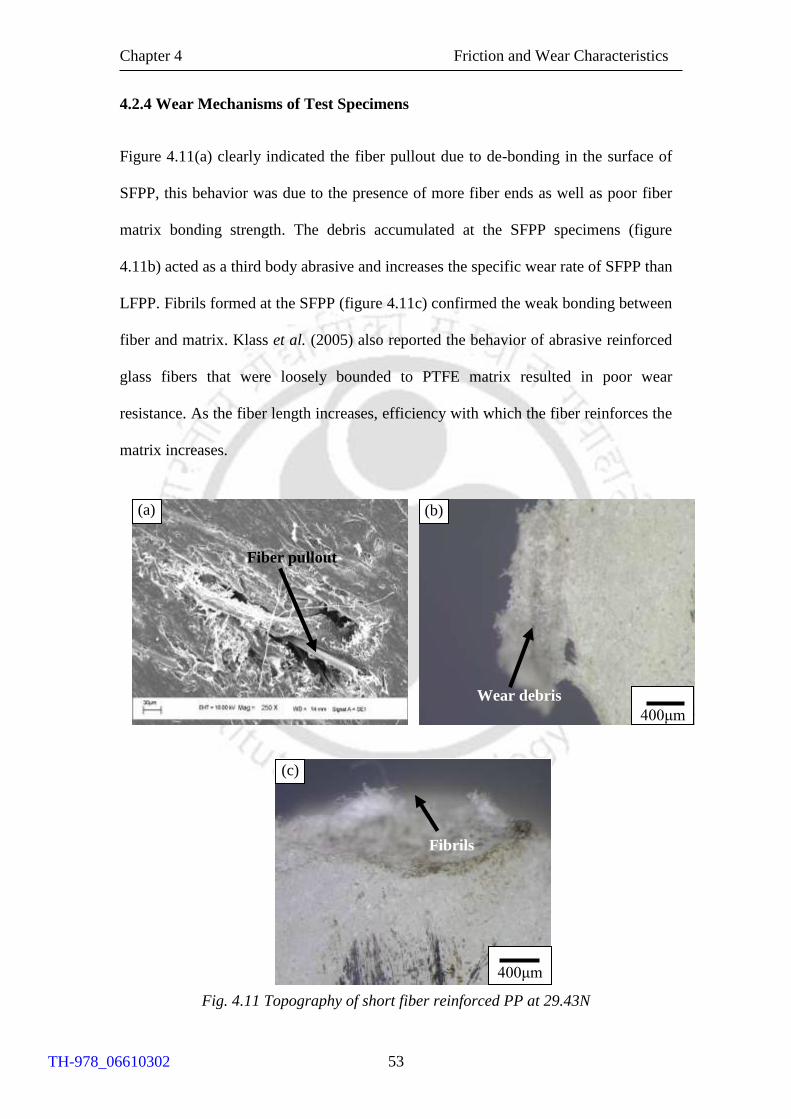
Chapter 4 Friction and Wear Characteristics
53
4.2.4 Wear Mechanisms of Test Specimens
Figure 4.11(a) clearly indicated the fiber pullout due to de-bonding in the surface of
SFPP, this behavior was due to the presence of more fiber ends as well as poor fiber
matrix bonding strength. The debris accumulated at the SFPP specimens (figure
4.11b) acted as a third body abrasive and increases the specific wear rate of SFPP than
LFPP. Fibrils formed at the SFPP (figure 4.11c) confirmed the weak bonding between
fiber and matrix. Klass et al. (2005) also reported the behavior of abrasive reinforced
glass fibers that were loosely bounded to PTFE matrix resulted in poor wear
resistance. As the fiber length increases, efficiency with which the fiber reinforces the
matrix increases.
Fig. 4.11 Topography of short fiber reinforced PP at 29.43N
Fiber pullout
(a)
Fibrils
400μm
(c)
Wear debris
(b)
400μm
TH-978_06610302

Chapter 4 Friction and Wear Characteristics
54
When the load exceeds the maximum allowable fiber strength, fiber breakage failure
can be expected. Formation of grooves and some patches of transfer film on the LFPP
surface served as a stress concentration region which aided fiber breakage. In the
present case, LFPP exhibited broken fibers (figure 4.12a) and fiber entanglement
(figure 4.12b) due to the sufficiently larger fiber length and better fiber matrix bond.
This type of fiber breakage/entanglement in a surface leaves the surface relatively
undisturbed which resulted in good wear resistance. Unreinforced polypropylene
exhibited ductile wear as shown in figures 4.13(a-b) and it was dominated by micro
ploughing (figure 4.13a) and deep grooves (figure 4.13b) caused due to the asperities
of the mating steel disc.
Fig. 4.12 SEM of topography of long fiber reinforced PP at 29.43N
Fig.4.13 SEM of topography of unreinforced PP material at 29.43 N
(a)
Broken fiber
Fiber entanglement
(b)
Micro ploughed
region
(a)
Deeper grooves
(b)
TH-978_06610302

Chapter 4 Friction and Wear Characteristics
55
4.3 ABRASIVE WEAR TEST
Pin on disc test rig used to evaluate adhesive wear was modified to carry out multi
pass abrasive wear test. Silicone carbide emery paper (400 and 320 grit size) was
firmly attached on the steel disc to alter from adhesive to abrasive counter surface
condition. The average particle size of grits 400 and 320 # are 31 and 45 μm
respectively (ISO 8486-2:2007). Abrasive wear tests were conducted at 4.91, 9.81 and
14.72 N normal loads at 0.2 m/s sliding velocity. Tests were conducted under
laboratory conditions, 32 ± 3°C and RH 57 ± 5 %. Test pins were cleaned before
testing and the initial mass was measured using an electronic balance with 0.1 mg
accuracy. Abrasive wear tests were conducted up to a sliding distance of 180 m. The
sampling rate for the friction force and displacement was kept as 0.5 Hz .The wear
loss was quantified by both mass and dimensional loss. The wear volume loss (Km in
mm3) was calculated using equation 4.2
1000)(21
mm
Km
(4.2)
where m1 and m2 are the specimen mass in g before and after testing and is the
material density in g/cm4. Dimensional wear loss was measured using on-line laser
displacement transducer of 2 µm accuracy (Keyence). From the change in length, the
wear volume (Kd in mm3) was calculated using equation 4.3
2
p o
d
πd hK =
4 (4.3)
where dp is the pin diameter in mm and ho is the change in pin length during test
in mm. The worn-out surfaces of the pin and wear debris were observed under
microscope to identify the wear mechanism.
TH-978_06610302
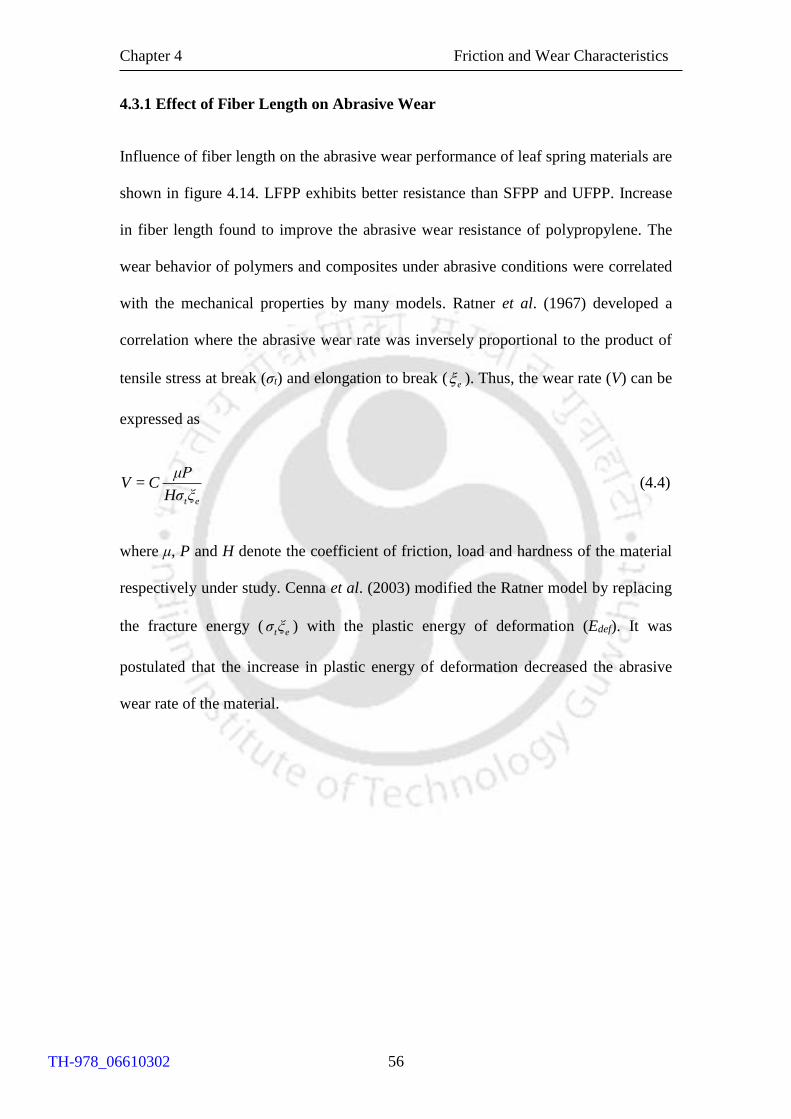
Chapter 4 Friction and Wear Characteristics
56
4.3.1 Effect of Fiber Length on Abrasive Wear
Influence of fiber length on the abrasive wear performance of leaf spring materials are
shown in figure 4.14. LFPP exhibits better resistance than SFPP and UFPP. Increase
in fiber length found to improve the abrasive wear resistance of polypropylene. The
wear behavior of polymers and composites under abrasive conditions were correlated
with the mechanical properties by many models. Ratner et al. (1967) developed a
correlation where the abrasive wear rate was inversely proportional to the product of
tensile stress at break (σt) and elongation to break ( e ). Thus, the wear rate (V) can be
expressed as
t e
μPV = C
Hσ ξ (4.4)
where μ, P and H denote the coefficient of friction, load and hardness of the material
respectively under study. Cenna et al. (2003) modified the Ratner model by replacing
the fracture energy ( t eσ ξ ) with the plastic energy of deformation (Edef). It was
postulated that the increase in plastic energy of deformation decreased the abrasive
wear rate of the material.
TH-978_06610302
Chapter 4 Friction and Wear Characteristics
57
Fig. 4.14 Wear volume at load of 9.81 N for 400# grit size
Fig. 4.15 Experimental setup for constant load indentation test (a) schematic diagram
(b) photograph
Fixed platen
6mm ball
Specimen
Movable platen
(a)
Fixed platen
6mm ball
Specimen
Movable platen
(b)
0
10
20
30
40
50
SFPP LFPP UFPP
Test materials
Wea
r v
olu
me
(mm
3)
.
TH-978_06610302
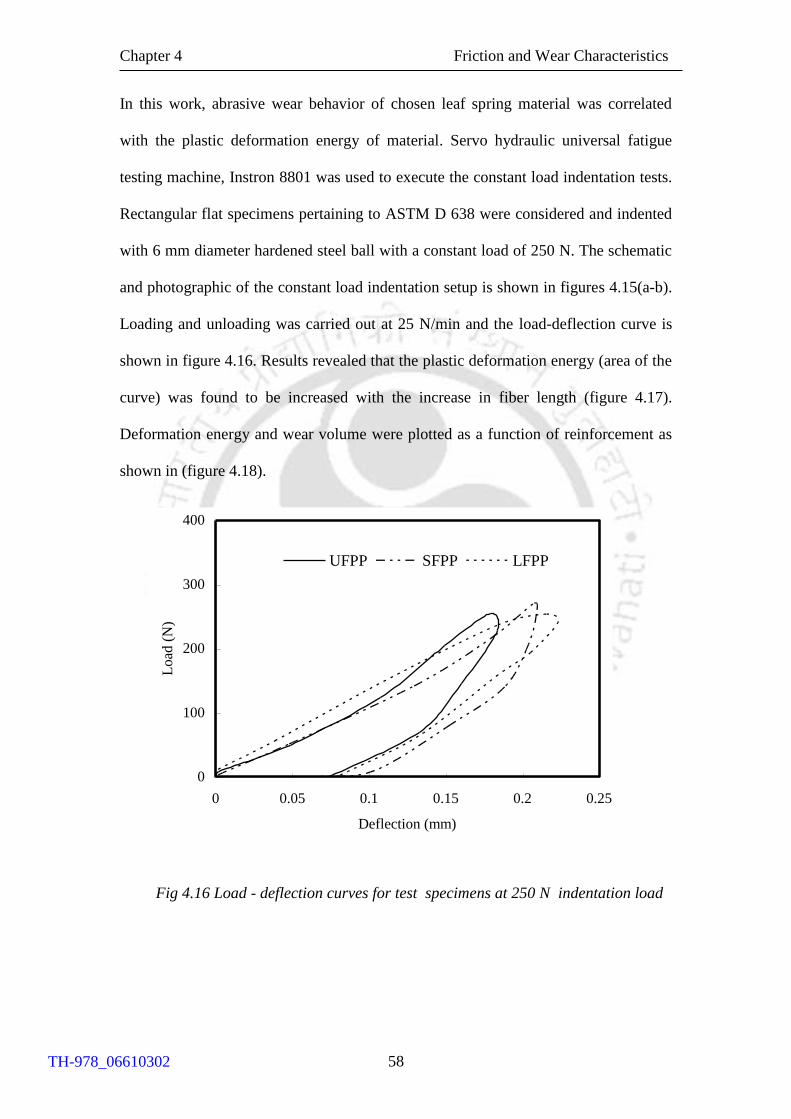
Chapter 4 Friction and Wear Characteristics
58
In this work, abrasive wear behavior of chosen leaf spring material was correlated
with the plastic deformation energy of material. Servo hydraulic universal fatigue
testing machine, Instron 8801 was used to execute the constant load indentation tests.
Rectangular flat specimens pertaining to ASTM D 638 were considered and indented
with 6 mm diameter hardened steel ball with a constant load of 250 N. The schematic
and photographic of the constant load indentation setup is shown in figures 4.15(a-b).
Loading and unloading was carried out at 25 N/min and the load-deflection curve is
shown in figure 4.16. Results revealed that the plastic deformation energy (area of the
curve) was found to be increased with the increase in fiber length (figure 4.17).
Deformation energy and wear volume were plotted as a function of reinforcement as
shown in (figure 4.18).
Fig 4.16 Load - deflection curves for test specimens at 250 N indentation load
0
100
200
300
400
0 0.05 0.1 0.15 0.2 0.25
Deflection (mm)
Load
(N
)
UFPP SFPP LFPP
TH-978_06610302
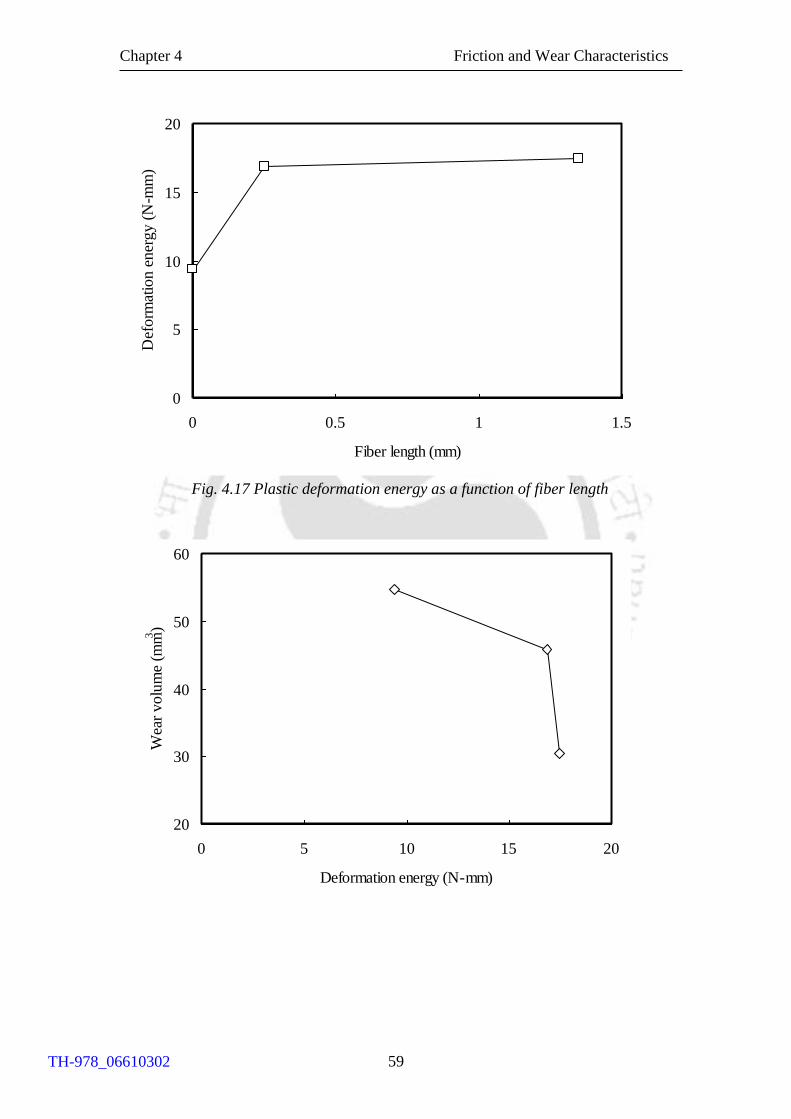
Chapter 4 Friction and Wear Characteristics
59
0
5
10
15
20
0 0.5 1 1.5
Fiber length (mm)
Def
orm
atio
n e
ner
gy (
N-m
m)
.
Fig. 4.17 Plastic deformation energy as a function of fiber length
20
30
40
50
60
0 5 10 15 20
Deformation energy (N-mm)
Wea
r v
olu
me
(mm3
)
TH-978_06610302

Chapter 4 Friction and Wear Characteristics
60
Fig. 4.18 Relation between the wear volume and deformation energy
Three trials were conducted for calculating deformation energy and wear volume;
deviations were found to be 3 and 4.5 % respectively. Plastic energy of deformation
was found to play a vital role in the wear characteristics. In the multi pass abrasive
wear testing, repeated specimen travel over the same wear track accumulates the wear
debris (clogging) in the abrasive grit spaces (Rabinowicz,1995). Clogging
significantly influences the wear of most polymeric materials.
(b)
Clogged layer
Clogged layer
(c)
1mm
1mm
(a)
Clogged layer
1mm
TH-978_06610302
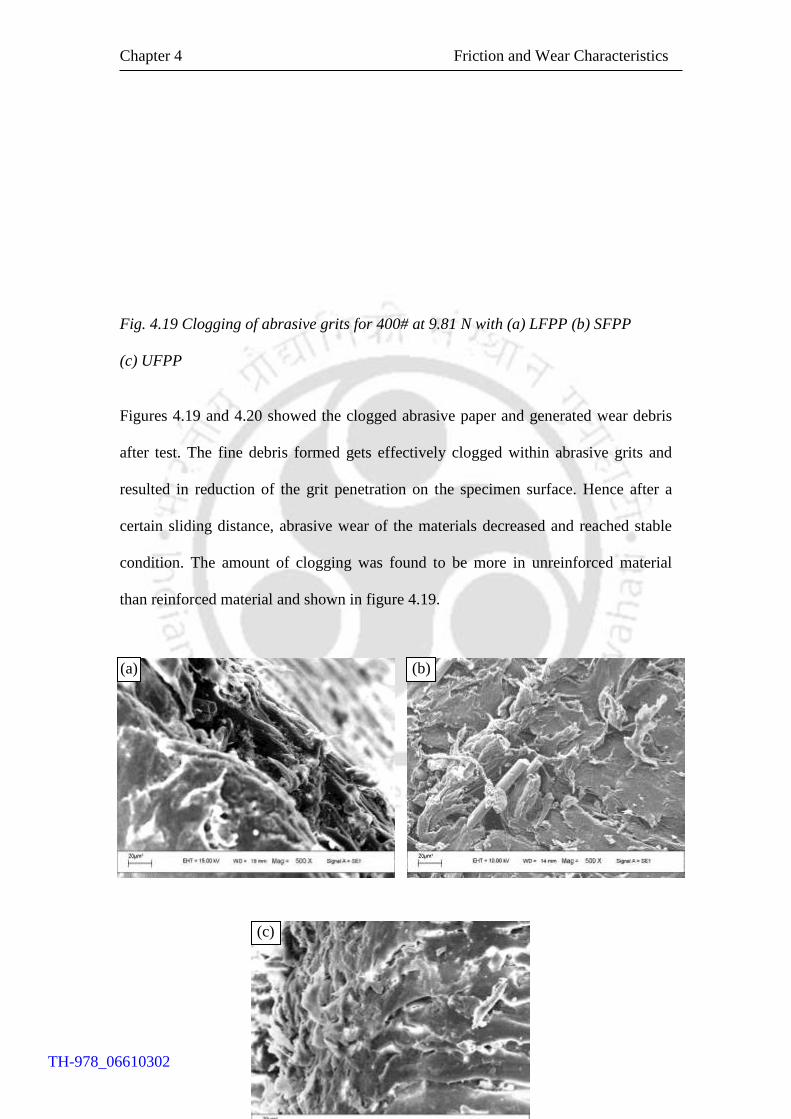
Chapter 4 Friction and Wear Characteristics
61
Fig. 4.19 Clogging of abrasive grits for 400# at 9.81 N with (a) LFPP (b) SFPP
(c) UFPP
Figures 4.19 and 4.20 showed the clogged abrasive paper and generated wear debris
after test. The fine debris formed gets effectively clogged within abrasive grits and
resulted in reduction of the grit penetration on the specimen surface. Hence after a
certain sliding distance, abrasive wear of the materials decreased and reached stable
condition. The amount of clogging was found to be more in unreinforced material
than reinforced material and shown in figure 4.19.
(a) (b)
(c)
TH-978_06610302
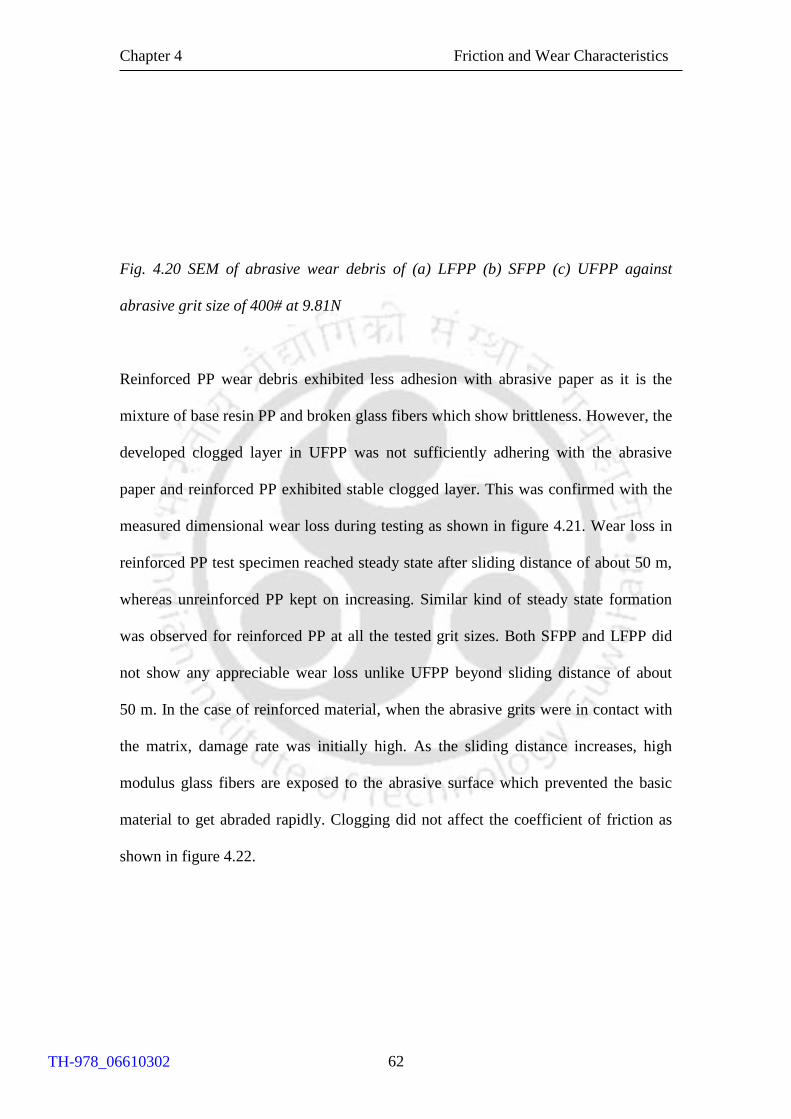
Chapter 4 Friction and Wear Characteristics
62
Fig. 4.20 SEM of abrasive wear debris of (a) LFPP (b) SFPP (c) UFPP against
abrasive grit size of 400# at 9.81N
Reinforced PP wear debris exhibited less adhesion with abrasive paper as it is the
mixture of base resin PP and broken glass fibers which show brittleness. However, the
developed clogged layer in UFPP was not sufficiently adhering with the abrasive
paper and reinforced PP exhibited stable clogged layer. This was confirmed with the
measured dimensional wear loss during testing as shown in figure 4.21. Wear loss in
reinforced PP test specimen reached steady state after sliding distance of about 50 m,
whereas unreinforced PP kept on increasing. Similar kind of steady state formation
was observed for reinforced PP at all the tested grit sizes. Both SFPP and LFPP did
not show any appreciable wear loss unlike UFPP beyond sliding distance of about
50 m. In the case of reinforced material, when the abrasive grits were in contact with
the matrix, damage rate was initially high. As the sliding distance increases, high
modulus glass fibers are exposed to the abrasive surface which prevented the basic
material to get abraded rapidly. Clogging did not affect the coefficient of friction as
shown in figure 4.22.
TH-978_06610302
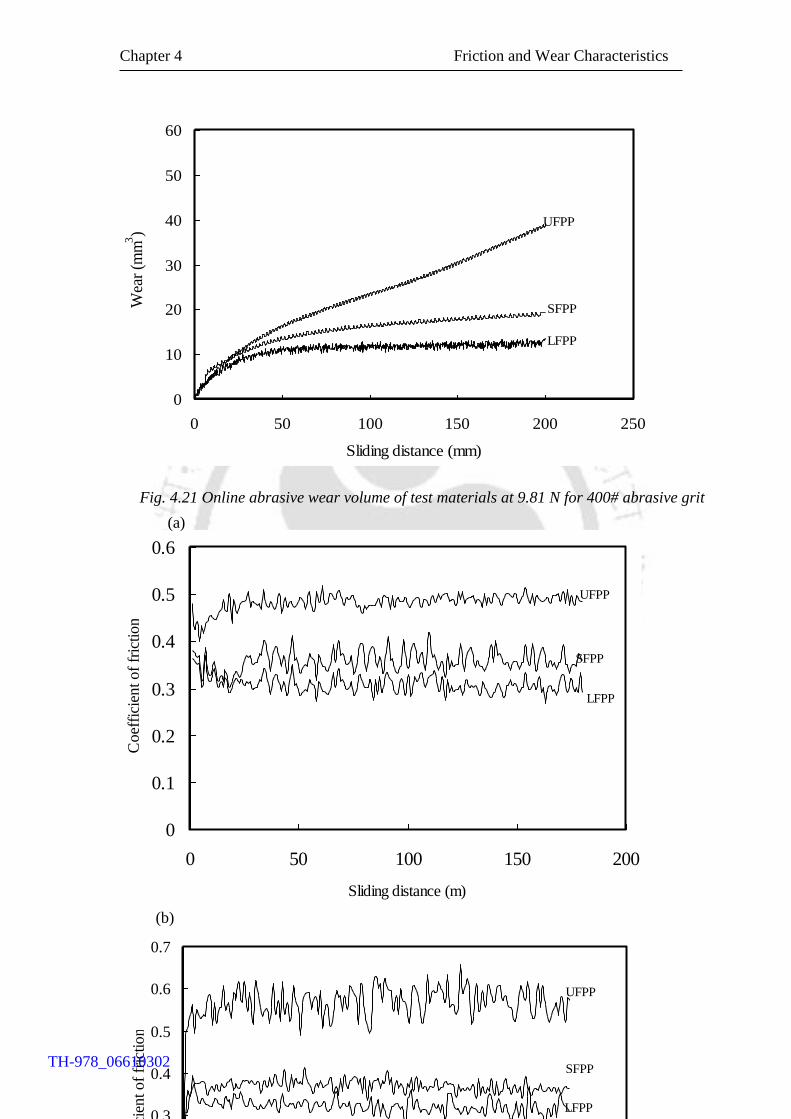
Chapter 4 Friction and Wear Characteristics
63
Fig. 4.21 Online abrasive wear volume of test materials at 9.81 N for 400# abrasive grit
0
10
20
30
40
50
60
0 50 100 150 200 250
Sliding distance (mm)
Wea
r (m
m3)
UFPP
SFPP
LFPP
0
0.1
0.2
0.3
0.4
0.5
0.6
0 50 100 150 200
Sliding distance (m)
Co
effi
cien
t o
f fr
ictio
n-
SFPP
LFPP
UFPP
(a)
0
0.1
0.2
0.3
0.4
0.5
0.6
0.7
0 50 100 150 200Sliding distance (m)
Coef
fici
ent of
fric
tion-
UFPP
SFPP
LFPP
(b)
TH-978_06610302
Chapter 4 Friction and Wear Characteristics
64
Fig. 4.22 Effect of grit size on friction coefficient of test materials at 14.72 N (a) 400#
(b) 320#
For all the considered materials, friction coefficient reached steady state after
traversing a few sliding distance. Reinforced PP exhibited less coefficient of friction
than unreinforced PP.
4.3.2 Effect of Load and Grit Size on the Abrasive Wear Performance
The abrasive wear of the considered materials was significantly influenced by
operating parameters, normal load and abrasive grit size. It was evident from
figure 4.23 that the wear volume was dependent on the grit size. Wear volume of all
the considered materials was found to be high with 320 # for all the tested loading
conditions. When the abrasive wear particle size is large, the real area of contact
between the asperity and abrasive surface is less resulting in high contact stress
(Srinath and Gnanamoorthy, 2006). These stresses at the contact ease the initiation of
cracks and the material was removed easily compared to the abrasive grits of smaller
particle size.
TH-978_06610302

Chapter 4 Friction and Wear Characteristics
65
Fig. 4.23 Effect of grit size on abrasive wear volume at 9.81 N
Fig. 4.24 Effect of load on wear volume of test materials at grit size of 320#
Figure 4.24 shows the effect of load on the abrasive wear volume of the tested
materials. When the load increases, the contact stress increases between the abrasive
0
20
40
60
80
100
120
0 5 10 15 20
Load (N)
Wea
r v
olu
me
(mm
3)
LFPP SFPP UFPP
0
20
40
60
80
100
LFPP SFPP UFPP
Wea
r volu
me
(mm3
) .
320# 400#
TH-978_06610302
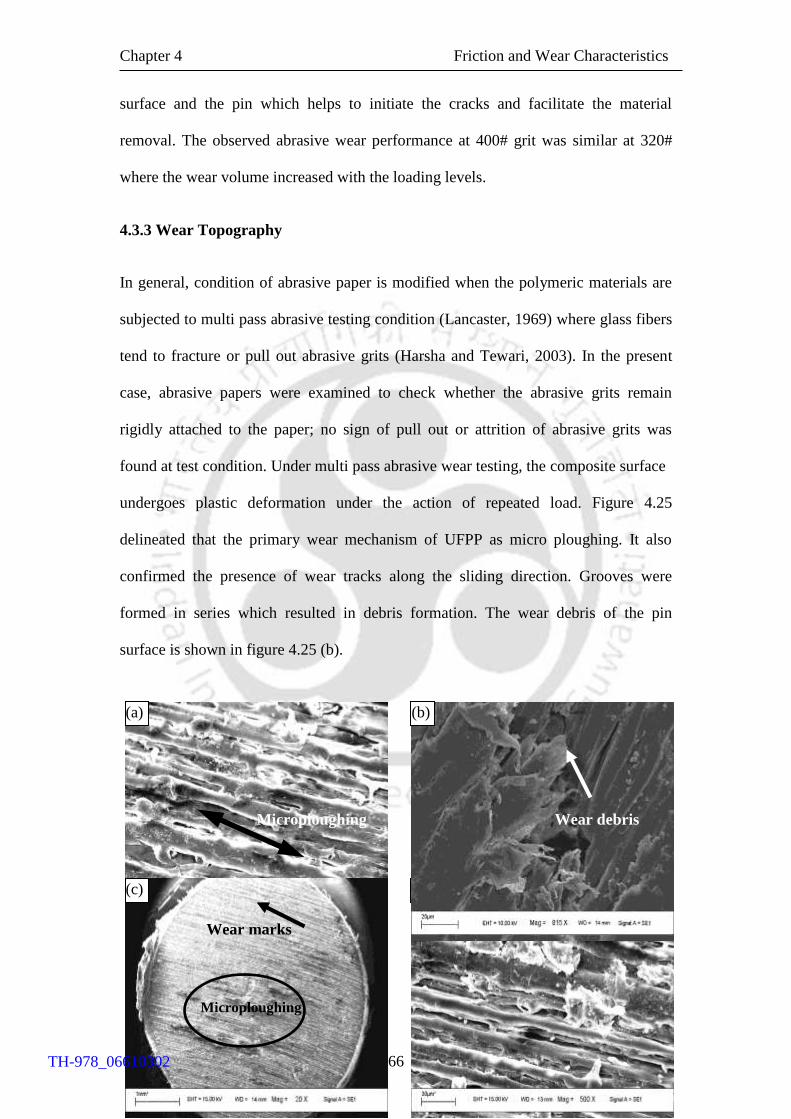
Chapter 4 Friction and Wear Characteristics
66
surface and the pin which helps to initiate the cracks and facilitate the material
removal. The observed abrasive wear performance at 400# grit was similar at 320#
where the wear volume increased with the loading levels.
4.3.3 Wear Topography
In general, condition of abrasive paper is modified when the polymeric materials are
subjected to multi pass abrasive testing condition (Lancaster, 1969) where glass fibers
tend to fracture or pull out abrasive grits (Harsha and Tewari, 2003). In the present
case, abrasive papers were examined to check whether the abrasive grits remain
rigidly attached to the paper; no sign of pull out or attrition of abrasive grits was
found at test condition. Under multi pass abrasive wear testing, the composite surface
undergoes plastic deformation under the action of repeated load. Figure 4.25
delineated that the primary wear mechanism of UFPP as micro ploughing. It also
confirmed the presence of wear tracks along the sliding direction. Grooves were
formed in series which resulted in debris formation. The wear debris of the pin
surface is shown in figure 4.25 (b).
(d)
(a)
Microploughing
(b)
Wear debris
(c)
Wear marks
Microploughing
TH-978_06610302
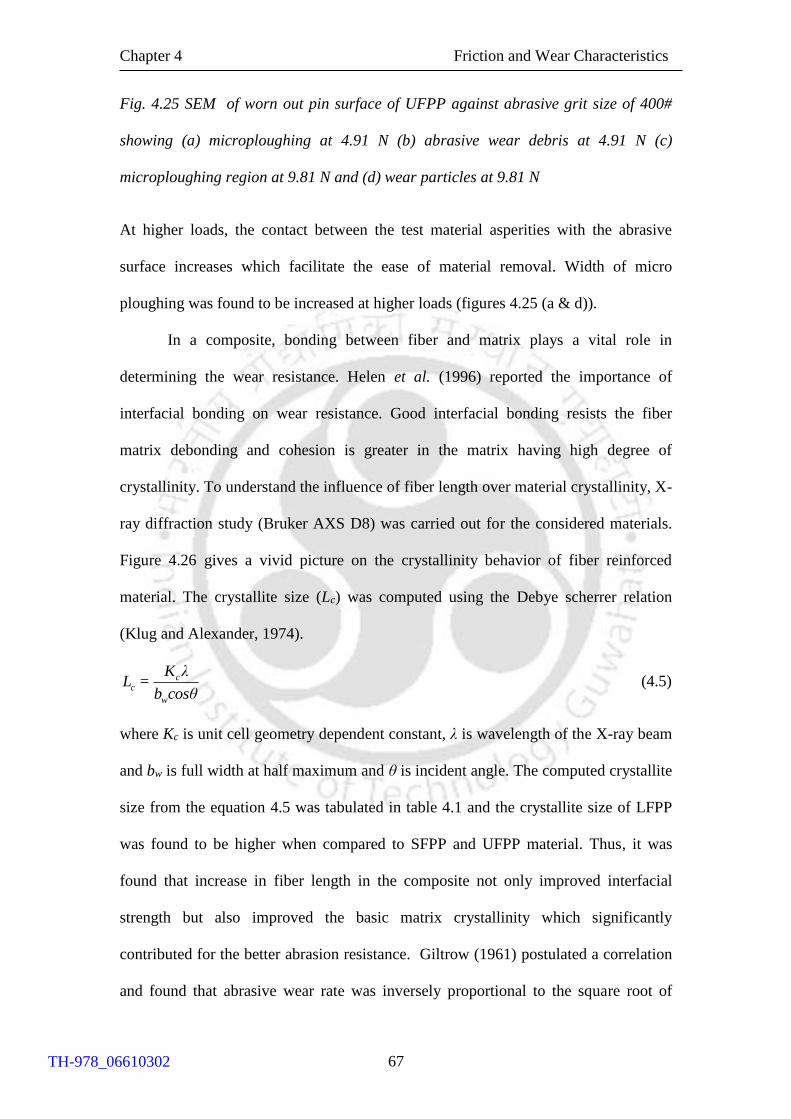
Chapter 4 Friction and Wear Characteristics
67
Fig. 4.25 SEM of worn out pin surface of UFPP against abrasive grit size of 400#
showing (a) microploughing at 4.91 N (b) abrasive wear debris at 4.91 N (c)
microploughing region at 9.81 N and (d) wear particles at 9.81 N
At higher loads, the contact between the test material asperities with the abrasive
surface increases which facilitate the ease of material removal. Width of micro
ploughing was found to be increased at higher loads (figures 4.25 (a & d)).
In a composite, bonding between fiber and matrix plays a vital role in
determining the wear resistance. Helen et al. (1996) reported the importance of
interfacial bonding on wear resistance. Good interfacial bonding resists the fiber
matrix debonding and cohesion is greater in the matrix having high degree of
crystallinity. To understand the influence of fiber length over material crystallinity, X-
ray diffraction study (Bruker AXS D8) was carried out for the considered materials.
Figure 4.26 gives a vivid picture on the crystallinity behavior of fiber reinforced
material. The crystallite size (Lc) was computed using the Debye scherrer relation
(Klug and Alexander, 1974).
cc
w
K λL =
b cosθ (4.5)
where Kc is unit cell geometry dependent constant, λ is wavelength of the X-ray beam
and bw is full width at half maximum and θ is incident angle. The computed crystallite
size from the equation 4.5 was tabulated in table 4.1 and the crystallite size of LFPP
was found to be higher when compared to SFPP and UFPP material. Thus, it was
found that increase in fiber length in the composite not only improved interfacial
strength but also improved the basic matrix crystallinity which significantly
contributed for the better abrasion resistance. Giltrow (1961) postulated a correlation
and found that abrasive wear rate was inversely proportional to the square root of
TH-978_06610302

Chapter 4 Friction and Wear Characteristics
68
material cohesive energy. Briscoe and Evans (1989) reported that the abrasive wear
resistance increased with the improvement in matrix crystallinity. Thus, prior work
confirms the role of matrix crystallinity in influencing the wear performance and in
the present work; increase in fiber length improves matrix crystallinity besides
abrasive wear performance.
Fig. 4.26 X-ray diffraction pattern for leaf spring materials
Table 4.1 Crystallite size for leaf spring materials
Unreinforced PP Short glass fiber reinforced PP Long glass fiber reinforced PP
2
(deg)
FWHM
bw (deg)
Crystallite
size Lc
(Å)
2
(deg)
FWHM
bw (deg)
Crystallite
size Lc
(Å)
2
(deg)
FWHM
bw (deg)
Crystallite
size Lc
(Å)
14.957 0.88600 100.330 14.964 0.74972 118.615 14.987 0.60586 146.784
0
100
200
300
400
500
600
700
12 13 14 15 16 17 2 θ ( degrees )
Inte
nsi
ty c
ou
nt .
LFPP
SFPP
UFPP
TH-978_06610302
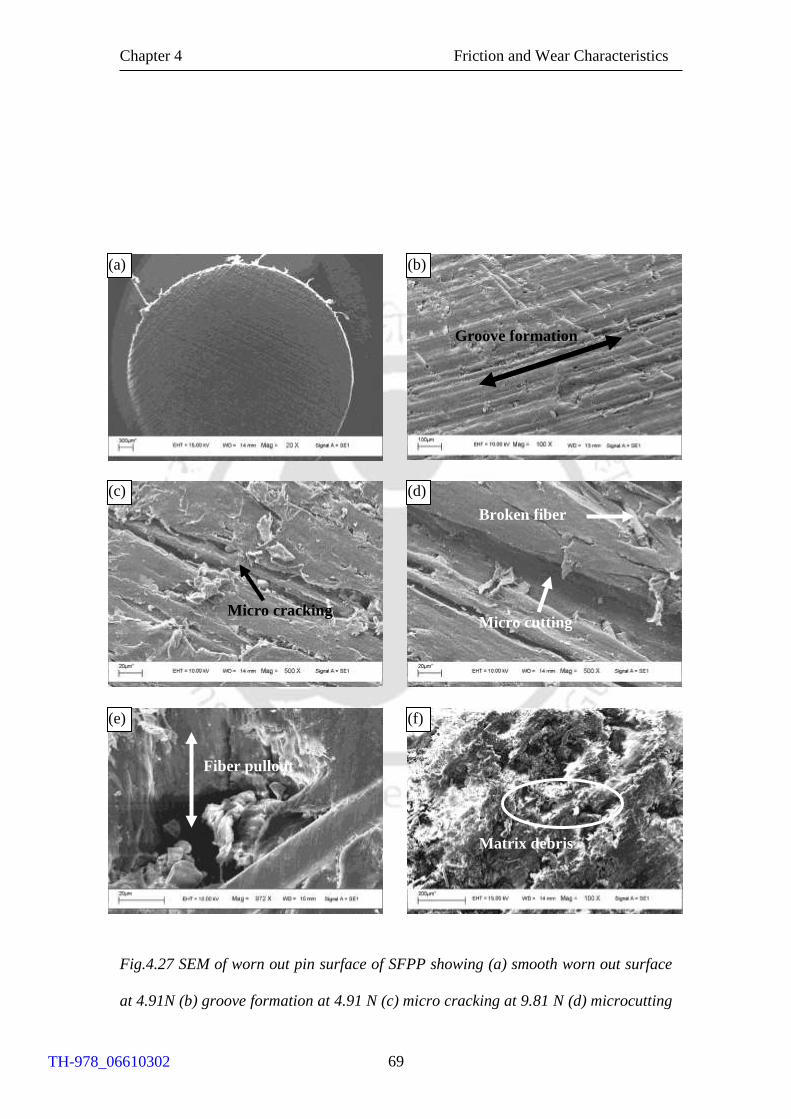
Chapter 4 Friction and Wear Characteristics
69
Fig.4.27 SEM of worn out pin surface of SFPP showing (a) smooth worn out surface
at 4.91N (b) groove formation at 4.91 N (c) micro cracking at 9.81 N (d) microcutting
Groove formation
(b) (a)
(c)
Micro cracking
(d)
Micro cutting
Broken fiber
(e)
Fiber pullout
(f)
Matrix debris
TH-978_06610302

Chapter 4 Friction and Wear Characteristics
70
at 14.72N (e) fiber pullout at 14.72 N and (f) matrix debris in 320# abrasive sheet at
14.72N.
The surface wear morphology of LFPP and SFPP specimens revealed micro cutting as
primary wear mechanism. In the case of SFPP at lower loads, the wear was observed
due to micro ploughing in which the matrix was deteriorated and fibers were exposed.
This behavior was confirmed with the presence of grooves in sliding direction as
shown in figures 4.27(a-b). When the load increases, micro cracking followed by
micro cutting was observed and shown in figures 4.27(c-d). Repetitive passage of
abrasive particles resulted in micro cracking and fiber pullout as shown in figure 4.27
(e). Figure 4.27 (f) showed the presence of broken glass fibers along with matrix
debris in the abrasive sheet.
Increased aspect ratio of fibers in LFPP contribute to have good interfacial
adhesive force between fiber and matrix which results in high ploughing force
requirement for the matrix rupture. Smooth worn out surface observed in LFPP at
loading of 4.91 N shown in figure 4.28 (a) confirmed this behavior. Clogged wear
debris observed on the abrasive sheet with less and small size debris (figure 4.28 b)
supported the enhanced abrasive wear resistance. High matrix crystallinity and high
aspect ratio summarily prevented micro cracking. Micrographs of LFPP (figures 4.28
(c-e)) revealed that, at lower loads the damage towards fiber breakage was found to be
less; at higher loads more fibers tend to break. Due to the improved fiber matrix
adhesion, de-bonding was not observed in LFPP which contributed to less wear.
TH-978_06610302
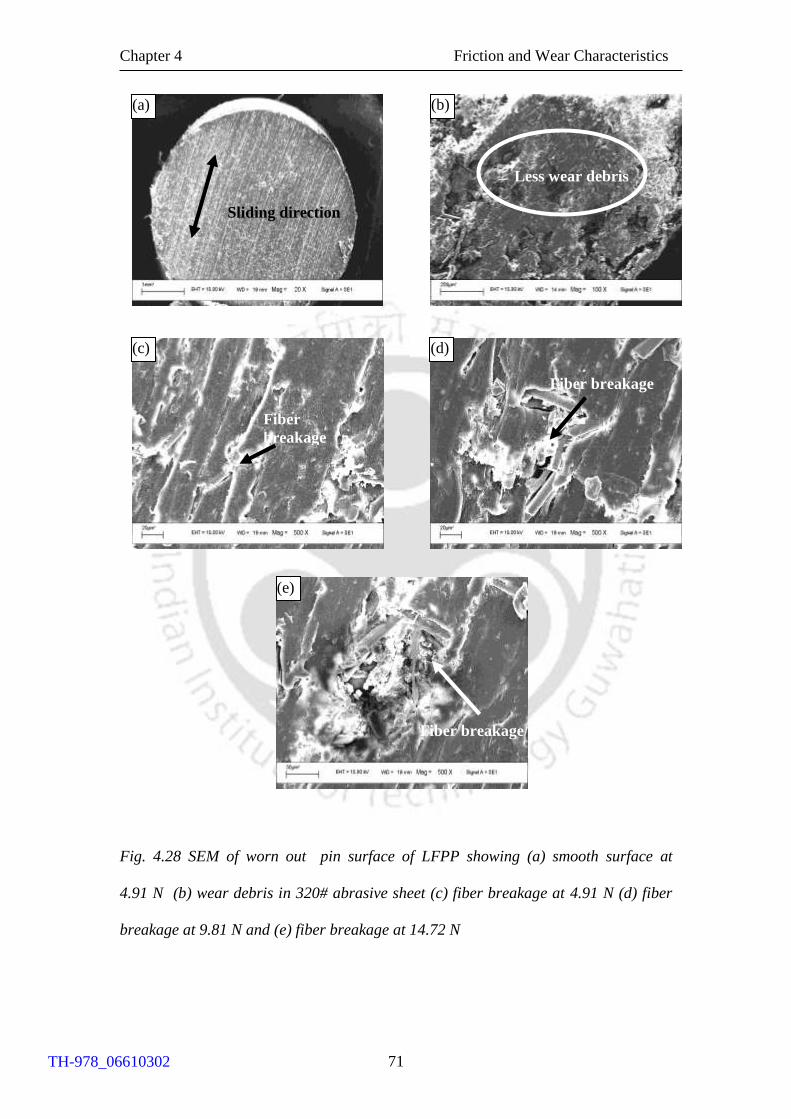
Chapter 4 Friction and Wear Characteristics
71
Fig. 4.28 SEM of worn out pin surface of LFPP showing (a) smooth surface at
4.91 N (b) wear debris in 320# abrasive sheet (c) fiber breakage at 4.91 N (d) fiber
breakage at 9.81 N and (e) fiber breakage at 14.72 N
(b)
Less wear debris
(a)
Sliding direction
(d)
Fiber breakage
(e)
Fiber breakage
(c)
Fiber
breakage
TH-978_06610302
Chapter 4 Friction and Wear Characteristics
72
4.4 SUMMARY
Friction and wear characteristics were investigated for the leaf spring materials
under adhesive and abrasive modes using pin on disc test configuration. Plastic
deformation energy and crystallite size of the test materials were correlated with the
wear performance.
Fiber reinforcement improved the hardness and effectively reduced the coefficient
of friction than unreinforced material. Among the reinforcement LFPP showed
less specific wear rate compared to SFPP in adhesive as well as abrasive modes.
Improved fiber matrix bonding and presence of less fiber ends in LFPP improved
wear resistance compared to that of SFPP and UFPP. Specific wear rate and wear
volume of the test materials increased with the increase in load during adhesive
and abrasive modes for all the materials.
Transfer film formation and clogging on the counter face significantly affected the
friction-wear behavior during adhesive and abrasive modes respectively. Transfer
layer and clogged layer were found to be more pronounced in unreinforced
material than reinforced material.
LFPP exhibited improved plastic deformation energy and matrix crystallinity
resulted in superior wear resistance compared to that of SFPP and UFPP.
Under abrasive mode, UFPP, SFPP and LFPP exhibited microploughing, fiber
pullout and fiber breakage respectively as the dominant failure morphology.
TH-978_06610302
Chapter 5 Damping characteristics
73
CHAPTER 5
DAMPING CHARACTERISTICS OF THERMOPLASTIC
LEAF SPRING MATERIAL
5.1 INTRODUCTION
Fatigue resistance with excellent damping is the most desirable material
characteristics for leaf spring application (Adams and Maheri, 2003). Inherent
material damping characteristics of the composite material aid to replace steel in
suspension spring application (Beardmore and Johnson, 1986). Fiber reinforcement in
the polymeric material not only enhances strength and stiffness but also alters the
damping characteristics of the composite. Enhanced stiffness along with good
damping characteristics of discontinuous fiber reinforced thermoplastic material suits
many anti-vibration applications. Complete and systematic understanding of all the
damping sources of the discontinuous fiber reinforced thermoplastic material is
necessary for designing this class of materials for leaf spring application.
Discontinuous fibers in the composite alters damping characteristics owing to the
presence of fiber-matrix interfacial bond, voids and stress concentrations around fiber
ends (Nelson and Hancock, 1978; Kenny and Marchetti, 1995; Chandra et al., 1999).
Discontinuous fibers in the composite alters damping characteristics owing to the
presence of fiber-matrix interfacial bond, voids and stress concentrations around fiber
ends (Nelson and Hancock, 1978; Kenny and Marchetti, 1995; Chandra et al., 1999).
If the bonding between fiber / matrix is less, then the damping capacity developed by
the composite was found to be more. Gupta et al. (1990) performed tensile test in
short glass fiber reinforced polypropylene and investigated various types of energy
TH-978_06610302
Chapter 5 Damping characteristics
74
absorbing mechanisms and reported that debonding and fibre pull-out at the fracture
surfaces are the two primary phenomenons influencing the energy absorbing
mechanisms. Kultural and Eryurek (2007) evaluated fatigue performance of
polypropylene with different percentage of calcium carbonate and confirmed that with
the increase in filler content, hysteretic heating and damping capacity was found to be
increased. Gassan and Bledzki (2000) investigated the dynamic performance of jute
fiber reinforced polypropylene and reported that the strong fiber matrix adhesion
enhanced the dynamic modulus of the composite and found to reduce the specific
damping capacity. Material damping influences hysteresis heating as well as the
ability to absorb vibration during service and hence, a better understanding of the
interaction between fatigue damage and damping is essential to design and utilize
these materials for better fatigue resistance and damping (Senthilvelan and
Gnanamoorthy, 2006).
Many research works have been carried out to understand the influence of
fibers on the damping behavior of thermoset and thermoplastic laminate materials
(Hadi and Ashton, 1996; Lee et al., 1994; Chandra et al., 1999; Adams and Maheri,
2003). Various works were carried out in the past to understand the damping
mechanism of discontinuous fiber reinforced thermoplastic materials (Crema et al.,
1989; Wray et al., 1990; Kultural and Eryurek 2007), however, the influence of fiber
length towards damping performance of the thermoplastic composites was not
investigated.
In this chapter, damping performance was evaluated and reported for leaf
spring materials; unreinforced, 20 % short and long glass fiber reinforced
polypropylene materials by subjecting to elastic and plastic deformation as well as
free and forced vibration tests. Logarithmic decrement and phase lag between excited
TH-978_06610302
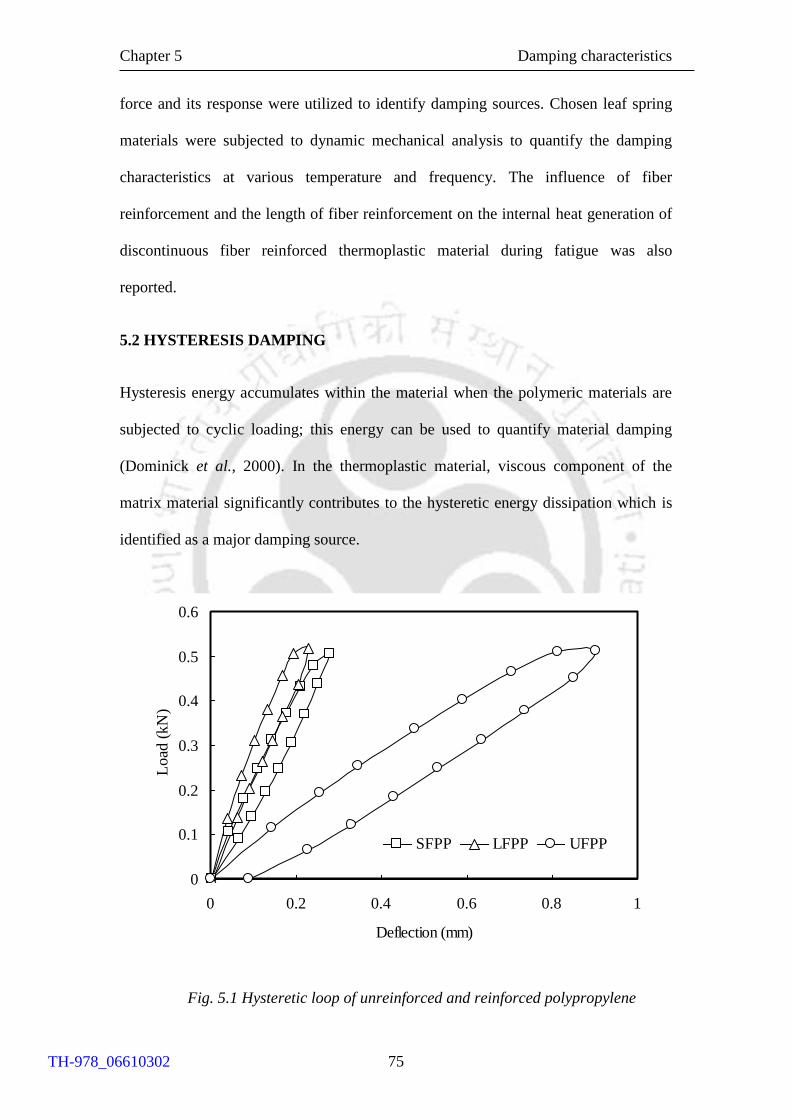
Chapter 5 Damping characteristics
75
force and its response were utilized to identify damping sources. Chosen leaf spring
materials were subjected to dynamic mechanical analysis to quantify the damping
characteristics at various temperature and frequency. The influence of fiber
reinforcement and the length of fiber reinforcement on the internal heat generation of
discontinuous fiber reinforced thermoplastic material during fatigue was also
reported.
5.2 HYSTERESIS DAMPING
Hysteresis energy accumulates within the material when the polymeric materials are
subjected to cyclic loading; this energy can be used to quantify material damping
(Dominick et al., 2000). In the thermoplastic material, viscous component of the
matrix material significantly contributes to the hysteretic energy dissipation which is
identified as a major damping source.
Fig. 5.1 Hysteretic loop of unreinforced and reinforced polypropylene
0
0.1
0.2
0.3
0.4
0.5
0.6
0 0.2 0.4 0.6 0.8 1
Deflection (mm)
Load
(k
N)
SFPP LFPP UFPP
TH-978_06610302
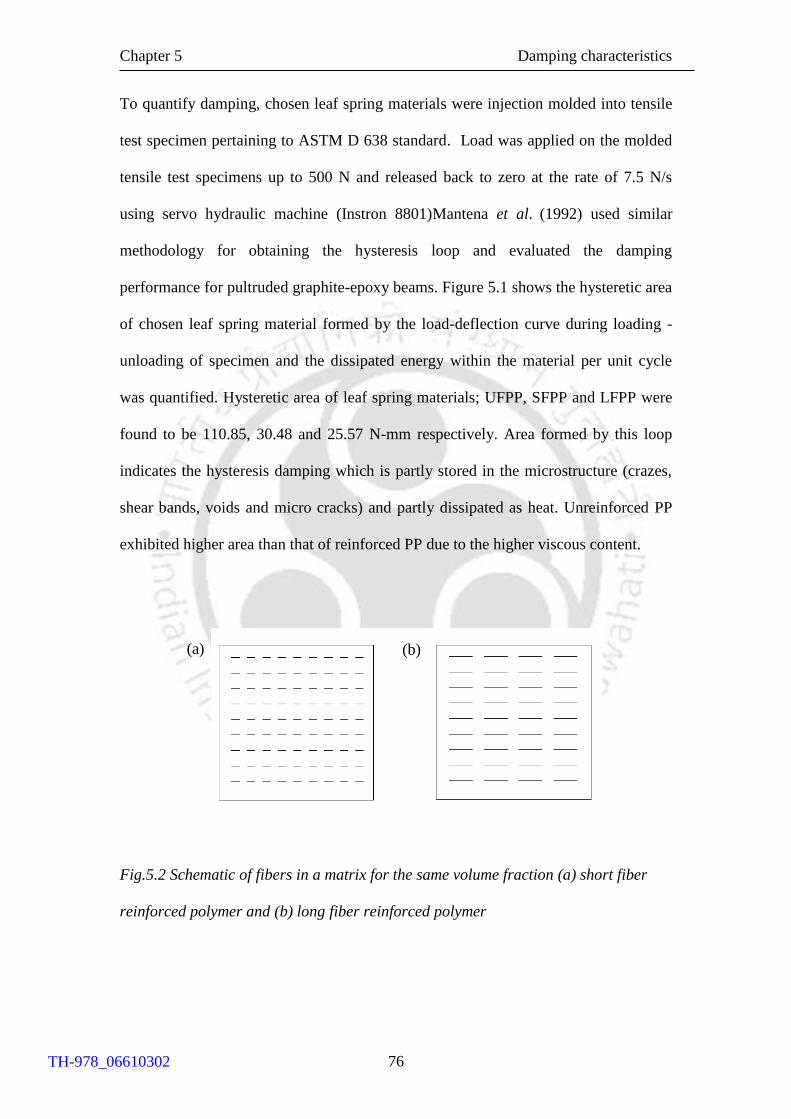
Chapter 5 Damping characteristics
76
To quantify damping, chosen leaf spring materials were injection molded into tensile
test specimen pertaining to ASTM D 638 standard. Load was applied on the molded
tensile test specimens up to 500 N and released back to zero at the rate of 7.5 N/s
using servo hydraulic machine (Instron 8801)Mantena et al. (1992) used similar
methodology for obtaining the hysteresis loop and evaluated the damping
performance for pultruded graphite-epoxy beams. Figure 5.1 shows the hysteretic area
of chosen leaf spring material formed by the load-deflection curve during loading -
unloading of specimen and the dissipated energy within the material per unit cycle
was quantified. Hysteretic area of leaf spring materials; UFPP, SFPP and LFPP were
found to be 110.85, 30.48 and 25.57 N-mm respectively. Area formed by this loop
indicates the hysteresis damping which is partly stored in the microstructure (crazes,
shear bands, voids and micro cracks) and partly dissipated as heat. Unreinforced PP
exhibited higher area than that of reinforced PP due to the higher viscous content.
Fig.5.2 Schematic of fibers in a matrix for the same volume fraction (a) short fiber
reinforced polymer and (b) long fiber reinforced polymer
(a) (b)
TH-978_06610302
Chapter 5 Damping characteristics
77
Among reinforcement material, SFPP exhibited higher hysteresis area than LFPP due
to the presence of more fiber ends/fiber matrix interface area. For the fixed volume
fraction of reinforcement, due to the higher fiber ends and fiber matrix interface area
(figure 5.2), short fiber reinforced material exhibited superior hysteretic damping
characteristics than that of long fiber reinforced material.
5.3 DAMPING DUE TO FIBER-MATRIX INTERFACE
In the composites interface between fiber and the supporting matrix is one of the
major damping sources; ideal interface transfers the entire load from matrix to fiber
and do not contribute to the damping (Chandra et al., 1999). To quantify damping due
to the fiber matrix interface, tensile test was carried out on chosen material and
fractured surfaces were investigated to understand the fiber- matrix interface as
discussed in section 4.2.2 (Figures 4.5 & 4.6). Addition of reinforcement increased
material modulus and strength. Increase in fiber length of LFPP material increases
surface area of the fiber and provided good interfacial bonding strength with the
matrix and thus, fiber pullout was avoided. In the interfacial bonding of fiber and
matrix, fiber end is identified as the weakest region and more energy is absorbed in
this region and results in improved damping. Due to the more fiber ends (figure 5.2)
damping due to fiber matrix interface was higher in SFPP than that of LFPP. Higher
strength and modulus of LFPP also confirms less fiber-matrix debonding. Gassan and
Bledzki (2000) reported that composite having good fiber-matrix adhesion exhibited
less specific damping capacity than composite with poor fiber-matrix adhesion.
TH-978_06610302
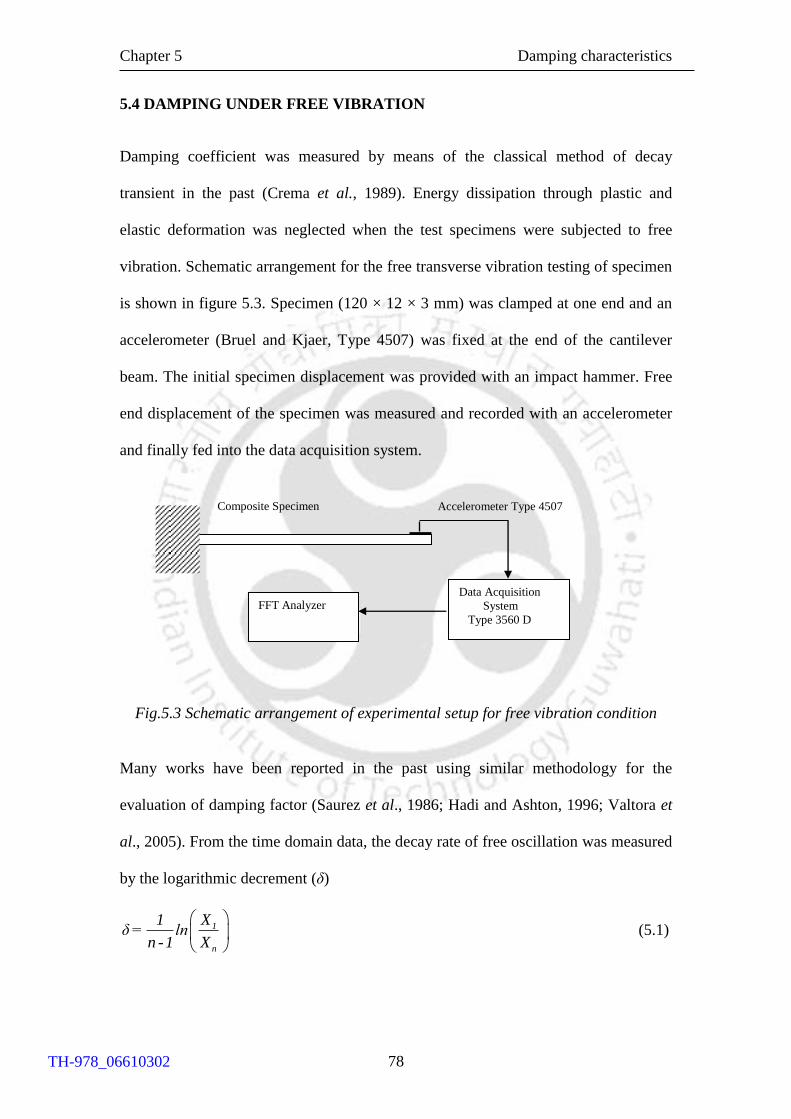
Chapter 5 Damping characteristics
78
5.4 DAMPING UNDER FREE VIBRATION
Damping coefficient was measured by means of the classical method of decay
transient in the past (Crema et al., 1989). Energy dissipation through plastic and
elastic deformation was neglected when the test specimens were subjected to free
vibration. Schematic arrangement for the free transverse vibration testing of specimen
is shown in figure 5.3. Specimen (120 × 12 × 3 mm) was clamped at one end and an
accelerometer (Bruel and Kjaer, Type 4507) was fixed at the end of the cantilever
beam. The initial specimen displacement was provided with an impact hammer. Free
end displacement of the specimen was measured and recorded with an accelerometer
and finally fed into the data acquisition system.
Fig.5.3 Schematic arrangement of experimental setup for free vibration condition
Many works have been reported in the past using similar methodology for the
evaluation of damping factor (Saurez et al., 1986; Hadi and Ashton, 1996; Valtora et
al., 2005). From the time domain data, the decay rate of free oscillation was measured
by the logarithmic decrement (δ)
1
n
X1δ = ln
n -1 X
(5.1)
Data Acquisition
System
Type 3560 D
FFT Analyzer
Accelerometer Type 4507 Composite Specimen
TH-978_06610302
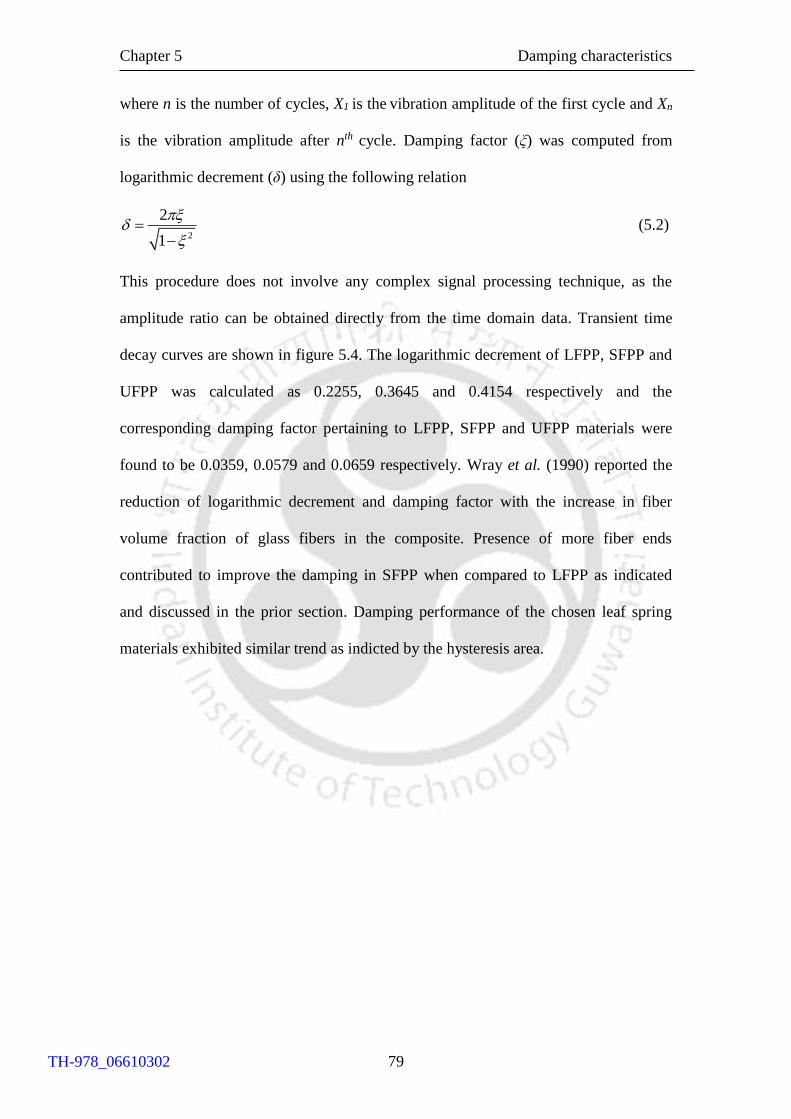
Chapter 5 Damping characteristics
79
where n is the number of cycles, X1 is the vibration amplitude of the first cycle and Xn
is the vibration amplitude after nth cycle. Damping factor (ξ) was computed from
logarithmic decrement (δ) using the following relation
2
2
1
(5.2)
This procedure does not involve any complex signal processing technique, as the
amplitude ratio can be obtained directly from the time domain data. Transient time
decay curves are shown in figure 5.4. The logarithmic decrement of LFPP, SFPP and
UFPP was calculated as 0.2255, 0.3645 and 0.4154 respectively and the
corresponding damping factor pertaining to LFPP, SFPP and UFPP materials were
found to be 0.0359, 0.0579 and 0.0659 respectively. Wray et al. (1990) reported the
reduction of logarithmic decrement and damping factor with the increase in fiber
volume fraction of glass fibers in the composite. Presence of more fiber ends
contributed to improve the damping in SFPP when compared to LFPP as indicated
and discussed in the prior section. Damping performance of the chosen leaf spring
materials exhibited similar trend as indicted by the hysteresis area.
TH-978_06610302
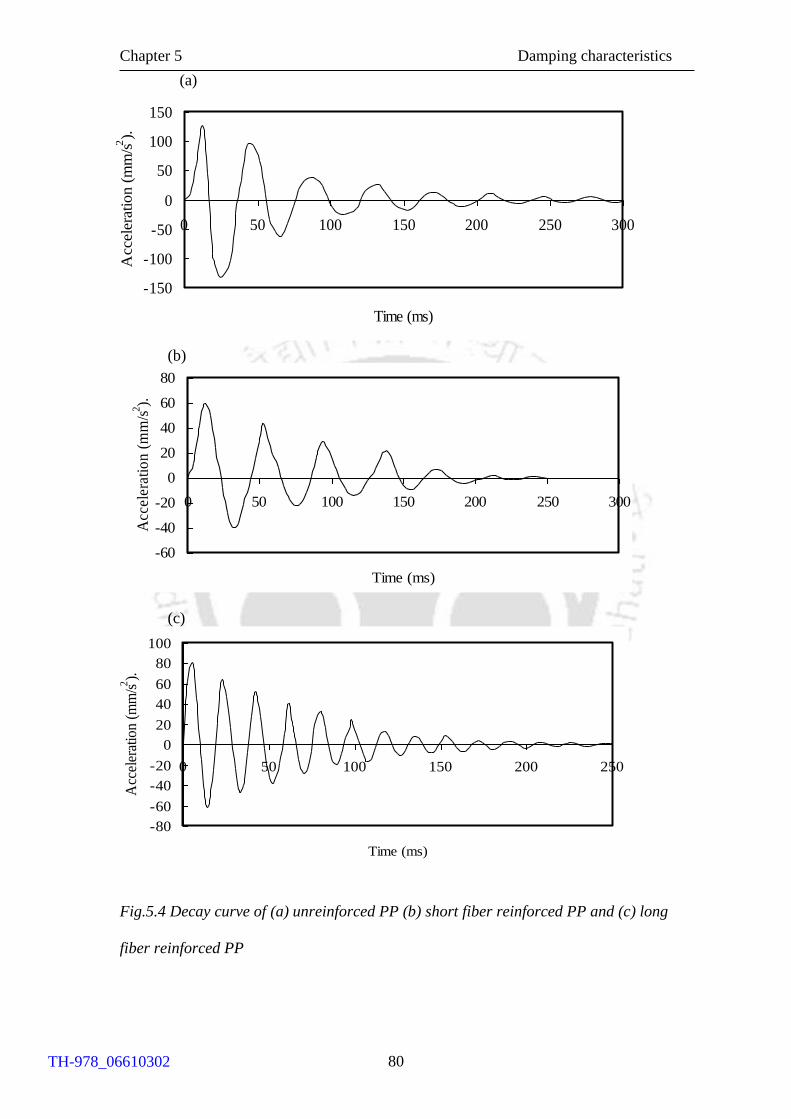
Chapter 5 Damping characteristics
80
Fig.5.4 Decay curve of (a) unreinforced PP (b) short fiber reinforced PP and (c) long
fiber reinforced PP
-150
-100
-50
0
50
100
150
0 50 100 150 200 250 300
Time (ms)
Acc
eler
atio
n (
mm
/s 2).
(a)
-60
-40
-20
0
20
40
60
80
0 50 100 150 200 250 300
Time (ms)
Acc
eler
atio
n (
mm
/s 2).
(b)
-80
-60
-40
-20
0
20
40
60
80
100
0 50 100 150 200 250
Time (ms)
Acc
eler
atio
n (
mm
/s 2).
(c)
TH-978_06610302
Chapter 5 Damping characteristics
81
5.5 DAMPING UNDER FORCED VIBRATION
Energy dissipation through plastic deformation was neglected when the test
specimens were subjected to forced vibration. Schematic and experimental
arrangements for the forced transverse vibrations of the composite specimen are
shown in figures 5.5(a-c). Test specimen was clamped at one end and the force
transducer (Bruel and Kjaer, 8230-001) was fixed above the exciter and connected at
the other end. An accelerometer was fixed at free end and the signals from the
accelerometer (Bruel and Kjaer, Type 4507) and force transducer were measured and
stored with respect to time. The schematic of exciting force and its response are
shown in figure 5.6 and the phase lag () was evaluated using following relation
0360lt
T (5.3)
where T is the time period for one cycle and tl is the time lag in s between exciting
forcing and response. Three trials were conducted for all the chosen leaf spring
materials. Phase lag is the time by which the response lags behind the exciting force
and it is a measure of the damping. Valtorta et al. (2005) used similar technique by
measuring the phase difference between excitation and response for polypropylene
fibers and later compared damping measurements from standard dynamic mechanical
analysis technique
Fig.5.5a Schematic diagram of experimental setup for forced vibration condition
Exciter Force transducer
Composite Specimen Accelerometer
Data Acquisition
System
(a)
TH-978_06610302
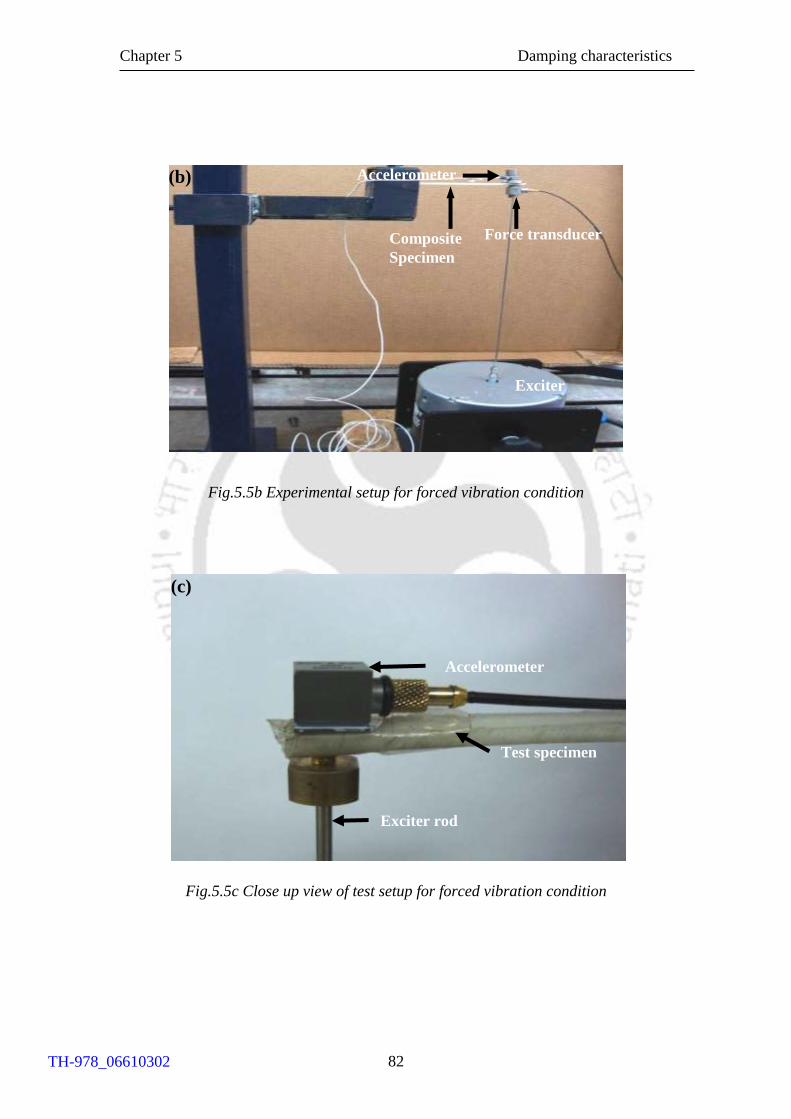
Chapter 5 Damping characteristics
82
Fig.5.5b Experimental setup for forced vibration condition
Fig.5.5c Close up view of test setup for forced vibration condition
Exciter rod
Test specimen
Accelerometer
(c)
Composite
Specimen
Accelerometer
Force transducer
Exciter
(b)
TH-978_06610302
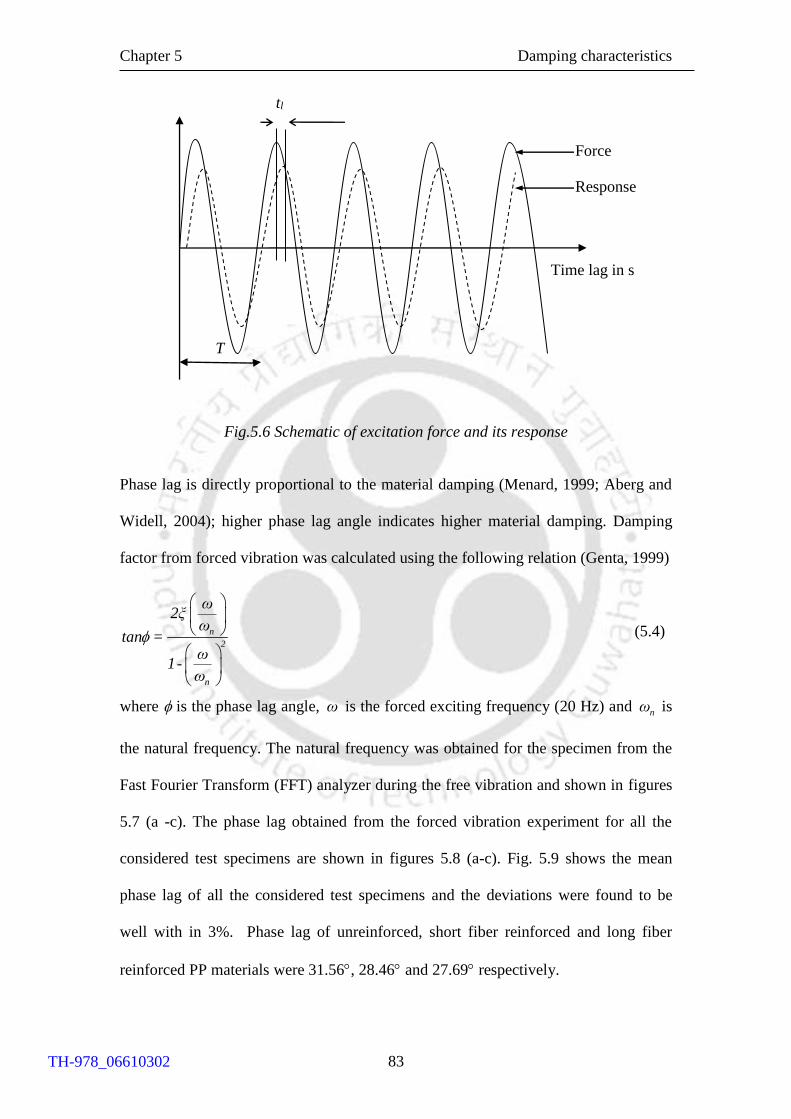
Chapter 5 Damping characteristics
83
Fig.5.6 Schematic of excitation force and its response
Phase lag is directly proportional to the material damping (Menard, 1999; Aberg and
Widell, 2004); higher phase lag angle indicates higher material damping. Damping
factor from forced vibration was calculated using the following relation (Genta, 1999)
(5.4)
where is the phase lag angle, ω is the forced exciting frequency (20 Hz) and nω is
the natural frequency. The natural frequency was obtained for the specimen from the
Fast Fourier Transform (FFT) analyzer during the free vibration and shown in figures
5.7 (a -c). The phase lag obtained from the forced vibration experiment for all the
considered test specimens are shown in figures 5.8 (a-c). Fig. 5.9 shows the mean
phase lag of all the considered test specimens and the deviations were found to be
well with in 3%. Phase lag of unreinforced, short fiber reinforced and long fiber
reinforced PP materials were 31.56, 28.46 and 27.69 respectively.
tl
Time lag in s
Force
Response
T
n
2
n
ω2ξ
ωtan =
ω1-
ω
TH-978_06610302
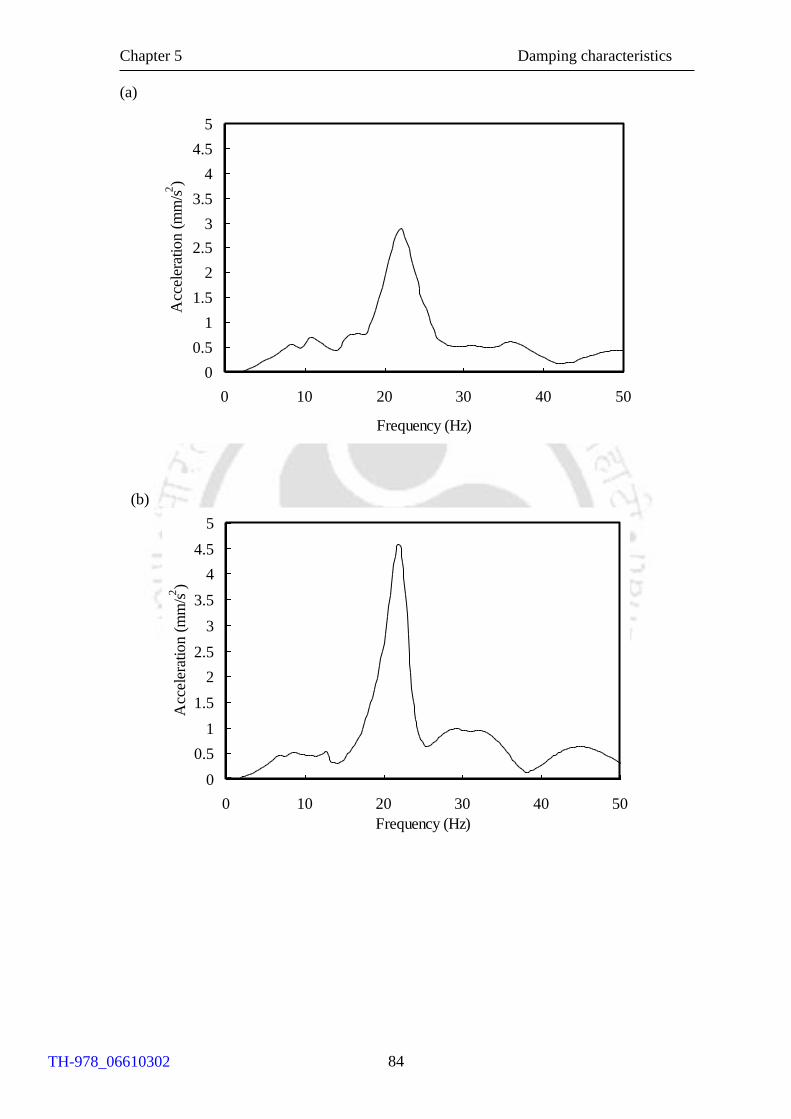
Chapter 5 Damping characteristics
84
(a)
0
0.5
1
1.5
2
2.5
3
3.5
4
4.5
5
0 10 20 30 40 50
Frequency (Hz)
Acc
eler
atio
n (
mm
/s 2)
(b)
0
0.5
1
1.5
2
2.5
3
3.5
4
4.5
5
0 10 20 30 40 50
Frequency (Hz)
Acc
eler
atio
n (
mm
/s 2)
TH-978_06610302
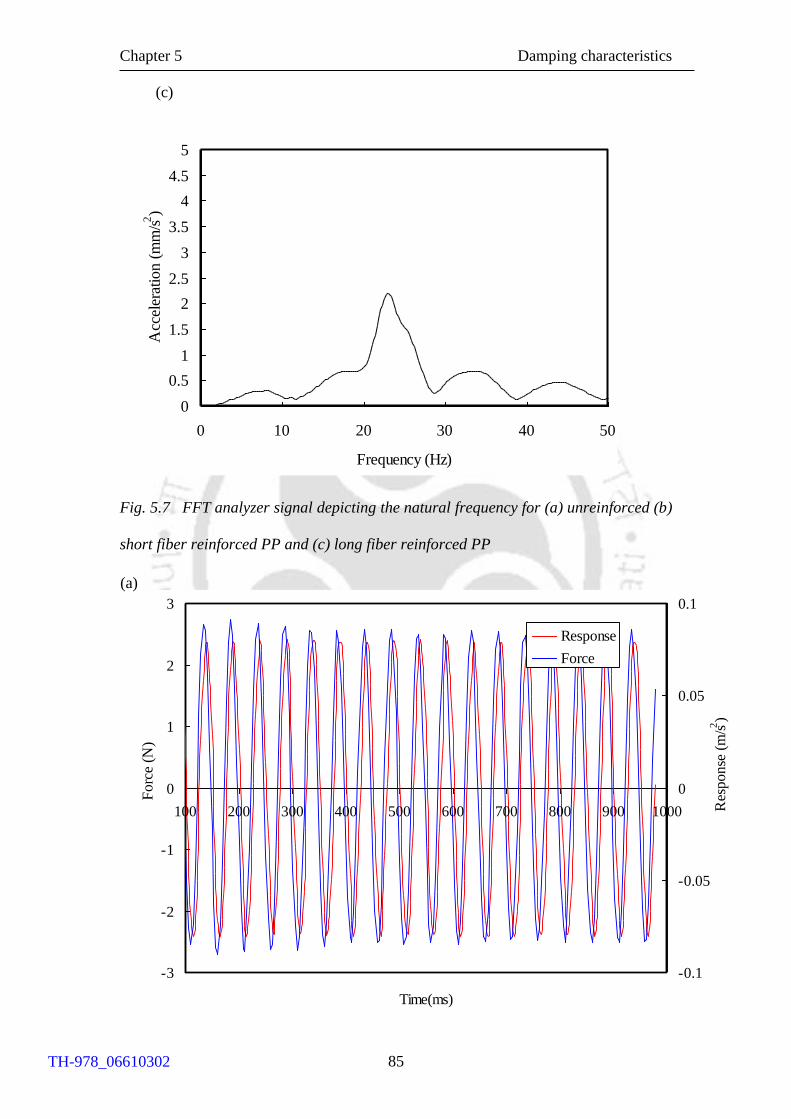
Chapter 5 Damping characteristics
85
Fig. 5.7 FFT analyzer signal depicting the natural frequency for (a) unreinforced (b)
short fiber reinforced PP and (c) long fiber reinforced PP
(c)
0
0.5
1
1.5
2
2.5
3
3.5
4
4.5
5
0 10 20 30 40 50
Frequency (Hz)
Acc
eler
atio
n (
mm
/s 2)
-3
-2
-1
0
1
2
3
100 200 300 400 500 600 700 800 900 1000
Time(ms)
Forc
e (N
)
-0.1
-0.05
0
0.05
0.1
Res
ponse
(m
/s2)
Response
Force
(a)
TH-978_06610302
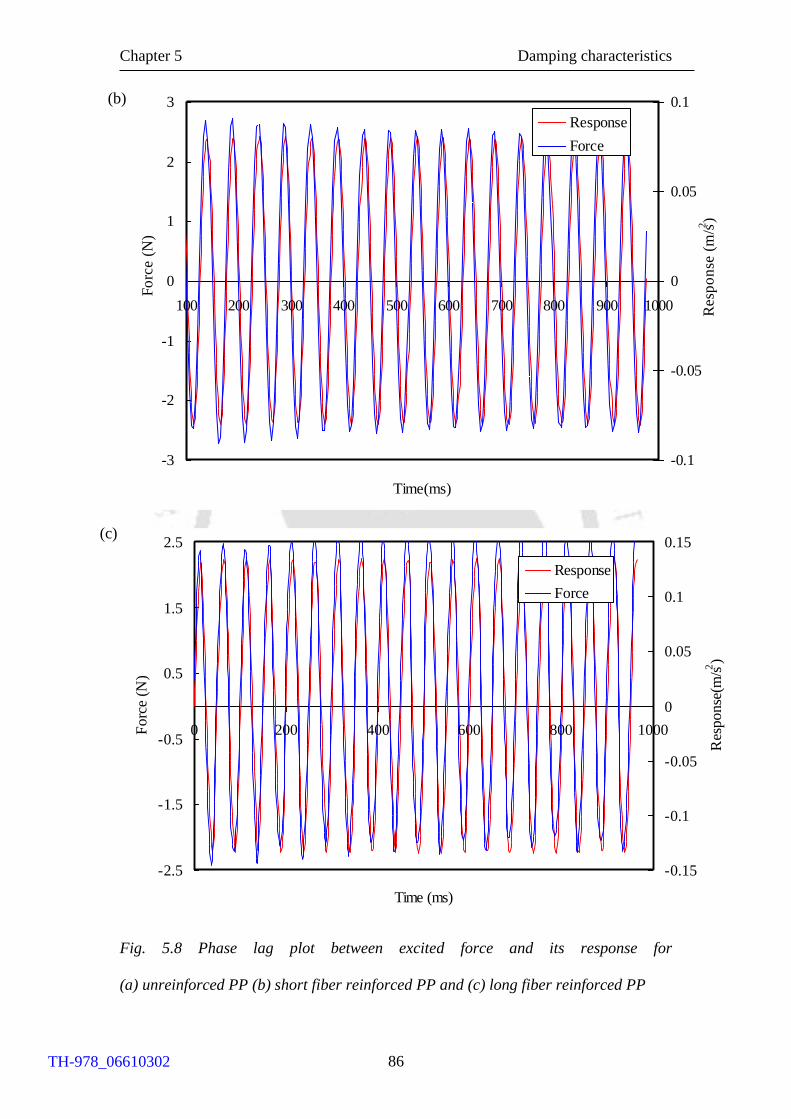
Chapter 5 Damping characteristics
86
Fig. 5.8 Phase lag plot between excited force and its response for
(a) unreinforced PP (b) short fiber reinforced PP and (c) long fiber reinforced PP
(c)
-2.5
-1.5
-0.5
0.5
1.5
2.5
0 200 400 600 800 1000
Time (ms)
Fo
rce
(N)
-0.15
-0.1
-0.05
0
0.05
0.1
0.15
Res
po
nse
(m/s2
)
Response
Force
-3
-2
-1
0
1
2
3
100 200 300 400 500 600 700 800 900 1000
Time(ms)
Fo
rce (
N)
-0.1
-0.05
0
0.05
0.1
Resp
on
se (
m/s2
)
Response
Force
(b)
TH-978_06610302

Chapter 5 Damping characteristics
87
Fig.5.9 Phase lag between excited force and its response of the test specimens
Addition of fibers to the base polypropylene significantly limits the material elastic
deformation and decreases the phase lag between the exciting force and the
corresponding material response. Among reinforced material, SFPP showed increased
phase lag than that of LFPP due to the presence of more fiber matrix interface which
ultimately delayed the response to initiate. The calculated damping factor obtained
from forced vibration test for LFPP, SFPP and UFPP were 0.0393, 0.0517, and
0.0644 respectively. Since the test specimen geometry and air damping conditions
were similar in both free and forced vibration technique, obtained damping factors
were almost same. The damping factor and phase lag obtained from forced vibration
tests exhibited similar trend to that of hysteretic area and the logarithmic decrement
obtained through free vibration tests.
5.6 DYNAMIC MECHANICAL ANALYSIS
In the structural applications, most often materials are subjected to dynamic loads
under various temperatures; hence, dynamic performance evaluation at various
temperatures helps to design these materials suitably. Dynamic Mechanical Analysis
24
26
28
30
32
UFPP SFPP LFPP
Phas
e la
g (
Deg
ree)
.
TH-978_06610302
Chapter 5 Damping characteristics
88
(DMA) was carried out by applying an oscillating force to a sample and response of
material to that force was analyzed.
From DMA, material modulus and loss factor (measure of damping) were
found out at various temperatures and frequencies. The modulus measured from DMA
is not the same as the Young’s modulus of the classic stress-strain curve. In DMA, a
complex modulus (E*), elastic/storage modulus (E’) and imaginary/loss modulus
(E’’) were calculated from the material response to the sine wave oscillation. These
moduli allow better characterization of the material such as ability of the material to
return or store energy (E’), ability to lose energy (E’’) and loss factor (the ratio of
these effects, tan δ). DMA was carried out on the injection molded test specimens
using Perkin-Elmer as per ASTM D6382 standard, DMA/7E. Test specimens were
subjected to bending in a cantilever mode with a span length of 70 mm. An oscillatory
force of 3 N was applied over a temperature range of 32-92 C and frequency scan
was done between 0.1-100 Hz.
Figures 5.10a and 5.10b show the variation of storage modulus and loss
modulus of test materials as a function of temperature, tested at 1 Hz frequency. It is
vivid that the increase in the fiber length improved the material stiffness at dynamic
condition. The storage modulus and loss modulus of LFPP material were found to be
higher compared to those of UFPP and SFPP materials. Since the mean fiber length of
LFPP (1.251 mm) was larger than that of SFPP (0.4403 mm), the molecular mobility
of LFPP polymer matrix was restricted which resulted in superior modulus.
TH-978_06610302
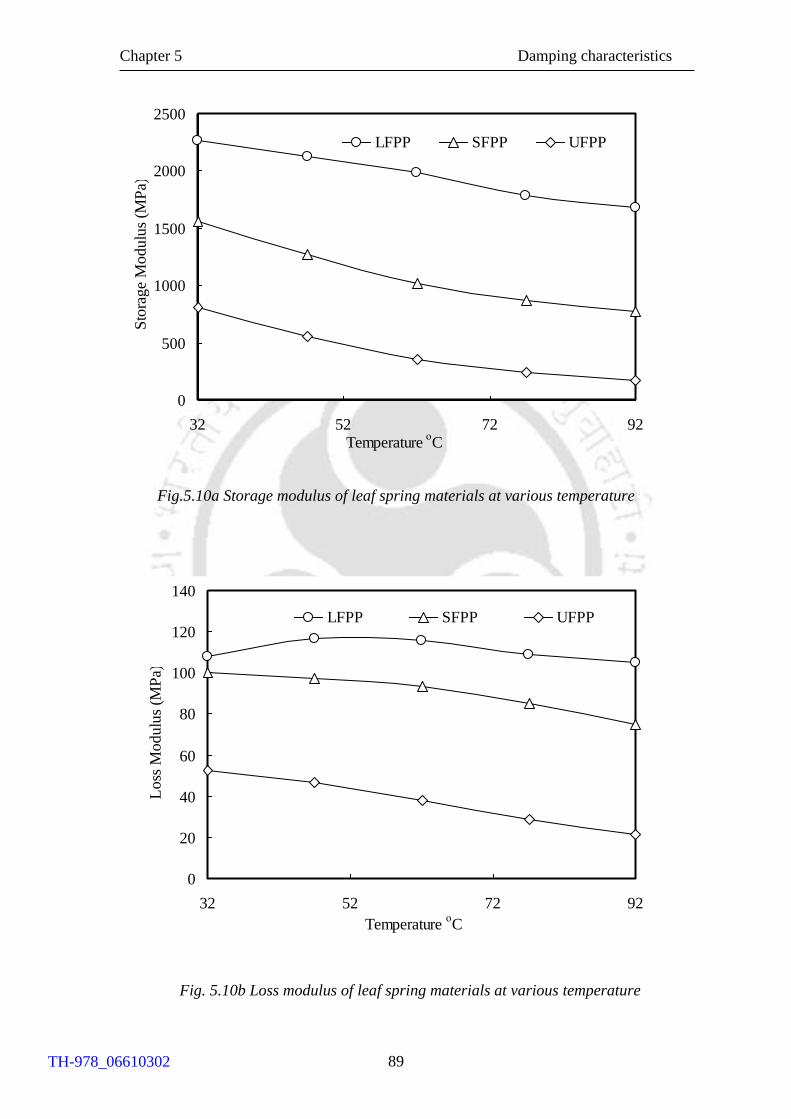
Chapter 5 Damping characteristics
89
Fig.5.10a Storage modulus of leaf spring materials at various temperature
Fig. 5.10b Loss modulus of leaf spring materials at various temperature
0
500
1000
1500
2000
2500
32 52 72 92Temperature
οC
Sto
rag
e M
od
ulu
s (M
Pa)
LFPP SFPP UFPP
0
20
40
60
80
100
120
140
32 52 72 92
Temperature οC
Loss
Modulu
s (M
Pa)
LFPP SFPP UFPP
TH-978_06610302
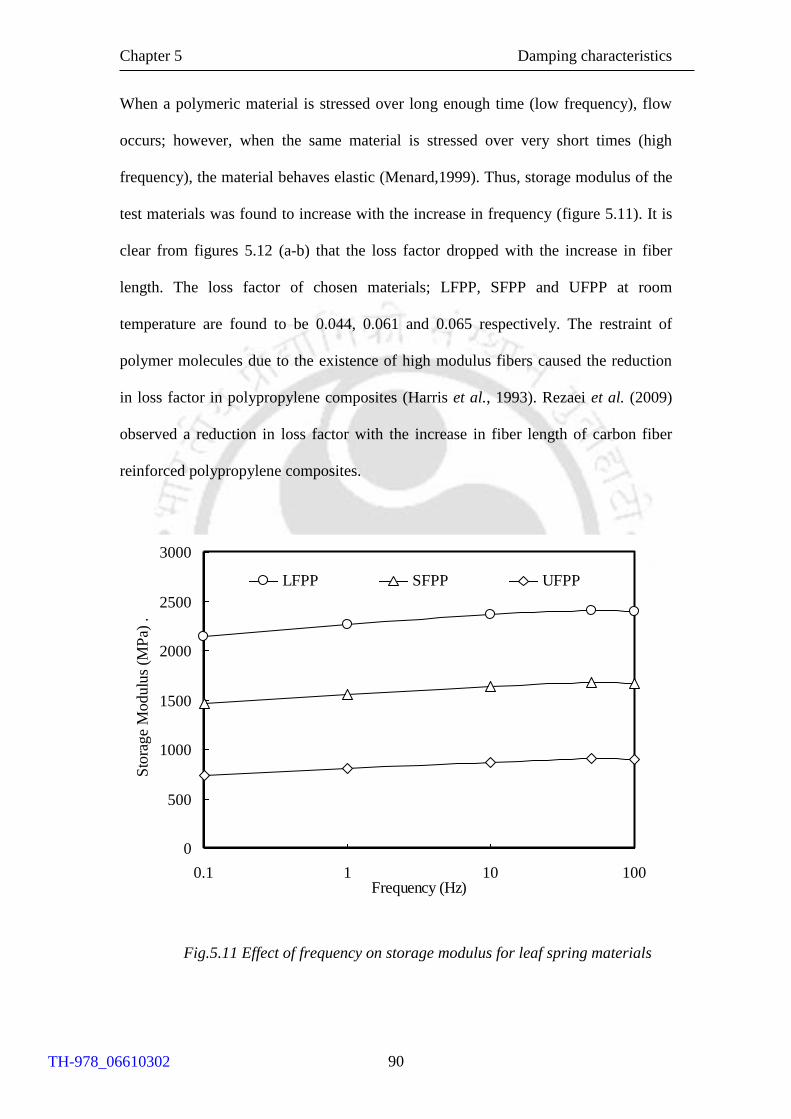
Chapter 5 Damping characteristics
90
When a polymeric material is stressed over long enough time (low frequency), flow
occurs; however, when the same material is stressed over very short times (high
frequency), the material behaves elastic (Menard,1999). Thus, storage modulus of the
test materials was found to increase with the increase in frequency (figure 5.11). It is
clear from figures 5.12 (a-b) that the loss factor dropped with the increase in fiber
length. The loss factor of chosen materials; LFPP, SFPP and UFPP at room
temperature are found to be 0.044, 0.061 and 0.065 respectively. The restraint of
polymer molecules due to the existence of high modulus fibers caused the reduction
in loss factor in polypropylene composites (Harris et al., 1993). Rezaei et al. (2009)
observed a reduction in loss factor with the increase in fiber length of carbon fiber
reinforced polypropylene composites.
Fig.5.11 Effect of frequency on storage modulus for leaf spring materials
0
500
1000
1500
2000
2500
3000
0.1 1 10 100Frequency (Hz)
Sto
rag
e M
od
ulu
s (M
Pa)
.
LFPP SFPP UFPP
TH-978_06610302

Chapter 5 Damping characteristics
91
Fig.5.12 Loss factor for leaf spring materials under (a) various frequencies
(b) various temperature
0.00
0.02
0.04
0.06
0.08
0.10
0.1 1 10 100
Frequency (Hz)
Lo
ss f
acto
r (t
anδ
)
LFPP SFPP UFPP
(a)
(b)
0.00
0.02
0.04
0.06
0.08
0.10
0.12
0.14
0.16
32 52 72 92
Temperature οC
Lo
ss f
acto
r (T
an
δ)
.
LFPP SFPP UFPP
TH-978_06610302
Chapter 5 Damping characteristics
92
Loss factor of chosen material decreased with the increase in frequency (figure 5.12a).
Sato et al. (1992) also reported similar behavior and this is due to the fact that
increased frequency decreases viscoelastic strain decreases and pays the way for
increased stiffness (Crawford, 1998; Rosato et al., 2000). Loss factor of all the chosen
test materials was found to increase with the increase in temperature (figure 5.12b)
and this behavior was due to the matrix softening which resulted in increased
molecular mobility at elevated temperature. When the test material temperature
increases, the free volume, i.e., space for the internal movement of the molecule
increases resulted in drop of storage modulus and hence, rise in loss factor was
visualized. The increase in damping factor with increase in temperature is less for
LFPP due to the reinforcing efficiency of longer glass fiber polypropylene
composites. Thomason and Groenewoud (1996) reported the reinforcing efficiency of
longer glass fiber polypropylene composites in retaining the modulus at higher
temperatures. Damping factor (ξ) was calculated using the relation 5.5 (Landro and
Lorenz, 2009)
tanδξ =
2 (5.5)
The damping factor of LFPP, SFPP and UFPP were 0.022, 0.030 and 0.032
respectively. It is to be noted the variation in damping factor obtained through
dynamic mechanical analysis and forced vibration was due to the change in geometry
of test specimen, type of load, tightening torque (clamping effects) and the effect of
air damping (Menard,1999).
5.7 HYSTERETIC HEATING
Viscoelastic characteristics of polymeric materials generate considerable amount of
internal friction within the material during mechanical deformation resulting in
TH-978_06610302
Chapter 5 Damping characteristics
93
hysteresis heat generation. Damping affects the amount of hysteresis heat generation
during service (Senthilvelan and Gnanamoorthy, 2006). Rise in temperature due to the
material hysteretic heating depends strongly on the damping properties of the material
(ASM International, 1988; Kultrural and Eryurek, 2007). Thus, evaluation of internal
friction generated in the form of heat for the chosen leaf spring material during cyclic
loading is of practical importance.
To investigate the influence of fiber length on the hysteretic heating for leaf
spring materials, injection molded tensile test specimens pertaining to ASTM D 638
standard were used. Test specimens were subjected to finite number (7200) of fatigue
cycles using servo hydraulic fatigue testing machine(Instron 8801) at 1 Hz and R = 0
(stress ratio) under constant displacement mode. The load required for 1 mm
deflection under cyclic sinusoidal loading was measured for the chosen test materials.
During testing, specimen temperature was measured using non-contact infra red
temperature sensor (Raytek MID, 0.1 C accuracy). Sensor was positioned in such a
way to measure the temperature at the middle of the gauge length of tensile specimen.
The temperature rise under cyclic load was observed for all the three test materials.
The generated heat exceeds the heat transferred to the surroundings because of poor
conductivity of the material resulted in specimen heating. During cyclic loading some
part of the mechanical work was spent on irreversible molecular processes leading to
various microscopic deformations; crazes, shear bands, voids and micro cracks and
the other polymeric material, resulting with rise in specimen temperature. In general,
fatigue tests are being carried out to evaluate the endurance strength of a material. In
this study, the heat generated during cyclic loading was measured and attempted to
correlate with the hysteretic heating behavior of the material and hence, material
damping.
TH-978_06610302

Chapter 5 Damping characteristics
94
Fig. 5.13 Hysteretic heating of unreinforced and reinforced polypropylene specimens
during fatigue
Figure 5.13 shows the measured surface temperature of test materials during fatigue
testing. The rise in temperature for unreinforced PP was due to the hysteretic heating
behavior of the polypropylene matrix material and the measured surface temperature
was less than reinforced PP. In the case of reinforced PP, presence of fibers and fiber
matrix interface causes more internal friction resulted in increase of heat generation.
Short fiber reinforced PP exhibited higher temperature than that of the long fiber
reinforced PP due to the higher internal collision because of its higher fiber ends. For
a given volume of material, short fiber reinforced material have more fiber ends than
long fiber reinforced material (figure 5.2). Hence, when the short fiber reinforced
materials are subjected to cyclic loading, presence of more fiber ends cause more
internal friction, resulted in higher heat generation. Kultrural and Eryurek (2007) also
0
5
10
15
20
0 2000 4000 6000 8000
Number of cycles (Nf)
Ris
e in
sp
ecim
en tem
per
atu
re
( οC
).
SFPP
LFPP
UFPP
TH-978_06610302
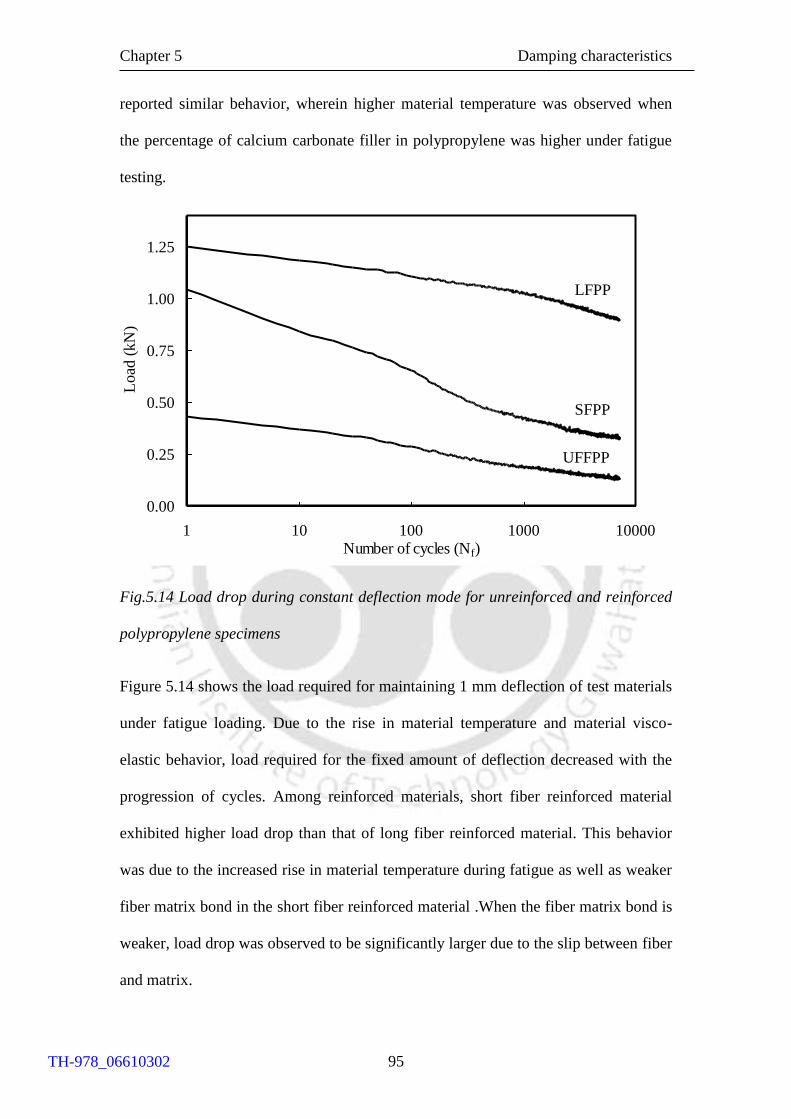
Chapter 5 Damping characteristics
95
reported similar behavior, wherein higher material temperature was observed when
the percentage of calcium carbonate filler in polypropylene was higher under fatigue
testing.
Fig.5.14 Load drop during constant deflection mode for unreinforced and reinforced
polypropylene specimens
Figure 5.14 shows the load required for maintaining 1 mm deflection of test materials
under fatigue loading. Due to the rise in material temperature and material visco-
elastic behavior, load required for the fixed amount of deflection decreased with the
progression of cycles. Among reinforced materials, short fiber reinforced material
exhibited higher load drop than that of long fiber reinforced material. This behavior
was due to the increased rise in material temperature during fatigue as well as weaker
fiber matrix bond in the short fiber reinforced material .When the fiber matrix bond is
weaker, load drop was observed to be significantly larger due to the slip between fiber
and matrix.
0.00
0.25
0.50
0.75
1.00
1.25
1 10 100 1000 10000Number of cycles (Nf)
Lo
ad (
kN
)
LFPP
SFPP
UFFPP
TH-978_06610302

Chapter 5 Damping characteristics
96
5.8 SUMMARY
Damping performance of the chosen leaf spring materials were evaluated through various
techniques to identify various individual damping sources. Test materials were subjected
to deformation to identify damping sources due to the elastic and plastic deformation.
Leaf spring materials were subjected to free and forced vibration, to identify damping
sources other than energy dissipation through elastic and plastic deformation. Test
materials were also subjected to dynamic mechanical analysis to understand and correlate
material damping behavior.
When the test materials were subjected to elastic as well as plastic deformation,
hysteretic area measurement indicated energy dissipation. Unreinforced material
exhibited higher energy dissipation than reinforced material. SFPP showed higher
energy dissipation than LFPP due to the presence of more fiber ends.
When the test materials were subjected to free vibration, logarithmic decrement and
damping factor were found to decrease with the increase in fiber length. UFPP had
the highest damping factor followed by SFPP and LFPP. When the test materials were
subjected to forced vibration, UFPP and SFPP exhibited higher phase lag between the
excited force and its response than that of LFPP material.
Dynamic mechanical analysis of test material revealed the improvement of storage
modulus with respect to increase in fiber length, LFPP had a higher storage modulus
followed by SFPP and UFPP; however, damping factor was found to be reduced with
the incorporation of fibers. Damping factor was high for UFPP preceded by SFPP and
LFPP.
Reinforced material showed higher temperature rise than that of unreinforced material
under cyclic loading due to the presence of fibers and fiber matrix interfaces. Among
reinforced material, SFPP found to exhibit more temperature rise than that of LFPP
due to the higher fiber end density and inferior fiber matrix bond.
TH-978_06610302
Chapter 5 Damping characteristics
97
In a summary unreinforced material exhibited higher energy dissipation than
reinforced material. SFPP showed higher energy dissipation than LFPP. Logarithmic
decrement and damping factor were found to decrease with the increase in fiber
length. UFPP had the highest damping factor followed by SFPP and LFPP. Damping
factor was found to be reduced with the incorporation of fibers. Damping factor was
high for UFPP preceded by SFPP and LFPP.
TH-978_06610302
Chapter 6 Design, Manufacture and Static Performance
98
CHAPTER 6
DESIGN, MANUFACTURE AND STATIC
PERFORMANCE OF THERMOPLASTIC LEAF SPRINGS
6.1 INTRODUCTION
Automobile suspension system isolates passengers and cargos from shocks and
vibration due to the road undulations by absorbing, storing and releasing energy. In
the suspension system, leaf springs are preferred over air suspension and coil spring
due to its simple design. During the past three decades, sufficient amount of research
and development work have been carried out on thermoset composite leaf springs
(Beardmore, 1986; Rajendran and Vijayarangan, 2001; Qureshi, 2001; Shokrieh and
Rezaei, 2003). Design aspects involving shape optimization, reduction of unsprung
weight, manufacturing process involved and performance investigation is dealt in
many research articles. Applications of leaf spring ranging from solar car (Sancaktar
and Gratton, 1999) to railway freight applications (Hou et al., 2005) were investigated
in the past. Thermoplastic composites are desirable as the leaf spring material due to
its high specific strength, ability to manufacture complex shape and corrosion
resistance (Yamada, 2007).
In this chapter, design of variable width mono leaf spring with the aid of
optimization technique and finite element analysis tool was presented. Designed leaf
spring was manufactured by injection molding process. Before development, injection
molding simulation software was used to design the appropriate die, gating and
processing condition. Manufacturing details of variable width leaf springs with
TH-978_06610302
Chapter 6 Design, Manufacture and Static Performance
99
chosen test materials were also presented in this chapter. Static performance
evaluation of leaf springs to understand the load deflection and strain rate
sensitiveness is also presented in this chapter.
6.2 LEAF SPRING DESIGN
6.2.1 Material Design
Material and geometry of the leaf springs significantly influence energy storage and
leaf spring performance. To identify appropriate material for the leaf spring, specific
strain energy of the discontinuous glass fiber thermoplastic polypropylene and
conventional leaf spring steel materials were considered. Amount of specific elastic
strain energy stored in a system (Yu and Kim, 1988) is given as
Se = u 2 / 2E (6.1)
where E is the modulus of elasticity of the material, ρ is the density of the material
and σu is the ultimate strength of the material. The above equation depicts that most
appropriate material for the leaf spring application must have maximum strength and
minimum modulus of elasticity. Figure 6.1 shows the specific strain energy of spring
steel, unreinforced polypropylene (UFPP), 20 % short glass fiber reinforced
polypropylene (SFPP) and 20 % long glass fiber reinforced polypropylene (LFPP)
materials and material properties are tabulated in table 6.1. Due to the high specific
elastic strain energy, discontinuous long glass fiber reinforced thermoplastic material
was identified as a potential material for the leaf spring application.
TH-978_06610302
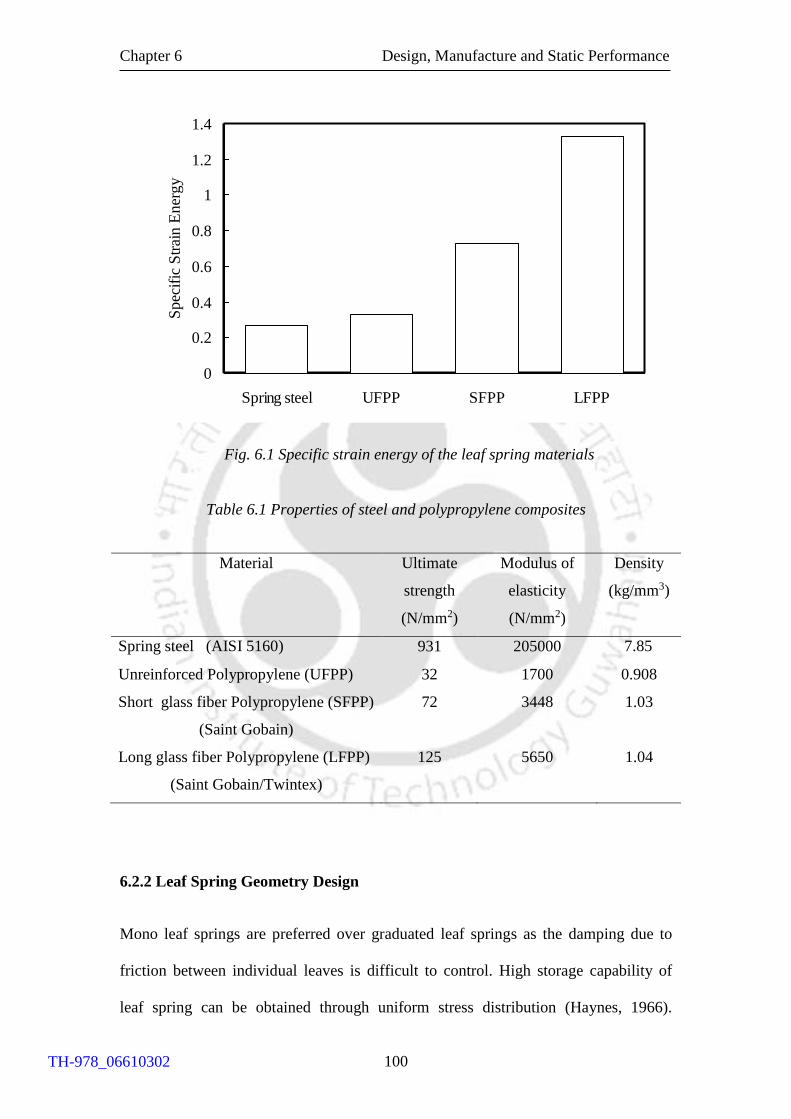
Chapter 6 Design, Manufacture and Static Performance
100
Fig. 6.1 Specific strain energy of the leaf spring materials
Table 6.1 Properties of steel and polypropylene composites
6.2.2 Leaf Spring Geometry Design
Mono leaf springs are preferred over graduated leaf springs as the damping due to
friction between individual leaves is difficult to control. High storage capability of
leaf spring can be obtained through uniform stress distribution (Haynes, 1966).
Material Ultimate
strength
(N/mm2)
Modulus of
elasticity
(N/mm2)
Density
(kg/mm3)
Spring steel (AISI 5160)
931 205000 7.85
Unreinforced Polypropylene (UFPP) 32 1700 0.908
Short glass fiber Polypropylene (SFPP)
(Saint Gobain)
72 3448 1.03
Long glass fiber Polypropylene (LFPP)
(Saint Gobain/Twintex)
125 5650 1.04
0
0.2
0.4
0.6
0.8
1
1.2
1.4
Spring steel UFPP SFPP LFPP
Spec
ific
Str
ain E
ner
gy .
TH-978_06610302

Chapter 6 Design, Manufacture and Static Performance
101
The shape of the leaf spring should provide uniform bending stress along the length of
the spring under vertical forces. To fulfill this criteria, different types of design;
constant cross section, constant thickness and varying width were considered in the
past (Beardmore, 1986; Sancaktar and Gratton, 1999). In the present investigation,
width (bc) and thickness (t) at the axle seat for a specified loading condition were
determined by optimizing the volume of spring by considering the geometry as a
rectangular spring with constant width and thickness. Later appropriate taper ratio was
applied from center to the ends of the leaf spring for varying width.
Leaf spring design was constrained with mechanical properties of chosen leaf
spring materials, (unreinforced polypropylene, 20 % short and long glass fiber
reinforced polypropylene), shot capacity, processing capability of the injection
molding machine and frame size of the fatigue testing machine available at IIT
Guwahati.
Leaf spring geometry was constrained to have a maximum weight of 160 g
(based on the shot capacity of the injection molding machine). With the above
constraint, dimensions at the center of the rectangular beam were determined with the
optimization tool box of Matlab®. The function used in the optimization tool box was
‘fmincon’ and the function uses an inbuilt line search method (Matlab release notes,
2005). The main objective was to minimize the weight of the leaf spring, and it was
limited to 160 g with the maximum loading (P) at full deflection as 500 N. Length of
the spring (L) is fixed as 300 mm (fixed based on the frame side of the fatigue testing
machine).
TH-978_06610302
Chapter 6 Design, Manufacture and Static Performance
102
Detailed optimal problem formulations are as follows:
The objective function can be represented as:
F (Wb) = ρ L (bc .t) (6.2)
where Wb is weight of the beam, bc is width at the center, t is beam thickness at the
center and ρ is material density, 1.04g/cc (Twintex, 2005). The upper and lower
bound values of design variables, b and t (decided based on the manufacturing limits)
are given as
bmax = 60 mm and bmin = 20 mm
tmax =15 mm and tmin = 5 mm
Bending stress (Sb) and deflection (Y) are design constraints that are related to design
variable and design parameter. Spring rate of thermoset composite leaf springs lies in
the range of 20 - 586 N/mm ranging from solar car (Sancaktar and Gratton, 1999) to
railway wagon suspension system (Hou et al., 2005). In this investigation the upper
and lower bound values of spring rate were taken as 30 and 50 N/mm respectively,
which give rise to limits of deflection (Y) ranging from 10-16 mm for a maximum
load of 500 N.
Design constraints are:
22
3
bt
PLSb (6.3)
3
3
4Ebt
PLY (6.4)
where E is modulus of elasticity. Considering fatigue and static characteristic of the
reinforced plastics, a factor of safety 2.5 (Mascarenhas et al., 2004) was considered
for deciding the value of Smax and Smin.
TH-978_06610302
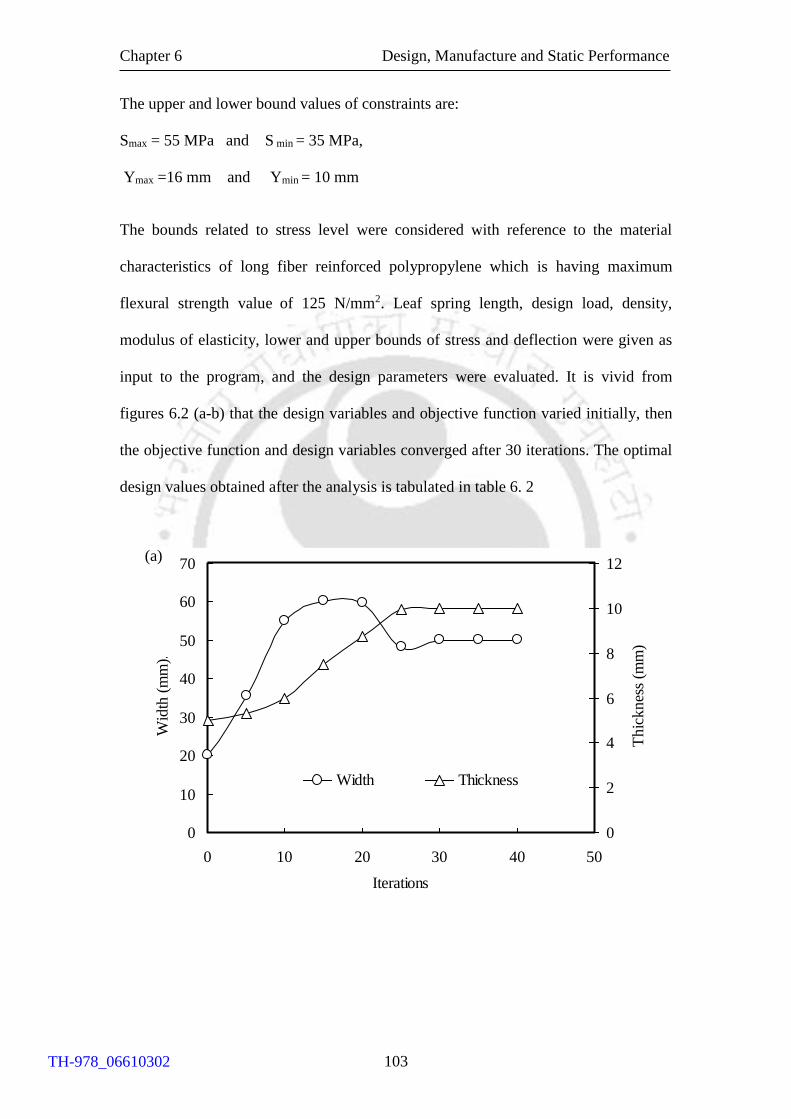
Chapter 6 Design, Manufacture and Static Performance
103
The upper and lower bound values of constraints are:
Smax = 55 MPa and S min = 35 MPa,
Ymax =16 mm and Ymin = 10 mm
The bounds related to stress level were considered with reference to the material
characteristics of long fiber reinforced polypropylene which is having maximum
flexural strength value of 125 N/mm2. Leaf spring length, design load, density,
modulus of elasticity, lower and upper bounds of stress and deflection were given as
input to the program, and the design parameters were evaluated. It is vivid from
figures 6.2 (a-b) that the design variables and objective function varied initially, then
the objective function and design variables converged after 30 iterations. The optimal
design values obtained after the analysis is tabulated in table 6. 2
0
10
20
30
40
50
60
70
0 10 20 30 40 50
Iterations
Wid
th (
mm
).
0
2
4
6
8
10
12
Th
ick
nes
s (m
m).
Width Thickness
(a)
TH-978_06610302
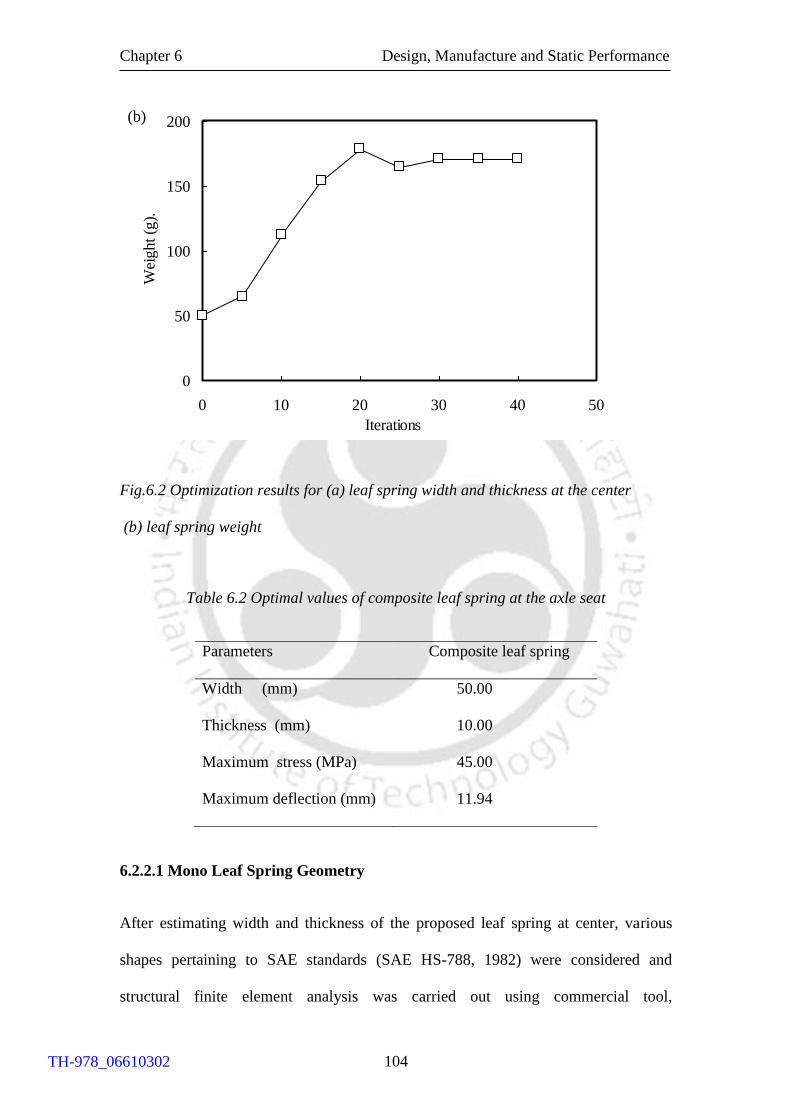
Chapter 6 Design, Manufacture and Static Performance
104
Fig.6.2 Optimization results for (a) leaf spring width and thickness at the center
(b) leaf spring weight
Table 6.2 Optimal values of composite leaf spring at the axle seat
Parameters Composite leaf spring
Width (mm) 50.00
Thickness (mm) 10.00
Maximum stress (MPa) 45.00
Maximum deflection (mm) 11.94
6.2.2.1 Mono Leaf Spring Geometry
After estimating width and thickness of the proposed leaf spring at center, various
shapes pertaining to SAE standards (SAE HS-788, 1982) were considered and
structural finite element analysis was carried out using commercial tool,
0
50
100
150
200
0 10 20 30 40 50
Iterations
Wei
ght (g
).
(b)
TH-978_06610302
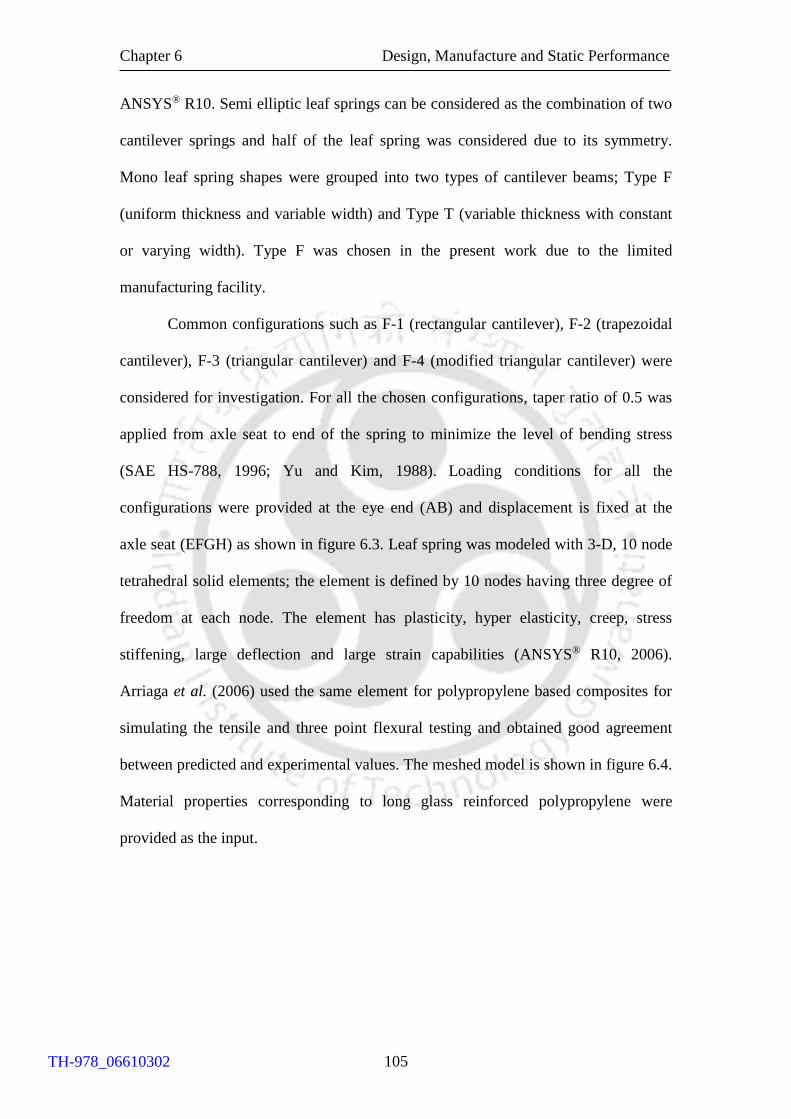
Chapter 6 Design, Manufacture and Static Performance
105
ANSYS® R10. Semi elliptic leaf springs can be considered as the combination of two
cantilever springs and half of the leaf spring was considered due to its symmetry.
Mono leaf spring shapes were grouped into two types of cantilever beams; Type F
(uniform thickness and variable width) and Type T (variable thickness with constant
or varying width). Type F was chosen in the present work due to the limited
manufacturing facility.
Common configurations such as F-1 (rectangular cantilever), F-2 (trapezoidal
cantilever), F-3 (triangular cantilever) and F-4 (modified triangular cantilever) were
considered for investigation. For all the chosen configurations, taper ratio of 0.5 was
applied from axle seat to end of the spring to minimize the level of bending stress
(SAE HS-788, 1996; Yu and Kim, 1988). Loading conditions for all the
configurations were provided at the eye end (AB) and displacement is fixed at the
axle seat (EFGH) as shown in figure 6.3. Leaf spring was modeled with 3-D, 10 node
tetrahedral solid elements; the element is defined by 10 nodes having three degree of
freedom at each node. The element has plasticity, hyper elasticity, creep, stress
stiffening, large deflection and large strain capabilities (ANSYS® R10, 2006).
Arriaga et al. (2006) used the same element for polypropylene based composites for
simulating the tensile and three point flexural testing and obtained good agreement
between predicted and experimental values. The meshed model is shown in figure 6.4.
Material properties corresponding to long glass reinforced polypropylene were
provided as the input.
TH-978_06610302

Chapter 6 Design, Manufacture and Static Performance
106
Fig.6.3 Schematic loading condition of a typical symmetric leaf spring
Fig.6.4 Meshed model of typical symmetric leaf spring
A
B
C
E
F
G
H
P
Fixed axle seat end
TH-978_06610302
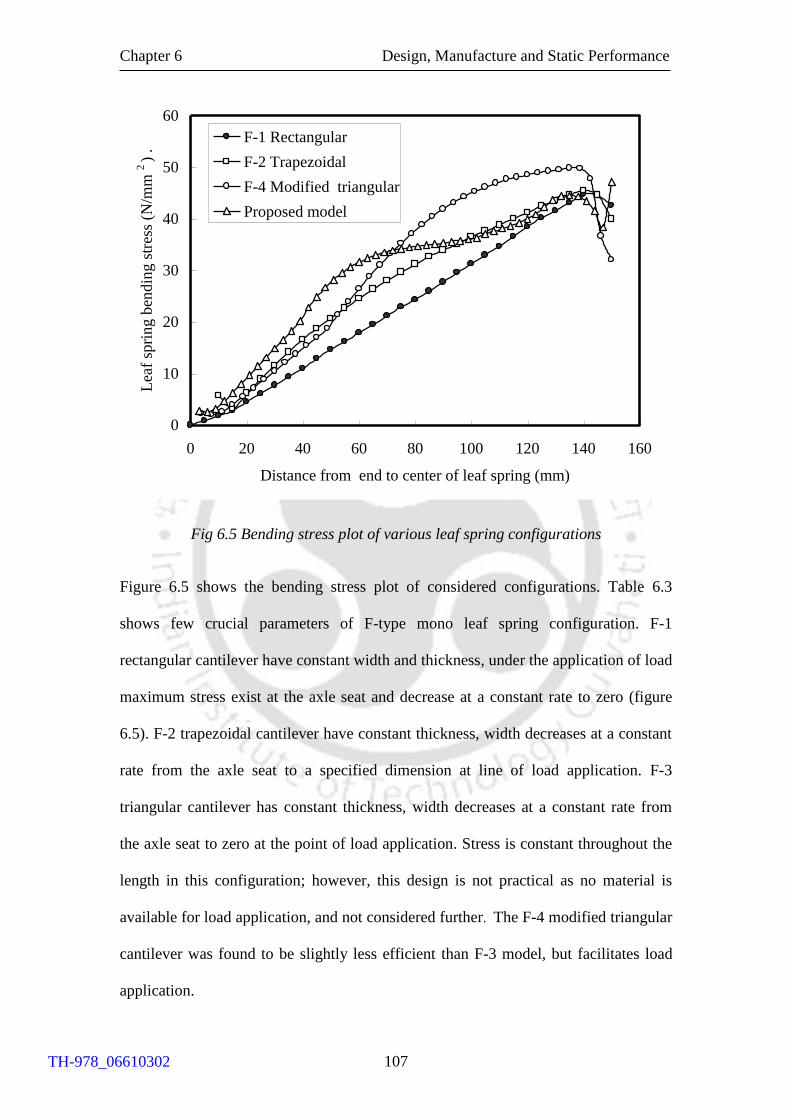
Chapter 6 Design, Manufacture and Static Performance
107
Fig 6.5 Bending stress plot of various leaf spring configurations
Figure 6.5 shows the bending stress plot of considered configurations. Table 6.3
shows few crucial parameters of F-type mono leaf spring configuration. F-1
rectangular cantilever have constant width and thickness, under the application of load
maximum stress exist at the axle seat and decrease at a constant rate to zero (figure
6.5). F-2 trapezoidal cantilever have constant thickness, width decreases at a constant
rate from the axle seat to a specified dimension at line of load application. F-3
triangular cantilever has constant thickness, width decreases at a constant rate from
the axle seat to zero at the point of load application. Stress is constant throughout the
length in this configuration; however, this design is not practical as no material is
available for load application, and not considered further. The F-4 modified triangular
cantilever was found to be slightly less efficient than F-3 model, but facilitates load
application.
0
10
20
30
40
50
60
0 20 40 60 80 100 120 140 160
Distance from end to center of leaf spring (mm)
Lea
f sp
rin
g b
end
ing
str
ess
(N/m
m 2
) .
F-1 Rectangular
F-2 Trapezoidal
F-4 Modified triangular
Proposed model
TH-978_06610302
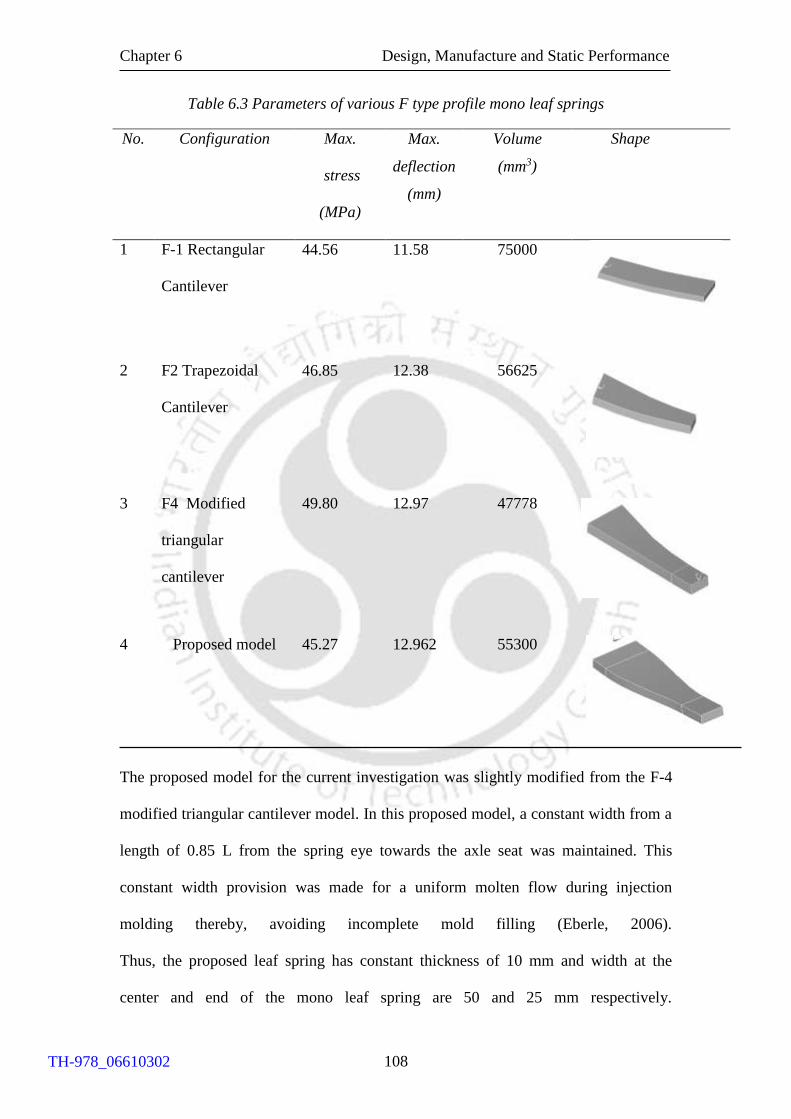
Chapter 6 Design, Manufacture and Static Performance
108
Table 6.3 Parameters of various F type profile mono leaf springs
No. Configuration Max.
stress
(MPa)
Max.
deflection
(mm)
Volume
(mm3)
Shape
1 F-1 Rectangular
Cantilever
44.56 11.58 75000
2
F2 Trapezoidal
Cantilever
46.85 12.38 56625
3 F4 Modified
triangular
cantilever
49.80 12.97 47778
4 Proposed model 45.27 12.962 55300
The proposed model for the current investigation was slightly modified from the F-4
modified triangular cantilever model. In this proposed model, a constant width from a
length of 0.85 L from the spring eye towards the axle seat was maintained. This
constant width provision was made for a uniform molten flow during injection
molding thereby, avoiding incomplete mold filling (Eberle, 2006).
Thus, the proposed leaf spring has constant thickness of 10 mm and width at the
center and end of the mono leaf spring are 50 and 25 mm respectively.
TH-978_06610302
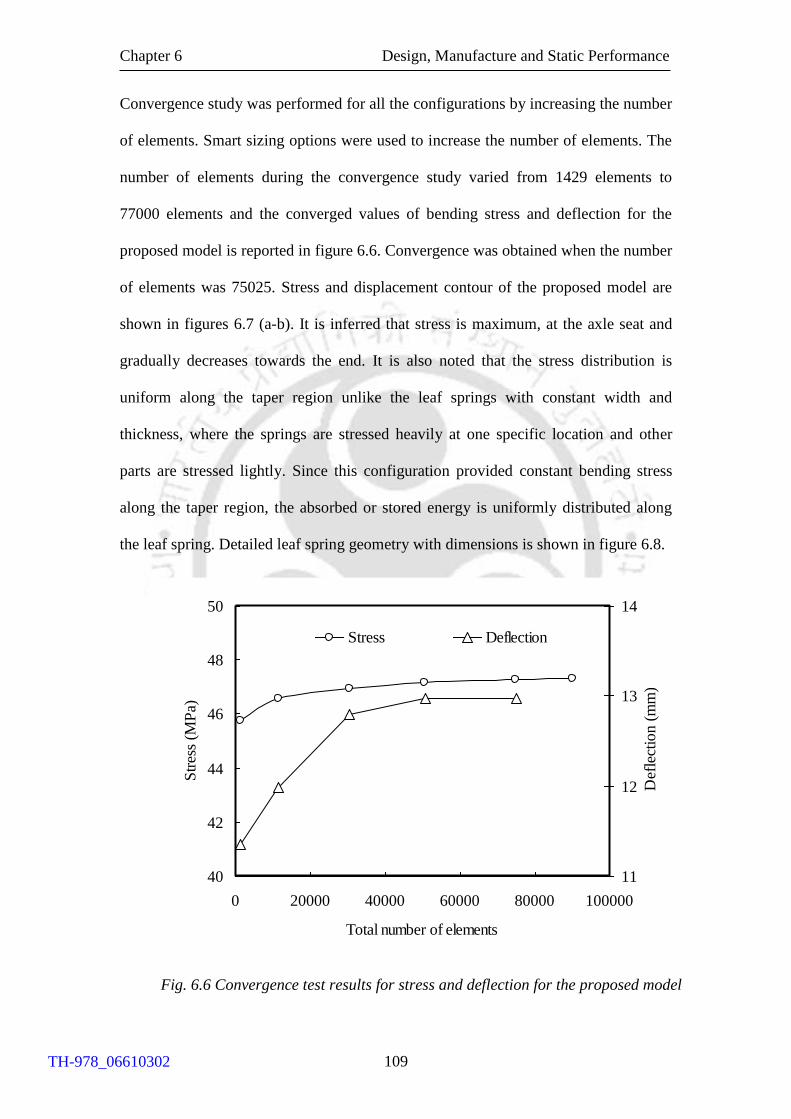
Chapter 6 Design, Manufacture and Static Performance
109
Convergence study was performed for all the configurations by increasing the number
of elements. Smart sizing options were used to increase the number of elements. The
number of elements during the convergence study varied from 1429 elements to
77000 elements and the converged values of bending stress and deflection for the
proposed model is reported in figure 6.6. Convergence was obtained when the number
of elements was 75025. Stress and displacement contour of the proposed model are
shown in figures 6.7 (a-b). It is inferred that stress is maximum, at the axle seat and
gradually decreases towards the end. It is also noted that the stress distribution is
uniform along the taper region unlike the leaf springs with constant width and
thickness, where the springs are stressed heavily at one specific location and other
parts are stressed lightly. Since this configuration provided constant bending stress
along the taper region, the absorbed or stored energy is uniformly distributed along
the leaf spring. Detailed leaf spring geometry with dimensions is shown in figure 6.8.
Fig. 6.6 Convergence test results for stress and deflection for the proposed model
40
42
44
46
48
50
0 20000 40000 60000 80000 100000
Total number of elements
Str
ess
(MP
a)
11
12
13
14
Def
lect
ion (
mm
).Stress Deflection
TH-978_06610302
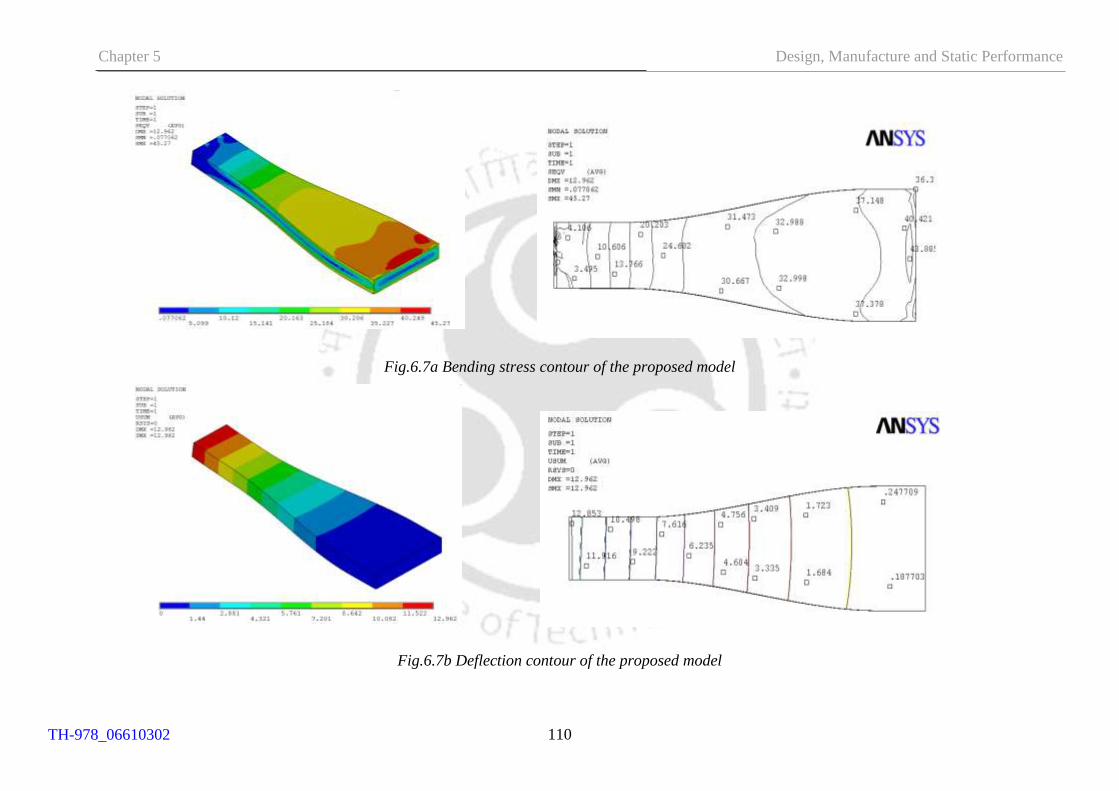
Chapter 6 Design, Manufacture and Static Performance
110
Fig.6.7a Bending stress contour of the proposed model
Fig.6.7b Deflection contour of the proposed model
Chapter 5 Design, Manufacture and Static Performance
TH-978_06610302
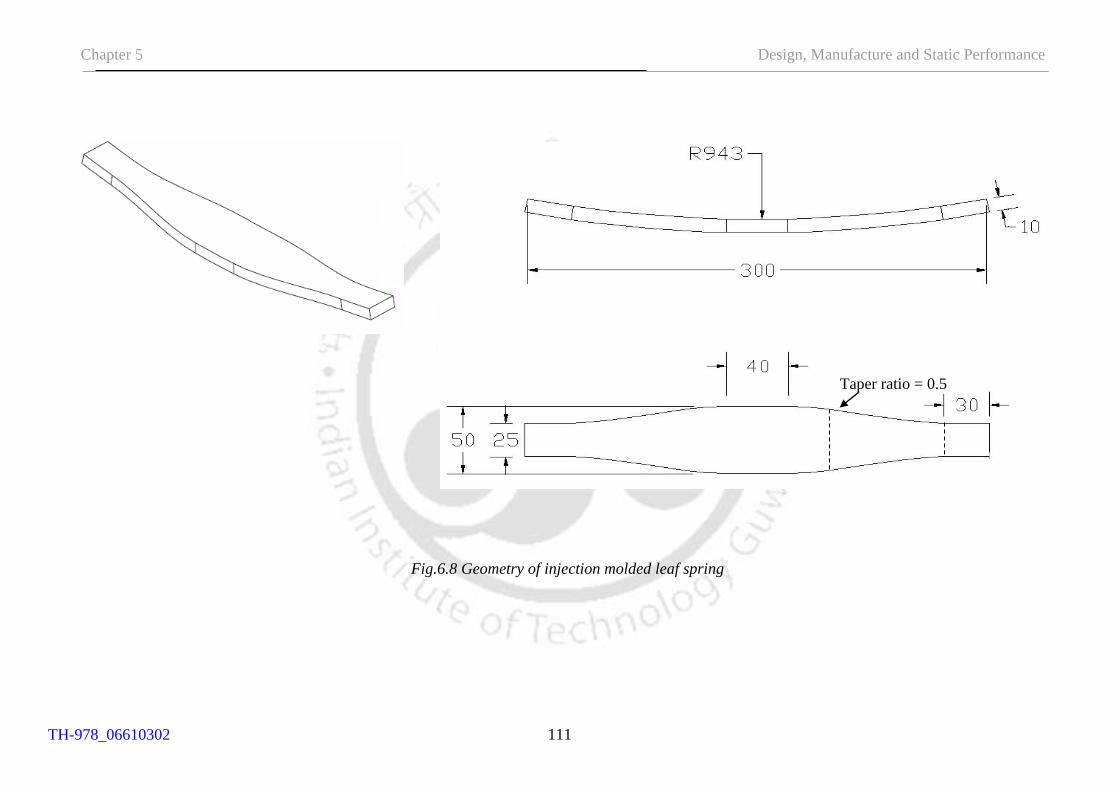
Chapter 6 Design, Manufacture and Static Performance
111
All dimensions are in mm
Fig.6.8 Geometry of injection molded leaf spring
Taper ratio = 0.5
Chapter 5 Design, Manufacture and Static Performance
TH-978_06610302
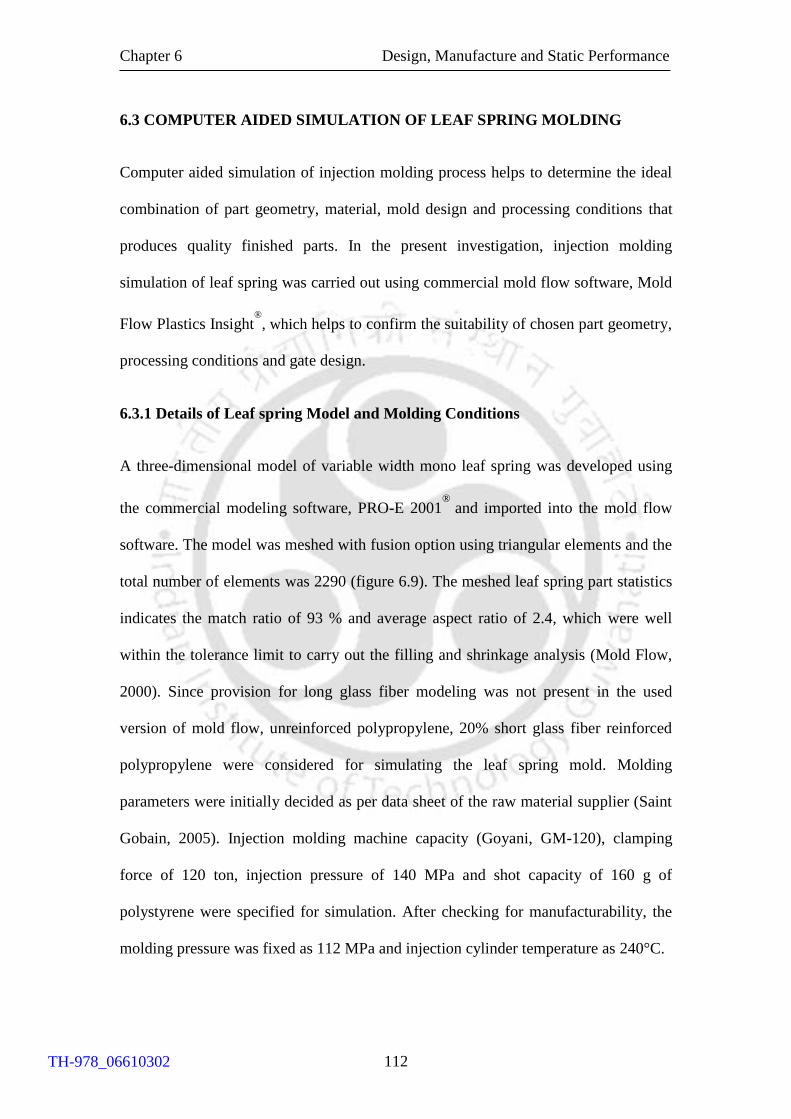
Chapter 6 Design, Manufacture and Static Performance
112
6.3 COMPUTER AIDED SIMULATION OF LEAF SPRING MOLDING
Computer aided simulation of injection molding process helps to determine the ideal
combination of part geometry, material, mold design and processing conditions that
produces quality finished parts. In the present investigation, injection molding
simulation of leaf spring was carried out using commercial mold flow software, Mold
Flow Plastics Insight®
, which helps to confirm the suitability of chosen part geometry,
processing conditions and gate design.
6.3.1 Details of Leaf spring Model and Molding Conditions
A three-dimensional model of variable width mono leaf spring was developed using
the commercial modeling software, PRO-E 2001®
and imported into the mold flow
software. The model was meshed with fusion option using triangular elements and the
total number of elements was 2290 (figure 6.9). The meshed leaf spring part statistics
indicates the match ratio of 93 % and average aspect ratio of 2.4, which were well
within the tolerance limit to carry out the filling and shrinkage analysis (Mold Flow,
2000). Since provision for long glass fiber modeling was not present in the used
version of mold flow, unreinforced polypropylene, 20% short glass fiber reinforced
polypropylene were considered for simulating the leaf spring mold. Molding
parameters were initially decided as per data sheet of the raw material supplier (Saint
Gobain, 2005). Injection molding machine capacity (Goyani, GM-120), clamping
force of 120 ton, injection pressure of 140 MPa and shot capacity of 160 g of
polystyrene were specified for simulation. After checking for manufacturability, the
molding pressure was fixed as 112 MPa and injection cylinder temperature as 240°C.
TH-978_06610302
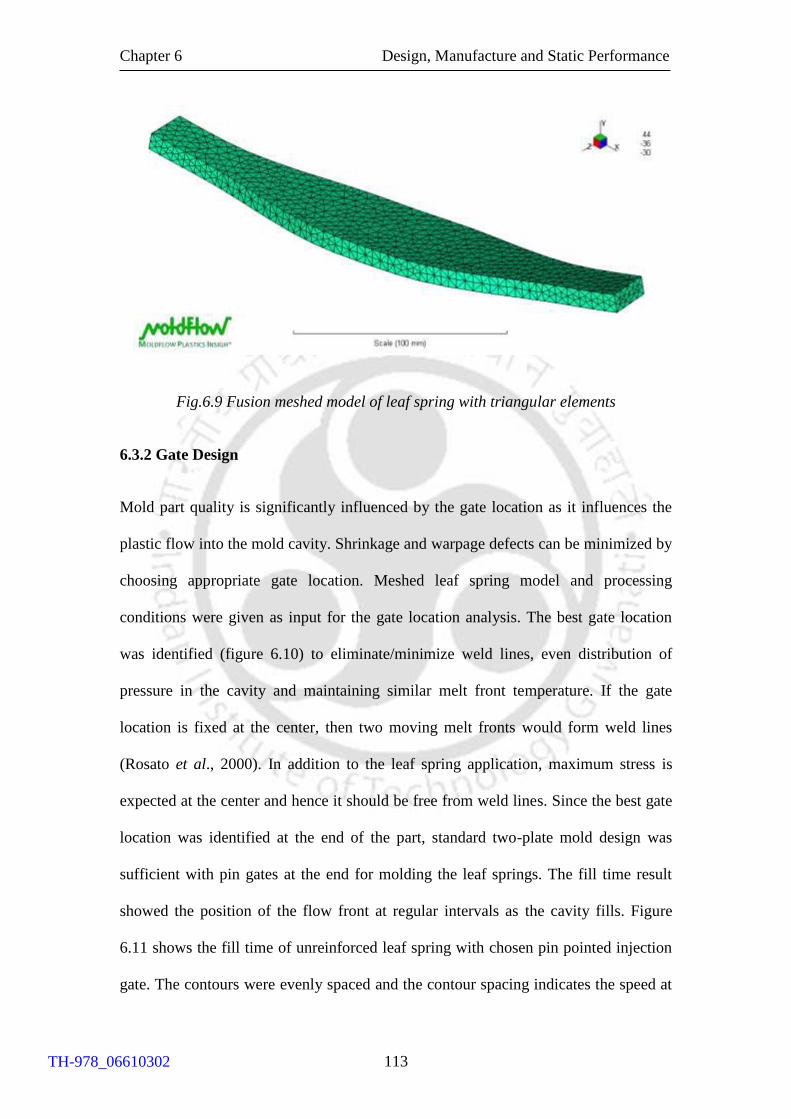
Chapter 6 Design, Manufacture and Static Performance
113
Fig.6.9 Fusion meshed model of leaf spring with triangular elements
6.3.2 Gate Design
Mold part quality is significantly influenced by the gate location as it influences the
plastic flow into the mold cavity. Shrinkage and warpage defects can be minimized by
choosing appropriate gate location. Meshed leaf spring model and processing
conditions were given as input for the gate location analysis. The best gate location
was identified (figure 6.10) to eliminate/minimize weld lines, even distribution of
pressure in the cavity and maintaining similar melt front temperature. If the gate
location is fixed at the center, then two moving melt fronts would form weld lines
(Rosato et al., 2000). In addition to the leaf spring application, maximum stress is
expected at the center and hence it should be free from weld lines. Since the best gate
location was identified at the end of the part, standard two-plate mold design was
sufficient with pin gates at the end for molding the leaf springs. The fill time result
showed the position of the flow front at regular intervals as the cavity fills. Figure
6.11 shows the fill time of unreinforced leaf spring with chosen pin pointed injection
gate. The contours were evenly spaced and the contour spacing indicates the speed at
TH-978_06610302
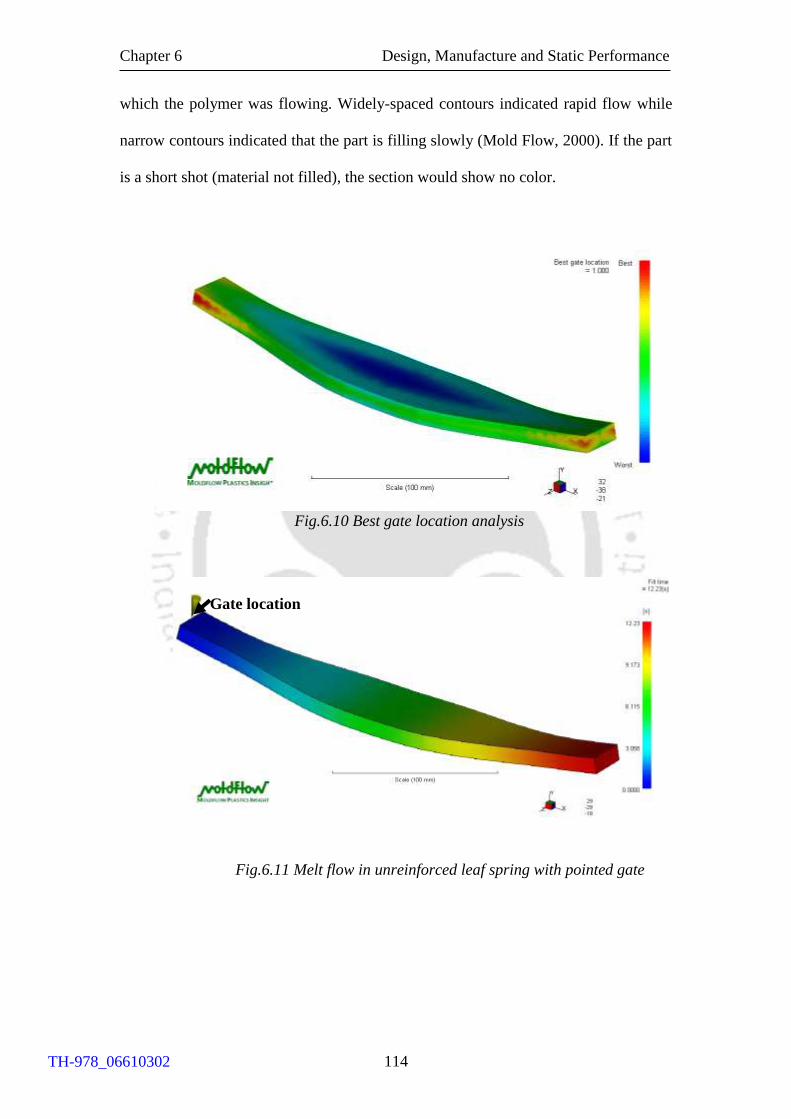
Chapter 6 Design, Manufacture and Static Performance
114
which the polymer was flowing. Widely-spaced contours indicated rapid flow while
narrow contours indicated that the part is filling slowly (Mold Flow, 2000). If the part
is a short shot (material not filled), the section would show no color.
Fig.6.10 Best gate location analysis
Fig.6.11 Melt flow in unreinforced leaf spring with pointed gate
Gate location
TH-978_06610302
Chapter 6 Design, Manufacture and Static Performance
115
6.3.3 Mold Shrinkage of Test Leaf Springs
During the filling process, polymer melt was injected into the cavity through sprue,
runner and gate. Residual stress was induced due to high pressure, temperature change
and relaxation of polymer chains during the process of filling resulted in shrinkage
and warpage of the part. Shrinkage values are corresponding to the dimensions
parallel and perpendicular to the direction of melt flow in a part. During injection
molding of fiber-reinforced polymers, the presence of fibers reduced volumetric
shrinkage. Figures 6.12 (a-b) show the volumetric shrinkage of unreinforced and
glass-fiber reinforced polypropylene leaf springs respectively. The maximum
percentage of volumetric shrinkage for unreinforced and glass fiber reinforced
polypropylene leaf springs were 15.97 and 12.47 % respectively.
TH-978_06610302
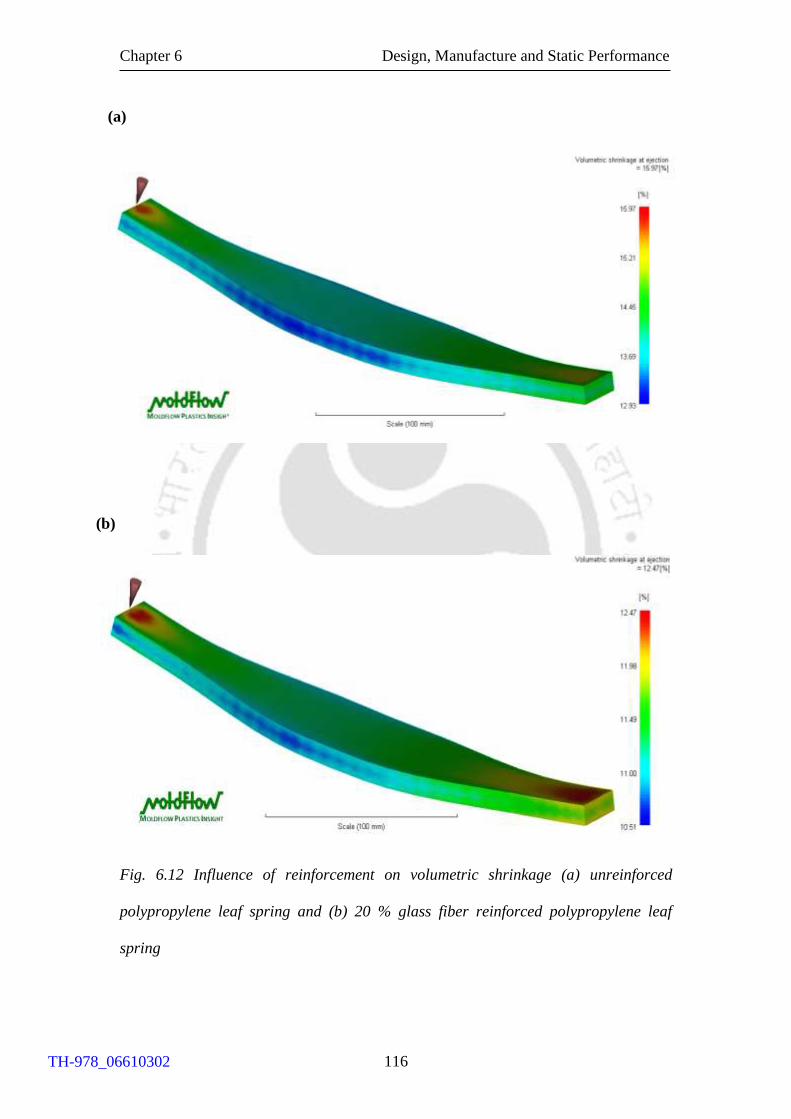
Chapter 6 Design, Manufacture and Static Performance
116
Fig. 6.12 Influence of reinforcement on volumetric shrinkage (a) unreinforced
polypropylene leaf spring and (b) 20 % glass fiber reinforced polypropylene leaf
spring
(a)
(b)
TH-978_06610302
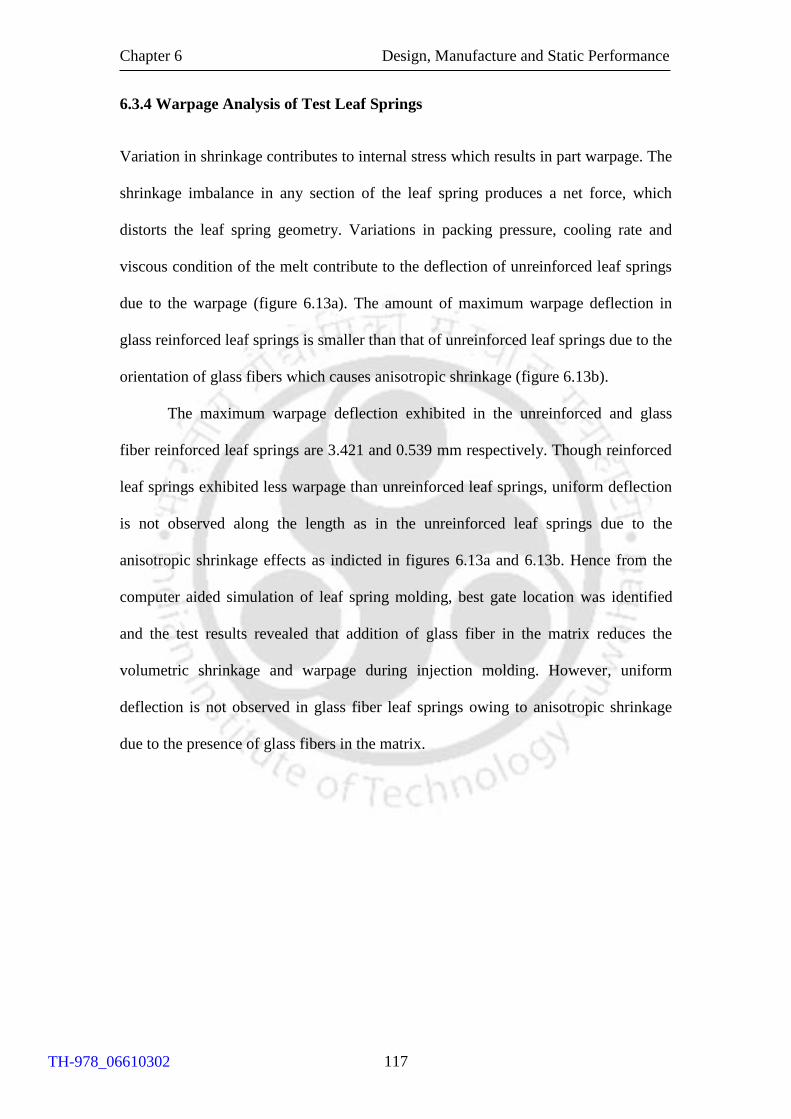
Chapter 6 Design, Manufacture and Static Performance
117
6.3.4 Warpage Analysis of Test Leaf Springs
Variation in shrinkage contributes to internal stress which results in part warpage. The
shrinkage imbalance in any section of the leaf spring produces a net force, which
distorts the leaf spring geometry. Variations in packing pressure, cooling rate and
viscous condition of the melt contribute to the deflection of unreinforced leaf springs
due to the warpage (figure 6.13a). The amount of maximum warpage deflection in
glass reinforced leaf springs is smaller than that of unreinforced leaf springs due to the
orientation of glass fibers which causes anisotropic shrinkage (figure 6.13b).
The maximum warpage deflection exhibited in the unreinforced and glass
fiber reinforced leaf springs are 3.421 and 0.539 mm respectively. Though reinforced
leaf springs exhibited less warpage than unreinforced leaf springs, uniform deflection
is not observed along the length as in the unreinforced leaf springs due to the
anisotropic shrinkage effects as indicted in figures 6.13a and 6.13b. Hence from the
computer aided simulation of leaf spring molding, best gate location was identified
and the test results revealed that addition of glass fiber in the matrix reduces the
volumetric shrinkage and warpage during injection molding. However, uniform
deflection is not observed in glass fiber leaf springs owing to anisotropic shrinkage
due to the presence of glass fibers in the matrix.
TH-978_06610302
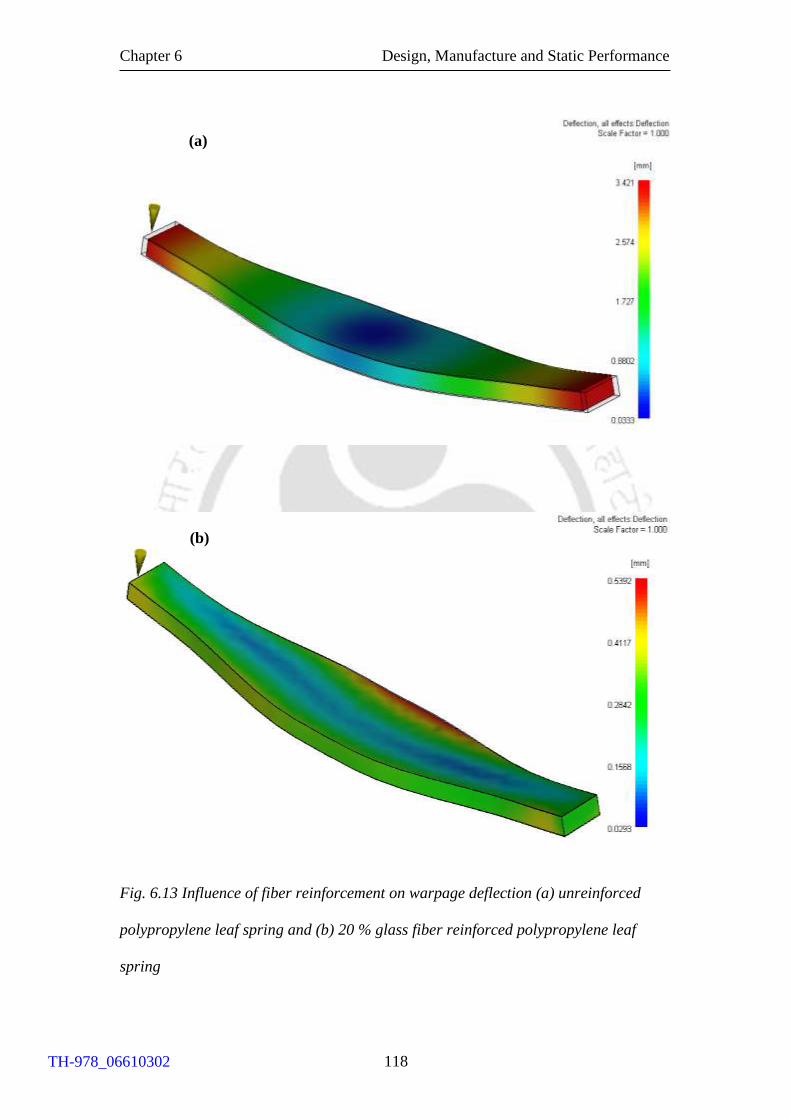
Chapter 6 Design, Manufacture and Static Performance
118
Fig. 6.13 Influence of fiber reinforcement on warpage deflection (a) unreinforced
polypropylene leaf spring and (b) 20 % glass fiber reinforced polypropylene leaf
spring
(a)
(b)
TH-978_06610302
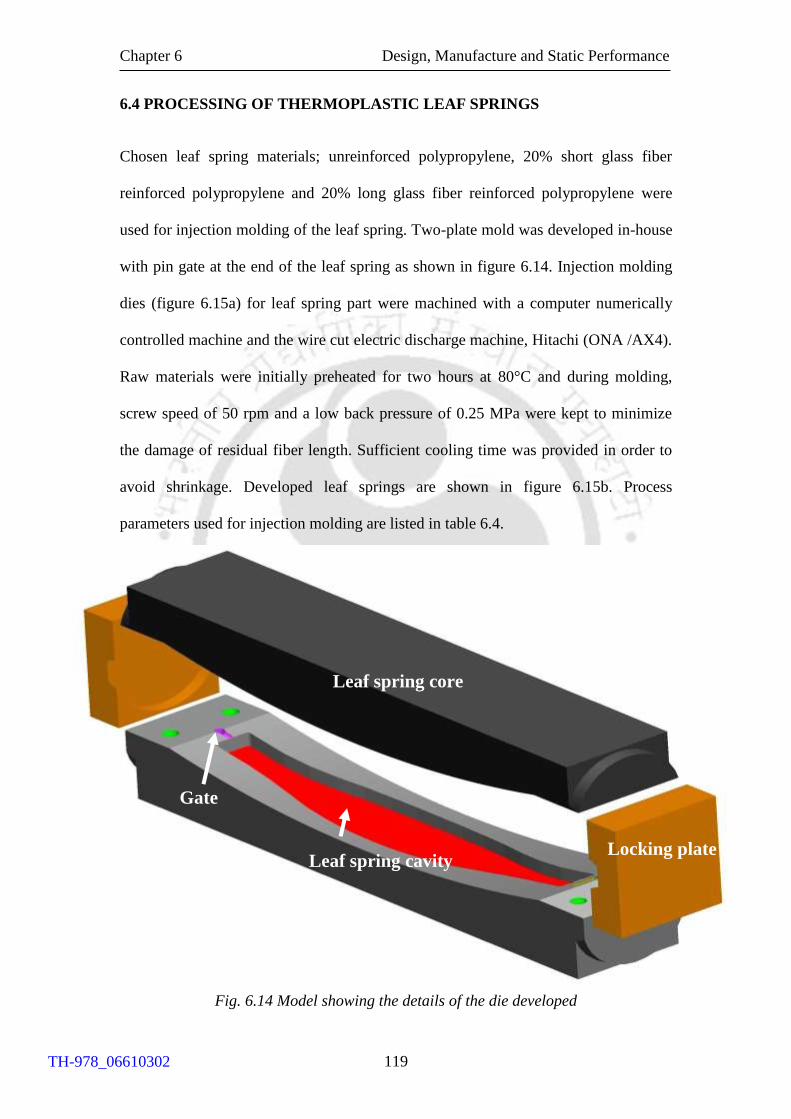
Chapter 6 Design, Manufacture and Static Performance
119
6.4 PROCESSING OF THERMOPLASTIC LEAF SPRINGS
Chosen leaf spring materials; unreinforced polypropylene, 20% short glass fiber
reinforced polypropylene and 20% long glass fiber reinforced polypropylene were
used for injection molding of the leaf spring. Two-plate mold was developed in-house
with pin gate at the end of the leaf spring as shown in figure 6.14. Injection molding
dies (figure 6.15a) for leaf spring part were machined with a computer numerically
controlled machine and the wire cut electric discharge machine, Hitachi (ONA /AX4).
Raw materials were initially preheated for two hours at 80°C and during molding,
screw speed of 50 rpm and a low back pressure of 0.25 MPa were kept to minimize
the damage of residual fiber length. Sufficient cooling time was provided in order to
avoid shrinkage. Developed leaf springs are shown in figure 6.15b. Process
parameters used for injection molding are listed in table 6.4.
Fig. 6.14 Model showing the details of the die developed
Gate
Leaf spring cavity
Leaf spring core
Locking plate
TH-978_06610302
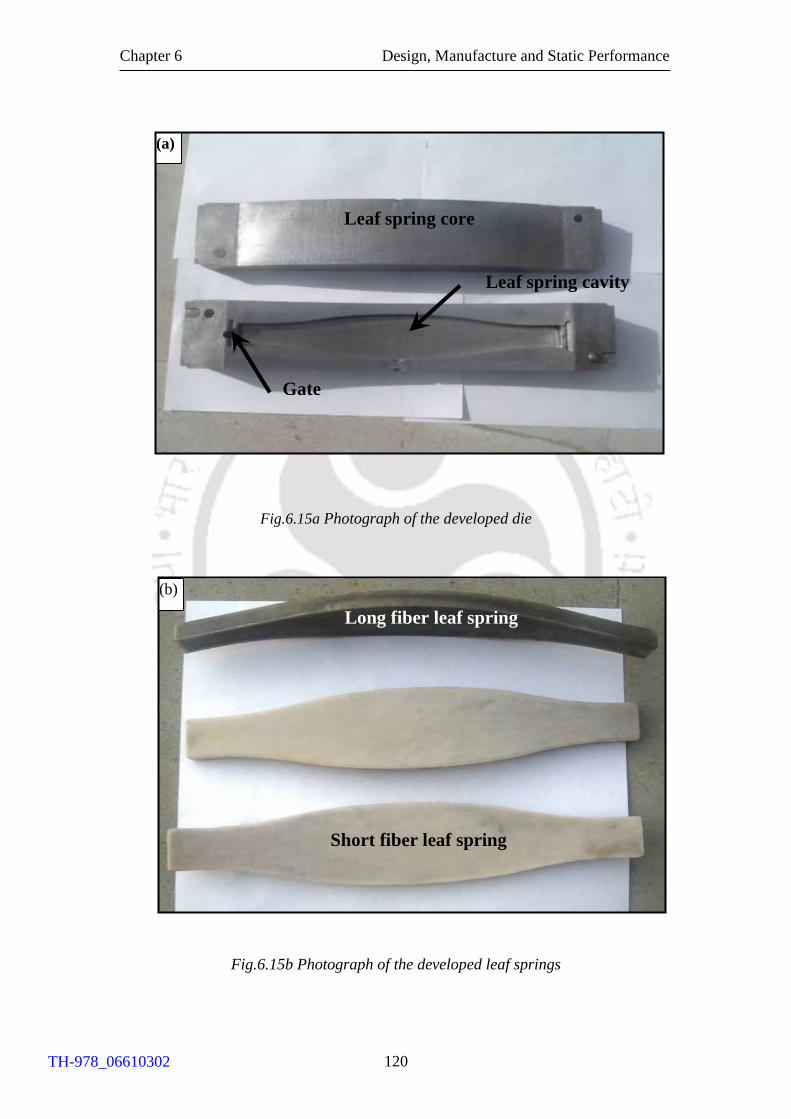
Chapter 6 Design, Manufacture and Static Performance
120
Fig.6.15a Photograph of the developed die
Fig.6.15b Photograph of the developed leaf springs
Gate
Leaf spring cavity
(a)
Leaf spring core
(b)
Long fiber leaf spring
Short fiber leaf spring
TH-978_06610302
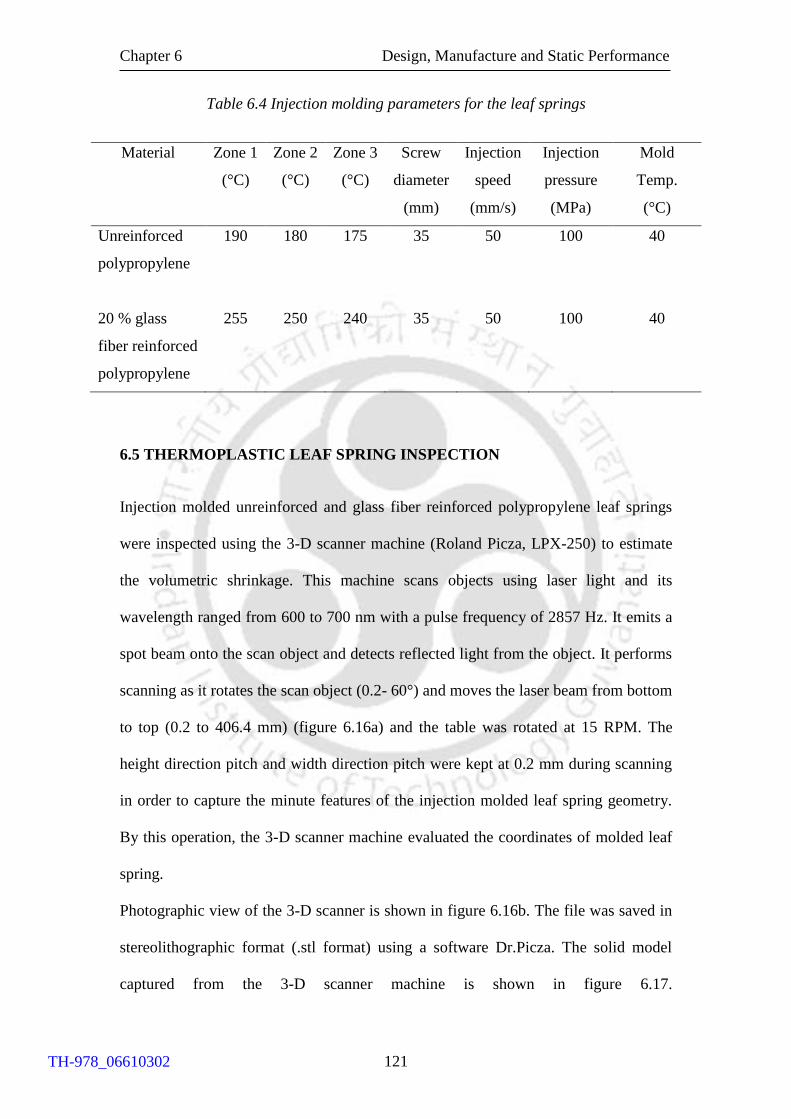
Chapter 6 Design, Manufacture and Static Performance
121
Table 6.4 Injection molding parameters for the leaf springs
6.5 THERMOPLASTIC LEAF SPRING INSPECTION
Injection molded unreinforced and glass fiber reinforced polypropylene leaf springs
were inspected using the 3-D scanner machine (Roland Picza, LPX-250) to estimate
the volumetric shrinkage. This machine scans objects using laser light and its
wavelength ranged from 600 to 700 nm with a pulse frequency of 2857 Hz. It emits a
spot beam onto the scan object and detects reflected light from the object. It performs
scanning as it rotates the scan object (0.2- 60°) and moves the laser beam from bottom
to top (0.2 to 406.4 mm) (figure 6.16a) and the table was rotated at 15 RPM. The
height direction pitch and width direction pitch were kept at 0.2 mm during scanning
in order to capture the minute features of the injection molded leaf spring geometry.
By this operation, the 3-D scanner machine evaluated the coordinates of molded leaf
spring.
Photographic view of the 3-D scanner is shown in figure 6.16b. The file was saved in
stereolithographic format (.stl format) using a software Dr.Picza. The solid model
captured from the 3-D scanner machine is shown in figure 6.17.
Material Zone 1
(°C)
Zone 2
(°C)
Zone 3
(°C)
Screw
diameter
(mm)
Injection
speed
(mm/s)
Injection
pressure
(MPa)
Mold
Temp.
(°C)
Unreinforced
polypropylene
190 180 175 35 50 100 40
20 % glass
fiber reinforced
polypropylene
255 250 240 35 50 100 40
TH-978_06610302
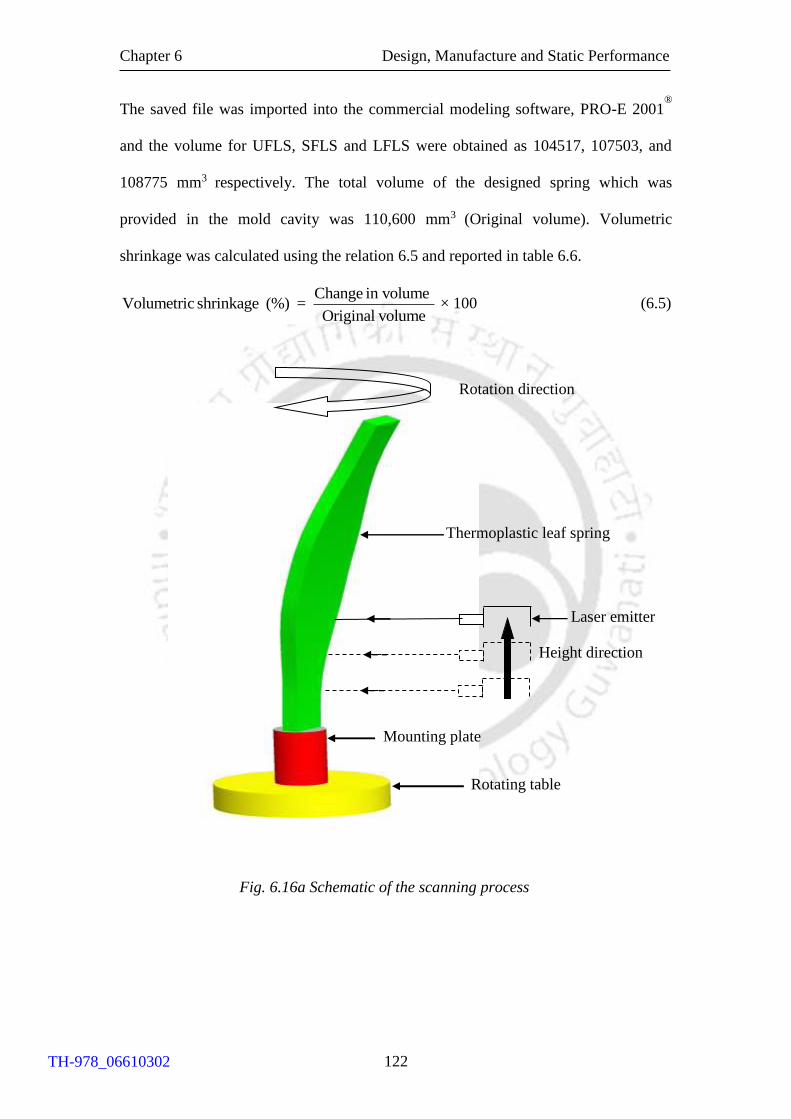
Chapter 6 Design, Manufacture and Static Performance
122
The saved file was imported into the commercial modeling software, PRO-E 2001®
and the volume for UFLS, SFLS and LFLS were obtained as 104517, 107503, and
108775 mm3 respectively. The total volume of the designed spring which was
provided in the mold cavity was 110,600 mm3 (Original volume). Volumetric
shrinkage was calculated using the relation 6.5 and reported in table 6.6.
Change in volume Volumetric shrinkage (%) =
Original volume× 100 (6.5)
Fig. 6.16a Schematic of the scanning process
Rotating table
Thermoplastic leaf spring
Mounting plate
Rotation direction
Height direction
Laser emitter
TH-978_06610302
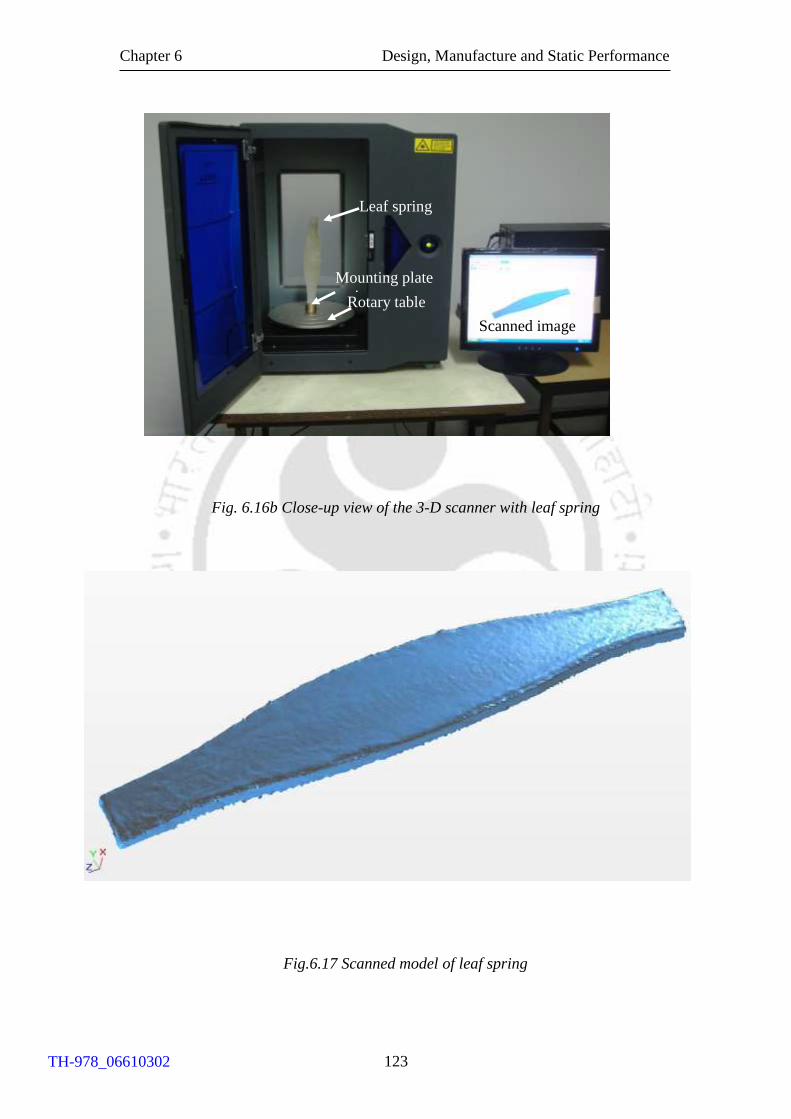
Chapter 6 Design, Manufacture and Static Performance
123
Fig. 6.16b Close-up view of the 3-D scanner with leaf spring
Fig.6.17 Scanned model of leaf spring
Leaf spring
Mounting plate
spring Rotary table
Scanned image
TH-978_06610302
Chapter 6 Design, Manufacture and Static Performance
124
Mass of atleast three leaf springs of each material was measured using an electronic
balance of 0.1 mg accuracy (Sartorius, Make; BT224S). The mass of UFLS, SFLS
and LFLS leaf springs were found to be 93.650 3.5, 109.502 4.2, 112.793 3.9 g
respectively. The density of UFPP, SFPP and LFPP were 0.90, 1.03, 1.04 g/cm3 (Saint
Gobain/ Twintex, 2005). The leaf spring volume was calculated by assuming the
component is free from voids. The volume of UFLS, SFLS and LFLS were found to
be 104055, 106312 and 108454 mm3 respectively. With the calculated volume,
volumetric shrinkage is calculated and reported in table 6.6.
Table 6.5 Volumetric shrinkage by 3-D Scanner and weight measurement
6.6 FIXTURE FOR LEAF SPRING PERFORMANCE EVALUATION
In a suspension system, leaf spring ends are attached to the automobile body and
center of the leaf spring is supported on the axle through which vertical forces are
transmitted. A fixture was designed with a linear guide way (THK E8-0620) and
integrated with the existing servo hydraulic fatigue testing machine as shown in
figure 6.18a (Instron 8801) to evaluate the performance of molded leaf spring.
Material
Volumetric shrinkage
by inspection in %
Volumetric shrinkage by
weight measurement in %
Unreinforced polypropylene 5.50 5.9
20 % short glass fiber
reinforced polypropylene
2.80 3.8
20 % long glass fiber
reinforced polypropylene
1.65 1.9
TH-978_06610302
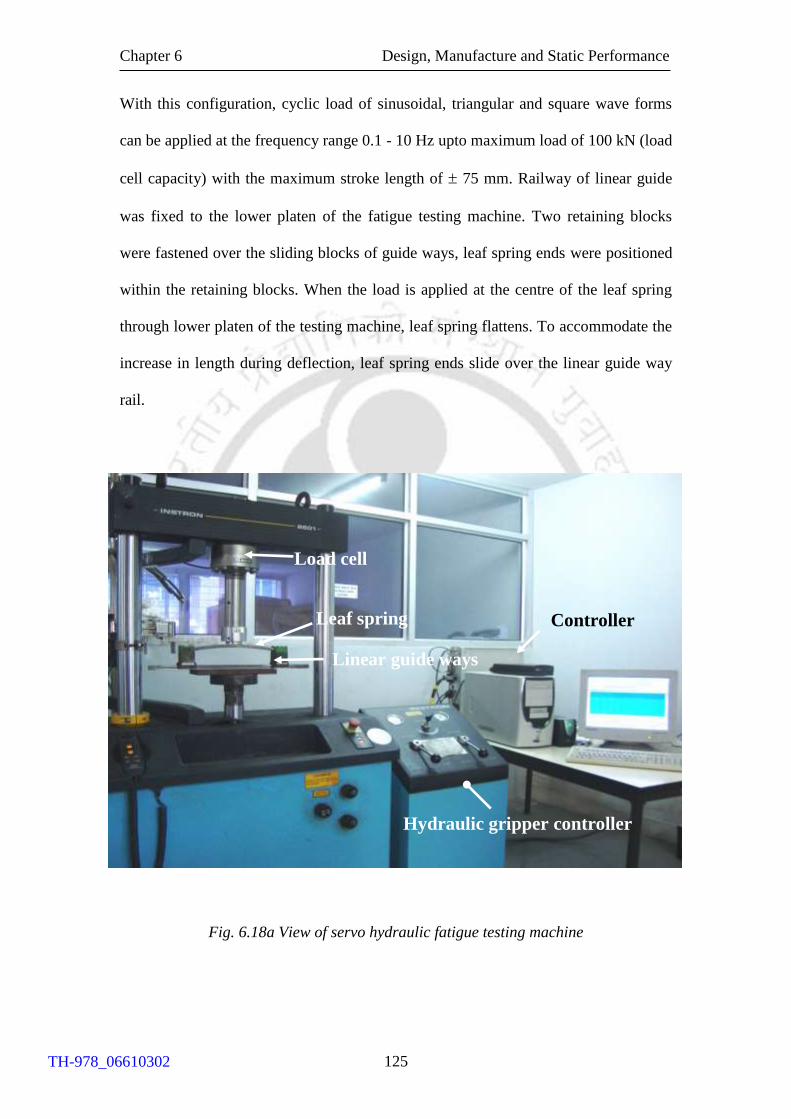
Chapter 6 Design, Manufacture and Static Performance
125
With this configuration, cyclic load of sinusoidal, triangular and square wave forms
can be applied at the frequency range 0.1 - 10 Hz upto maximum load of 100 kN (load
cell capacity) with the maximum stroke length of 75 mm. Railway of linear guide
was fixed to the lower platen of the fatigue testing machine. Two retaining blocks
were fastened over the sliding blocks of guide ways, leaf spring ends were positioned
within the retaining blocks. When the load is applied at the centre of the leaf spring
through lower platen of the testing machine, leaf spring flattens. To accommodate the
increase in length during deflection, leaf spring ends slide over the linear guide way
rail.
Fig. 6.18a View of servo hydraulic fatigue testing machine
Fixture
Linear guide way
Hydraulic gripper controller
Leaf spring Controller
Load cell
Linear guide ways
TH-978_06610302
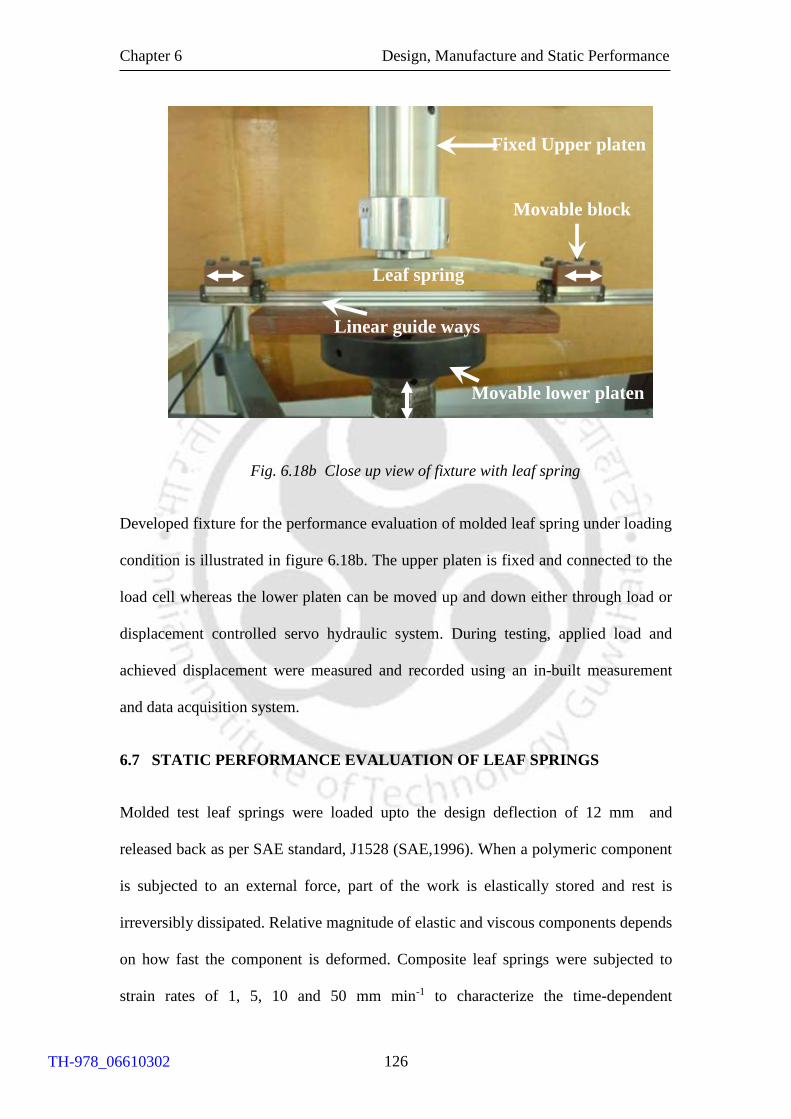
Chapter 6 Design, Manufacture and Static Performance
126
Fig. 6.18b Close up view of fixture with leaf spring
Developed fixture for the performance evaluation of molded leaf spring under loading
condition is illustrated in figure 6.18b. The upper platen is fixed and connected to the
load cell whereas the lower platen can be moved up and down either through load or
displacement controlled servo hydraulic system. During testing, applied load and
achieved displacement were measured and recorded using an in-built measurement
and data acquisition system.
6.7 STATIC PERFORMANCE EVALUATION OF LEAF SPRINGS
Molded test leaf springs were loaded upto the design deflection of 12 mm and
released back as per SAE standard, J1528 (SAE,1996). When a polymeric component
is subjected to an external force, part of the work is elastically stored and rest is
irreversibly dissipated. Relative magnitude of elastic and viscous components depends
on how fast the component is deformed. Composite leaf springs were subjected to
strain rates of 1, 5, 10 and 50 mm min-1 to characterize the time-dependent
Fixed Upper platen
Movable block
Linear guide ways
Movable lower platen
Leaf spring
TH-978_06610302
Chapter 6 Design, Manufacture and Static Performance
127
load -deflection behavior. Molded leaf springs were subjected to loading rate of 5, 10
and 20 N/s and the corresponding load deflection curve for loading and unloading
were plotted to quantify hysteretic behavior of molded leaf spring. Area enclosed by
the loading and unloading curve exhibited the damping behavior of molded composite
leaf spring under service condition. Molded leaf springs were also subjected to a
maximum deflection of 12 mm and the deflection was maintained constantly for a
time period of 15,000 s to investigate the load relaxation characteristics on the molded
leaf spring.
6.7.1 Load Deflection Behavior of Leaf Springs
Design of suspension leaf spring is based on strength as well as deflection.
Figure 6.19 shows the load-deflection curve of the molded long fiber reinforced leaf
spring (LFLS), short fiber reinforced leaf spring (SFLS) and unreinforced leaf spring
(UFLS). It is observed from the figure 6.19 that the load required for a deflection of
12 mm for LFLS, SFLS and UFLS are 490, 190 and 110 N respectively. The spring
rate of long, short glass fiber reinforced leaf spring and unreinforced leaf spring were
computed from the initial portion of the load-deflection curve and found to be 40.1,
15.45 and 9.17 N/mm respectively. Spring rate of LFLS was found to be about three
times greater than that of SFLS and five times greater than UFLS. It is to be noted that
the above behavior was observed when the tests were carried under constant
displacement rate of 5mm/min. Due to the vehicle service condition, suspension leaf
springs were subjected to the time varying load, and hence there is a need to
understand the load -deflection behavior of molded leaf springs at various strain rates.
TH-978_06610302
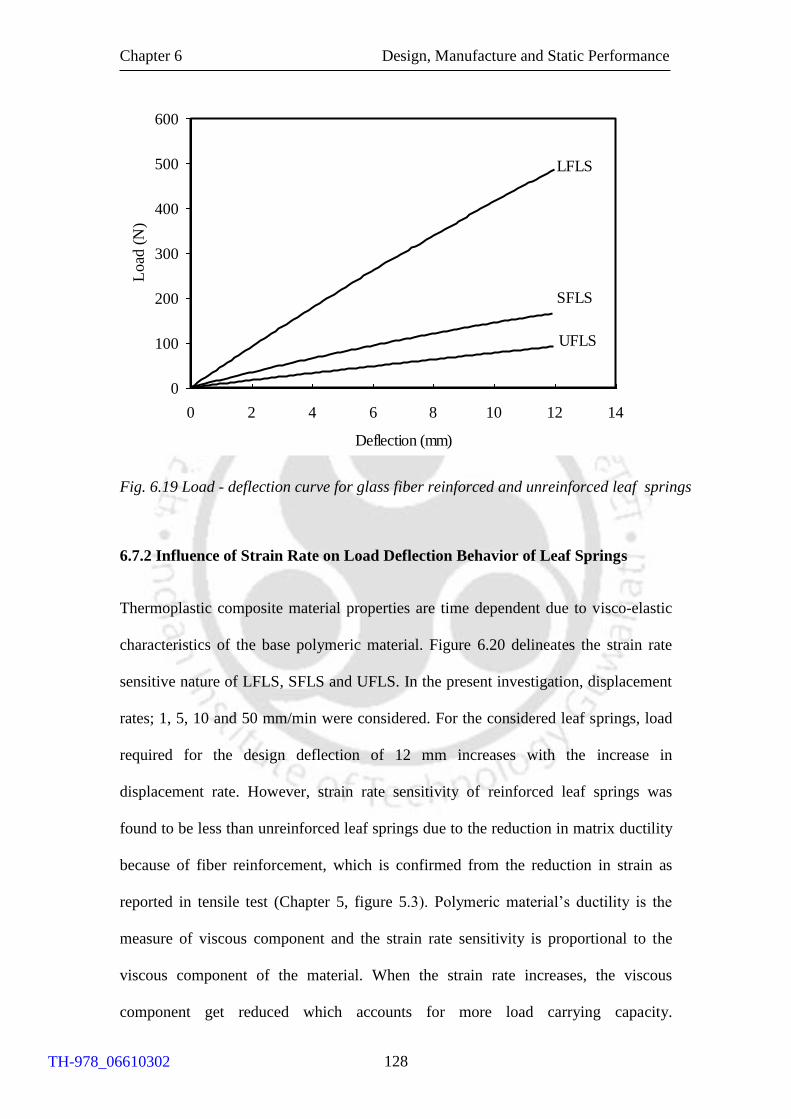
Chapter 6 Design, Manufacture and Static Performance
128
Fig. 6.19 Load - deflection curve for glass fiber reinforced and unreinforced leaf springs
6.7.2 Influence of Strain Rate on Load Deflection Behavior of Leaf Springs
Thermoplastic composite material properties are time dependent due to visco-elastic
characteristics of the base polymeric material. Figure 6.20 delineates the strain rate
sensitive nature of LFLS, SFLS and UFLS. In the present investigation, displacement
rates; 1, 5, 10 and 50 mm/min were considered. For the considered leaf springs, load
required for the design deflection of 12 mm increases with the increase in
displacement rate. However, strain rate sensitivity of reinforced leaf springs was
found to be less than unreinforced leaf springs due to the reduction in matrix ductility
because of fiber reinforcement, which is confirmed from the reduction in strain as
reported in tensile test (Chapter 5, figure 5.3). Polymeric material’s ductility is the
measure of viscous component and the strain rate sensitivity is proportional to the
viscous component of the material. When the strain rate increases, the viscous
component get reduced which accounts for more load carrying capacity.
0
100
200
300
400
500
600
0 2 4 6 8 10 12 14
Deflection (mm)
Load
(N
)
LFLS
SFLS
UFLS
TH-978_06610302

Chapter 6 Design, Manufacture and Static Performance
129
Since energy is absorbed in the leaf springs, higher the energy absorbed, better is the
isolation of a vehicle from vibration. Hence there is a need to understand the energy
storage capacity of the molded leaf springs.
Fig. 6.20 Effect of strain rate on reinforced and unreinforced leaf spring
6.7.3 Energy Storage Capacity of Leaf Springs
In service, spring stress must not exceed allowable stress to avoid permanent
set /premature failure. This consideration limits the amount of energy which can be
stored in the spring. The absorbed energy for the effective work done was estimated
by measuring the area under load-deflection curve for a maximum designed deflection
of 12 mm. Energy stored by the chosen UFLS, SFLS and LFLS were 4.55, 9.37 and
24.11 J, LFLS can store more energy than other two chosen leaf springs and this
feature enables to provide better vehicle riding comfort.
0
100
200
300
400
500
0 2 4 6 8 10 12 14
Deflection (mm)
Load
(N
)
1mm/min 5mm/min
10mm/min 50mm/min
LFPP
SFPP
UFPP
TH-978_06610302
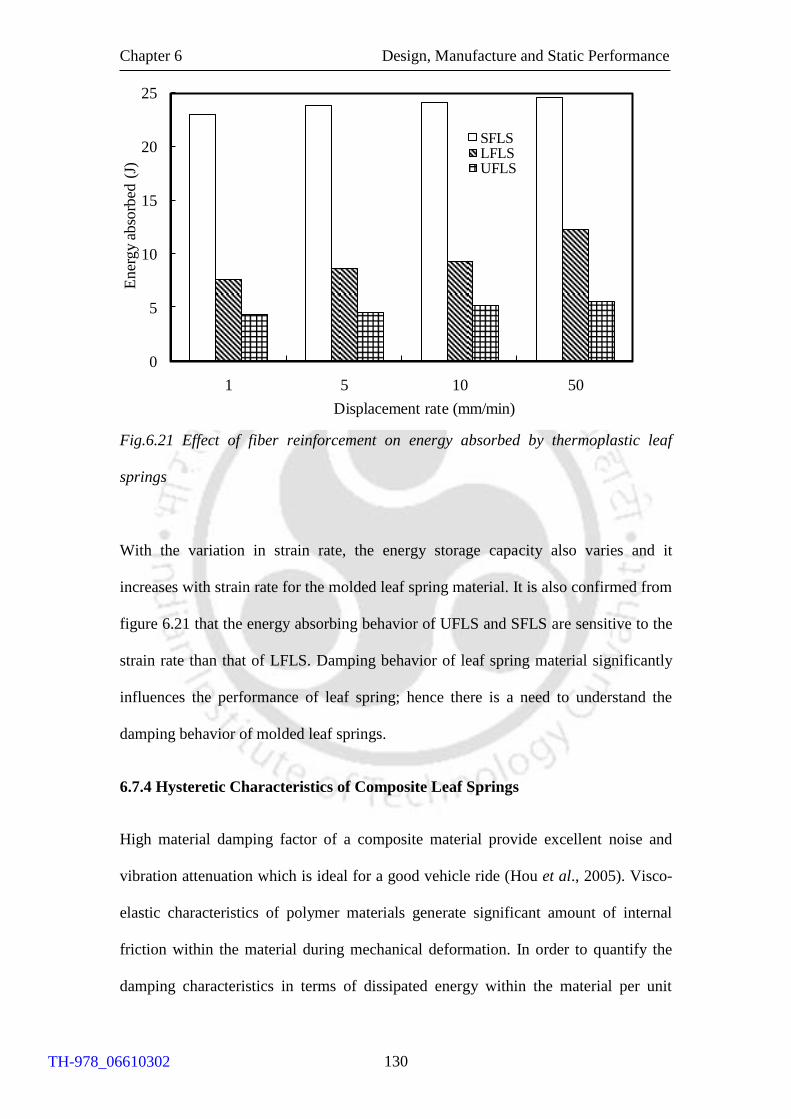
Chapter 6 Design, Manufacture and Static Performance
130
Fig.6.21 Effect of fiber reinforcement on energy absorbed by thermoplastic leaf
springs
With the variation in strain rate, the energy storage capacity also varies and it
increases with strain rate for the molded leaf spring material. It is also confirmed from
figure 6.21 that the energy absorbing behavior of UFLS and SFLS are sensitive to the
strain rate than that of LFLS. Damping behavior of leaf spring material significantly
influences the performance of leaf spring; hence there is a need to understand the
damping behavior of molded leaf springs.
6.7.4 Hysteretic Characteristics of Composite Leaf Springs
High material damping factor of a composite material provide excellent noise and
vibration attenuation which is ideal for a good vehicle ride (Hou et al., 2005). Visco-
elastic characteristics of polymer materials generate significant amount of internal
friction within the material during mechanical deformation. In order to quantify the
damping characteristics in terms of dissipated energy within the material per unit
0
5
10
15
20
25
1 5 10 50
En
erg
y a
bso
rbed
(J)
Displacement rate (mm/min)
SFLSLFLSUFLS
TH-978_06610302

Chapter 6 Design, Manufacture and Static Performance
131
cycle, hysteretic performance curve was obtained by loading and unloading the
spring. Molded leaf springs were subjected to loading-unloading for a maximum load
of 200 N at a loading rate of 5, 10 and 20 N/s. Figure 6.22a shows the hysteretic
behavior of LFLS. Figure 6.22b confirmed that UFLS and SFLS dissipated more
energy than that of LFLS; in addition, hysteretic losses of LFLS were less sensitive to
loading rate due to its enhanced stiffness. Stiffer the material, lesser the plastic
deformation, resulted in lowering the hysteretic loss per cycle (Rosato et al., 2000).
Less hysteretic effect is preferable under dynamic loading conditions. For a
given volume fraction of glass fiber material, short fiber reinforced material have
more fiber ends than long fiber reinforced material as reported in section 5.2.
Karger-Kocsis and Friedrich (1988) also reported similar observations in the long and
short fiber reinforced polyamide 66 composite, where the fracture surface revealed
that longer fiber length had a much smaller fiber density per unit area than that of
short fiber polyamide composite. Energy is dissipated through the fiber-matrix
interface (Gassan and Bledzki, 2007). Therefore, with the presence of more fiber ends
in SFPP material, energy dissipation is more than that of LFPP materials. In addition,
with the increased fiber length in LFPP material, viscous response is dominated by
elastic response. This reduction of viscous response in LFPP material contributes to
the less sensitivity towards hysteretic energy dissipation than SFPP material with
respect to loading rate.
TH-978_06610302

Chapter 6 Design, Manufacture and Static Performance
132
Fig. 6.22 a Loading-unloading curve for molded long fiber reinforced leaf springs
Fig. 6.22b Hysteretic component of molded leaf springs
0
50
100
150
200
250
300
0 1 2 3 4 5
Deflection (mm)
Load
(N
)5N/s 10N/s 20N/s
0
200
400
600
800
1000
1200
5 10 20
Hyst
eres
is a
rea
(N-m
m)
Loading rate (N/s)
LFLS SFLS UFLS
TH-978_06610302
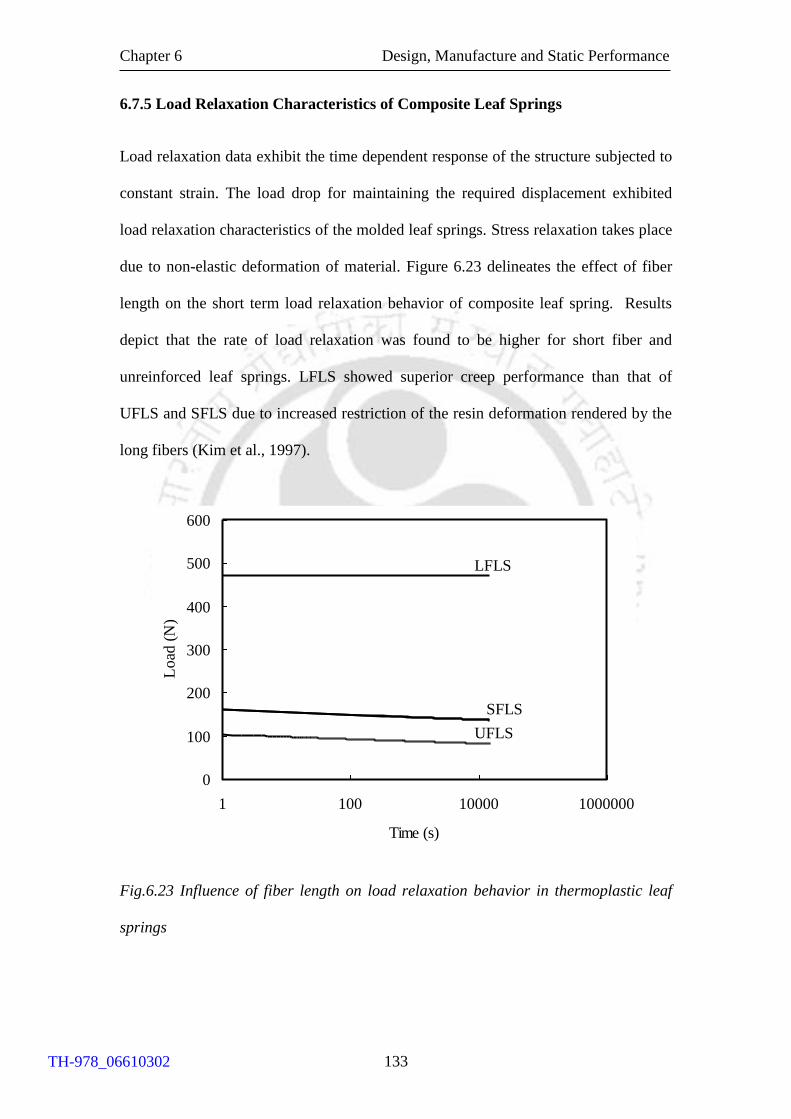
Chapter 6 Design, Manufacture and Static Performance
133
6.7.5 Load Relaxation Characteristics of Composite Leaf Springs
Load relaxation data exhibit the time dependent response of the structure subjected to
constant strain. The load drop for maintaining the required displacement exhibited
load relaxation characteristics of the molded leaf springs. Stress relaxation takes place
due to non-elastic deformation of material. Figure 6.23 delineates the effect of fiber
length on the short term load relaxation behavior of composite leaf spring. Results
depict that the rate of load relaxation was found to be higher for short fiber and
unreinforced leaf springs. LFLS showed superior creep performance than that of
UFLS and SFLS due to increased restriction of the resin deformation rendered by the
long fibers (Kim et al., 1997).
Fig.6.23 Influence of fiber length on load relaxation behavior in thermoplastic leaf
springs
0
100
200
300
400
500
600
1 100 10000 1000000
Time (s)
Load
(N
)
LFLS
SFLS
UFLS
TH-978_06610302
Chapter 6 Design, Manufacture and Static Performance
134
6.8 SUMMARY
This chapter discussed the design procedure, development and preliminary
performance of the thermoplastic composite leaf spring.
Various geometric configurations pertaining to SAE standards were considered
and the proposed design was evaluated with the aid of finite element analysis after
optimization of leaf spring dimension at center.
Injection molding simulation was carried out to choose best gate location.
Presence of fibers in the molded leaf spring found to reduce the volumetric
shrinkage.
Unreinforced, 20 % short glass fiber reinforced and 20 % long glass fiber
reinforced polypropylene leaf springs were injection molded and static
performance was carried out with the developed fixture in house.
Spring rate of LFLS was found to be about three times greater than that of SFLS
and five times greater than UFLS. Energy storage capability of LFLS was found
to be significantly higher that of SFLS and UFLS, which helps to isolate
vibrations. Load-deflection behavior of LFLS showed less strain rate sensitiveness
than that of SFLS and UFLS.
TH-978_06610302
Chapter 7 Fatigue and Creep Performance
135
CHAPTER 7
FATIGUE AND CREEP PERFORMANCE OF
THERMOPLASTIC LEAF SPRINGS
7.1 INTRODUCTION
Suspension leaf springs are subjected to fatigue loads when the vehicle periodically
passes through surface irregularities on the road. Identification of safe operating
regime of the developed thermoplastic composite leaf springs is of practical
importance. Apart from identifying the fatigue strength of the component, it is
necessary to characterize the damage progression in the component viz. hysteresis,
damping and stiffness reduction during fatigue test (Orth et al., 1993). Processing
conditions, fiber length, matrix properties, interfacial properties and testing conditions
were identified as the major influencing factors over the fatigue behaviour of the fiber
reinforced composites (Sauer and Richardson et al., 1980). Increase in fiber loading
and length of fibers improved the fatigue crack propagation resistance (Czigany and
Karger-Kocsis, 1993). The interfacial strength plays a significant role on the fatigue
behaviour of the discontinuous fiber reinforced composites (Bureau and Denault,
2004). Presence of long glass fibers in the polypropylene matrix reduced the energy
dissipation characteristics and provides higher fatigue life (Goel et al., 2008).
Different fatigue failure mechanisms are possible due to the heterogeneous
characteristics of the discontinuous fiber reinforced composites and hence
understanding the micro mechanisms of product failure helps to design and develop
quality components.
TH-978_06610302
Chapter 7 Fatigue and Creep Performance
136
Creep performance evaluation is essential due to the requirement of service
conditions; leaf springs are subjected to constant stress for long duration as the chassis
weight is taken by the suspension system even when the vehicle remains stationary.
Besides, leaf springs are also subjected to various stress levels due to the different
payload conditions. In the discontinuous fiber reinforced composites, fiber length and
temperature influenced the stress transfer which significantly contributes to the creep
behavior (Silverman, 1987).
This chapter reported the fatigue and short-term creep performance of
discontinuous fiber reinforced thermoplastic leaf springs at various stress levels.
Cyclic load-deflection curve of molded leaf springs were utilized as an index to
quantify the accumulated leaf spring damage during fatigue testing and safe operating
regime was identified. The influence of reinforcement over leaf spring fatigue failure
mechanism was also reported in this chapter. In addition, flexural short-term creep
performance of leaf springs were investigated and experimental creep performance of
2 h was utilized to predict the creep performance with the aid of empirical model and
compared with 24 h experimental creep data.
7.2 FATIGUE PERFORMANCE EVALUATION METHODOLOGY
Unreinforced polypropylene (UFLS), 20 wt % short (SFLS) and 20 wt % long glass
fiber reinforced polypropylene (LFLS) leaf springs were used for the fatigue
performance evaluation. Details of fixture for the leaf spring testing were reported in
section 6.5. Test leaf springs were loaded upto 12 mm deflection (Camber) and
released back as per SAE standards (SAE J 1528, 1990). The load taken for this
magnitude of deflection of test leaf spring was taken as Pmax. Since leaf springs are
not subjected to completely reversed load in service, tests were performed under
TH-978_06610302
Chapter 7 Fatigue and Creep Performance
137
pulsating bending mode with an amplitude ratio, A = -1. Molded test leaf springs were
subjected to various levels of alternating loads with respect to Pmax at a frequency of
0.5 Hz (SAE J 1528, 1990). Tests were conducted under laboratory conditions (32 ±
3°C, RH 57 % ± 5 %). During fatigue test, leaf spring damage was continuously
monitored with the help of cyclic load-deflection curve. The cyclic load-deflection
plot at 0.8Pmax, 0.9Pmax and Pmax was further utilized to quantify energy dissipation
and spring rate drop. Failure of molded leaf springs was considered when the spring
rate reduced by 10 % or fracture.
7.3 FATIGUE PERFORMANCE OF THERMOPLASTIC LEAF SPRINGS
7.3.1 Energy Dissipation of Test Leaf Springs
Energy dissipation behavior of a suspension system significantly influences the
passengers riding comfort. Although energy dissipation minimizes structural
vibration, it significantly reduces the spring rate which is not desirable for suspension
application. Schematic representation of cyclic stress-strain loop to evaluate energy
dissipation and spring rate under fatigue condition is shown in figure 7.1. The
hysteretic characteristic of the polymeric material causes significant energy
dissipation under dynamic condition. Energy dissipation ratio (Hc) is the ratio of
energy lost/cycle (measured from the area enclosed by the loading-unloading curve)
to the strain energy/cycle (area enclosed by the loading curve). Sugimoto and Sasaki
(2007) also used energy dissipation ratio parameter as an index for the fatigue
performance evaluation. Orth et al. (1993) specified energy dissipation ratio as a
measure of damping and quantified the instantaneous increase in the damping for
valve spring retainer under fatigue conditions.
TH-978_06610302
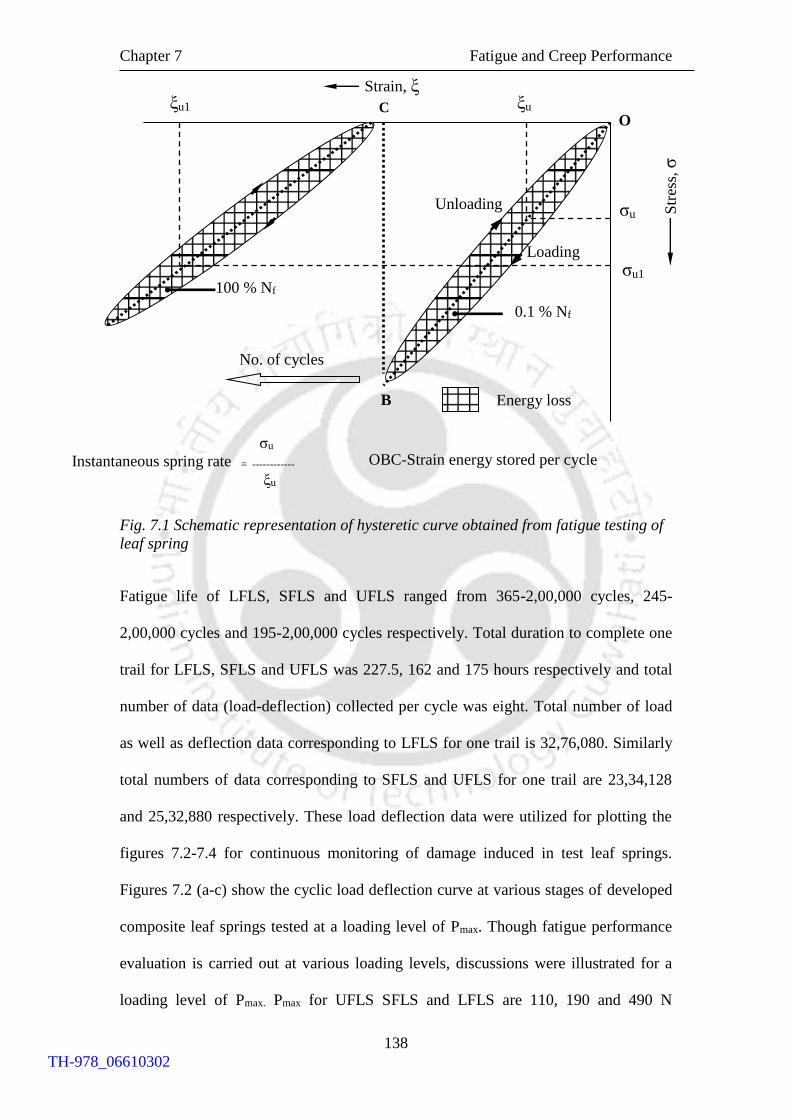
Chapter 7 Fatigue and Creep Performance
138
Fig. 7.1 Schematic representation of hysteretic curve obtained from fatigue testing of
leaf spring
Fatigue life of LFLS, SFLS and UFLS ranged from 365-2,00,000 cycles, 245-
2,00,000 cycles and 195-2,00,000 cycles respectively. Total duration to complete one
trail for LFLS, SFLS and UFLS was 227.5, 162 and 175 hours respectively and total
number of data (load-deflection) collected per cycle was eight. Total number of load
as well as deflection data corresponding to LFLS for one trail is 32,76,080. Similarly
total numbers of data corresponding to SFLS and UFLS for one trail are 23,34,128
and 25,32,880 respectively. These load deflection data were utilized for plotting the
figures 7.2-7.4 for continuous monitoring of damage induced in test leaf springs.
Figures 7.2 (a-c) show the cyclic load deflection curve at various stages of developed
composite leaf springs tested at a loading level of Pmax. Though fatigue performance
evaluation is carried out at various loading levels, discussions were illustrated for a
loading level of Pmax. Pmax for UFLS SFLS and LFLS are 110, 190 and 490 N
Loading
B
B
σu
σu1
OBC-Strain energy stored per cycle
σu
Instantaneous spring rate = ------------
ξu
Energy loss
Unloading
C O
ξu ξu1
0.1 % Nf
100 % Nf
Strain, ξ
Str
ess,
σ
No. of cycles
TH-978_06610302
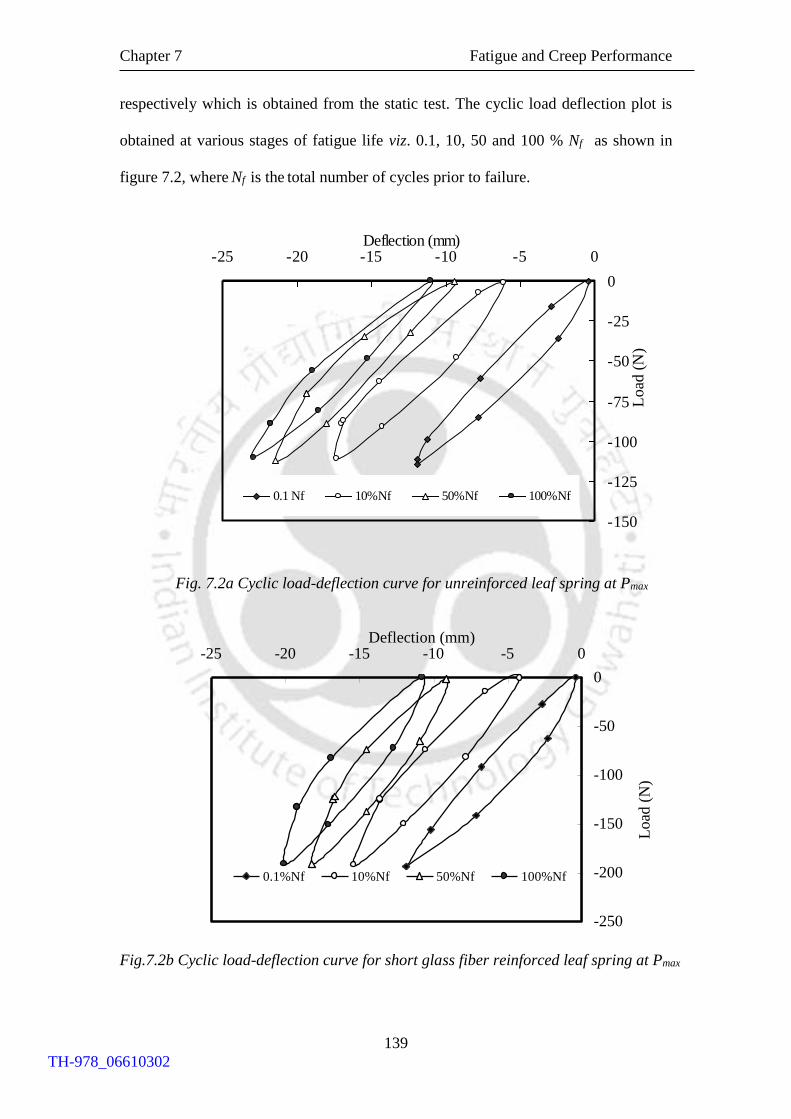
Chapter 7 Fatigue and Creep Performance
139
respectively which is obtained from the static test. The cyclic load deflection plot is
obtained at various stages of fatigue life viz. 0.1, 10, 50 and 100 % Nf as shown in
figure 7.2, where Nf is the total number of cycles prior to failure.
Fig. 7.2a Cyclic load-deflection curve for unreinforced leaf spring at Pmax
Fig.7.2b Cyclic load-deflection curve for short glass fiber reinforced leaf spring at Pmax
-250
-200
-150
-100
-50
0
-25 -20 -15 -10 -5 0Deflection (mm)
Load
(N
)
0.1%Nf 10%Nf 50%Nf 100%Nf
-150
-125
-100
-75
-50
-25
0
-25 -20 -15 -10 -5 0Deflection (mm)
Lo
ad (
N)
0.1 Nf 10%Nf 50%Nf 100%Nf
TH-978_06610302
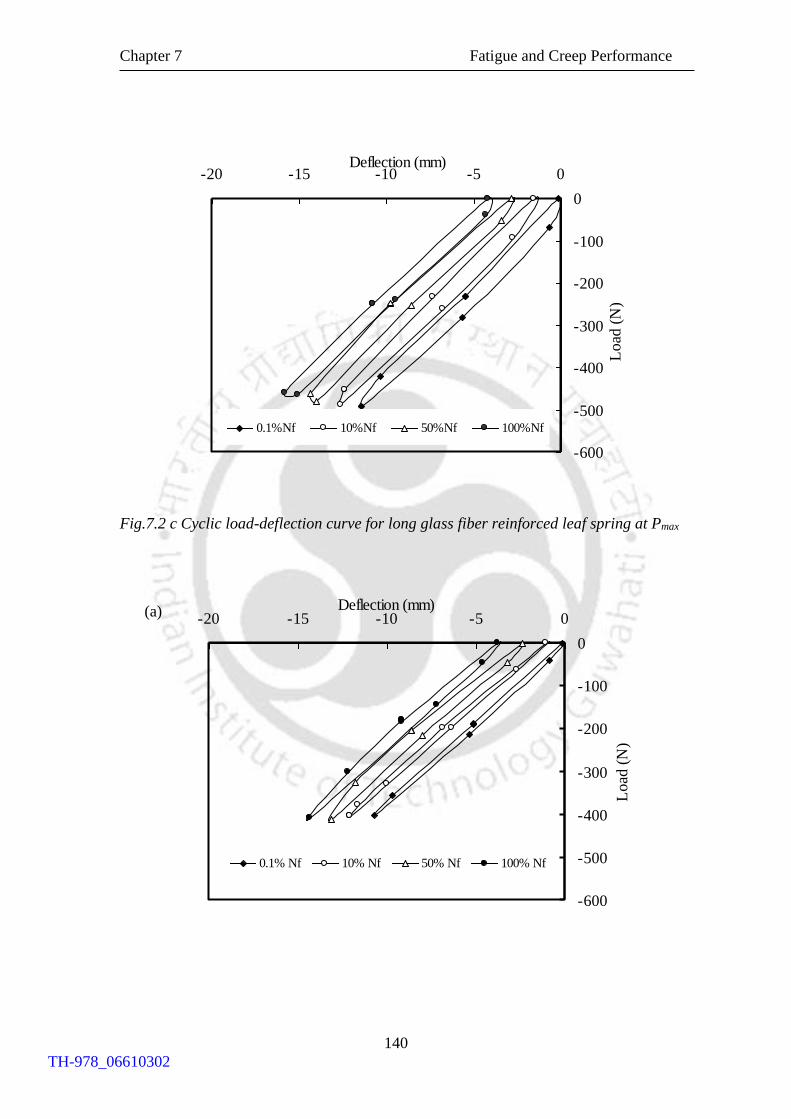
Chapter 7 Fatigue and Creep Performance
140
Fig.7.2 c Cyclic load-deflection curve for long glass fiber reinforced leaf spring at Pmax
-600
-500
-400
-300
-200
-100
0
-20 -15 -10 -5 0Deflection (mm)
Lo
ad (
N)
0.1% Nf 10% Nf 50% Nf 100% Nf
(a)
-600
-500
-400
-300
-200
-100
0
-20 -15 -10 -5 0Deflection (mm)
Lo
ad (
N)
0.1%Nf 10%Nf 50%Nf 100%Nf
TH-978_06610302

Chapter 7 Fatigue and Creep Performance
141
Fig. 7.3 Cyclic load-deflection curve for long glass fiber reinforced leaf spring at
(a) 0.8 Pmax (b) 0.9 Pmax (c) 1.2Pmax
-600
-500
-400
-300
-200
-100
0
-20 -15 -10 -5 0
Deflection (mm)
Load
(N
)
0.1% Nf 10% Nf 50% Nf 100 %Nf
(b)
-700
-600
-500
-400
-300
-200
-100
0
-20 -15 -10 -5 0
Deflection (mm)
Lo
ad (
N)
0.1% Nf 10% Nf 50% Nf 100 %Nf
(c)
TH-978_06610302
Chapter 7 Fatigue and Creep Performance
142
Energy dissipation of test leaf spring is evaluated from the cyclic load-deflection plot.
To compare the leaf spring performance, the energy dissipation ratio at beginning
(10th) and after finite number of cycle (3500th) was computed. The increase in energy
dissipation ratio from the beginning to 3500th cycle for UFLS, SFLS and LFLS are
found to be 1.40, 1.20 and 1.04 respectively. Earlier investigation (Section 6.7.4)
under static condition also confirmed the enhanced energy dissipation behavior of
SFLS than that of LFLS. This behavior is due to the presence of more fiber ends in
SFLS than that of LFLS. In addition, the presence of high modulus long glass fibers
reduces the energy dissipation significantly. Talib et al. (2010) also reported the
reduced energy dissipation behavior due to the presence of high modulus carbon fiber
in the composite springs.
These hysteresis loops move along the deflection axis throughout the life of the
component. The shape and size of these loops, depends on the applied stress. Figures
7.3(a-c) show the cyclic load-deflection curve of long fiber reinforced leaf springs
subjected to 0.8 Pmax , 0.9 Pmax and 1.2 Pmax at various period of fatigue life (Nf).
Cyclic load-deflection plot of test leaf springs exhibited significant increase in
deflection with the increase in load during the fatigue loading. Since energy
dissipation is associated with the spring rate reduction, further quantification of spring
rate is of the practical importance to the suspension application.
7.3.2 Spring Rate of Test Leaf Springs
Spring rate of the vehicle suspension system is decided by the sprung mass (mass of
the body and other component supported by the suspension). If the spring rate is very
high (excessively rigid springs) than required, then springs do not absorb shock and
vibration thereby all the vibrations are transmitted to the vehicle. If the spring rate is
TH-978_06610302
Chapter 7 Fatigue and Creep Performance
143
very low (excessively flexible springs) than required, then the springs deflect
drastically which contributes to the poor isolation of the vehicle from the road against
the vibrations. Hence for the good suspension system, appropriate spring rate is
required and to be retained during its service. Fatigue loading of leaf springs causes
material damage and reduces spring rate as the cycle progresses.
To enumerate the accumulated fatigue damage in the test leaf spring, relative spring
rate (ratio of instantaneous spring rate (K) to the initial spring rate (Ko)) was measured
and plotted as the performance index. The relative spring rate of test leaf springs at
finite number of cycles at various loads were obtained from the cyclic load deflection
curve. Figures 7.4 (a-b) show the relative spring rate of test leaf springs at three
different loading levels (0.8 Pmax 0.9 Pmax and Pmax). Orth et al. (1993) also utilized the
stiffness drop for carbon fiber reinforced spring retainer as a damage index under
dynamic loading condition. Casado et al. (2006) adopted similar methodology for the
performance investigation of railway fastening part made of short glass fiber
reinforced nylon and reported a continuous stiffness drop and as well as fracture. Leaf
spring fatigue failure is taken as spring rate drop/fracture as per SAE standard J 1528.
UFLS and SFLS exhibited failure by spring rate drop by 10 % whereas LFLS
exhibited fracture failure. Unlike, SFLS and UFLS, LFLS do not exhibit appreciable
spring rate drop initially but later significant drop in spring rate was observed, and
similar kind of transition was observed for all the chosen loads.
TH-978_06610302
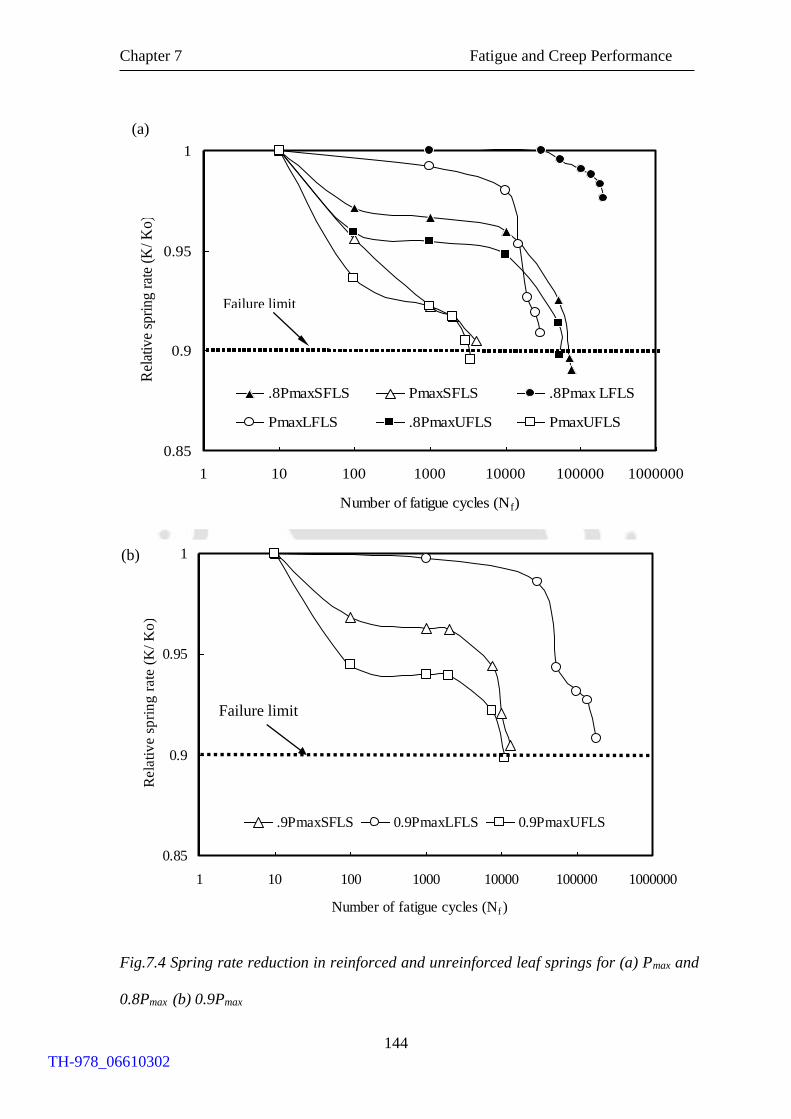
Chapter 7 Fatigue and Creep Performance
144
Fig.7.4 Spring rate reduction in reinforced and unreinforced leaf springs for (a) Pmax and
0.8Pmax (b) 0.9Pmax
0.85
0.9
0.95
1
1 10 100 1000 10000 100000 1000000
Number of fatigue cycles (Nf)
Rel
ativ
e sp
rin
g r
ate
(K/
Ko
).
.8PmaxSFLS PmaxSFLS .8Pmax LFLS
PmaxLFLS .8PmaxUFLS PmaxUFLS
Failure limit
(a)
0.85
0.9
0.95
1
1 10 100 1000 10000 100000 1000000
Number of fatigue cycles (Nf )
Rela
tiv
e s
pri
ng
rate
(K
/ K
o).
.9PmaxSFLS 0.9PmaxLFLS 0.9PmaxUFLS
Failure limit
(b)
TH-978_06610302
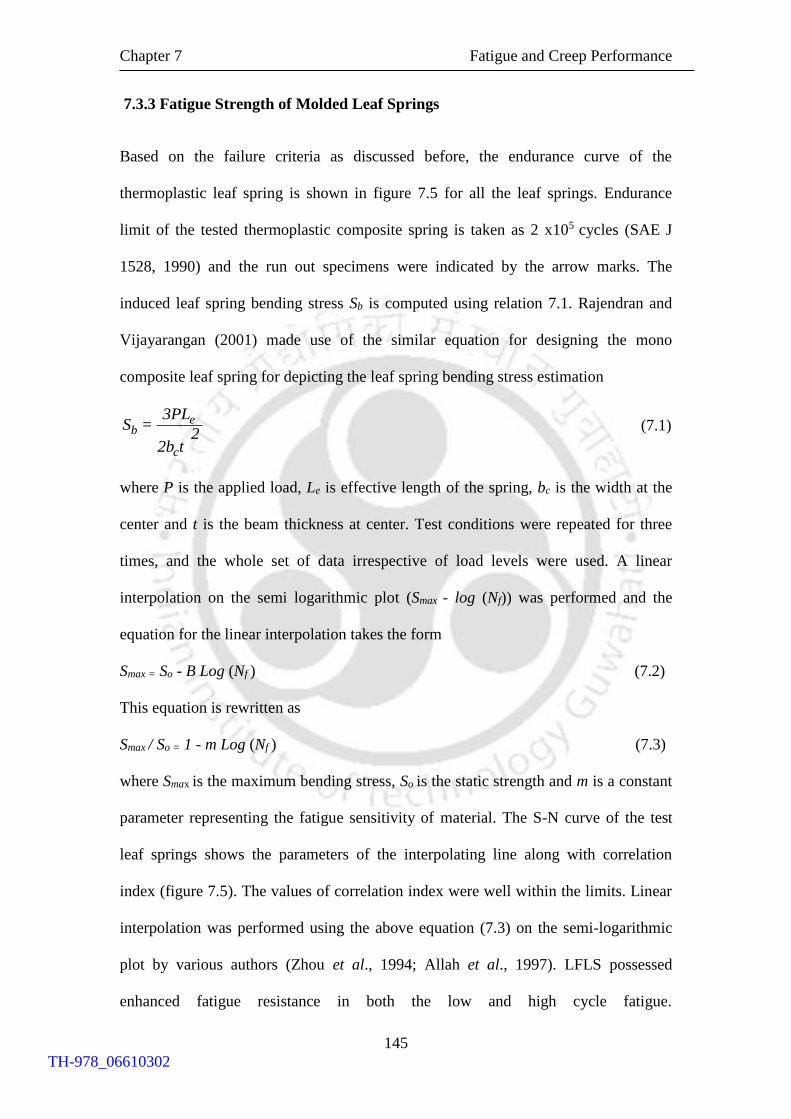
Chapter 7 Fatigue and Creep Performance
145
7.3.3 Fatigue Strength of Molded Leaf Springs
Based on the failure criteria as discussed before, the endurance curve of the
thermoplastic leaf spring is shown in figure 7.5 for all the leaf springs. Endurance
limit of the tested thermoplastic composite spring is taken as 2 x10⁵ cycles (SAE J
1528, 1990) and the run out specimens were indicated by the arrow marks. The
induced leaf spring bending stress Sb is computed using relation 7.1. Rajendran and
Vijayarangan (2001) made use of the similar equation for designing the mono
composite leaf spring for depicting the leaf spring bending stress estimation
eb
c
3PLS =
22b t
(7.1)
where P is the applied load, Le is effective length of the spring, bc is the width at the
center and t is the beam thickness at center. Test conditions were repeated for three
times, and the whole set of data irrespective of load levels were used. A linear
interpolation on the semi logarithmic plot (Smax - log (Nf)) was performed and the
equation for the linear interpolation takes the form
Smax = So - B Log (Nf ) (7.2)
This equation is rewritten as
Smax / So = 1 - m Log (Nf ) (7.3)
where Smax is the maximum bending stress, So is the static strength and m is a constant
parameter representing the fatigue sensitivity of material. The S-N curve of the test
leaf springs shows the parameters of the interpolating line along with correlation
index (figure 7.5). The values of correlation index were well within the limits. Linear
interpolation was performed using the above equation (7.3) on the semi-logarithmic
plot by various authors (Zhou et al., 1994; Allah et al., 1997). LFLS possessed
enhanced fatigue resistance in both the low and high cycle fatigue.
TH-978_06610302
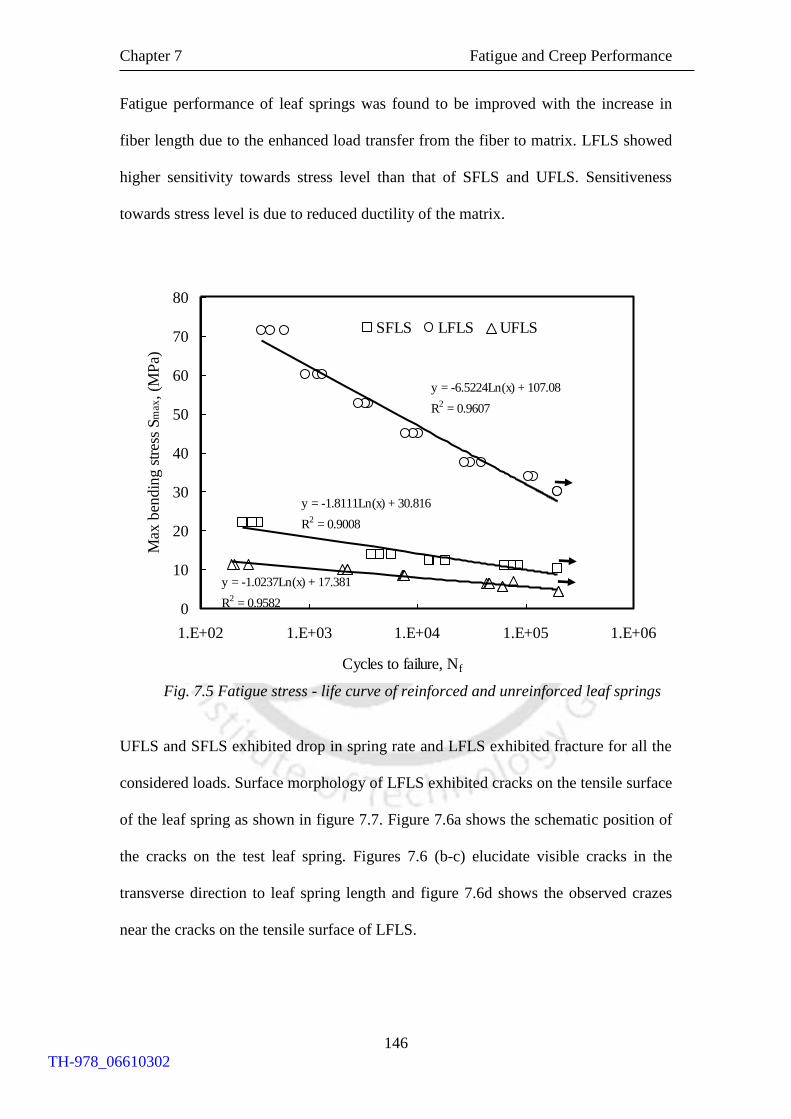
Chapter 7 Fatigue and Creep Performance
146
Fatigue performance of leaf springs was found to be improved with the increase in
fiber length due to the enhanced load transfer from the fiber to matrix. LFLS showed
higher sensitivity towards stress level than that of SFLS and UFLS. Sensitiveness
towards stress level is due to reduced ductility of the matrix.
Fig. 7.5 Fatigue stress - life curve of reinforced and unreinforced leaf springs
UFLS and SFLS exhibited drop in spring rate and LFLS exhibited fracture for all the
considered loads. Surface morphology of LFLS exhibited cracks on the tensile surface
of the leaf spring as shown in figure 7.7. Figure 7.6a shows the schematic position of
the cracks on the test leaf spring. Figures 7.6 (b-c) elucidate visible cracks in the
transverse direction to leaf spring length and figure 7.6d shows the observed crazes
near the cracks on the tensile surface of LFLS.
y = -6.5224Ln(x) + 107.08
R2 = 0.9607
y = -1.8111Ln(x) + 30.816
R2 = 0.9008
y = -1.0237Ln(x) + 17.381
R2 = 0.95820
10
20
30
40
50
60
70
80
1.E+02 1.E+03 1.E+04 1.E+05 1.E+06
Cycles to failure, Nf
Max
ben
din
g s
tres
s S
max
, (M
Pa)
SFLS LFLS UFLS
TH-978_06610302
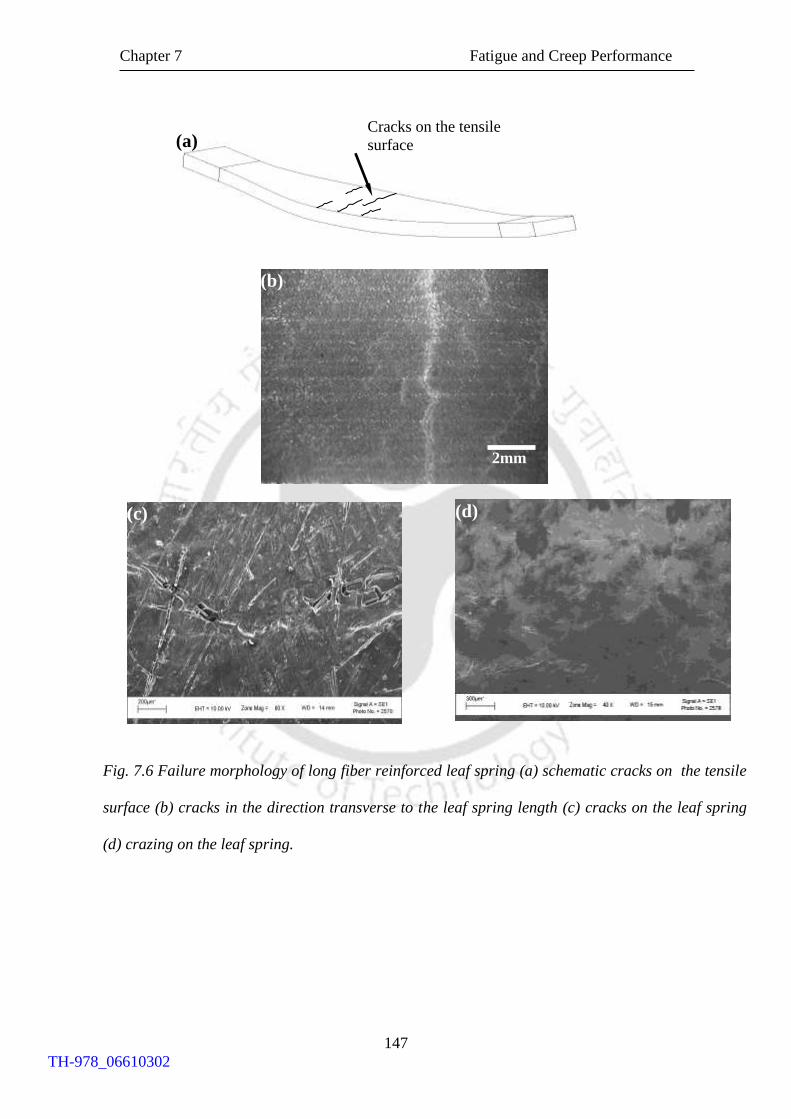
Chapter 7 Fatigue and Creep Performance
147
Fig. 7.6 Failure morphology of long fiber reinforced leaf spring (a) schematic cracks on the tensile
surface (b) cracks in the direction transverse to the leaf spring length (c) cracks on the leaf spring
(d) crazing on the leaf spring.
Cracks on the tensile
surface (a)
2mm
(b)
(c) (d)
TH-978_06610302
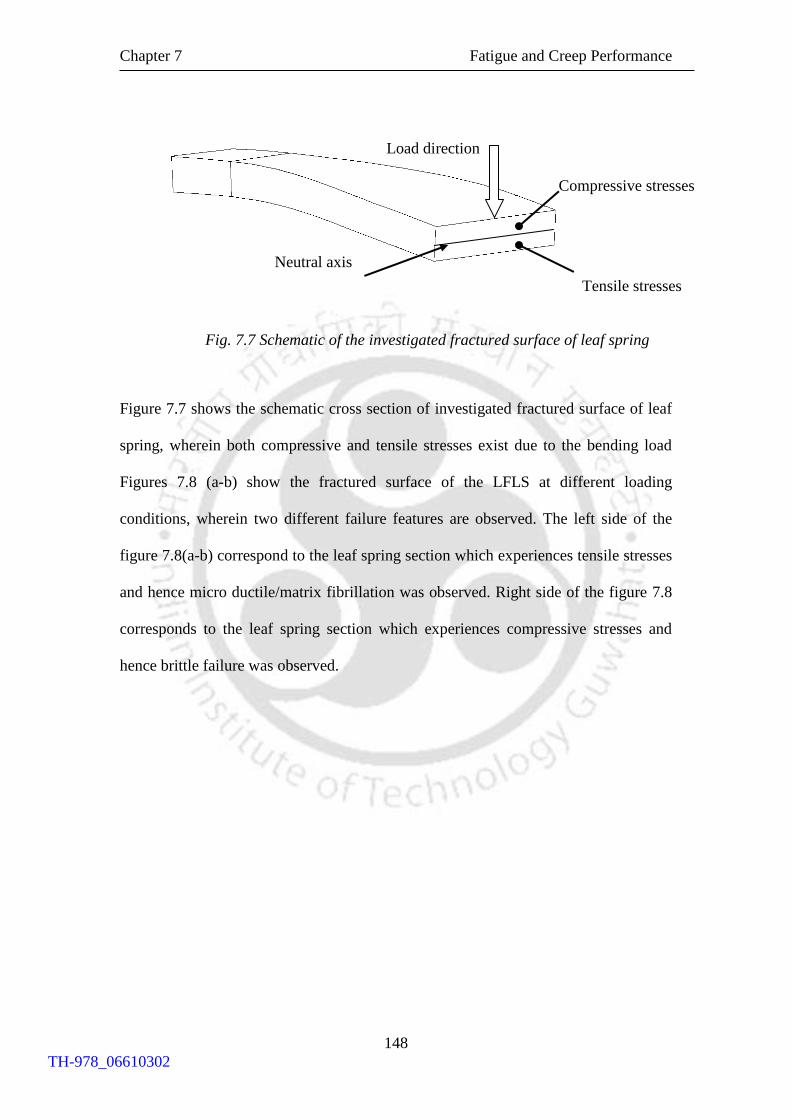
Chapter 7 Fatigue and Creep Performance
148
Fig. 7.7 Schematic of the investigated fractured surface of leaf spring
Figure 7.7 shows the schematic cross section of investigated fractured surface of leaf
spring, wherein both compressive and tensile stresses exist due to the bending load
Figures 7.8 (a-b) show the fractured surface of the LFLS at different loading
conditions, wherein two different failure features are observed. The left side of the
figure 7.8(a-b) correspond to the leaf spring section which experiences tensile stresses
and hence micro ductile/matrix fibrillation was observed. Right side of the figure 7.8
corresponds to the leaf spring section which experiences compressive stresses and
hence brittle failure was observed.
Tensile stresses
Load direction
Neutral axis
Compressive stresses
TH-978_06610302
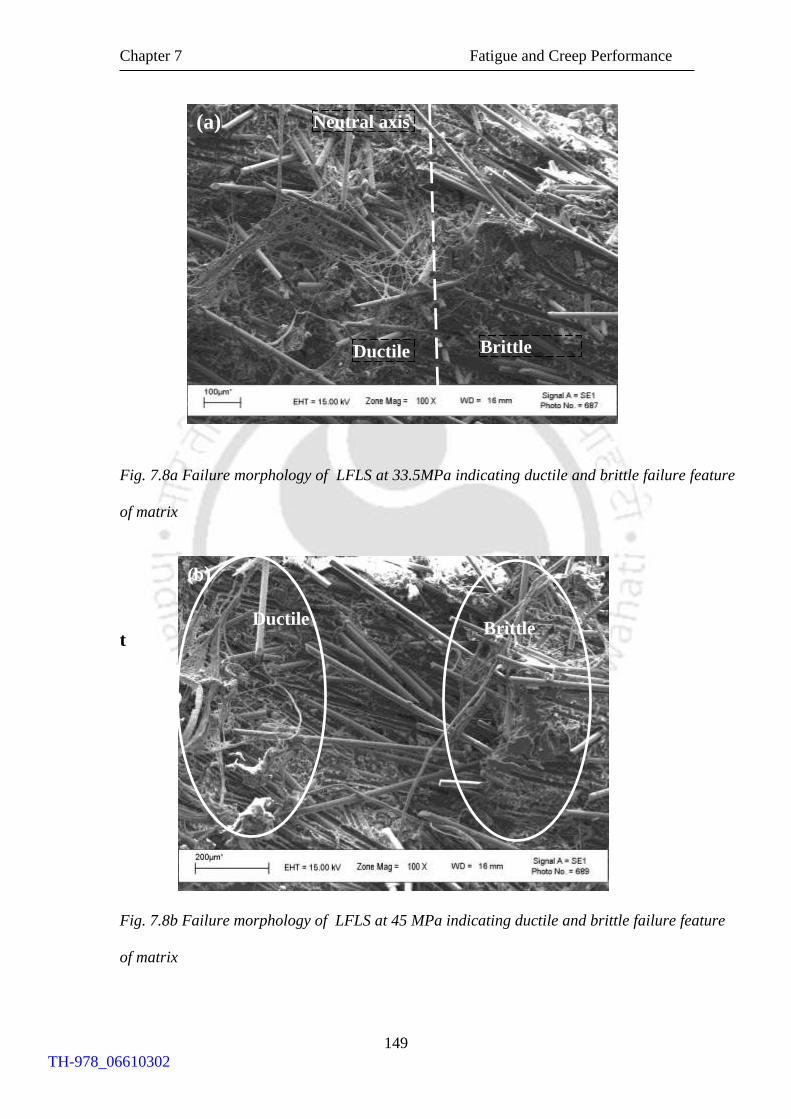
Chapter 7 Fatigue and Creep Performance
149
Fig. 7.8a Failure morphology of LFLS at 33.5MPa indicating ductile and brittle failure feature
of matrix
t
Fig. 7.8b Failure morphology of LFLS at 45 MPa indicating ductile and brittle failure feature
of matrix
Brittle Ductile
(b)
Neutral axis
Ductile Brittle
(a)
TH-978_06610302
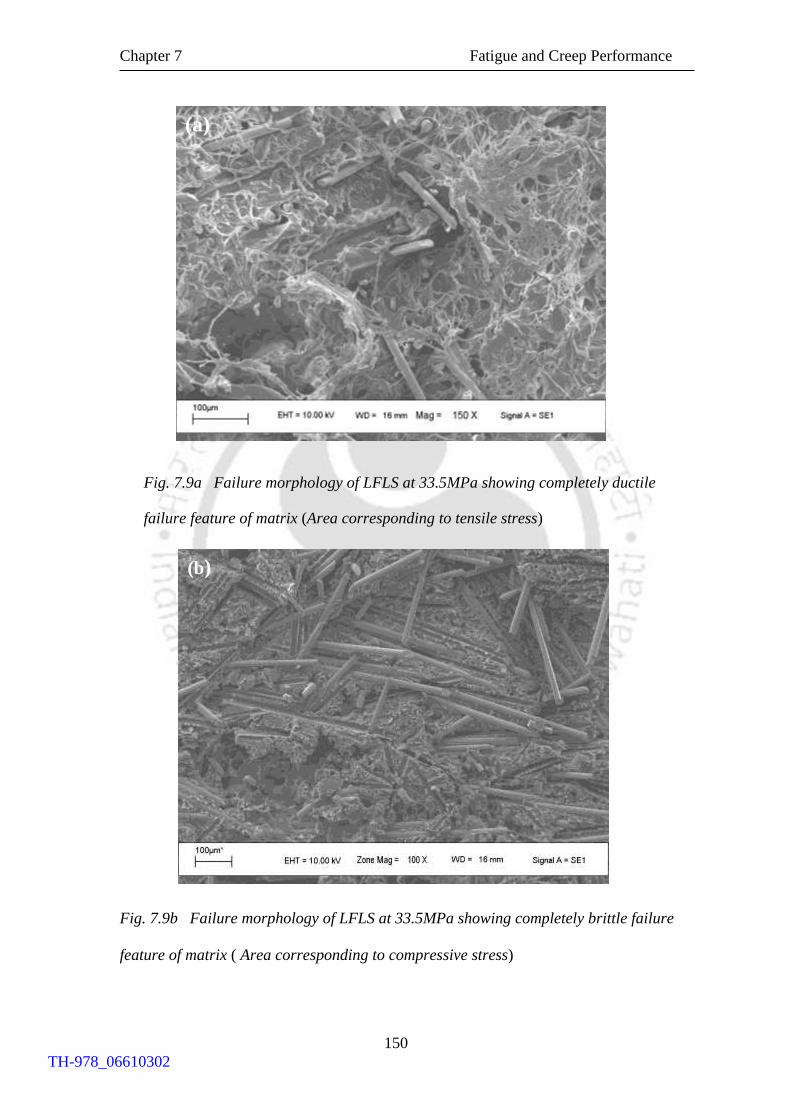
Chapter 7 Fatigue and Creep Performance
150
Fig. 7.9a Failure morphology of LFLS at 33.5MPa showing completely ductile
failure feature of matrix (Area corresponding to tensile stress)
Fig. 7.9b Failure morphology of LFLS at 33.5MPa showing completely brittle failure
feature of matrix ( Area corresponding to compressive stress)
(a)
(b)
TH-978_06610302

Chapter 7 Fatigue and Creep Performance
151
The above failure morphologies (figures 7.8(a-b)) correspond to the region near the
neutral axis as indicated in figure 7.7. Fractured surface of LFLS near the edge (i.e.
away from the neutral axis) was further examined, wherein either tensile or brittle
failure feature was observed. Figure 7.9a indicates the micro ductile failure feature
which corresponds to the tensile stress region of LFLS leaf spring. Figure 7.9b
indicates the brittle failure feature which corresponds to the compressive stress region
of LFLS leaf spring. Purslow (1988) investigated the flexural fractured surface of
carbon fiber reinforced polyetheretherketone laminates, where compression and
tensile failures were observed near the neutral axis. Jeng and Chen (2000) attempted
to investigate the flexural fractured surface on injection molded carbon fiber
polyetheretherketone near the neutral axis, however, significant difference was not
observed on the tensile and compressive side of the fractured surface.
Fatigue strength of discontinuous fiber reinforced part significantly depends
on the fiber orientation, which in turn depends mainly on the part shape and gate
position in the molding die. Gate position was kept in such a way that the majority of
the discontinuous fibers orient along the length of the leaf spring. Figure
7.10 shows the predicted fiber orientation using Mold Flow Plastics Insight®
for the
molded leaf spring where fibers were oriented along the leaf spring length, which is
preferred for load carrying application as load is acting normal to the fiber direction.
Figure 7.11 also confirmed that injection molding induced fiber alignment.
Investigation to understand failure morphology of LFLS also confirmed this behavior
(figures (7.8b,-7.9b)).
TH-978_06610302
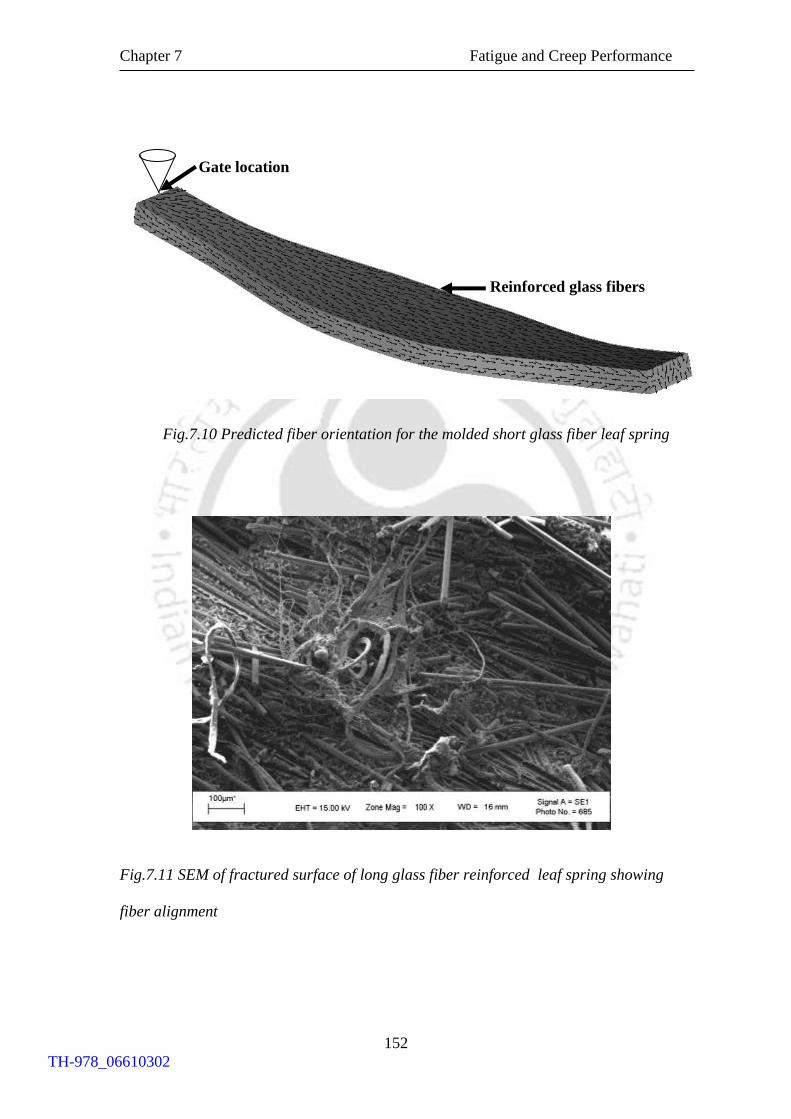
Chapter 7 Fatigue and Creep Performance
152
Fig.7.10 Predicted fiber orientation for the molded short glass fiber leaf spring
Fig.7.11 SEM of fractured surface of long glass fiber reinforced leaf spring showing
fiber alignment
Reinforced glass fibers
Gate location
TH-978_06610302

Chapter 7 Fatigue and Creep Performance
153
7.4 CREEP PERFORMANCE
The influence of fiber length on the short-term flexural creep performance of
thermoplastic composite leaf springs for various stress levels at room temperature
condition is discussed in this section. Though leaf spring application demands creep
performance evaluation in the range of 1000 h, present experimental work was limited
to 24 h and the usefulness of empirical model for the creep performance prediction of
molded leaf spring was explored. Since empirical model is used to predict the creep
performance of leaf spring, the theoretical background regarding these models is also
presented.
7.4.1 BACKGROUND ON CREEP MODELS
7.4.1.1 Findley’s Power Law Model
Mechanical behavior of polymeric material under constant stress was developed by
Findley and Khosla (1955). The general form of the power law equation was given as
' n
tε(t)= ε t (7.4)
where ε(t) is the time dependent strain ,'
tε is power law coefficient which is stress
and temperature dependent coefficient, n is the power law exponent and t is the time
after loading. Park and Balatinecz (1998) used the above equation 7.4 to investigate
the flexural creep behavior of wood fiber reinforced polypropylene composites.
Power law model is simple in approach and successfully predicted nonlinear
viscoelastic creep behavior of thermoplastic composites over large range of stress
(Liou et al., 1997; Hadid et al., 2002; Banik et al., 2008) besides this model is also
recommended by American Society of Civil Engineers (ASCE, 1986) for structural
TH-978_06610302
Chapter 7 Fatigue and Creep Performance
154
plastics design manual in the analysis of composite materials for long term structural
behavior.
7.4.1.2 HRZ Model
Findley’s power law was unsuccessful in accounting for the stress effect on the
mechanical behavior of polymeric material. The two power law parameters in the
Findley-Khosla model'
tε and n were significantly influenced by the applied stress
level. Karian (1999) carried out flexural creep test on polypropylene short fiber
composite and observed that creep strain was sensitive to stress level.
Hadid et al. (2002) modified the Findley’s power law to incorporate time and stress
dependence in the model where the power law coefficient (ε't) and power law
exponent (n) were plotted with respect to stress level (σ). The best fitting curve
proposed the relation between '
tε and σ as
b'
ε =a. σt (7.5)
Similarly, the best fitting curve proposed between n and σ value takes the form
n=c.exp e.σ (7.6)
Equations (7.5 and 7.6) were used in equation 7.4 and strain at any particular time (t)
can be calculated using the following HRZ equation
c.exp(e.σ)bε(t)= a.σ .t (7.7)
where a, b ,c and e are the curve fitting parameters obtained from the regression
analysis. Chevali et al. (2009) used the four parameter HRZ model to fit the
experimental data obtained from flexural creep investigation for nylon 6/6,
polypropylene and high-density polyethylene based long fiber thermoplastic
composites.
TH-978_06610302
Chapter 7 Fatigue and Creep Performance
155
7.4.2 CREEP PERFORMANCE EVALUATION METHODOLOGY
Creep performance test were carried out for 24 h for 0.8 Pmax and Pmax load levels. In
addition, 2 h creep tests were also conducted at 0.6, 1.2 and 1.4 times the Pmax. The
cross-head speed during loading of the leaf spring was adjusted in order to reach the
desired load level in a time of 5 s as suggested by ASTM D2990-95 standard (ASTM
D-2990, 2005). Constant load was maintained and leaf spring deflection (δ(t) ) was
continuously measured and recorded. Creep strain at instantaneous time ( )ε(t) was
computed using the relation 7.8 (ASTM D-2990, 2005).
6δ(t).tε (t) =
2Le
(7.8)
where, δ (t) is the deflection at instantaneous time, t is the thickness and Le the
effective leaf spring length. From the measured creep strain, creep compliance (J(t) in
MPa-1) was computed using the relation 7.9 (ASTM D-2990, 2005)
34b t δ(t)
cJ(t) =3
PLe
(7.9)
7.5 FLEXURAL CREEP PERFORMANCE OF THERMOPLASTIC
COMPOSITE LEAF SPRINGS
7.5.1 Experimental Creep Performance
In the service conditions, suspension leaf springs are subjected to constant stress as
the chassis weight is taken by the suspension system even the vehicle remains
stationary. Besides, leaf springs are also subjected to various stress levels due to the
TH-978_06610302
Chapter 7 Fatigue and Creep Performance
156
different prevailing payload conditions. Thus, creep response investigation of the
molded leaf spring under various stress levels is of practical importance.
Creep performance evaluation was carried out at various loading levels
corresponding to the value of Pmax. The induced leaf spring bending stress (Smax) was
computed using equation 7.1 for the tested load levels. The stress level corresponding
to Pmax for UFLS, SFLS and LFLS were 8.25, 14.25 and 37.75 MPa respectively. It is
to be noted that the stress value corresponding to Pmax is well below the yield stress
value of the leaf spring material (Saint Gobain/ Twintex, 2005). Figure 7.12 shows the
24 h creep response of the chosen test leaf springs. A raise in creep compliance was
observed with the time period for all the leaf springs. The time-compliance data at
100 s for Pmax reveals that the LFLS, SFLS and UFLS exhibited creep compliance of
4.0E-04, 8.0E-04 and 1.6E-03 MPa-1 respectively. Subsequent to the preliminary
rapid increase in creep compliance, the rate of creep compliance decreases. The
compliance at the end of 24 h test reveals that LFLS, SFLS and UFLS showed an
increase in creep compliance of 20.87, 51.62 and 65.20 % respectively. Three trials
were conducted for calculating creep compliance for all the molded leaf springs and
deviations for LFLS, SFLS and UFLS were found to be 3.5, 4.2 and 2.5 %
respectively. Improved creep resistance behavior of LFLS was due to the improved
load transfer from the matrix to the fibers and the matrix constriction to deformation.
Chevali et al. (2009) also observed a similar behavior with the increase in loading of
glass fiber reinforcement in the nylon composites. Since creep compliance increase
was associated with the spring rate reduction, quantification of spring rate is of
practical importance.
TH-978_06610302
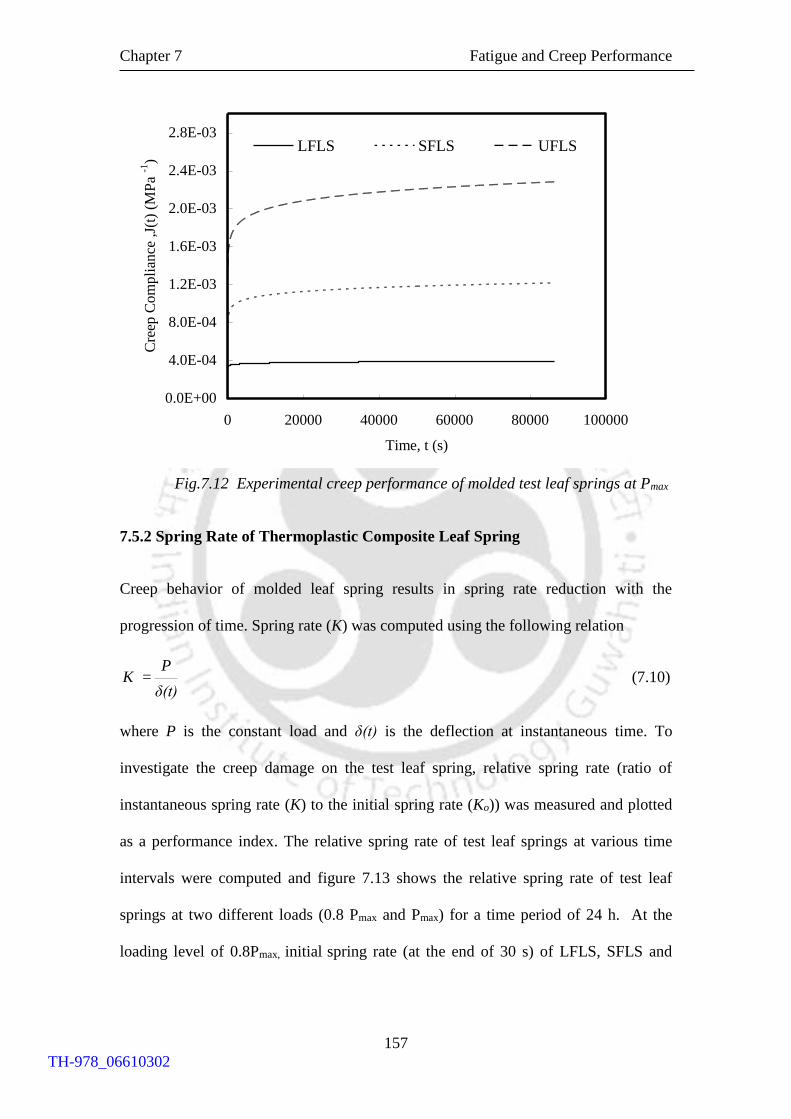
Chapter 7 Fatigue and Creep Performance
157
Fig.7.12 Experimental creep performance of molded test leaf springs at Pmax
7.5.2 Spring Rate of Thermoplastic Composite Leaf Spring
Creep behavior of molded leaf spring results in spring rate reduction with the
progression of time. Spring rate (K) was computed using the following relation
PK =
δ(t) (7.10)
where P is the constant load and δ(t) is the deflection at instantaneous time. To
investigate the creep damage on the test leaf spring, relative spring rate (ratio of
instantaneous spring rate (K) to the initial spring rate (Ko)) was measured and plotted
as a performance index. The relative spring rate of test leaf springs at various time
intervals were computed and figure 7.13 shows the relative spring rate of test leaf
springs at two different loads (0.8 Pmax and Pmax) for a time period of 24 h. At the
loading level of 0.8Pmax, initial spring rate (at the end of 30 s) of LFLS, SFLS and
0.0E+00
4.0E-04
8.0E-04
1.2E-03
1.6E-03
2.0E-03
2.4E-03
2.8E-03
0 20000 40000 60000 80000 100000
Time, t (s)
Cre
ep C
om
pli
ance
,J(
t) (
MP
a -1
)LFLS SFLS UFLS
TH-978_06610302
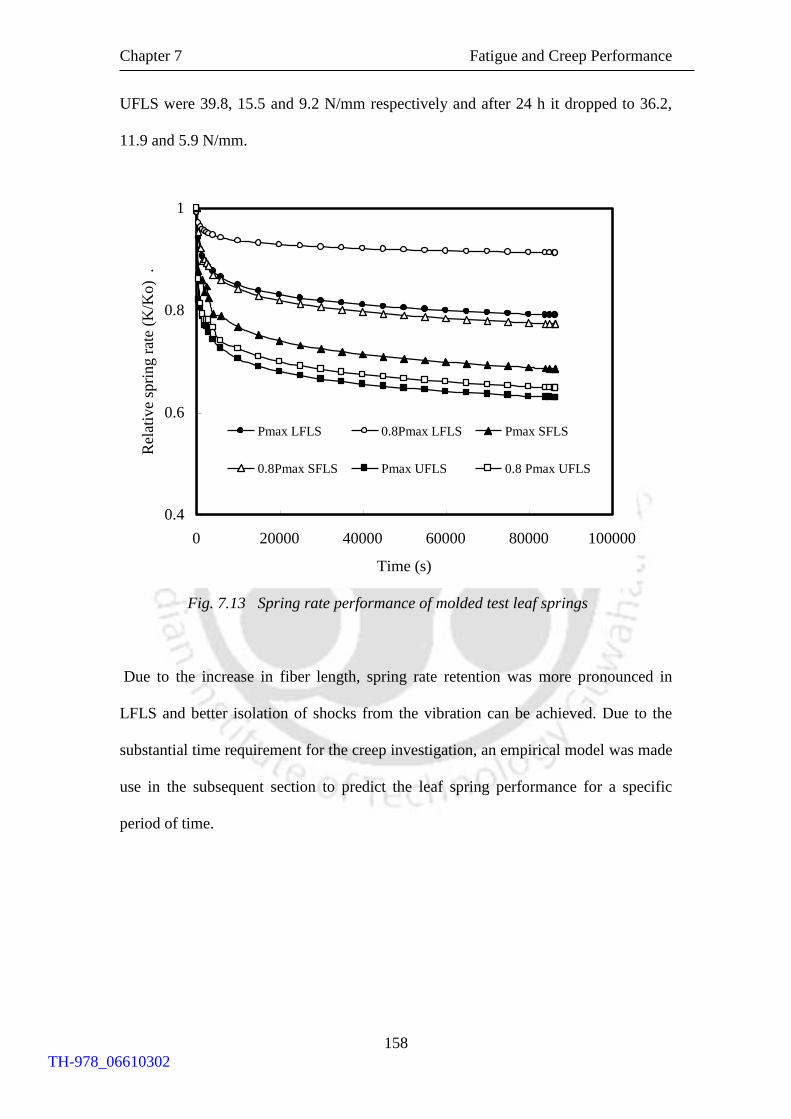
Chapter 7 Fatigue and Creep Performance
158
UFLS were 39.8, 15.5 and 9.2 N/mm respectively and after 24 h it dropped to 36.2,
11.9 and 5.9 N/mm.
Fig. 7.13 Spring rate performance of molded test leaf springs
Due to the increase in fiber length, spring rate retention was more pronounced in
LFLS and better isolation of shocks from the vibration can be achieved. Due to the
substantial time requirement for the creep investigation, an empirical model was made
use in the subsequent section to predict the leaf spring performance for a specific
period of time.
0.4
0.6
0.8
1
0 20000 40000 60000 80000 100000
Time (s)
Rel
ativ
e sp
rin
g r
ate
(K/K
o)
.
Pmax LFLS 0.8Pmax LFLS Pmax SFLS
0.8Pmax SFLS Pmax UFLS 0.8 Pmax UFLS
TH-978_06610302
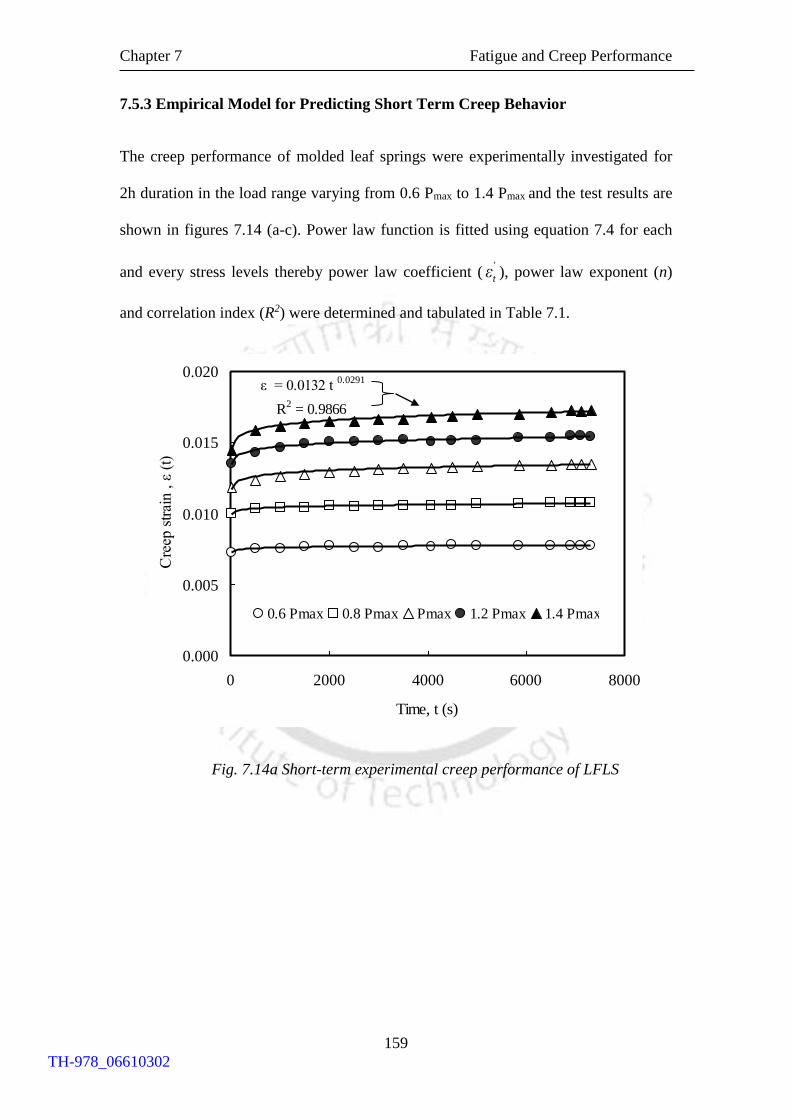
Chapter 7 Fatigue and Creep Performance
159
7.5.3 Empirical Model for Predicting Short Term Creep Behavior
The creep performance of molded leaf springs were experimentally investigated for
2h duration in the load range varying from 0.6 Pmax to 1.4 Pmax and the test results are
shown in figures 7.14 (a-c). Power law function is fitted using equation 7.4 for each
and every stress levels thereby power law coefficient ('
tε ), power law exponent (n)
and correlation index (R2) were determined and tabulated in Table 7.1.
Fig. 7.14a Short-term experimental creep performance of LFLS
ε = 0.0132 t 0.0291
R2 = 0.9866
0.000
0.005
0.010
0.015
0.020
0 2000 4000 6000 8000
Time, t (s)
Cre
ep s
trai
n , ε
(t)
0.6 Pmax 0.8 Pmax Pmax 1.2 Pmax 1.4 Pmax
TH-978_06610302

Chapter 7 Fatigue and Creep Performance
160
Fig. 7.14b Short-term experimental creep performance of SFLS
Fig. 7.14c Short-term experimental creep performance of UFLS
ε = 0.0121 t 0.0545
R2 = 0.9734
0
0.005
0.01
0.015
0.02
0.025
0 2000 4000 6000 8000
Time,t (s)
Cre
ep s
trai
n,
ε (t
)
0.6 Pmax 0.8 Pmax Pmax 1.2 Pmax 1.4 Pmax
ε = 0.0118 t 0.0727
R2 = 0.956
0.000
0.005
0.010
0.015
0.020
0.025
0 2000 4000 6000 8000
Time ,t (s)
Cre
ep s
trai
n,
ε (t
) .
0.6 Pmax 0.8 Pmax Pmax 1.2 Pmax 1.4 Pmax
TH-978_06610302
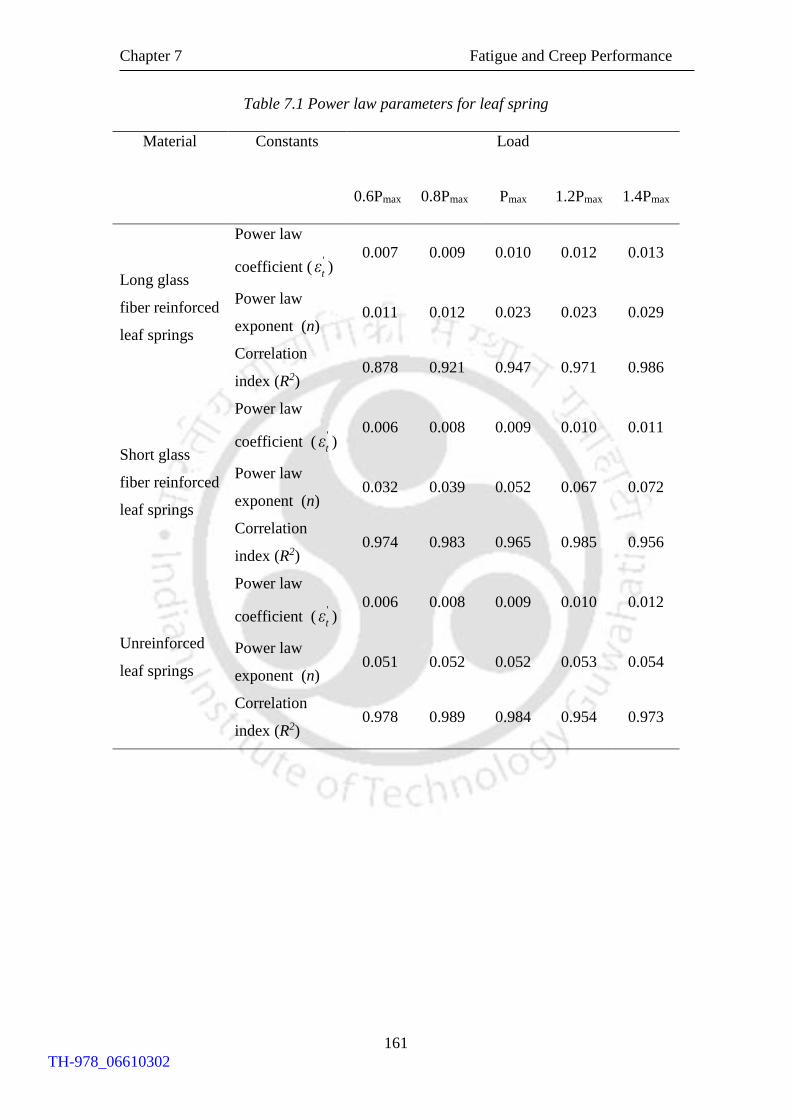
Chapter 7 Fatigue and Creep Performance
161
Table 7.1 Power law parameters for leaf spring
Material Constants Load
0.6Pmax 0.8Pmax Pmax 1.2Pmax 1.4Pmax
Long glass
fiber reinforced
leaf springs
Power law
coefficient ('
tε ) 0.007 0.009 0.010 0.012 0.013
Power law
exponent (n) 0.011 0.012 0.023 0.023 0.029
Correlation
index (R2) 0.878 0.921 0.947 0.971 0.986
Short glass
fiber reinforced
leaf springs
Power law
coefficient ('
tε ) 0.006 0.008 0.009 0.010 0.011
Power law
exponent (n) 0.032 0.039 0.052 0.067 0.072
Correlation
index (R2) 0.974 0.983 0.965 0.985 0.956
Unreinforced
leaf springs
Power law
coefficient ('
tε ) 0.006 0.008 0.009 0.010 0.012
Power law
exponent (n) 0.051 0.052 0.052 0.053 0.054
Correlation
index (R2) 0.978 0.989 0.984 0.954 0.973
TH-978_06610302
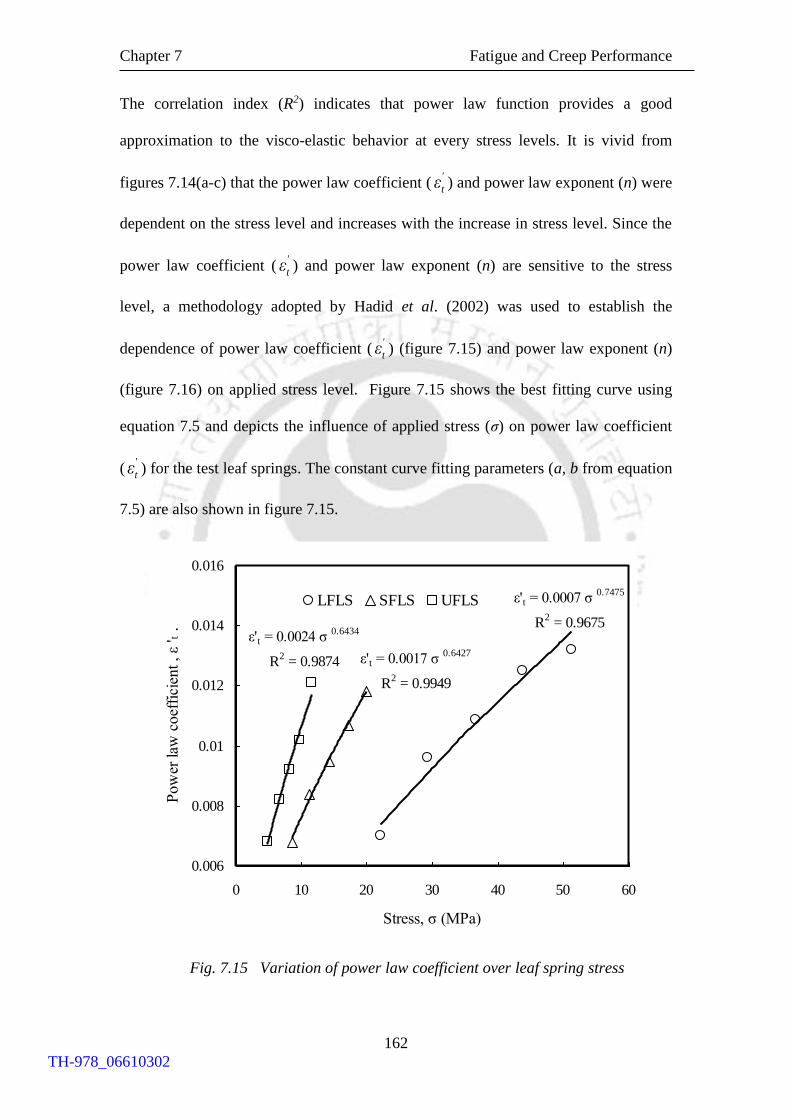
Chapter 7 Fatigue and Creep Performance
162
The correlation index (R2) indicates that power law function provides a good
approximation to the visco-elastic behavior at every stress levels. It is vivid from
figures 7.14(a-c) that the power law coefficient ('
tε ) and power law exponent (n) were
dependent on the stress level and increases with the increase in stress level. Since the
power law coefficient ('
tε ) and power law exponent (n) are sensitive to the stress
level, a methodology adopted by Hadid et al. (2002) was used to establish the
dependence of power law coefficient ('
tε ) (figure 7.15) and power law exponent (n)
(figure 7.16) on applied stress level. Figure 7.15 shows the best fitting curve using
equation 7.5 and depicts the influence of applied stress (σ) on power law coefficient
('
tε ) for the test leaf springs. The constant curve fitting parameters (a, b from equation
7.5) are also shown in figure 7.15.
Fig. 7.15 Variation of power law coefficient over leaf spring stress
ε't = 0.0007 σ 0.7475
R2 = 0.9675
ε't = 0.0017 σ 0.6427
R2 = 0.9949
ε't = 0.0024 σ 0.6434
R2 = 0.9874
0.006
0.008
0.01
0.012
0.014
0.016
0 10 20 30 40 50 60
Stress, σ (MPa)
Pow
er law
coef
fici
ent , ε
' t .
LFLS SFLS UFLS
TH-978_06610302
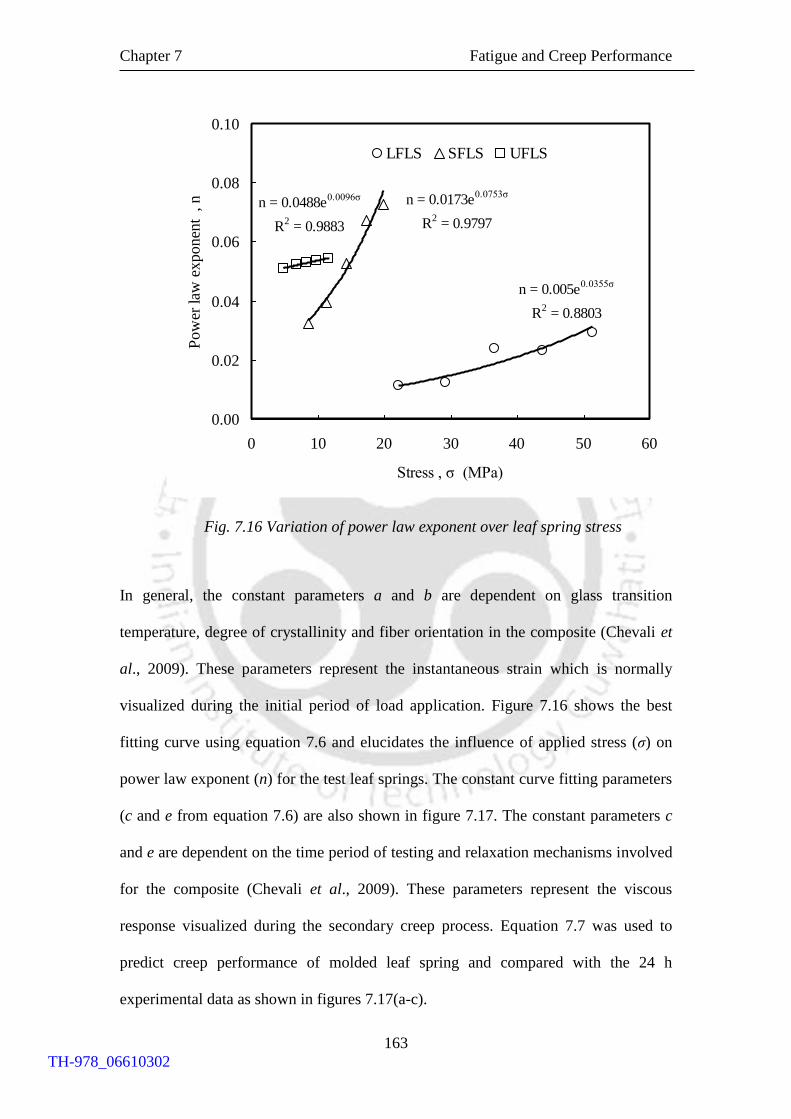
Chapter 7 Fatigue and Creep Performance
163
Fig. 7.16 Variation of power law exponent over leaf spring stress
In general, the constant parameters a and b are dependent on glass transition
temperature, degree of crystallinity and fiber orientation in the composite (Chevali et
al., 2009). These parameters represent the instantaneous strain which is normally
visualized during the initial period of load application. Figure 7.16 shows the best
fitting curve using equation 7.6 and elucidates the influence of applied stress (σ) on
power law exponent (n) for the test leaf springs. The constant curve fitting parameters
(c and e from equation 7.6) are also shown in figure 7.17. The constant parameters c
and e are dependent on the time period of testing and relaxation mechanisms involved
for the composite (Chevali et al., 2009). These parameters represent the viscous
response visualized during the secondary creep process. Equation 7.7 was used to
predict creep performance of molded leaf spring and compared with the 24 h
experimental data as shown in figures 7.17(a-c).
n = 0.005e0.0355σ
R2 = 0.8803
n = 0.0173e0.0753σ
R2 = 0.9797
n = 0.0488e0.0096σ
R2 = 0.9883
0.00
0.02
0.04
0.06
0.08
0.10
0 10 20 30 40 50 60
Stress , σ (MPa)
Pow
er law
exponen
t , n
.
LFLS SFLS UFLS
TH-978_06610302

Chapter 7 Fatigue and Creep Performance
164
Fig. 7.17a Experimental and predicted creep performance of LFLS
Fig. 7.17b Experimental and predicted creep performance of SFLS
0.000
0.005
0.010
0.015
0.020
0 20000 40000 60000 80000 100000
Time,t (s)
Cre
ep s
trai
n ,
ε (
t)
SFLS experimental strain SFLS predicted strain
Pmax
0.8 Pmax
0.000
0.005
0.010
0.015
0 20000 40000 60000 80000 100000
Time, t (s)
Cre
ep s
trai
n, ε(
t)
LFLS experimental strain LFLS predicted strain
Pmax
0.8Pmax
TH-978_06610302

Chapter 7 Fatigue and Creep Performance
165
The deviation between the predicted creep strain and experimental creep are shown in
Table 7.2. It is found that HRZ model predicted well with the experimental creep
performance of the chosen thermoplastic composite leaf springs. Furthermore it was
observed that at a loading level of 0.8 Pmax, the error between experimental and
predicted creep strain was less than loading level at Pmax. Similar observations were
visualized by Hadid et al. (2002) where the error between experimental and predicted
values was high at higher stresses.
Fig. 7.17c Experimental and predicted creep performance of UFLS
0
0.005
0.01
0.015
0.02
0 20000 40000 60000 80000 100000
Time, t (s)
Cre
ep
Str
ain
, ε(
t)
UFLS experimental strain UFLS predicted strain
Pmax
0.8Pmax
TH-978_06610302

Chapter 7 Fatigue and Creep Performance
166
Table 7.2 Comparison of HRZ model predicted strain and experimental strain
Material Loading
level
Experimental
Creep strain
HRZ predicted
Creep strain
Long glass fiber
reinforced leaf
springs
Pmax 0.0141 0.0123
0.8 Pmax 0.0112 0.0102
Short glass fiber
reinforced leaf
springs
Pmax 0.0171 0.0168
0.8 Pmax 0.0136 0.0131
Unreinforced
leaf springs
Pmax 0.0188 0.0170
0.8 Pmax 0.0148 0.0145
7.5.4 Influence of Material Crystallinity on Power Law Coefficient
Prior investigation with HRZ model for predicting the creep behavior of thermoplastic
materials was limited (Hadid et al., 2002; Chevali et al., 2009). Hadid et al. (2002)
have not attempted to correlate parameters with any of the material behavior.
Chevali et al. (2009) reported that the power law coefficient depends on material
characteristics which include degree of crystallinity, glass transition temperature and
fiber orientation, however, no specific correlations with any behavior was attempted.
In the present investigation, the evaluated power law coefficient ('
tε ) of UFLS,
SFLS and LFLS corresponding to 11.55, 19.95 and 22.05 MPa stress were 0.012,
0.011 and 0.007 respectively (Table 7.1). The crystallite size of investigated leaf
spring materials; unreinforced, short glass fiber reinforced and long glass fiber
reinforced polypropylene were 100.330, 118.615 and 146.784 Å respectively.
Detailed methodology and mechanisms were reported in Chapter 4 (Section 4.3.3).
TH-978_06610302
Chapter 7 Fatigue and Creep Performance
167
From the crystallite size and power law coefficient, it was confirmed that increase in
crystallinity reduced the power law coefficient.
To confirm this correlation further, experimental creep data of Banik et al.
(2008) was also considered. Banik et al. (2008) experimentally evaluated the creep
performance of unidirectional polypropylene composites and crossply laminates at
various loads and temperatures and compared with an empirical model. In the present
investigation, experimental creep response of Banik et al. (2008) was extracted and
analyzed using data capturing software Windig 2.5, where the creep test was
conducted at 30 C for an applied stress of 10 MPa. The extracted creep data results
were found to be fit with the power law function. The evaluated power law coefficient
of crossply laminates and unidirectional composites were found to be 0.1831 and
0.0729 respectively. Banik et.al (2008) measured and reported the crystallinity of
crossply laminates and unidirectional composites as 49.5 and 51.0 % respectively.
Thus, it was confirmed that increase in material crystallinity reduced the power law
coefficient.
7.6 SUMMARY
This chapter discussed the fatigue and short-term flexural creep performance of the
mono composite leaf spring.
Fatigue performance of injection molded thermoplastic composite leaf springs
under pulsating compression mode was investigated at various alternating loading
levels, wherein performance of leaf spring was found to be improved with the
fiber length.
Increase in deflection and relative spring rate were continuously measured and
used as a damage index. Reduction in spring rate was dependent on the applied
TH-978_06610302
Chapter 7 Fatigue and Creep Performance
168
stress level for all the leaf springs, and found to be reduced with the increase in
fiber length.
Short fiber reinforced and unreinforced polypropylene leaf springs exhibited 10 %
drop in spring rate, whereas long glass fiber reinforced polypropylene leaf spring
exhibited fracture failure at tensile surface.
Creep performance of the molded leaf springs were experimentally evaluated for
2 h and short term creep performance (24 h) was predicted with the aid of HRZ
model over wide range of stress. The predicted performance was compared with
24 h experimental results and found to be satisfactory. HRZ model parameters
were also utilized to correlate investigated leaf spring material characteristics.
TH-978_06610302

Chapter 8 Joint Performance
169
CHAPTER 8
JOINT PERFORMANCE OF THERMOPLASTIC LEAF SPRINGS
8.1 INTRODUCTION
Suspension leaf springs ends are connected to the vehicle chassis and this joint
strength must be higher than that of designed leaf spring (Yu and Kim, 1998). Bolted
and adhesively bonded joints are commonly utilized for joining the composite
structures. Bolted joints are found to be more useful than adhesive bonded joints, due
to the superior load transfer, less sensitive to the surface condition and easy to repair
(Camanho and Matthews, 1997). Stress concentration plays a significant role in the
performance characteristics of the bolted joint strength (Shokrieh and Rezaei, 2003).
Tension, shear, bearing, cleavage and pull-through failure modes are the most
commonly observed failure modes observed in the bolted joints performance
(Thoppul et al., 2009). Static and dynamic performances of the composite pinned
joints are exceedingly influenced by the joint geometry, environment and testing
conditions (Stockdale and Matthews, 1976; Crews, 1981; Lim, 2006; Aktas, 2009).
Bearing response of the joint is affected due to the clearance between fastener and
hole (McCarthy et al., 2005). Unlike the static mode of failure, fatigue damage should
address the progression of damage. Joint damage due to the fatigue can be
investigated by measuring the hole elongation with the aid of hysteresis loop (Crews,
1981; Chen, 2001). Composite constituent properties significantly alter the bearing
strength performance (Pinnell, 1996).
TH-978_06610302
Chapter 8 Joint Performance
170
This chapter presented the parametric investigation of leaf spring joint using finite
element analysis. Experimental static and fatigue performance of the chosen
composite leaf spring joints were reported in this chapter. Failure morphology of the
leaf spring joints was also presented in this chapter to understand the influence of
fiber length towards joint performance.
8.2 DESIGN OF JOINT CONFIGURATION
8.2.1 Joint Geometry and Design Methodology
Figure 8.1a shows the detailed geometry of injection molded leaf spring. Flat end
portion of the molded leaf spring was considered for the joint strength evaluation.
Sectioned geometry from the molded leaf spring is shown in figure 8.1b. Two parallel
pin joint with lateral support was chosen for leaf spring application. Based on the bolt
design, hole diameter of the joint was chosen as 4 mm. Total length of the plate (L+E)
was taken as 30 mm due to the available flat portion of the leaf spring geometry
without any curvature as shown in figure 8.1a. Length and width of the chosen
specimen are represented as (L+E) and W respectively. Distance between two holes
and the distance from the edge are M and K respectively. E is the distance from the
free edge to the centre of the hole. Parametric joint strength evaluation was carried out
using FEA tool, AnsysR10 and the solution was obtained by varying the value of
E from 4 to 7 mm and M from 6 to 18 mm for a fixed width of 25 mm inorder to
achieve high bearing strength.
TH-978_06610302
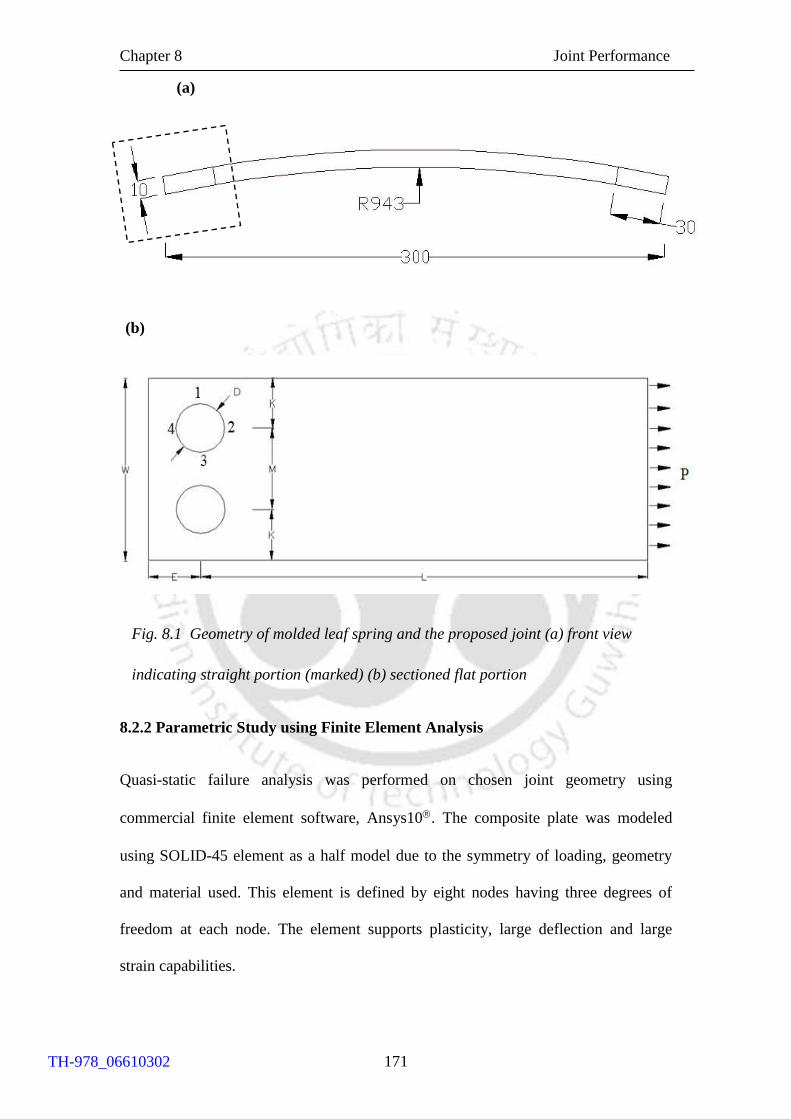
Chapter 8 Joint Performance
171
Fig. 8.1 Geometry of molded leaf spring and the proposed joint (a) front view
indicating straight portion (marked) (b) sectioned flat portion
8.2.2 Parametric Study using Finite Element Analysis
Quasi-static failure analysis was performed on chosen joint geometry using
commercial finite element software, Ansys10. The composite plate was modeled
using SOLID-45 element as a half model due to the symmetry of loading, geometry
and material used. This element is defined by eight nodes having three degrees of
freedom at each node. The element supports plasticity, large deflection and large
strain capabilities.
(b)
(a)
TH-978_06610302
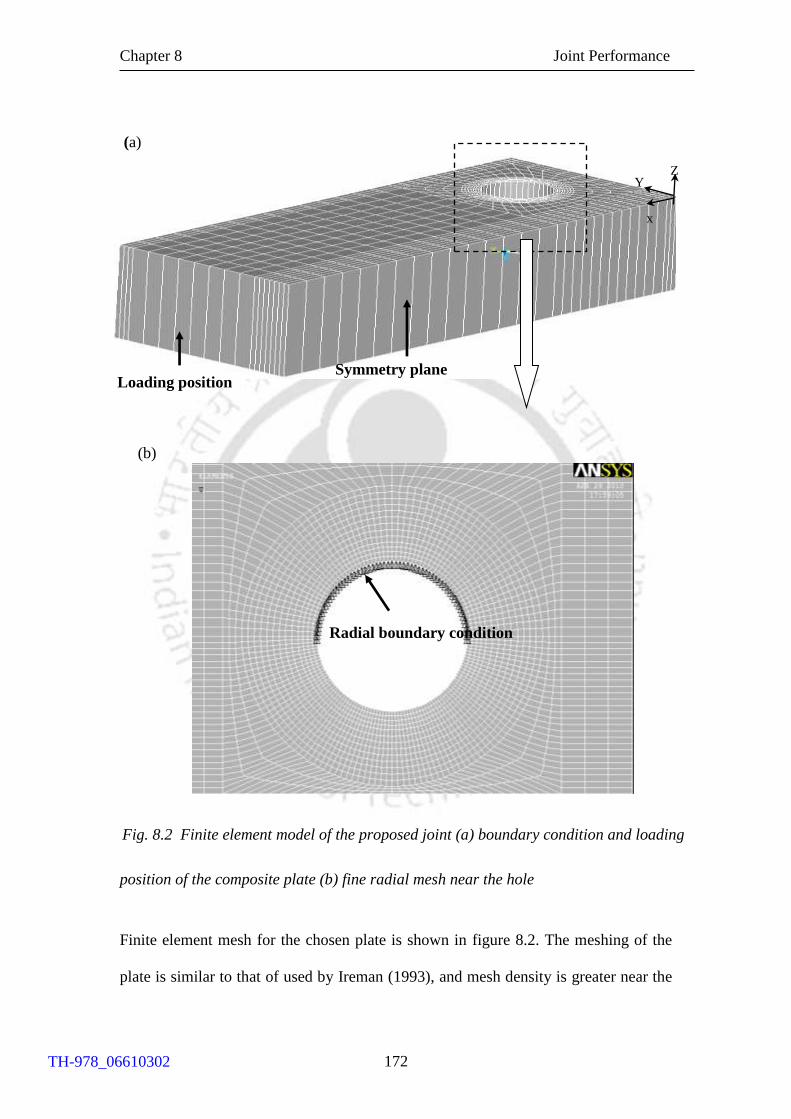
Chapter 8 Joint Performance
172
Fig. 8.2 Finite element model of the proposed joint (a) boundary condition and loading
position of the composite plate (b) fine radial mesh near the hole
Finite element mesh for the chosen plate is shown in figure 8.2. The meshing of the
plate is similar to that of used by Ireman (1993), and mesh density is greater near the
Loading position Symmetry plane
(a)
x
Y Z
(b)
Radial boundary condition
TH-978_06610302
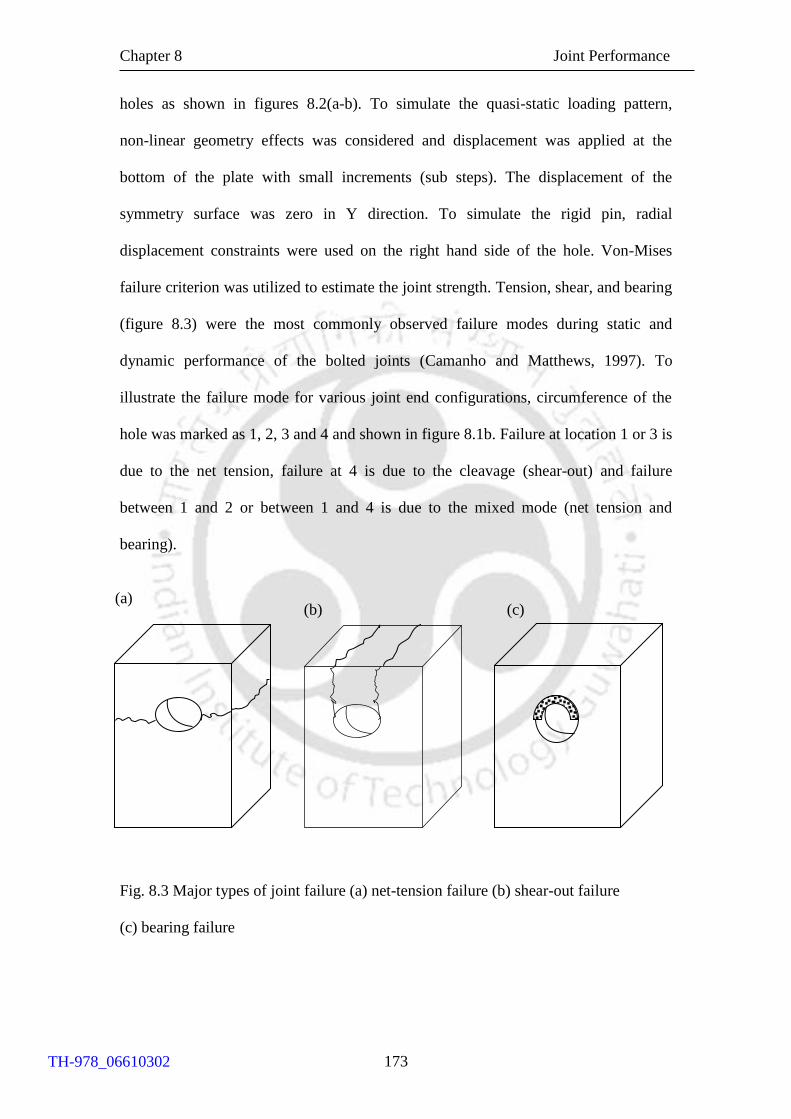
Chapter 8 Joint Performance
173
holes as shown in figures 8.2(a-b). To simulate the quasi-static loading pattern,
non-linear geometry effects was considered and displacement was applied at the
bottom of the plate with small increments (sub steps). The displacement of the
symmetry surface was zero in Y direction. To simulate the rigid pin, radial
displacement constraints were used on the right hand side of the hole. Von-Mises
failure criterion was utilized to estimate the joint strength. Tension, shear, and bearing
(figure 8.3) were the most commonly observed failure modes during static and
dynamic performance of the bolted joints (Camanho and Matthews, 1997). To
illustrate the failure mode for various joint end configurations, circumference of the
hole was marked as 1, 2, 3 and 4 and shown in figure 8.1b. Failure at location 1 or 3 is
due to the net tension, failure at 4 is due to the cleavage (shear-out) and failure
between 1 and 2 or between 1 and 4 is due to the mixed mode (net tension and
bearing).
Fig. 8.3 Major types of joint failure (a) net-tension failure (b) shear-out failure
(c) bearing failure
(a)
(b) (c)
TH-978_06610302

Chapter 8 Joint Performance
174
Fig. 8.4 Influence of design parameter over bearing strength and failure modes
50
54
58
62
66
70
3 4 5 6 7 8
Distance from the free edge (mm)
Bea
rin
g s
tren
gth
(M
Pa)
.
M= 6 mm M=10 mm
M= 14 mm M= 18 mm
C
C
C
C
NT-1 NT-1
NT-1
NT-1
NT-1
NT-1
NT-1 NT-1
NT-1
NT-3
NT-3 NT-3
TH-978_06610302

Chapter 8 Joint Performance
175
Figure 8.4 shows the influence of bearing strength on hole position from the free edge
(E) and distance between hole center (M). Failure mode was also marked for the
entire joint configurations. C represents cleavage (shear-out), NT-1 represents net
tension at site 1 and NT-3 represents net tension at site 3. It was observed from the
numerical analysis, joint strength was found to be inferior at E = 4 mm and M = 6 mm
and superior at E = 7 mm and M = 10 mm. Maximum bearing strength of 63.7 MPa
was obtained for this configuration.
For a constant value of width (W), the load carrying capacity of the joint
increases with the increase in free edge distance to the centre of the hole (E). With
the increase in hole position from free edge (E), change in failure mode from cleavage
(figure 8.5a) at point 4 to net tension at 1 was observed (figure 8.5b). The bearing
strength variation for M =10 mm and 14 mm was very less. In both the configurations
the maximum stress occurred at same site 1. For M = 6 mm, the failure site is at 3 and
net tension failure between the holes is observed resulting in reduced bearing load.
For M = 18 mm, maximum stress occurred at point 1 similar to that of M = 10 and
M = 14 mm. Since the edge of the plate was closer to the hole, the bearing strength
was less for M = 18 mm. FEA results suggest that superior joint strength can be
achieved at E = 7 mm and M = 10 mm, however due to the experimental constraint in
gripping the free end (to avoid slipping of the pin from the lower gripper), end
distance corresponding to E = 5mm was chosen for the experimental investigation.
Thus, joint with E = 5 mm and M = 10 mm was chosen for the experimental
evaluation.
TH-978_06610302
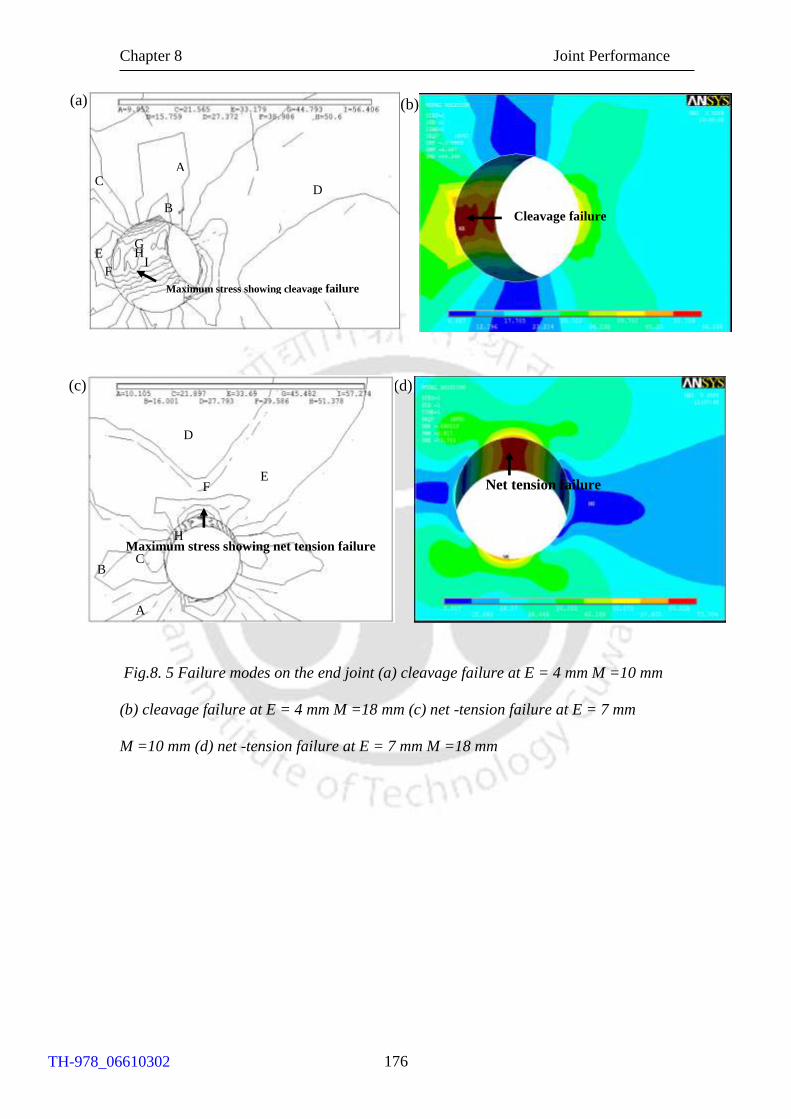
Chapter 8 Joint Performance
176
Fig.8. 5 Failure modes on the end joint (a) cleavage failure at E = 4 mm M =10 mm
(b) cleavage failure at E = 4 mm M =18 mm (c) net -tension failure at E = 7 mm
M =10 mm (d) net -tension failure at E = 7 mm M =18 mm
(d)
Net tension failure
(b) (a)
A
I H G
F
E
B
C D
A
Maximum stress showing cleavage failure
Cleavage failure
(c)
H
F E
D
C B
A
Maximum stress showing net tension failure
TH-978_06610302
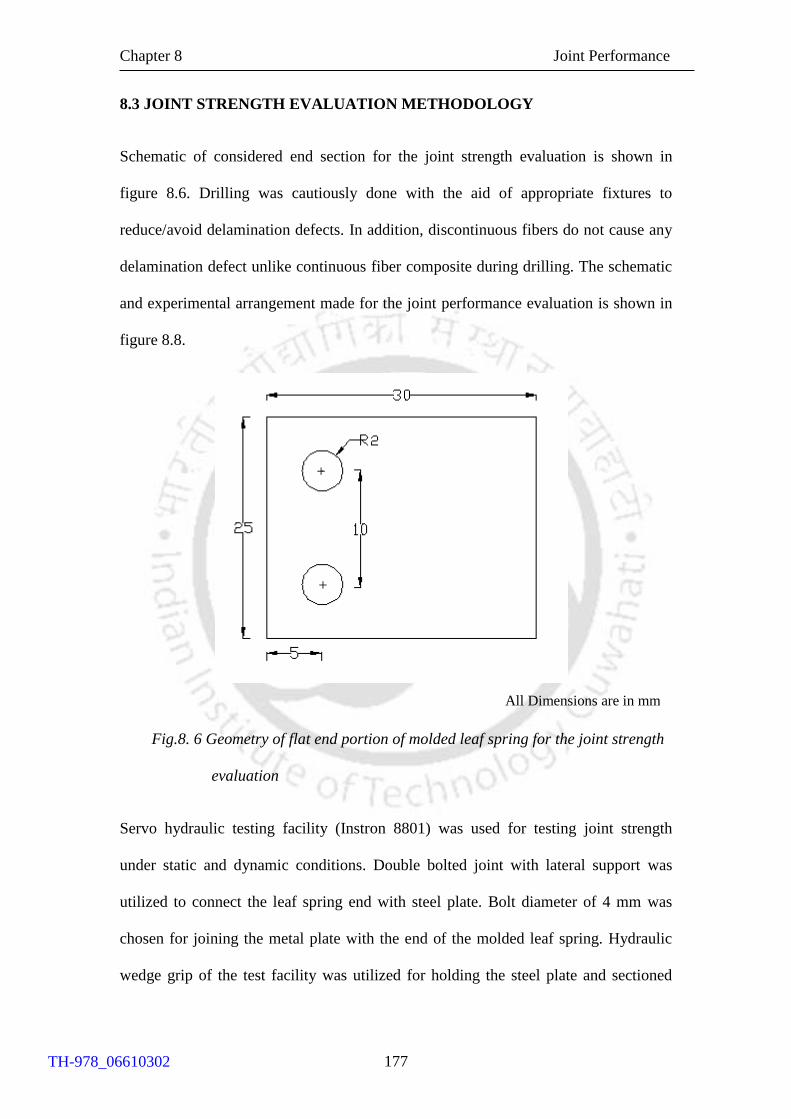
Chapter 8 Joint Performance
177
8.3 JOINT STRENGTH EVALUATION METHODOLOGY
Schematic of considered end section for the joint strength evaluation is shown in
figure 8.6. Drilling was cautiously done with the aid of appropriate fixtures to
reduce/avoid delamination defects. In addition, discontinuous fibers do not cause any
delamination defect unlike continuous fiber composite during drilling. The schematic
and experimental arrangement made for the joint performance evaluation is shown in
figure 8.8.
Fig.8. 6 Geometry of flat end portion of molded leaf spring for the joint strength
evaluation
Servo hydraulic testing facility (Instron 8801) was used for testing joint strength
under static and dynamic conditions. Double bolted joint with lateral support was
utilized to connect the leaf spring end with steel plate. Bolt diameter of 4 mm was
chosen for joining the metal plate with the end of the molded leaf spring. Hydraulic
wedge grip of the test facility was utilized for holding the steel plate and sectioned
All Dimensions are in mm
+
+
TH-978_06610302
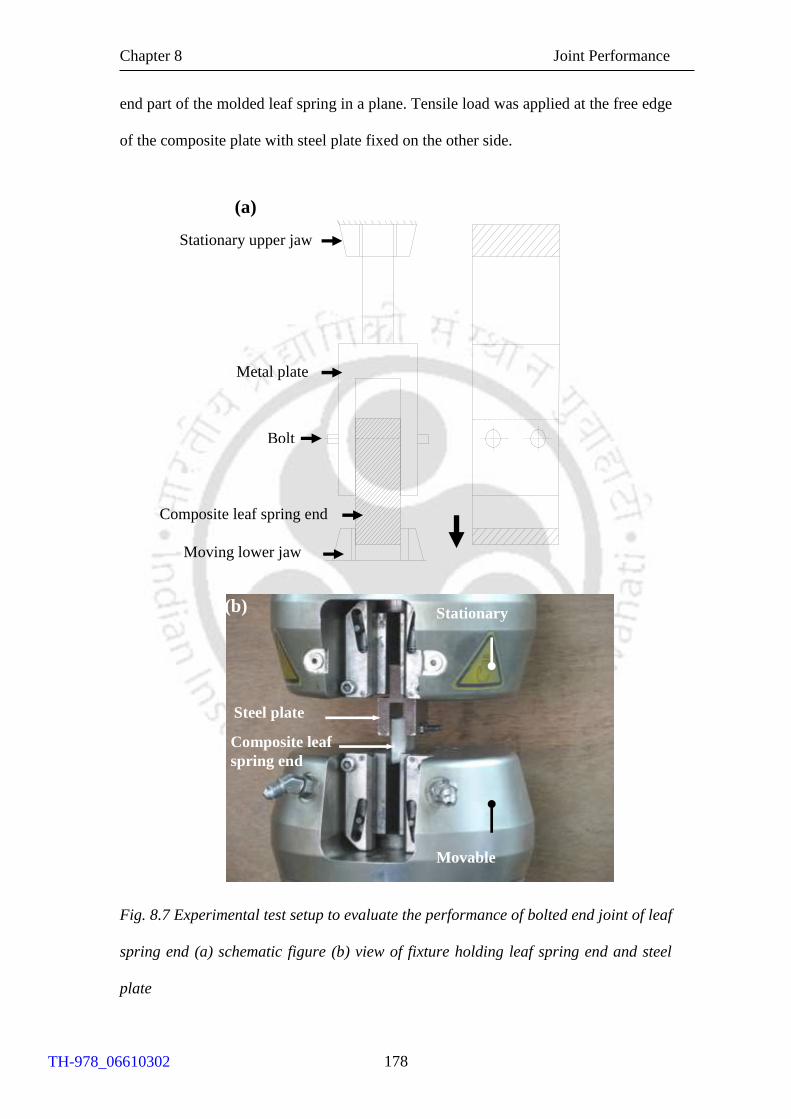
Chapter 8 Joint Performance
178
end part of the molded leaf spring in a plane. Tensile load was applied at the free edge
of the composite plate with steel plate fixed on the other side.
Fig. 8.7 Experimental test setup to evaluate the performance of bolted end joint of leaf
spring end (a) schematic figure (b) view of fixture holding leaf spring end and steel
plate
Stationary upper jaw
Metal plate
Bolt
Composite leaf spring end
Moving lower jaw
(a)
(b)
Steel plate
Composite leaf
spring end
Stationary
Movable
TH-978_06610302
Chapter 8 Joint Performance
179
Load and cross-head displacements were continuously measured and acquired with
the help of the inbuilt data acquisition system of the servo hydraulic testing machine.
Joint strength under tensile mode was evaluated under ambient room condition (23C
and 50 % humidity) at constant crosshead speed of 5mm/min. Tests were repeated for
at least three times and the deviation was found to be within 4 % and the average
value is used for further analysis. Maximum load obtained from the load-deflection
curve was considered for computing the bearing strength for all the chosen leaf
spring.
To understand the influence of bolt-hole clearance on test joint performance,
clearance of 200, 400 and 600 µm and interference of 20 µm were considered for the
investigation in short fiber reinforced leaf springs. Prior work on the effect of
clearance on thermoset composite joint strength investigation (Rowlands et al., 1982;
Scalea et al., 1999) also recommended this range of fit between the bolt and hole. The
above desired test clearances were achieved by machining hardened steel pins to a
size of 4.02, 3.80, 3.60, and 3.40 mm. Machined steel pin diameters were measured
using a micrometer of 1 µm accuracy. Joint strengths were evaluated under tension
mode at a constant cross-head speed of 5mm/min.
Fatigue tests for joints were performed with out keeping clearance under
completely reversed mode (stress ratio, R = -1). Various alternating load amplitudes
were chosen on the basis of the percentage of ultimate bearing strength of the leaf
spring joint. Loading frequency of 0.5 Hz was chosen for all the test loads. Joint
damage during fatigue was investigated by measuring the hole elongation with the aid
of hysteresis loop. Figure 8.8 shows the schematic load-deflection hysteresis loop
during the fatigue test. Hole elongation (ΔN) due to the fatigue can be obtained by
subtracting the fastener translation after Nf fatigue cycles (δN) and fastener translation
TH-978_06610302
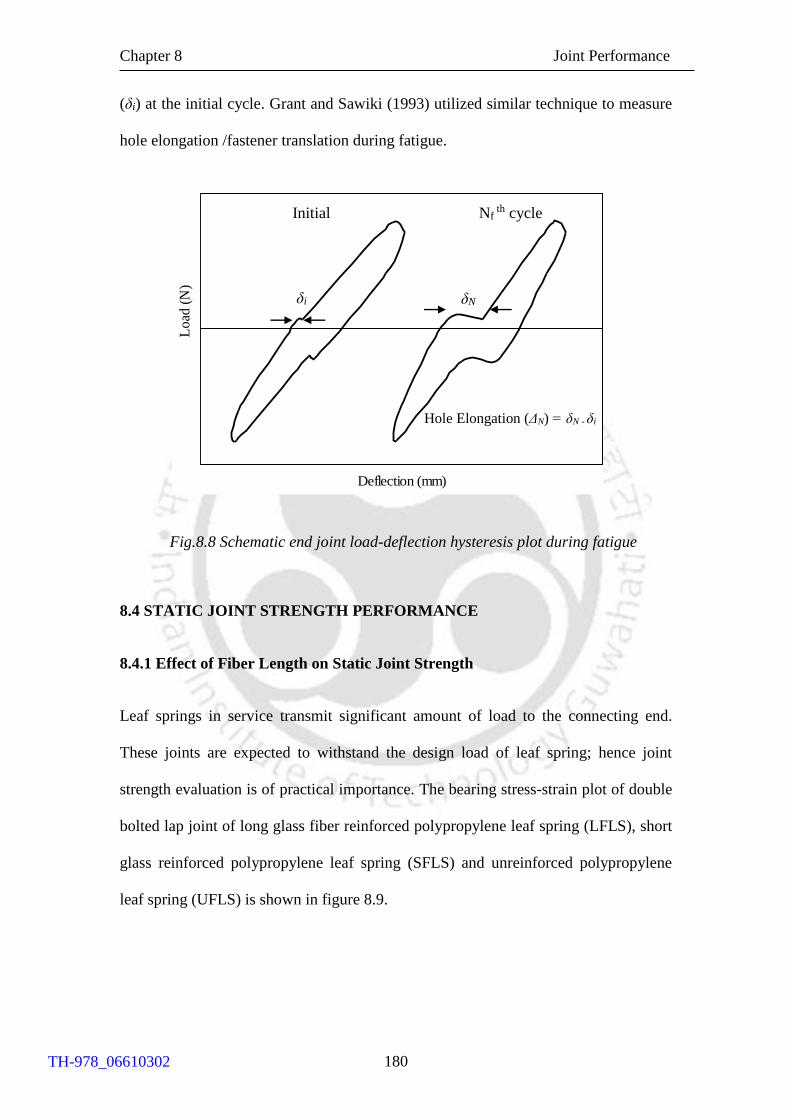
Chapter 8 Joint Performance
180
(δi) at the initial cycle. Grant and Sawiki (1993) utilized similar technique to measure
hole elongation /fastener translation during fatigue.
Fig.8.8 Schematic end joint load-deflection hysteresis plot during fatigue
8.4 STATIC JOINT STRENGTH PERFORMANCE
8.4.1 Effect of Fiber Length on Static Joint Strength
Leaf springs in service transmit significant amount of load to the connecting end.
These joints are expected to withstand the design load of leaf spring; hence joint
strength evaluation is of practical importance. The bearing stress-strain plot of double
bolted lap joint of long glass fiber reinforced polypropylene leaf spring (LFLS), short
glass reinforced polypropylene leaf spring (SFLS) and unreinforced polypropylene
leaf spring (UFLS) is shown in figure 8.9.
Deflection (mm)
Lo
ad (
N)
Initial Nf th cycle
δi δN
Hole Elongation (ΔN) = δN - δi
TH-978_06610302

Chapter 8 Joint Performance
181
Fig. 8.9 Bearing stress -strain curve of test joints
The bearing stress σb was evaluated using following relation
2b
p
P
dt (8.1)
where P is maximum load obtained before failure; d is hole diameter and tp is
thickness of the composite plate. The maximum load reached before failure for LFLS,
SFLS and UFLS joints were 4.81, 3.84 and 3.39 kN respectively. Thus, test leaf
springs are found to have sufficient end joint strength in view of the estimated design
load of 500 N for all the chosen leaf springs. Increase in fiber length results in
efficient load transfer from the matrix to the fiber, thereby improving the load
carrying capability.
0
10
20
30
40
50
60
70
0 5 10 15 20 25 30 35 40
Bearing strain (%)
Beari
ng
str
ess
(M
Pa)
.
LFLS SFLS UFLS
A
B
B
B
C
D
C D
D
C
TH-978_06610302

Chapter 8 Joint Performance
182
The bearing strain was evaluated using the following relation proposed by McCarthy
et al. (2005)
p
bKd
(8.2)
where ξb is the bearing strain, δp is the fastener/pin displacement, d is the hole
diameter and K = 2 for double shear joint with two fasteners. It is observed from
figure 8.9 that the stiffness of the bolted joint is improved with increase in fiber
length. The joint stiffness computed from the initial linear portion (AB) of the bearing
stress-strain curve were 9.94, 3.38, and 2.49 kN/mm for LFLS, SFLS and UFLS joints
respectively. Beyond this linear portion, test joints exhibited significant stiffness drop
as indicated by the curve BC, until a maximum bearing stress is attained.
The joint failure of LFLS, SFLS and UFLS occurred at a corresponding strain
of 20.3, 33.0 and 35.2 % respectively. Thus, reduction in bearing strain prior to the
composite failure was confirmed with the increase in fiber length. Failure morphology
of all the leaf spring joints under static loading condition exhibited mixed mode
failure (tension and bearing failure) as shown in figure 8.10. Hole extension was
visualized for all the leaf spring joints and confirmed the bearing damage prior to net-
tension failure. Karakazu et al. (2008) investigated the influence of geometric
parameters over the failure of glass fiber reinforced vinyl-ester plates having similar
joint configuration as in the present investigation. Mixed mode of failure was
observed (tension and bearing failure), when the ratio of edge distance to the hole
diameter (E/d) was between 1 and 5 and the ratio of the distance between two holes to
hole diameter (M/d) was 2. It is to be noted in the present investigation that, E/d is
1.25 and M/d is 2.5.
TH-978_06610302
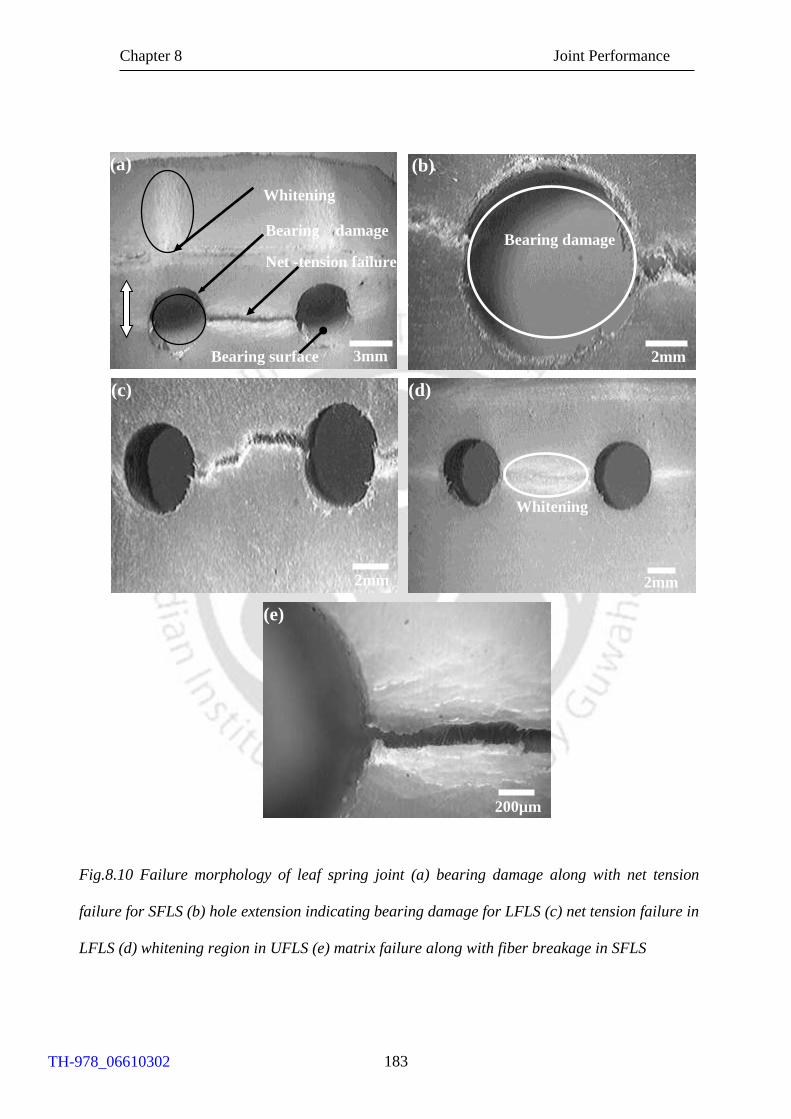
Chapter 8 Joint Performance
183
Fig.8.10 Failure morphology of leaf spring joint (a) bearing damage along with net tension
failure for SFLS (b) hole extension indicating bearing damage for LFLS (c) net tension failure in
LFLS (d) whitening region in UFLS (e) matrix failure along with fiber breakage in SFLS
Loading direction
(d)
2mm
Whitening
Load direction
3mm
(a)
Whitening
Bearing damage
Net -tension failure
Bearing surface
Bearing damage
(b)
2mm
(c)
2mm
200µm
(e)
TH-978_06610302
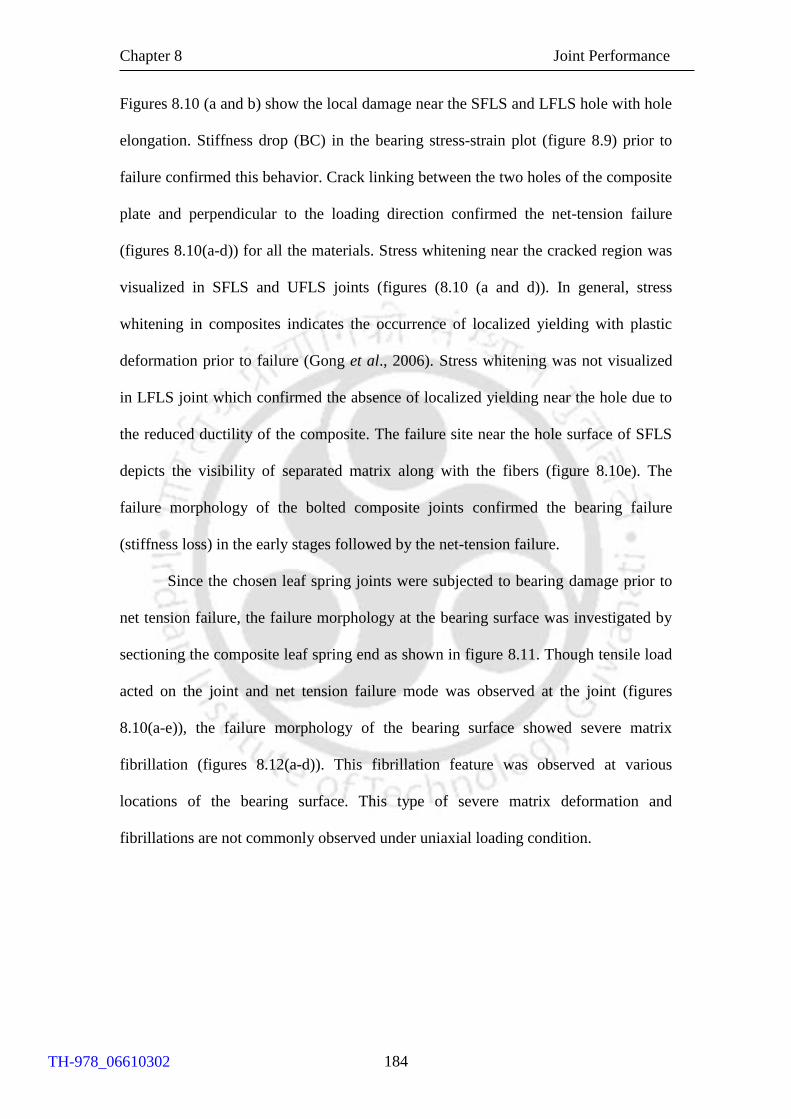
Chapter 8 Joint Performance
184
Figures 8.10 (a and b) show the local damage near the SFLS and LFLS hole with hole
elongation. Stiffness drop (BC) in the bearing stress-strain plot (figure 8.9) prior to
failure confirmed this behavior. Crack linking between the two holes of the composite
plate and perpendicular to the loading direction confirmed the net-tension failure
(figures 8.10(a-d)) for all the materials. Stress whitening near the cracked region was
visualized in SFLS and UFLS joints (figures (8.10 (a and d)). In general, stress
whitening in composites indicates the occurrence of localized yielding with plastic
deformation prior to failure (Gong et al., 2006). Stress whitening was not visualized
in LFLS joint which confirmed the absence of localized yielding near the hole due to
the reduced ductility of the composite. The failure site near the hole surface of SFLS
depicts the visibility of separated matrix along with the fibers (figure 8.10e). The
failure morphology of the bolted composite joints confirmed the bearing failure
(stiffness loss) in the early stages followed by the net-tension failure.
Since the chosen leaf spring joints were subjected to bearing damage prior to
net tension failure, the failure morphology at the bearing surface was investigated by
sectioning the composite leaf spring end as shown in figure 8.11. Though tensile load
acted on the joint and net tension failure mode was observed at the joint (figures
8.10(a-e)), the failure morphology of the bearing surface showed severe matrix
fibrillation (figures 8.12(a-d)). This fibrillation feature was observed at various
locations of the bearing surface. This type of severe matrix deformation and
fibrillations are not commonly observed under uniaxial loading condition.
TH-978_06610302
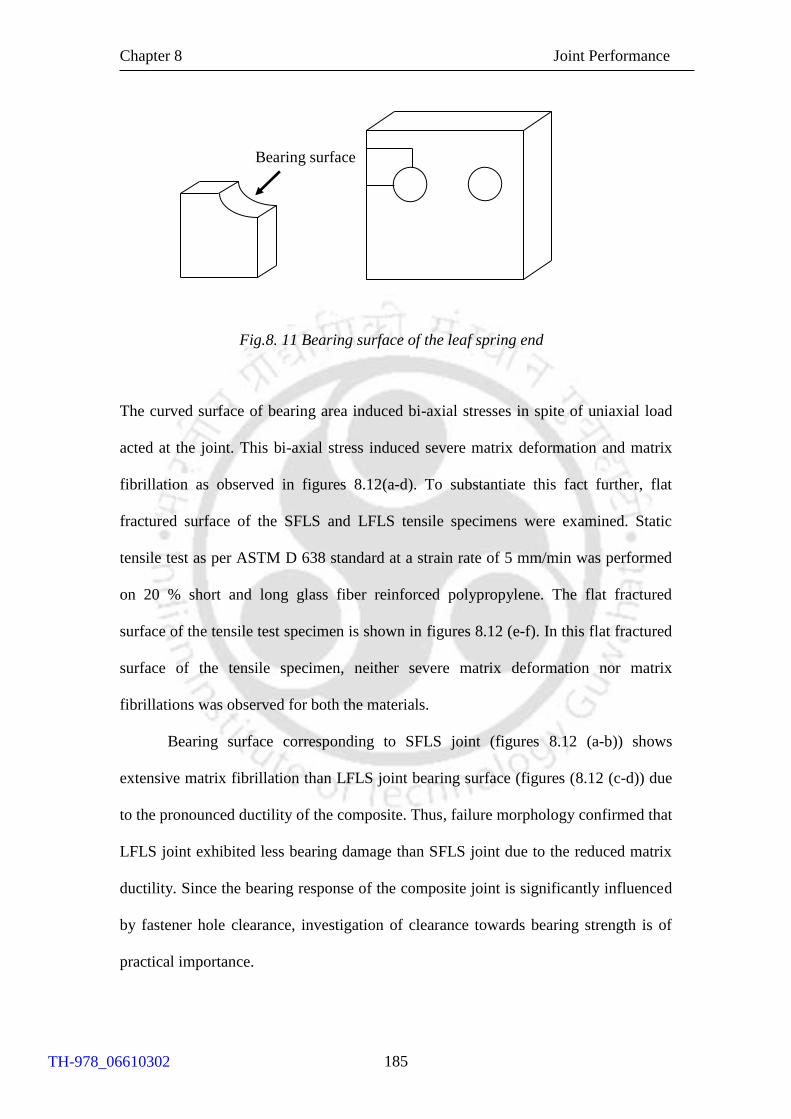
Chapter 8 Joint Performance
185
Fig.8. 11 Bearing surface of the leaf spring end
The curved surface of bearing area induced bi-axial stresses in spite of uniaxial load
acted at the joint. This bi-axial stress induced severe matrix deformation and matrix
fibrillation as observed in figures 8.12(a-d). To substantiate this fact further, flat
fractured surface of the SFLS and LFLS tensile specimens were examined. Static
tensile test as per ASTM D 638 standard at a strain rate of 5 mm/min was performed
on 20 % short and long glass fiber reinforced polypropylene. The flat fractured
surface of the tensile test specimen is shown in figures 8.12 (e-f). In this flat fractured
surface of the tensile specimen, neither severe matrix deformation nor matrix
fibrillations was observed for both the materials.
Bearing surface corresponding to SFLS joint (figures 8.12 (a-b)) shows
extensive matrix fibrillation than LFLS joint bearing surface (figures (8.12 (c-d)) due
to the pronounced ductility of the composite. Thus, failure morphology confirmed that
LFLS joint exhibited less bearing damage than SFLS joint due to the reduced matrix
ductility. Since the bearing response of the composite joint is significantly influenced
by fastener hole clearance, investigation of clearance towards bearing strength is of
practical importance.
Bearing surface
TH-978_06610302
Chapter 8 Joint Performance
186
Fig.8.12 Failure morphology of (a-b) fractured bearing surface of SFLS (c-d) fractured bearing
surface of LFLS (e) fractured surface of the SFLS tensile specimen (f) flat fractured surface of the
LFLS tensile specimen
(a)
Matrix
fibrillation
(d) (c)
Matrix fibrillation
(f)
(b) Matrix fibrillation
(e)
TH-978_06610302
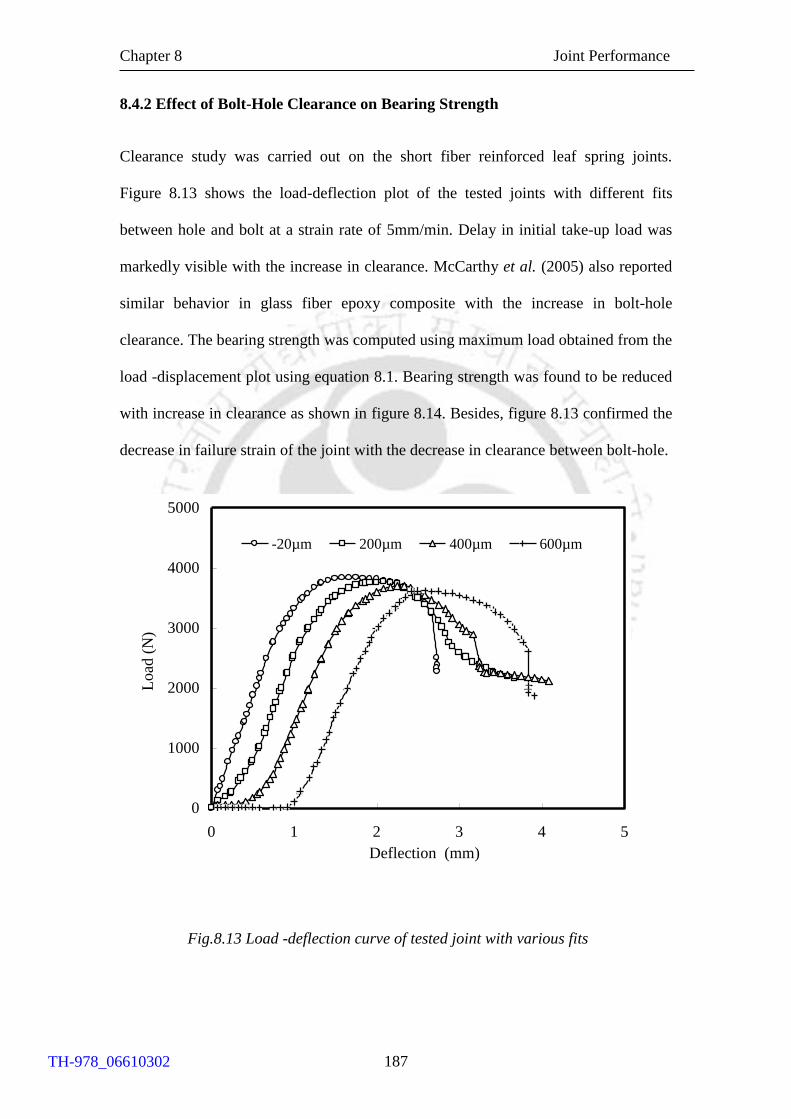
Chapter 8 Joint Performance
187
8.4.2 Effect of Bolt-Hole Clearance on Bearing Strength
Clearance study was carried out on the short fiber reinforced leaf spring joints.
Figure 8.13 shows the load-deflection plot of the tested joints with different fits
between hole and bolt at a strain rate of 5mm/min. Delay in initial take-up load was
markedly visible with the increase in clearance. McCarthy et al. (2005) also reported
similar behavior in glass fiber epoxy composite with the increase in bolt-hole
clearance. The bearing strength was computed using maximum load obtained from the
load -displacement plot using equation 8.1. Bearing strength was found to be reduced
with increase in clearance as shown in figure 8.14. Besides, figure 8.13 confirmed the
decrease in failure strain of the joint with the decrease in clearance between bolt-hole.
Fig.8.13 Load -deflection curve of tested joint with various fits
0
1000
2000
3000
4000
5000
0 1 2 3 4 5
Deflection (mm)
Lo
ad (
N)
-20µm 200µm 400µm 600µm
TH-978_06610302
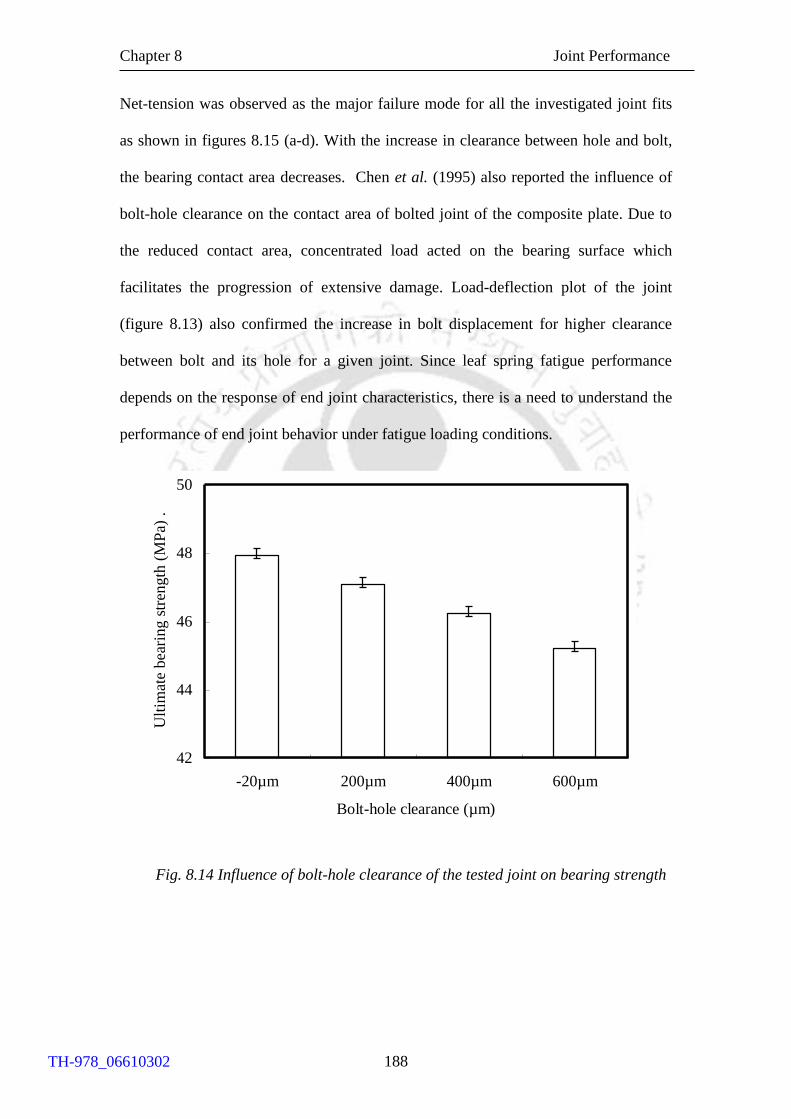
Chapter 8 Joint Performance
188
Net-tension was observed as the major failure mode for all the investigated joint fits
as shown in figures 8.15 (a-d). With the increase in clearance between hole and bolt,
the bearing contact area decreases. Chen et al. (1995) also reported the influence of
bolt-hole clearance on the contact area of bolted joint of the composite plate. Due to
the reduced contact area, concentrated load acted on the bearing surface which
facilitates the progression of extensive damage. Load-deflection plot of the joint
(figure 8.13) also confirmed the increase in bolt displacement for higher clearance
between bolt and its hole for a given joint. Since leaf spring fatigue performance
depends on the response of end joint characteristics, there is a need to understand the
performance of end joint behavior under fatigue loading conditions.
Fig. 8.14 Influence of bolt-hole clearance of the tested joint on bearing strength
42
44
46
48
50
-20µm 200µm 400µm 600µm
Bolt-hole clearance (µm)
Ult
imat
e bea
ring
str
ength
(M
Pa)
.
TH-978_06610302
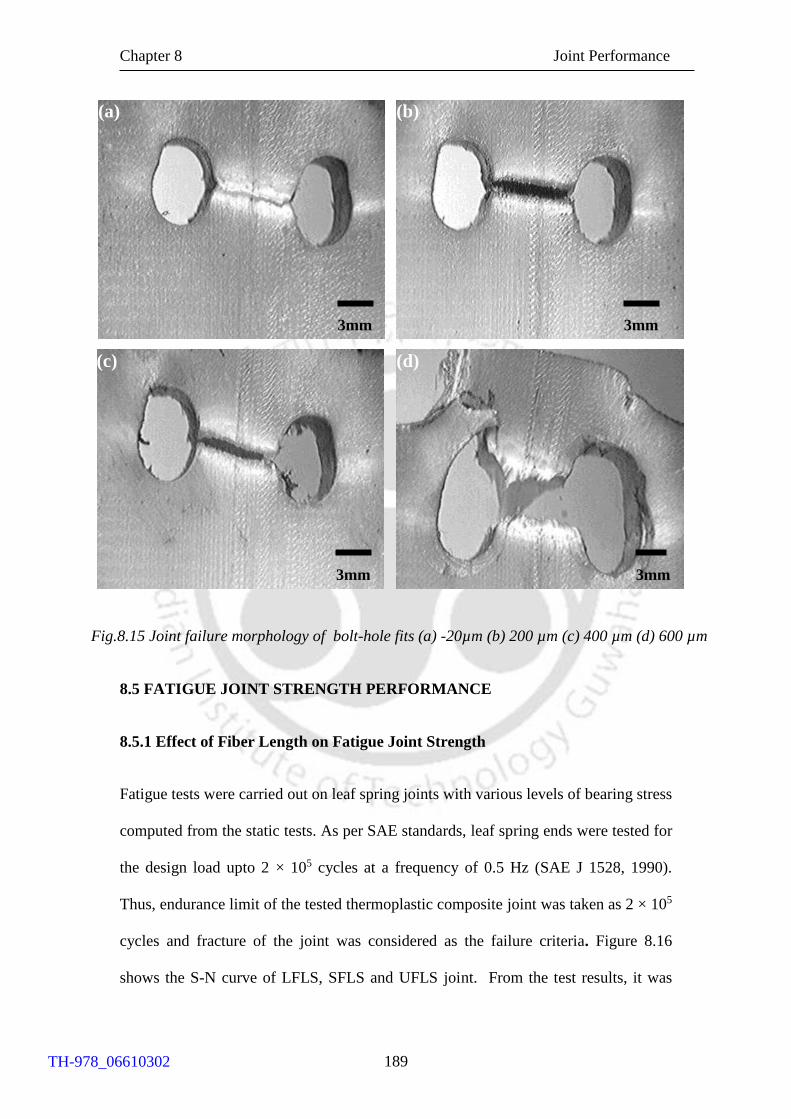
Chapter 8 Joint Performance
189
Fig.8.15 Joint failure morphology of bolt-hole fits (a) -20µm (b) 200 µm (c) 400 µm (d) 600 µm
8.5 FATIGUE JOINT STRENGTH PERFORMANCE
8.5.1 Effect of Fiber Length on Fatigue Joint Strength
Fatigue tests were carried out on leaf spring joints with various levels of bearing stress
computed from the static tests. As per SAE standards, leaf spring ends were tested for
the design load upto 2 × 10⁵ cycles at a frequency of 0.5 Hz (SAE J 1528, 1990).
Thus, endurance limit of the tested thermoplastic composite joint was taken as 2 × 10⁵
cycles and fracture of the joint was considered as the failure criteria. Figure 8.16
shows the S-N curve of LFLS, SFLS and UFLS joint. From the test results, it was
3mm
(a) (b)
3mm
(c)
3mm
(d)
3mm
TH-978_06610302
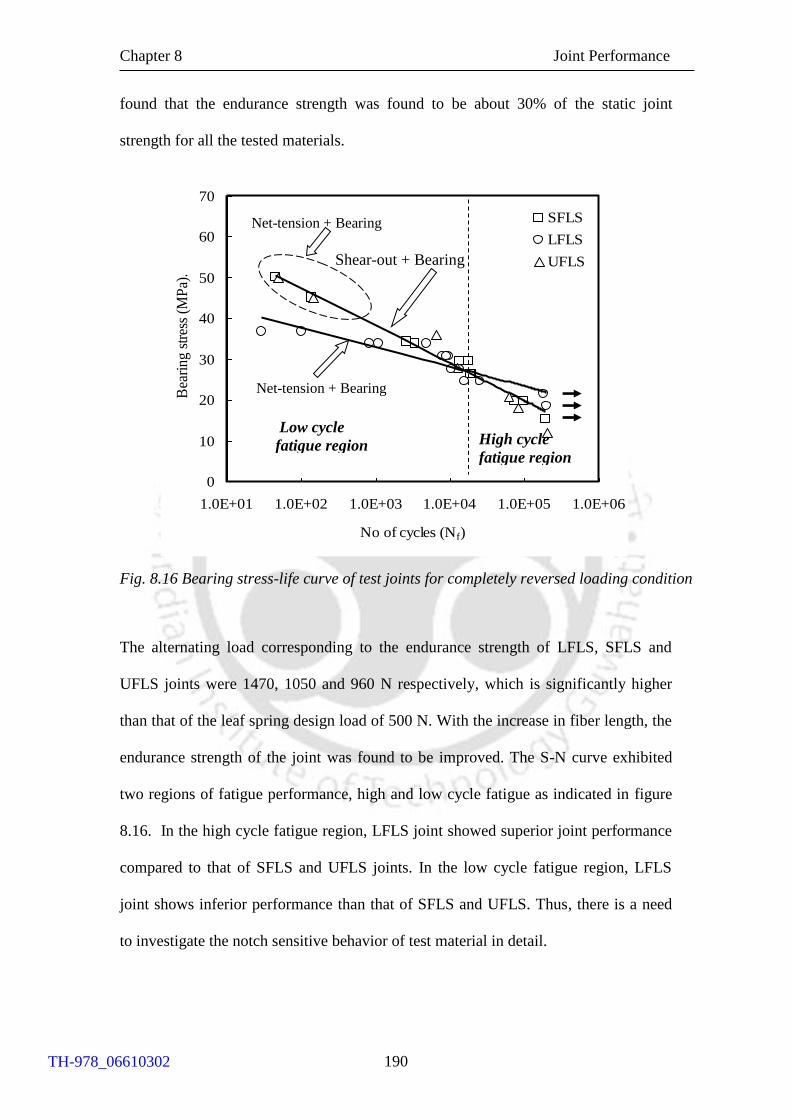
Chapter 8 Joint Performance
190
found that the endurance strength was found to be about 30% of the static joint
strength for all the tested materials.
Fig. 8.16 Bearing stress-life curve of test joints for completely reversed loading condition
The alternating load corresponding to the endurance strength of LFLS, SFLS and
UFLS joints were 1470, 1050 and 960 N respectively, which is significantly higher
than that of the leaf spring design load of 500 N. With the increase in fiber length, the
endurance strength of the joint was found to be improved. The S-N curve exhibited
two regions of fatigue performance, high and low cycle fatigue as indicated in figure
8.16. In the high cycle fatigue region, LFLS joint showed superior joint performance
compared to that of SFLS and UFLS joints. In the low cycle fatigue region, LFLS
joint shows inferior performance than that of SFLS and UFLS. Thus, there is a need
to investigate the notch sensitive behavior of test material in detail.
0
10
20
30
40
50
60
70
1.0E+01 1.0E+02 1.0E+03 1.0E+04 1.0E+05 1.0E+06
No of cycles (Nf)
Bea
rin
g s
tres
s (M
Pa)
.
SFLS
LFLS
UFLS
Net-tension + Bearing
Shear-out + Bearing
Net-tension + Bearing
Low cycle
fatigue region High cycle
fatigue region
TH-978_06610302

Chapter 8 Joint Performance
191
To identify the notch sensitive behavior of leaf spring materials, tensile test specimens
(as per ASTM D 638) with central hole of 2 mm diameter across the width was
considered. Displacement rate of 5mm/min was used for all the chosen leaf spring
materials. Figure 8.17 shows the load-deflection curve of notched and unnotched
specimens made of LFPP, SFPP and UFPP. For all the test materials, the failure load
decreases due to the presence of notch with the reduction in extension. The notch
sensitivity factor Q was evaluated by the following relation (Prabhakaran, 2003)
Q = (Ks -1)/ (Kt -1) (8.3)
where Kt is the theoretical/elastic stress concentration factor which is equal to 2.6
based on the width to diameter ratio (Peterson, 1951), Ks is the strength reduction
factor, and it is given by the ratio between strength of unnotched specimen to the
strength of notched specimen.
Fig.8.17 Load-deflection curve of notched and unnotched curve for the leaf spring
joint materials
0
500
1000
1500
2000
2500
3000
0 0.5 1 1.5 2 2.5 3 3.5 4
Extension (mm)
Lo
ad
(N
)
Notched Unnotched
LFPP
SFPP
UFPP
TH-978_06610302

Chapter 8 Joint Performance
192
From figure 8.17, failure load for unnotched and notched LFPP specimens are 2469
and 2055 N respectively, and hence the strength reduction factor of LFPP was found
to be 1.016. Similarly, strength reduction factor of SFPP and UFPP were computed as
0.957 and 0.887 respectively. With the computed strength reduction factor, the notch
sensitivity of LFPP, SFPP and UFPP were obtained as + 0.0106, -0.0268 and - 0.0703
respectively using equation 8.3. Thus, it was confirmed that the presence of long
fibers in LFPP caused the material more notch sensitive. SFPP and UFPP showed a
notch strengthening effect which is observed from the negative value of notch
sensitivity factor. Notch strengthening effect implied the material ability to undergo
localized yielding near the hole prior to failure (Fouad, 2009). Notch sensitive
behavior is generally more visible in the low cycle fatigue condition where the stress
level is high. Ferreira et al. (1997) investigated the fatigue performance of glass fiber
reinforced polypropylene specimens with central and offset holes having different
diameters where significant difference between notched and unnotched specimens
was observed at low cycle fatigue and very less difference in performance was
observed at high cycle condition.
In general, notch sensitivity of the composite material is dependent on matrix
and fiber material (Pinnell, 1996). Guynn and Bradley (1989) reported that the ductile
matrix exhibited better ability to dissipate stress concentration near the notch than that
of brittle material. In the present investigation, LFLS joint exhibited high strength and
high modulus associated with lesser bearing strain as indicated in figure 8.9. At low
cycle fatigue region where the stress level is higher, the ability of LFLS joint to
dissipate the stress concentration near the hole was limited due to the presence of
relatively brittle matrix compared to that of SFLS and UFLS joints. This hinders the
LFLS joint to withstand at higher stress (absence of local yielding near the hole).
TH-978_06610302

Chapter 8 Joint Performance
193
However, at high cycle fatigue where the stress is relatively less, the induced strain
near the hole was less and effect of stress concentration was minimum, which leads to
superior performance in LFLS joint than that of SFLS and UFLS joints. Thus, it was
observed that notch sensitive characteristics of the leaf spring materials played an
important role in deciding the low and high cycle fatigue response of the joint. Since
the investigated test joint predominantly exhibited bearing failure, an attempt was
made to monitor this damage continuously.
Continuous measurement of load-deflection curves of test joint helps to
measure the hole elongation in the joint. Completely reversed fatigue load causes the
tensile load to act at the ends diametrically opposite to the hole, which causes hole
elongation (bearing mode of failure). Figures 8.18-8.20 show the measured hysteresis
loop of UFLS, SFLS and LFLS joint at different stages. The increase in hole
elongation (ΔN = δN - δi as indicated in schematic figure 8.7) during the fatigue loading
is shown in figures 8.18(a-d), 8.19(a-d) and 8.20(a-d). Presence of discontinuous
fibers in the composite leaf spring alters the hole elongation, and this is reflected from
the change in shape of the load-deflection plots. As the cycle progresses, the shape of
the load-deflection hysteresis plot of the joint varied due to the change in surface
condition of the bearing area and stiffness of the bolted joint.
TH-978_06610302

Chapter 8 Joint Performance
194
Fig. 8.18 (a-d) Load-deflection hysteresis loop of UFLS joint at an alternating stress
of 28 MPa corresponding to 60% ultimate bearing strength
-2.5
-2
-1.5
-1
-0.5
0
0.5
1
1.5
2
2.5
-20 -19 -18 -17 -16
Deflection (mm)
Lo
ad
(k
N)
10000-10030 cycles
(d)
-2.5
-2
-1.5
-1
-0.5
0
0.5
1
1.5
2
2.5
-20 -19 -18 -17 -16
Deflection (mm).
Load
(kN
)
100-130 cycles
(a)
-2.5
-2
-1.5
-1
-0.5
0
0.5
1
1.5
2
2.5
-20 -19 -18 -17 -16
Deflection (mm)
Lo
ad (
kN
)
5000-5030 cycles
(b)
-2.5
-2
-1.5
-1
-0.5
0
0.5
1
1.5
2
2.5
-20 -19 -18 -17 -16
Deflection (mm)
Lo
ad (
kN
)
7500-7530 cycles
(c)
TH-978_06610302
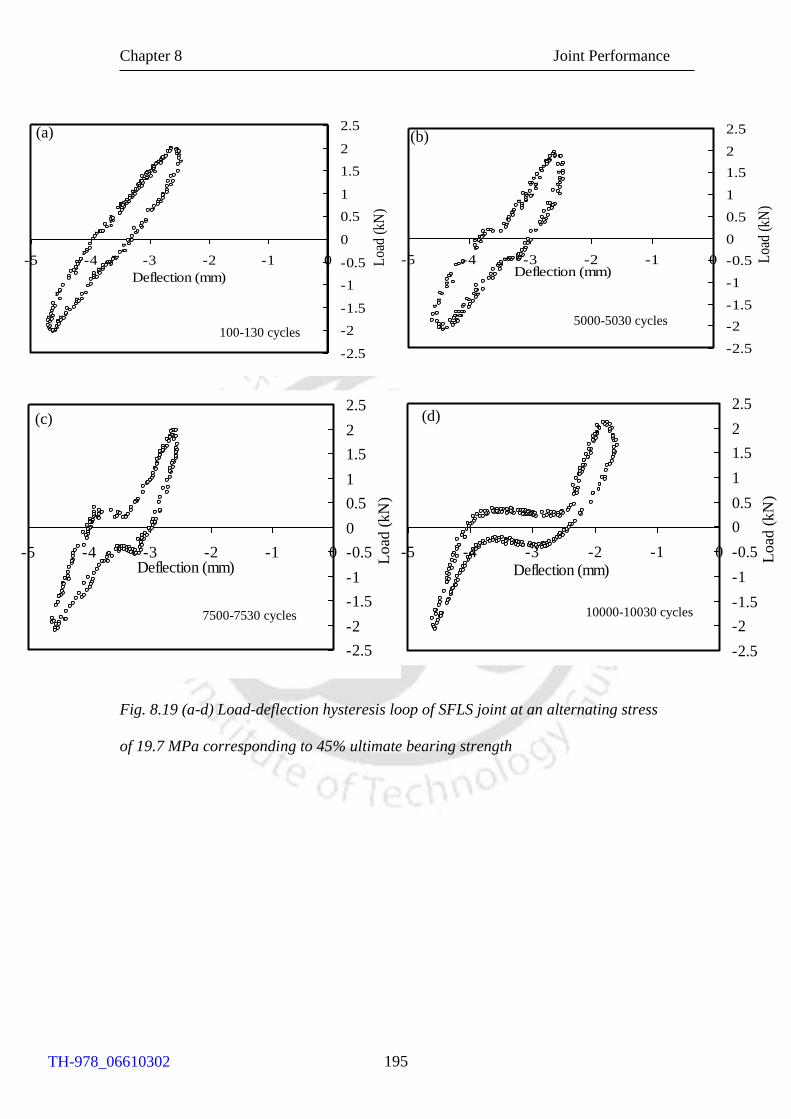
Chapter 8 Joint Performance
195
Fig. 8.19 (a-d) Load-deflection hysteresis loop of SFLS joint at an alternating stress
of 19.7 MPa corresponding to 45% ultimate bearing strength
-2.5
-2
-1.5
-1
-0.5
0
0.5
1
1.5
2
2.5
-5 -4 -3 -2 -1 0
Deflection (mm)
Loa
d (k
N)
(a)
100-130 cycles
-2.5
-2
-1.5
-1
-0.5
0
0.5
1
1.5
2
2.5
-5 -4 -3 -2 -1 0Deflection (mm)
Loa
d (k
N)
(b)
5000-5030 cycles
-2.5
-2
-1.5
-1
-0.5
0
0.5
1
1.5
2
2.5
-5 -4 -3 -2 -1 0Deflection (mm)
Lo
ad (
kN
)
(c)
7500-7530 cycles
-2.5
-2
-1.5
-1
-0.5
0
0.5
1
1.5
2
2.5
-5 -4 -3 -2 -1 0Deflection (mm)
Load
(kN
)
(d)
10000-10030 cycles
TH-978_06610302
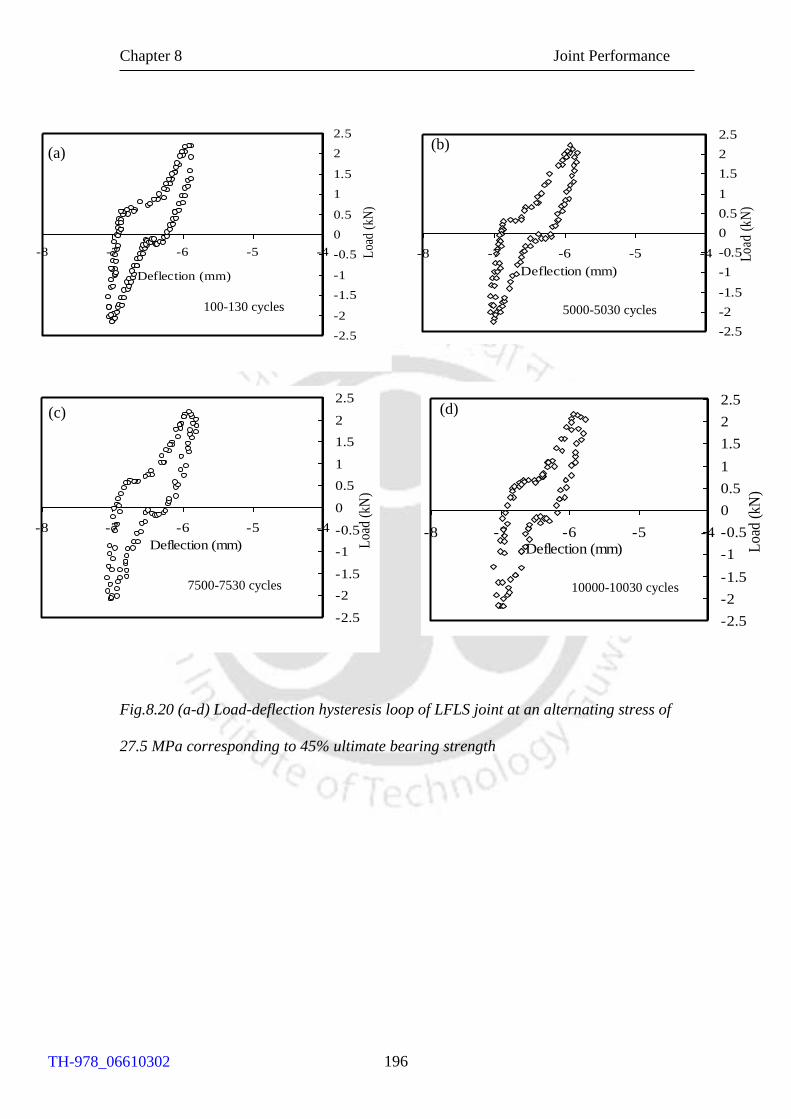
Chapter 8 Joint Performance
196
Fig.8.20 (a-d) Load-deflection hysteresis loop of LFLS joint at an alternating stress of
27.5 MPa corresponding to 45% ultimate bearing strength
-2.5
-2
-1.5
-1
-0.5
0
0.5
1
1.5
2
2.5
-8 -7 -6 -5 -4
Deflection (mm)
Loa
d (k
N)
100-130 cycles
(a)
-2.5
-2
-1.5
-1
-0.5
0
0.5
1
1.5
2
2.5
-8 -7 -6 -5 -4
Deflection (mm)
Loa
d (k
N)
5000-5030 cycles
(b)
-2.5
-2
-1.5
-1
-0.5
0
0.5
1
1.5
2
2.5
-8 -7 -6 -5 -4
Deflection (mm) Loa
d (k
N)
7500-7530 cycles
(c)
-2.5
-2
-1.5
-1
-0.5
0
0.5
1
1.5
2
2.5
-8 -7 -6 -5 -4Deflection (mm) L
oad
(kN
)
10000-10030 cycles
(d)
TH-978_06610302

Chapter 8 Joint Performance
197
Figures 8.21 (a-c) show the progressive hole extension when UFLS, SFLS and LFLS
joints are subjected to fatigue. With the increase in number of cycles, the hole
elongation increases, and it is observed to be more in UFLS joint followed by SFLS
and LFLS joint. At an alternating stress of 28 MPa and 1000 cycles, UFLS joint
exhibited a hole elongation of 0.22 mm, whereas LFLS joint exhibited only 0.06 mm
for an alternating stress of 27.5 MPa. Hole elongation was found to be slow upto 1000
cycles for all the test material joints, and later increased progressively until failure
occurred. Besides, the rate of hole elongation was found to be significantly influenced
by the bearing stress amplitude. Huth (1986) and Saunders et al. (1993) also reported
the damage progression using load-deflection plot of the composite joint. In addition
to the continuous monitoring of bearing damage, morphology of the fractured joints
was also investigated to understand the joint failure mechanism.
Fig. 8. 21a Hole extension of UFLS joint
0
0.5
1
1.5
2
1 10 100 1000 10000 100000 1000000
Number of fatigue cycles (Nf)
Ho
le e
xte
nsi
on
(m
m).
12 MPa
18MPa
20.75MPa
28MPa
36MPa
TH-978_06610302
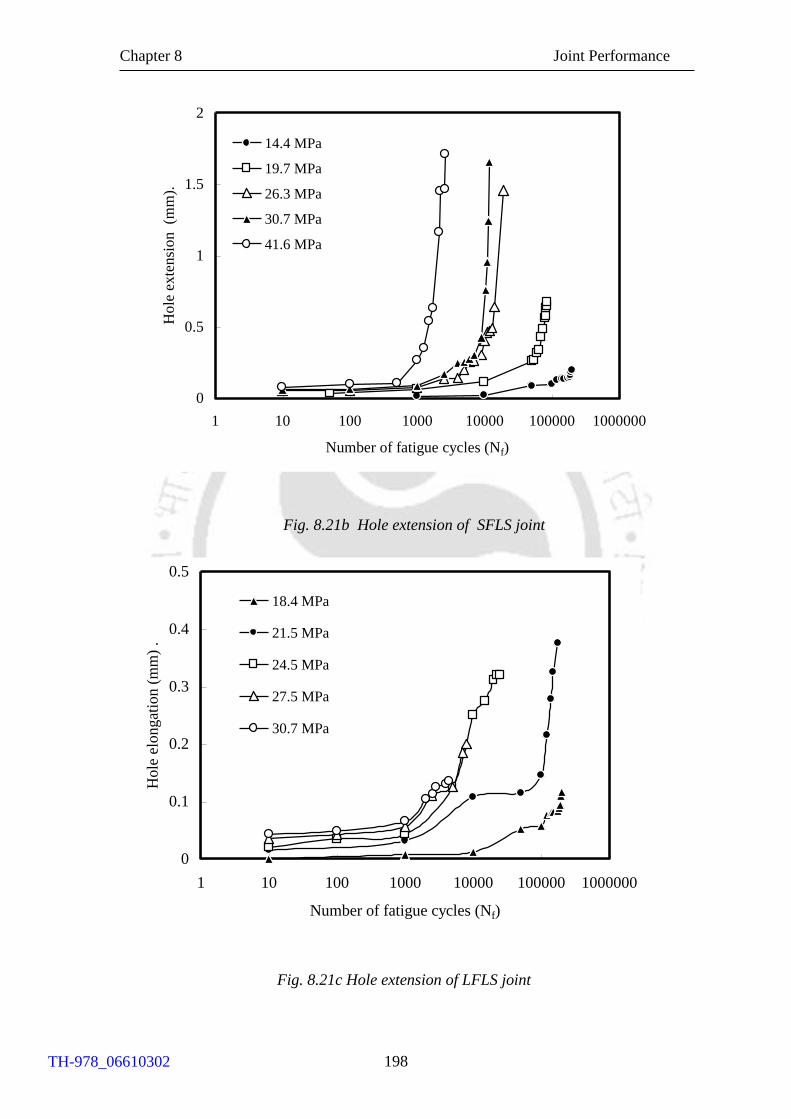
Chapter 8 Joint Performance
198
Fig. 8.21b Hole extension of SFLS joint
Fig. 8.21c Hole extension of LFLS joint
0
0.5
1
1.5
2
1 10 100 1000 10000 100000 1000000
Number of fatigue cycles (Nf)
Hole
exte
nsi
on (m
m).
14.4 MPa
19.7 MPa
26.3 MPa
30.7 MPa
41.6 MPa
0
0.1
0.2
0.3
0.4
0.5
1 10 100 1000 10000 100000 1000000
Number of fatigue cycles (Nf)
Ho
le e
long
atio
n (
mm
) .
18.4 MPa
21.5 MPa
24.5 MPa
27.5 MPa
30.7 MPa
TH-978_06610302
Chapter 8 Joint Performance
199
8.5.2 Effect of Fiber Length on Fatigue Failure Morphology
Failure modes observed in the considered leaf spring joints were found to be
dependent on the stress level and leaf spring material. LFLS end joint failed by net-
tension (T) + bearing (B) for all the bearing stress levels (figures 8.22(a-b)). SFLS and
UFLS joint exhibited net-tension (T) + bearing (B) at higher bearing stress amplitude.
Failure mode of SFLS and UFLS joint (figure 8.22c) at higher stress level was similar
to that of joint failure observed under static loading condition (figures 8.10a and
8.10d). Starikov and Schon (2001, 2002) investigated static and fatigue performance
of carbon fiber epoxy specimens joined with different numbers of bolts and observed
a similar observation as reported in the present investigation, where net-tension and
bearing failures were observed at static as well as high stress fatigue condition.
Observation of whitening in SFLS and UFLS joint confirmed the material yielding
(figure 8.22c). Shear out (S) + bearing (B) failure was observed at lower bearing
stress amplitude for SFLS and UFLS joint. The progressive damage caused the hole
elongation, which leads the bolt motion to cause shear-out failure (figures 8.22(d-e)).
The absence of shear out failure in LFLS joint confirmed the lack of hole elongation.
This behavior is due to the reduced ductility of the polypropylene matrix in the
composite and failure morphology observed at the bearing surface area confirmed this
behavior.
TH-978_06610302

Chapter 8 Joint Performance
200
Fig.8.22 Fatigue failure morphology of test joint at various bearing stress (a) net-tension failure in
LFLS at 30.7MPa (b) net-tension failure in LFLS at 21.5 MPa (c) net-tension failure of UFLS at
45MPa (d) shear-out failure of UFLS at 28MPa (e) shear-out failure of SFLS at 30.7 MPa
(a)
Net-tension failure
2mm
(b)
Net-tension failure
2mm
3 mm
(d)
(e)
2mm
whitening
(c)
2mm
TH-978_06610302
Chapter 8 Joint Performance
201
Failure morphology (figures 8.23(a-b)) of SFLS joint exhibited matrix fibrillation
during fatigue, this behavior is due to considerable hole elongation (bearing damage)
prior to the failure. Wear particles were also observed at the bearing surface area due
to the sliding friction between bearing hole and bolt shank (figure 8.23a). Figures 8.23
(c-d) show the insignificant matrix stretching due to reduced hole elongation
characteristics of LFLS joint. The fibers were well adhered to the matrix and
elongation of the matrix was constrained as shown in figure 8.23d. It was confirmed
that bearing damage is prominent in SFLS joint than LFLS joint due to reduced
ductility of the composite.
Though joint failure morphology under fatigue exhibited shear out/net-tension
failure, substantial bearing damage (figures 8.22(a-e)) was also observed at all the
investigated stress levels. Despite the fact that uniaxial fatigue load was acted at the
investigated joint, bi-axial stress was induced at the bearing surface due to the curved
surface of the bearing area as in static condition. This bi-axial stress at the bearing
surface severely deformed the matrix as shown in figures 8.23(a-d). To substantiate
further, same leaf spring test material; 20 % short fiber reinforced polypropylene was
injection molded into tensile test specimen as per ASTM D638 standard and subjected
to similar fatigue condition. Loading frequency of 0.5 Hz, alternating loading
amplitude of 45 and 60 % UTS was kept for the testing. As expected, the failure
morphology of the fractured surface of tensile test specimen was found to be different
from the bearing surface of leaf spring end. The morphology of fractured surface of
the tensile test specimen subjected to fatigue testing is shown in figures 8.23 (e-f),
wherein no severe matrix deformation and fibrillation were found as exhibited at the
bearing surfaces.
TH-978_06610302

Chapter 8 Joint Performance
202
Fig. 8.23 Bearing surface failure morphology of test joint during fatigue (a) matrix fibrillation
along with wear debris of SFLS joint at alternating stress of 19.7 MPa (b) excessive matrix
fibrillation of SFLS joint at alternating stress of 26.3 MPa (c-d) absence of matrix stretching in
LFLS at alternating stress of 24.5 MPa (e) failure surface at 45% UTS of SFLS tensile specimen
(f) failure surface at 60% UTS of SFLS tensile specimen
Wear debris
(a) (b)
Elongation of
matrix
(c) (d)
(e) (f)
TH-978_06610302
Chapter 8 Joint Performance
203
8.6 SUMMARY
This chapter presents the static and fatigue performance of the composite leaf spring
end joint behavior.
Parametric investigation of double pin joint for the molded thermoplastic leaf
spring revealed the effect of end distance and distance between the holes in
influencing the bearing strength. Load carrying capacity of the joint was found to
increase with the increase in free edge distance to hole centre.
Static and fatigue leaf spring end joint strength evaluation confirmed that the
bearing strength increased with the increase in fiber length and sufficient end joint
strength was observed for all the material configurations.
Joint strength was found to be significantly influenced by the fit between fastener
and hole under static loading condition. Superior joint strength was exhibited with
the decrease in clearance. However for the investigated clearance range, failure
mode was found to be same.
Long fiber reinforced leaf spring joint exhibited superior performance at high
cycle fatigue condition than short fiber and unreinforced leaf spring joint.
However, notch sensitive characteristics of the material deteriorated the
performance of long fiber reinforced leaf spring at low cycle fatigue conditions.
Hole elongation of long fiber reinforced leaf spring joint was low compared to
unreinforced and short fiber reinforced leaf spring joint at all the investigated
stress levels.
Long fiber reinforced leaf spring end joint exhibited net-tension + bearing damage
at all the stress levels. Short fiber reinforced and unreinforced leaf spring end joint
exhibited net-tension + bearing damage at high stress level and shear-out +
bearing at lower stress level.
TH-978_06610302

Chapter 9 Summary and Conclusions
204
CHAPTER 9
SUMMARY AND CONCLUSIONS
8.1 SUMMARY
Unreinforced, 20 % short and 20 % long glass fiber reinforced polypropylene
materials were considered for injection molding the varying width mono leaf springs.
Computer aided injection molding simulation of leaf spring was carried out and then
die was manufactured. Desired material properties for the leaf spring applications viz.,
adhesive wear, abrasive wear and damping performance were examined before
manufacturing the leaf spring. Considered materials were injected molded into
varying width mono leaf spring. Developed leaf springs were evaluated for static,
fatigue and short term flexural creep performance with the aid of servo hydraulic
fatigue testing facility. Leaf spring end joint was designed with the aid of finite
element analysis and experimentally evaluated for static and fatigue performance.
Following major conclusions were drawn based on the investigation.
8.2 CONCLUSIONS
Adhesive and abrasive wear performance of leaf spring materials confirmed the
role of fiber length on the wear performance of leaf spring materials. Improved
fiber matrix bonding, hardness and presence of less fiber ends in long fiber
reinforced material reduced specific wear rate compared to that of short fiber
reinforced and unreinforced material. UFPP exhibited micro ploughing in both
adhesive and abrasive modes. Fiber pullout and micro cutting were observed in
TH-978_06610302
Chapter 9 Summary and Conclusions
205
SFPP material at adhesive and abrasive mode respectively. LFPP exhibited fiber
breakage under adhesive as well as abrasive mode.
Damping behavior of leaf spring material was significantly affected by the fiber
ends and fiber-matrix interface. Short fiber reinforced composite material
exhibited superior damping performance to that of long fiber reinforced composite
material. Under free vibration, logarithmic decrement and damping factor were
found to decrease with the increase in fiber length. Under forced vibration, SFPP
exhibited higher phase lag between the excited force and its response than that of
LFPP material.
Long fiber reinforced material exhibited improved crystallinity and thermal
stability than that of short fiber reinforced material. Static performance of the
molded leaf spring is appreciably influenced with the fiber length. Spring rate of
LFLS was found to be about three times greater than that of SFLS and five times
greater than UFLS. Energy storage capability of long glass fiber reinforced leaf
spring was found to be significantly higher that of SFLS and UFLS, which helps
to isolate vibrations. Load-deflection behavior of LFLS showed less strain rate
sensitiveness than that of SFLS and UFLS.
Fatigue performance of the molded leaf spring is significantly altered with the
fiber length. Load-deflection of test leaf springs was continuously measured and
used as a damage index. Spring rate reduction was dependent on the stress level
for all the considered leaf springs and found to decrease with the increase in fiber
length. Short fiber reinforced and unreinforced leaf springs exhibited 10 % drop in
initial spring rate, whereas long fiber reinforced leaf spring exhibited fracture
failure at tensile surface.
TH-978_06610302
Chapter 9 Summary and Conclusions
206
Short-term flexural creep performance of leaf spring was improved with the fiber
length due to the improved load transfer from the matrix to the fibers. HRZ model
was used to predict the short term creep performance of leaf spring.
Leaf spring end joint was designed and experimentally evaluated for static and
fatigue performance. Static end joint strength evaluation confirmed that the
bearing strength increased with the increase in fiber length and decreased with the
increase in clearance. LFLS exhibited superior joint performance during high
cycle fatigue conditions than that of SFLS and UFLS joints. However notch
sensitive characteristics of the long fiber reinforced material associated with
reduced composite ductility deteriorated its performance at low cycle fatigue
conditions.
In a summary adhesive and abrasive wear resistance was found to be improved with
reinforcement; LFPP exhibited superior wear resistance than that of SFPP. Damping
performance was found to be deteriorated with the reinforcement; SFPP exhibited
superior damping performance than that of LFP. Static, fatigue and creep performance
of leaf spring was found to be enhanced due to the reinforcement; LFLS exhibited
superior static and dynamic performance than SFLS. Static and high cycle fatigue
performance of leaf spring joint was found to be improved due to the reinforcement;
LFLS exhibited superior fatigue joint performance than SFLS.
8.3 FUTURE SCOPE
Current investigation is limited to 20 % weight fraction of fibers, this can be
varied and its influence can be studied. With the utilization of high performance
base matrix and resins fibers (such as PEEK matrix and carbon fibers) for leaf
TH-978_06610302

Chapter 9 Summary and Conclusions
207
spring application, load carrying capability, fatigue life and creep resistance can
be significantly enhanced.
In the current study, varying width and constant thickness leaf springs were
molded, further varying thickness as well as varying width leaf spring can be
fabricated and its performance can be studied. Leaf spring can be molded to the
actual size and fitted in the vehicle to investigate the real time ride characteristics.
TH-978_06610302
208
REFERENCES
1. Aberg, J., and Widell, B. Uniaxial material damping measurements using a fiber
optic lattice: A discussion of its performance envelope. Experimental Mechanics,
2004, 44, 33-36.
2. Acha, B.A., Reboredo, M.M., and Marcovich, N.E. Creep and dynamic
mechanical behavior of PP–jute composites: Effect of the interfacial adhesion.
Composites Part A: Applied Science and Manufacturing, 2007, 33, 1507-1516.
3. Adams, R.D., and Maheri, M.R. Damping in advanced polymer-matrix
composites. Journal of Alloys and Compounds, 2003, 355, 126-130.
4. Aggarwal, V.P., Agarwal, and Khan, R.A. A stress approach model for
predictions of fatigue life by shot penning of EN45A spring steel. International
Journal of Fatigue, 2006, 12, 1845-1853.
5. Aktas, A., Imrek, H., and Cunedioglu, Y. Experimental and numerical failure
analysis of pinned-joints in composite materials. Composite Structures, 2009, 89,
459-466.
6. Allah, A., Abdin, E.M., Selmy, A.I., and Khashaba, U.A. Effect of mean stress
on fatigue behavior of GFRP pultruded rod composites. Composites Part A, 1997,
28, 87-91.
7. Al-Qureshi, H.A. Automobile leaf springs from composite materials. Journal of
Material Processing Technology, 2001, 118, 58-61.
8. American Society of Civil Engineers. Structural Plastic Design Manual, 1986
(ASCE Publications, Newyork).
9. Arnold, C., Yang, M., Ayala, E., and Adam Bell. Effects of filler particles on
abrasive wear of elastomer based composites. Wear, 1991, 146, 349-366.
10. ASM International. Engineering Materials Handbook, 1988 (ASM International,
Ohio).
11. ASTM D-2990. Standard test methods for tensile, compressive, and flexural creep
and creep-rupture of plastics. ASTM International: Philadelphia, 2005.
TH-978_06610302
209
12. ASTM D5961/D5961M-05E1. Standard test method for bearing response of
polymer-matrix composite laminates. ASTM International: West Conshohocken,
2005.
13. Bahadur, S. The development of transfer layers and their role in polymer
tribology. Wear, 2000, 245, 92-99.
14. Bahadur, S., and Polineni, V.K. Tribological studies of glass fabric-reinforced
polyamide composites filled with CuO and PTFE. Wear, 1996, 200, 95-104.
15. Banik, K., Karger-Kocsis, J., and Abraham, T. Flexural creep of all-
polypropylene composites: Model analysis. Polymer Engineering Science, 2008,
48, 941-948.
16. Barkoula, N.M., and Karger-Kocsis, J. Effect of fibre content and relative fibre
orientation on the solid particle erosion of GF/PP composites. Wear, 2002, 252,
80-87.
17. Barrett, T.S., Stachowiak, G.W., and Batchelor, A.W. Effect of roughness and
sliding speed on the wear and friction of ultra-high molecular weight polyethylene.
Wear, 1992, 153, 331-350.
18. Bartus, S.D., Vaidya, U.K., and Ulven, C.A. Design and development of a long
fiber thermoplastic bus seat. Journal of Thermoplastic Materials, 2006, 19,
131-154.
19. Bayer, R.G. Mechanical Wear Prediction and Prevention, 1994 (Marcel Dekker
Inc, New York).
20. Beardmore, P., and Johnson, C.F. The potential for composites in structural
automotive applications. Composite Science and Technology, 1986, 26, 251-281.
21. Beardmore, P. Composite structures for automobiles. Composite Structures,
1986, 5, 163-176.
22. Bekhet, N.E. Tribological behaviour of drawn polypropylene. Wear, 1999, 236,
55-61.
23. Bellenger, V., Tcharkhtchi, A., and Castaing, P. Thermal and mechanical
fatigue of a PA66/glass fibers composite material. International Journal of
Fatigue, 2006, 28, 1348-1352.
TH-978_06610302
210
24. Belogur, V.P., Treshchevskii, A.N., and Yu Konev, S. Titanium alloys for
springs in cutoff fittings. Chemical and Petroleum Engineering, 2004, 40,
696-698.
25. Bernasconi, A., Davoli, P., Basil, A., and Filippi, A. Effect of fibre orientation on
the fatigue behaviour of a short glass fibre reinforced polyamide-6. International
Journal of Fatigue, 2007, 29, 199-208.
26. Bernasconi, A., Davoli, P., Rossin, D., and Armanni, C. Effect of reprocessing
on the fatigue strength of a fiberglass reinforced polyamide. Composites Part A,
2007, 38, 710-718.
27. Bijwe, J., Indumathi, J., John Rajesh, J., and Fahim, M. Friction and wear
behaviour of polyetherimide composites in various wear modes. Wear, 2001, 249,
715-726.
28. Briscoe, B. Wear of polymers: An essay of fundamental aspects. Tribology
International, 1981, 14, 231-243.
29. Briscoe, B.J., and Evans, P.D. The influence of asperity deformation conditions
on the abrasive wear of γ-irradiated polytetrafluoroethylenes. Wear, 1989, 133,
47-64.
30. Bundisnki, K.G. Resistance to particle abrasion of selected plastics. Wear, 1997,
203-204, 302-309.
31. Bureau, M.N., and Denault, J. Fatigue resistance of continuous glass
fiber/polypropylene composites: consolidation dependence. Composites Science
and Technology, 2004, 64, 1785-1794.
32. Camanho, P.P., and Matthews, F.L. Stress analysis and strength prediction of
mechanically fastened joints in FRP: A review. Composites Part A, 1997, 28,
529-547.
33. Carlsson, L.A., Aronsson, C.G., and Backlund, J. Notch sensitivity of thermoset
and thermoplastic laminates loaded in tension. Journal of Material Science, 1989,
24, 1670-1682.
34. Carwalho, W.S., and Rosario Bretas, E.S. Thermoplastic/carbon fibre
composites: Correlation between interphase morphology and dynamic mechanical
properties. European Polymer Journal, 1990, 26, 817-821.
TH-978_06610302
211
35. Casado, J.A., Carrascal, I., Polanco, J.A., and Gutierrez-Solana, F. Fatigue
failure of short glass fibre reinforced PA 66 structural pieces for railway track
fasteners. Engineering Failure Analysis, 2006, 13,182-197.
36. Cenna, A., Allen, S., Page, N.W., and Dastoor, P. Modeling the three-body
abrasive wear of UHMWPE particle reinforced composites. Wear, 2003, 254,
581-588.
37. Challa, S.R., and Progelhof, R.C. A study of creep and creep rupture of
polycarbonate. Polymer Engineering and Science, 1995, 6, 546-554.
38. Chandra, R., Singh, S.P., and Gupta, K. Damping studies in fiber-reinforced
composites – A review. Composite Structures, 1999, 46, 41-51.
39. Chandradass, J., Ramesh Kumar, M., and Velmurugan, R. Effect of nanoclay
addition on vibration properties of glass fibre reinforced vinyl ester composites.
Materials Letters, 2007, 61, 4385-4388.
40. Chen, H.S. The static and fatigue strength of bolted joints in composites with
hygrothermal cycling. Composite Structures, 2001, 52, 295-306.
41. Chen, W.H., and Lee, S.S. Numerical and experimental failure analysis of
composite laminates with bolted joints under bending loads. Journal of Composite
Materials, 1995, 29, 15-36.
42. Chen, W.H., Lee, S, S., and Yeh, J.T. Three-dimensional contact stress analysis
of a composite laminate with bolted joint. Composite Structures, 1995, 30,
287-297.
43. Chevali, V.S., Dean, D, R., and Janowski, G.M. Flexural creep behavior of
discontinuous thermoplastic composites: Non-linear viscoelastic modeling and
time–temperature-stress superposition. Composites: Part A, 2009, 40, 870-877.
44. Cirino, M., Pipes, B., and Friedrich, K. The abrasive wear behavior of
continuous fiber polymer composites. Journal of Materials Science, 1987, 22,
2481-2492.
45. Clerico, M., and Patierno, V. Sliding wear of polymeric composites. Wear, 1979,
53, 299-301.
46. Collings, T.A. The strength of bolted joints in multi-directional CFRP laminates.
Composites, 1977, 8, 46-55.
TH-978_06610302
212
47. Corvi, A. A preliminary approach to composite beam design using FEM
analysis. Composite Structures, 1990, 16, 259-275.
48. Crawford, R.J. Plastics Engineering, 1998 (Butterworth Heinemann, Oxford).
49. Crema, L.B., Castellani, A., and Serra, A. Experimental tests for damping
measurement on several short glass fiber composites. Journal of Composite
Materials, 1989, 23, 978-987.
50. Crews, J. Bolt bearing fatigue of a graphite/epoxy laminate. ASTM STP 749,
1981, 131-44.
51. Croce, P., Pietro Orsini, and Walter Salvatore. Vibration isolation and design of
automotive test benches. Engineering Structures, 2001, 23, 945-956.
52. Czigany, T., and Karger-Kocsis, J. Comparison of the failure mode in short and
long glass fiber-reinforced injection-molded polypropylene composites by acoustic
emission. Polymer Bulletin, 1993, 31,495-501.
53. Dally, J.W., and Carrillo, D.H. Fatigue behavior of glass-fiber fortified
thermoplastic. Polymer Engineering and Science, 1969, 9, 434-444.
54. Daughtery, R.L. Composite leaf springs in heavy truck applications. In:
Proceedings of Composite Materials, Japan-US Conference, Tokyo, 1981,
pp.529-538.
55. Deaver, D., and MCllvaine, J. Use of structural long glass fiber composites to
replace steel in automotive running boards. SAE International, 2005,
Doc No: 1679.
56. Dwivedi, U.K., and Navin Chand. Influence of MA-g-PP on abrasive wear
behaviour of chopped sisal fibre reinforced polypropylene composites. Journal of
Materials Processing Technology, 2009, 209, 5371-5375.
57. Eberle, A.P.R., Baird, D.G., and Wapperom, P. Modeling the transient rheology
of a polypropylene melt reinforced with long and short glass fibers. In:
Proceedings of AIChE Annual Meeting, Cincinatti, 2005, pp.1-5.
58. Ferreira, J.A.M., Costa, J.D.M., Reis, P.N.B., and Richardson, M.O.W.
Analysis of fatigue and damage in glass-fibre-reinforced polypropylene composite
materials. Composites Science and Technology, 1997, 59, 1461-1467.
TH-978_06610302
213
59. Findley, W.N., and Khosla, G. Application of the superposition principle and
theories of mechanical equation of state, strain, and time hardening to creep of
plastics under changing loads. Journal of Applied Physics, 1955, 26, 821–832.
60. Fouad, H. Experimental and numerical studies of the notch strengthening
behaviour of semi-crystalline ultra-high molecular weight polyethylene. Materials
and Design, 2009, 31, 1117-1129.
61. Fuentes, J.J., Aguilar, H.J., Rodríguez, J.A., and Herrera, E.J. Premature
fracture in automobile leaf springs. Engineering Fracture Analysis, 2008, 45,
3025-3035.
62. Gamstedt, K.E., Berglund, L.A., and Peijs, T. Fatigue mechanisms in
unidirectional glass-fibre-reinforced polypropylene. Composites Science and
Technology, 1999, 59, 759-768.
63. Gassan, J., and Bledzki, A.K. Possibilities to improve the properties of natural
fiber reinforced plastics by fiber modification-jute polypropylene composites.
Applied Composite Materials, 2000, 7, 373-385.
64. Genta, G. Vibration of Structures and Machines, 1990 (Springer Verlag,
Newyork).
65. Giltrow, J.P. A relationship between abrasive wear and the cohesive energy of
materials. Wear, 1969, 15, 71-79.
66. Godwin, E.W., Matthews, F.L., and Kilty, P.F. Strength of multi-bolt joints in
GRP. Composites, 1982, 13, 268-272.
67. Goel, A., Chawla, K.K., Vaidya, U.K., Chawla, N., and Koopman, M.
Characterization of fatigue behavior of long fiber reinforced thermoplastic (LFT)
composites. Materials Characterization, 2008, 60, 537-544.
68. Gong, G., Xie, B.H., Yang, W., Li, Z.M., Lai, S.M., and Yang, M.B. Plastic
deformation behavior of polypropylene / calcium carbonate composites with and
without maleic anhydride grafted polypropylene incorporated using the essential
work of fracture method. Polymer Testing, 2006, 25, 98-106.
69. Graham, R. Strategies for failure analysis. Advanced Material Process, 2004,
162, 45–49.
TH-978_06610302

214
70. Grant, P., and Sawicki, A. Bearing fatigue and hole elongation in composite
bolted joints. In: Proceedings of 49th annual forum of the American helicopter
society, St.Louis, 1993, pp.163-170.
71. Greco, A., Claudio Musardo, and Alfonso Maffezzoli. Flexural creep behaviour
of PP matrix woven composite. Composites Science and Technology, 2007, 67,
1148-1158.
72. Gu, W., Wu, H.F., Kampe, S.L., and Lu, G.Q. Volume fraction effects on
interfacial adhesion strength of glass-fiber-reinforced polymer composites.
Material Science Engineering A, 2000, 277, 237-243.
73. Gupta, B.V., and Lahiri, J. Non-linear viscoelastic behavior of polypropylene
and glass reinforced polypropylene in creep. Journal of Composite Materials,
1980, 14, 288-296.
74. Gupta, V.B., Mittal, R.K., and Malti, G. Energy absorbing mechanisms in short
glass fiber reinforced polypropylene. Composite Science and Technology, 1990,
37, 353-368.
75. Guynn, E.G., and Bradley, W.L. Measurements of the stress supported by the
crush zone in open hole composite laminates loaded in compression. Journal of
Reinforced Plastics and Composites, 1989, 8, 133-149.
76. Hadi, A.S., and Ashton, J.N. Measurement and theoretical modeling of the
damping properties of a unidirectional glass/epoxy composite. Composite
Structures, 1996, 34, 381-385.
77. Hadid, M., Rechak, S., and Tati, A. Long-term bending creep behavior prediction
of injection molded composite using stress-time correspondence principle.
Materials Science and Engineering A, 2004, 385, 54-58.
78. Hadid, M., Rechak, S., and Zouani, A. Empirical non-linear viscoelastic model
for injection molded thermoplastic composite. Polymer Composites, 2002, 23,
771-778.
79. Harris, B., Braddel, O., Almond, D., Lefebure, C., and Verbic, J. Study of
carbon fiber surface treatment by dynamic mechanical analysis. Journal of
Material Science, 1993, 28, 3353-3366.
TH-978_06610302
215
80. Harsha, A.P., and Tewari, U. S. Tribo performance of polyaryletherketone
composites. Polymer Testing, 2002, 21, 697-709.
81. Harsha, A.P., and Tewari, U.S. Two-body and three-body abrasive wear
behaviour of polyaryletherketone composites. Polymer Testing, 2003, 22, 403-418.
82. Hashin, Z. Complex moduli of viscoelastic composites: I. General theory and
application to particulate composites. International Journal of Solids and
Structures, 1970, 6, 539-552.
83. Hashmi, S.A.R., Somit, N., Anuradha, P., and Navinchand. Sliding wear of
PP/UHMWPE blends: effect of blend composition. Wear, 2001, 247, 9-14.
84. Haynes. Calculation and Design of Metal Spring, 3rd edition, 1966 (Chapman and
Hall, London).
85. Helen, C.Y., Cartledge Caroline Baillie, and Yiu-Wing Mai. Friction and wear
mechanisms of a thermoplastic composite GF/PA6 subjected to different thermal
histories. Wear, 1996, 94, 178-184.
86. Herrera, E.J., Soria, L., and Gallardo, J.M. Ingenieria Forense (Diagnosis de
fallos), Anales De Mecánica De La Fractura, 2004, 21, 21-27.
87. Hou, J.P., Cherruault, J.Y., Jeronimidis, G., and Mayer, R. Design, testing and
simulation of fibre composite leaf springs for heavy axle load. The Journal of
Strain Analysis for Engineering Design, 2005, 40, 497-504.
88. Hou, J.P., Cherruault, J.Y., Jeronimidis, G., Mayer, R., and Chvojan. J.
Testing of fibre composite leaf spring for heavy axle loads. Journal of
Thermoplastic Composite Materials, 2010, DOI: 10.1177/0892705709096552.
89. Houshyar, S., Shanks, R.A., and Hodzic, A. Tensile creep behavior of
polypropylene fibre reinforced polypropylene composites. Polymer Testing, 2005,
24, 257-264.
90. Huth, H. Influence of fastener flexibility on the prediction of load transfer and
fatigue life for multiple-row joints, fatigue in mechanically fastened composite and
metallic joints. ASTM STP 927, Philadelphia, 1986, 221-250.
TH-978_06610302
216
91. Imihezri, S.S.S., Sapuan, S.M., Hamdan, M., and Sulaiman, S. A study on
comparison of V and X ribbings for polymeric based composite automotive clutch
pedal using mould flow analysis software. Materials and Design, 2005, 26,
157-166.
92. Ireman, T., Nyman, T., and Hellbom, K. On design methods for bolted joints in
composite aircraft structures. Composite Structures, 1993, 25, 567-578.
93. Jaydeep Khedkar., Negulescu, I., and Meletis,E.I. Sliding wear behaviour of
PTFE composites.Wear,2002,253,361-369.
94. Jeng, C.C., and Chen, M. Flexural failure mechanisms in injection - moulded
carbon fibre/PEEK composites. Composites Science and Technology, 2000, 60,
1863-1872.
95. Joseph, P.V., Mathew, G., Joseph, K., Groeninckx, G., and Thomas, S.
Dynamic mechanical properties of short sisal fibre reinforced polypropylene
composites. Composites Part A: Applied Science and Manufacturing, 2003, 34,
275-290.
96. Kanagaraj, S., Mathew, M.T., Fonseca, A., Oliveira, M.S.A., Simoes, J.A.O.,
and Rocha, L.A. Tribological characterization of carbon nanotubes/ultrahigh
molecular weight polyethylene composites: the effects of sliding distance.
International Journal of Surface Science and Engineering, 2010, 4, 305-321.
97. Karakuzu, R., Taylak, N., Icten, B.M., and Aktas, M. Effects of geometric
parameters on failure behavior in laminated composite plates with two parallel pin-
loaded holes. Composite Structures, 2008, 85, 1-9.
98. Karger-Kocsis, J., and Friedrich, K. Fatigue crack propagation in short and long
fibre-reinforced injection-molded PA6, 6 composites. Composites, 1988, 19,
105-114.
99. Karger-Kocsis, J., Felhos, D., and Xu, D. Mechanical and tribological properties
of rubber blends composed of HNBR and in situ producedpolyurethane. Wear,
2010, 68, 467-472.
100. Karian, H.G. In: Proceedings of the 46th Conference of the SPI, Newyork, 1999.
TH-978_06610302
217
101. Kenny, J.M., and Marchetti, M. Elasto-plastic behavior of thermoplastic
composite laminates under cyclic loading. Composite Structures, 1995, 32,
375-382.
102. Khashaba, U.A., Sallam, H. E.M., Al-Shorbagy, A.E. and Seif, M.A. Effect of
washer size and tightening torque on the performance of bolted joints in composite
structures. Composite Structures, 2006, 73, 310-317.
103. Kim, H.C., Glenn, L.W., Ellis, C.S., and Miller, D.E. Selecting long-glass
fiber/thermoplastics for creep resistance. Plastic Engineering, 1997, 53, 39-40.
104. Kim, T., Moon, W., and Kim, S. Inflence of leaf shapes on performance of
progressive multi-leaf springs. Journal of Vehicle Design, 2004, 34, 65-83.
105. Klass, N.V., Mracus, K., and Kellock, C. The tribological behaviour of glass
filled Polytetrafluoroethylene. Tribology International, 2005, 38, 824-833.
106. Klug, P.H., and Alexander, L.E. X-Ray Diffraction Procedures: For
Polycrystalline and Amorphous Materials, 1974 (Wiley-Interscience, Newyork).
107. Krause, W., Henning, F., Troster, S., Geiger, O., and Eyerer, P. LFTD - A
process technology for large scale production of fiber reinforced thermoplastic
components. Journal of Thermoplastic Composite Materials, 2003, 16, 289-302.
108. Kretsis, G., and Matthews, F.L. The strength of bolted joints in glass fiber /epoxy
laminates. Composites, 1985, 16, 92-102.
109. Krishnaswamy, R.K. Analysis of ductile and brittle failures from creep rupture
testing of high-density polyethylene (HDPE) pipes. Polymer, 2005, 28,
11664 -11672.
110. Kubat, J., Rigdahl, M., and Welander, M. Characterization of interfacial
interactions in high density polyethylene filled with glass spheres using dynamic
mechanical analysis. Journal of Applied Polymer Science, 1990, 39, 1527-1539.
111. Kultural, S.E., and Eryurek, I.B. Fatigue behavior of calcium carbonate filled
polypropylene under high frequency loading. Materials and Design, 2007, 28,
816-823.
112. Lancaster, J.K. Abrasive wear of polymers. Wear, 1969, 14, 223-239.
TH-978_06610302

218
113. Landro, L.D., and Lorenzi, W. Mechanical properties and dynamic mechanical
analysis of thermoplastic-natural fiber/glass reinforced composites.
Macromolecullar Symposia, 2009, 286, 145-155.
114. Lee, I., Kim, B, N., and Koo, K.N. Dynamic characteristics of thermoplastic
composite laminates. Composites, 1994, 25, 281-286.
115. Leevy, G., and Khoa Cao. Evaluation of a multi-leaf hybrid springs for
automotive suspensions. SAE Paper series, 2004, Doc No: 2004-01-0782.
116. Lhymn, C., Tempelmeyer, K.E., and Davis, P.K. The abrasive wear of short
fibre composites. Composites, 1985, 16, 127-136.
117. Lim, T.S., Kim, B.C., and Lee, D.G. Fatigue characteristics of the bolted joints
for unidirectional composite laminates. Composite Structures, 2006, 72, 58-68.
118. Lin, H., Ma, C.C.M., and Tai, N.H. Long fiber reinforced polyamide
polycarbonate composites. I: Fatigue behavior and morphological study. Journal
of Vinyl & Additive Technology, 1996, 2, 80-86.
119. Liou, W.J., and Tseng, C.I. Creep behavior of nylon-6 thermoplastic composites.
Polymer Composites, 1997, 18, 492-499.
120. Liu, H., Polak, M.A., and Penlidis, A. A practical approach to modeling time-
dependent nonlinear creep behavior of polyethylene for structural applications.
Polymer Engineering Science, 2008, 48, 159-167.
121. Lo, K.H., Mccusker, J.J., and Gottenberg, W.G. Composite leaf spring for tank
trailer suspensions. Journal of Reinforced Plastics and Composites, 1987, 6,
100-112.
122. Lu, Z.P., and Friedrich, K. On sliding friction and wear of PEEK and its
composites. Wear, 1995, 181-183, 324-631.
123. Luscher, A., and Houser, D. An investigation of the geometry and transmission
error of injection molded gears. Journal of Injection Molding Technology, 2000, 4,
177-190.
124. Mallick, P. Composites Engineering Handbook, 1997 (CRC Press, Newyork).
125. Mandell, J.F., and Chevaillier, J.P.F. Craze initiation, crack growth, and lifetime
trends in fatigue of poly (vinylch1oride). Polymer Engineering and Science, 1985,
3, 170-177.
TH-978_06610302

219
126. Mandell, J.F., Huang, D. D., and McGarry, F.J. Fatigue of glass and carbon
fiber reinforced engineering thermoplastics. Polymer Composites, 1981, 2,
137-144.
127. Manson, J.A., Hertzberg, R.W., Kim, S.L., and Skibi, M. The β transition and
frequency sensitivity in fatigue crack propagation of polymers. Polymer, 1975, 16,
850-851.
128. Mantena, P.R., Vaughan, J.G., Donti, R.P., and Kowsika, M.V. Influence of
process variables on the dynamic characteristics of pultruded graphite-epoxy
composites In: Proceedings of the Vibro-Acoustic Characterization of Materials
and Structures, ASME , 1992, pp.147-154.
129. Markarian, J. Long fibre reinforcement drives automotive market forward.
Plastics, Additives and Compounding, 2005, 7, 24-29.
130. Marshall, D.F. Long-fibre reinforced thermoplastics. Materials & Design, 1987,
8, 77-81.
131. Martin, G.C., and Gerberich, W.W. Temperature effects on fatigue crack growth
in polycarbonate. Journal of Materials Science, 1976, 11, 231-238.
132. Mascarenhas, W.N., Ahreens, C.H., and Ogliari, A. Design criteria and safety
factors for plastic components design. Materials and Design, 2004, 25, 257-261.
133. Mathew, M.T., Padaki, V., Alagirusamy, R., Deopura, B.L., Fangueiro, R.,
Rocha, L.A., and Gomes, J.R. Tribological behaviour of multilayered textile
composites: The effect of reciprocating sliding frequency. Wear, 2009, 267, 26-33.
134. Mathew, M.T., Padaki, V., Rocha, L.A., Gomes, J.R., Alagirusamy, R.,
Deopura, B.L., and Fangueiro, R. Tribological properties of the directionally
oriented warp knit GFRP composites. Wear, 2007, 263, 930-938.
135. McCarthy, C.T., McCarthy, M.A., and Lawlor, V.P. Progressive damage
analysis of multi-bolt composite joints with variable bolt-hole clearances.
Composites Part B, 2005, 36, 290-305.
136. Mcgee, A.C., Dharan, C.K.H., and Finnie, I. Abrasive wear of graphite fiber-
reinforced polymer composite materials. Wear, 1997, 114, 97-107.
137. Menard, K.P. Dynamic Mechanical Analysis: A Practical Introduction, 1999
(CRC Press, Florida).
TH-978_06610302
220
138. Mergler, Y.J., Schaake, R.P., and Huis Veld, A.J. Material transfer of POM in
sliding contact. Wear, 2004, 256, 294-301.
139. Moisa, S., Landsber, G., Rittel, D., and Halary, J.L. Hysteretic thermal behavior
of semi-aromatic polyamides. Polymer, 2005, 46, 11870 -11875.
140. Morris, C.J. Composite integrated rear suspension. Composite Structures, 1986,
5, 233-242.
141. Mukhopadhyay, N.K., Das, S.K., Ravikumar, B., Ranganath, V.R., and Ghosh
chowdhury, S. Premature failure of a leaf spring due to improper material
processing. Engineering Fracture Analysis, 1997, 4, 161-170.
142. Mutoh, Y., Tanaka, K., and Takeda, K. Fretting fatigue of automotive leaf
spring. In: Proceeding of International Conference on the Fatigue of Engineering
Materials and Structures, Institution of Mechanical Engineers, London, 1986,
pp.203-210.
143. Myshkin, N.K., Petrokovets, M.I., and Kovalev, A.V. Tribology of polymers:
Adhesion, friction, wear, and mass-transfer. Tribology International, 2005, 38,
910-921.
144. Naik, R.A., and Crews, J.H. Stress analysis method for a clearance-fit bolt under
bearing loads. AIAA Journal, 1986, 24, 1348–1353.
145. Nelson, D.J. Dynamic testing of discontinuous fiber reinforced composite
materials. Journal of Sound and Vibration, 1979, 64, 403-419.
146. Nelson, D.J., and Hancock, J.W. Interfacial slip and damping in fiber-reinforced
composites. Journal of Material Science, 1978, 13, 2429-2440.
147. Ning, H., Uday Vaidya, Janowski, G.M., and George Husman. Design,
manufacture and analysis of a thermoplastic composite frame structure for mass
transit. Composite Structures, 2007, 80, 105-116.
148. Noh, W.J., Choi, M.H., and Chihoon Choi. Development of a door shield
module plate with long-fiber-reinforced thermoplastic polypropylene. SAE
International, 2006, Doc No: 2006-01-0330.
149. Okutan, B. The effects of geometric parameters on the failure strength for pin-
loaded multi-directional fiber-glass reinforced epoxy laminate. Composites Part-B,
2002, 33, 567-578.
TH-978_06610302

221
150. Orth, F., Hoffmann, L., Zilch-Bremer, H., and Ehrenstein, G.W. Evaluation of
composites under dynamic load. Composite Structures, 1993, 24, 265-272.
151. Owei, O. S., and Schipper, D.J. Tribological behaviour of unfilled and composite
polyoxymethylene. Wear, 1991, 148, 363-376.
152. Pakdil, M., Sen, F., Sayman, O., and Benli, S. The effect of preload on failure
response of glass epoxy laminated composite bolted-joints with clearance. Journal
of Reinforced Plastics and Composites, 2007, 26, 1239-1252.
153. Palabiyik, M., and Bahadur, S. Tribological studies of polyamide 6 and high-
density polyethylene blend filled with PTFE and copper oxide and reinforced with
glass fibres. Wear, 2002, 25, 369-376.
154. Park, B.D., and Balatinecz, J.J. Short term flexural creep behavior of wood
fiber/polypropylene composites. Polymer Composites, 1998, 19, 377-382.
155. Pegoretti, A., and Ricco, T. Creep crack growth in a short glass fibres reinforced
polypropylene composite. Journal of Material Science, 2001, 19, 4637-4641.
156. Peterson, R.E. Design Factors for Stress Concentration, 1951 (Penton
Publication, Belfast).
157. Pinnell, M.F. An examination of the effect of composite constituent properties on
the notched strength performance of composite materials. Composites Science and
Technology, 1996, 56, 1405-1413.
158. Prabhakaran, E.M., Nair, S., and Sinha, P.K. Notch sensitivity of polymers.
Journal of Applied Polymer Science, 2003, 22, 3011-3020.
159. Purslow, D. Fractography of fiber-reinforced thermoplastics, Part3. Tensile,
compressive and flexural failures. Composites, 1988, 19, 358-366.
160. Rabinowicz, E. Friction and Wear of Materials, 1995 (John Wiley & sons,
New York).
161. Rajeesh, K. R., Gnanamoorthy, R., and Velmurugan, R. Effect of humidity on
the indentation hardness and flexural fatigue behavior of polyamide 6
nanocomposite. Material Science and Engineering A, 2010, 527, 2826-2830.
162. Rajendran, I., and Vijayarangan, S. Optimal design of a composite leaf spring
using genetic algorithms. International Journal of Computers and Structures,
2001, 79, 1121-29.
TH-978_06610302
222
163. Ratner, S.B., Ferberova, I., Radyukevich, O.V., and Lure, E.G. Connection
between wear resistance of plastics and other mechanical properties. Abrasion of
Rubber, 1967, 12, 7-17.
164. Rezaei, F., Yunus, R., and Ibrahim, N.A. Effect of fiber length on thermo
mechanical properties of short carbon fiber reinforced polypropylene composites.
Materials and Design, 2009, 30, 260-263.
165. Rittel, D., Eliasha, N., and Halaryb, J.L. Hysteretic heating of modified poly
methylmethacrylate. Polymer, 2003, 44, 2817-2822.
166. Rosato, D.V., Rosato, D.V., and Rosato, M.G. Plastic Design Handbook, 2000
(Kluwer Academic Publishers, Boston).
167. Rowlands, R.E., Rahman, M.U., Wilkinson, T.L., and Chiang, Y.I. Single and
multiple bolted joints in orthotropic materials. Composites, 1982, 13, 273-279.
168. Ruland, W. Free vibrations of viscoelastic materials with high damping. Colloid
and Polymer Science, 1984, 262, 387-396.
169. SAE HS-78. Manual on Design and Application of Leaf Springs, 1996 (SAE
International, PA, USA).
170. SAE J 1528. Fatigue Testing Procedure for Suspension Leaf Springs, 1990 (SAE
International, PA, USA).
171. Sancaktar, E., and Gratton, M. Design analysis and optimization of composite
leaf springs for light vehicle applications. Composite Structures, 1999, 44,
195-204.
172. Santika, P., Wiyono, D., and Subagyo, H. Durability testing of leaf spring and
shock absorber. SAE Paper series, 1987, Doc No: 871284.
173. Sato, N., Kurauchi, T., and Kamigaito, O. Material improvement and quality
assurance for composite leaf springs based on micro fracture mechanism. Journal
of Composite Materials, 1992, 26, 1240-1253.
174. Sauer, J.A., and Richardson, G.C. Fatigue of polymers. International Journal of
Fracture, 1980, 16, 499-532.
175. Saunders, D.S., Galea, S.C., and Diermendjian, G.K. The development of
fatigue damage around fastener holes in thick graphite/epoxy composite laminates.
Composites, 1993, 24, 309-321.
TH-978_06610302
223
176. Saurez, S.A., Gibson, R.F., Sun, C.T., and Chaturvedi, S.K. The influence of
fiber length and fiber orientation on damping and stiffness of polymer composite
materials. Experimental Mechanics, 1986, 26, 175-184.
177. Scalea, L.D.F., Cappello, F., and Cloud, G.L. On the elastic behavior of a cross-
ply composite pin-joint with clearance fits. Journal of Thermoplastic Composite
Materials, 1999, 12, 13-22.
178. Sefrani, Y., and Jean-Marie Berthelot. Temperature effect on the damping
properties of unidirectional glass fibre composites. Composites Part-B, 2006, 37,
346-355.
179. Senthilvelan, S., and Gnanamoorthy, R. Damping characteristics of
unreinforced, glass and carbon fiber reinforced nylon 6/6 spur gears. Polymer
Testing, 2006, 25, 56-62.
180. Sepe, M.P. Use of advanced characterization techniques in evaluating the fitness-
for-use of long-glass fiber thermoplastics: San Francisco, 1994, pp.2029-2032.
181. Seungwon Yoo, Jongchan Park and Junghwan Lim. Fatigue strength evaluation
for the leaf spring of commercial vehicle considering u bolt fixing force.
Modeling, Identification and Control, 2007, Doc No: 2007-01-0853.
182. Shankar, G. S. S., and Vijayarangan, S. Mono composite leaf spring for light
vehicle-design, end joint analysis and testing. Material Science, 2006, 12,
220-225.
183. Shokrieh, M.M., and Davood Rezaei. Analysis and optimization of a composite
leaf spring. Composite Structures, 2003, 9, 317-325.
184. Silverman, E.M. Effect of glass fiber length on the creep and impact resistance of
reinforced thermoplastics. Polymer Composites, 1987, 8, 8-15.
185. Simoes, J.A.O. Icarus: the design process of a conceptual vehicle. Materials and
Design, 2001, 22, 251-257.
186. Siswosuwarno, M., Kusalamwardi, H., and Kusuma, G. Influence of shot-
peening on the surface microstructure of leaf spring. SAE Paper series, 1985,
Doc No: 852227.
187. Sole, B.M., and Ball, A. On the abrasive wear behavior of mineral filled
polypropylene. Tribology International, 1996, 29, 457-465.
TH-978_06610302
224
188. Srinath, G., and Gnanamoorthy, R. Effect of short fibre reinforcement on the
friction and wear behavior of nylon 66. Applied Composite Materials, 2005, 12,
369-383.
189. Srinath, G., and Gnanamoorthy, R. Two-body abrasive wear characteristics of
nylon clay nanocomposites-effect of grit size, load, and sliding velocity. Materials
Science and Engineering A, 2006, 435, 181-186.
190. Srivastava, V.K., and Pathak, J.P. Friction and wear properties of bushing
bearing of graphite filled short glass composites in dry sliding. Wear, 1996, 197,
145-150.
191. Stachowaik, G.W., and Batchelor, A.W. Engineering Tribology, 2001,
(Butterworth-Heinemann, Boston).
192. Stockdale, J.H., and Matthews, F.L. The effect of clamping pressure on bolt
bearing loads in glass fiber reinforced plastics. Composites, 1976, 7, 34-38.
193. Straikov, R., and Schon, J. Experimental study on fatigue resistance of composite
joints with protruding - head bolts. Composite Structures, 2002, 55, 1-11.
194. Straikov, R., and Schon, J. Quasi-static behaviour of composite joints with
protruding-head bolts. Composite Structures, 2001, 51, 411-425.
195. Sugimoto, T., and Sasaki, Y. Fatigue of structural plywood under cyclic shear
through thickness III: Energy dissipation performance. Journal of Wood Science,
2007, 54, 169-173.
196. Sugiyama, H., Ahmed, A., Shabana Mohamed, Omar, A., and Wei-Yi Loh.
Development of nonlinear elastic leaf spring model for multibody vehicle systems.
Computer Methods in Applied Mechanics and Engineering, 2005, 195, 6925-6941.
197. Sun, H.T., Chang, F.K., and Qing, X. The response of composite joints with bolt-
clamping loads, part II: Model verification. Journal of Composite Materials, 2002,
36, 69-92.
198. Suresha, B., Chandramohan, G., Samapthkumaran, P., and Seetharamu, S.
Three-body abrasive wear behaviour of carbon and glass fiber reinforced epoxy
composites. Materials Science and Engineering: A, 2007, 443, 285-291.
TH-978_06610302

225
199. Swanson, S.R., Cairns, D.S., Guyll, M.E., and Johnson, D. Compression fatigue
response for carbon fiber with conventional and toughened epoxy matrices with
damage. Transaction of ASME Journal of Engineering Material and Technology,
1993, 115, 116-121.
200. Talib, A., Ali, A., Goudah, G., Lah, N.A.C., and Golestaneh, A.F. Developing a
composite based elliptic spring for automotive applications. Materials and Design,
2010, 31, 475-484.
201. Tanabe, K., Seino, T., and Kajio, Y. Characteristics of carbon/glass fiber
reinforced plastic leaf spring. In: Proceedings of SAE International Congress and
Exposition, Detroit, 1982, pp.1628-1634.
202. Tanaka, K., Mutoh, Y., Sakoda, S., and Leadbeater, G. Fretting fatigue in
0.65C spring steel and 0.45C carbon steel. Fatigue and Fracture of Engineering
Materials and Structures, 1985, 8, 129-142.
203. Thattaiparthasarathy, B.K., Pillay, S., Ning, N.S., and Vaidya, U.K. Process
simulation, design and manufacturing of a long fiber thermoplastic composite for
mass transit application. Composites, 2008, 39, 1512-1521.
204. Theren, K., and Lundin, A. Advanced composite materials for road vehicles.
Materials & Design, 1990, 11, 71-75.
205. Thomason, J.L. The influence of fiber length and concentration on the properties
of glass fibre reinforced polypropylene: 5. Injection moulded long and short fibre
PP. Composites Part A, 2002, 33, 1641-1652.
206. Thomason, J.L., and Groenewoud, W.M. The influence of fibre length and
concentration on the properties of glass fibre reinforced polypropylene: 2 Thermal
properties. Composites Part A, 1996, 27, 555-565.
207. Thomason, J.L., and Vlug, M.A. Influence of fibre length and concentration on
the properties of glass fibre-reinforced polypropylene: 1.Tensile and flexural
modulus. Composites Part A, 1995, 27, 477-484.
208. Thoppul, S.D., Finegan, J., and Gibson, R.F. Mechanics of mechanically
fastened joints in polymer- matrix composite structures-A review. Composites
Science and Technology, 2009, 69, 301-329.
TH-978_06610302
226
209. Throp, J.M. Friction of some commercial polymer-based bearing material against
steel. Tribology International, 1982, 15, 69-74.
210. Todinov, M.T. Residual stresses at the surface of automotive suspension springs.
Journal of Materials Science, 2000, 35, 3313-3320.
211. Tong, J., Ma, J., and Jiang, M. Effects of the wollastonite fiber modification on
the sliding wear behavior of UHMWPE composites. Wear, 2003, 255, 734-741.
212. Twintex Product Data Sheet. Long fiber thermoplastic pellets, 2005 (Saint
Gobain Vetrotex America Inc, USA).
213. Unal, H., Mimaroglu, A., Kadioglu, U., and Ekiz, H. Sliding friction and wear
behaviour of polytetrafluoroethylene and its composites under dry conditions.
Materials and Design, 2004, 25, 239-245.
214. Vaidya, U.K., Serrano, J. C., Villalobos, A., Sands, J., and Garner, J. Design
and analysis of a long fiber thermoplastic composite tailcone for a tank gun
training round. Materials & Design, 2008, 29, 305-318.
215. Valtorta, D.J., Lefevre, E., and Mazza. A new method for measuring damping in
flexural vibration of thin fibers. Experimental Mechanics, 2005, 45, 433-439.
216. Vaziri, M., Spurr, R.T., and Stott, F.H. An investigation of the wear of
polymeric materials. Wear, 1988, 122, 329-342.
217. Voss, H., and Friedrich, K. On the wear behaviour of short-fibre-reinforced
PEEK composites. Wear, 1987, 116, 1-18.
218. Vu-Khanh, T., Denault, J., Habib, P, and Low, A. The effects of injection
molding on the mechanical behavior of long–fiber reinforced PBT/PET blends.
Composites Science and Technology, 1991, 40, 423-435.
219. Warty, S., Sauer, J.A., and Charlesby, A. Effects of radiation and chain end on
fatigue behaviour of polystyrene. European Polymer Journal, 1979, 15, 445-452.
220. Wray, S., Ashton, J. N., and El-Sobky, H. An investigation of the influence of
anisotropy and frequency on damping in short glass fiber reinforced
polypropylene. Composite Structures, 1990, 15, 43-60.
221. Wyzgoski, M.G., and Novak, G.E. Fatigue fracture of long fiber reinforced nylon
66. Polymer Composites, 1995, 16, 38-51.
222. Yamada, Y. Materials for Leaf Springs, 2007 (Springer, Newyork).
TH-978_06610302
227
223. Yamaguchi, Y. Tribology of Plastic Materials, 1990 (Elsevier, Amsterdam).
224. Yavari, V., Rajabi, I., Daneshvar, F., and Kadivar, M. H. On the stress
distribution around the hole in mechanically fastened joints. Mechanics Research
Communications, 2009, 36, 373-380.
225. Yu, W.J., and Kim, H.C. Double tapered FRP beam for automobile suspension
leaf spring. Composite Structures, 1988, 9, 279-300.
226. Zainudin, E.S., Sapuan, S.M., Sulaiman, S., and Ahmad, M.M.H.M. Fiber
orientation of short fiber reinforced injection molded thermoplastic composites: A
review. Journal of Injection Moulding Technology, 2002, 6, 1-10.
227. Zhang, H., Zhang, Z., and Friedrich, K. Effect of fibre length on the wear
resistance of short carbon fibre reinforced epoxy composites. Composites Science
and Technology, 2006, 67, 222-230.
228. Zhang, Z., and Hartwig, G. Relation of damping and fatigue damage of
unidirectional fibre composites. International Journal of Fatigue, 2001, 24,
713-718.
229. Zhou, J., D’Amore, A., Yang, Y., He, T., Li, B., and Nicolais, L. Flexural
fatigue of short glass fiber reinforced a blend of polyphenylene ether ketone and
polyphenylene sulfide. Applied Composite Materials, 1994, 1, 183-195.
TH-978_06610302
228
LIST OF PUBLICATIONS BASED ON THE RESEARCH WORK
Refereed Journals
1. Subramanian, C., and Senthilvelan, S. Effect of fiber length on the friction and
wear of discontinuous fiber reinforced polypropylene material. International
Journal of Plastics Technology, 2008, 12, 863-875.
2. Subramanian, C., and Senthilvelan, S. Effect of reinforced fiber length on
hysteretic heating of discontinuous fiber reinforced polypropylene. International
Journal of Polymeric Materials, 2009, 58(7), 347-354.
3. Subramanian, C., and Senthilvelan, S. Development and preliminary
performance evaluation of discontinuous fiber reinforced thermoplastic leaf
spring. Journal of Materials: Design and Applications, Proc. of Ins. Mech. E
Part L, 2009, 223(3), 131-142.
4. Subramanian, C., and Senthilvelan, S. Abrasive behavior of discontinuous
fiber reinforced polypropylene material. Industrial Lubrication and Tribology,
2010, 62(4), 187-196.
5. Subramanian, C., and Senthilvelan, S. Effect of reinforced fiber length on the
joint performance of thermoplastic leaf spring. Materials and Design, 2010, 31,
3733-3741.
6. Subramanian, C., and Senthilvelan, S. Fatigue performance of discontinuous
fiber reinforced thermoplastic leaf spring. Journal of Materials: Design and
Applications, Proc. of Ins. Mech. E Part L, 2010, 224(3), 93-100.
7. Subramanian, C., and Senthilvelan, S. Joint Performance of glass fiber
reinforced polypropylene leaf spring. Composite Structures, 2011, 93(2), 759-
766.
8. Subramanian, C., and Senthilvelan, S. Effect of reinforced fiber length on the
creep performance of thermoplastic leaf spring. Journal of Applied Polymer
Science, 2011, 120(6), 3679-3686.
9. Subramanian, C., Sunil Balwant Deshpande and Senthilvelan, S. Effect of
reinforced fiber length on damping performance of thermoplastic composites.
Advanced Composite Materials (Accepted for Publication December, 2010).
TH-978_06610302
229
Presentations in Conferences
1. Sunil Balwant Deshpande, Subramanian, C., and Senthilvelan, S. Vibration
characteristics of thermoplastic composites, 1st International and 6th ISAMPE
National Conference on Composites (INCCOM), Indian Institute of Technology
Kanpur, December 12-14, 2007, pp. 535-539.
2. Subramanian, C., and Senthilvelan, S. Computer aided design of thermoplastic
composite leaf spring, International Conference on Computer Aided Engineering,
Indian Institute of Technology Madras, December 13-15, 2007, pp. 329-336.
3. Subramanian, C., and Senthilvelan, S. Friction and wear performance of long
and short fiber reinforced polypropylene, 6th International Conference on
Industrial Tribology (ICIT),Indian Oil R & D Centre, New Delhi, November 06-
08, 2008, CD Proceedings.
4. Subramanian, C., and Senthilvelan, S. Computer aided design of composite leaf
spring joint, National Conference on Industrial Problems in Machines and
Mechanisms (IPRoMM), Indian Institute of Technology Madras, July 10-11,
2009, pp. 149-156.
5. Subramanian, C., and Senthilvelan, S. Effect of material stiffness over joint
performance of thermoplastic composite leaf spring, 8th ISAMPE National
Conference on Composites (INCCOM), VSSC, Thiruvananthapuram, Dec 04-05,
2009, pp. 25-33.
TH-978_06610302
230
CURRICULUM VITAE
1. Name: C.SUBRMANIAN
2. Date of Birth: 23-08-1978
3. Permanent Address: S/o S. Chithambaram Pillai
Saraswathy Bhawan,
Door no: 71/9A/8D
4th street, Bharathi Nagar,
East Ramanputhoour
Nagercoil-2
Ph: 0-9944897007, 0-9444903847
Email:[email protected]
4. Educational Qualifications:
1995-1999 Bachelor of Engineering
Institution: Annamalai University
Chidambaram 608 002, India
Specialization: Mechanical and Production Engineering
1999-2000 Master of Engineering
Institution: Hindustan College of Engineering
Chennai, India
Specialization: Computer Aided Design
2006-2010
Doctor of Philosophy
Institution: Indian Institute of Technology Guwahati
Guwahati 781039, India
Registration Date: 25-07-2006
Thesis Submission Date: 08-10-2010
TH-978_06610302

231
DOCTORAL COMMITTEE
Guide: Dr. S. Senthilvelan
Associate Professor
Department of Mechanical Engineering
Chairperson: Prof. Debabrata Chakraborty
Professor and Head
Department of Mechanical Engineering
Members: Prof. Sashindra K. Kakoty
Professor
Department of Mechanical Engineering
Dr. G. Pugazhenthi
Assistant Professor
Department of Chemical Engineering
TH-978_06610302