design, develop, deploy and maintenance of surveying ... · pdf filedesign, develop, deploy...
TRANSCRIPT
1
Terms of Reference
For
Design, develop, deploy and maintenance of Surveying Functions System (Phase I)–
(ICTA/GOSL/CON/QCBS/2016/157)
1. Introduction
The affairs related to private and state owned lands are usually handled by various government
organizations. The Ministry of Lands of the central government, Department of Land
Commissioner General, Registrar General’s Department, Survey Department, Department of Land
Title Settlement, Valuation Department, Land and Agriculture Ministries of Provincial Councils,
Provincial Land Commissioner’s Department, Local Government Institutions and Divisional
Secretariats are the prominent organizations which handle state land matters. The Ministry of
Lands has implemented a re-engineering study to increase the efficiency of the citizen service
delivery mechanism of the land management activities among the various government institutions
which are responsible for private and government lands in Sri Lanka. In this endeavour The
Ministry of Lands is working with a number of government organizations as stated above mainly
focusing on Bim Saviya program.
2. Background
The Ministry of Lands is the central government organization with the authority relating to land
matters in Sri Lanka. Further, Land Commissioners General Department, Survey Department,
Land Title Settlement Department and Registrar General’s Department are central government
institutions which are mandated to work on private and public lands Sri Lanka. The Ministry of
Lands has implemented a re-engineering study to increase the efficiency of the citizen service
delivery mechanism of the land management activities relating to Bim Saviya program. In this
endeavour The Ministry of Lands is working with a number of government organizations as stated
above. In order to overcome many issues related to Bim Saviya Program The Ministry of Lands
conducted the Re-engineering study by covering all the organizations and a set of re-engineered
processes have been established at this moment. Further a software requirement study has been
conducted based on the re-engineered processes and a detailed requirement specification has been
finalized with the participation of all the institutions.
3. Concise statement of the objectives
This project intends to develop Processes such as AA2/3, BA1/2/4/5/6/7/8/9, CA11/12/13/14,
CA21/22/23, DA1/2/3 and EA1/2/3/4 of the re-engineered land management processes. Hence
this project intends,
a) To prepare a requirement specification for the new processes based on the Re-engineered
process report and the addendum.
b) To develop a solution that is capable to work as per the re-engineered processes (Refer
4.17)
c) To deploy the solution in the Lanka Government Cloud and integrate with the existing
2
eLH processes.
d) To train the users of all offices of related organizations as trainers.
e) To link the solution with proposed/on going Parcel Fabric Information System.
4. Scope of Work
4.1 Conduct a system requirement verification study of the processes.
4.2 On completing the above, submit a requirement verification report.
4.3 Design and develop the system, upon obtaining ICTA approval for the above.
4.4 Implement the in collaboration with the, SPA consultants appointed by ICTA, or review
committee and facilitate the ‘Software Process Audit (SPA)’ specified by ICTA. Refer
Annex C.
4.5 Maintain project source code in the ICTA Source Code Management system (SCM).
4.6 Maintain all issues in the Issue tracking system maintained by ICTA.
4.7 Adopt a proper application release procedure to release the LB to ICTA during the
deployment in the staging / production environments.
4.8 Participate for Project Review Committee meeting and Project Implementation
Committee (PIC) Meetings as a member.
4.9 Obtain User Acceptance Test(UAT) for the implemented processes.
4.10 Deploy into production environment at Lanka Government Cloud (LGC).
4.11 Provide support and maintenance services, from the date of launch to an agreed
time period.
4.12 Adhere to the Service Level Agreement, during the support and maintenance
phase (SLA) indicated in Annex B.
4.13 Adherence to e-Government Policy of Sri Lanka [1].
4.14 Adherence to Web 2.0 concepts, open standards and Service Oriented Architecture
(SOA) principles.
4.15 Adherence to Lanka Interoperability Framework (LIFe) standards [2].
4.16 Work collaboratively with ICTA and other stakeholder organizations
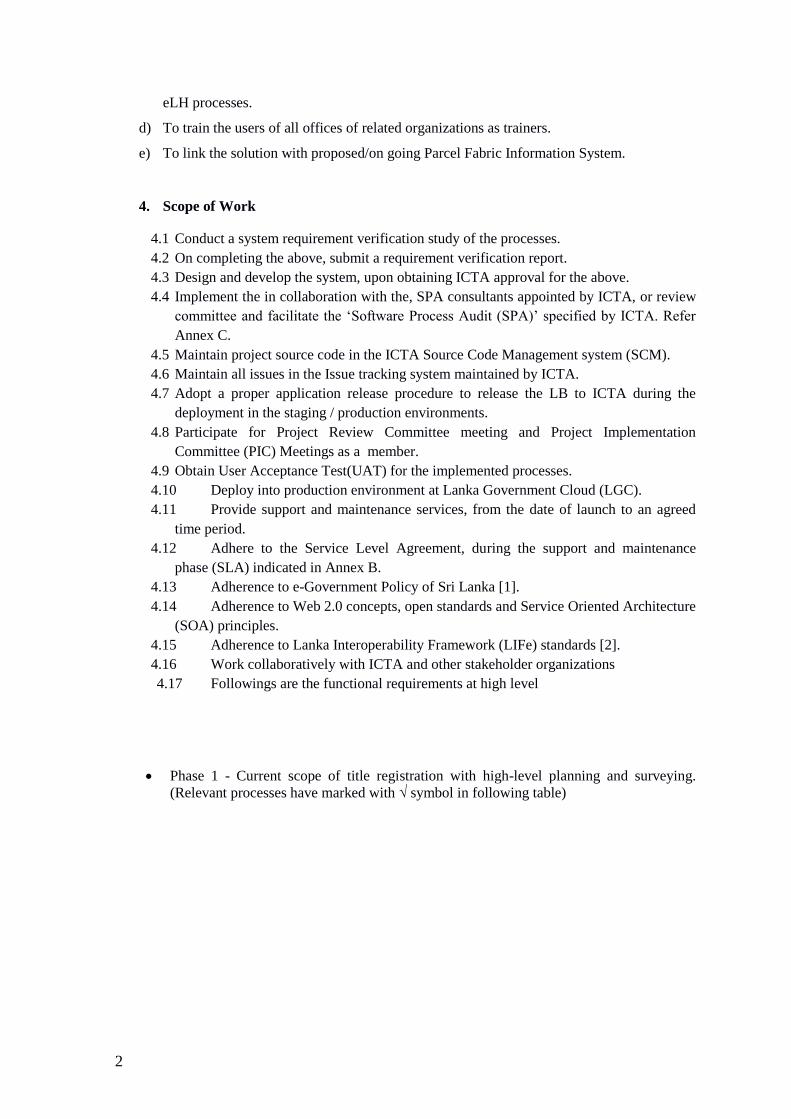
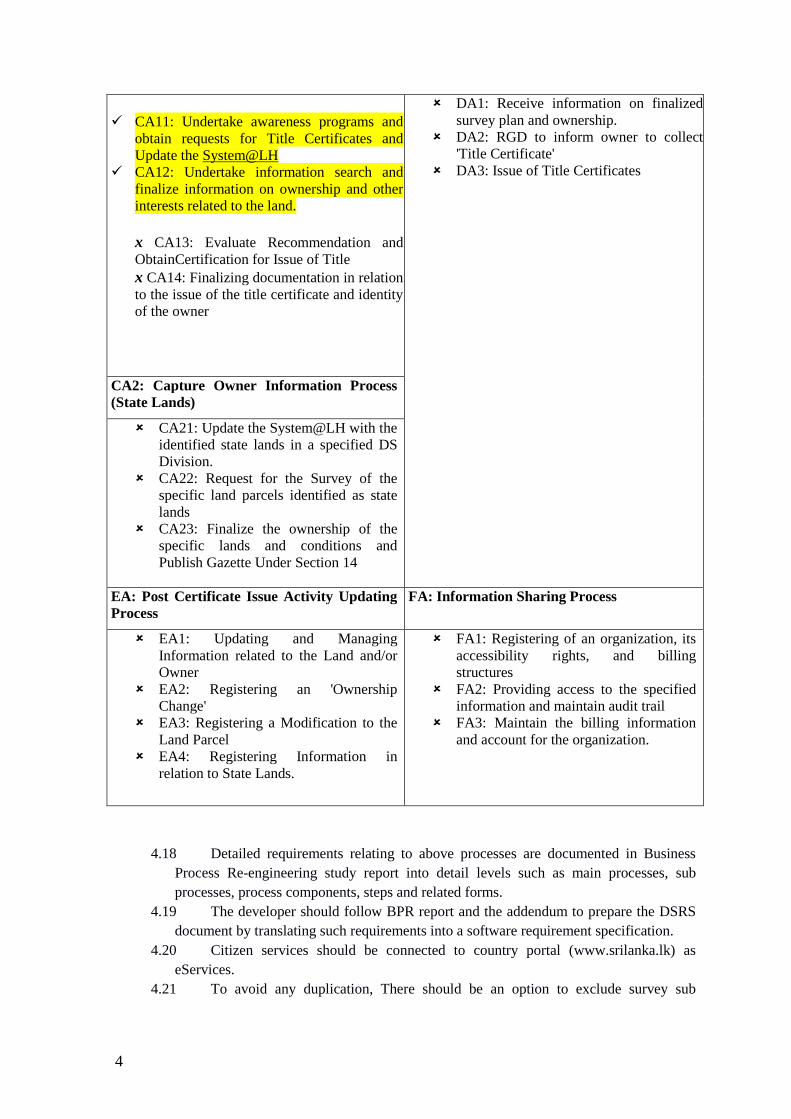
4.17 Followings are the functional requirements at high level
Phase 1 - Current scope of title registration with high-level planning and surveying.
(Relevant processes have marked with √ symbol in following table)

3
AA: Planning and Monitoring Process BA: Land Information Capture Process
(Including Declaring Other Interests)
AA1: Prepare Ministry Plan for the specified DS
Division.
AA2: Prepare detailed individual
department plans for each GN Division in
DS.
AA3: Monitor the progress of plans and
take corrective action where required
BA1: Design and Implement Referencing
within DS Division
BA2: Undertake ‘Detailed Cadastral
Survey’ of land parcels *
BA3: Updating the land usage related interests by
other state organizations
BA4: Handling of Inconsistencies in
relation to the boundaries of own or
adjacent land parcels.
BA5: Undertake 'Land Marking/Misc.
Surveys/Acquisition Surveys/Court
Commission Surveys'
BA6: Undertake 'Data capturing for
Parcel Fabric'
BA7: Undertake 'Engineering Surveys'
BA8: Undertake 'Condominium
Surveys'
BA9: Training Module for BA1, BA2,
BA4, BA6, BA7 & BA8 sub processes
above.
* Sub Process BA2 BA5 to BA9 has to be
expanded as follows
Planning of survey
Office and field Investigation
Capturing survey data
Process captured survey data
Uploading data to the system
Drawing the plan according to given
technical specifications
Monitoring the process
CA1: Capture Owner Information Process
(Private Lands)
DA: Issue of Title Certificate Process
4
CA11: Undertake awareness programs and
obtain requests for Title Certificates and
Update the System@LH
CA12: Undertake information search and
finalize information on ownership and other
interests related to the land.
x CA13: Evaluate Recommendation and
ObtainCertification for Issue of Title
x CA14: Finalizing documentation in relation
to the issue of the title certificate and identity
of the owner
DA1: Receive information on finalized
survey plan and ownership.
DA2: RGD to inform owner to collect
'Title Certificate'
DA3: Issue of Title Certificates
CA2: Capture Owner Information Process
(State Lands)
CA21: Update the System@LH with the
identified state lands in a specified DS
Division.
CA22: Request for the Survey of the
specific land parcels identified as state
lands
CA23: Finalize the ownership of the
specific lands and conditions and
Publish Gazette Under Section 14
EA: Post Certificate Issue Activity Updating
Process
FA: Information Sharing Process
EA1: Updating and Managing
Information related to the Land and/or
Owner
EA2: Registering an 'Ownership
Change'
EA3: Registering a Modification to the
Land Parcel
EA4: Registering Information in
relation to State Lands.
FA1: Registering of an organization, its
accessibility rights, and billing
structures
FA2: Providing access to the specified
information and maintain audit trail
FA3: Maintain the billing information
and account for the organization.
4.18 Detailed requirements relating to above processes are documented in Business
Process Re-engineering study report into detail levels such as main processes, sub
processes, process components, steps and related forms.
4.19 The developer should follow BPR report and the addendum to prepare the DSRS
document by translating such requirements into a software requirement specification.
4.20 Citizen services should be connected to country portal (www.srilanka.lk) as
eServices.
4.21 To avoid any duplication, There should be an option to exclude survey sub

5
processes in case if it covers from other project.
4.22 The developed system should be capable to integrate with the compatible systems
that developed in the future for the next phases and the additional processes identifies
with ‘× ‘afterwards.
4.23 ICTA or its designated entity (end user) shall have the ownership rights to client
specific components arising from the requirements specified in the DSRS. The ICTA may
consider shared ownership rights to such components provided there is a cost benefit to
ICTA or its designated entity (end user) at the discretion of the ICTA.
4.24 ICTA or its designated entity (end user) should have the right to access, modify,
further develop and enhance the system at no cost to ICTA or its designated entity (end
user).
4.25 The evaluation and the selection of the successful Bidder will be based on Total
Cost of Ownership to ICTA or its designated entity (end user).
4.26 Refer following Annexes which form a part and partial of the “Terms of
Reference”.
Annex A - Non-Functional Requirements.
Annex B - Service Level Agreement (SLA) for Support and Maintenance
Services.
Annex C - Software Project Audit Process
Annex D – Proposed System Architecture of LB
Annex E – Re-engineering process of Land Title Settlement and Surveying
functions
Annex F – Addendum to BPR Report (Survey Processes BA5 to BA9, Revised
BA2 Processes)
5. Final outputs, Reporting Requirements, Time Schedule for Deliverables;
Project duration is 8 months including requirement Verification, designing, developing and
deploying the system.
Consultancy firm is required to submit the following list of deliverables for the Land Bank
project.
No Deliverables Phase
5.1 Implementation Proposal
5.1.1 Inception report
5.1.2 Requirement verification report
5.1.3 Implementing schedule
5.1.5 Acceptance criteria for the UAT
5.1.7 Proper maintenance of issues in the Issue tracking System
Inception
5.2 5.2.1 Design and Architecture Document
5.2.2 Data migration and integration plan (if applicable)
5.2.3 Release Management plan (including staging, production and
support and maintenance)
5.2.4 Proper maintenance of issues in the Issue tracking System
Elaboration
5.3 5.3.1 Iteration one release note
5.3.2 Iteration two release note
5.3.3 Iteration three release note
Construction
6
5.3.4 Proper maintenance of source code in SCM for all three
iterations
5.3.5 Proper maintenance of issues in the issue tracking System
5.4 5.4.1 Solutions deployment and installation guide
5.4.2 Online help and the User manual for back office application
5.4.3 Administrator Manual
5.4.4 Proper maintenance of issues in the Issue tracking System
5.4.5 Successful UAT acceptance of the system
5.4.6 Production deployment confirmation report
Transition
Refer http://en.wikipedia.org/wiki/IBM_Rational_Unified_Process for more information about
RUP (Rational Unified Process) phases.
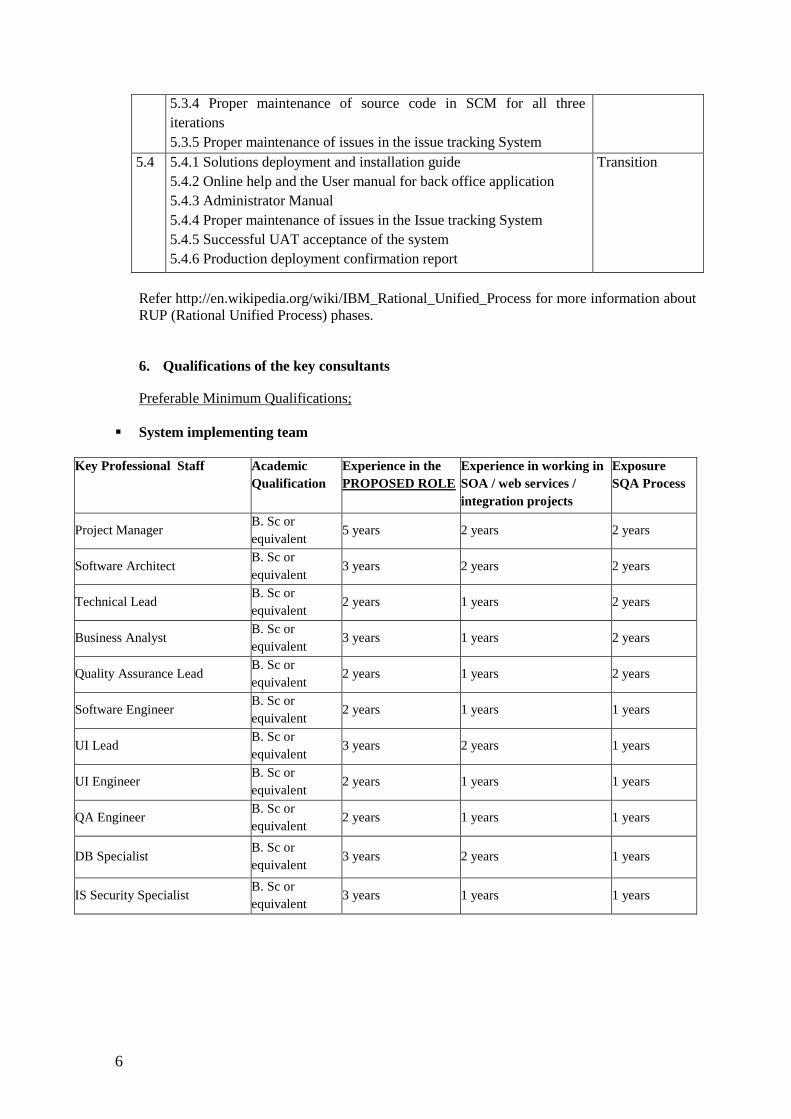
6. Qualifications of the key consultants
Preferable Minimum Qualifications;
System implementing team
Key Professional Staff Academic
Qualification
Experience in the
PROPOSED ROLE
Experience in working in
SOA / web services /
integration projects
Exposure
SQA Process
Project Manager B. Sc or
equivalent 5 years 2 years 2 years
Software Architect B. Sc or
equivalent 3 years 2 years 2 years
Technical Lead B. Sc or
equivalent 2 years 1 years 2 years
Business Analyst B. Sc or
equivalent 3 years 1 years 2 years
Quality Assurance Lead B. Sc or
equivalent 2 years 1 years 2 years
Software Engineer B. Sc or
equivalent 2 years 1 years 1 years
UI Lead B. Sc or
equivalent 3 years 2 years 1 years
UI Engineer B. Sc or
equivalent 2 years 1 years 1 years
QA Engineer B. Sc or
equivalent 2 years 1 years 1 years
DB Specialist B. Sc or
equivalent 3 years 2 years 1 years
IS Security Specialist B. Sc or
equivalent 3 years 1 years 1 years

7
Support and Maintenance team
Key Professional
Staff
Academic
qualification
Experience in the
PROPOSED
ROLE
Experience in
working in SOA /
web services /
integration projects
Exposure SQA
Process
Technical Lead B. Sc or equivalent 2 years 1 years 2 years
Software Engineer B. Sc or equivalent 2 years 1 year 1 year
7. Services and Facilities Provided by ICTA
7.1 Web-based access to the ICTA SCM system
7.2 Designs of the existing system
7.3 Access to staging/ production servers
7.4 Issue Tracking System
7.5 SQA dashboard
References
[1] e-Government Policy Approved by Cabinet of Sri Lanka
http://www.icta.lk/index.php/en/e-governement-policy
[2] Lanka Interoperability Framework - http://www.life.gov.lk/
9.Review Committees and Review Procedures
The Software Development Service Provider is required to work closely with the ICTA
Technology Team and the Software Process Audit (SPA) consultants or the review committees
such as SAGE – Software Architecture Group of Experts.
All versions of deliverables will be reviewed by/either the SPA consultants, SAGE, or ICTA
Technology Team.
All the deliverables must be verified and confirmed to be accurate and complete by the Project
Implementation Committee (PIC) or the Project Management Committee (PMC). Deliverables
must be formally endorsed by the PIC or PMC or CTO or Head of Technology Team.

8
Annex (A)
Non-Functional Requirements
1. Workflow based operations
A workflow is activated when an initiating event occurs. The workflow would guide a
user in actioning an event. It would define the requirements to initiate a workflow. Once
initiated, the processing should be controlled as to the sequence of activities, and the
officers who execute it.
Some key terms and concepts of workflow based operations are:
- Task: Work performed to effect a single change. A workflow would consist of
several tasks. In workflow construction, the task definition is a template for action.
The task must be associated with an actual event in order to carry out the action.
- Activated Task: When an action is required, and a task is associated with a specific
item which must be actioned, the task is instantiated and a single instance of the
task is created. It is the instance of a task (ie- Activated Task) which can be
executed. (Note: This is not a standard workflow term, and has been adopted for
clarity).
- Work Item: A workflow-item moving through a work process. A work item would
be associated with a single instance of a workflow, and Activated Tasks within the
workflow.
Refer Annexure A1.1 for more supporting services
2. Security
1. User authentication and authorization
An administrative application need to be developed wherever applicable.
2. Availability
The system should be developed to ensure “High Availability” to remain the system
available all the time. (e.g. Portlets clustering capability should be taken into consideration
in the development)
3. Non-repudiation
The system should ensure non-repudiation by having standard audit-trails and provisions
to have WS-Security using digital signatures.
3. Audit Facilities
Wherever applicable, an audit trail of all activities must be maintained. On a service or
operation being initiated, the system should log the event, creating a basic ‘audit log entry’. It
should not be possible for the operation to be executed without the log entry being made.
The information recorded in the audit trail depends on the type of activity which takes place.
Each service would be responsible for logging detailed information. The different types of
operations are -
1. Data Capture & Maintenance
2. Creation of an entry / item
3. Modification an item
4. Deletion
5. Control (or status change)
6. Process execution
7. Data synchronization

9
8. Print (only selected item)
9. Retrieval
10. Monitor
Detail logging may be enabled or disabled for each type of operation, and/or for each business
object. It should be possible to configure which attributes of a data item should be traced at the
detail level. Tracing of some attributes may be considered mandatory, and they should not be
turned off.
4. Backup and Contingency Planning
The main contingencies that should be considered and the training with regards to these shall
be given to the relevant staff -
11. Equipment failure
12. Physical / natural Disaster
13. Messaging or communication facilities.
14. Changes in operations and policy
15. Sudden absence of key personnel
16. Breach in Security
Automatic Backups daily, weekly and monthly should be taken. All the backup procedures and
backups needs to be tested regularly for restoration.
5. Performance
Following performance criteria is provided as a guideline only. If the actual performance is
falling below the stipulated figures, the consultant is to justify the reasons. However, the
performance level must be accepted by the technical evaluation committee appointed by the
client.
The bandwidth is assumed at 512kbps (shared) (point to point between LIX and the
Department web service) with 1,000 concurrent users (50% load factor) in total.
Item Performance
Screen Navigation: field-to-field < 10 milliseconds
Screen Navigation: screen-to-screen < 5 seconds
Screen Refresh < 3 seconds
Screen list box, combo box < 3 seconds
Screen grid – 25 rows, 10 columns < 5 seconds
Report preview – (all reports) – initial page
view (if asynchronous)
< 60 seconds in most instances. It is understood
that complicated / large volume reports may
require a longer period
Simple enquiry – single table, 5 fields, 3
conditions – without screen rendering
< 5 seconds for 100,000 rows
Complex enquiry – multiple joined table
(5), 10 fields, 3 conditions – without screen
rendering
< 8 seconds for 100,000 rows
Server side validations / computations < 10 milliseconds
Client side validations / computations < 1 millisecond
Batch processing (if any) per 100 records < 120 seconds
Login, authentication, and verification < 3 seconds

10
Daily backups (@ Dept.) – max duration 1 hour (on-line preferred)
Total Restore (@Dept) – max duration 4 hours
Annex (B)
SERVICE LEVEL AGREEMENT for
SUPPORT AND MAINTENANCE SERVICES
1. Introduction
The aim of this agreement is to provide a basis for close co-operation between the Client and
the Consultant for support and maintenance services to be provided by the Consultant, thereby
ensuring a timely and efficient support service is available. The objectives of this agreement
are detailed in Section 1.1.
This agreement is contingent upon each party knowing and fulfilling their responsibilities and
generating an environment conducive to the achievement and maintenance of targeted service
levels.
1.1 Objectives of Service Level Agreements
1. To create an environment conducive to a co-operative relationship between Client,
Consultant and Client's representatives (government organizations) to ensure the effective
support of all end users.
2. To document the responsibilities of all parties taking part in the Agreement.
3. To define the commencement of the agreement, its initial term and the provision for
reviews.
4. To define in detail the service to be delivered by each party and the level of service
expected, thereby reducing the risk of misunderstandings.
5. To institute a formal system of objective service level monitoring ensuring that reviews of
the agreement is based on factual data.
6. To provide a common understanding of service requirements/capabilities and of the
principles involved in the measurement of service levels.
7. To provide for all parties to the Service Level Agreement a single, easily referenced
document which caters for all objectives as listed above.
1.2 Service Level Monitoring
The success of Service Level Agreements (SLA) depends fundamentally on the ability to
measure performance comprehensively and accurately so that credible and reliable
information can be provided to customers and support areas on the service provided.
Service factors must be meaningful, measurable and monitored constantly. Actual levels of
service are to be compared with agreed target levels on a regular basis by both Client and
Consultant. In the event of a discrepancy between actual and targeted service levels both
Client and Consultant are expected to identify and resolve the reason(s) for any
discrepancies in close co-operation.
Service level monitoring will be performed by Client. Reports will be produced as and when
required and forwarded to the Consultant.

11
1.3 Support Levels
The consultant must provide support and maintenance services during Support Levels
mentioned below;
Support Level: High
Component/ Service Core Components of Lanka Gate
Support Hours 24 hours a day, all days in the week
(including public and mercantile holidays)
Support Level: Medium
Component/ Service 1 Government Interface and related backend services (deployed
at Government organization site)
Support Hours From 08:00 AM to 05:00 PM Monday to Friday
(excluding public holidays)
Component/ Service 2 For front-end portlets and supporting back-end applications
(web services, etc.. deployed at Lanka Government Cloud
(LGC))
Support Hours From 08:00 AM to 09:00 PM, all days in the week (including
public and mercantile holidays)
1.4 On-Call Services Requirements
Consultant MUST make at least ONE qualified personnel available to the Client by
telephone and email for the reporting and resolution of non-conformities or other issues,
defects or problems. Dedicated telephone numbers and emails should be available for
reporting issues. Client will nominate the personnel who are authorized to report non-
conformities or other problems with the system from the departments. Reporting of non-
conformities includes requests by the Client to apply critical software updates or patches.
Table-1 shows the response priority assigned to faults according to the perceived importance
of the reported situation and the required initial telephone response times for the individual
priority ratings. All times indicated represent telephone response time during specified
Support Levels. The indicated telephone response time represents the maximum delay
between a fault/request being reported and a Consultant's representative contacting the
Client by telephone. The purpose of this telephone contact is to notify the Client of the
receipt of the fault/request and provide the Client with details of the proposed action to be
taken in respect of the particular fault/request.
Support
Level
Business
Critical
Business
Critical
Non-
Business
Critical
Non-
Business
Critical
Fatal Impaired Fatal Impaired
High 60 minutes
within Support
Hours
90 minutes
within Support
Hours
90 minutes
within Support
Hours
120 minutes
within Support
Hours
Medium 120 minutes
within Support
Hours
150 minutes
within Support
Hours
150 minutes
within Support
Hours
180 minutes
within Support
Hours
Table-1: Response Priority
12
Note:
Fatal - Total system inoperability
Impaired - Partial system inoperability
Business Critical - Unable to perform core business functions
Non-Business Critical - Able to perform limited core business functions
Consultant notification can occur outside Support Level time, and thus the response may
occur after the next Support Level begins. Furthermore, “Time to Arrive On-Site (Table-3)”
starts from Support Level starting time and “Time to Resolve the Problem” is Support Level
time starting from the actual time of arrival on site.
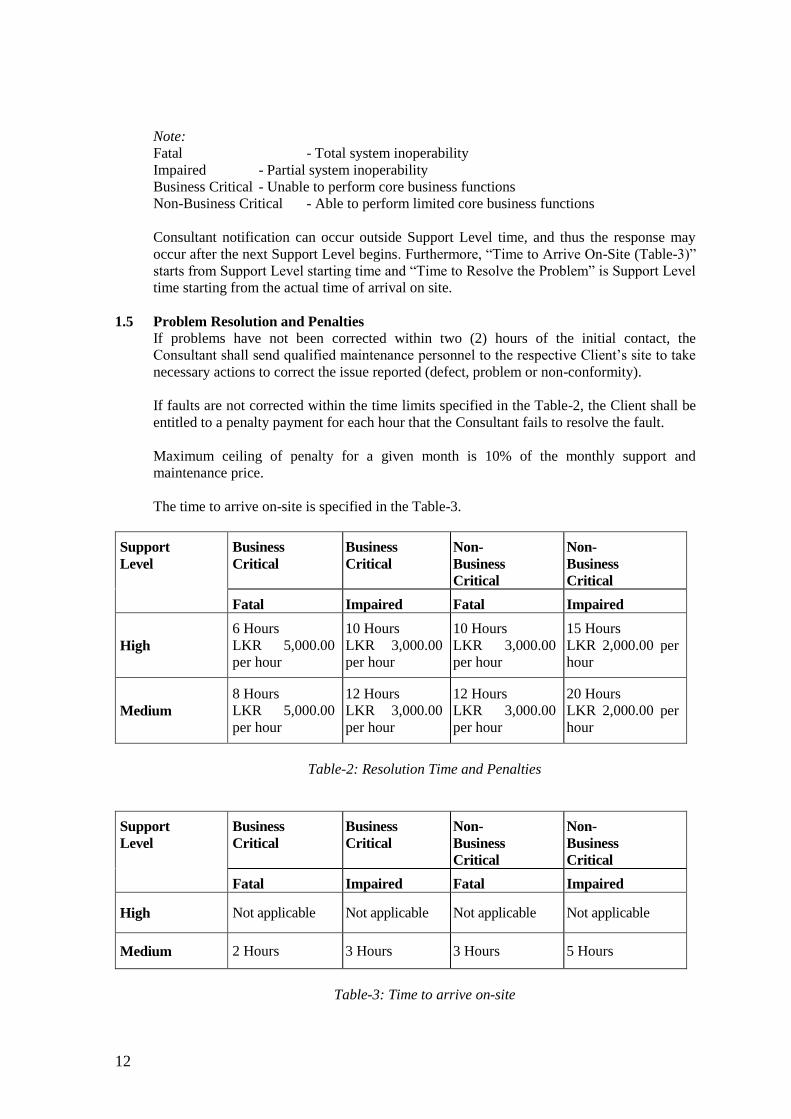
1.5 Problem Resolution and Penalties
If problems have not been corrected within two (2) hours of the initial contact, the
Consultant shall send qualified maintenance personnel to the respective Client’s site to take
necessary actions to correct the issue reported (defect, problem or non-conformity).
If faults are not corrected within the time limits specified in the Table-2, the Client shall be
entitled to a penalty payment for each hour that the Consultant fails to resolve the fault.
Maximum ceiling of penalty for a given month is 10% of the monthly support and
maintenance price.
The time to arrive on-site is specified in the Table-3.
Support
Level
Business
Critical
Business
Critical
Non-
Business
Critical
Non-
Business
Critical
Fatal Impaired Fatal Impaired
High
6 Hours
LKR 5,000.00
per hour
10 Hours
LKR 3,000.00
per hour
10 Hours
LKR 3,000.00
per hour
15 Hours
LKR 2,000.00 per
hour
Medium
8 Hours
LKR 5,000.00
per hour
12 Hours
LKR 3,000.00
per hour
12 Hours
LKR 3,000.00
per hour
20 Hours
LKR 2,000.00 per
hour
Table-2: Resolution Time and Penalties
Support
Level
Business
Critical
Business
Critical
Non-
Business
Critical
Non-
Business
Critical
Fatal Impaired Fatal Impaired
High Not applicable Not applicable Not applicable Not applicable
Medium 2 Hours 3 Hours 3 Hours 5 Hours
Table-3: Time to arrive on-site
13
Annex C
Software Project Audit Process
Version 1.2
Information and Communication Technology Agency of Sri Lanka
1. Introduction
1.1 Purpose
Purpose of this document is to describe the Software Project Audit Process which is capable of
auditing and ensuring the quality of different activities carried out throughout a software project
life-cycle. The main purpose of this process is to provide much higher level of confidence in the
quality of the deliverables received by the client from the developer. The quality level of the
audited activity is presented using a measurement technique called metrics.
The process should be followed by both the development team and the Software Project Audit
team to derive their own metrics to measure the quality status of a software product in its life
cycle. Eventually, the trend analysis of such metrics can be used to identify any potential project
issues or failures and to come up with solutions.
This document explains several guidelines which can be used within the audit process for project
progress calculation and mapping payment milestones with project deliverables or and project
artifact reviews to effectively manage the project.
Further, the document contrasts the Software Project Audit process from typical software
development life cycle and illustrates how it has been automated by integrating several testing
tools and testing methodologies as well as embedding best industry standards.
1.2 Scope
Scope of this document is to provide an insight about the Software Project Audit Process,
importance of metrics, analysis of metrics, automated process of metric generation, skills required
to generate certain metrics, guideline for project progress calculation, guideline for mapping
payment milestones with deliverables and guideline for Review of Project artifacts.

14
1.3 Definitions, Acronyms and Abbreviations
Acronym Definition
AQI Architecture Quality Index
AD Architectural Design
CQI Code Quality Index
DD Defect Density
DQI Design Quality Index
DSI Defect Severity Index
ISI Issue Severity Index
PERI Project Execution Readiness Index
RCI Requirement Clarity Index
SPA Software Project Audit
SR Software Requirement
TTEI Tasks Tracking Efficiency Index
TR Transfer
UAT User Acceptance Test
OAT Operational Acceptance Test

15
2. Process Overview
It is often said that if something cannot be measured, it cannot be managed or improved. There is
immense value in measurement, but you should always make sure that you get some value out of
any measurement that you are doing.
What is a Metric?
It is a standard of measurement which can be used to measure the software quality. It
gives a confidence in the software product. They are typically the providers of the
visibility of the software product you need.
Why Measure?
When used appropriately, metrics can aid in software development process
improvement by providing pragmatic, objective evidence of process change initiatives.
Although metrics are gathered during the test effort, they can provide measurements of
many different activities performed throughout a project. In conjunction with root
cause analysis, test metrics can be used to quantitatively track issues from points of
occurrence throughout the development process. In addition, when metrics
information is accumulated, updated and reported on a consistent and regular basis, it
ensures that trends can be promptly captured and evaluated.
What to Measure?
When considering the metric driven process, it can be divided into two parts. The first
part is to collect data, and the second is to prepare metrics/charts and analyze them to
get the valuable insight which might help in decision making. Information collected
during the software development process can help in:
Finding the relation between data points
Correlating cause and effect
Input for future planning
Normally, the metric driven process involves certain steps which are repeated over a
period of time. It starts with identifying what to measure. After the purpose is known,
data can be collected and converted into the metrics. Based on the analysis of these
metrics appropriate action can be taken, and if necessary metrics can be refined and
measurement goals can be adjusted for the better. Data presented by
Development/testing team, together with their opinion, normally decides whether a
product will go into client or not. So it becomes very important for Development
team/test teams to present data and opinion in such a way that data looks meaningful

16
to everyone, and decision can be taken based on the data presented. Every software
project should be measured for its schedule and the quality requirement for its release.
There are lots of charts and metrics that we can use to track progress and measure the
quality requirements of the release. In Figure 1.0 shows some of main metrics which
can be derived at specific level of the software development life-cycle.
Figure 1.0 - Various Metrics derived at different levels of SD process

17
2.1 Metrics in Brief
Metric
Purpose
Project Execution
Readiness Index (PERI)
This Proposed index at requirements stage is derived based on quality of
the documents involve with this phase. The main Documents involve in
this phase are;
* User Requirements Document
* Acceptance test plans
* Project management plan for the SR phase
* Configuration management plan for the SR phase
* Verification and validation plan for the SR phase
* Quality assurance plan for the SR phase
When reviewing , reviewers can verify the document by checking its
content with a checklist. Each of these content in a checklist is categorized
under their Severity to the System. All defects in those contents should be
logged in a defect tracking system. Finally, index can be derived as;
Weighted average of the total number of Open Issues in the product
detected till date against all categories (Blocker (B), Critical (C), Major
(Ma), Normal (N), Minor (Mi), Trivial(T)).
Metric: (B*162 + C*54 + Ma*18 + N*6 + Mi*2+ T)*10
Total weight (162+54+18+6+2+1)
Note: Can be calculated based on the review cycles
Requirements
Clarity/Change
Index(RCI)
This index measures following two criteria relevant to requirements
1. Requirements Clarity
This is the proposed index is at Specification Stage which should indicate
how well each member of the Software development team comprehend the
requirements and also indicates How well the requirements are cleared for
Software Development Team.
2. Requirement Changes
Requirement changes may be arisen at any stage of a project. Therefore,
this index should be continued till UAT phase of a project and all the
requirement changes arisen during that period should be captured under
this index.
18
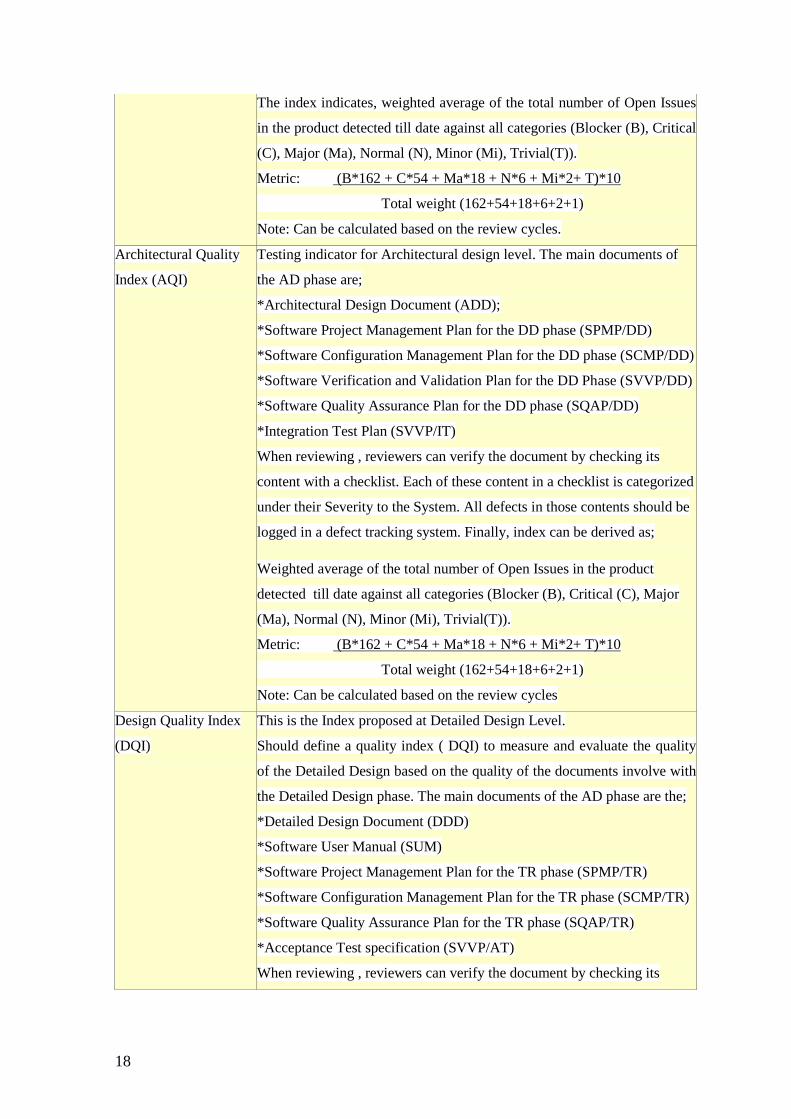
The index indicates, weighted average of the total number of Open Issues
in the product detected till date against all categories (Blocker (B), Critical
(C), Major (Ma), Normal (N), Minor (Mi), Trivial(T)).
Metric: (B*162 + C*54 + Ma*18 + N*6 + Mi*2+ T)*10
Total weight (162+54+18+6+2+1)
Note: Can be calculated based on the review cycles.
Architectural Quality
Index (AQI)
Testing indicator for Architectural design level. The main documents of
the AD phase are;
*Architectural Design Document (ADD);
*Software Project Management Plan for the DD phase (SPMP/DD)
*Software Configuration Management Plan for the DD phase (SCMP/DD)
*Software Verification and Validation Plan for the DD Phase (SVVP/DD)
*Software Quality Assurance Plan for the DD phase (SQAP/DD)
*Integration Test Plan (SVVP/IT)
When reviewing , reviewers can verify the document by checking its
content with a checklist. Each of these content in a checklist is categorized
under their Severity to the System. All defects in those contents should be
logged in a defect tracking system. Finally, index can be derived as;
Weighted average of the total number of Open Issues in the product
detected till date against all categories (Blocker (B), Critical (C), Major
(Ma), Normal (N), Minor (Mi), Trivial(T)).
Metric: (B*162 + C*54 + Ma*18 + N*6 + Mi*2+ T)*10
Total weight (162+54+18+6+2+1)
Note: Can be calculated based on the review cycles
Design Quality Index
(DQI)
This is the Index proposed at Detailed Design Level.
Should define a quality index ( DQI) to measure and evaluate the quality
of the Detailed Design based on the quality of the documents involve with
the Detailed Design phase. The main documents of the AD phase are the;
*Detailed Design Document (DDD)
*Software User Manual (SUM)
*Software Project Management Plan for the TR phase (SPMP/TR)
*Software Configuration Management Plan for the TR phase (SCMP/TR)
*Software Quality Assurance Plan for the TR phase (SQAP/TR)
*Acceptance Test specification (SVVP/AT)
When reviewing , reviewers can verify the document by checking its

19
content with a checklist. Each of these content in a checklist is categorized
under their Severity to the System. All defects in those contents should be
logged in a defect tracking system. Finally, index can be derived as;
Weighted average of the total number of Open Issues in the product
detected till date against all categories (Blocker (B), Critical (C), Major
(Ma), Normal (N), Minor (Mi), Trivial(T)).
Metric: (B*162 + C*54 + Ma*18 + N*6 + Mi*2+ T)*10
Total weight (162+54+18+6+2+1)
Note: Can be calculated based on the review cycles
Code Quality index
(CQI)
- Indicates how well the software codes are written and maintained.
- To be derived using considering multiple aspects. This will be decided in
project execution.
- Index can be derived as;
Weighted average of the total number of Open Issues in the product
detected till date against all categories (Blocker (B), Critical (C), Major
(Ma), Normal (N), Minor (Mi), Trivial(T)).
Metric: (B*162 + C*54 + Ma*18 + N*6 + Mi*2+ T)*10
Total weight (162+54+18+6+2+1)
Defect Density (DD) - Number of defects per unit size of the application (KLOC)
- Calculated end of each drop cycle.
- The Number of Known Defects is the count of total defects identified
against a particular software entity, during a particular time period
- Size is a normalizer that allows comparisons between different software
entities (i.e modules, releases, products). Size is typically counted either in
Lines of Code or Function Points.
Defect Severity Index
(DSI)
- Indicates application stability
- Weighted average of the total number of Open Defects in the product
detected till date against all categories (Blocker (B), Critical (C), Major
(Ma), Normal (N), Minor (Mi), Trivial(T)).
Metric: (B*162 + C*54 + Ma*18 + N*6 + Mi*2+ T)*10
Total weight (162+54+18+6+2+1)
Note: Calculated weekly and delivered by drop
Issue Severity Index
(ISI)
During the User Acceptance Test(UAT) time issues can be arisen. All
those issues should be logged in UAT documentation as well as in the bug

20
tracking System.
- Weighted average of the total number of Open issues in the product
arisen during the UAT period against all categories (Blocker (B), Critical
(C), Major (Ma), Normal (N), Minor (Mi), Trivial(T)).
Metric: (B*162 + C*54 + Ma*18 + N*6 + Mi*2+ T)*10
Total weight (162+54+18+6+2+1)
Defect Category An attribute of the defect in relation to the quality attributes of the product.
Quality attributes of a product include functionality, usability,
documentation, performance, installation, stability ,compatibility ,
internationalization etc. This metric can provide insight into the different
quality attributes of the product. This metric can be computed by dividing
the defects that belong to a particular category by the total number of
defects.
Defect Cause
Distribution Chart
This chart gives information on the cause of defects.
Defect Distribution
Across Components
This chart gives information on how defects are distributed across various
components of the system.
Defect Finding Rate This chart gives information on how many defects are found across a
given period. This can be tracked on a daily or weekly basis.
Defect Removal
Efficiency
The number of defects that are removed per time unit (hours/days/weeks).
Indicates the efficiency of defect removal methods, as well as indirect
measurement of the quality of the product. Computed by dividing the
effort required for defect detection, defect resolution time and retesting
time by the number of defects. This is calculated per test type, during and
across test phases.
Effort Adherence
As % of what is committed in contract. Provides a measure of what was
estimated at the beginning of the project vs. the actual effort taken. Useful
to understand the variance (if any) and for estimating future similar
projects.
Number of Defects The total number of defects found in a given time period/phase/test type
that resulted in software or documentation modifications. Only accepted
defects that resulted in modifying the software or the documentation are
counted.
Review Efficiency # of defects detected /LOC or pages reviewed per day
21
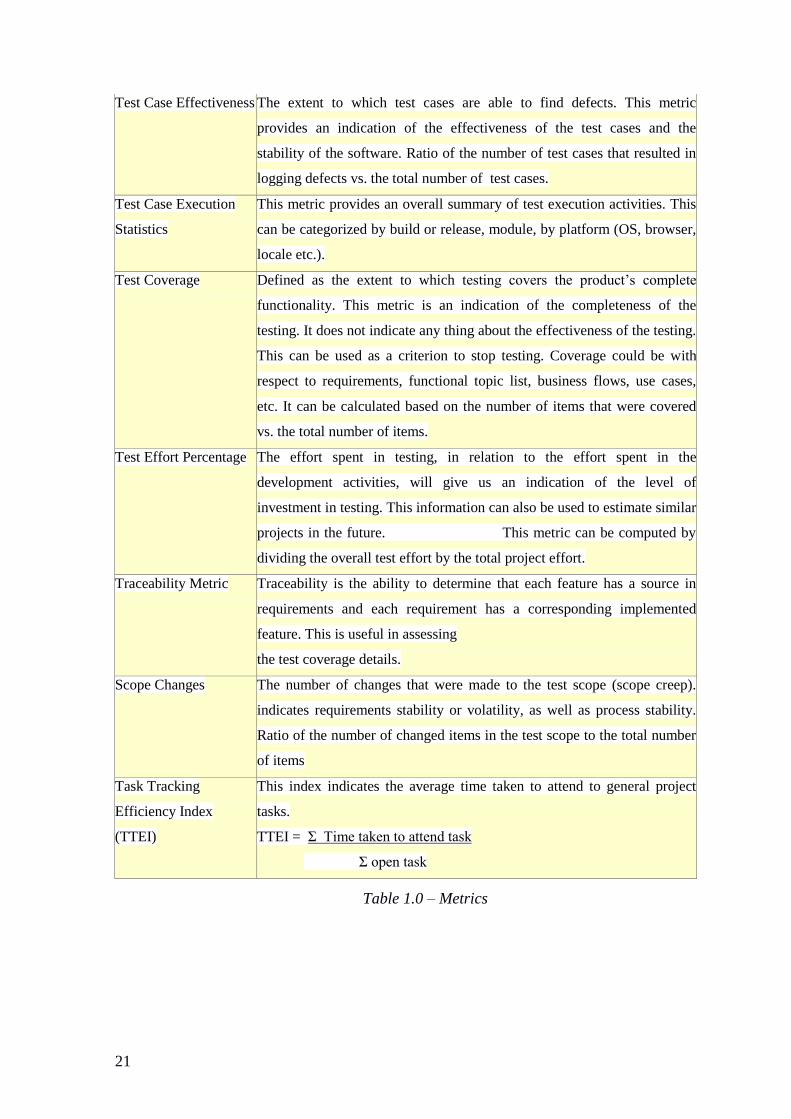
Test Case Effectiveness The extent to which test cases are able to find defects. This metric
provides an indication of the effectiveness of the test cases and the
stability of the software. Ratio of the number of test cases that resulted in
logging defects vs. the total number of test cases.
Test Case Execution
Statistics
This metric provides an overall summary of test execution activities. This
can be categorized by build or release, module, by platform (OS, browser,
locale etc.).
Test Coverage Defined as the extent to which testing covers the product’s complete
functionality. This metric is an indication of the completeness of the
testing. It does not indicate any thing about the effectiveness of the testing.
This can be used as a criterion to stop testing. Coverage could be with
respect to requirements, functional topic list, business flows, use cases,
etc. It can be calculated based on the number of items that were covered
vs. the total number of items.
Test Effort Percentage The effort spent in testing, in relation to the effort spent in the
development activities, will give us an indication of the level of
investment in testing. This information can also be used to estimate similar
projects in the future. This metric can be computed by
dividing the overall test effort by the total project effort.
Traceability Metric Traceability is the ability to determine that each feature has a source in
requirements and each requirement has a corresponding implemented
feature. This is useful in assessing
the test coverage details.
Scope Changes The number of changes that were made to the test scope (scope creep).
indicates requirements stability or volatility, as well as process stability.
Ratio of the number of changed items in the test scope to the total number
of items
Task Tracking
Efficiency Index
(TTEI)
This index indicates the average time taken to attend to general project
tasks.
TTEI = Σ Time taken to attend task
Σ open task
Table 1.0 – Metrics

22
2.2 Metrics Analysis
Much as the time is spent gathering or maintaining metrics, enough time should be spent to
review and interpret on a regular basis throughout the test effort, particularly after the
application is released into production. During review meetings, the project team should
closely examine all available data and use that information to determine the root cause of
identified problems. It is important to look at several metrics, as this will allow the project
team to have a more complete picture of what took place during a test.
Let's assume that as part of the SPA Process, the following metrics are collected by the
SPA team.
Metric
Purpose
Defect Severity
Index
Weighted average index of the Severity of defects. A higher severity
defect gets a higher weight. S1 is a show stopper, S2 is high severity, S3 is
medium & S4 is low. Ideally, this should slope down as test cycles
progress.
For instance, if the test team has generated the following metrics:
L
o
o
k
i
n
a
t the graphs one can safely deduce the followings;
23
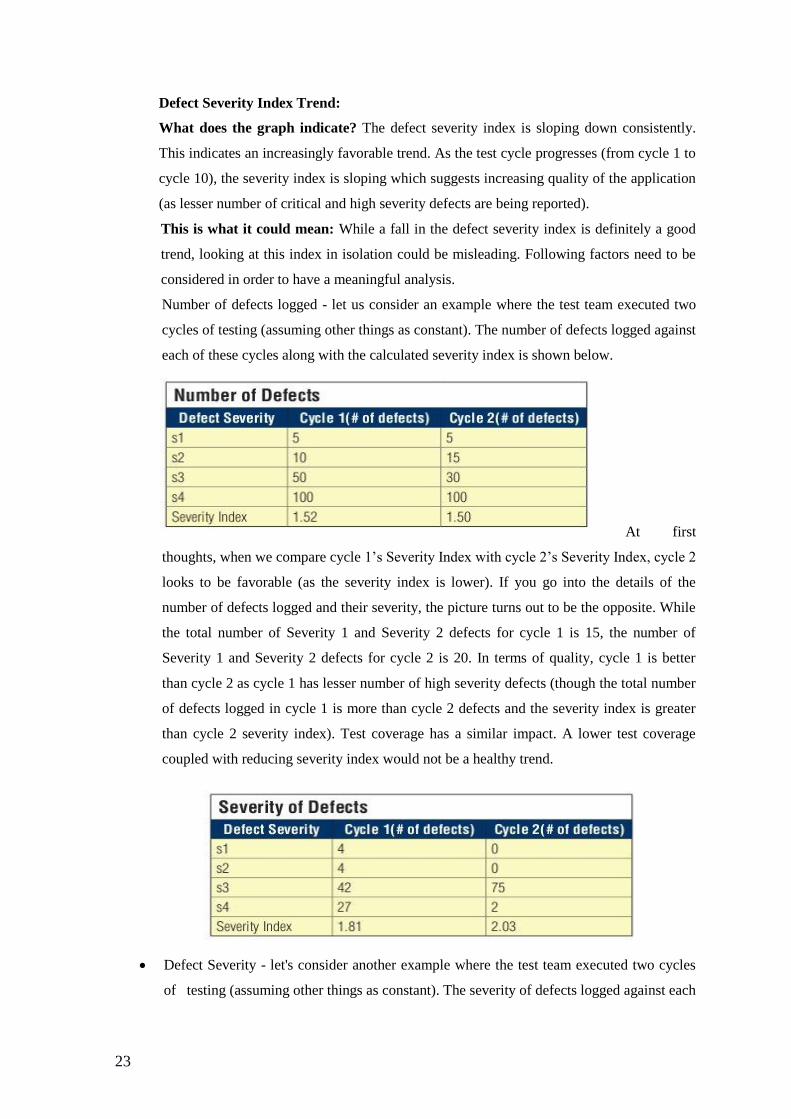
Defect Severity Index Trend:
What does the graph indicate? The defect severity index is sloping down consistently.
This indicates an increasingly favorable trend. As the test cycle progresses (from cycle 1 to
cycle 10), the severity index is sloping which suggests increasing quality of the application
(as lesser number of critical and high severity defects are being reported).
This is what it could mean: While a fall in the defect severity index is definitely a good
trend, looking at this index in isolation could be misleading. Following factors need to be
considered in order to have a meaningful analysis.
Number of defects logged - let us consider an example where the test team executed two
cycles of testing (assuming other things as constant). The number of defects logged against
each of these cycles along with the calculated severity index is shown below.
At first
thoughts, when we compare cycle 1’s Severity Index with cycle 2’s Severity Index, cycle 2
looks to be favorable (as the severity index is lower). If you go into the details of the
number of defects logged and their severity, the picture turns out to be the opposite. While
the total number of Severity 1 and Severity 2 defects for cycle 1 is 15, the number of
Severity 1 and Severity 2 defects for cycle 2 is 20. In terms of quality, cycle 1 is better
than cycle 2 as cycle 1 has lesser number of high severity defects (though the total number
of defects logged in cycle 1 is more than cycle 2 defects and the severity index is greater
than cycle 2 severity index). Test coverage has a similar impact. A lower test coverage
coupled with reducing severity index would not be a healthy trend.
Defect Severity - let's consider another example where the test team executed two cycles
of testing (assuming other things as constant). The severity of defects logged against each

24
of these cycles along with the calculated severity index is shown below.
Looking at the severity index, it looks like cycle 1 is better than cycle 2 (as the severity
index is low for cycle 1 compared to cycle 2). However, cycle 2 is better than cycle 1 as
total number of Severity 1 and Severity 2 defects is zero compared to a total of 8 severity 1
and severity 2 defects of cycle 1. Just because the severity index is low, do not believe the
quality of the application is better than the earlier cycle.

25
3. Process Automation
In following section describes about the testing methodologies, process and tools to be
used while automating the typical software development life-cycle in order to deriving the
metrics.
3.1 Testing Methodology
According to the Automated testing process, every development activity is mirrored by a
test activity. The testing process follows a well-proven testing methodology called W-
model. Following Figure-2.0 explains, the way of testing activities of W-model involve
with the standard software development life-cycle.
Figure 2.0 – The W-model
Figure-2.0
While the execution of the project, either developers or SPA team can generate the related metrics.
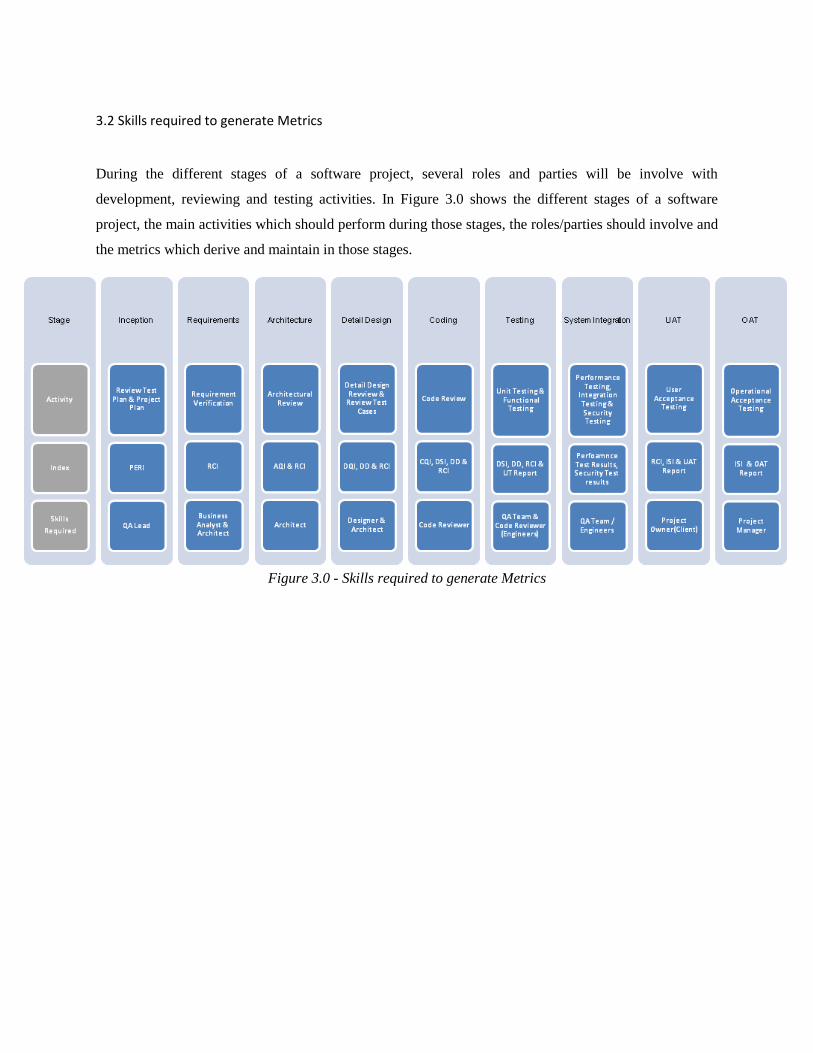
3.2 Skills required to generate Metrics
During the different stages of a software project, several roles and parties will be involve with
development, reviewing and testing activities. In Figure 3.0 shows the different stages of a software
project, the main activities which should perform during those stages, the roles/parties should involve and
the metrics which derive and maintain in those stages.
Figure 3.0 - Skills required to generate Metrics

3.3 Process of Setting-up a Metric
The Figure-4.0 explains the life-cycle of a Metric or the process involved in setting up the
metrics:
Figure 4.0 - Metrics Life-Cycle
When implementing this process, several testing tools and techniques will be used along with the
automated testing process in order to generating, maintaining and evaluating the metrics derived
at specific level of the Software development life-cycle.
3.4 Integration of testing tools/process
Below you find a list of tools /process which will be used when automating the typical SD life-
cycle suits to the Software Project Audit Process.
Fagan inspection - Fagan Inspection defines a process as a certain activity with a pre-
specified entry and exit criteria. Activities for which Fagan Inspection can be used are:
1. Requirement specification
Iterative

2. Software/Information System architecture (for example DYA)
3. Programming (for example for iterations in XP or DSDM)
4. Software testing (for example when creating test scripts)
Cruise Control – It is both a continuous integration tool and an extensible framework for
creating a custom continuous build process. It includes dozens of plug-ins for a variety of
source controls, build technologies, and notifications schemes including email and instant
messaging. A web interface provides details of the current and previous builds.
Bug-zilla - It is a Web-based general-purpose defect tracking and testing tool.
SVN - It is a revision control system which use Subversion to maintain current and
historical versions of files such as source code, web pages, and documentation.
Git - Git is a free & open source, distributed version control system designed to
handle everything from small to very large projects with speed and efficiency.
SCM - For Configuration identification and Identifying configurations, configuration
items and baselines. Also for Configuration control ,Configuration status accounting and
Configuration auditing
3.5 Displaying Metrics –The Dashboard
The Dashboard is the interface to help project teams to visualize their project statuses by several
indexes. And also it could be used to displaying the test results of specific tests carried by the
SPA team who responsible for the given project. As an example; in Figure 5.0 displays the
current status of the project with its estimated effort against the predicted effort.

Figure 5.0 – SPA Dashboard view

Annex D – Proposed System Architecture

eLH InfrastructureFirewall
Citizens
Proposed Cluster for eLHStandard : 2 instancesPeak times: up to 4 instances(Web, App, DB, GIS)
Citizen Portlet
LGN Switch
LAN- Administration- Operations Redundant, high-bandwidth
connectivity. (100% uptime)
Standard Internet connectivity
Data synchronization path
Interoperability Framework
Interoperability
services
e-SLIMS
Data Sync
WS
Scanner
Bar-code
Reader Printer
Functionality exposed via Web Services
Email gateway
SMS Gateway
CA
Surveyor
Surveyor
Portlet
Lawyers/Notaries
Lawyer/Notary
Portlet
Lanka GatePortal
FirewallLGN Cloud Infrastructure
DL Portlet
DL Owners(eg. CEB, UDA)
DL – Data Layer WS – Web ServiceCA – Certification Authority
LGN connectivity
Local Server[Web+App+DB+GIS]
(optional)
Land Registry
Data Sync
WS
Mobile Device
Future Portlets

Configurations of server instances
Web Server instance
OS: an Enterprise level OS (Linux)
- RAM 4GB (720 RAM Hours per month)
- Storage 10GB per month (OS + Application Server + caching etc)
-
Application Server instance
- OS: an Enterprise level OS
- RAM 8GB (720 RAM Hours per month)
- Storage 10GB per month (OS + Application Server + caching etc)
-
Database Server instance
- OS: an Enterprise level OS
- RAM 16GB (720 RAM Hours per month)
- Storage 1000GB per month (OS + Database Server etc)
- Required Qt
GIS Server instance
- OS: an Enterprise level OS
- RAM 16GB (720 RAM Hours per month)
- Storage 1000GB per month (OS + Database Server etc)
-
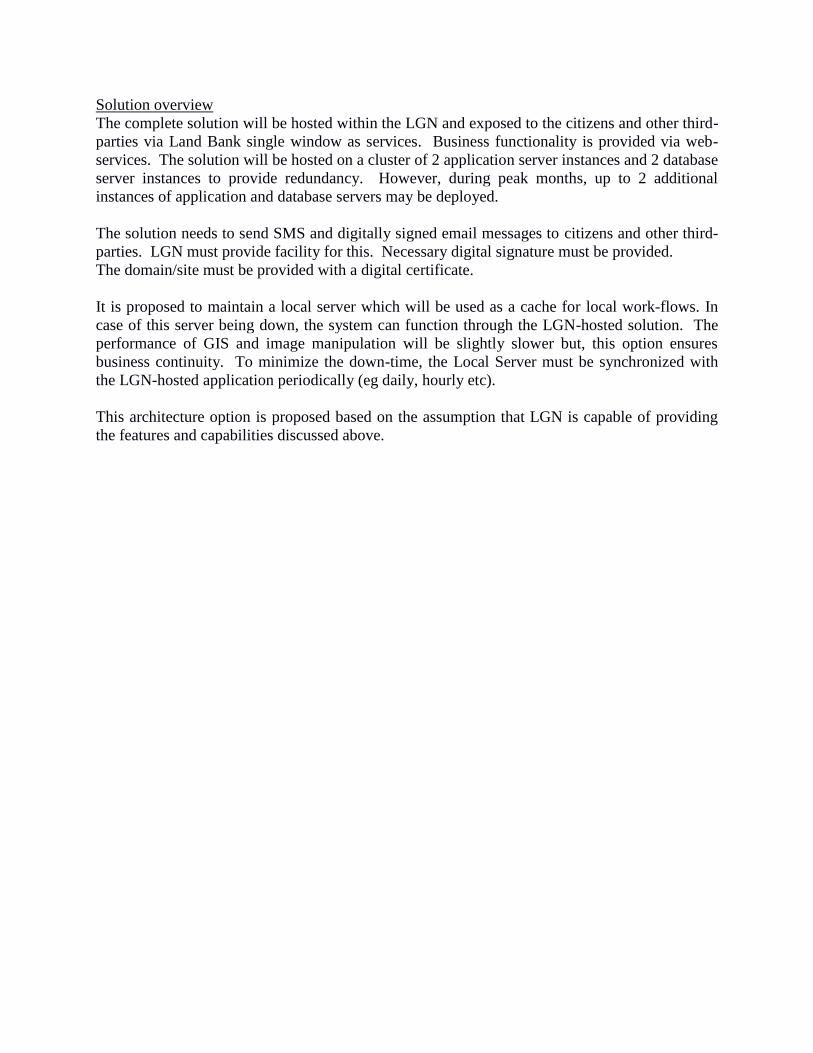
Solution overview
The complete solution will be hosted within the LGN and exposed to the citizens and other third-
parties via Land Bank single window as services. Business functionality is provided via web-
services. The solution will be hosted on a cluster of 2 application server instances and 2 database
server instances to provide redundancy. However, during peak months, up to 2 additional
instances of application and database servers may be deployed.
The solution needs to send SMS and digitally signed email messages to citizens and other third-
parties. LGN must provide facility for this. Necessary digital signature must be provided.
The domain/site must be provided with a digital certificate.
It is proposed to maintain a local server which will be used as a cache for local work-flows. In
case of this server being down, the system can function through the LGN-hosted solution. The
performance of GIS and image manipulation will be slightly slower but, this option ensures
business continuity. To minimize the down-time, the Local Server must be synchronized with
the LGN-hosted application periodically (eg daily, hourly etc).
This architecture option is proposed based on the assumption that LGN is capable of providing
the features and capabilities discussed above.