design-â€centered introduction to aerospace engineering
TRANSCRIPT
Extrovert E-‐book Series
Published under the EXTROVERT project, with thanks to NASA. February 2013
Design-‐Centered Introduction To Aerospace Engineering
Narayanan M. Komerath

Extrovert E-‐book Series
Published under the EXTROVERT project, with thanks to NASA. February 2013
Publishing Information The author gratefully acknowledges support under the NASA Innovation in Aerospace Instruction Initiative, NASA Grant No. NNX09AF67G. Tony Springer is the Technical Monitor. This version is dated February 18, 2013. Copyright except where indicated, is held by Narayanan M. Komerath. Please contact [email protected] for information and permission to copy.
Disclaimer “Any opinions, findings, and conclusions or recommendations expressed in this material are those of the author(s) and do not necessarily reflect the views of the National Aeronautics and Space Administration.”

Design Centered Introduction to Aerospace Engineering
N.M.Komerath
August 23, 2012

Contents
1 Welcome to Aerospace Engineering 31.1 Introduction to Aerospace Engineering: The Process of Designing a Flight Vehicle . . 41.2 Issues in Designing a Flight Vehicle . . . . . . . . . . . . . . . . . . . . . . . . . . . . 71.3 Aerospace Design: A Route Map of Disciplines . . . . . . . . . . . . . . . . . . . . . 91.4 Much Remains to be Learned About Flight . . . . . . . . . . . . . . . . . . . . . . . 101.5 Summarizing . . . . . . . . . . . . . . . . . . . . . . . . . . . . . . . . . . . . . . . . 11
2 Estimating the TakeOff Weight of an Aircraft 122.1 Example Aircraft with Statistics . . . . . . . . . . . . . . . . . . . . . . . . . . . . . 142.2 Design Step 2 . . . . . . . . . . . . . . . . . . . . . . . . . . . . . . . . . . . . . . . . 16
3 Force Balance 173.1 Newton’s Laws of Motion . . . . . . . . . . . . . . . . . . . . . . . . . . . . . . . . . 17
4 Equations to Describe Aircraft Motion 184.1 The Freestream and Aircraft Motion . . . . . . . . . . . . . . . . . . . . . . . . . . . 184.2 Coordinate System . . . . . . . . . . . . . . . . . . . . . . . . . . . . . . . . . . . . . 184.3 Equations Along Different Coordinate Axes . . . . . . . . . . . . . . . . . . . . . . . 194.4 Roll, Pitch, Yaw . . . . . . . . . . . . . . . . . . . . . . . . . . . . . . . . . . . . . . 20
5 The Atmosphere 225.1 The Atmosphere . . . . . . . . . . . . . . . . . . . . . . . . . . . . . . . . . . . . . . 225.2 Design Step 3 . . . . . . . . . . . . . . . . . . . . . . . . . . . . . . . . . . . . . . . . 25
6 Aerodynamic Lift and Drag 266.1 Lift . . . . . . . . . . . . . . . . . . . . . . . . . . . . . . . . . . . . . . . . . . . . . . 266.2 Drag . . . . . . . . . . . . . . . . . . . . . . . . . . . . . . . . . . . . . . . . . . . . . 296.3 Pressure . . . . . . . . . . . . . . . . . . . . . . . . . . . . . . . . . . . . . . . . . . . 296.4 Airfoil (British: “aerofoil”) . . . . . . . . . . . . . . . . . . . . . . . . . . . . . . . . . 30
7 Aerodynamics of Wings and Aircraft 327.1 Introduction . . . . . . . . . . . . . . . . . . . . . . . . . . . . . . . . . . . . . . . . . 327.2 Lift Coefficient . . . . . . . . . . . . . . . . . . . . . . . . . . . . . . . . . . . . . . . 337.3 Drag Coefficient . . . . . . . . . . . . . . . . . . . . . . . . . . . . . . . . . . . . . . . 347.4 Aerodynamic Summary . . . . . . . . . . . . . . . . . . . . . . . . . . . . . . . . . . 37
1
CONTENTS 2
8 Propulsion 388.1 How Jet Engines Work . . . . . . . . . . . . . . . . . . . . . . . . . . . . . . . . . . . 388.2 Turbojets, Turboprops, Turbofans . . . . . . . . . . . . . . . . . . . . . . . . . . . . 408.3 Ramjets . . . . . . . . . . . . . . . . . . . . . . . . . . . . . . . . . . . . . . . . . . . 408.4 Rockets . . . . . . . . . . . . . . . . . . . . . . . . . . . . . . . . . . . . . . . . . . . 418.5 Efficiency . . . . . . . . . . . . . . . . . . . . . . . . . . . . . . . . . . . . . . . . . . 418.6 Design Step 4 . . . . . . . . . . . . . . . . . . . . . . . . . . . . . . . . . . . . . . . . 43
9 Performance 449.1 Basic Performance Parameters . . . . . . . . . . . . . . . . . . . . . . . . . . . . . . 449.2 Climb Performance . . . . . . . . . . . . . . . . . . . . . . . . . . . . . . . . . . . . . 459.3 Level Turn Performance . . . . . . . . . . . . . . . . . . . . . . . . . . . . . . . . . . 499.4 Range and Endurance . . . . . . . . . . . . . . . . . . . . . . . . . . . . . . . . . . . 519.5 Minimum Velocity: Stall Speed . . . . . . . . . . . . . . . . . . . . . . . . . . . . . . 539.6 Takeoff and Landing . . . . . . . . . . . . . . . . . . . . . . . . . . . . . . . . . . . . 549.7 Design Step 5 . . . . . . . . . . . . . . . . . . . . . . . . . . . . . . . . . . . . . . . . 55
10 Stability and Control 5710.1 Important Points . . . . . . . . . . . . . . . . . . . . . . . . . . . . . . . . . . . . . . 5710.2 Static Stability . . . . . . . . . . . . . . . . . . . . . . . . . . . . . . . . . . . . . . . 5710.3 Aerodynamic Control Surfaces . . . . . . . . . . . . . . . . . . . . . . . . . . . . . . . 58
11 Structures 6111.1 Aeroelasticity . . . . . . . . . . . . . . . . . . . . . . . . . . . . . . . . . . . . . . . . 6111.2 Weight . . . . . . . . . . . . . . . . . . . . . . . . . . . . . . . . . . . . . . . . . . . . 63
12 High Speed Flight 6612.1 Introduction . . . . . . . . . . . . . . . . . . . . . . . . . . . . . . . . . . . . . . . . . 6612.2 Mach Number and Mach Angle . . . . . . . . . . . . . . . . . . . . . . . . . . . . . . 6612.3 Shocks . . . . . . . . . . . . . . . . . . . . . . . . . . . . . . . . . . . . . . . . . . . . 6712.4 Flight at High Subsonic and Transonic Speeds . . . . . . . . . . . . . . . . . . . . . . 69
13 Space Flight 7213.1 Rockets Revisited . . . . . . . . . . . . . . . . . . . . . . . . . . . . . . . . . . . . . . 7213.2 The Laws of Newton and Kepler . . . . . . . . . . . . . . . . . . . . . . . . . . . . . 73
Index 76
Chapter 1
Welcome to Aerospace Engineering
Most pioneers learned the "disciplines" of engineering through the hard route of designing devicesand systems. We try to capture this spirit by taking the learner through the process of conceptuallydesigning a flight vehicle. In the process, we explore the gateways to the various disciplines ofaerospace engineering, each leading to deep resources of knowledge and experience. Prepare forliftoff. We assume that you are a first year undergraduate, fresh out of high school. You will findyourself designing airliners and defining their flight envelopes, as you go through these chapters,follow the exercises and complete a few assignments.
This book is a condensed, refined version of a course that was first developed in the Summerof 1997, and first taught in Fall 1997 at Georgia Tech. In the 1990s, the aerospace industry was inrecession, after the Cold War ended and the need for large numbers of combat aircraft disappeared.Many students who came to Georgia Tech to study aerospace engineering, found themselves studyingwith excellent students from other disciplines. There was no introduction to aerospace engineeringin the first year of college, because it was assumed that students could not appreciate the issues inaerospace engineering until they had completed several courses in Mathematics, Physics, Chemistry,Statics, Dynamics and Strength of Materials. As they completed the second year, they foundthemselves having to decide between continuing alone in a school where they had never taken acourse, or going with their study-group friends into other disciplines. The School of AerospaceEngineering decided to try introducing the excitement of aerospace engineering in the first year.Several different approaches were tried, but they were either too simplistic (avoiding Math andPhysics) or far too complicated. The notion of using aircraft conceptual design as a vehicle tointroduce students in their first week of college to aerospace engineering, was rather risky, but ourstudents took to it with amazing enthusiasm. The course was taught several times in the subsequentyears. It was condensed into a 1.5-day Workshop for engineering students, and then for new engineersfrom other disciplines.
There are several excellent textbooks set at the level of a college student learning about aerospaceengineering. One is the textbook by Professor John D. Anderson [1]. Another book, set at a slightlyhigher level, but with excellent reference data, is the earlier book by Professor Shevell [2]. Dr.Tennekes, author of a famous and beautifully lucid textbook on the difficult science of Turbulence,has written a very simple book introducing flying vehicles [3]. This book is remarkable for the simplelinks between flying vehicles ranging from insects to jumbo jets, and showing, for example, that evena bird taking off for a flight across the Atlantic Ocean shares many design features with an airlinerdoing the same trip. Simmons [4] presents the aerodynamics of model airplanes. Alexander and Vogel[5] tell us about birds, insects and other flyers in nature, and Alexander [6] compares biomechanicalflight to larger aircraft. Brandt [7] uses an aircraft design perspective to introduce engineering.Damon [8] introduces the science of space flight. Kemp [9] discusses the opportunities opened by
3

CHAPTER 1. WELCOME TO AEROSPACE ENGINEERING 4
the advent of sub-orbital space flights. The Civil Air Patrol has published a nice introduction toflight [10].
Aircraft design is, of course, a highly specialized subject. One widely-used resource for aircraftdesign is the series of textbooks by Professor Jan Roskam [11]. Aircraft designers introduce manyvariables to calculate the values of parameters to a high level of accuracy. We use a much simplerapproach using the average values of these parameters. While less accurate, this approach givesuseful results quickly, and illustrates the process of designing a flight vehicle.
1.1 Introduction to Aerospace Engineering: The Process of Design-ing a Flight Vehicle
Aerospace Engineering is about converting dreams to reality using science, engineering, imaginationand determination. So we will first summarize today’s dreams, and consider a route map of disciplinesthrough which they can be converted to reality.
Today’s Dreams
Although today’s airplanes and spacecraft are amazing feats of technology, the field of aerospaceengineering is still very young. There are so many immense challenges before us. Let us considera few. As we consider each dream, we will have to wake up, and think a little about what exactlyeach entails. This is the first step in defining our requirements, putting numbers to the dreams.
Fly like a bird
Wouldn’t it be nice if we could fly like birds? What exactly does that mean, though? We wouldhave to fly in the speed range somewhere between 0 and about 160 kilometers (100 miles) per hour,We must be able to fly high enough and far enough to cross mountains and rivers, but we mustalso be able to land anywhere safely and at a very low landing speed. To avoid hitting the groundhard, the landing speed must be down in the range of 10 feet per second. The other feat that birdsroutinely accomplish is that of landing precisely on a branch and holding on to it as they spreadand then fold their wings, hardly even shaking the branch. That is a lot tougher.
Commute by Air
This is a dream of millions of people who find themselves sitting in traffic for hours every day. Wewish we could just fly from our home garage to the parking lot at our workplaces, and then backagain later in the day, to our garages. What does this imply in technical terms? There are alreadysome “flying cars”, invented since the 1970s. However, if these are to become as affordable as today’scars, enough of them would have to be produced and sold. So we must imagine a traffic managementsystem that can accomodate, say, 1 million cars over a big city. These cars may be moving at 200kilometers per hour, and they must be able to operate safely in all types of weather, includingthunderstorns, wind gusts and blizzards, and at night. The main problem is collision avoidance, andkeeping the commuters from killing themselves and each other.
City to City, doorstep service
The next dream is to be able to fly from one city to another, across states, and again, be able tofly from our homes to our destimations. Such flight would have to be quite fast, perhaps at 600kilometers per hour, so that we can visit friends and relatives who live, say, 1000 kilometers away.

CHAPTER 1. WELCOME TO AEROSPACE ENGINEERING 5
Perhaps in this case the vehicle will not be a personal one such as the commuter vehicle, but a largervehicle that might pick us up from near our homes, like a bus. It would have to take off and landvertically, so that no long runway is needed. While landing and taking off vertically, it must notmake much noise, or cause a strong downward blast of air.
Cross the World In a Day
Anyone who has travelled on a 14-hour or 17-hour airliner ride, and done so in economy class, willappreciate the desire for something that travels about 2 to 3 times as fast. Such a vehicle mightcruise at Mach 3, or 3 times the speed of sound. The speed of sound is roughly 600 miles of 960kilometers per hour, so this would be around 1800 miles or 3000 kilometers per hour.
Note: Did you notice that we are being rather loose with our arithmetic? I didn’t say that thespeed of sound on a standard day in the Stratosphere above 33,000 feet altitude in the InternationalStandard Atmosphere is precisely 583.47 Statute miles per hour etc. I have no idea if it is! Thatis quite all right for now. We need to develop the knack of making calculations in round numbersthat we can work out while sitting on the bus to school or walking around the Student Center withheadphones stuck on our ears. Once we get a grasp of the rough magnitudes of numbers, we can sitdown with a calculator or computer and work things out in detailed and accurate mathematics. Butsimply being precise is no good if we don’t have a grasp on the rough magnitudes.
Visit Low Earth Orbit
Many of us would like to experience the feeling of being in orbit around the Earth. The lowestaltitudes where we can do this are about 300 to 400km above the surface. However, the issue inreaching orbit is not the height, but the speed. Going into orbit is like being a ball at the end ofa string, being whirled around by a child. The string becomes taut as tangential speed of the ballincreases, and the radial stress increases. If she lets go, the ball will zoom out along the tangent tothe circle that she was describing in the air. One has to be moving at a tangential speed of about24,000 kilometers per hour to balance Earth’s gravity and be in orbit.
Our Orbital Joyrider (at least for me!) should be a reusable spaceliner, and it must take off,accelerate, re-enter the atmosphere, and land, routinely and in absolute safety and comfort. The“National Aerospace Plane” project announced by President Reagan was promptly dubbed the “Ori-ent Express” by the media. As advertised, it was to be a hypersonic airliner that could take youfrom Los Angeles or New York to Tokyo at many times the speed of sound, zooming to the edge ofSpace.
Consider that in the days of the Space Shuttle, NASA invited the public to watch the spectacularliftoff from parkig lots located at a safe distance. Following the liftoff, people would rush to get intheir cars and try to beat the rush out of the parking lot. Well.. before the average person could gettheir car out of the lot, they would be hearing the NASA commentator remark that the Shuttle wascrossing Africa. So the prospect of a hypersonic airliner sounds very exciting indeed. But considerthe acceleration and deceleration at the start and end of the journey. Accelerating at 3 or 4 timesthe acceleration due to gravity (3 Gs) or the vibration of a typical Space Shuttle liftoff are not verypleasant, even for highly trained astronauts. The airline would not have to feel bad about not serv-ing any lunch on those expensive flights, as most passengers would not be able to eat any or keep itdown for long. Not surprisingly, the National Aerospace Plane remains a dream, but surely some day

CHAPTER 1. WELCOME TO AEROSPACE ENGINEERING 6
some version of it will come about. You may be one of its designers who solves it’s toughest problems.
Reaching orbit is like throwing a ball. Once the ball leaves your hand, it is in a ballistic trajectory(imposing-sounding word, but see the first 4 letters? Aerospace engineers used to be kids too, andthe field is so exciting that it keeps us feeling young). The “throw” is the acceleration phase, whenyou are exerting thrust on the ball, and imparting an impulse or a packet of energy to the ball. Ifyou think about what a space vehicle does, its engines “burn” for the first few minutes, and then it“coasts” for millions and millions of miles. We will see more on this when we study about spacecraft,but if you are burning fuel to produce this impulse, then, clearly, you want to burn up all the fuelas quickly as possible, because you don’t want to spend the impulse on accelerating the fuel massitself. So the ideal way to launch something is to put in all the impulse at the very start, as quicklyas you can. This is why Space launch vehicles take off with such a spectacular display of immensepower: they are burning the fuel as fast as the engine will allow, and accelerating the vehicle asmuch as its structure can take.
It still costs a huge amount of money to launch anything into Space. Very little of this is theactual cost of fuel, or even of the materials used to build the vehicle. Most of the cost is in the timeand expertise it takes to design, fabricate, analyze, test, document, inspect, monitor and control theentire process. In other words, it is in the salaries of the people who work in the program. Withoutthem, and without their full attention and expertise, space flight would not only be very difficult,it would be unacceptably dangerous. And no, this is not “government waste” and no, aerospaceengineers do not get paid outrageous salaries or bonuses. But the net result is that today, the costof sending anything to orbit, or to speeds similar to orbital speeds (as for that Saturday morningtrip to Tokyo Mall) is immense. It costs something like $30,000 per kilogram of mass, to go to orbit.Yes, that means that if you weigh 180 lbs on Earth, your mass is around 82 kilograms. It will costat least $2.46 million to send you to orbit - or to Tokyo Mall. For much less than that, you couldgo on the Internet from the comfort of your home, and in less time than it takes to say “10..9...Ignition!” you could charge that on your credit card and have the items shipped to you next day -usually on an airplane that aerospace engineers like you designed. This is the toughest problem ofall in the Space program. The launch cost to orbit must be brought to about $100 per kilogram orless, to make it really worthwhile to do many things in Space.
Visit nearby planets
Wouldn’t it be cool to go and prance around in the 0.3G gravity field of Mars, or see the frozenseas of Titan, or zoom through the rings of Saturn? Some day, surely, people will. Right now, theprospect requires that we get up to speeds of over 100,000 kmph; months of endurance because thedistance is just so immense, and, most difficult of all, we need some way of shielding ourselves fromthe radiation in Space, once we are outside the protection afforded by the lovely blue skies of ouratmosphere. The Sun, from where most of our energy comes, is one huge nuclear reactor, with bothnuclear fission reactions (large, massive atoms breaking into smaller ones) and nuclear fusion (tinyatoms like hydrogen joining to form more massive ones) occurring. These processes give us sunlightand warmth, but also release powerful ultraviolent rays, gamma rays and X-rays, all of which canbreak the cells in our bodies and kill us. In addition to these, in Space there are other wanderinghigh-energy particles running away from awful events such as exploding stars. These are calledCosmic Radiation and they may be particles traveling at maybe 75 kilometers per second. They cango right through most things, which sounds harmless, except that they may hit the aluminum or
CHAPTER 1. WELCOME TO AEROSPACE ENGINEERING 7
steel shell of our craft and cause thousands of smaller particles and rays to emanate from the insideof these shells and kill us. And on top of these, let’s not forget those tiny specks of whatever floatingabout in orbit. They may be as small as dust, but they can punch a hole a couple of millimeters indiameter in metal skins or circuit boards - or through pressure suits and people.
So look at those astronauts with a bit more respect. Yes, they ARE brave people, because forall the expertise of the Space Agencies looking after them, no one can really protect them againstthose last-named dangers.
If you really are determined to stop radiation and microscopic particles, there is one way: sur-round yourself with about 3 meters (roughly 6 feet) thickness of soil, either from the Earth or,say, from the Moon. That will stop most things. Unfortunately, if you calculate the mass of avehicle that has such thick walls, and multiply that by $30,000 per kilogram, you decide again thatit’s not time to take that trip. Some day someone will solve this problem. That someone may be you.
Visit nearby star systems
The nearest star to the Solar System is , which is about 4.24 light-years, or 40 trillion kilometersaway. Obviously, to traverse such a distance in any acceptable time, a vehicle must travel at a speedthat is a substantial fraction of the speed of light. This is the relativistic speed domain, wherestrange things are expected to occur.
Travel to deep space
Many interesting places including stars that have Earth-like planets, are millions of light years away.How we might start traveling to such places, is a matter of speculation. Our ideas of travel may becompletely changed as we consider methods to travel to such places. Maybe they will tell us?
Nanoprobes
At the other end of the size and speed spectrum, is the quest to go ever smaller, and explorephenomena at tiny size levels. Nanoprobes have dimensions on the order of one nanometer.
1.2 Issues in Designing a Flight Vehicle
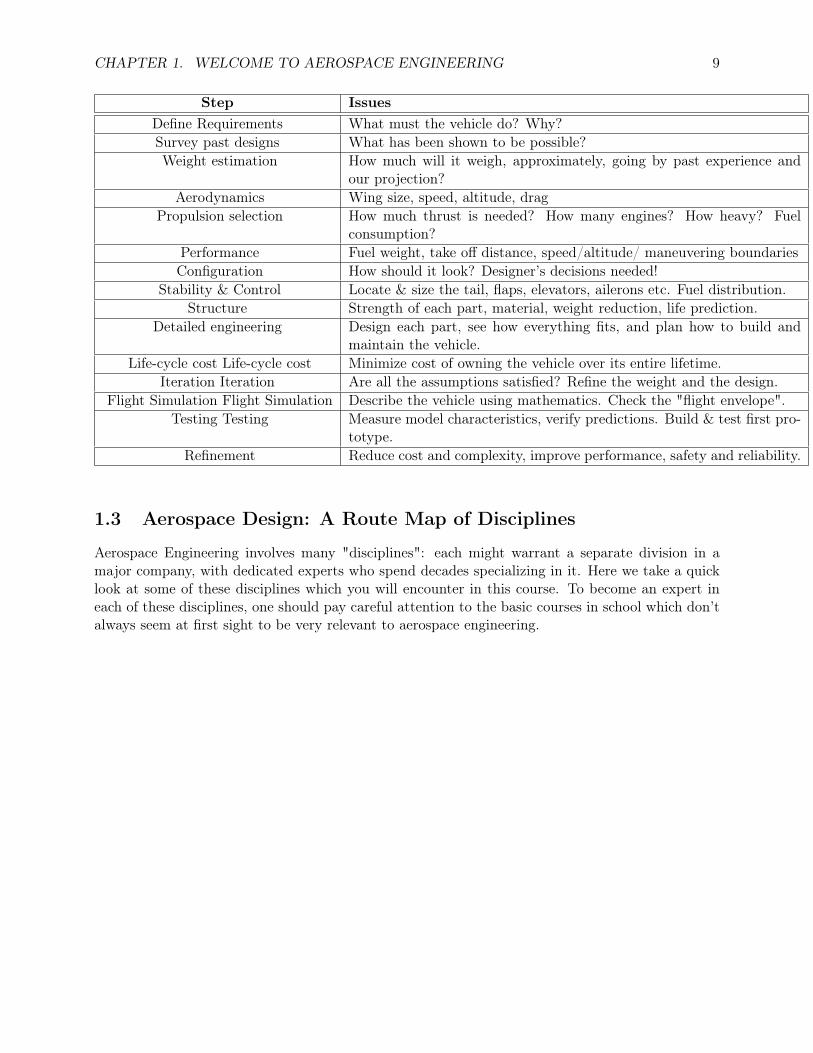
In the table below, we summarize the process of flight vehicle design. The first column lists thesteps, and the second says what each step does. The first step is th define the requirements, ordecide what we want to do and why. That looks easy, but aircraft manufacturers will tell you thatthis is the most crucial step of all, and perhaps the one that is hardest to do as accurately as it mustbe done. This step requires the company to talk to hundreds, even thousands, of people, argue forhours, and eventually distill a clear idea of what the vehicle must be able to do. Why is this so?It is because the vehicle must eventually succeed in the marketplace, whether the customer is themilitary, a space agency, an airline, or a private owner. It must do better than predecessors havedone, and yet not try to do too much.
The next step is, shockingly, to go and sneak a peek, or in fact spend a great deal of time andeffort peeking, at what others have done before. This is called benchmarking. What has been shownto be possible? For instance, has anyone managed to design an aircraft that can carry 2000 people

CHAPTER 1. WELCOME TO AEROSPACE ENGINEERING 8
and their pets and bags and enough food and water for the trip, non-stop at 700 miles an houraverage speed, for 10,000 miles? If not, what exactly have they achieved? Why did they do that,and what stopped them from doing any better? You see that this gets pretty deep, but at the begin-ning it is as simple as listing the specifications of flight vehicles that are in the same general class ofsize, speed, capacity to carry useful load, and range, as the one that you are contemplating designing.
In this process, we adopt two attitudes. First, we respect the engineers who designed the vehiclesthat flew in the past, or are flying today, and assume that they did about as well as anyone couldhave done, and that they were very smart and very hard-working people. In other words, a veryhard act to follow. Secondly, we boldly assume that we will also learn what they learned, and be assmart and hard-working, and maybe, just maybe, a bit smarter or work a bit harder, since we havetheir experience to teach us. So we can do better, but not immensely better, than they did. This isthe culture of aerospace engineering. Brash we may sound, but inside we have a healthy respect forour competition, because if they are anywhere near as smart and quick as we are, well, they must bepretty awesome too. But we can’t afford to sit around being over-awed by them, because we haveto do better.
The rest of the design process is pretty straightforward and logical. Please read the table, and aswe get to each topic later, we will detail it. One observation to make: Note that the design processis iterative. We do not sit around until we can magically come out with a perfect design at the firstattempt. Everything is linked to everything else, so where does one start? We break out of thisdilemma by making a bold guess at the final answer, say how much the vehicle will weigh when itis all done. This is where it helps that we have the answers that our predecessors achieved. We willguess something a little better. Then figure out all the things that this implies, and suddenly wehave a detailed specification of the vehicle. Maybe it won’t work, and if that is the case, we will goback and refine our initial guess, and do everything over again, until everything fits perfectly.
In the old days this was painful, as one had to everything with a slide rule and pencil and eraser- but aerospace engineers still did it! Today it is so much easier to do with a spreadsheet on acomputer. And take heart. My freshman students at Georgia Tech in 2010 complained bitterly atthe immense amount of calculations that they had to do in SIX weeks, to get their first design done.So much calculation! So many hours! Oh, their poor brains! Their hands as they had to type andwrite! They had never had to work so hard in high school, the poor dears! So I asked them to revisethe entire design, for a vehicle that was quite different - it would use liquid hydrogen as fuel insteadof the usual petroleum jet fuel. I gave them one week to do it. They did it. Then I asked them todo the essential parts of those calculations for another vehicle, as one question out of 6 on a 3-hourfinal examination, with no computer available to help them. So they had all of 30 minutes to do it.They complained that that was hard - but the point is, they did it, and did it very well. THAT, dearreader, is the power of iteration, when there is an aerospace engineer learning from the experience.So yes, most people find this stuff difficult. But persist, pay attention, and you will excel at it.
CHAPTER 1. WELCOME TO AEROSPACE ENGINEERING 9
Step IssuesDefine Requirements What must the vehicle do? Why?Survey past designs What has been shown to be possible?Weight estimation How much will it weigh, approximately, going by past experience and
our projection?Aerodynamics Wing size, speed, altitude, drag
Propulsion selection How much thrust is needed? How many engines? How heavy? Fuelconsumption?
Performance Fuel weight, take off distance, speed/altitude/ maneuvering boundariesConfiguration How should it look? Designer’s decisions needed!
Stability & Control Locate & size the tail, flaps, elevators, ailerons etc. Fuel distribution.Structure Strength of each part, material, weight reduction, life prediction.
Detailed engineering Design each part, see how everything fits, and plan how to build andmaintain the vehicle.
Life-cycle cost Life-cycle cost Minimize cost of owning the vehicle over its entire lifetime.Iteration Iteration Are all the assumptions satisfied? Refine the weight and the design.
Flight Simulation Flight Simulation Describe the vehicle using mathematics. Check the "flight envelope".Testing Testing Measure model characteristics, verify predictions. Build & test first pro-
totype.Refinement Reduce cost and complexity, improve performance, safety and reliability.
1.3 Aerospace Design: A Route Map of Disciplines
Aerospace Engineering involves many "disciplines": each might warrant a separate division in amajor company, with dedicated experts who spend decades specializing in it. Here we take a quicklook at some of these disciplines which you will encounter in this course. To become an expert ineach of these disciplines, one should pay careful attention to the basic courses in school which don’talways seem at first sight to be very relevant to aerospace engineering.

CHAPTER 1. WELCOME TO AEROSPACE ENGINEERING 10
Aspect Basic disciplines needed
Mission Specification Technology forecasting, market surveys, vehicle perfor-mance, economics, social sciences, political science
Weight EstimationStatistics, technology forecasting
AerodynamicsPhysics, calculus, computer science
PropulsionPhysics, thermodynamics, chemistry, lasers, optics, environ-mental sciences, acoustics
PerformancePhysics, Statics and Dynamics, calculus; flight mechanics
StructuresMaterials, Statics, Dynamics, Strength of Materials.
Layout and detail designEngg. graphics, psychology, economics, ergonomics
Stability Statics, calculusControls Laplace transforms, differential equations, electrical engg.,
computer scienceInstrumentation & communications Optics, electronics, signal processing, computingSpace propulsion Electricity, magnetism, nuclear engg., chemistry, physics, dy-
namics, thermodynamics
Trajectories & space mission design Dynamics, astronomy, modern physics
Spacecraft designHeat transfer, materials, photoelectricity, thermodynamics,chemistry, physics, physiology, electrical circuits
Flight SimulationFlight mechanics, image processing, engg. graphics, com-puter science, control theory.
Ground and flight testing and exper-imentation
Physics, chemistry, mechanical design, electronics, signalprocessing, image processing, computer science.
Lifecycle costManufacturing, Systems Engg., Optimization, Economics,Political and Legal Issues.
1.4 Much Remains to be Learned About Flight
Today’s designs can fly over 100 times as fast as the Wright Flyer, and go right out into space, circlethe earth every 90 minutes or so, and return to precise touchdowns on earth.
In the 1920s, a whole 17 years since the Wright Brothers made their first flight, the newspapersclaimed that airplanes had reached the limits of speed and altitude. So-called Experts “proved” thatthere was no “scope” in this field. After all, they argued, what more could be done, than what hadalready been demonstrated?
So as of 2013, humans have around 110 years of powered flight experience. Birds and insects have1 million-plus years of evolution, i.e., iterative design improvements, built into them. We cannotmatch the control precision, landing versatility, payload fraction, engine weight fraction, fuel costs,maneuverability, reconfigurable geometry, or structure weight fraction of birds and insects. By com-parison with birds and insects, today’s aircraft are still fragile and clumsy.

CHAPTER 1. WELCOME TO AEROSPACE ENGINEERING 11
They have stiff, nearly-rigid wings that can’t flap, twist, fold or thrust to any significant degree.They need long runways and complex traffic control systems. You have to drive through 2 hours ofdowntown traffic and spend an hour and a half at the airport and another 30 minutes on the taxiwayto make a flight of 200 miles. When we launch spacecraft, only 10% of the total launch mass everreaches orbit: the rest is wasted.
1.5 Summarizing
You are already well into aerospace engineering. You saw how the dreams of far-out concepts areimmediately translated into tangible requirements with numbers. You confidently put down numbersfrom calculations done in your head, without worrying that the arithmetic was not exact to 5 decimalplaces. You have seen how this process gets us thinking about how to meet those requirements, andeventially tells us what is needed. You have also seen some of the real obstacles in the way ofachieving those dreams. Next, we will start the process of thinking through the requirements forsomething much closer to us: an airliner, or a “civilian transport aircraft”.

Chapter 2
Estimating the TakeOff Weight of anAircraft
Let us think about how an aircraft might be designed. How does one decide how big it should be,or its shape? How does one know whether it will travel as high and as fast and as far as we wantit to do? All of its properties are related to one another. The designer needs a systematic process.If we knew how much the aircraft weighs, we could reason that it needs at least that much lift,and enough strength in the structure to support this weight, and so on. But until the aircraft iscompletely designed, how can one hope to know how much it weighs? Below we see how simple thisprocess is. We start by guessing the most difficult answer of all: the Take Off Gross Weight of theaircraft. We try to reduce the uncertaintly of this guess as much as possible by looking at whatother people have done, and how those aircraft turned out in practice. There is nothing wrong intaking such a guess. We will systematically calculate everything else based on this guess, and thenat the end we will see if the weight really turns out to be close to the guess. Otherwise, we will knowhow to change the guess and “converge” on the right answer after a few iterations of the procedure.
Requirements Definition / Mission Specification
First, we have to decide what we want the contraption to do. Then we will think of a "typicalmission profile". To do these, we must find out what our customers really want, what others havebeen able to achieve in the past, and what opportunities are opened by new developments. Inindustry, this is a crucial stage requiring massive effort and intense thinking, because this is goingto be the basis to commit the company’s future. It involves discussions, analyses and trade studieswith the airlines, financiers, regulating agencies, airports, law-makers and advertising or marketingagencies. Engineers have to learn to excel in this environment.
Excercise: Mission Specification
Regional jet aircraft using hydrogen fuelRange: 1600 kmCruise Speed: 500 kmph minimum80 passengers
Typical Mission Requirements:Atlanta - Rayleigh-Durham NCAlbuquerque-San Antonio
12

CHAPTER 2. ESTIMATING THE TAKEOFF WEIGHT OF AN AIRCRAFT 13
Denver-Atlanta in summerShort turn-around time. Fuel-efficient
Independent operation: No “jetway” needed. Reliable: All weather
Weight Estimation and Benchmarking
The mass to be carried is the “payload”. This is the load which we get paid to carry. Once thepayload is determined we ask, “haven’t others tried to do something similar or close to this? Howmuch did their aircraft weigh?”
This is known as “benchmarking”, getting a rough idea of the weight fractions of the various systemsinvolved. For example, fuel weight may be 50% of the takeoff weight of a long-range airliner.
How Takeoff Gross Weight (TOW) of an Aircraft is Broken Out
Component Fraction
Payload Fraction: passengers+crew, baggage, food+water, cargo Wpayload
TOW
Propulsion Fraction: Engines, engine control systems, nacelles, fuel lines, fuel pumps,fuel tanks
Wengines
TOW
Structure and Controls Fraction: Everything else fixed to the aircraft: wings, fuse-lage, control surfaces, instruments, landing gear, hydraulic systems, air conditioning,lights, interior furnishings.
WstructureTOW
Fuel Fraction Wfuel
TOW
Total: 1.0
Note: However you break it out, you must make sure that everything is included somewhere, andonly once.
Example: Computing TOW
Takeoff gross weight is simply the payload divided by the payload fraction. For example, if thepayload is 30,000 lbs, and we find that a reasonable payload fraction that we can achieve is 0.15,then the TOW is 30,000/0.15 = 200,000 lbs.
This is an estimate. You just learned how to get across the most difficult “canyons” of techni-cal uncertainty in engineering: you jump across it. You make a “reasonable guess”, see where itleads, and then refine the guess as you learn more.
The rest of the design is to make sure we come in under this estimate, when we calculate ev-erything else.

CHAPTER 2. ESTIMATING THE TAKEOFF WEIGHT OF AN AIRCRAFT 14
When we have a rough calculation of all the other things, we will go back and “iterate” many timesto refine our estimates, so that the whole vehicle gets better. For this we will spare no technicaleffort, and it will take years.
Benchmarking
There is a wide range of answers to our question about the payload fraction. Some craft weigh onlyfour times their payload; others way ten times the payload. There is some similarity between thesepayload fractions for aircraft which have similar missions and payloads. In our case, one way ofclassifying missions may be passenger-miles, the product of the number of passengers and numberof miles of range. There are many other ways of doing the classification.
2.1 Example Aircraft with Statistics
Embraer 190 Commercial Regional Jet, Brazil
Wingspan 23.56 mLength 36.15 mHeight 10.48 m
Cruise Speed: Mach 0.80
Boeing 787
Figure 2.1: Boeing 787. Image courtesy of http://inslee.house.gov/issue/aerospace
Length 57 mWingspan 60 mWing Area 325 m2
Height 16.9 mMax Takeoff Weight 228,000 kg
Range 14,000 - 15,000 kmCruise Speed Mach 0.85

CHAPTER 2. ESTIMATING THE TAKEOFF WEIGHT OF AN AIRCRAFT 15
F-35 Joint Strike Fighter
Figure 2.2: F35. Image courtesy of www.jsf.mil
Wingspan 35 feetWing Area 460 feet2
Length 51 feetEmpty Weight 29,300 lb
Max Takeoff Weight 70,000 lbRange 1,200 nmi

CHAPTER 2. ESTIMATING THE TAKEOFF WEIGHT OF AN AIRCRAFT 16
Sukhoi Su-30MKI
Figure 2.3: Sukhoi Su-30. Image Courtesy of http://www.usafe.af.mil/shared/media/photodb/web/080713-F-4964T-02.JPG
Wingspan 14.70 mLength 21.94 m
Wing Area 62 m2
Height 6.36 mEmpty Mass 17,700 kg
Max Takeoff Mass 34,000 kgRange 3,000 km
2.2 Design Step 2
6. Determine payload. Mass per passenger = ( ) kg. Supplies per passenger = ( ) kg. Baggageper passenger = ( ) kg. Cargo per flight = ( ) kg. Total payload = ( ) kg.
7. Determine payload mass fraction.
8. Determine Takeoff Gross Weight (TOW).
Chapter 3
Force Balance
The wings (and horizontal tails to some extent) support the weight of the whole aircraft. The restof the aircraft just hangs from these lifting surfaces. Of course the wings and tails themselves haveweight. On most aircraft, the wings contain most of the fuel. We can use Newton’s Laws of Motionto calculate the acceleration of an aircraft, and thus decide how the forces on the aircraft must bebalanced to make it go in a desired direction.
3.1 Newton’s Laws of Motion
Newton’s First Law of Motion
The first law defines the concept of equilibrium. It says: An object continues to be in a state of restor uniform motion unless there is a net force acting on it.
Newton’s Second Law of Motion
states that the net force on an object is equal to the time rate of change of momentum.
F =d(mv)
dt
Using the chain rule:
F = (dm
dt)v +m(
dv
dt)
If the mass remains unchanged,
F = mdv
dt= ma
Force and acceleration are vectors: they have magnitude and direction. If two vectors are equal, i.e.,~A = ~B, then,
Ax~i+Ay~j +Az~k = Bx~i+By~j +Bz~z
orAx = Bx, Ay = By, Az = Bz
Newton’s Third Law of Motion
Every action has an equal and opposite reaction. For example, if the engine of an airplane producesthrust which pulls forward on the aircraft, then the aircraft pulls on the engine in the oppositedirection.
17

Chapter 4
Equations to Describe Aircraft Motion
4.1 The Freestream and Aircraft Motion
Definition of Freestream Velocity
Since our interest is in the aircraft, and not so much on what happens to the air in a given place,we start by thinking of what we would see if we were attached to the aircraft. It appears that theaircraft is sitting still, and the whole atmosphere is rushing towards, past, and away from the craft.This is similar to the situation in wind tunnel where aircraft models are tested. The model is held inplace in the test section of the wind tunnel, and the wind speed is adjusted for each test condition.This leads to the concept of a freestream speed.
The freestream is the air upstream of an aircraft. The freestream velocity is the velocity of thisair relative to the aircraft. It is denoted as u∞ or v∞, though this text more commonly uses theformer. An aircraft can be said to be moving at a velocity u∞, though in that context it refers to thevelocity with the same magnitude but opposite direction of the freestream’s direction.
The definition of the freestream is very important, for the definitions of lift and drag depend onit. Lift is defined as the force perpendicular to the freestream velocity, and drag is defined as theforce parallel to the freestream velocity.
Angle of Attack
The chord line of an airfoil or wing is the straight line from the center of curvature on the leadingedge to the trailing edge. The angle of attack, denoted as α, is the angle this line makes with thefreestream, as shown below.It is important to note that the aircraft is still traveling in the direction of the freestream.
Angle with the Horizon
The angle between the freestream and the horizon is denoted by θ.
4.2 Coordinate System
We typically use a NED (north-east-down) coordinate system, with the x direction coming out of thethe nose of the aircraft, the y direction exiting the starboard side of the aircraft. The z axis points
18

CHAPTER 4. EQUATIONS TO DESCRIBE AIRCRAFT MOTION 19
down to the earth, and is positive down.
4.3 Equations Along Different Coordinate Axes
Weight acts towards the center of the earth (or whatever the closest massive heavenly body is). Thetwo component equations are:
Along x: − L sin θ −D cos θ + T cos θ = Max
Along z: L cos θ −D sin θ + T sin θ −W = Maz
The total acceleration vector of the aircraft is given by the components along the the x, y, and zdirections.
In the case above, there is no acceleration along the y-direction because there is no net force alongthat direction.
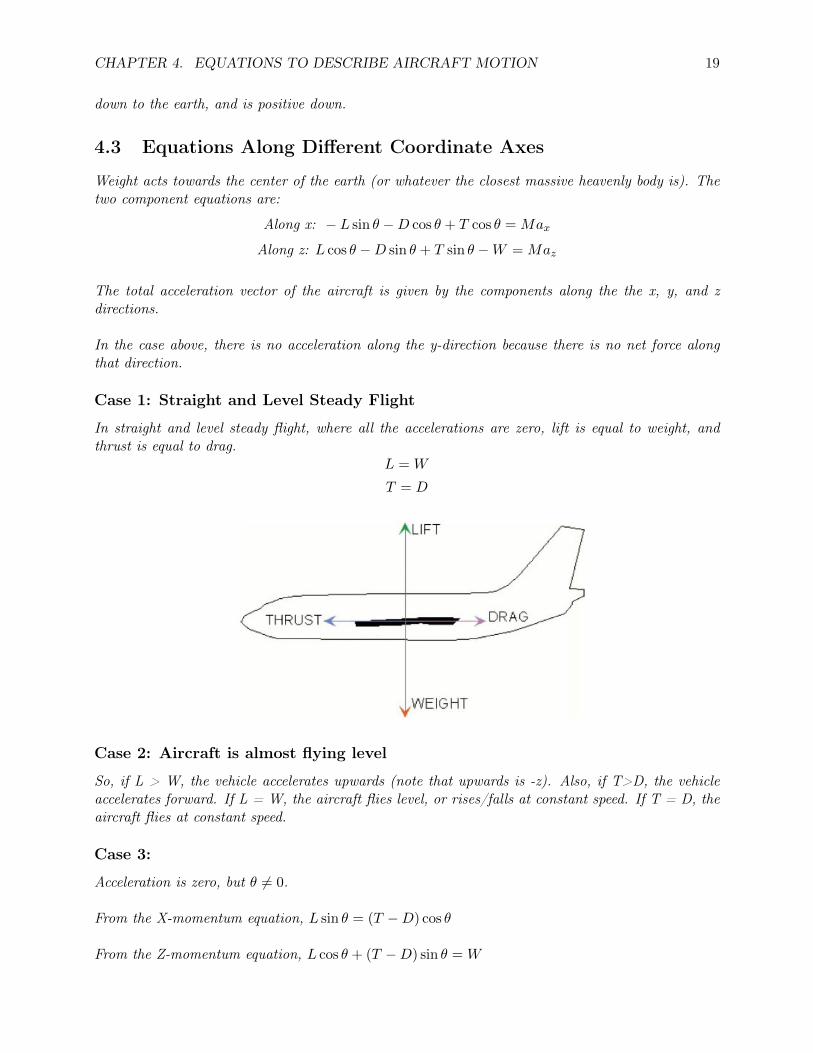
Case 1: Straight and Level Steady Flight
In straight and level steady flight, where all the accelerations are zero, lift is equal to weight, andthrust is equal to drag.
L = W
T = D
Case 2: Aircraft is almost flying level
So, if L > W, the vehicle accelerates upwards (note that upwards is -z). Also, if T>D, the vehicleaccelerates forward. If L = W, the aircraft flies level, or rises/falls at constant speed. If T = D, theaircraft flies at constant speed.
Case 3:
Acceleration is zero, but θ 6= 0.
From the X-momentum equation, L sin θ = (T −D) cos θ
From the Z-momentum equation, L cos θ + (T −D) sin θ = W

CHAPTER 4. EQUATIONS TO DESCRIBE AIRCRAFT MOTION 20
Rate of Climb
Dividing the X-momentum equation by the Z-momentum equation,
tan θ = (T −D)/L
w sinU(T −D)/L
tan θ =w
u
If θ is small (as is usual under a routine climb condition where one is not in any desperate hurry),the value u is fairly close to the magnitude of the velocity vector, U. Then, approximately,
If w > 0, then the aircraft is climbing. From these we note:
1) If the lift is greater than the weight, then the aircraft will accelerate upwards.
2) If the thrust is greater than the drag, the aircraft can climb if the thrust acts at an angle tothe flight direction. Thus there are different ways of achieving the same result.
Sideward Forces: Level Turn
By rolling an angle φ, the aircraft uses part of the lift force acting on the wings to execute turns,because lift acts perpendicular to the wings. As a result, a component of the lift, L sinφ, acts to makethe aircraft turn. This force, called the centripetal force, is the force directed towards the center, andis equal to MU2
R . The value L sinφM is the radial acceleration.
(Image here)
Notes from the figure:L cosφ = W
L sinφ =MU2
R
To pull tighter turns (smaller radius R) at a smaller value of U, L sinφ must be made larger.
If the aircraft is not to lose altitude during this maneuver, L cosφ must be as large as the weight, W.
4.4 Roll, Pitch, Yaw
An airplane can use its control surfaces to pitch, roll, and yaw. Each of these is a rotation about theaxes defined earlier.
Pitch
Pitch is typically controlled by the elevator, a horizontal control surface on the tail. Moving theelevator rotates the plane about the y-axis, which runs through the wings of the plane.
Roll
Rollis typically controlled by ailerons, horizontal control surfaces on the wings. Moving the aileronsrotates the airplane about the x-axis.

CHAPTER 4. EQUATIONS TO DESCRIBE AIRCRAFT MOTION 21
Yaw
Yaw is typically controlled by the rudder, the vertical control surface on the tail. Moving the ruddercauses the plane to yaw, or rotate about the z-axis (vertical axis). Deflecting the rudder to the rightcauses the aircraft nose to yaw to the right.

Chapter 5
The Atmosphere
5.1 The Atmosphere
Earth’s radius at the equator is about 6,378.137 km (3963 miles). The polar radius is about 6,356.750km (3,950 miles). There are about 90 kilometers of gaseous atmosphere, or 270,000 feet of gaseousatmosphere. Outer space is over a hundred miles up, but there is very little air above 51 miles.
Because of gravity, the air above presses down on the air below. At sea level, air pressure is enoughto support a column of mercury (Hg), 760 millimeters (mm) high: 101,325 N/m2. For a given basearea, this column of mercury weighs about the same as a column of air only 11 kilometers high atsea level air density. So most of the air is in the bottom layers of the atmosphere.
Hydrostatic equation
At a height h above the surface, let’s say that pressure is p Newtons per square meter (N/m2, orPascals), and density is ρ kilograms per cubic meter (kg/m3). The acceleration due to gravity ismeters per second squared (m/s2). If you go up a tiny distance dh, the pressure decreases by a tinyamount dp.
dp = −ρgdh
This is because you no longer have to support the weight of the element dh of the air column thatwent below you.
Perfect Gas Law
The Perfect Gas Lawis a relation between pressure, density, temperature and compositio of a gas.
p = ρRT
R depends only on the composition (i.e., the average molecular weight) of the gas, i.e., air. Know-ing that air is generally composed of 20% diatomic oxygen (O2; molecular weight MW = 32), 79%diatomic nitrogen (N2; MW=28), and 1% argon (MW=44).
Average (or “mean”) molecular weight of air is [(0.2)(32) + (0.79)(28) + (0.01)(44)]=28.96
The Universal Gas Constant is 8314 J/kmol-K in SI units.
22

CHAPTER 5. THE ATMOSPHERE 23
Figure 5.1:
Thus the gas constant for air is R = (8314 J/kmol-K) / (28.96 kg/kmol) = 287.04 J/kg-KDifferentiating the perfect gas law,
dp
p=
(−gRT
)dh
ln
(P2
P1
)=
(−gRT
)(h2 − h1)
If T is constant,P2
P1=ρ2ρ1
= e(−gRT
)(h2−h1)
This holds in the Stratosphere, the region between 11,000 meters and 25,000 meters.
In gradient regions, where T changes as altitude changes, we will assume that this variation islinear, i.e.,
T2 = T1 + a(h2 − h1)
P2
P1=
(T2T1
)−gaR
ρ2ρ1
=
(T2T1
)(−gaR−1)
This holds in the Troposphere, the region between sea level and 11,000 meters.
CHAPTER 5. THE ATMOSPHERE 24
Troposphere
In the Troposphere (the region below 11,000 meters), the constant a is approximately -0.0065 Kelvinper meter. Thus, for a standard sea-level temperature of 288.12 Kelvin, the temperature in thetroposphere is given by:
T = 288.12− 0.0065h
where h is in meters. In this region, the pressure and density variations can be found as follows:
P2
P1=
(T2T1
)−gaR
density:ρ2ρ1
=
(T2T1
)[−gaR−1]
Example:What is the standard temperature at 5000 meters? T = 288.12− (5000)(0.0065) =
Sea-Level Standard Conditions
Sea-Level Standard Conditions: Temperature = 288.12 K, Pressure = 101,325 N/m2, Density =1.225 kg/m3.We can express the pressure at a point on a given day as “so-many meters, , meaning: “If I were ina Standard Atmosphere, and measured this pressure, I would be at this altitude”. Similarly, we canexpress and .
A major issue arises in tropical countries where there are high mountains, such as India for India:The density Altitude is often much higher than geometric altitude. For example, in the Himalayas,where long runways are anyway hard to come by, landing speed becomes too high for the availablefield length, on summer days. Helicopters find that they cannot clear ridges, and must fly throughcanyons and valleys instead, which is infinitely more dangerous.
Regions of the Atmosphere
Below 500 meters, we are in the Atmospheric Boundary Layer. The winds in this region get ob-structed by hills, buildings, and by the friction of moving over the ground; hence they slow down andbecome turbulent. This is where we see most of the gusts, tornadoes, rain, snow, etc. Above this,and below 11,000 meters, is the Troposphere. Most of the “weather” occurs in this region, thoughsome thunderstorms rise as high as 18,000 meters.From about 11,000 meters to 25,000 meters is the Stratosphere, where the temperature is constantat a cold 216.7 Kelvins. Most of today’s airliners cruise in this region.From 25,000 meters to about 47,000 meters, the temperature rises again, linearly, reaching 270.65 Kby 47,000 meters. Above that, the temperature is again assumed to remain quite constant. Compo-sition starts changing approximately above 50,000 meters due to dissociation and ionization, causedby radiation and high-energy particles from space.
CHAPTER 5. THE ATMOSPHERE 25
Some Sample Values
Altitude (m) Temp (K) Density (kg/m3) Pressure (N/m2) Viscosity (N· s/m2)0 288.15 1.225 101,327 0.0000178911,000 (end of tropos.) 216.50 0.363925 22,633 0.0000142125,000 (end of stratos.) 221.65 0.03946 2511.18 0.0000144847,000 (end of lineartemp increase)
270.648 0.00142 110.916 0.00001703
60,000 245.452 0.00028 20.3156 0.0000157571,000 214.652 0.00006 3.95698 0.00001410
Note, in summary:
1. It gets pretty cold and hard to breathe up there.
2. The “weather” is mostly below 11 km.
3. Most flight occurs below 20,000 meters today.
4. High-altitude winds can reach 200 mph.
5. The atmospheric boundary layer contains violent gusts and changes in conditions.
5.2 Design Step 3
6. Determine conditions at cruise altitude. (Cruise altitude for short-range aircraft is lower thanthat for long-range)
Calculate the standard atmospheric conditions at a selected altitude for your aircraft.
On a day when sea-level temperature is 35 C and pressure is 101,000 Pascals, find the actual altitudeif the aircraft altimeter indicates 12000 m.
1. Construct a spreadsheet calculation where you can specify the altitude and get all the standardconditions: temperature, pressure, density.
Homework:2. Construct a spreadsheet where you can specify a pressure and temperature, and you can find thepressure altitude and density altitude.

Chapter 6
Aerodynamic Lift and Drag
6.1 Lift
Aerodynamic lift is the force perpendicular to the freestream. It is generated by deflecting thefreestream air. According to Newton’s 1st and 3rd laws, lift is the reaction to the rate of changeof momentum of air, perpendicular to the freestream. Lift is related to freestream velocity by:
L =1
2ρU2∞SCL
where U∞ is the freestream velocity, CL is the wing lift coefficient, and S is the planform area of thewing.
Lift Generation
In low-speed flows of air (<0.3 times the speed of sound, or Mach 0.3), there are three main waysto create aerodynamic lift. All involve directing the momentum perpendicular to the freestream. Theangle of attack can be varied, camber can be added to the wing, or lift can be induced through vortices.
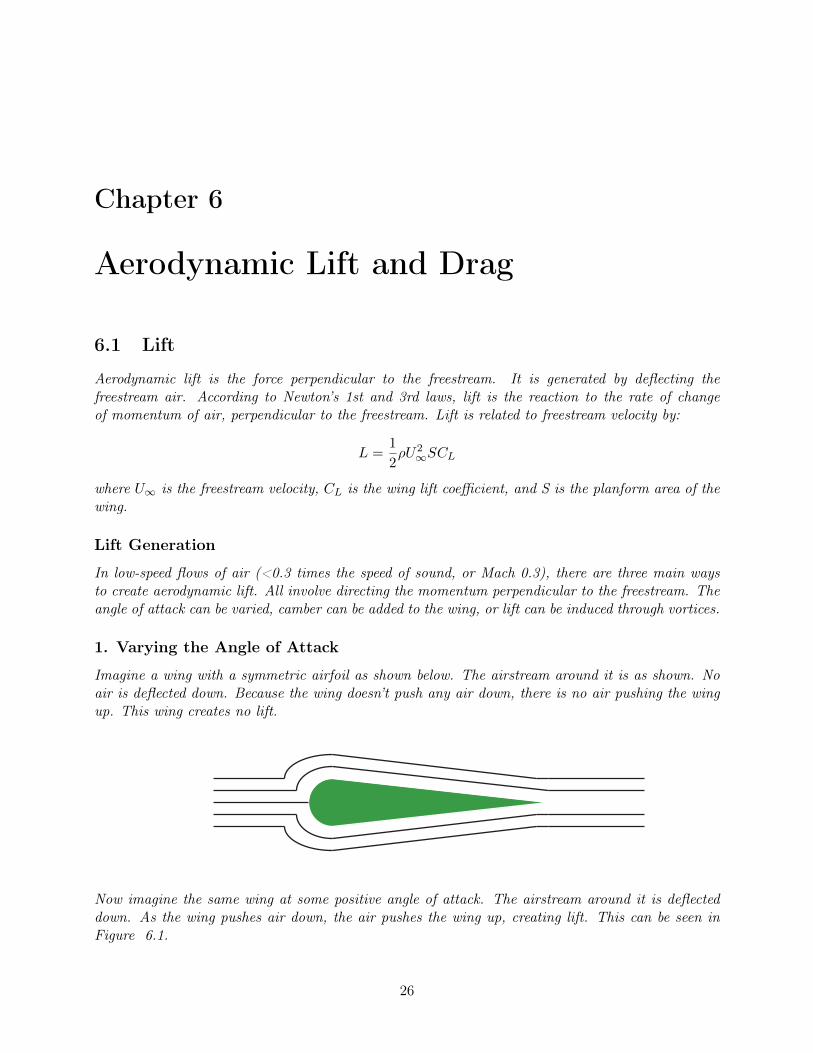
1. Varying the Angle of Attack
Imagine a wing with a symmetric airfoil as shown below. The airstream around it is as shown. Noair is deflected down. Because the wing doesn’t push any air down, there is no air pushing the wingup. This wing creates no lift.
Now imagine the same wing at some positive angle of attack. The airstream around it is deflecteddown. As the wing pushes air down, the air pushes the wing up, creating lift. This can be seen inFigure 6.1.
26

CHAPTER 6. AERODYNAMIC LIFT AND DRAG 27
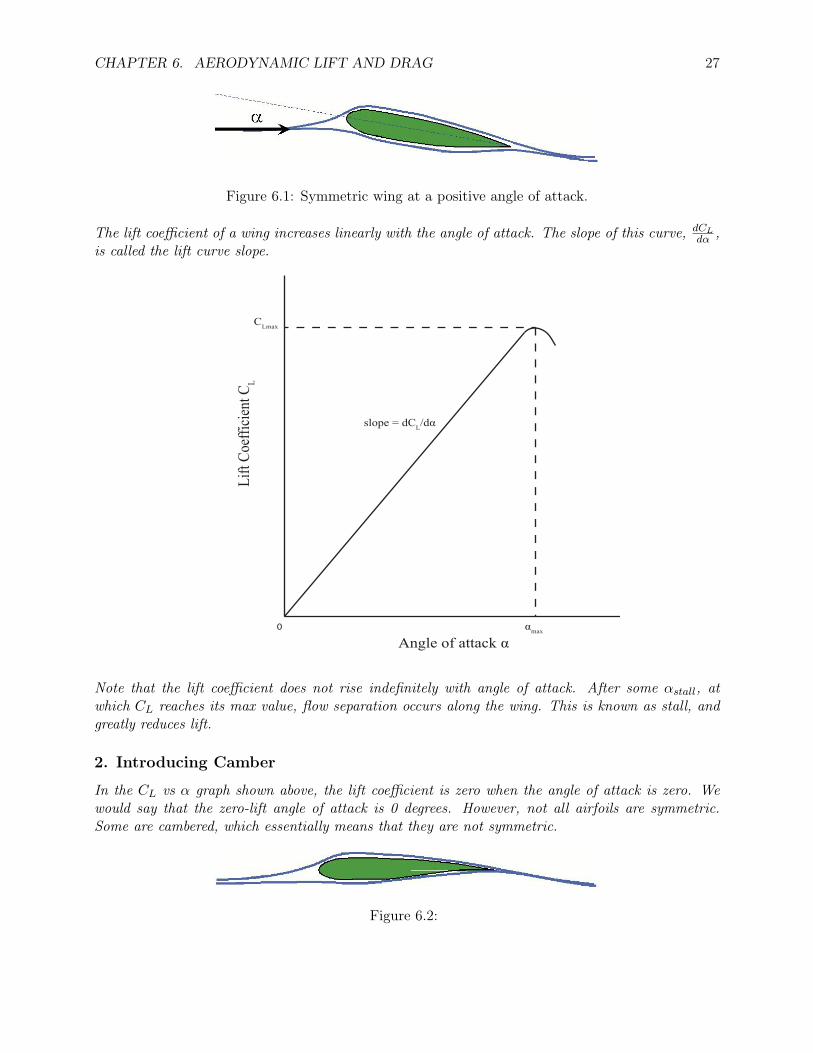
Figure 6.1: Symmetric wing at a positive angle of attack.
The lift coefficient of a wing increases linearly with the angle of attack. The slope of this curve, dCLdα ,is called the lift curve slope.
Angle of attack α
Lift
Coef
ficien
t CL
0 αmax
CLmax
slope = dCL/dα
Note that the lift coefficient does not rise indefinitely with angle of attack. After some αstall, atwhich CL reaches its max value, flow separation occurs along the wing. This is known as stall, andgreatly reduces lift.
2. Introducing Camber
In the CL vs α graph shown above, the lift coefficient is zero when the angle of attack is zero. Wewould say that the zero-lift angle of attack is 0 degrees. However, not all airfoils are symmetric.Some are cambered, which essentially means that they are not symmetric.
Figure 6.2:

CHAPTER 6. AERODYNAMIC LIFT AND DRAG 28
3. Vortex-Induced Lift
The third way to generate lift in low-speed flight is vortex-induced lift. The vortex generated at thewing tip is generally bad news, because it means lift loss and drag rise. However, being a vortex, ithas regions of high velocity and low pressure. If we can make the vortex go close to the upper surfaceof the wing, this low pressure can provide the suction we need to generate lift. This principle is usedon aircraft which, for other reasons, must have wings with extremely low aspect ratio. In fact mostaircraft designed for high-speed flight and high maneuverability have wings of small aspect ratio, withhighly swept wing leading edges. The wing sweep is so high that we can think of the entire leadingedge as the wing tip. Even at small angles of attack, a vortex forms along this edge (called, obviously,the Leading Edge Vortex), and this provides much of the lift of such wings when the aircraft is flyingat low speed (even supersonic aircraft need to land, fairly slowly). When vortex lift is used, the wingscan be very thin, and have sharp leading edges, which are good to minimize shocks and wave drag inhigh speed flight.
Figure 6.3:
The vortex lift-curve slope is very small compared to the ideal lift curve slope of 2π per radian.However, vortex lift can be obtained up to large angles of attack, sometimes up to 30 degrees angleof attack. So adequate lift can be obtained by going to high angles of attack during landing and low-speed flight. The North American XB-70 supersonic bomber, the British Aerospace - AerospatialeConcorde (shown against the sun, below), and the Soviet Tupolev Tu-144 supersonic jetliners areexamples of delta-winged aircraft. The delta wings are good for supersonic flight. When the aircraftcomes in for a landing, it does so at a high angle of attack where the wings produce vortex lift.
Figure 6.4: (Left)North American XB-70. (Right)Concorde.

CHAPTER 6. AERODYNAMIC LIFT AND DRAG 29
6.2 Drag
Drag is force along the freestream direction acting on the vehicle. It is due to irreversible loss ofmomentum. Drag is given by:
D =1
2ρU2∞SCD
The lift to drag ratio is:L
D=CLCD
We want our planes to have as high a L/D ratio as possible!
6.3 Pressure
Bernoulli’s Principle
In each lift generation method presented in the “Lift Generation” section, the flow moves more rapidlyat some places than at others. In these regions of high velocity, the pressure is lower. The relationbetween pressure and velocity in low-speed flow is given by the Bernoulli equation:
p0 = p1 +1
2ρU2
1
orp0 = p1 +
1
2ρU2
1 = p2 +1
2ρU2
2
This equation is derived from Newton’s Second Law of Motion, which expresses conservation of mo-mentum.
p0 is called the stagnation pressure, or total pressure, while p is called the static pressure. Theterm 1
2ρU2 is called the dynamic pressure, also denoted as q.
Pressure Coefficient
The pressure coefficient is a way to express the pressure with respect to some reference pressure, asa “dimensionless” quantity.
Cp =p− p∞12ρU
2∞
=p− p∞q∞
= 1− (U
U∞)2
Cp = 0 indicates the undisturbed freestream value of static pressure.Cp = 1 indicates a stagnation point.Cp < 0 indicates a suction region.Chordwise pressure distribution over an airfoil in low-speed flow.

CHAPTER 6. AERODYNAMIC LIFT AND DRAG 30
Figure 6.5: Chordwise pressure distribution over an airfoil in low-speed flow.
Excercise: Pressure Coefficient
What is the pressure coefficient at the stagnation point of an airfoil section?What is the pressure coefficient on a flat surface aligned with the freestream?
Cp at the suction peak of an airfoil is -1.2. What is the pressure there as a percent-age of the freestream static pressure?
What is the velocity at this point, as a percentage of the freestream velocity?
6.4 Airfoil (British: “aerofoil”)
“Airfoil” means “shape of a section of a wing”. It is a two-dimensional concept. Airfoils can’t fly;wings fly. Airfoil properties are used to calculate and design wing properties.
The airfoil lift coefficient, also called the section lift coefficient, is denoted as cl. Note that thislowercase coefficient is not the same as the uppercase version, CL, which refers to the wing lift coef-ficient. As with the wing lift coefficient, the airfoil lift coefficient also varies with angle of attack α.
If the airfoil is cambered, the lift coefficient is positive even at zero angle of attack, and reacheszero only at some negative value of α. This is called the “zero-lift angle of attack”, α0. As thecamber increases, α0 becomes more negative.
Thus the airfoil coefficient is cl = dcldα (α− α0)
The lift curve slope is dcldα .
dcldα ≤ 2π, where α is in radians.

CHAPTER 6. AERODYNAMIC LIFT AND DRAG 31
Excercise: Airfoil Lift Coefficient
The angle of attack of an airfoil is 12 degrees. The lift curve slope is 5.8 per radian.Zero-lift angle of attack is -2 degrees. Find the lift coefficient.
If the air density is 1/10 of sea-level standard, and the temperature is 20 deg. C higherthan the standard sea-level, flight speed is 100 m/s, and the airfoil chord is 1.2m, findthe lift per unit span of this airfoil section.

Chapter 7
Aerodynamics of Wings and Aircraft
7.1 Introduction
Unlike airfoils, studied in the last chapter, wings are 3-dimensional objects. They have a span, b,which is simply the distance from one wingtip to the other. They also have an aspect ratio, AR,defined by:
AR =b2
Swhere b is the span and S is the wing planform area. It is important to note that airfoils are consideredto have an infinite span, and an aspect ratio of infinite.
Effects of Finite Aspect Ratio
At the ends of the wings, the pressure difference between the upper and lower sides is lost, as theflow rolls up into a vortex. This does not happen with airfoils, because, as previously stated, theirspans are considered infinite and thus the flow never rolls up.
Figure 7.1: Wingtip vortices.
This effect causes overall lift to be reduced, relative to the airfoil lift value predicted for a section ofan infinite wing.
The lift vector is tilted back, so that an induced drag is created.
32

CHAPTER 7. AERODYNAMICS OF WINGS AND AIRCRAFT 33
Figure 7.2:
Both of these (usually undesirable) effects are reduced by increasing the aspect ratio of the wing. Asthe aspect ratio approaches infinity, the wing resembles an airfoil, and will be less affected by theseeffects.
7.2 Lift Coefficient
Due to the effects of finite aspect ratio described above, the lift curve slope of a wing, dCLdα , will be
smaller than the lift curve slope of the airfoil shape it uses. If we set the airfoil’s lift curve slope toa0 = dcl
dα , we can find the lift curve slope of a wing using this airfoil with the following equation:
dCLdα
=a0
1 + a0πARe
The lift curve slope of a wing depends on the lift curve slope of its airfoil as well as its aspect ratioand spanwise efficiency factor. As the equation above shows, any wing with a finite aspect ratio willalways have a smaller lift curve slope than its airfoil. As the aspect ratio of the wing approachesinfinite, the lift curve slope of the wing approaches that of the airfoil. An aspect ratio of infinte wouldyield
dCLdα
=a0
1 + 0=dcldα
In this chapter’s introduction, it was stated that airfoils are considered to have an infinite aspectratio. The results of this equation agree with this.
Although their lift curve slopes differ, wings do have the same zero-lift angle of attack α0 as theirairfoils. Thus it is possible, given the dcl
dα and α0 of the airfoil, and the aspect ratio and spanwiseefficiency of the wing, to find the lift coefficient of a wing at any angle of attack using the followingequation:
CL =dCLdα

CHAPTER 7. AERODYNAMICS OF WINGS AND AIRCRAFT 34
7.3 Drag Coefficient
Drag is given by
D =1
2ρU2∞SCD
The drag coefficient in low-speed flow is composed of three parts:
CD = CD0 + CDfriction + CDi
where CD0 is the parasite drag coefficient, CDfriction is the skin friction drag coefficient, and CDi isthe lift-induced drag. These three terms make up what the total drag coefficient, CD, for low-speedflight.
Parasite/Profile Drag
The term CD0 in the drag coefficient equation above is the parasitic drag coefficient, also knownas the profile drag coefficient. This term is independent of lift. It is usually due to the losses ofstagnation pressure which occur when part of the flow separates somewhere along the wing or bodysurface. In high speed flight, the effects of shock and wave dragmust be added to this, and becomesthe dominant source of drag. Most aircraft are designed to minimize CD0.
The profile drag of an airfoil of chord 1 unit is about the same as that of a circular cylinder whosediameter is only 0.005 units.
Figure 7.3: The profile drag of an airfoil is about the same as that of a circular cylinder whosediameter is 0.5% of the chord length.
Skin Friction Drag
CDfriction is the skin friction drag coefficient, which is due to viscosity. This becomes important intwo limits: one where the size of the wing, or the speed of the flow, is extremely small, as might bethe case for an insect-sized aircraft. This is called the "low-Reynolds number” limit. We will see laterwhat this Reynolds number is. The other limit is that of high-speed flight, where the skin friction canbe severe enough to heat up the wing surface to melting point. If inviscid flow is assumed, this termcan be neglected.
CHAPTER 7. AERODYNAMICS OF WINGS AND AIRCRAFT 35
Induced Drag
CDi is the lift-induced drag coefficient. In low-speed flight, this is the largest cause of drag, becauseyou must have lift to fly, and this drag is caused by lift. The lift induced drag coefficient can becalculated with the following formula:
CDi =C2L
πARe
In the above equation, AR is the aspect ratio, CL is the lift coefficient, and e is the spanwise efficiencyfactor. The spanwise efficiency factor answers the question: How does this wing rate compared to theideal wing for this aspect ratio? Its value is usually close to 1, perhaps as high as 0.99. If unknown,it can usually be assumed to be anything from 0.9 to 1.
Two things should be noted from the equation for the induced drag coefficient:
1. CDi ∝ C2L so that CDi ∝ α2. Induced drag increases with the square of the angle of attack.
A smaller angle of attack reduces the induced drag.
2. CDi approaches zero as aspect ratio approaches infinite. A larger aspect ratio reduces the in-duced drag.
To minimize induced drag, one should design wings with the largest possible aspect ratio, but alsoprovide enough surface area so that you only need a small angle of attack to provide the necessarylift even at low speed.
Example: Calculating Drag
CD0 of a small airliner is 0.018. The wing aspect ratio is 6. Assume spanwise effi-ciency is 0.9. The lift coefficient is 0.5. Find the total drag coefficient. If the density is1 kg/m3, the span is 40 meters and the speed is 200 m/s, find the drag.
Speed for Minimum Drag
As mentioned before, total drag is composed of a part that depends on lift, and one that does not.
D = D0 +Di = (CD0 + CDi)(1
2ρU2∞S)
D = (CD0 +C2L
π(AR)e)(
1
2ρU2∞S)
Let us consider what it takes to keep lift equal to drag, L = W:
W = L = q∞SCLwhereCL =W
q∞S
SoD = q∞SCD0 + (
W
S)2
1
π(AR)e(S
q∞)

CHAPTER 7. AERODYNAMICS OF WINGS AND AIRCRAFT 36
dD
dq∞= SCD0 − (
W
S)2
1
π(AR)e(S
q2∞) = 0
CD0 = (W
Sq∞)2
1
π(AR)e
CD0 = CDi
Minimum Total Drag = twice zero-lift drag. This is a remarkable result. It means that aircraft,unlike other forms of transportation, have a definite speed for minimum drag.
Figure 7.4: For aircraft, the speed for minimum drag is nonzero.
To fly an airplane of a given weight, straight and level, the condition for minimum drag (maximumlift-to-drag ratio) is that the profile drag coefficient is the same as the induced drag coefficient.
Example
An aircraft has a wing loading (W/S) of 130 pounds per square foot (6233 N/m2), aspectratio of 7.667, and wing span of 60.96 m. We’ll assume that its spanwise efficiency factorwill be 0.99. Let’s assume that the profile drag coefficient is given by CD0 = 0.015.
Thus, for maximum Lift-to-Drag ratio (minimum drag, and lift is always equal to weightfor straight and level flight),
CDi = CD0 = 0.015
The corresponding CL is calculated as 0.598, and the dynamic pressure is 10423 N/m2.
At 11,000 meters in the Standard Atmosphere, density is 0.36 kg/m3, so that the flightspeed is 240.64 m/s.
Note: In practice, the CD0 might change with flight Mach number, for high-speed flight.This is not taken into account in the above example.

CHAPTER 7. AERODYNAMICS OF WINGS AND AIRCRAFT 37
7.4 Aerodynamic Summary
Lift is the force perpendicular to the flow direction, due to pressure differences across surfaces. Thereare 3 ways of generating lift:
1. angle of attack
2. camber
3. vortex-induced lift
An infinite-span (2-dimensional) wing is entirely described by its airfoil section.
Finite wings have less lift than corresponding infinite wings at the same angle of attack, and alsohave lift-induced drag. The total drag acting on a wing in inviscid flow is composed of profile drag,which does not vary with lift, and induced drag, which rises with the square of the lift coefficient.The friction drag is ignored in the inviscid case.
To fly an airplane of a given weight, straight and level, the condition for minimum drag (maxi-mum lift-to-drag ratio) is that the profile drag coefficient is the same as the induced drag coefficient.

Chapter 8
Propulsion
As a rule of thumb, maximum takeoff thrust available must be around 30% of the gross weight of theaircraft. For airliners, takeoff is the most demanding thrust condition, so it drives the selection ofthe engines. Airliners must be able to take off with one engine out. Modern airliners use 2, 3 or 4engines, trending towards using only two if possible.
8.1 How Jet Engines Work
Jet engines work using the Gas Turbine Cycle, a process which consists of the following four steps:compression, heat addition, expansion, and cooling.
1) Compression
Air enters the engine at P1, and is compressed to a very high pressure P2. This is done by doingwork on the air using the rotating blades of a fan and a compressor. The temperature also rises asthe air is compressed.
P2
P1=T2T1
γγ−1
where γ = 1.4 so thatγ
γ − 1= 3.5
2) Heat Addition
Heat is added to high-pressure air by burning fuel. Pressure remains constant, and temperature risesto its highest point in the engine. This temperature is called the turbine inlet temperature, as itwill enter the turbine after this point. This quantity can be controlled by varying the amount of fueladded. In modern military engines, this temperature is greater than 2000 Kelvin.
38
CHAPTER 8. PROPULSION 39
3) Expansion and Work Extraction
Hot, high pressure air is blown out through a turbine, and then accelerated through a nozzle. Theair moving through the turbine blades forces it to spin. The turbine is connected to the compressorwith a shaft, and the turbine drives the compressor as air flows through it. This takes work out ofthe air, lowering its pressure and temperature. The air then blows out of the nozzle as a jet, with avelocity ue and a static pressure equal to ambient air pressure, or pe = pa
4) Cooling:
To complete the cycle, we must consider the cooling of air (constant-temperature heat release) in theatmosphere before the next jet aircraft comes along and gulps it in. However, since we don’t directlypay for this step inside the engine, we don’t worry consider it much.
Thrust for Basic Jet Engine
Thrust is calculated using Newton’s Second Law of Motion.
Figure 8.1: Basic jet engine.
Let’s say that the speed of air entering the engine is ua. The engine gulps ma kg/s of air, moving atua with respect to the engine. It adds mf kg of fuel per second, which has about zero velocity withrespect to the engine. All this mass then blows out of the exhaust at ue m/s.
(ma + mf )ue − maua − mf (0)
Defining fuel-to-air ratio as: f ≡ mf
ma
Rate of change of momentum = ma[(1 + f)ue − ua]
This must be equal to the thrust. τ = ma[(1 + f)ue − ua]
The function of a jet engine is to increase the momentum of the fluid passing through it.
“Pressure Thrust”
The general thrust equation in the previoius section left out a pressure term. A more accurateequation of thrust would be:
τ = ma[(1 + f)ue − ua] + (pe − pa)Ae
where Ae is the area of the engine’s nozzle exit, pe is the pressure of the gas exiting the engine,and pa is the ambient pressure. The extra term could be called pressure thrust, which is the forcedue to the pressure difference between the exhaust plane and the outside, acting on the exhaust area.

CHAPTER 8. PROPULSION 40
Ideally, a nozzle should expand the flow such that the exit pressure is equal to the ambient pressure,or pe = pa. Most well-designed nozzles come pretty very to this, and in many cases this extra termcan be dropped.
8.2 Turbojets, Turboprops, Turbofans
Turbojets, turboprops, and turbofans are three different types of air-breathing jet engines that employthe use of a turbine (the “turbo” prefix in each of these words means a turbine is involved). However,some have additional turbines that extract energy out of the flow to do different things.
Turbojets
In turbojets, the turbine only takes energy out of the flow for the compressor and some auxiliaryservices, but little else. Most of the hot gas expanded during the burning phase is rushed out thenozzle as a fast jet of air.
Turbofans
In turbofans, there is another turbine in the engine that takes energy out of the flow to turn a fanat the front of an engine. This fan accelerates air outside the core of the engine, which adds to thethrust. The air accelerated by the fan is called bypass air. The ratio of the mass flow rate of airthrough the fan to the mass flow rate of air through the core of the engine is called the bypass ratio,denoted by β.
τ = β ˙maH(ueC − ua) + ˙maH [(1 + f)ueH − ua]
Turbofans are very efficient because the fan moves a lot of air at a slow velocity. For this reason, mostcommercial airliners use turbofans. The bypass ratio for most of these engines is usually between 4to 8.
Turboprops
In turboprops, a turbine takes a lot of energy out of the flow, and is connected to a gearbox at thefront of the engine, which is then connected to a propeller. This propeller is what gives the enginemost of its thrust; only 15 - 20% comes from the jet. The gearbox is necessary to reduce the rotationalspeed of the enigne down to propeller speeds.
8.3 Ramjets
A ramjet is an air-breathing jet engine that has less moving parts than a turbojet. The air iscompressed without a compressor, relying solely on the geometry of the engine inlet to compressthe air. This relieves the need for a turbine. As a result, the combustor can heat the gas to highertemperatures. There are no turbine blades on which the flow can stagnate. This allows ramjets toexpel the air-fuel mix at a much higher velocity. The ramjet contains less complicated machinery,which is good from a manufacturing standpoint.The thrust equation for ramjets is the same as the general equation for thrust out of a jet engine:
τ = ma[(1 + f)ue − u] + (pe − pa)Ae

CHAPTER 8. PROPULSION 41
Assuming an ideal nozzle, where pe = pa,
τ = ma[(1 + f)ue − u]
A huge problem with ramjets is that they can’t generate thrust when they are not moving. Because aramjet has no compressor, it has no way of sucking air into the engine.
8.4 Rockets
Rockets do not take in any air, and must carry oxidizer as well as fuel. Rockets generate thrust byaccelerating this fuel-oxidizer mix out the back of the engine. The thrust equation for a rocket is:
τ = meue + (pe − pa)Ae
The pressure term in the thrust for a rocket engine is more important than in the other enginesexamined. In most other cases, the engine can be designed so that the exit pressure is equal to theatmospheric pressure, thus eliminating the pressure term. However this is more difficult with rocketsbecause of two reasons. First, rockets tend to work in low-pressure environments like high altitude,or zero-pressure environments like space. Thus it is harder for the nozzle to expand the flow to thecorrect conditions. Also, rockets often change altitude very quickly. This rapid change in the ambientpressure surrounding the rocket makes it difficult for a single nozzle design to expand the flow to idealconditions at each altitude.
Rockets have a measure called the effective exhaust velocity, ce. This term can be found by addingboth types of thrust in the rocket thrust equation and dividing by the total mass flow rate of gasexiting the nozzle:
τ = meue + (pe − pa)Ae = mece
ce = ue +(pe − pa)Ae
me
8.5 Efficiency
Thermal Efficiency
shows that the efficiency in converting heat to work is highest when the heat is added at the highestpossible pressure.
ηthermal = 1− 1
Pr
(γ−1)/γ
The compressor pressure ratio, denoted as Pr, is the ratio of pressures after and before the com-pressor. Modern turbine engines have high compressor pressure ratios, meaning they compress theincoming air to many times its original pressure. Note that even when Pr is 40, the thermal effi-ciency is only 0.65, or 65%. As with most efficiencies, thermal and propulsive efficiencies can onlyhave values between 0 and 1.
Propulsive Efficiency
The propulsive efficiency measures the efficiency in converting the kinetic energy of the fluid (air)to thrust.
ηpropulsive =2
1 + ueu

CHAPTER 8. PROPULSION 42
The exit velocity ue will always be greater than the flight velocity u if thrust is created. Taking airin at a certain velocity, the engine must shoot it out at a greater velocity for there to be a changeof momentum in the fluid. The thermal efficiency is maximized by driving the exhaust velocity asclose as possible to the flight speed u. This is done by using high bypass fans, or turboprops. Thesedevices move lots of air slowly, so that the exit velocity ue is as close to u as possible.
Specific Thrust and Thrust Specific Fuel Consumption
Thrust Lapse Rate
As we go up in the atmosphere, the density decreases. So, for a given flight speed, thrust decreasesas altitude increases. This rate of decrease is called the thrust lapse rate. In the absence of any dataon this lapse, it is reasonable to assume that thrust is proportional to the density of air.
Empirical relations have been developed for large turbofan engines of the type employed on mod-ern commercial transport aircraft:
Thrust at altitude = (Sea-level static thrust)
Below 5000 m, it can be assumed that thrust varies linearly, or scales with density.
The variation of thrust with altitude is milder than the variation with altitude. The expressionis not monotonic (i.e., it does not just keep increasing, or keep decreasing, with increasing Machnumber), so it is not attempted here.
Example: Thrust Calculation
Calculate the thrust and specific fuel consumption of the engine with the following conditions:
Hot air mass flow rate = 100 kg/s
Flight speed = 200 m/s
Fuel/air ratio = 0.015
Hot exhaust velocity = 800 m/s
Fan exhaust velocity = 250 m/s
Bypass ratio = 6
Solution:Because there is a bypass ratio of 6, we know this is a turbofan engine. Using the equation providedin the turbofan section above,
τ = β ˙maH(ueC − ua) + ˙maH [(1 + f)ueH − ua]
τ = (6)(100 kg/s)(250 m/s− 200 m/s) + (100 kg/s)[(1 + 0.015)800 m/s− 200 m/s]
τ = 91200 N
TSFC:TSFC =
mf
τ
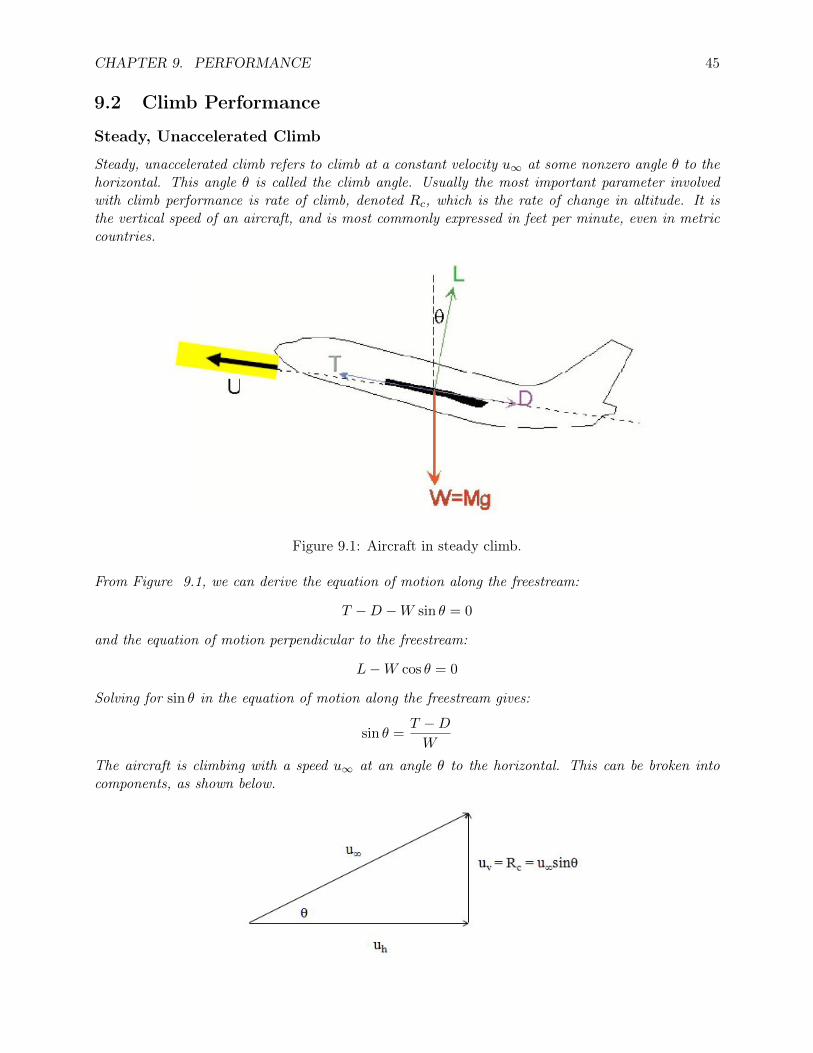
CHAPTER 8. PROPULSION 43
TSFC =(0.015)(100 kg/s)
91200 NTSFC = 1.644 x 10⁻⁵ kg/N-s
Some Implications:Assume thrust to weight ratio of the engine is roughly 4.5, so that the weight of the engine is 20335N. Assume that the engine is installed using the 30% of TOW guideline. TOW = 305333 N. Engineweight fraction = 20335/305333 = 6.65%.
If L/D = 12, thrust needed at flight altitude is only 25444 N. Can fly at altitude where densityis about 0.28 of sea level.
8.6 Design Step 4
15. Select engines based on thrust and 1-engine-out criteria.16. Find thrust-specific fuel consumption.17. Estimate thrust variation with altitude.

Chapter 9
Performance
Aircraft performance is the study of how well an aircraft achieves specific goals. These goals dependon the specific mission of the aircraft in question. Transport aircraft need a lot of range, while patrolaircraft need a lot of endurance. Fighter aircraft need to have small turning radii so as to have theedge in a dogfight, but interceptor aircraft require good climb performance to quickly meet threats.This chapter explores some of the most common performance parameters, and shows how to evaluatethem given some basic information about the aircraft.
9.1 Basic Performance Parameters
In this section, basic performance parameters will be discussed. These are either simple enough notto require an entire section, or necessary for understanding more complex parameters later in thechapter.
Wing Loading
The wing loading of an aircraft is given by the total weight of the aircraft divided by the planformarea of the wing. The Boeing 747 has a wing loading of about 150 lbf/ft2. In order to grasp themagnitude of this feat, try to visualize a square foot of metal. Then imagine putting 150 pounds ofweight on it and trying to make it fly.
Excess Thrust
For an aircraft to fly straight and level, its thrust must equal its drag. However, if an aircraft’sengines are producing more thrust than is needed to fly, it is said to have excess thrust. Excessthrust is simply the difference between thrust and drag.
Excess Thrust = T −D
Excess Power
The excess power is simply the excess thrust multiplied by the velocity at which the aircraft is moving.
Excess Power = u∞(T −D)
44
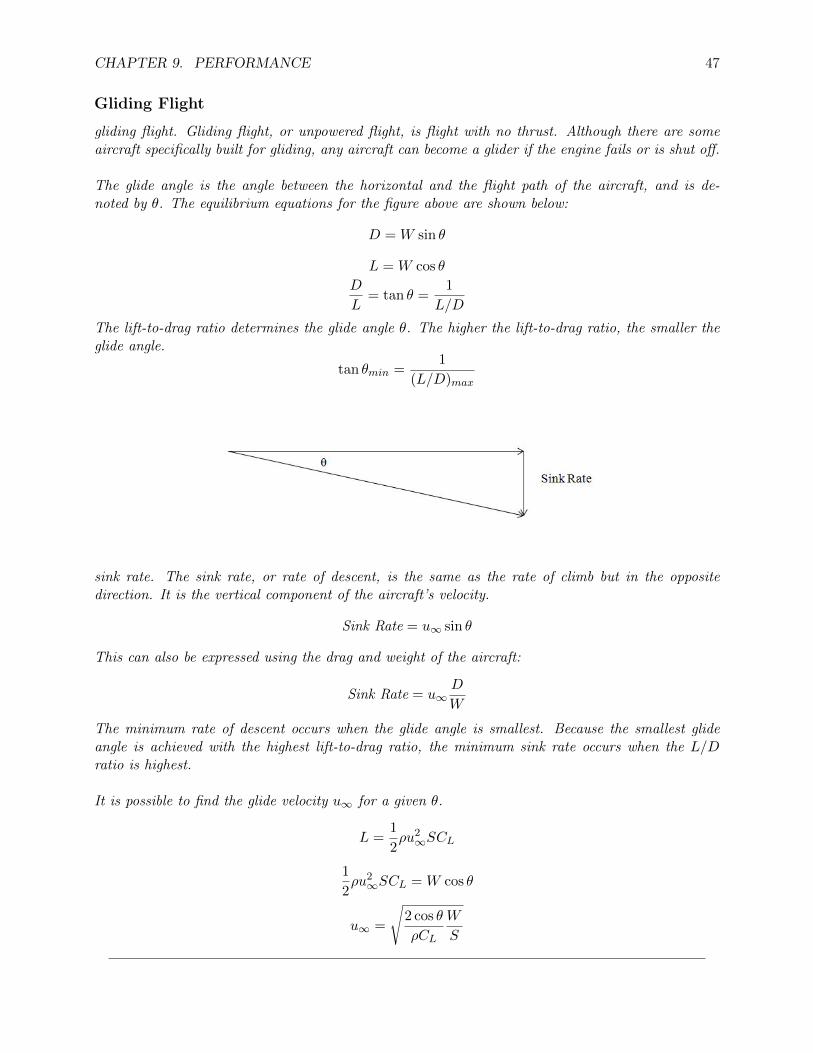
CHAPTER 9. PERFORMANCE 45
9.2 Climb Performance
Steady, Unaccelerated Climb
Steady, unaccelerated climb refers to climb at a constant velocity u∞ at some nonzero angle θ to thehorizontal. This angle θ is called the climb angle. Usually the most important parameter involvedwith climb performance is rate of climb, denoted Rc, which is the rate of change in altitude. It isthe vertical speed of an aircraft, and is most commonly expressed in feet per minute, even in metriccountries.
Figure 9.1: Aircraft in steady climb.
From Figure 9.1, we can derive the equation of motion along the freestream:
T −D −W sin θ = 0
and the equation of motion perpendicular to the freestream:
L−W cos θ = 0
Solving for sin θ in the equation of motion along the freestream gives:
sin θ =T −DW
The aircraft is climbing with a speed u∞ at an angle θ to the horizontal. This can be broken intocomponents, as shown below.

CHAPTER 9. PERFORMANCE 46
Rate of climb. From Figure 9.2, we can see that the rate of climb, Rc, is equal to the verticalcomponent of the velocity, uv, which is equal to u∞ sin θ.
Rc = u∞ sin θ
Inserting the equation for sin θ derived above,
Rc = u∞T −DW
The term u∞(T −D) is the term for excess power. Thus, the rate of climb can be expressed as excesspower over weight.
Rc =Excess Power
W
Because of this relationship between excess power and rate of climb, it can be said that excess powerdetermines the rate of climb. Similarly, excess thrust determines the angle of climb, θ. This can beseen if the expression for climb angle is slightly modified:
sin θ =T −DW
=Excess Thrust
W
.
Example: Steady Climb
An aircraft has a L/D of 15 and its thrust is 105% of the drag. Find the climb an-gle, assuming constant flight speed.
L/D = 15T/D = 1.05
tan θ = (T −D)/L = (T/D − 1)/(L/D) = 0.05/15
= 0.0033
∼ 0.0033 ∗ 180/π degrees
∼ 0.2 degrees
If speed is 200 m/s, climb rate is 0.0033*200 = 0.66 m/s ∼ 120 feet per minute. Verylow.Typical climb rate is ∼ 500 fpm.Question: what is the thrust needed, as % of drag, for a 500 fpm climb?

CHAPTER 9. PERFORMANCE 47
Gliding Flight
gliding flight. Gliding flight, or unpowered flight, is flight with no thrust. Although there are someaircraft specifically built for gliding, any aircraft can become a glider if the engine fails or is shut off.
The glide angle is the angle between the horizontal and the flight path of the aircraft, and is de-noted by θ. The equilibrium equations for the figure above are shown below:
D = W sin θ
L = W cos θ
D
L= tan θ =
1
L/D
The lift-to-drag ratio determines the glide angle θ. The higher the lift-to-drag ratio, the smaller theglide angle.
tan θmin =1
(L/D)max
sink rate. The sink rate, or rate of descent, is the same as the rate of climb but in the oppositedirection. It is the vertical component of the aircraft’s velocity.
Sink Rate = u∞ sin θ
This can also be expressed using the drag and weight of the aircraft:
Sink Rate = u∞D
W
The minimum rate of descent occurs when the glide angle is smallest. Because the smallest glideangle is achieved with the highest lift-to-drag ratio, the minimum sink rate occurs when the L/Dratio is highest.
It is possible to find the glide velocity u∞ for a given θ.
L =1
2ρu2∞SCL
1
2ρu2∞SCL = W cos θ
u∞ =
√2 cos θ
ρCL
W
S
CHAPTER 9. PERFORMANCE 48
Example: Sink Rate
An aircraft is coming in on final landing approach. The pilot has aligned the craft withthe centerline of the runway, and trims for constant speed of 65 mph. If the aircraftweight is 2400 lb and drag is 220 lb, what should the thrust be, to achieve a constant sinkrate of 500 ft/min?
Solution:W = 2400 lb
D = 220 lb
u∞ = 65mihr· 1 hr
60 min· 5280 ft
1 mi= 5720 ft/min
Sink Rate = u∞ sin θ
Unlike a problem with purely gliding flight, this one includes thrust:
W sin θ + T = D
sin θ =D − TW
Sink Rate = u∞D − TW
T = D −W Sink Rateu∞
T = 220− (2400)
(500
5720
)The thrust must be 10 lb to achieve a constant sink rate of 500 ft/min.
Accelerated Climb
The sections on steady climb and gliding flight both focused on equilibrium situations, with no accel-eration. Now we look at accelerated climb, but will use energy methods instead of dealing with freebody diagrams and Newton’s second law.
The first concept that must be understood is energy height. The total energy of an aircraft flyingat some altitude h is given by the sum of its potential and kinetic energies.
Total aircraft energy = mgh+1
2mu2∞
This is the total aircraft energy. This fixed amount of energy can be “spent” in any combination ofpotential energy or kinetic energy. The total aircraft energy could be turned into all potential energy,or all kinetic energy. An aircraft flying at an altitude h and some velocity u∞ could reduce its altitudeto almost zero, which would convert all the potential energy into kinetic energy, increasing the speedof the aircraft. Alternatively, the aircraft could convert all of its kinetic energy into potential energy,which would increase the altitude of the aircraft (though it would have no velocity!). This last idea

CHAPTER 9. PERFORMANCE 49
illustrates the idea of energy height, He. Energy height is simply the total aircraft energy divided bythe weight of the aircraft:
He =mgh+ 1
2mu2∞
mg
He = h+u2∞2g
Energy height has units of height and represents the altitude an aircraft could reach if all of its kineticenergy were converted to potential energy.
9.3 Level Turn Performance
A level turn is a turn in which the altitude of the aircraft remains constant. In order to perform alevel turn, an aircraft rolls an angle φ. This causes the lift vector to rotate by φ, as shown in Figure9.3. The horizontal component of the rotated lift vector is what causes the aircraft to turn.
Figure 9.2: Plane performing a level turn.
Because the turn is level, and there is no change in altitude, there can be no net force in the verticaldirection. This leads to the following relation between lift and weight:
L cosφ = W
In straight and level flight, the lift must equal the weight for the aircraft to remain in equilibrium.For any angle φ greater than 0◦ and less than 90◦, the value cosφ will be less than one. Thereforelift must be greater than the weight if the aircraft is to remain at a level altitude during its turn.
The centripetal force experience by the aircraft is equal to the horizontal component of the lift vector.
mu2∞Rt
= L sinφ
In the equation above Rt is the turn radius. Thus the equation for turn radius is
Rt =m
L
u2∞sinφ

CHAPTER 9. PERFORMANCE 50
Load Factor
The load factor n is defined as the ratio of lift to weight. It is of great importance when looking atturn performance.
n ≡ L
W
We have shown that for a level turn,L cosφ = W
thusn =
L
W=
1
cosφ
For a level turn, the load factor and the roll angle are directly related. The load factor is oftenexpressed in terms of “g’s”. If an aircraft undergoes a load factor of 3, it is also said to be experiencing3 g’s.
Turn Radius and Load Factor
Given above, the turn radius for a level turn is
Rt =m
L
u2∞sinφ
We wish to have load factor in the expression for Rt. We begin by substituting W/g for m in theabove equation.
Rt =W
L
u2∞g sinφ
=u2∞
gn sinφ
Above, we showed that
cosφ =1
n
Using the trig identitycos2 φ+ sin2 φ = 1
we can replace sinφ with a term that only has n:
1
n
2
+ sin2 φ = 1
sinφ =
√1− 1
n2=
1
n
√n2 − 1
Substituting into the original equation for turn radius, the turn radius can be expressed with only u∞and n:
Rt =u2∞
g√n2 − 1
From the above equation, it can be seen that the smallest turn radius can be achieved by having thelowest velocity and the highest load factor. This relation makes the importance of load factor evident.
CHAPTER 9. PERFORMANCE 51
Example: Sideward Forces
Traveling at 250 m/s, an aircraft performs a level turn, with the radius limited by theneed to keep the g-level (load factor) below 7.0. What is turn radius Rt, and what is theroll angle φ?
Solution:We begin by with the two equations of motion:
L sinφ =mu2∞Rt
L cosφ = W
The second equation can be used to find the roll angle.
cosφ =W
L=
1LW
=1
n
φ = cos−11
n
φ = cos−11
7= 81.8◦
Dividing the centripetal equation of motion with the vertical equation of equilibrium yields:
tanφ =mu2∞WRt
=u2∞gRt
Rt =u2∞
g tanφ=
(250)2
(9.8)(tan 81.8◦)= 920.5m
The roll angle is 81.8◦ and the turn radius is 920.5 m.
9.4 Range and Endurance
Breguet Range Equation
The range of an aircraft is the total distance it can travel on one load of fuel. The Breguet rangeequation is a good way to quickly estimate the range of an aircraft using some performance specifi-cations of the aircraft. This equation assumes that the flight is steady and level.
The derivation begins by considering the definition of velocity:
u∞ =ds
dt
Because we are solving for range, or total displacement, we arrange this so as to have ds alone onthe left side:
ds = u∞dt

CHAPTER 9. PERFORMANCE 52
Using the definition of thrust specific fuel consumption for a jet-propelled airplane, dt in the aboveequation can be replaced with some of the aircraft’s performance parameters:
ct = −˙Wfuel
T= −dWfuel
Tdt
The negative sign is there because ct is a positive value, but the weight of fuel is decreasing so thederivative is negative. Rearranging and solving for dt:
dt = −dWfuel
ctT
Substituting this into the displacement equation above:
ds = −u∞ct
dWfuel
T
We assumed steady, level flight. Thus, T = D and we can replace T with D. We can also multiplythe right hand side by L/D, as L = W ; this is the same as multiplying by one. Also, it is reasonableto assume that dW = dWfuel, or that the change in total aircraft weight is the same as the changein fuel weight. Applying these changes results in:
ds = −u∞ct
L
D
dW
W
Range is just the integration of ds. Thus we get:
R =
∫ R
0ds = −
∫ W1
W0
u∞ct
L
D
dW
W
W0 is the initial weight of the aircraft, when it is fully loaded with fuel, and W1 is the final weightof the aircraft, when all the fuel has been used. Assuming that u∞, ct, and L/D are all constants:
R =u∞ct
L
DlnW0
W1
This equation is known as the Breguet range equation. This equation shows three independent methodsto increase range. Firstly, specific fuel consumption (ct) should be minimized. Also, the fractionu∞(L/D) must be maximized. The speed at which a plane flies affects its lift and therefore its L/Dratio, which is why we join u∞ and L/D in one term; they are not independent of each other. Lastly,the ratio of the initial weight to the final weight (W0/W1) should be maximized. Fuel should composeas much of the initial aircraft weight as possible.
Fuel Consumed During Climb
For the climb phase, we will assume the fuel consumption for cruise plus an increment depending onthe cruise altitude. The table below is constructed from data on large commercial airliners (Shevell).
Altitude % of takeoff weight as added fuel consumption20,000 feet 0.75%30,000 feet 1.25%35,000 feet 1.60%

CHAPTER 9. PERFORMANCE 53
Endurance
While range is the distance an aircraft can travel on one load of fuel, endurance is the amount oftime the aircraft can stay in the air on one load of fuel. It is a measure of time, and as such ismeasured in seconds, minutes, or hours. There are many applications in which endurance might bemore important than range. Observation or patrol aircraft are prime examples. They might need towatch a small area for large amounts of time, and not necessarily cover a lot of ground.
The derivation of the endurance for jet-propelled aircraft is similar to the derivation of the Breguetrange equation. Again we assume steady, level flight with constant specific fuel consumption and aconstant L/D ratio. The derivation begins with the definition of thrust specific fuel consumption:
ct = −dWfuel
Tdt
This time we are interested in solving for total time, so we isolate dt on the left-hand side:
dt = −dWfuel
Tct
As we did in the Breguet range derivation, we will replace thrust with drag, multiply by L/W , andreplace dWfuel with dW .
dt = − 1
ct
L
D
dWfuel
W
Edurance can be found by integrating from t = 0, when the aircraft is fully loaded (W = W0), tot = E, when the aircraft has no fuel (W = W1):
E =1
ct
L
DlnW0
W1
Similar to range, endurance can be increased by reducing the thrust specific fuel consumption ct andby increasing the ratio of initial weight to final weight, W0/W1. Unlike range, endurance does notbenefit from maximizing the product u∞(L/D), as no u∞ term appears in the endurance equation.Instead, endurace relies directly on the lift-to-drag ratio, L/D. Increasing the L/D ratio increasesthe endurance.
9.5 Minimum Velocity: Stall Speed
During steady and level flight, the lift of the airplane must equal the weight. These are both equal tothe previously shown equation for lift:
W = L =1
2ρu2∞SCL
The right hand side of the above equation must equal the weight of the aircraft. The planform area Swill probably remain constant (ignoring the possibility of some variable geometry wing), and so willthe density, assuming level flight. To maintain a constant lift to support a (mostly) constant weight,u∞ can decrease only if CL increases. This is even more apparent if we rearrange:
u∞ =
√2W
ρSCL

CHAPTER 9. PERFORMANCE 54
As CL increases, the speed required to stay in the air decreases. Thus, it is reasonable to say thatthe minimum speed at a given density and weight is:
u∞min =
√2W
ρSCLmax
9.6 Takeoff and Landing
Takeoff and Landing Distances
Net thrust is the thrust minus the ground roll friction, drag, etc. Assume net thrust is 0.2 Wto. ThenT −D = 0.2Wto.
Kinetic Energy = 12mU
2 = 12(Wg )U2 = 0.2WR where R is the takeoff run distance.
In distance R, we gained enough kinetic energy to be at takeoff speed, accelerating at the rate corre-sponding to net thrust of 0.2 Wto. Thus,
R =U2
0.4g
The runway length should be twice this distance, in order to stop if the decision to abort takeoff ismade at the takeoff speed.
Landing Procedure: Airliner
Descent to 5000 feet. Vectored to 12 miles downwind, make a 180-degree turn. Extend flaps andlanding gear, and reduce speed to 150 mph. This leaves 5 minutes of final approach to do the flapdeflections, landing gear deployment, lining up of the runway, etc.
Landing Procedure: Small Plane
Maintain constant angle of descent along a specified flight path (staying along the middle of the glideslope). Align with the runway centerline.
Arriving over the runway end, reduce power and increase angle of attack to level off with the landinggear a few feet off the ground. Use ground effect to continue flying level, as the speed reduces, andthe aircraft slowly sinks to the ground.
Just before touchdown, flare (increase angle of attack, nearly to stall), and hold altitude. Rateof sink comes to very near zero,and as the speed comes below the stalling speed in ground effect, themain landing gear wheels touch the ground. Continue flying and bring nose slowly down until nosegear touches.
Use if any is available to slow down, otherwise roll with light braking, slow down to the speed forturning off the runway, and take the next taxiway turnoff as instructed by the tower.

CHAPTER 9. PERFORMANCE 55
Cross-Winds
Factors like cross-winds make life much more interesting. In the event of cross-winds, the airplanemay be piloted down with the “controls crossed” (roll so that the lift vector is pointed into the wind,but use rudder in the opposite direction to keep from changing flight direction into the wind. As theairplane comes close to the runway, the wind will generally change quickly in speed and direction-and the pilot must compensate to keep the aircraft aligned with the runway. To land in a cross-wind,the airplane is held in a banked attitude, so that the landing gear on the side facing into the windtouches down first, then the other side, and the pilot holds the aircraft from swerving on the runwaydue to the greatly increased drag on one side.
Add gusts to the cross-wind, and the need for piloting skills becomes much more evident.
Sometimes, to increase the rate of descent down to the runway, the pilot may fly with the aircraftactually sideslipping, alternately one way and then the other, and again controls crossed to induce aside-slipping motion. The reasoning here is that the drag is much greater in sidelsip, so the forwardspeed is reduced and the angle of attack made a lot steeper.
Example
Gross weight = 200,000 N.At altitude H, engine thrust is constant with speed, at 5000 N.W/S = 8,000 N/m2
CLmax = 1.4
Lowest speed (stall): L = W = qSCLmax
ustall =
√2W
ρSCLmax
Lowest speed (thrust available): Ta = D = qSCD
CD = CD0 +C2L
π(AR)e
Highest speed (thrust available): Ta = D = qSCD
9.7 Design Step 5
18. Find the fuel fraction needed for full mission range.
19. Determine propulsion and structure mass fractions.
20. Verify fuel weight and volume achievable-if not, iterate from # 14.
21. Develop steady flight envelop and plot. Determine extremes.

CHAPTER 9. PERFORMANCE 56
22. Verify ceiling, max speed and min speed.
23. Takeoff and landing field length; control surfaces/flaps needed.

Chapter 10
Stability and Control
When you launch a paper airplane, the most frequent cause of an unsuccessful flight is that theairplane flips out of control. This is usually because the airplane is not statically stable. By carefullyadjusting the weight distribution, or deflecting some control surfaces, the flight characteristics canbe greatly improved.
10.1 Important Points
Center of Pressure
center of pressure. We have defined lift as the force acting on a wing perpendicular to the freestream,and drag as the force acting parallel to the freestream, but have not really visualized how these forcesact on a wing. In reality, there are pressure and shear stress distributions acting over the surface. Itis possible to find the net effect of these distributions, and represent them with a single concentratedforce R, acting at a specific point. The specific point at which this resultant force R acts is the centerof pressure, denoted by c.p. The force R can then be broken down into componenets perpendicularand parallel to the freestream, or lift and drag.
Aerodynamic Center
The aerodynamic center of an airfoil is the point about which the pitching moment coefficient isindependent of the angle of attack. Independent of the angle of attack means the pitching moment isindependent of the lift coefficient. At the aerodynamic center, the pitching moment stays constant,no matter how the airfoil orients itself to the flow.
10.2 Static Stability
An aircraft is statically stable if it can recover from small disturbances by itself. It is staticallyunstable if the disturbance gets amplified and the aircraft does not recover.
Example of Static Instability
Imagine that the center of pressure on a wing is ahead of the center of gravity, as shown below.Suppose that α increases due to some small, instantaneous gust. The coefficient of lift, and thereforelift, would increase because of the increase in α. The change in pitching moment is nose-up, which
57

CHAPTER 10. STABILITY AND CONTROL 58
further increases α. Thus, a slight increase in α would continue to get larger; this is statically un-stable.
Figure 10.1: CP in front of CG.
Static Stability
If the center of pressure were located behind the center of gravity, lift would still increase if angle ofattack were increased. However, this time the lift force is acting behind the center of gravity (at thec.p.), and causes a nose-down pitching moment. Thus the system acts to reduce α if α is suddenlyincreased, so this system is statically stable.
Figure 10.2: CP behind CG.
10.3 Aerodynamic Control Surfaces
In chapter 4, roll, pitch, and yaw were introduced as rotations about axes of the aircraft. In order toinduce these rotations, aircraft need control surfaces.
Aileron: Roll Control
Ailerons are control surfaces located at the trailing edge of aircraft wings. Deflecting an aileron islike cambering the airfoil section of the wing. It changes the lift at the same angle of attack. If the

CHAPTER 10. STABILITY AND CONTROL 59
aileron is deflected down, the wing produces more lift; an aileron that is deflected up causes the wingto produce less lift (or even negative lift). Because of this force imbalance, the aircraft rolls about theroll axis.
Figure 10.3:
Elevator: Pitch Control
Elevators are flight control surfaces found on the horizontal part of the tail structure of most aircraft.
Figure 10.4: Deflecting the elevator up causes the aircraft nose to pitch up.
Rudder: Yaw Control
The rudder is the vertical control surface found on the tail structure of most aircraft. If the lift(side force in this case) on the vertical tail is changed, the aircraft tends to yaw. The aircraft mustthen roll to avoid sideslipping. In aircraft, yaw is not used to turn aircraft. As was shown in theperformance chapter, aircraft roll in order to turn. The main use of the rudder is to make minorchanges and corrections as the aircraft goes through a turn.

CHAPTER 10. STABILITY AND CONTROL 60
Figure 10.5: Deflecting the rudder to the right causes the aircraft nose to yaw to the right.
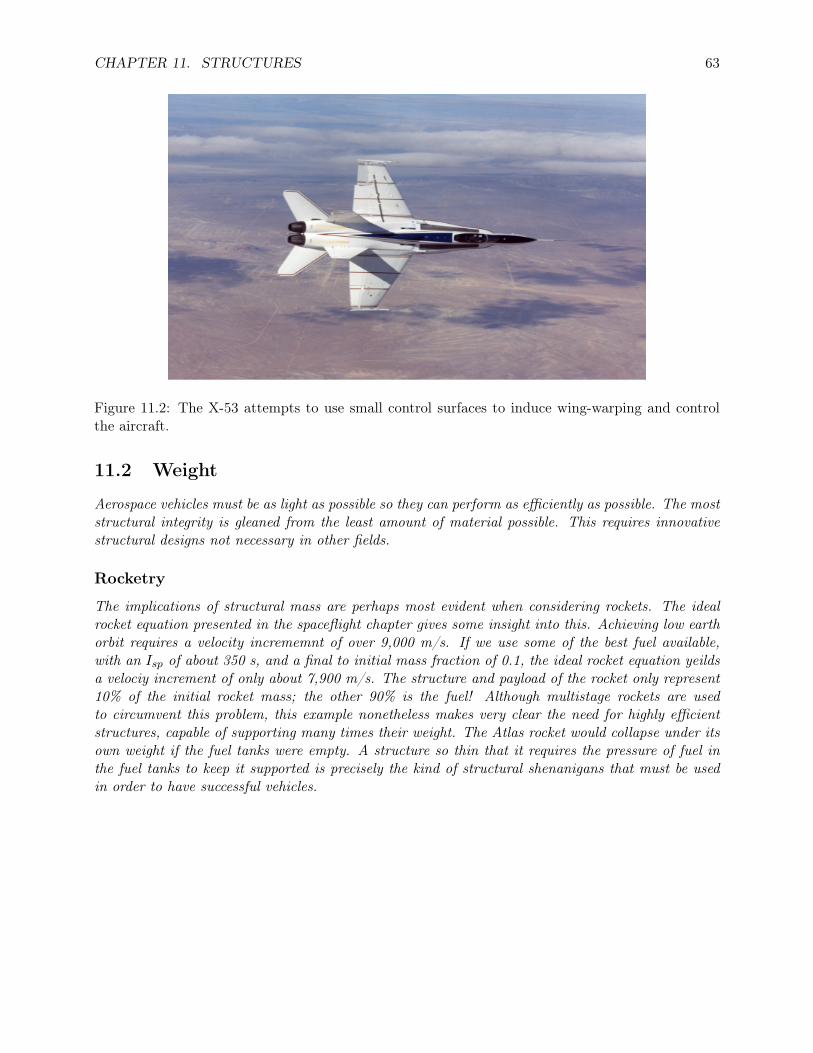
Chapter 11
Structures
The study of structures is a critical part of aerospace engineering. Whereas buildings can takeadvantage of several tons of concrete and steel for their construction, aerospace vehicles are typicallyweight limited and must be incredibly efficient with their use of supports. Furthermore, the largeforces encountered during flight present new structural difficulties not present in the building ofstatic structures. As a result, the aerospace industry is constantly making use of the latest structuraladvances. This chapter is intended to make the student aware of some basic issues in aircraftstructures, as well as some of these advances and their implications. This chapter does not include adetailed explanation on the theory of structures, as this is expected to be covered in structures-specificcourses later in the student’s career.
11.1 Aeroelasticity
Aeroelasticity refers to the study of structures under aerodynamic loading. Not only do aircraftencounter large aerodynamic loads when flying at high speeds, they have structures that are specificallydesigned to create yet more forces (like wings that create lift). Therefore it is very important to seehow structures and aerodynamic forces interact.
Flutter
Flutter is a phenomenon in the field of dynamic aeroelasticity, and explains a rapid up and downvibration of the wings, and typically causes failure. It occurs when aerodynamic forces mix withelastic and inertial forces to create a dynamic instability. Although it can happen to bridges andchimneys, it is a huge design consideration when designing wings and other lift-creating surfaces.The vibration is usually caused by the aerodynamic force on the wings. If the vibration increasesthe aerodynamic force, the effect is self-exciting oscillation, and the wing undergoes rapid periodicmotion before failing and breaking.
Aeroelastic flutter is what caused the famous collapse of the Tacoma Narrows Bridge in 1940. Causedby 40 mph winds, the aerodynamic forces on the bridge induced an oscillation in the main span thateventually caused the bridge to collapse. Now aerodynamic forces are taken into consideration whendesigning bridges and other stationary structures. Even chimneys are designed with this in mind sothat they do not flutter in high winds. The forces experienced by an aircraft in high-speed flight aremuch more severe, and for this reason aeroelastic effects are heavily considered when designing anaircraft.
61

CHAPTER 11. STRUCTURES 62
Figure 11.1: This image shows some of the kind of vibration experienced by the Tacoma NarrowsBridge due to aeroelastic flutter.
Active Aeroelastic Wing
Until this point, aeroelastic phenomena have mostly been shown in a negative light. However, thisdoes not have to be the case, and aeroelasticity’s effects can be used to increase performance andcontrol. This idea dates back to the Wright brothers, who, lacking the sophisticated control surfaceswe take for granted today, tried to control their Wright Flyer by twisting and warping the wings.However, control surfaces such as ailerons quickly became the preferred method of aircraft control.
Although the Wright brothers did not use aeroelastic effects to twist their wings, the NASA ActiveAeroelastic Wing program is currently studying the feasibility of using aeroelastic effects to causewing-warping in order to increase control and performance. The X-53 used to test the idea is amodified F-18 with multiple “aerodynamic tabs” meant to induce aeroelastic effects. The hope is thatcontrol of the aircraft can be achieved with smaller control surfaces that turn the entire wing into acontrol surface, rather than relying on a single large aileron. The larger ailerons add a lot of weightto the wing, and have minimum size requirements, due to the fact that they must be able to controlthe aircraft even at low speeds. This causes a lot of strain at higher speeds, and also reduces theaspect ratio of the wing. By using the smaller control surfaces to induce twist in the wing, lighter,more efficient wings with higher aspect ratios can be used instead.

CHAPTER 11. STRUCTURES 63
Figure 11.2: The X-53 attempts to use small control surfaces to induce wing-warping and controlthe aircraft.
11.2 Weight
Aerospace vehicles must be as light as possible so they can perform as efficiently as possible. The moststructural integrity is gleaned from the least amount of material possible. This requires innovativestructural designs not necessary in other fields.
Rocketry
The implications of structural mass are perhaps most evident when considering rockets. The idealrocket equation presented in the spaceflight chapter gives some insight into this. Achieving low earthorbit requires a velocity incrememnt of over 9,000 m/s. If we use some of the best fuel available,with an Isp of about 350 s, and a final to initial mass fraction of 0.1, the ideal rocket equation yeildsa velociy increment of only about 7,900 m/s. The structure and payload of the rocket only represent10% of the initial rocket mass; the other 90% is the fuel! Although multistage rockets are usedto circumvent this problem, this example nonetheless makes very clear the need for highly efficientstructures, capable of supporting many times their weight. The Atlas rocket would collapse under itsown weight if the fuel tanks were empty. A structure so thin that it requires the pressure of fuel inthe fuel tanks to keep it supported is precisely the kind of structural shenanigans that must be usedin order to have successful vehicles.

CHAPTER 11. STRUCTURES 64
Figure 11.3: The Atlas family of rockets would collapse under their own weight if the fuel tanks wereempty.
Carbon Fiber
The aircraft industry has primarily created airframes out of aluminum for many years due to itslight weight and high strength. However, carbon fiber is a material that is both stronger and lighter.Carbon fiber is made up of thin strands of carbon. These strands are thinner than human hair, andcan be woven together like yarn. When coated with some sort of resin, these strands can be moldedinto particular shapes. This is similar to paper mache, which involves coating newspaper strips withglue so that they mold to some shape.
Being both lighter and stronger than aluminum, carbon fiber has attracted the attention of com-mercial aircraft designers. The Boeing 787 is 50% carbon fiber by weight and 80% carbon fiber byvolume. This represents a major advance in commercial aviation. The aircraft is estimated to be 20%more fuel efficient than a similarly sized aircraft that is built with the more traditional aluminum.

CHAPTER 11. STRUCTURES 65
Figure 11.4: The Boeing 787 is the first commercial airliner made mostly of carbon fiber.
Although there are many great advantages to using carbon fiber, there are also many hurdles impedingits use. While fractures and imperfections in aluminum are easy to test for (in many cases beingvisible to the naked eye), it is much more difficult to test and perform maintenance on carbon fiber.Carbon fiber is also more expensive than aluminum, but is becoming cheaper with time.

Chapter 12
High Speed Flight
12.1 Introduction
Low-speed flows can be considered incompressible. This means that density is assumed constant.However, this assumption cannot be made for high-speed flows. This makes calculations for high-speed flows more difficult.
12.2 Mach Number and Mach Angle
Mach Number and the Speed of Sound
Small disturbances in air propagate at the speed of sound. This means that the speed of sound isthe speed through at which information propagates through the fluid. The speed of sound, a, can becalculated with the formula below:
a =√γRT
where γ is 1.4 for air, T is an absolute temperature (Kelvin or Rankine), and R is the gas constantof air.
The Mach number M is defined as:M ≡ u
a
The Mach Cone Angle
The Mach Cone defines the boundaries of where the weakest disturbances created by an object movingfaster than sound, reach, around and behind the object. As shown in Figure 12.1 the Mach cone isthe result of the disturbance spreading outwards in an expanding sphere radiating out from the source,as the source moves faster than the speed of sound. Note that the picture shown in the figure is aninstantaneous picture. At the next instant, the object will have moved, and the cone will have grownin size in the window that we are viewing.
66

CHAPTER 12. HIGH SPEED FLIGHT 67
Figure 12.1:
sinµ =a
u=
1
M
µ = sin−11
M
12.3 Shocks
In aeronautics, the term “shocks” refers to shock waves. These waves develop in front of bodies trav-elling faster than the speed of sound. Because the speed of sound is the speed at which informationpropagates through a fluid, air in front of an object travelling faster than the speed of sound is un-aware of the impending disturbance. The shock develops to slow down the flow before it strikes theobject. Across a shock wave, the Mach number of the fluid decreases, and huge increases in pressure,density, temperature, and entropy occur.
If a body is blunt, the shock wave forms in front of the body, as shown in the left side of Figure12.2. If the body is sharp, an oblique shock wave forms.

CHAPTER 12. HIGH SPEED FLIGHT 68
Figure 12.2: (Left)A bow shock wave. (Right)An oblique shock wave.
Oblique shocks turn the flow before it hits the object. The oblique shock angle β is greater than theMach angle µ.
Figure 12.3: Oblique shock angle β.
Hypersonic Regime
The hypersonic regime exists above Mach 4 or 5. Across a shock there is a large pressure increase,as well as a large temperature increase. The Mach angle is extremely small. It is possible to generatelift with a large pressure rise below the lower surface of a hypersonic aircraft.

CHAPTER 12. HIGH SPEED FLIGHT 69
Figure 12.4:
The Power of Shocks
If an asteroid is so big that it still remains as a solid object when it nears the ground (i.e., comesdown to a few thousand feet), the shock waves can hit the ground with terrible strength. This canflatten trees, forrests, and buildings (happened in Siberia just around the time the Wright Brotherswere getting off the ground). When the object finally reaches the ground, the shock in front blasts ahuge crater in the earth’s surface. The crater is huge, even though the object that actually reachesthe ground may be quite small. The Meteor Crater in Arizona is one mile in diameter, and hundredsof feet deep. It is widely believed that an immense object hit the Gulf of Mexico during the age of thedinosaurs, and the havoc was such that it caused the extinction of the dinosaurs, worldwide.
12.4 Flight at High Subsonic and Transonic Speeds
Above a Mach number of about 0.3, air can no longer be considered incompressible. This makescalculations more difficult, as density can no longer be considered a constant.
Subsonic Flight: Prandtl-Glauert Compressibility Correction
Information about an airfoil’s lift and drag coefficients in incompressible flow is not valid in thecompressible regime. However, the incompressible lift and drag coefficients can be converted into liftand drag coefficients in the compressible regime using the Prandtl-Glauert compressibility correction.The lift and drag coefficients of an airfoil at a given angle of attack increase with flight Mach number,according to the Prandtl-Glauert Compressibility Correction:
cl =clo√
1−M2∞
cd =cdo√
1−M2∞
where clo and cdo are the lift and drag coefficients before the correction. To get the same lift coefficientat a higher Mach number, one requires a smaller angle of attack. This is good, because the drag

CHAPTER 12. HIGH SPEED FLIGHT 70
coefficient also increases like this. This expression is valid for Mach numbers which are lower thanthe critical Mach number.
Critical Mach Number
As a wing approaches Mach 1, the flow at some point along the wing will reach Mach 1 even if thefreestream Mach number is lower. Once any flow along the airfoil reaches Mach 1, huge increasesin drag occur, as the graph below shows. For this reason, commercial aircraft fly just below theircritical Mach number, so a huge drag increase can be avoided.
Figure 12.5: Drag increases greatly near Mach 1.
It is possible to “trick” the flow with swept wings and achieve higher critical Mach numbers. Themotivation to do so should be apparent; an increase in the critical Mach number is effectively anincrease in the cruise speed. The most notable method is the use of wing sweep. If a wing is sweptback an angle Λ, the wing only experiences the component of the freestream normal to it. Thiscomponent is u∞ cos Λ. Because this normal component is smaller than the freestream velocity, theaircraft can travel at a higher freestream velocity before the flow over the wing at any point reachesMach 1. Thus, the critical Mach number is higher with wing sweep.
CHAPTER 12. HIGH SPEED FLIGHT 71
Figure 12.6: Wing sweep increases the critical Mach number by decreasing the normal componentof velocity experienced by the wing.
The positive effects of wing sweep can be seen in commercial aircraft. The table below demon-strates the relationship between the sweep angles of various airliners and their cruise Mach numbers.
Aircraft Sweep Angle (◦) Typical Cruise Mach Max Cruise MachB737-800 25.0 0.785 0.82B757-200 25.0 0.80 0.82B767-300 31.5 0.80 0.86B777-200 31.64 0.84 0.89B747-400 37.5 0.85 0.92
Suggested Method to Calculate Transonic Drag Peak
The part up to Mach 1 can be described as a Lorentz function.
CD =1
πγ[1 + (M−Mcrγ )2]
Where the peak
CDmax =1
πγ

Chapter 13
Space Flight
Figure 13.1:
13.1 Rockets Revisited
Velocity Increment ∆V
Consider a rocket with effective exhaust velocity ce. The effective exhaust velocity is a way of ex-pressing the thrust in a simple manner by adding up the momentum thrust and the pressure thrustand dividing this sum by the mass flow rate. As propellant is blasted from the exit nozzle, the massof the vehicle decreases. This is substantial in the case of the rocket as compared to air-breathingengines, because all the propellant comes from inside the vehicle. From Newton’s Second Law,
Thrust = MdV
dt= −ce
dM
dt
72

CHAPTER 13. SPACE FLIGHT 73
dV = −cedM
M
∆V = −ce∫ M2
M1
dM
M
∆V = ce lnM1
M2
where M1 is the initial mass, which includes the propellant, and M2 is the mass after the propellanthas been used up to achieve the velocity increment ∆V .
Specific Impulse and Mass Ratio
Define the specific impulse of the propellant as:
Isp ≡ceg
where g is the standard value of acceleration due to gravity at sea-level (9.8 m/s2). The unit ofspecific impulse is seconds. Using this definition,
∆V = gIsp lnM1
M2
Mass ratio of a rocket isM1
M2= e
∆VgIsp
Note: Some space agency websites express specific impulse without the g. Thus their “Isp” is simplyce.
13.2 The Laws of Newton and Kepler
Newton’s Law of Gravitation
To find the velocity increment required for various missions, we must calculate trajectories and orbits.This is done using Newton’s Law of Gravitation:
Fr = −GMm
r2
Here the left hand side is the “radial force” of attraction due to gravitation, between two bodies; thelarger is of mass M, and the smaller is of mass m.
The universal gravitational constant is:
G = 6.670 x 10⁻¹¹ Nm2/kg2

CHAPTER 13. SPACE FLIGHT 74
Kepler’s Laws
These can be applied to a satellite of mass m, orbiting a much larger object of mass M (m � M).
1. The satellite travels in an elliptical path around its center of attraction, which is located atone focii of the eclipse. The orbit must lie in a plane containing the center of attraction.
2. The radius vector from the center of attraction sweeps equal areas of the orbit per unit time. Asthe satellite moves away, its speed decreases. As it nears the center of attraction, its speed increases.
3. The ratio of the squares of the orbital periods of any two satellites about the same body equals theratio of the cubes of the semi-major axes of the respective orbits.
t21t22
=a31a32
Calculating Velocities Along an Elliptical Orbit
The speed at any point in an elliptical orbit is:
v =
√g0r20(
2
r− 1
a)
where g0 is the acceleration due to gravity at radius r0.The minimum velocity is obtained at the apogee, or highest point of the orbit:
vapogee =
√g0r20
(1− ε)a(1 + ε)
= vmin
where eccentricity is given byε = 1− rmin
a
The max velocity is obtained at the perigree, or lowest point of the orbit:
vperigree =
√g0r20
(1 + ε)
a(1− ε)= vmax
The time for one orbit is:
τ =2π√a3
r0√g0

CHAPTER 13. SPACE FLIGHT 75
Circular Orbit and Escape Velocity at Radius r
vcirc =
√g0r20r
vescape = vcirc√
2
vescape =
√2g0
r20r
Example: Speed for Circular Orbit and Speed for Escape
Earth’s volumetric radius ≈ 6370.998685023 km (≈ 3958.755 mi; ≈3440.064 nmi). How-ever, note that in calculating the standard value of g0, a slightly different radius is used:
g = Gm1
r2= (6.5742× 10⁻¹¹)
5.9736× 1024
(6.37101× 10⁶)2= 9.822
m
s2
Consider a circular orbit at r = 7000 km.
vcirc =
√g0r20r
Escape speed at radius r.vescape = vcirc
√2

Bibliography
[1] J. Anderson, Introduction to Flight, ser. McGraw-Hill Series in Aeronautical andAerospace Engineering. McGraw-Hill Higher Education, 2005. [Online]. Available:http://books.google.com/books?id=Hd_AR0CAmsoC
[2] R. Shevell, Fundamentals of flight. Prentice-Hall, 1983. [Online]. Available:http://books.google.com/books?id=N3hTAAAAMAAJ
[3] H. Tennekes and H. Tennekes, The Simple Science of Flight: From Insects to Jumbo Jets.Mit Press, 2009. [Online]. Available: http://books.google.com/books?id=lt4PQPDhX5YC
[4] M. Simons, Model aircraft aerodynamics. Nexus Special Interests, 1999. [Online]. Available:http://books.google.com/books?id=R2xvegHiRecC
[5] D. Alexander and S. Vogel, Nature’s Flyers: Birds, Insects, And The Biomechanics OfFlight, ser. Nature’s Flyers. Johns Hopkins University Press, 2004. [Online]. Available:http://books.google.com/books?id=zj395mz_GYkC
[6] D. Alexander, Why Don’t Jumbo Jets Flap Their Wings?: Flying Animals, FlyingMachines, and How They Are Different. Rutgers University Press, 2009. [Online]. Available:http://books.google.com/books?id=XCk2OwAACAAJ
[7] S. Brandt, Introduction to aeronautics: a design perspective. Aiaa, 2004.
[8] T. Damon, Introduction to Space: The Science of Spaceflight, ser. Or-bit A Foundation Series. Krieger Publishing Company, 2011. [Online]. Available:http://books.google.com/books?id=K3IAPwAACAAJ
[9] K. Kemp, Destination Space: Making Science Fiction a Reality. Virgin, 2007. [Online].Available: http://books.google.com/books?id=rlBGAAAAYAAJ
[10] U. S. C. A. Patrol, Introduction to Flight. National Headquarters, Civil Air Patrol, 1972.[Online]. Available: http://books.google.com/books?id=NRYbRAAACAAJ
[11] J. Roskam, Airplane Design: Preliminary calculation of aerodynamic, thrust and powercharacteristics, ser. Airplane Design. Roskam Aviation and Engineering Corporation, 1985.[Online]. Available: http://books.google.com/books?id=bo9TAAAAMAAJ
76