design and optimization of an electromagnetic
TRANSCRIPT

International Journal of Frontiers in Sociology
ISSN 2706-6827 Vol. 3, Issue 17: 112-120, DOI: 10.25236/IJFS.2021.031717
Published by Francis Academic Press, UK
-112-
Design and optimization of an Electromagnetic-
Piezoelectric Composite Vibration Generator
Yuan-yuan Fan1,a*, Xiaoxin Zhang2, Ying-jun Sang2 , Fei Huang3, Shangguang
Wu2
1Faculty of Mathematics and Physics, Huaiyin Institute of Technology, Huaian 223003, China 2Faculty of Automation, Huaiyin Institute of Technology, Huaian, 223003, China 3Faculty of Electronic Information Engineering, Huaiyin Institute of Technology, Huaian, 223003,
China
*Corresponding author
Abstract: Piezoelectric power generations refer to the piezoelectric integrated structure which realize
the transformation of conversion from environmental vibration based mechanical energy to electric
energy. A new type of vibration energy generator with cantilever beam structure is designed in this
paper. In order to reveal the underlying of piezoelectric transducer mechanism, the vibration
mechanics analysis is carried out by establishing a mathematical model, namely, the vibration
mechanism of cantilever beam caused by external vibration excitation is described by using spring
mass block damping single degree of freedom system model. In order to get the vibration generator
with reasonable structure and excellent performance, frequency response and transient, the
relationship between the cantilever thickness, cantilever width, cantilever length and vibration
characteristics are optimazed by using COMSOL-Multiphysics FEM simulation software to model and
analyze the generator body. To evaluate the output performance of the piezoelectric module, finite
element modeling and analysis is conducted. According to the evaluation, the design of
electromagnetic and -piezoelectric composite vibration generator presented in this paper is proising
for environmental vibration based energy harvest.
Keywords: cantilever beam, power generation, piezoelectric, electromagnetic, piezoelectric-
electromagnetic, finite element simulation
1. Introduction
With the distribution and portability of electronic products, environmental energy collection has
attracted more and more attention. Nowadays, the research and application of solar energy, wind energy
and thermal energy in the environment have become more and more mature.However, the vibration
energy which also exists in the environment has not been effectively developed and applied. In the
environment of mechanical motion, the form of motion such as vibration is very common, and the
vibration energy collected in the environment is often enough to drive some electronic equipment to
work. Using the piezoelectric effect of functional material [1], a piezoelectric integrated structure is
designed to convert mechanical energy into electrical energy. By converting and collecting the
generated electrical energy, it can provide power for various low-power electronic systems. The general
ways to convert vibration energy into electrical energy are electromagnetic, electrostatic, piezoelectric,
magnetostrictive and composite energy acquisition technology [2]. Nowadays, the main form of energy
conversion is piezoelectric. Piezoelectric vibration generator has the advantages of high output voltage,
simple structure, less heating, easy integration with microelectronic sensor containing silicon body and
less peripheral energy controller. In this paper, the COMSOL-Multiphysics FEM simulation software is
used to analyze the finite element modeling of the generator body[3,4], and the relationship between
the cantilever thickness, cantilever width, cantilever length and vibration characteristics is obtained.
Through the establishment of vibration model [5] and finite element simulation optimization, a
piezoelectric vibration device is designed to highlight its advantages and improve the output
performance of the generator.

International Journal of Frontiers in Sociology
ISSN 2706-6827 Vol. 3, Issue 17: 112-120, DOI: 10.25236/IJFS.2021.031717
Published by Francis Academic Press, UK
-113-
2. System Structure and Mathematical Model
2.1. System Structure and Principle
The vibration based piezoelectric device can be described by the structure shown in Figure 1 (a).
The device consists of a piezoelectric cantilever beam with a mass at the end. The mass is used to
excite vibration and adjust resonance frequency. The vibration of the cantilever is caused by external
vibration[6]. The piezoelectric sheet is under the action of stress to generate charge, and the total output
energy is increased by integrating these two parts of energy.
2.2. Mathematical model
The piezoelectric cantilever structure is most sensitive to environmental excitation and is easy to
produce forced vibration. When analyzing the vibration mechanics, the spring mass block damping
single degree of freedom system model can be used to describe the vibration model of cantilever beam
under external vibration excitation, as shown in Figure 1(b). The model of vibration system is:
2
n nt 2 t z t tz z y (1)
In the Formula (1)
y (t)——Vibration displacement of the external environment foundation;
z(t)——Relative vibration displacement of the mass block;
ξ——Damping ratio, / 2ξ c km , c is damping;
nω ——System fundamental frequency angular frequency, n /ω K m, K is the system efficient
elastic coefficient, m = ∆m +0.236 M [7], ∆m is the mass of mass blocks, M is the cantilever beam
mass.
m
k c
y(t)
z(t)
(a).Structural model of the cantilever beam (b). Spring mass block damping model
Figure 1: Model of unequal length single crystal CVPG
According to the cross section transformation method[7] and the parallel axis theorem of moment
of inertia[8], the equivalent section moment of inertia of cantilever beam in x = 0 ~ LP and x = LP ~ Le
sections is:
332 2
1
3
2
[ ( ) ] [ ( ) ]12 2 12 2
12
wt twt tI η wt d wt d
ηwtI
p psh shsh p
sh
(2)
In the Formula (2)
d——Distance of the lower surface of the piezoelectric layer from the neutral axis,d = (ηtsh2 - tp2)
/2(tp +ηtsh),the tp and tsh are the thickness of the piezoelectric layer and the elastic layer, respectively;
w——Width of the cantilever beam;
η——η = Ysh/Yp,The Ysh, Yp is the elastic modulus of the elastic layer and the piezoelectric layer,
respectively;
According to the of structural mechanics[7], the effective elastic coefficient of the cantilever beam
is:

International Journal of Frontiers in Sociology
ISSN 2706-6827 Vol. 3, Issue 17: 112-120, DOI: 10.25236/IJFS.2021.031717
Published by Francis Academic Press, UK
-114-
1 2
3 3 3
2 1
3
( ( ) ) ( )
Y I IK
l l l I l l I
p
e e p e p
(3)
Using the vibration angle frequency formula of the system base frequency:
p 1 2
n 1 1 3 3 3
e e p 2 e p 1
3
[( ( ) ) ( ) ](Δ 0.236 )
Y I IKω K K
m l l l I l l I m M
(4)
1K ——For the frequency correction factor.
It is remarkably seen from the piezoelectric equation[7]that when the cantilever beam receives the
inertial force in the z direction, the piezoelectric layer produces tension and compression in the x
direction and forms a coupled electric field in the z direction. For the piezoelectric strain δ = –d31E3, it
can be equivalent to a concentrated force FE, at the end of the cantilever beam after adding an electric
field force in formula (1):
t t K t t tEmz cz z my F (5)
1 EF k U according to the equation and relation of strain and bending moment,
31 p 1
1
b p p p( )( )42 2
d Y Ik
l l t d t
.
Substitute the FE into the formula (4),obtain the(6):
2
1
2 2
n n
/
2
ω y k U mz
ω j ξωω ω
(6)
According to the principle of thermal equilibrium, the internal energy [9] generated in the
infinitesimal unit is represented as the total energy of the piezoelectric layer. Using the
relationship[10,11] of the cantilever beam, the relationship between the open circuit voltage and
vibration excitation acceleration of the vibration generator is:
22
Po 2 2
n n pj2 (1 )
in
KkK A
CV
ω ξωω ω k
(7)
Ain——Indicates the acceleration of the external excitation vibration,Ain = ω2y.
2K——For the voltage correction factor.
In the formula, Ki is the correction coefficient, the multiple experimental data of resonance angle
frequency and the average of the corresponding theoretical calculated value, Ki=
n
/ωω/ωω/ωω n0
'
nn0
'
2n0
'
1 , has measured data for the experiment of resonance angular
frequency and n is the number of experiments. The modified formula can be directly applied to the
COMSOL simulation virtual experiment, greatly improving the time efficiency and design accuracy of
the cantilever beam device design.
3. Finite Element Simulation and Optimization Analysis of Piezoelectric Cantilever Vibration
Device
3.1. Simulation Analysis of the Characteristic Frequency
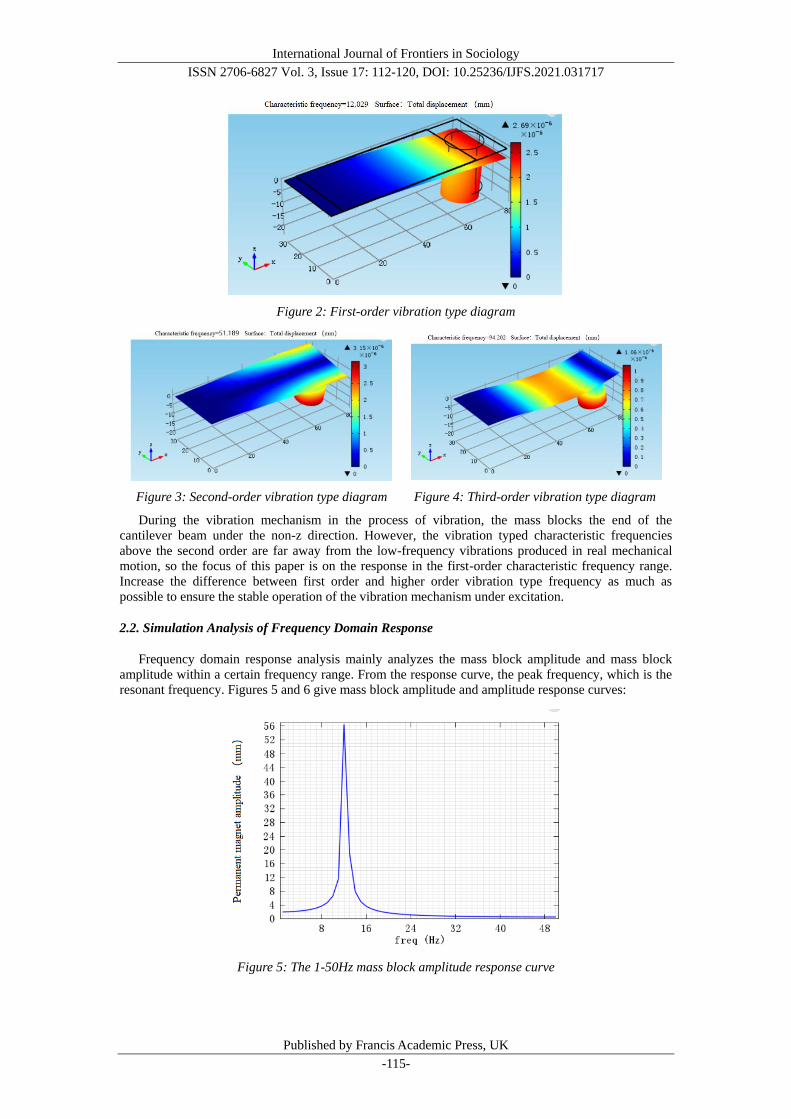
The structural analysis of the vibration device shall first simulate the characteristic frequency of the
structure itself. The natural characteristic frequency and the characteristic diagram of the vibration
mechanism can be determined by the characteristic frequency solver. The first sixth orders
characteristic frequency of the vibration mechanism model is 12.029Hz, 51.189Hz, 94.202Hz,
427.28Hz, 572.5Hz, 1082.3Hz.
Figures 2, 3 and 4are the three-dimensional vibration patterns of the first third order of the vibration
mechanism model respectively:
'
nω
International Journal of Frontiers in Sociology
ISSN 2706-6827 Vol. 3, Issue 17: 112-120, DOI: 10.25236/IJFS.2021.031717
Published by Francis Academic Press, UK
-115-
Figure 2: First-order vibration type diagram
Figure 3: Second-order vibration type diagram Figure 4: Third-order vibration type diagram
During the vibration mechanism in the process of vibration, the mass blocks the end of the
cantilever beam under the non-z direction. However, the vibration typed characteristic frequencies
above the second order are far away from the low-frequency vibrations produced in real mechanical
motion, so the focus of this paper is on the response in the first-order characteristic frequency range.
Increase the difference between first order and higher order vibration type frequency as much as
possible to ensure the stable operation of the vibration mechanism under excitation.
2.2. Simulation Analysis of Frequency Domain Response
Frequency domain response analysis mainly analyzes the mass block amplitude and mass block
amplitude within a certain frequency range. From the response curve, the peak frequency, which is the
resonant frequency. Figures 5 and 6 give mass block amplitude and amplitude response curves:
Figure 5: The 1-50Hz mass block amplitude response curve

International Journal of Frontiers in Sociology
ISSN 2706-6827 Vol. 3, Issue 17: 112-120, DOI: 10.25236/IJFS.2021.031717
Published by Francis Academic Press, UK
-116-
Figure 6: Potential response curve of 1-50Hz piezoelectric sheet
Through FIGS. 2-4 and 2-5, it is clearly observed that the peak frequency in the response curve is
near the first order characteristic frequency obtained by 12Hz, and 2.1 analysis, and the amplitude of
the mass block and the potential of the piezoelectric sheet near the characteristic frequency reach the
maximum. When the frequency is one but deviates from this frequency, the amplitude of the mass
block and the potential response of the piezoelectric sheet decrease rapidly.
2.3. Transient Simulation Analysis
This section performs a dynamic analysis of a frequency range near the characteristic frequency
based on the above two sections. The method is to apply a discrete frequency to the vibration
mechanism, and to analyze the specific displacement value of the cantilever arm end mass block and
the specific potential value of the piezoelectric plate within a specified frequency.
Figure 7 and Figure 8show the maximum potential of the piezoelectric sheet and the maximum
displacement of the mass block at 10, 11, 12,13,13,14, and 15Hz, respectively.
Figure 7: Frequency-displacement relation diagram
Figure 8: Frequency-potential relationship diagram

International Journal of Frontiers in Sociology
ISSN 2706-6827 Vol. 3, Issue 17: 112-120, DOI: 10.25236/IJFS.2021.031717
Published by Francis Academic Press, UK
-117-
Figure 9 and figure 10 show the three-dimensional model diagram and stress diagram of the
maximum displacement produced by the vibration mechanism when the applied displacement load is
2*sin(2*pi*12*t)[mm].
Figure 9: Maximum displacement 3 D model diagram
Figure 10: Stress map
The transient analysis shows that the resonant frequency should be near 12Hz. Meanwhile, the time
domain analysis shows that the maximum displacement of the mass block can reach the maximum
potential of the 6.202mm, piezoelectric sheet up to 23.854v when the resonant frequency is applied.
Based on the above conclusions, we further analyze the application of the resonant frequency.
Figure 11 shows the relationship between the mass block displacement at the end when the cantilever
beam is stable. When the displacement load applied by the vibration base end of the cantilever beam is
2*sin(2*pi*12*t)[mm], the displacement function of the end mass block is consistent with its frequency,
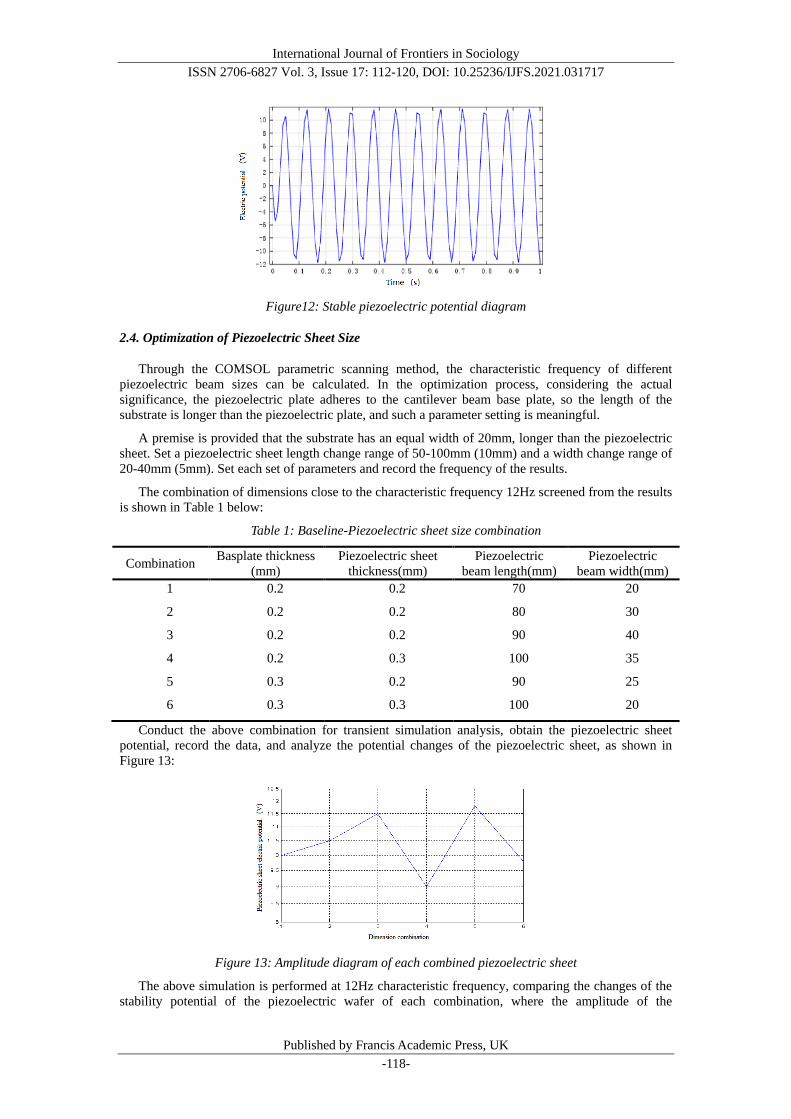
only the amplitude becomes 6.2mm, and lags a certain phase. Figure 12 gives the piezoelectric sheet
stabilization potential of the cantilever arm with an amplitude of 10.5V.
Figure11: Stability displacement diagram
International Journal of Frontiers in Sociology
ISSN 2706-6827 Vol. 3, Issue 17: 112-120, DOI: 10.25236/IJFS.2021.031717
Published by Francis Academic Press, UK
-118-
Figure12: Stable piezoelectric potential diagram
2.4. Optimization of Piezoelectric Sheet Size
Through the COMSOL parametric scanning method, the characteristic frequency of different
piezoelectric beam sizes can be calculated. In the optimization process, considering the actual
significance, the piezoelectric plate adheres to the cantilever beam base plate, so the length of the
substrate is longer than the piezoelectric plate, and such a parameter setting is meaningful.
A premise is provided that the substrate has an equal width of 20mm, longer than the piezoelectric
sheet. Set a piezoelectric sheet length change range of 50-100mm (10mm) and a width change range of
20-40mm (5mm). Set each set of parameters and record the frequency of the results.
The combination of dimensions close to the characteristic frequency 12Hz screened from the results
is shown in Table 1 below:
Table 1: Baseline-Piezoelectric sheet size combination
Combination Basplate thickness
(mm)
Piezoelectric sheet
thickness(mm)
Piezoelectric
beam length(mm)
Piezoelectric
beam width(mm)
1 0.2 0.2 70 20
2 0.2 0.2 80 30
3 0.2 0.2 90 40
4 0.2 0.3 100 35
5 0.3 0.2 90 25
6 0.3 0.3 100 20
Conduct the above combination for transient simulation analysis, obtain the piezoelectric sheet
potential, record the data, and analyze the potential changes of the piezoelectric sheet, as shown in
Figure 13:
Figure 13: Amplitude diagram of each combined piezoelectric sheet
The above simulation is performed at 12Hz characteristic frequency, comparing the changes of the
stability potential of the piezoelectric wafer of each combination, where the amplitude of the

International Journal of Frontiers in Sociology
ISSN 2706-6827 Vol. 3, Issue 17: 112-120, DOI: 10.25236/IJFS.2021.031717
Published by Francis Academic Press, UK
-119-
combination 5 is maximum. From the comparison of combined dimensions, the analysis shows that
when the piezoelectric sheet thickness is relatively thin, long length and narrow width, the piezoelectric
sheet generated potential is large.
The steady-state potential diagram of the combination 5 is shown in Figure14:
Figure 14: Stability voltage potential diagram
It can be seen from the diagram that the steady-state potential of combination 5 is about 11.5V.
3. Experimental Setting and Analysis
The simulation analysis shows that the device resonance frequency is associated with the structural
parameters of the cantilever arm. The resonance frequency of the system can be adjusted by changing
parameters such as length, width and thickness of the piezoelectric sheet and substrate plates. The
resonance frequency of the system is designed as 12 Hz, combined with the simulation analysis to
finally determine the piezoelectric cantilever beam dimension parameters, as shown in Table 2 below:
Table 2: Parameters of the piezoelectric vibration device
Parameter Name Numerical
value Parameter Name Numerical value
cantilever beam length (mm) 55 cantilever beam width (mm) 30
Piezoelectric sheet length (mm) 40 Piezoelectric sheet width
(mm) 30
Piezoelectric layer thickness (mm) 0.1 Mass block quality ( g) 18
Basstrate thickness (mm) 0.08 Mass block height(mm) 15
The experiment is a piezoelectric vibration device split experiment, by testing the output voltage of
the piezoelectric beam under the resonance state, to verify the correctness of the analytical model.
Figure 15: Vibrating generator experimental system

International Journal of Frontiers in Sociology
ISSN 2706-6827 Vol. 3, Issue 17: 112-120, DOI: 10.25236/IJFS.2021.031717
Published by Francis Academic Press, UK
-120-
Figure16: Open-circuit voltage waveform diagram of the piezoelectric plate
In the piezoelectric vibration mechanism division experiment, the open circuit voltage of the
piezoelectric sheet is shown in Figure15, 16: the open circuit voltage in the experiment is 10.1V,
similar to the simulation data in section 2.
In the characteristic frequency simulation, the resonance frequency is 12.029Hz, close to the
theoretical value of the resonance frequency of 12Hz.
4. Conclusion
A piezoelectric electromagnetic composite vibration energy generator is designed using
COMSOL-Multiphysics FEM simulation software. Key simulation of the vibration mechanism of the
generator includes its characteristic frequency, frequency domain response, time domain analysis, and
obtained its piezoelectric potential and motion characteristics.
It is concluded from the simulation that the amplitude near the resonance frequency 12Hz and the
potential of the mass block and of the piezoelectric sheet reach the maximum, and the maximum
displacement of the mass block reaches the maximum potential of the 6.202 mm, 23.854 V.
References
[1] Jian Li,Chun-li Zhang,Rong-hao Bao. Research laboratory on the mechanics of smart materials
and structures, Zhejiang University. [J].SCIE, 2019, 20(4): 305-310.
[2] Chen Dingfang,Sun Ke.Research Status and Development Trend of Micro Piezoelectric Energy
Collector [J]. Journal of Hubei University of Technology, 2012, 27 (4): 1-8.
[3] Liu Xu. Study on Influence of Unit Parameters on cantilever Based on Finite Element Simulation
[J]. Modern Manufacturing Technology and Equipment, 2019,276 (11): 69-70.
[4] Xiao-biao SHAN, Shi-wei GUAN, Zhang-shi LIU. A new energy harvester using a piezoelectric and
suspension electromagnetic mechanism [J]. EI/SCIE.2013, 14(12): 890-897.
[5] Hibbeler R C. Mechanics of materials [M].USA: Pearson Prentice Hall publisher, 2005.
[6] Sun Yafei, Yang Yunpeng. Development of micro-piezoelectric self-power generation system for
cantilever beam [J]. Electronics Technology and Software Engineering, 2020, (2): 210-212.
[7] Kan Junwu, Tang Kehong, Wang Shuyun, etc. Modeling and Simulation Analysis of Piezoelectric
cantilever Power Generation Device [J].Optical Precision Engineering, 2008, 16 (1): 71-75.
[8] Zhao Xingqiang, Wen Zhiyu. Harmonant Frequency Regulation of Piezoelectric cantilever Power
Generation Device [J]. Piezoelectric and acoustic light, 2013, 35 (2): 241-244.
[9] Guo Xinyuan, Yue Jianhui, Zheng Yi. Analysis of the mode and harmonic response characteristics
of the single-crystal piezoelectric sheet [J]. Computer simulation, 2020, 37 (12): 178-180.
[10] Fang Liqing, Zhang Lei. Modeling and experiment of equivalent viscosity damping of
single-crystal piezoelectric cantilever beam [J]. Optical Precision Engineering, 2014, 22 (3): 641-648.
[11] Cheng Guangming, Li Xinhui, Zhang Haibin, Zeng Ping, Wen Jianming. Effect of Change of
cantilever-type Biwafer on Its Dynamic Characteristics [J]. Optical Precision Engineering, 2014, 22
(5): 1296-1303.