design and optimization of a micro-aerial vehicle and optimization of a micro-aerial vehicle for...
TRANSCRIPT

Design and
Optimization of a
Micro-Aerial Vehicle
For Design/Build/Fly
Michelle Acevedo Benjamin Andrews Casey Brown Christopher Cahill Ruxandra Duca Emily Dunham Mitchell Lentz
Edson Novinyo Luis Paredes
Emily Perry Miles Schuler Ashley Smith
Daniel Thiesse

AL2-1601
Design and Optimization of a
Micro-Aerial Vehicle
A Major Qualifying Project Report
Submitted to the Faculty of the
WORCESTER POLYTECHNIC INSTITUTE
In partial fulfillment of the requirements for the
Degree of Bachelor of Science
in Aerospace Engineering
by
Michelle Acevedo _________________
Benjamin Andrews _________________
Casey Brown _________________
Christopher Cahill _________________
Ruxandra Duca _________________
Emily Dunham _________________
Mitchell Lentz _________________
Edson Novinyo _________________
Luis Paredes _________________
Emily Perry _________________
Miles Schuler _________________
Ashley Smith _________________
Daniel Thiesse _________________
April 26, 2016
Approved by: __________________________
Prof. Anthony B. Linn
Aerospace Engineering Program
Mechanical Engineering Department, WPI
__________________________
Prof. Seong-kyun Im
Aerospace Engineering Program
Mechanical Engineering Department, WPI

I
Abstract
AIAA’s 2016 Design/Build/Fly Competition required the construction of two separate
systems to complete distributive manufacturing missions. The team had to develop a production
aircraft to carry a 1 kg payload and a manufacturing support aircraft which could carry the
production aircraft internally. Aircraft designs were finalized using merit analyses and iterative
design techniques to make quantitative decisions. The team selected a flying wing design for
the production aircraft nested inside the wing of a conventional design manufacturing support
aircraft as final configurations. The aircraft were manufactured and tested to ensure designs
would complete mission requirements while maintaining the highest possible score by retaining
minimal components and a low aircraft weight.
“Certain materials are included under the fair use exemption of the U.S. Copyright Law and
have been prepared according to the fair use guidelines and are restricted from further use."

II
Executive Summary
The following report documents the efforts of Worcester Polytechnic Institute’s 2016
AIAA/Cessna/Raytheon Design/Build/Fly competition team during the background research,
design, analysis, manufacturing, and testing of their aircraft entries. The 2016 Design/build/Fly
competition challenges teams to construct two remote controlled electrically powered aircraft
that will fulfill mission requirements and receive the highest total score, which is calculated
based upon the grading of the written report, the aircraft’s flight scores, and the rated aircraft
cost, a function which induces the total weight of both aircraft and the weight of the batteries
used to power them.
The emphasis of this year’s competition is to created aircraft optimized for distributed
manufacturing, and requires the construction of two separate aircraft. The first, named the
“Manufacturing Support (MS) aircraft”, must be able to fly three laps around the DBF
competition course within 5 minutes unloaded in mission 1. In mission 2, the MS aircraft must
internally carry each of the components of the second aircraft from a loading to an unloading
area within 10 minutes. The second, “Production” aircraft, must be made such that it can be
repeatedly assembled and disassembled without using glue, tape, or screws. In addition to
needing to fit within the MS aircraft during mission 2, the production aircraft is required to carry
the payload of a 32oz Gatorade bottle for its only flight (mission 3) which requires the aircraft to
fly three laps around the DBF competition track within 5 minutes.
Although decreasing the components of the production aircraft would increase the weight
the MS aircraft had to carry during mission 2, a scoring analysis conducted by the team
revealed that the winning aircraft tandem would consist of a production aircraft made up of no
more than 2 components. Thus, the challenge for teams would be to create a production aircraft
that was as light as possible to minimize the payload the MS aircraft must carry.
An initial trade study helped our team identify a flying wing configuration to be optimal for
both of our aircraft. The high L/W this configuration yields will help us excel in mission 2 and 3
while simultaneously keeping our rated aircraft cost (RAC) low. Additionally, the ability of flying
wings to “nest” within one another, similar to a Russian Babushka doll, was identified as a
means to minimize the total components of the production aircraft. Subsequent trade studies
helped us select a single tractor motor and tricycle-style landing gear. An analysis program was

III
written in MATLAB was used to determine thrust and power requirements for each leg of the
mission. Battery packs and motors were selected based upon this data, and were sized to
exceed the predicted specifications by a safety factor of 20%. The program also calculated the
distance each aircraft needed to take off, ensuring they would be airborne within 100ft, one of
the mission requirements. Numerous iterations were run using different combinations of airfoils,
batteries, and motors, and the most efficient configuration was selected.
To increase the stability of the production aircraft, the Gatorade bottle was slung under the
main frame. Its housing was 3D printed and reinforced with carbon fiber roving to increase its
structural integrity without adding excess weight. The production aircraft is loaded into the
manufacturing support aircraft upside-down through a hinged flap in the top of the MS aircraft’s
airfoil. This flap is secured through the use of Velcro. A foam faring covers the fuselage and
landing gear of the production aircraft. A tail was added In order to counteract the large moment
created by the MS aircraft’s think airfoil. The tail also houses the MS aircraft’s control surfaces.
Each subsystem of our aircraft were tested, and the results were compared to the predicted
values, resulting in small changes to optimize results. Due to heavy winds at the competition,
flight of the MS aircraft was only briefly achieved, whereas the production aircraft did not fly.

IV
Acknowledgements
We would like to thank the following individuals and groups for their help and support
throughout the entirety of this project:
Project Advisor Professor Anthony B. Linn
Project Advisor Professor Seong-kyun Im
Project Advisor Professor Nikhil Karanjgaokar
WPI Faculty Professor Raghvendra V. Cowlagi
WPI Students Jean Furter, Johnathan Griffin, Zachary Ligham,
Austin McCalmont, John O’Neill, Kelley Slabinski,
Club Millis Model Aircraft Club

V
Table of Authorship
Section Author(s)
1. Introduction
1.1 – 1.2 ED, ML
2. Conceptual Design
2.1, 2.4 CB
2.2, 2.4 AS
2.3, 2.5 ML
2.5 MA, MS
2.6 BA
2.7 CB
3. Aircraft Design
3.1 – 3.4 CC, EP, DT
3.5 – 3.6 DT
3.7 BA, ED, EN
3.8 AS, CB
4. Detailed Design Models
4.1 DT
4.2 CB, AS
4.3 – 4.8 RD, LP
4.7 BA
4.9 – 4.10 ML
5. Manufacturing
5.1 CB, LP
5.2 MA, CB
5.1 – 5.3 AS
6. Testing
6.1 CB
6.1 – 6.4 AS
6.2 DT
6.3 BA, ED, EN
6.5 MS
7. Final Results
7.1 – 7.2 AS
8. Conclusion
8.1 – 8.2 MA
Appendices
A – D CC, EP, DT
E ML
F RD, LP
Final Edits
References CC
Editing and Formatting RD
VI
Table of Contents
Abstract....................................................................................................................................... I
Executive Summary ................................................................................................................... II
Acknowledgements ................................................................................................................... IV
Table of Authorship .................................................................................................................... V
Table of Figures ........................................................................................................................ IX
List of Tables ............................................................................................................................. X
1. Introduction ......................................................................................................................... 1
1.1 Team Organization ...................................................................................................... 1
1.2 Project Gantt Chart ...................................................................................................... 3
2. Conceptual Design .............................................................................................................. 5
2.1 Design Constraints ....................................................................................................... 5
2.2 Mission Sequence........................................................................................................ 6
2.2.1 Mission 1: Manufacturing Support Aircraft Arrival .................................................. 6
2.2.2 Mission 2: Manufacturing Support Aircraft Delivery Flight ..................................... 6
2.2.3 Mission 3: Production Aircraft Flight ...................................................................... 7
2.2.4 Mission 4: Bonus Mission...................................................................................... 7
2.2.5 Mission Model ....................................................................................................... 8
2.3 Scoring Formula .......................................................................................................... 9
2.4 Sensitivity Analysis ...................................................................................................... 9
2.4.1 Aircraft Configuration Selection ............................................................................. 9
2.4.2 Payload Configuration ..........................................................................................11
2.4.3 Propeller Configuration ........................................................................................11
2.4.4 Landing Gear Configuration .................................................................................13
2.5 Material Analysis .........................................................................................................14
2.6 Battery Selection .........................................................................................................14
2.7 Conceptual Design Summary .....................................................................................15
3. Aircraft Design ...................................................................................................................16
3.1 Aerodynamic Analysis .................................................................................................16
3.2 Aerodynamic Analysis for Production Aircraft ..............................................................16
3.2.1 Initial Approach ....................................................................................................16
3.2.2 Second Approach: Weight Estimate .....................................................................18

VII
3.2.3 Second Approach: Airfoil Analysis .......................................................................18
3.2.4 Second Approach: Initial Sizing ...........................................................................20
3.2.5 Third Approach: Changes from the Previous Approach .......................................21
3.2.6 Third Approach: Methodology ..............................................................................22
3.2.7 Third Approach: Results ......................................................................................23
3.2.8 Control Surfaces Analysis ....................................................................................24
3.3 Aerodynamic Analysis for Manufacturing Support Aircraft ...........................................25
3.4 Stability Analyses ........................................................................................................27
3.5 Wing Tunnel Testing ...................................................................................................30
3.6 Final Design Parameters based on Aerodynamic Analyses ........................................32
3.7 Propulsion Analysis .....................................................................................................34
3.7.1 Motor and Propeller .............................................................................................34
3.7.2 Battery .................................................................................................................34
3.8 Structural Analysis ......................................................................................................35
4. Detailed Design Models .....................................................................................................36
4.1 Summary of Final Specifications .................................................................................36
4.2 Weight Balance ...........................................................................................................38
4.3 Fuselage - Production Aircraft .....................................................................................39
4.4 Fuselage – Manufacturing Support Aircraft .................................................................41
4.5 Payload Arrangement .................................................................................................43
4.6 Wings..........................................................................................................................44
4.7 Propulsion System Integration ....................................................................................45
4.8 Landing Gear ..............................................................................................................48
4.9 Expected Performance ...............................................................................................50
4.10 Rated Aircraft Cost ......................................................................................................50
5. Manufacturing ....................................................................................................................51
5.1 Materials Selected for Major Components ..................................................................51
5.2 Manufacturing Processes............................................................................................54
5.3 Manufacturing Milestones Chart ..................................................................................56
6. Testing ...............................................................................................................................57
6.1 Structural Testing ........................................................................................................57
6.2 Wind Tunnel Testing ...................................................................................................58
6.3 Battery and Propulsion Testing ...................................................................................59
6.4 Flight Checklist ...........................................................................................................60
6.5 Prototype ....................................................................................................................61
VIII
7. Final Results ......................................................................................................................62
7.1 Final Aircraft Performance ..........................................................................................62
7.2 Competition results .....................................................................................................62
8. Conclusion .........................................................................................................................64
8.1 Outcome .....................................................................................................................64
8.2 Recommendations ......................................................................................................65
Appendix A – Aerodynamic Analyses Results ...........................................................................67
Appendix B – Initial Sizing Results ............................................................................................74
Appendix C – Detailed Airfoil Results for Production Aircraft .....................................................76
Appendix D – Detailed Results for Manufacturing Support Aircraft ............................................84
Appendix E – MATLAB Code for Power Requirement Calculation ............................................90
Appendix F – CAD Package .................................................................................................... 100
References ............................................................................................................................. 114

IX
Table of Figures
Figure 1.1-1 Group Organizational Structure .............................................................................. 2
Figure 1.2-1 - Project Gantt Chart .............................................................................................. 4
Figure 2.2-1 - Mission Model ...................................................................................................... 8
Figure 2.4-1 - Aircraft Configurations ........................................................................................10
Figure 2.4-2 Concept Drawing of Flying Wing and Traditional Production Aircraft .....................10
Figure 2.4-3 Propeller Configurations ........................................................................................12
Figure 2.4-4 Landing Gear Configurations ................................................................................13
Figure 3.2-1 XFLR5 Initial Model for Production Aircraft ............................................................18
Figure 3.2-2 NACA 4412 Coefficient of Lift vs. Angle of Attach .................................................19
Figure 3.2-3 NACA 4412 Moment, Drag, and Lift-t-Drag Graphs ..............................................20
Figure 3.4-1 Production Aircraft Airfoil Profiles ..........................................................................27
Figure 3.4-2 Production Aircraft Aerodynamic Graphs ..............................................................28
Figure 3.4-3 Manufacturing Support Aircraft Airfoil Profiles .......................................................28
Figure 3.4-4 Manufacturing Support Aircraft Aerodynamic Graphs ............................................29
Figure 3.4-5 Production Aircraft Stability Analysis in XFLR5 .....................................................29
Figure 3.4-6 Manufacturing Support Aircraft Stability Analysis in XFLR5...................................30
Figure 3.5-1 Theoretical/Actual Lift for Production Aircraft ........................................................31
Figure 3.5-2 Theoretical/Actual Lift for Manufacturing Support Aircraft ......................................32
Figure 4.2-1 Weight Balance .....................................................................................................39
Figure 4.3-1 Production Aircraft Initital Fuselage Design ...........................................................40
Figure 4.3-2 - Section View of Aluminum Fitting Showing Wing Spar and Reinforcing Tubes ...40
Figure 4.3-3 Updated Structure of Production Aircraft Fuselage ...............................................41
Figure 4.3-4 Foam Fairing Fuselage an Aerodynamic Shape ....................................................41
Figure 4.4-1 Fuselage Strength Given by Central Carbon Fiber Spar .......................................42
Figure 4.4-2 Tail Fittings Connected to Central Carbon Fiber Spar ...........................................42
Figure 4.4-3 Foam Fairing for Manufacturing Support Aircraft ...................................................43
Figure 4.5-1 Section View and Entire View of 3D Printed Payload Case ...................................43
Figure 4.5-2 Updated Attachment of the 3D Printed Case .........................................................44
Figure 4.5-3 Manufacturing Support Aircraft with Wing Lids Open ............................................44
Figure 4.6-1 Production Aircraft Wing Design............................................................................45
Figure 4.6-2 Manufacturing Support Aircraft Wing Design .........................................................45
Figure 4.7-1 Initial Motor Mount for Production Aircraft .............................................................46
Figure 4.7-2 Final Motor Mount for Production Aircraft ..............................................................46
Figure 4.7-3 Production Aircraft Propulsion System Wiring Diagram .........................................47
Figure 4.7-4 Manufacturing Support Aircraft Propulsion System Wiring Diagram ......................48
Figure 4.8-1 Initial Design of Production Aircraft Landing Gear .................................................48
Figure 4.8-2 Final Design of Production Aircraft Landing Gear ..................................................49
Figure 4.8-3 Nose Wheel and Servo Arrangement ....................................................................49
Figure 6.2-1 Wind Tunnel Testing of Wing Test Sections ..........................................................58

X
List of Tables
Table 2.4-1 Comparative Analysis of Aircraft Configurations .....................................................10
Table 2.4-2 Comparative Analysis of Propeller Configurations ..................................................12
Table 2.5-1 Materials Properties ...............................................................................................14
Table 2.6-1 Comparative Analysis for Battery Selection ............................................................15
Table 3.2-1 Induced Drag Results .............................................................................................17
Table 3.2-2 Airfoils Initial Ranking .............................................................................................18
Table 3.2-3 NACA 4412 Aerodynamic Coefficients Based on Airspeed ....................................20
Table 3.2-4 Results for Lissaman 7769 Airfoil ...........................................................................20
Table 3.2-5 NACA 4412 Updated Aerodynamic Coefficients Based on Airspeed ......................21
Table 3.2-6 Summary of Aerodynamic Analysis for Production Aircraft Potential Airfoils ...........24
Table 3.2-7 Summary of Aerodynamic Results for NACA 4412 .................................................25
Table 3.3-1 Summary of Results for Manufacturing Support Aircraft Potential Airfoils ...............26
Table 3.3-2 Summary of Aerodynamic Results for NACA 4418 .................................................26
Table 3.4-1 Production Aircraft Initial Stability Results ..............................................................30
Table 3.6-1 Final Design Parameter for Both Aircraft ................................................................33
Table 3.7-1Motor and Propeller Specifications ..........................................................................34
Table 4.1-1 Summary of Final Specifications ............................................................................36
Table 4.10-1 Rated Aircraft Cost ...............................................................................................50
Table 5.1-1 Detailed Material Usage Description ......................................................................53
Table 6.3-1 Thrust Testing Results ...........................................................................................59

1
1. Introduction
Unmanned aviation dates back to the early nineteenth century models used in the
development of manned flight. Today, unmanned aerial vehicles are used for both military and
civilian purposes, with applications ranging from disaster recovery missions to delivering online
purchases. The term “unmanned aerial vehicle” refers to a robotic aircraft that operates either
autonomously or via remote control. Unmanned aerial vehicles are particularly attractive due to
their implementation capabilities in high-risk circumstances. [1]
The purpose of this project was to design, manufacture, and test two unmanned aerial
vehicles for entry in the 2016 AIAA Foundation/Cessna/Raytheon Missile Systems Student
Design/Build/Fly competition. The AIAA Foundation invites university students from around the
world to participate in this competition and have the opportunity to construct a radio-controlled
aircraft to meet specific mission requirements that vary each year. [2] The 2016 Design/Build/Fly
competition required teams to simulate distributed manufacturing through the development of
two aircraft: one aircraft optimized for assembly into a production aircraft and another optimized
for moving the production aircraft components to a centralized assembly location. [3]
This project aimed to develop two aircraft to meet the mission requirements established by
the AIAA Foundation. The primary objectives were to minimize the weight of both aircraft and
the number of components used to construct the production aircraft. This report describes the
analysis, design, and manufacturing processes used to develop the two unmanned aerial
vehicles entered by the Worcester Polytechnic Institute 2016 Design/Build/Fly team.
1.1 TEAM ORGANIZATION
The WPI team adopted a business structure and project timeline to aid in the delegation
and timely completion of project objectives. As a method of optimizing each group member’s
skill set, the team was separated into five subgroups: Project Manager, Aerodynamics,
Propulsion, Design, Structures/Materials and Manufacturing. This business structure was
flexible, as all team members collaborated together to reach deadlines, share viewpoints and
learn the various disciplines. The team layout can be seen below in figure 1.1-1.

2
Figure 1.1-1 Group Organizational Structure
Each subgroup was led by one person, who was in charge of their respective assignments
and delegating the workload to the group. As the needs of the team changed throughout our
first and second semesters, additional subgroups were formed and existing subgroups were
disbanded. All team members fully participated in the writing of reports. The roles of each group
are as follows:
Project Manager: The project manager was responsible for organizing and leading team
meetings, corresponding with the AIAA, analyzing and confirming results from subgroups,
and delegating work at meetings. This position required planning, organizing, delegating,
and communication skills, as well as the ability to be flexible and manage setbacks.
Aerodynamics Team: The aerodynamics team was responsible for selecting airfoils, sizing,
performing stability analyses, and designing the control surfaces of both the Production and
the Manufacturing Support Aircraft. The skills required were a deep knowledge of both
incompressible fluid and aircraft dynamics, and the ability to use and interpret XFLR5.

3
Propulsion Analysis: The propulsion analysis team was responsible for selecting the
motor, battery, propeller, speed controller, and receiver for the aircraft. The skills required
included an understanding of electrical components, propeller thrust equations, and battery
types.
Design Team: The design team was responsible for researching and strategizing innovative
RC designs and structures that would call for a successful aircraft. The skills required were a
blend of knowledge from multiple disciplines as well as the use of Computer Aided Design
software such as SolidWorks.
Structural and Material Analysis: This team was responsible for researching, testing, and
acquiring the materials needed to build the aircraft. They also identified necessary
manufacturing techniques and equipment. The skills required included a background in
structural analysis and materials science.
Manufacturing Team: This team was responsible for the implementation of the model
created by the Design Team. This consisted of the purchasing of materials, the
manufacturing of test sections, structural testing and actual building of the Production and
Manufacturing Support Aircraft.
1.2 PROJECT GANTT CHART
To stay on schedule throughout the project, a Gantt chart was used. This chart shows the
progress of all activities that occurred since the start of the project. The chart is color coded for
both the production aircraft and the manufacturing support aircraft.

4
Figure 1.2-1 - Project Gantt Chart
5
2. Conceptual Design
The objective of the conceptual design phase was to identify possible configurations which
would meet the requirements of the 2016 Design/Build/Fly competition. Merit analyses were
used to vet the possible solutions and to determine the optimal configuration for each aircraft.
2.1 DESIGN CONSTRAINTS
Analysis of the contest rules yielded the following requirements for this year’s aircraft
The aircraft can be of any design except rotary wing or lighter-than-air.
The batteries must be either NiCD or NiMH, and the on-board battery packs must be the
only power source assisting the aircraft’s takeoff.
The aircraft must be propeller driven and electric powered.
o The propeller must be bought from a manufacturer and cannot be built by the team.
o The motor must be available over-the-counter and remain unmodified by the team.
The payloads must be secured in place during flight.
The Manufacturing Support Aircraft must carry the Production Aircraft internally as a
payload. The Production Aircraft may be disassembled and transported internally one
component at a time.
The Production Aircraft must be transported within the Manufacturing Support Aircraft.
o This can be done by dissembling the Production Aircraft into sub-assemblies. Each
sub-assembly must be transported alone without any other components.
o The Production Aircraft must be capable of being taken apart and reassembled
multiple times. Therefore, the aircraft may not undergo any cutting or gluing as
methods of breakdown and reassembly.
The Production Aircraft must carry an unopened 32-ounce Gatorade bottle internally as a
payload.

6
2.2 MISSION SEQUENCE
The 2016 DBF competition consists of three flight missions and one bonus ground
mission. All three flight missions must be flown in order; a new mission cannot be attempted
until a score has been received for the previous mission. The bonus ground mission will then be
completed after completing all the above missions successfully. Before beginning the first of the
three missions, the aircraft must first pass the wing tip load test with the intended payload for
each mission. The bonus ground mission will be completed in an area separate from the flight
area immediately after the final flight. For the bonus mission, the team will bring all Production
Aircraft sub-assembly groups flown to the designated area and must assemble the Production
Aircraft from the sub-assemblies within 2 minutes, including re-installing the payload. The
completed aircraft must then pass the wing tip lift test and a controls systems check for a score
to be given. [3]
The staging box is only for the pilot, pilot assistant and assembly crew members. After pre-
flight checkout, the crew members may be swapped out if the team desires. The aircraft is
limited to a 30.48 m (100-ft) takeoff field length and the aircraft must use ground rolling takeoff
and landing. For the turn on the first lap on any mission, the turn will not be permitted until the
judge gives a signal The pilot will have unaided visual control of the aircraft at all times. Finally,
to receive a score on any mission, the plane must successfully land. [3]
2.2.1 Mission 1: Manufacturing Support Aircraft Arrival
This mission only requires the Manufacturing Support Aircraft. There is no payload for the
arrival flight and the aircraft has a 30.48 meter takeoff requirement. The goal of this mission is to
complete three laps within the time limit of five minutes. Time is started when throttle is
advanced for takeoff. A lap is measured when the aircraft passes the start/finish line. The
aircraft must land successfully to get a score. The aircraft can receive 1 of 2 scores for this
mission [3]:
MF1 = 2.0 - if aircraft completes the mission
MF1 = 0.1 - if aircraft does not attempt or complete the mission
2.2.2 Mission 2: Manufacturing Support Aircraft Delivery Flight
In Mission 2, both the Manufacturing Support Aircraft and Production Aircraft will be used.
The Production Aircraft will be disassembled into sub-assemblies to be carried internally by the

7
Manufacturing Support Aircraft. The mission will begin when the first sub-assembly is installed.
The Manufacturing Support Aircraft must take-off within the 30.48 m field length, fly one lap with
the sub-assembly installed then return and land. After each lap, the aircraft will taxi to the
designated payload change area where the ground crew will “safe” the aircraft propulsion
system, remove the installed sub-assembly group, install and secure the next sub-assembly
group and re-enable the aircraft propulsion system. The aircraft will taxi to a location before the
Start Line and take-off for the next lap. Time ends when the aircraft passes the start line in the
air at the end of the final flight. The goal of this mission is to complete the required task within
10 minutes. The aircraft must complete a successful landing on each flight to obtain a score.
The Production Aircraft sub-assemblies do not include the Production Aircraft flight battery or
payload. The aircraft can receive 1 of 3 scores for this mission [3]:
● MF2 = 4.0 – Aircraft completes all sub-assembly group transport flights successfully within
the time window.
● MF2 = 1.0 - Aircraft completes less than all the sub-assembly flights within the designated
time allowance but at least 1 group is successfully transported
● MF2 = 0.1 – Aircraft does not attempt or complete a successful flight
2.2.3 Mission 3: Production Aircraft Flight
This is mission requires the Production Aircraft to carry a payload internally. The load is a
32 oz. Gatorade bottle with approximate specifications: height 20.8 cm, max diameter 9.4 cm,
weight 1.02 kg. The goal of this mission is to complete three laps within the time limit of five
minutes. A lap is complete when the aircraft passes over the start/finish line in the air. The
aircraft can receive 1 of 3 scores for this mission [3]:
● PF = 2.0 – Aircraft completes the required flight within the time period carrying the full
payload
● PF = 1.0 – Aircraft completes less than the required laps or exceeds the time period
● PF = 0.1 – Aircraft does not attempt or complete a successful flight
2.2.4 Mission 4: Bonus Mission
Each team may attempt the bonus mission after completing all three missions. The bonus
mission will be completed in an area separate from the flight area immediately after the final
flight as the team will bring all Production Aircraft sub-assembly groups flown to the designated
area. The ground crew must assemble the Production Aircraft from the sub-assemblies
including re-installing the payload. The goal of this mission is to complete the required tasks in

8
under two minutes. The completed aircraft must pass the wing tip lift test and a controls systems
check. The aircraft can receive 1 of 2 scores for this mission [3]:
● Bonus = 2.0 – Aircraft assembled in specified time and passes wing tip lift test
● Bonus = 0.0 – Any other result
2.2.5 Mission Model
A mission model was created to aid in the determination of power and energy
requirements as well as the ideal flight path for each mission. The model can be seen below:
Figure 2.2-1 - Mission Model
● Takeoff roll - Starting at a standstill, the aircraft will begin to accelerate to takeoff speed
● Liftoff - Before the aircraft begins to climb, the aircraft will continue to throttle up to the climb
velocity
● Climb - Aircraft will increase in altitude in order to commence the mission
● Cruise - Ideal velocity of operating the aircraft during the missions
● Turn - The turns will be executed dependent on the wing loading of the aircraft. Each turn
will be mission dependent.
● Assumptions - Velocity, climb rates and turns were determined assuming no winds during
the flight. Also, no immediate pitch angle change is assumed. Finally, the model was
determined with no pilot error.

9
2.3 SCORING FORMULA
Once all of the missions are completed the team’s total score can be calculated. The total
score is a function of all of the mission scores, the total weight of both aircraft, the battery weight
of both aircraft, the number of components of the Production Aircraft, and the written report
score. The equations that are used to calculate the total score can be seen below [3]:
𝑆𝑐𝑜𝑟𝑒 =
𝑊𝑟𝑖𝑡𝑡𝑒𝑛 𝑅𝑒𝑝𝑜𝑟𝑡 𝑆𝑐𝑜𝑟𝑒 ∗ 𝑇𝑜𝑡𝑎𝑙 𝑀𝑖𝑠𝑠𝑖𝑜𝑛 𝑆𝑐𝑜𝑟𝑒
𝑅𝐴𝐶
(1)
𝑇𝑜𝑡𝑎𝑙 𝑀𝑖𝑠𝑠𝑖𝑜𝑛 𝑆𝑐𝑜𝑟𝑒 = 𝑀𝐹1 ∗ 𝑀𝐹2 ∗ 𝑃𝐹 + 𝐵𝑜𝑛𝑢𝑠 (2)
𝑅𝑎𝑡𝑒𝑑 𝐴𝑖𝑟𝑐𝑟𝑎𝑓𝑡 𝐶𝑜𝑠𝑡 (𝑅𝐴𝐶) = 𝐸𝑊1 ∗ 𝑊𝑡𝐵𝑎𝑡𝑡𝑒𝑟𝑦1 ∗ 𝑁𝐶𝑜𝑚𝑝𝑜𝑛𝑒𝑛𝑡𝑠 + 𝐸𝑊2 ∗ 𝑊𝑡𝐵𝑎𝑡𝑡𝑒𝑟𝑦2 (3)
EW1 and EW2 are the empty weights of the Production and Manufacturing Support
Aircraft respectively, and NComponents is the number of subassemblies that the Production Aircraft
is broken into to be delivered by the Manufacturing Support Aircraft. As seen from the equation,
aircraft weight has a significant factor in the final score. This will necessitate an aircraft design
with a strong enough structure to withstand the forces of flight and landing that is also as light as
possible. The number of components in which the Production Aircraft must be broken into to be
delivered is also a factor in the denominator of the overall score equation, which means that it
will have a large effect. To minimize the number of components, clever packaging designs for
the Production Aircraft within the Manufacturing Support Aircraft will need to be employed.
Since the aircraft or the sub-assemblies must be completely enclosed, the design of the
Production Aircraft will significantly affect the design of the Manufacturing Support Aircraft.
2.4 SENSITIVITY ANALYSIS
2.4.1 Aircraft Configuration Selection
Four types of aircraft were considered: traditional (fixed wing), canard, biplane, and flying
wing. Although the canard configuration allows for good stall characteristics and stability, it is
difficult to choose a forward wing of the correct size, and to make sure it stalls before the wing.
Additionally, the wing twist distribution can distort the load distribution, leading to the elimination
of this type of aircraft from our list of choices. Similarly, the biplane was not considered due to

10
the added weight of a second airfoil and the increased number of components, a key feature
that the team wished to minimize.
Figure 2.4-1 - Aircraft Configurations
After narrowing the research down to the flying wing and the traditional configurations, two
concepts were drawn as shown in the figure below:
Figure 2.4-2 Concept Drawing of Flying Wing and Traditional Production Aircraft
Then, a comparative analysis between them was performed as presented below:
Table 2.4-1 Comparative Analysis of Aircraft Configurations
Weight of score Conventional Flying wing
Weight 0.35 0 1
Number of components 0.25 0 1
Payload abilities 0.05 1 0
Drag 0.10 0 1
Ease of Manufacture 0.15 1 0
Power Needed 0.10 0 1
TOTAL 0.20 0.80

11
In the table above, 1 represents the preferred performance in the given category. The
preferred performance is defined as the smaller value for weight, number of components, drag,
and power needed. Overall, the multiple advantages of low weight/number of components as
well as the high lift provided by the flying wing led us to choose this configuration for our
Production Aircraft.
2.4.2 Payload Configuration
The Production Aircraft must carry the payload (Gatorade bottle) during two of the events
of the competition: tech inspection and mission three. During tech inspection, the Production
Aircraft is required to undergo the wing tip lift test with the design payload installed. During
mission three, the Production Aircraft must takeoff within a prescribed field length and fly three
laps within five minutes while carrying the payload internally. For our team’s payload
configuration, we determined the best possible way to carry our payload internally was to
position our payload along the central axis of the Production Aircraft fuselage and ensure it was
properly secured during the two events. This configuration is beneficial as it is much easier to
maneuver an aircraft which possesses a balanced load distribution. Similarly, during tech
inspection, an even load distribution reduces the possibility of irreparable damage to the aircraft.
The detailed design was performed later in the project.
2.4.3 Propeller Configuration
When designing the aircraft, five propeller configurations were considered: single tractor,
single pusher, tractor/pusher, double tractor, and double pusher. A tractor configuration
produces thrust using propellers that pull in air from the front of the aircraft. A pusher
configuration produces thrust using propellers that push air from the back of the aircraft. A
tractor/pusher configuration uses one tractor propeller and one pusher propeller and a double
tractor or double pusher configuration uses one propeller on each wing. Our research focused
on airflow through the propeller and over the aircraft body, aircraft stability, and takeoff/landing
clearance.

12
Figure 2.4-3 Propeller Configurations
It is generally known that for Radio Controlled aircraft tractors are significantly more
efficient than pushers because a tractor propeller will intake clean, undisturbed air, while a
pusher propeller will intake turbulent air that has already passed over the body of the aircraft.
However, it was also noted that because the air travelling over the main aircraft body will be
turbulent from the propeller, tractor propellers cause the body to create more drag. It was
concluded that for low speed applications, the efficiency of the motor will be of greater effect
than any induced drag.
From a stability standpoint, pusher propeller aircraft tends to be more stable, particularly
in the yaw and pitch axes. The propeller improves stability by acting as a vertical tail surface
that moves the center of lift toward the back of the plane. A tractor propeller has the opposite
effect, bringing the center of lift forward and improving maneuverability but lessening the aircraft
stability. For our aircraft, stability carries more importance than maneuverability due to the
nature of the flight missions this year.
Takeoff, landing, and ground maneuverability all favor a tractor setup. Pusher propellers
require very careful takeoff and landing because it is possible for the propeller to clip the ground
during the nose up of a takeoff or during the flare of a landing trajectory. Pusher configurations
are also less maneuverable than tractors during taxiing on the runway. Pictured below is a
weighing chart of each of these factors for the various propulsion system configurations.
Table 2.4-2 Comparative Analysis of Propeller Configurations
Criteria Weight Single Tractor
Single Pusher
Tractor/ Pusher
Double Tractor
Double Pusher
Weight 0.3 2 2 1 1 1
Stability 0.15 0 2 1 1 3
Efficiency 0.25 2 1 3 2 1
Takeoff/Landing Clearance/Control 0.2 2 1 1 2 0
Compactability 0.1 2 2 1 0 0
Total 1.7 1.55 1.5 1.35 1

13
This table gives different weight to each of the important criterion that affect our aircraft’s
performance in the given missions. A higher positive value given to a configuration indicates a
more favorable outcome. The total score of each configuration is printed in bold at the bottom of
their respective columns. From these results, we selected a single tractor configuration.
2.4.4 Landing Gear Configuration
Three landing gear configurations were considered in the design of both aircraft: tricycle
gear, taildragger gear, and bicycle gear. The tricycle gear configuration uses two main gear
wheels aft of the CG and a steerable nose wheel forward of the CG, resulting in excellent
ground handling but high drag due to the length of the gear legs. The taildragger configuration
uses two main gear wheels forward of the CG and a small steerable tail wheel mounted on the
tail of the aircraft. Since the tailwheel is aft of the CG, this configuration is unstable during
ground handling and requires proper rudder input to maintain control during taxi. However, this
configuration creates less drag than the tricycle gear configuration since the tailwheel is small
and remains close to the fuselage. The bicycle configuration allows most of the weight of the
aircraft to be transferred to a main wheel and a secondary wheel closer to the tail, but requires
two additional wheels mounted on the wings to remain balanced during taxi, which adds drag.
Figure 2.4-4 Landing Gear Configurations
For the Production Aircraft, we decided to use a tricycle gear since the flying wing design
does not include a tail and therefore eliminates the possibility of a taildragger or bicycle
configuration. This setup requires a third servo to control the steerable nose wheel during
ground handling and allows us to place the wheels as closely as possible to the fuselage to
minimize the Production Aircraft’s profile as it is transported in the Manufacturing Support
Aircraft.
Bicycle Tricycle Taildragger

14
A taildragger configuration was selected for the Manufacturing Support Aircraft since the
boom tail allowed for the presence of a lightweight tail wheel while most of the aircraft’s weight
is transferred to sturdy main gear legs. A taildragger configuration also allows a steerable
tailwheel to be connected to the aircraft’s controllable rudder, eliminating the need for an
additional servo to steer the aircraft during taxi.
2.5 MATERIAL ANALYSIS
To gain an understanding of the materials that should be utilized when creating the two
aircraft, preliminary tests were performed on a 0.22’’ diameter aluminum tube,1/8’’x3’’x38’’
balsa, 2/8’’ thick balsa, and ½’’ diameter carbon fiber tube. We found that the ½’’ diameter
carbon fiber tube withstood the most weight of 20lbs without breaking. The 2/8’’ thick balsa did
not break under 18lbs; this makes it a good thickness for constructing the spar of the aircraft. At
10lbs the 1/8’’x3’’x38’’ balsa cracks and breaks at 12lbs. The 0.22’’ diameter aluminum tube
proved to be the weakest in the test and it started to bend at 8lbs.
Table 2.5-1 Materials Properties
Price (USD/Kg)
Density (Kg/m3)
Modulus (GPa)
Yield Strength (MPa)
Tensile Strength (MPa)
Flexural Modulus (GPa)
Flexural Strength (MPa)
Balsa (Longitudinal) ~8 190 4.7 12.5 20 3.8 20
Balsa (Transverse) ~8 190 0.17 0.8 0.9 0.16 0.95
Polystyrene Foam ~3 30 0.01 0.225 0.4 0.01 0.45
Carbon Fiber ~45 1800 380 2000 2400 380 3500
Polyolefin Film ~2.5 880 0.02 15 15 0.03 28
2.6 BATTERY SELECTION
Two types of batteries, Nickel-Metal Hydride and Nickel-Cadmium, were researched for
the application of the aircraft. Research shows that NiMH can outperform NiCd battery in long
duration applications. It was found that NiMH batteries store twice as much energy as standard
NiCd batteries. Therefore there is a higher power/weight ratio from NiMH than NiCd batteries.
Also, NiMH batteries can be charged many times at different battery charge levels without
affecting the life cycle of the battery while NiCd batteries have to be charged only after they

15
have been fully discharged. This improved life cycle of NiMH over NiCd increases its
applications. NiCd batteries can discharge with about twice the current of NiMH batteries.
However, batteries can be connected together in parallel to increase the max current if needed,
but this increase in battery pack weight would lower the rated aircraft cost. The chart below is a
weighing chart illustrating each of the factors for the battery requirements.
Table 2.6-1 Comparative Analysis for Battery Selection
Criteria Weight NiMH NiCd
Power/Weight 0.6 2 1
Ease of Use 0.1 2 1
Max Current 0.3 1 2
Total 1.7 1.3
As with previous weighing illustrations, a higher positive value represents a more favorable
outcome. From the different weights on the chart, the highest score would provide an aircraft
with the best performance in the given mission. Based on the total scores shown at the bottom
of the chart, we selected NiMH batteries.
2.7 CONCEPTUAL DESIGN SUMMARY
The analyses performed ultimately favored a flying wing design for the Production Aircraft
and a flying wing with a boom-mounted tail configuration for the Manufacturing Support Aircraft.
The final Production Aircraft design is a constant chord, swept flying wing with a single tractor
propeller, and tricycle landing gear which allows for adequate ground handling on a tailless
aircraft. The final Manufacturing Support Aircraft design is essentially a larger version of the
Production Aircraft flying wing with the addition of a boom-mounted tail to help counteract a
large moment from a thick, cambered airfoil. These two aircraft were designed in tandem to
ensure a high score at the competition.

16
3. Aircraft Design
3.1 AERODYNAMIC ANALYSIS
Initial sizing and design of the aircraft began with rough weigh estimates and an initial
chord length. The weight estimates were based on historical empty weight ratios from RC
aircraft from similar competitions, as well as the weight of the payload. The chord length was
initially estimated based on the size of the payload, specifically the height of the Gatorade
Bottle. Aerodynamic calculations were then made to determine initial sizing of the aircraft. The
calculated aerodynamic data was sent to the design team to determine a more precise weight
estimate. With the values of lift and drag from the aerodynamic analysis, a MATLAB program
was written to determine the power requirements of each leg of the mission. Additionally, the
program determined the load factor on the airplane and the time each plane would require to
complete three laps of the course. Based upon results obtained from this program, the initial
propulsion subsystem elements were selected. This became an iterative process until the team
achieved a final weight, design and size of both aircraft.
3.2 AERODYNAMIC ANALYSIS FOR PRODUCTION AIRCRAFT
3.2.1 Initial Approach
The first number needed was a rough weight estimate for the production aircraft only as
the weight of the production aircraft would be needed to have a weight estimate for the
manufacturing support aircraft. To make sure there was a buffer with the amount lift needed, a
2:1 ratio of aircraft weight to payload of used. As the bottle weighed about 1 kg, the aircraft
would need to be 2 kg for a grand total of 3 kg.
Airfoils commonly used for flying wing aircraft were researched and four airfoils were
observed to appear most frequently. The airfoil selected to be further investigated were MH 64,
MH 114, SD 7062, and the NACA 4412. These airfoils all have different characteristics that
made them viable options for the design.

17
After selecting these four airfoils, a standard chord of 12 inches or 0.3046 meters was set
so there was enough room for the bottle itself as well as any critical components. All the airfoils
were to be analyzed at 0 degrees angle of attack and 15 m/s for cruise conditions as a minimum
velocity to complete three laps in five minutes. The four airfoils were then analyzed in XFLR5’s
two-dimensional program. The velocity was required for the Reynolds number equation to put
into XFLR5 and was calculated to be 311,150. The Reynolds number equations is as follows [4]:
𝑅𝑒 =
𝜌 ∗ 𝑉 ∗ 𝑐
𝜇
(4)
From XFLR5, the coefficients of lift and moment were obtained for all four of the airfoils.
From here, the span of each airfoil was calculated using the lift equation. As this was the cruise
condition, the lift equaled the weight of the aircraft, which came out to 31.2 Newtons. The
equation used is as follows [4]:
𝐿 = 0.5𝐶𝑙𝜌𝑉2𝑏𝑐 (5)
The results for the span can be seen in the picture below. From here, the Aspect Ratio
(AR) was calculated for each airfoil was used by using the following equation [4]:
𝐴𝑅 =
𝑏2
𝑆
(6)
The results are seen in the image below. Lastly, using the coefficient of lift, the aspect
ratio, and a set Oswald efficiency of 0.8, the induced drag was calculated for each airfoil. The
equation for induced drag is as follows [4]:
𝐶𝑑𝑖 =
𝐶𝑙2
𝜋𝐴𝑅𝑒
(7)
The results of the induced drag are seen in the table below.
Table 3.2-1 Induced Drag Results
Airfoil Cl b AR Cdi Cm, L=0
SD 7062 0.45 1.600 5.249 0.01535 -0.08
MH64 0.15 4.790 1.572 5.69e-4 -0.02
MH114 0.85 0.847 2.779 0.1035 -0.19
NACA 4412 0.50 1..439 4.721 0.2107 -0.11
After calculating all these values, a merit analysis was performed on all four airfoils. The
coefficient of lift was given a point value of 40, the coefficient of moment and aspect ratio both at
25 points, and induced drag coefficient was at 10 points. Each of the airfoils was then ranked 1
through 5 in increments of 0.2, with 1 being the best.

18
Table 3.2-2 Airfoils Initial Ranking
Parameter Weight SD 7062 MH 64 MH114 NACA 4412
Cl 40 0.4 0.2 1 0.6
AR 25 0.6 0 0.6 0.8
Cdi 10 0.8 1 1 0.4
Cm, L=0 25 0.6 0.8 0 0.4
TOTAL: 100 270 190 285 290
The merit analysis revealed that the NACA 4412 was the best, followed by the MH 114,
the SD 7062, and lastly the MH 64. The area of the NACA 4412 was calculated to be 0.438m2.
The last image is an XFLR5 model of the NACA 4412 with winglets to improve yaw stability.
Figure 3.2-1 XFLR5 Initial Model for Production Aircraft
A second approach was pursued in which the analysis was expanded over a variety of
speeds and angles of attack to find the critical wing area needed at the lowest speed and
highest angle of attack. This provided a more accurate wing area required for each leg of the
aircraft's mission.
3.2.2 Second Approach: Weight Estimate
The same weight estimate method was used to try a second approach. This entailed
estimating an empty production aircraft weight to payload weight ratio of 2:1. With a payload
weight of approximately 1 kg the weight estimate for the production aircraft was 3 kg.
3.2.3 Second Approach: Airfoil Analysis
For the airfoil analysis, a wide variety of airfoils were analyzed rather than just the four
airfoils from the first approach, which all had similar aerodynamic characteristics. Using the

19
UIUC airfoil database, five additional low thickness airfoils were found with moment coefficients
close to 0 and low drag coefficients. Based on those characteristics, the following were
analyzed: the S 1223, NACA 4424, MH 45, MH 83 and Lissaman 7769 in addition to the NACA
4412, MH 64, SD 7062 and MH 114 which were previously investigated.
After selecting these airfoils, an XFLR5 analysis was performed at five different
airspeeds, ranging from 5 m/s to 25 m/s. To do so, the Reynolds Number corresponding to each
airspeed was first calculated since XFLR5 cannot analyze airfoils with just airspeed. For each
airfoil, XFLR5 produced graphs of coefficient of lift vs alpha, coefficient of moment vs alpha,
coefficient of drag vs. alpha, coefficient of lift vs. coefficient of drag and lift to drag vs. alpha
graphs. When analyzing the graph data, the focus was on the values that corresponded to a
cruise angle of attack of 0 degrees and a take-off angle of attack of 10 degrees. The take-off
angle of attack used for the analysis was arbitrarily chosen based on the take-off angles of
attack of previous competition teams. The graphs and resulting data for NACA 4412 airfoil can
be seen below. The results from the other airfoils can be seen in Appendix A.
Figure 3.2-2 NACA 4412 Coefficient of Lift vs. Angle of Attach
20
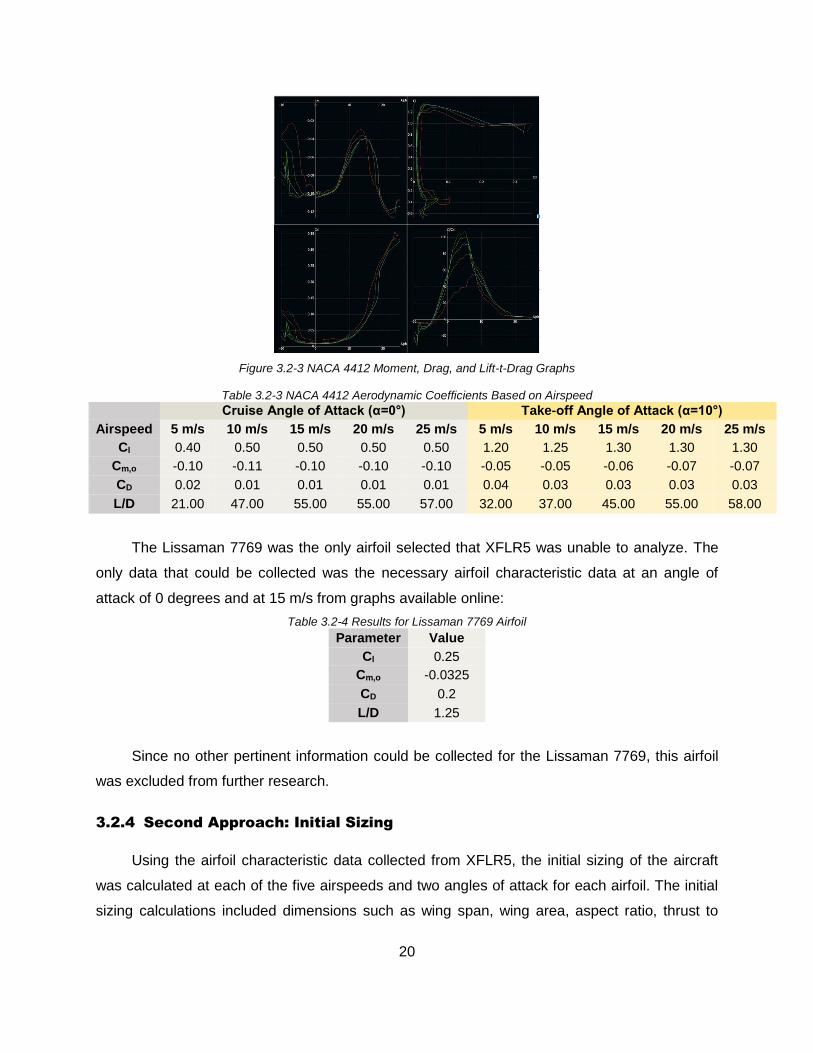
Figure 3.2-3 NACA 4412 Moment, Drag, and Lift-t-Drag Graphs
Table 3.2-3 NACA 4412 Aerodynamic Coefficients Based on Airspeed
Cruise Angle of Attack (α=0°) Take-off Angle of Attack (α=10°)
Airspeed 5 m/s 10 m/s 15 m/s 20 m/s 25 m/s 5 m/s 10 m/s 15 m/s 20 m/s 25 m/s
Cl 0.40 0.50 0.50 0.50 0.50 1.20 1.25 1.30 1.30 1.30
Cm,o -0.10 -0.11 -0.10 -0.10 -0.10 -0.05 -0.05 -0.06 -0.07 -0.07
CD 0.02 0.01 0.01 0.01 0.01 0.04 0.03 0.03 0.03 0.03
L/D 21.00 47.00 55.00 55.00 57.00 32.00 37.00 45.00 55.00 58.00
The Lissaman 7769 was the only airfoil selected that XFLR5 was unable to analyze. The
only data that could be collected was the necessary airfoil characteristic data at an angle of
attack of 0 degrees and at 15 m/s from graphs available online:
Table 3.2-4 Results for Lissaman 7769 Airfoil
Parameter Value
Cl 0.25
Cm,o -0.0325
CD 0.2
L/D 1.25
Since no other pertinent information could be collected for the Lissaman 7769, this airfoil
was excluded from further research.
3.2.4 Second Approach: Initial Sizing
Using the airfoil characteristic data collected from XFLR5, the initial sizing of the aircraft
was calculated at each of the five airspeeds and two angles of attack for each airfoil. The initial
sizing calculations included dimensions such as wing span, wing area, aspect ratio, thrust to

21
weight ratios and wing loading ratios. For these calculations, the chord length was set at 0.3048
m which was based on the length of the Gatorade bottle, the payload to be carried by this
aircraft. The following equations were used in an excel spreadsheet to aid the calculations [4]:
𝑆𝑝𝑎𝑛 𝑏 =
2𝑊
𝜌𝑐𝐶𝑙𝑉2
(8)
𝑆 = 𝑏 ∗ 𝑐 (9)
𝐴𝑠𝑝𝑒𝑐𝑡 𝑅𝑎𝑡𝑖𝑜 𝐴𝑅 =
𝑏
𝑐
(10)
𝑇ℎ𝑟𝑢𝑠𝑡 𝑡𝑜 𝑊𝑒𝑖𝑔ℎ𝑡 𝑅𝑎𝑡𝑖𝑜
𝑇
𝑊=
1
𝐿/𝐷
(11)
𝑊𝑖𝑛𝑔 𝐿𝑜𝑎𝑑𝑖𝑛𝑔
𝑊
𝑆=
𝑊
𝑏 ∗ 𝑐
(12)
In these equations, W was the estimated weight of the loaded production aircraft, 𝜌 was
the air density at sea level and c was the set chord length. The variable Cl was the coefficient of
lift that corresponded with the airspeed, V. The ratio L/D was the lift to drag ratio taken from the
XFLR5 data. The initial sizing calculations were made using the collected airfoil characteristic
data and the above equations. The results for NACA 4412 can be seen in the table below. The
results for all other airfoils are in Appendix B.
Table 3.2-5 NACA 4412 Updated Aerodynamic Coefficients Based on Airspeed
Cruise Angle of Attack (α=0°) Take-off Angle of Attack (α=10°)
Speed 5 m/s 10 m/s 15 m/s 20 m/s 25 m/s 5 m/s 10 m/s 15 m/s 20 m/s 25 m/s
b (m) 16.03 3.21 1.42 0.80 0.51 5.34 1.28 0.55 0.31 0.20
S (m2) 4.88 0.98 0.43 0.24 0.16 1.63 0.39 0.17 0.09 0.06
AR 52.58 10.52 4.67 2.63 1.68 17.53 4.21 1.80 1.01 0.65
T/W 0.05 0.02 0.02 0.02 0.02 0.03 0.03 0.02 0.02 0.02
W/S 6.13 30.63 68.91 122.50 191.41 18.38 76.56 179.16 318.50 497.66
An airfoil could have been selected based on the smallest area at 5 m/s during take-off.
The size of the aircraft, however, seemed inappropriate at the angle of attack of 10 degrees.
Additionally, the take-off angle of attack should vary with the airfoil. Therefore, a third approach
to the aerodynamic analysis was pursued, using more accurate methods.
3.2.5 Third Approach: Changes from the Previous Approach
For the third and final approach, a more accurate weight estimate was used after the
concept was developed using Computer Aided Design. With an estimate of 3.6 kg, not including

22
epoxy, tape, and other components, was rounded up to 4.0 kg for an added 10% safety factor in
the weight calculation. This was a significant increase in weight that was not accounted for in
the previous approach.
3.2.6 Third Approach: Methodology
The following steps were taken to properly analyze and select airfoils for use on the
production aircraft. Each airfoil was analyzed at four different airspeeds (10; 15; 20; and 25 m/s)
along with their corresponding Reynolds Numbers (207,000; 311,000; 415,000; and 519,000).
We removed 5 m/s because of the large required area needed for take-off.
Using the selected airfoils in approach two, we calculated the corresponding lift-curve
slopes for each airfoil. This equation was used as the standard for all baseline lift data. The lift-
curve slope equations can be found in each corresponding graph.
𝐶𝑙 = 𝑚𝛼 + 𝑏 (13)
Where Cl is the coefficient of lift; m is the slope of the lift-curve; α is the angle of attack;
and b is the y-intercept.
Step 1:
We needed to ensure that we would have the largest amount of lift at takeoff conditions so
that the aircraft could takeoff at a low velocity. To do this, we set each takeoff angle of attack
(AoA) at the airfoils critical AoA for 10 m/s. Then, using the lift-curve equation for each airfoil, we
were able to calculate the minimum area needed for takeoff at that specific airfoils AoA and
associated coefficient of lift using the following equation [4]:
𝑆 =
𝐿
0.5𝜌𝑉2𝐶𝑙
(14)
Where L is the required lift, which is equal to the weight of the aircraft.
This approach allowed us to normalize each airfoil about the surface area required for
takeoff. All following calculations would be completed using the calculated surface area at
takeoff.
Step 2:
By rearranging the preceding equation, we were able to calculate the new coefficient of lift
needed for flight at the remaining set airspeeds of 15, 20, and 25 m/s.
𝐶𝑙 =
𝐿
0.5𝜌𝑉2𝑆
(15)

23
Step 3:
Using the lift-curve equation we could calculate the necessary AoA to achieve the
minimum coefficient of lift that is required for flight. [4]
Step 4:
Using the surface area and set chord length of 0.2785 m, we could calculate the span and
aspect ratio of the aircraft. [4]
𝑏 =
𝑆
𝑐
(16)
𝐴𝑅 =
𝑏2
𝑐
(17)
Step 5:
At this point we had the necessary angles of attack for each airfoil, at four different
airspeeds. Using this data and the data generated by XFLR5 (shown in approach two), we
identified the coefficient of drag, coefficient of the moment, and the lift/drag at each airspeed
with the required AoA. [4]
Step 6:
We calculated the total drag on the aircraft, power, thrust to weight ratio, and wing load
ratio using the following equations [4]:
𝐷 = 0.5𝜌𝑉2𝑆𝐶𝐷 (18)
𝑃𝑜𝑤𝑒𝑟 = 𝐷 ∗ 𝑉 (19)
𝑇
𝑊= (
𝐿
𝑊)
−1
(20)
𝑊𝑖𝑛𝑔 𝐿𝑜𝑎𝑑 =
𝑊
𝑆
(21)
3.2.7 Third Approach: Results
From our research of small flying wing style UAV’s, we found that an appropriate wing load
ratio is between 5-10 N/m2. All airfoils except the S 1223 fit this requirement. Therefore, we
eliminated the S 1223 as a potential airfoil. We also eliminated the Lissaman 7769 because of
the drag coefficient, the SD 7062 for the high pitching moment, and the MH 64 for a lower stall
AoA than the MH 45. The remaining four airfoils were analyzed in the power requirements
MATLAB program to see the power needed to complete the missions, the time to takeoff, and

24
the distance to takeoff. This resulted in the MH 45 being selected as the airfoil for the production
aircraft. Tables 3.2-6 and 3.2-7 show the summary of aerodynamic requirements for all airfoils
and the detailed results for NACA 4412. The detailed results for the other airfoils are in
Appendix C.
Table 3.2-6 Summary of Aerodynamic Analysis for Production Aircraft Potential Airfoils
NACA 4412 MH 114 SD 7062 MH 83 MH 64 S1223 MH 45 Lissaman 7769
Max. Lift Coeff 1.2 1.8 1.6 1.8 1 1.6 1.2 1.4
Coeff of Lift at Zero AoA 0.5 0.8 0.4 0.45 0.15 1.2 0.1 0.3
Min. Drag Coeff 0.01 0.01 0.01 0.01 0.01 0.01 0.01 0.02
Max L/D at Cruise Speed 82 135 105 100 80 100 82 70
AoA at Max L/D 5 4 5 8 5 6 5 5
Zero Lift Angle -1 -10 -5 -4 -2 -5 -1 -3
Critical AoA 11 15 12 12 10 11 11 11
Lift Slope 0.08 0.09 0.08 0.09 0.1 0.07 0.092 0.1
Coeff of Moment at Zero AoA -0.01 -0.19 -0.08 -0.065 -0.02 -0.08 -0.01 -0.03
Distance to Takeoff (meters) 22 19 24 17
Time Until Takeoff (sec) 3.2 2.9
3.4
2.8
3.2.8 Control Surfaces Analysis
After researching designs of small UAV flying wings, we discovered that there is no
definitive way to design elevens for a flying wing. Instead, it is a trial and error iteration process
to obtain the required size of the elevon to be able to pitch and roll the aircraft. We used the
report of a Major Qualifying Project team from previous years [5] which was also a flying wing
design to help us design our control surfaces. We calculated the wing surface area and the
control surface area of the 2013 MQP aircraft, and determined the ratio of control surface area
to wing surface area.
To calculate the control surface area required for our aircraft, we implemented the same
ratio from the 2013 aircraft. For the aircraft to obtain a certain pitch rate at takeoff, we used a
control surface chord equal to the quarter chord of the main wing, 0.0762 m. Then used the ratio
of the 2013 aircraft to calculate a span of the control surfaces. [5]

25
Table 3.2-7 Summary of Aerodynamic Results for NACA 4412
NACA 4412
Weight = Lift 40 N 4 kg
Density of air 1.225 kg/m^3
Coeff of lift linearization
Chord 0.3048 m
Cl = mx +b
Area required at low speed 0.60 m^2
Cl = 0.08x +0.5
Frontal Area 0.07 m^2
Velocity (m/s)
Parameter Notation Units 10 15 20 25
Reynolds Number Re
207,000 311,000 415,000 519,000
Coeff of Lift Min Cl
1.20 0.48 0.27 0.17
Angle of Attack AoA degrees 8.75 -0.19 -2.84 -4.07
Span b meters 1.96 1.96 1.96 1.96
Aspect Ratio AR
6.44 6.44 6.44 6.44
Coeff of Drag Cd
0.03 0.01 0.01 0.01
Coeff of Moment Cm
-0.07 -0.10 -0.10 -0.10
Lift/Drag L/D
50.00 60.00 55.00 55.00
Drag D Newtons 0.92 0.83 1.47 2.29
Power P Watts 9.17 12.38 29.33 57.29
Thrust/Weight Ratio T/W
0.02 0.02 0.02 0.02
Wing Loading Factor W/S N/m^2 6.68 6.68 6.68 6.68
3.3 AERODYNAMIC ANALYSIS FOR MANUFACTURING SUPPORT
AIRCRAFT
For the Manufacturing Support aircraft, we were able to use the same process as the final
approach of the Production aircraft. We again were able to get a final weight estimate of 7.5kg.
This is to account for the weight of the Production aircraft as cargo. The airfoils selected ranged
in thicknesses between 12 and 18 percent and increased camber than the production aircraft to
provide more lift. The moment caused by the camber will be corrected by a vertical and
horizontal tail. The following tables shows a summary of results for all airfoils analyzed.

26
Table 3.3-1 Summary of Results for Manufacturing Support Aircraft Potential Airfoils
NACA4412 MH 114 MH 104 NACA2414 S8036 NACA 4418
Max. Lift Coeff 1.5 1.8 1.2 1.25 1.25 1.5
Coeff of Lift at Zero AoA 0.5 0.9 0.1 0.25 0.2 0.5
Min. Drag Coeff 0.08 0.01 0.01 0.01 0.01 0.01
Max L/D at Cruise Speed 110 107
100 110
AoA at Max L/D 6 7.5 5 7 8
Zero Lift Angle -4.5 -9 -1 -2.5 -2 -4.5
Critical AoA 15 14 12 15 16 11
Lift Slope 0.08 0.09 0.11 0.077 0.059 0.09
Coeff of Moment at Zero AoA -0.01 -0.19 0.025 -0.049 -0.028 -0.095
Min. Surface Area for Takeoff (m^2) 0.58 0.41 0.58 0.56 0.56 0.56
Takeoff Distance 16 16
Table 3.3-2 shows the results for NACA 4418. Tables for other airfoils are in Appendix D.
Table 3.3-2 Summary of Aerodynamic Results for NACA 4418
NACA 4418
Weight = Lift 75 N 7.5 kg
Density of air 1.225 kg/m^3
Coeff of lift linearization
Chord 0.4826 m
Cl = mx +b
Area required at low speed 1.08 m^2
Cl = 0.09x +0.5
Frontal Area 0.10 m^2
Velocity (m/s)
Parameter Notation Units 10 15 20 25
Reynolds Number Re
207,000 311,000 415,000 519,000
Coeff of Lift Cl
1.25 0.51 0.28 0.18
Angle of Attack AoA degrees 8.33 0.06 -2.40 -3.54
Span b meters 2.23 2.23 2.23 2.23
Aspect Ratio AR
4.63 4.63 4.63 4.63
Coeff of Drag Cd
0.02 0.01 0.01 0.01
Coeff of Moment Cm
-0.08 -0.09 -0.09 -0.09
Lift/Drag L/D
62.50 50.51 28.41 22.73
Drag D Newtons 1.32 1.49 2.64 3.30
Power P Watts 13.20 22.28 52.80 82.50
Thrust/Weight Ratio T/W
0.02 0.02 0.04 0.04
Wing Loading Factor W/S N/m^2 6.96 6.96 6.96 6.96

27
3.4 STABILITY ANALYSES
Flying wing aircraft are renowned for their high lift-to-drag ratios as the whole aircraft acts
as a lifting body. It was critical that the Production Aircraft was pitch stable as there would be no
tail to counteract any moments. This problem was easily resolved on the Manufacturing
Support Aircraft as it had a vertical and horizontal stabilizer.
As seen in the graphs below, the MH 45 had the lowest lift of the airfoils chosen; however,
the drag and moment coefficients for the MH 45 were also the lowest. As described in the
sensitivity analysis, weight would play the biggest role in our score. The battery was the
heaviest component of the aircraft, so minimizing the weight of the battery reduced the weight of
the overall aircraft. Trade studies showed that reducing the weight of the battery would play a
more significant role than reducing the weight of the wing. It was also discovered that the lower
the moment about the quarter chord, the easier it would be to achieve pitch stability without a
horizontal stabilizer. Therefore, we chose the MH 45 as the airfoil for the Production Aircraft.
Figure 3.4-1 Production Aircraft Airfoil Profiles

28
Figure 3.4-2 Production Aircraft Aerodynamic Graphs
Similar to the MH 45, the NACA 4418 did not produce the most lift of the chosen airfoils,
but did have low drag features to reduce the required power of the motor. Despite the large
pitching moment of the NACA 4418, it was chosen because of the high thickness (needed to
nest the Production Aircraft inside), high lift, and low drag. The pitching moment would be
corrected using a horizontal stabilizer.
Figure 3.4-3 Manufacturing Support Aircraft Airfoil Profiles
29
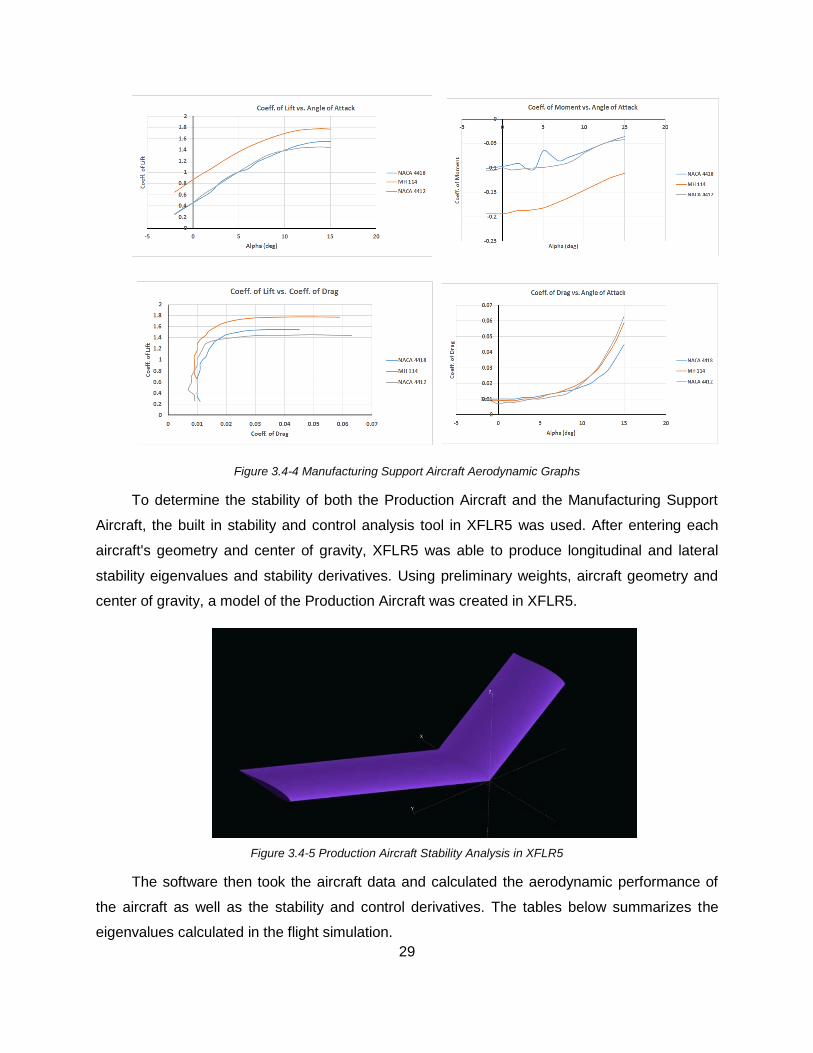
Figure 3.4-4 Manufacturing Support Aircraft Aerodynamic Graphs
To determine the stability of both the Production Aircraft and the Manufacturing Support
Aircraft, the built in stability and control analysis tool in XFLR5 was used. After entering each
aircraft's geometry and center of gravity, XFLR5 was able to produce longitudinal and lateral
stability eigenvalues and stability derivatives. Using preliminary weights, aircraft geometry and
center of gravity, a model of the Production Aircraft was created in XFLR5.
Figure 3.4-5 Production Aircraft Stability Analysis in XFLR5
The software then took the aircraft data and calculated the aerodynamic performance of
the aircraft as well as the stability and control derivatives. The tables below summarizes the
eigenvalues calculated in the flight simulation.

30
Table 3.4-1 Production Aircraft Initial Stability Results
Longitudinal Lateral
Phugoid Short Period Spiral Mode Dutch Roll Roll
-0.000 +/- 0.125i -96.680 +/- 137.700i -0.0002 + 0.000i -0.017 +/- 4.239i -36.875 + 0.000i
As indicated by the corresponding negative eigenvalues, the Production Aircraft was
stable in all five modes. The same process was used to analyze the Manufacturing Support
Aircraft’s stability and control. After entering preliminary weights, aircraft geometry, and center
of gravity, a model of the Manufacturing Support Aircraft was created in XFLR5.
Figure 3.4-6 Manufacturing Support Aircraft Stability Analysis in XFLR5
Likewise, the negative values prove that the Manufacturing Support Aircraft was also
stable in all five modes. This was only possible with a horizontal tail deflection angle of -4
degrees at the trim condition. Therefore, the aircraft would have to maintain tail deflection during
the course of the flight.
3.5 WING TUNNEL TESTING
To test the 3 dimensional lift characteristics, two wing test sections were constructed and
placed in the 2ft x 2ft test section of a wind tunnel. The lift force was calculated at -5, 0, 3, 6, 9,
12, and 15° angle of attack at 10, 15 20, and 25 m/s airspeed.

31
Production Aircraft
The measured lift and the theoretical lift were plotted on the same graph. It was evident
that the actual lift produced was not going to be enough to keep the aircraft in flight, therefore a
10% increase was added to the wing area on the production aircraft.
Figure 3.5-1 Theoretical/Actual Lift for Production Aircraft
32
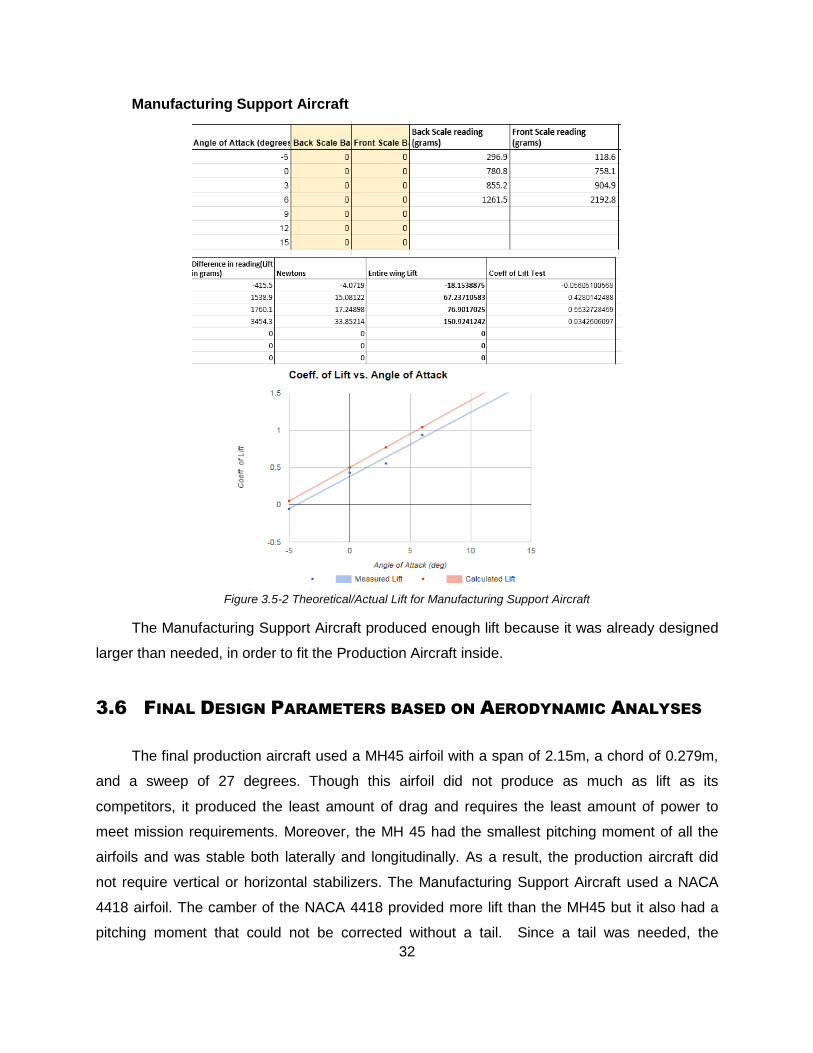
Manufacturing Support Aircraft
Figure 3.5-2 Theoretical/Actual Lift for Manufacturing Support Aircraft
The Manufacturing Support Aircraft produced enough lift because it was already designed
larger than needed, in order to fit the Production Aircraft inside.
3.6 FINAL DESIGN PARAMETERS BASED ON AERODYNAMIC ANALYSES
The final production aircraft used a MH45 airfoil with a span of 2.15m, a chord of 0.279m,
and a sweep of 27 degrees. Though this airfoil did not produce as much as lift as its
competitors, it produced the least amount of drag and requires the least amount of power to
meet mission requirements. Moreover, the MH 45 had the smallest pitching moment of all the
airfoils and was stable both laterally and longitudinally. As a result, the production aircraft did
not require vertical or horizontal stabilizers. The Manufacturing Support Aircraft used a NACA
4418 airfoil. The camber of the NACA 4418 provided more lift than the MH45 but it also had a
pitching moment that could not be corrected without a tail. Since a tail was needed, the

33
horizontal stabilizer had elevators and the vertical stabilizer had a rudder for pitch and yaw
control. These stabilizers were both NACA 0009. The NACA 4418 airfoil was thick enough to
contain the MH45 airfoil within itself while also providing structural support. The summary of all
design results can be seen in the tables below:
Table 3.6-1 Final Design Parameter for Both Aircraft
PA Main Wing:
Airfoil Chosen MH45
Span 2.150 m
Chord Length 0.279 m
Surface Area 0.600 m^2
Aspect Ratio 7.720
Sweep Angle 27.00 deg
Taper Ratio 1.000
Mean Aero Chord 0.279 m
Control Surfaces:
Elevon Length 0.373 m
Elevon Width 0.064 m
Aerodynamic
Characteristics:
Coeff of Lift 0.191
Coeff of Lift Max 1.11
Coeff of Drag 0.008
Coeff of Moment 0.033
Critical AoA 15
M/S Main Wing:
Airfoil Chosen NACA 4418
Span 2.150 m
Chord Length 0.483 m
Surface Area 0.980 m^2
Aspect Ratio 4.210
Sweep Angle 27.000 deg
Taper Ratio 1.000
Mean Aero Chord 0.483 m
Total A/C Weight 4.750 kg
X-CG 0.611 m
Z-CG 0.006 m
Horizontal Tail:
Airfoil Chosen NACA 0009
Span 0.535 m
Chord Length 0.300 m
Surface Area 0.161 m^2
Aspect Ratio 1.783
Sweep Angle 0.000
Taper Ratio 1.000
Mean Aero Chord 0.300
Vertical Tail
Airfoil Chosen NACA
0009
Span 0.309 m
Chord Length
Root 0.309 m
Chord Length
Tip 0.150 m
Surface Area 0.070 m^2
Aspect Ratio 2.640
Sweep Angle 0.000 deg
Taper Ratio 2.060
Mean Aero
Chord 0.240 m
Control Surfaces: Elevators 0.1122 m
Rudder 0.103 m
Aileron Length 0.535 m
Aileron Width 0.1143 m
Aero
Characteristics:
Coeff of Lift 0.369
Coeff of Lift Max 1.22
Coeff of Drag 0.02
Coeff of Moment 0.18
Critical AoA 15

34
3.7 PROPULSION ANALYSIS
There are three major components within the propulsion subsystem in both aircraft: the
motor, propeller, and battery. The motor and propeller were selected together as most motor
specification sheets recommend a propeller for the most effective and efficient use. Once the
motor and propeller were selected, the battery pack configuration could be determined from
motor and mission requirements.
3.7.1 Motor and Propeller
The first step of the design process for the propulsion system was to select the appropriate
motors. The motor had to be capable of taking off in the allotted runway size and generating
enough thrust in order to complete the mission requirements in the allotted time. From dynamic
thrust calculations and preliminary design parameters, we decided to first select an AXI Gold
2820/12 Outrunner Motor with specifications that can be seen in the table below:
Table 3.7-1Motor and Propeller Specifications
AXI Gold 2820/12 Outrunner Motor
Motor Diameter 35 mm
Shaft Diameter 5 mm
KV 990 Kv
Voltage Range 9.6 – 18.5 V
Max Current 37 Amps
Weight 5.3 oz.
Based on the motor specification sheet, an 11x7 propeller was recommended for use with
the motor to achieve the best efficiency.
3.7.2 Battery
From our analysis shown in section 2.6, NiMH batteries were decided to be used for both
aircraft. With the motor was selected we were able to choose a battery back that met the
mission requirements. A 10 cell, 12V, 3300mAh battery pack was decided for use. This would
meet the voltage output required by the motor and the capacity to run the motor for the duration
of each mission.

35
3.8 STRUCTURAL ANALYSIS
In an effort to use less total material, components that would be able to support high
bending moments and fracture toughness for the wing tip test were analyzed. The loads of the
aircraft were divided into three categories:
● Aerodynamic loads: This included all the wing and control surfaces that created lift, drag and
moment that would translate to the main SUPPORT of the structure. Balsa is a good material
since is lightweight and able to support sizeable loads applied in a perpendicular direction to
its grain.
● Propulsion loads: This included propulsive torque, thrust and continuous vibrations that
would transfer to the fuselage structure. A firm material was needed to absorb the motor
vibrations and to properly secure all fasteners.
● Ground loads: This included aircraft weight and landing impact. The truss consists of metal
components since it must have a high flexural strength that can withstand impact without
breaking.
Since all the loads acting on the aircraft need to be transferred to the major load bearing
components, all impact parts were designed to connect to the central spar or the wing spar. To
maximize the strength against bending moments at the fuselage, the wing spars were
connected as close as possible and secured with aluminum fittings and pins, thus allowing the
loads to be transferred along the fuselage truss.

36
4. Detailed Design Models
After the optimization process, and mission profile analysis, a prototype of the Production
Aircraft was constructed. The prototype was designed to test the flying characteristics of the
fully loaded Production Aircraft and validate the aircraft design. After the design for the
Production Aircraft was completed, a detailed design of the Manufacturing Support Aircraft was
created to conform to the size and shape of the Production Aircraft so it could be efficiently
transported inside the Manufacturing Support Aircraft. After these designs were successfully
created using Computer Aided Design software, they were built and tested to validate that the
designs accomplished each mission profile.
4.1 SUMMARY OF FINAL SPECIFICATIONS
The preliminary aircraft dimensions selected by the Aerodynamics team changed
minimally after the structural, layout, material and weight-balance analyses were done. Having
the final dimensions listed in the following tables, the wing design was carefully designed to
allow adequate thickness for manufacturability. The Production Aircraft and Manufacturing
Support Aircraft were designed for structural efficiency, simplicity and flight stability.
Table 4.1-1 Summary of Final Specifications
Production Aircraft Main Wing
Value Units
Airfoil Chosen MH 45
Span 2.150 m
Chord Length 0.279 m
Surface Area 0.600 m^2
Aspect Ratio 7.720
Sweep Angle 27.000 deg
Taper Ratio 1.000
Mean Aero Chord 0.279 m
Propulsion Systems
Production Value Units
Motor Type Axi 2820/12
Weight 0.15 kg
Kv 990 rpm/V
Power 300 W
Max RPM 11,880
Propeller 11x7 in

37
Electrical System – Production Aircraft Unit
Speed Controller Eflite 40A Brushless ESC
Radio Receiver Airtonics 92224
Number of Servos 3
Servo Type HS-225BB
Manufacturing Support Main Wing
Value Units
Airfoil Chosen NACA 4418
Span 2.150 m
Chord Length 0.483 m
Surface Area 0.980 m^2
Aspect Ratio 4.210
Sweep Angle 27.000 deg
Taper Ratio 1.000
Mean Aero Chord 0.483 m
Manufacturing Support Horizontal
Tail Value Units
Airfoil Chosen NACA 0009
Span 0.535 m
Chord Length 0.300 m
Surface Area 0.161 m^2
Aspect Ratio 1.783
Sweep Angle 0.000
Taper Ratio 1.000
Mean Aero Chord 0.300
Vertical Tail Value Units
Airfoil Chosen NACA 0009
Span 0.309 m
Chord Length Root 0.309 m
Chord Length Tip 0.150 m
Surface Area 0.070 m^2
Aspect Ratio 2.640
Sweep Angle 0.000 deg
Taper Ratio 2.060
Mean Aerod Chord 0.240 m
Propulsion Systems Manufacturing Support Value Units
Motor Type Axi 4120/14
Weight 0.32 kg
Kv 660 rpm/V
Power 672 W
Max RPM 14,400
Propeller 13x11 in
Electrical Systems Manufacturing Support
Speed Controller Turnigy AE-65A
Radio Receiver Airtronics 92164
Number of Servos 3
Servo Type HS-225BB
Batteries Manufacturing Support Value Units
Type NiMH
Capacity (each) 2,200 mAh
Range 5 min
Weight (each) 0.34 kg
Number of Batteries 2

38
4.2 WEIGHT BALANCE
Weight and balance tables were created for both aircraft to calculate the fore/aft position of
the Center of Gravity (CG) and help to determine the stability of the aircraft. The tables feature
the weight, arm, and moment for all the major components of the aircraft whose locations can
be changed, as well as the weight, arm and moment for aircraft’s structure itself to compute the
aircraft’s CG location. The arm length of each component was measured from a datum located
at the tip of the central carbon spar running down the middle of both aircraft. The moment of
each component is equal to the weight of the component multiplied by the arm, and the sum of
the weight, arm, and moment for each component is shown at the bottom of each table. The CG
position aft of the datum line was calculated by dividing the total moment by the total weight of
all the components in each in table.
The battery and the Gatorade bottle were the heaviest components in the production
aircraft, and both were placed near the center of the root chord to keep the CG closer to the
nose for stability purposes and ensure that the aircraft’s CG was within the footprint of the
tricycle landing gear.
The weight and balance of the Manufacturing Support Aircraft needed to be evaluated
for flight with and without the Production Aircraft loaded since the Production Aircraft was not
placed directly at the CG during transportation. Since the Manufacturing Support Aircraft used a
taildragger landing gear configuration, the CG has a large range longitudinally to prevent a
landing gear tip-over, but it had to be ensured that the aircraft did not become unstable with or
without the Production Aircraft loaded. For this reason, the Production Aircraft’s location for
transportation was kept as close to the CG as possible to limit the change in flight
characteristics between missions, and the battery location for the Manufacturing Support Aircraft
would be slightly different for each mission in an effort to keep the CG at a constant location.

39
Figure 4.2-1 Weight Balance
4.3 FUSELAGE - PRODUCTION AIRCRAFT
The entire Production Aircraft design wa based on the integration of optimized
subsystems into a lightweight assembly. The following subassemblies were analyzed with
greater detail: fuselage, payload arrangement, wings, propulsion system, and landing gear.
To obtain an aircraft that wa as lightweight and simple as possible, yet still strong enough
to sustain all aerodynamic forces, a central Carbon Fiber tube was initially considered as the
main structural component. The wings were attached to it through two aluminum fittings, while
the landing gear and payload arrangement were designed to have slots and could slide forward
and backward on the central spar until a desired Central of Gravity (CG) was obtained.

40
Figure 4.3-1 Production Aircraft Initital Fuselage Design
The aluminum fittings were designed to allow both front spars of the wing and the aft spars
to be connected as close as possible in the center of the aircraft, thus ensuring the fundamental
structural capability. A shorter tube was placed inside the wing spars in the fittings area to add
extra strength. The spars were secured to the fittings through pins.
Figure 4.3-2 - Section View of Aluminum Fitting Showing Wing Spar and Reinforcing Tubes
Upon further propulsion analysis, using two separate batteries placed inside the wings was
not possible. Rather, a single larger and heavier battery had to be used. The placement of this
battery was not favorable with the current configuration. Therefore, a new setup with two central
carbon fiber spars was chosen, so the battery could be places between them. This updated
model can be seen in the following figure:

41
Figure 4.3-3 Updated Structure of Production Aircraft Fuselage
To give the fuselage an aerodynamic shape, two foam fairings were used to enclose the
front side of the aircraft, one at the top and one at the bottom.
Figure 4.3-4 Foam Fairing Fuselage an Aerodynamic Shape
4.4 FUSELAGE – MANUFACTURING SUPPORT AIRCRAFT
Similarly the Manufacturing Support Aircraft used a Carbon fiber spar as the main
structural component. The wings were attached to the central spar with two aluminum fittings
like in the Production Aircraft to keep the manufacturing process consistent and to reduce the

42
building time. The landing gear was designed to move forward and backward on the central
spar until a desired Central of Gravity (CG) is obtained.
Figure 4.4-1 Fuselage Strength Given by Central Carbon Fiber Spar
In order to secure the tail, the central carbon fiber was extended all the wail to the tail. Two
aluminum fittings were used to attach the horizontal tail wing, and a wooden block was used to
attach the vertical stabilizer and the tail wheel bracket.
Figure 4.4-2 Tail Fittings Connected to Central Carbon Fiber Spar
The aluminum fittings for the Manufacturing Support aircraft were designed in the same
manner as those for the Production Aircraft. Additionally, a shorter tube was be placed inside
the wing spar similar to the method used in the Production Aircraft as shown in Figure 4-2.3

43
To give the fuselage an aerodynamic shape and enclose the Production aircraft and other
components, two foam fairings were used, one at the top of the fuselage and one at the bottom.
Figure 4.4-3 Foam Fairing for Manufacturing Support Aircraft
4.5 PAYLOAD ARRANGEMENT
For the Production Aircraft, a thin 3D printed cylindrical case reinforced with Carbon Fiber
roving was used to hold the Gatorade bottle. A conical lid was designed to secure the bottle in
place and give the fuselage an aerodynamic shape in the rear, where the foam covers ended.
Initially this case connected to the central spar and was restricted from rotation and translation
using pins. The case was initially a support for the receiver as well.
Figure 4.5-1 Section View and Entire View of 3D Printed Payload Case
After modifying the fuselage to contain two central spars and after testing the strength of
the 3D printed case support hooks, two aluminum hoops were chosen to attach the case
instead. These hoops were clamped to the two spars and were glued to the case. The updated
model can be seen in the following figure:

44
Figure 4.5-2 Updated Attachment of the 3D Printed Case
The top of each wing of the Manufacturing Support aircraft hinged upwards to nest the
production aircraft inside. The foam fairing was designed to fully enclose the Production Aircraft.
Figure 4.5-3 Manufacturing Support Aircraft with Wing Lids Open
4.6 WINGS
The wings were designed to be as light as possible yet strong enough to resist to all
aerodynamic forces in flight. Each wing consisted of an arrangement of laminated balsa ribs
connected through two carbon fiber spars, with a balsa sheet placed at the leading edge along
the length of the wing to maintain the airfoil shape and provide torsional strength. A heat-shrink
MonoKote film was applied around the wings to give them a smooth surface. The wings were
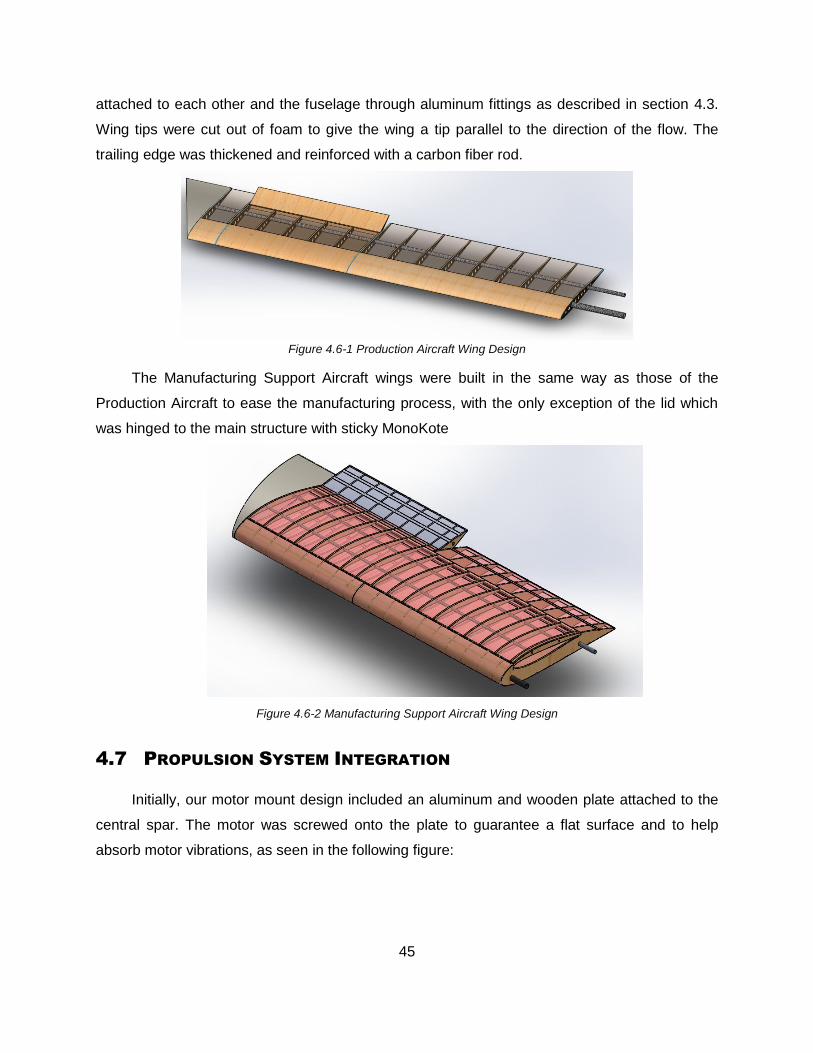
45
attached to each other and the fuselage through aluminum fittings as described in section 4.3.
Wing tips were cut out of foam to give the wing a tip parallel to the direction of the flow. The
trailing edge was thickened and reinforced with a carbon fiber rod.
Figure 4.6-1 Production Aircraft Wing Design
The Manufacturing Support Aircraft wings were built in the same way as those of the
Production Aircraft to ease the manufacturing process, with the only exception of the lid which
was hinged to the main structure with sticky MonoKote
Figure 4.6-2 Manufacturing Support Aircraft Wing Design
4.7 PROPULSION SYSTEM INTEGRATION
Initially, our motor mount design included an aluminum and wooden plate attached to the
central spar. The motor was screwed onto the plate to guarantee a flat surface and to help
absorb motor vibrations, as seen in the following figure:

46
Figure 4.7-1 Initial Motor Mount for Production Aircraft
After our design was updated, a new aluminum motor plate was created. This new mount
was attached and pinned to both central spars; it included a support for the nose wheel, as well
as holes to mount the servo through L-brackets. The following figure shows this setup:
Figure 4.7-2 Final Motor Mount for Production Aircraft
The propulsion system components were originally selected using the analysis from the
MATLAB program mentioned previously in sections 3 and 4. Following the wind tunnel test of
the propulsion systems described in section 8, we confirmed that the original selected
propulsion components had the proper characteristics for our Production flight mission. Though

47
it was found that the required battery capacity for the Production Aircraft decreased from
4200mAh to 2800mAh, this difference did not cause a need for modifications in our propulsion
components. Therefore the AXI 2820/12 motor and 11X7” propeller selections remained
unchanged. Based on the test data seen in section 8, we subsequently selected the propulsion
components for the Manufacturing Support. The motor selected for the Manufacturing Support
was an AXI Gold 4120/14 Outrunner with a 13X11” propeller with 4400mAh battery capacity.
The propulsion and electrical system for both the production and Manufacturing aircraft
shown below, had an identical setup with the exception of a 40A electronic speed controller
(ESC) for the Production Aircraft and a 65A ESC for the Manufacturing Support Aircraft. The
separate amperage requirement was due to more power being needed for the Manufacturing
Support Aircraft than for the Production Aircraft. The batteries were connected in parallel to
increase the battery capacity for the missions. Also, there were three servos for both aircraft all
having the same functionality, except the landing gear servo was also attached to the tail rudder
in the Manufacturing Support Aircraft.
Figure 4.7-3 Production Aircraft Propulsion System Wiring Diagram
A combination of two batteries was used to power the motor in the Production Aircraft.
The two batteries were attached to the wing spars with thin, aluminum fittings.

48
Figure 4.7-4 Manufacturing Support Aircraft Propulsion System Wiring Diagram
4.8 LANDING GEAR
The landing gear of the Production Aircraft was determined in the preliminary concept
phase as composed of two wheels in the back and a steerable nose wheel. Since this aircraft
was mounted upside down inside the Manufacturing Support Aircraft, the goal was to place the
wheels as close to the fuselage as possible. The initial design included the back wheels
mounted on an aluminum hoop designed to transfer shock away from the bottle casing to the
central spar, as seen in the following figure:
Figure 4.8-1 Initial Design of Production Aircraft Landing Gear

49
After changing the design of the fuselage to contain two tubes and two aluminum hoops,
the landing gear design was simplified and mounted on the aft hoop as follows:
Figure 4.8-2 Final Design of Production Aircraft Landing Gear
The nose wheel was attached directly to the motor mount plate, which was another
aluminum component. The servo that actuated the nose wheel was connected to the motor
mount using two L-brackets. The following figure shows this layout:
Figure 4.8-3 Nose Wheel and Servo Arrangement
Since a conventional layout was chosen for the Manufacturing Support Aircraft, a
reversible tricycle landing gear layout was deemed most favorable. Therefore the front wheels

50
were designed to connect to the central spar and be able to move to a correct position
according to the final CG. The rear wheel would be able to be steerable by connecting it to the
rudder this would minimize the amount of servos on the tail.
Figure 6.21 - Manufacturing Support Landing Gear
4.9 EXPECTED PERFORMANCE
Flight simulations conducted in MATLAB gave the following results:
Mission 1
Takeoff distance: 63 ft
Time to complete 3 laps: 207.4 seconds
Mission 2
Takeoff distance: 83 ft
Time to complete 3 laps: 220.4 seconds
Mission 3
Takeoff distance: 57 ft
Time to complete 3 laps: 173 seconds
4.10 RATED AIRCRAFT COST
Using pounds as the unit of weight, our aircraft’s rated aircraft cost is as follows:
Table 4.10-1 Rated Aircraft Cost
Production Aircraft Weight 3.33lb
Production Aircraft Battery Weight .661 lb
Ncomponents of the Production Aircraft 1
MS Aircraft Weight 10.472lb
MS Aircraft Battery Weight 1.5lb
Rated Aircraft Cost 17.909

51
5. Manufacturing
5.1 MATERIALS SELECTED FOR MAJOR COMPONENTS
The manufacturing process selection was a significant factor in optimizing overall aircraft
weight and total flight score. The selection of materials was determined based on research into
materials used on previous winning aircraft. After extensive research the following materials
were chosen for use in both of the aircraft: wood, composites, foam, and various plastics. These
materials were used to create the major components of the aircraft, the fuselage, wings, tail and
casing for our payload.
Laminated balsa plywood was selected for use in the ribs of both aircraft. This was due to
balsa being a very light weight material which would result in a lightweight structure. As balsa
sheets were not a strong material as they did not have a good strength to weight ratio, they
were reinforced with plywood to ensure the material could withstand the weight of the aircraft.
The laminated balsa plywood sheets were used to create the ribs of both the Production and
Manufacturing Support Aircraft, and the tail of the Production Aircraft, with the use of a Laser-
Cutting machine.
Figure 7.1 - Balsa Wood Ribs and Balsa Wood Leading Edge Wrap
Composites were chosen due to their high strength to low weight ratios. Carbon fiber was
the backbone of lightweight composites and their tubes were made of carbon fiber, fiberglass
and kevlar based composites. As a result, carbon fiber tubes were selected for the spars of the
aircraft. The spars of an aircraft must hold the structure firmly together while avoiding cracks

52
and breaks in the ribs due to the load. Carbon fiber in the form of a unidirectional cloth was also
used in to reinforce the casing for the Production payload.
Figure 7.2 - Carbon Fiber Wing Spars
Plastics are known for their low density and low electrical and thermal conductivity.
Plastics are typically easier to manufacture and relatively less expensive than other materials.
Both aircraft used MonoKote shrink wrap for the outer covering. MonoKote shrink wrap was
lightweight, easy to use and very durable which made it a top choice for use in this competition.
Plastics are also known to have a high strength to weight ratio when reinforced. As a result, a
3D printed case reinforced with carbon roving was used to carry the payload.
Figure 7.3 - Applying MonoKote Shrink Wrap (left); 3D Printed Bottle Case (right)
Foam is a popular material used when building RC aircraft as it is very inexpensive and its
models can be made quickly and easily with the use of hot wire foam cutters. Foam structures
are typically lightweight, durable and very flexible. For these reasons, the wingtips, control
surfaces, and fuselage fairings of both aircraft were made out of foam.

53
Figure 7.4 - Foam Wingtips abd Control Surfaces on Production Aicraft and Manufacturing Support Aicraft Wings
The detailed usage of these materials in constructing and testing our aircraft was as
follows:
Table 5.1-1 Detailed Material Usage Description
Material Component Usage
Production Aircraft
Balsa Plywood Sheets Wings Ribs
Carbon Fiber Tubes Wings Spars
Carbon Fiber Roving Fuselage Bottle Casing
MonoKote Shrink Wrap Wings Outer Covering
3D Printed material Fuselage Bottle Casing
Foam Fuselage Top Cover of Aircraft
Manufacturing Support Aircraft
Balsa Plywood Sheets Wings Ribs
Carbon Fiber Tubes Wings Spars
Carbon Fiber Roving Fuselage Bottle Casing
MonoKote Shrink Wrap Wings Outer Covering
Foam Fuselage Top Cover of Aircraft

54
5.2 MANUFACTURING PROCESSES
Although the aircraft was sized to be as light as possible, multiple manufacturing methods
were explored in order find those that would conserve weight. The manufacturing plan for both
the Production and Manufacturing Support Aircraft focused on the construction of three main
components: fuselage, wings and landing gear.
Fuselage
The fuselage of the Production Aircraft was designed to hold the payload yet be as light as
possible. The following three methods were investigated for the manufacturing of the fuselage:
● 3D Print – A payload case was manufactured via 3D printing. This case was able to hold
the payload securely and featured a cone-shaped twist-off lid at the back end.
● Carbon Fiber Roving – carbon fiber roving was utilized in order to reinforce the 3D
printed case. This was produced by wrapping the roving around the case until the
structure was more durable.
● MonoKote – The fuselage’s structure was wrapped with MonoKote shrink-wrap to serve
as the aircraft’s outer layer of skin.
The Manufacturing Support’s fuselage was manufactured such that it was be able to carry
the Production Aircraft’s fuselage within it. This fuselage was manufactured using a foam casing
large enough to withhold its payload and the Production Aircraft’s landing gear.
Wings
Each wing consisted of a front and rear carbon fiber tube to serve as spars. Flexible balsa
wood sheets were wrapped around the front of the wing ribs to form a leading edge while the
trailing edge was created by a thin carbon fiber rod running along the rear end of each rib. The
wing was built using a fixture created to ensure precision in rib spacing and movement. Each rib
was laminated using three sheets of balsa wood in a zero-ninety-zero orientation and then cut
using a laser cutter to create the desired airfoil shape. After the assembly of the wings was
finished, plywood blocks were placed along the inner surface of the leading edge as a way to
reinforce the structure along the leading edge of the wing. MonoKote was then applied to the
wings to provide a smooth aerodynamic surface. The front and rear wing spars extended into
the fuselage in order to promote structural efficiency.

55
One standout feature in the wings of the Manufacturing Support Aircraft was that they had
to hold the Production Aircraft’s wing internally. To account for this, the ribs were designed to
with a cutout in the shape of the MH 45 airfoil so that the smaller wing could be nested into the
larger wing. Additionally, a lid was created to fully enclose the nested Production Aircraft.
Figure 7.5 - Production Aircraft Wing Construction with Balsa Leading Edge Wrap and Laminated Balsa Plywood Ribs
Landing Gear
Different landing gear methods were used based on design specifications. On the
Production Aircraft, the team manufactured the landing gear as close to the fuselage as
possible to be able to be able to inversely mount the aircraft into the Manufacturing Support
Aircraft. This process entailed a steerable nose wheel assembly and utilized a CNC milled
aluminum plate to serve as mount for the main gear. The back wheels where mounted on a rod
that was shaped and fixed around the aluminum hoop. This design allowed for the distribution of
the landing impact around the plastic component and to the central spars, creating the
necessary rigidity and strength for each gear.

56
Figure 7.6 - Production Aircraft with Landing Gear Mounted Inversely in the Manufacturing Support Aircraft
5.3 MANUFACTURING MILESTONES CHART
Figure 7.7 - Manufacturing Milestones Chart

57
6. Testing
The aircraft was tested in numerous different ways to analyze the difference between
estimated and actual aircraft outputs. To begin testing the aircraft, individual components were
tested to ensure that when assembled as a whole the airplanes would be able to sustain flight.
Test sections of the wings of both aircraft were first created to ensure the airfoil selected met the
design requirements; then, analysis was conducted to select the carbon fiber spar sizes which
could sustain the load and maintain structural stability, and lastly the propellers and motors were
tested to confirm that the propulsion system could provide the power needed for take-off. The
results of these tests indicated the adjustments to be made to the designs before the
manufacturing phase.
6.1 STRUCTURAL TESTING
To test the integrity of each structure, the yield strength of the carbon fiber spars was
compared to the bending stress that resulted from the wings supporting the weight of the
aircraft. To perform this comparison, the bending stress on the spars was calculated using the
following formula for bending stress on a hollow tube. [6]
𝜎 =
𝑊𝐿2
2𝑍
(22)
In this equation, W equals the distributive load, L equals the length of the tube, and Z
equals the section modulus, which was calculated using the formula below. [6]
(23)
These calculations revealed the bending stresses that wing spars were likely to
experience in flight. After calculating the bending stresses for level flight and different load
factors, and comparing these values to the yield strength of the spar material, it was determined
that the material and diameter tubing that was chosen for the spars was sufficient to withstand
the forces of flight that are expected for our aircraft.

58
6.2 WIND TUNNEL TESTING
To gain a more accurate understanding of the aerodynamics characteristics of the three
dimensional wing, wing test sections were created and tested in a laminar flow wind tunnel.
Each test section was 48 cm in length, contained between 8- 9 ribs, had two wooden dowels
with diameter 2.095 cm, one inserted at the quarter chord and the other dowel inserted as close
to the trailing edge as possible while still leaving enough room for the installation of control
surfaces. Each test section was tested in a 60cm x 60cm wind tunnel to calculate the 3D lift on
each wing. During this test, the theoretical lift versus angle of attack plot was attempted. The
highest airspeed possible in the wind tunnel was approximately 146.65 ft/s; however, these
tests were only conducted at a maximum of 25 m/s, which was the maximum cruise of both
aircraft. By changing the airspeed and angle of attack, an experimental lift for the 3D wing was
determined during multiple phases of flight. These results are discussed in Section 3.5.
Figure 6.2-1 Wind Tunnel Testing of Wing Test Sections
The tests showed that the experimental lift curve slope for both aircraft was below the 2D
calculated values, as seen in figures 3.5-1 and 3.5-2 in Section 3.5. However, this effect was
taken into consideration when sizing both aircraft. A safety factor of 1.1 was added to the area
calculations of both aircraft to generate the extra 4 N of lift for the Production; and 7.5 N for the
Manufacturing Support Aircraft.

59
6.3 BATTERY AND PROPULSION TESTING
A thrust test and an endurance test using the motor and batteries to be used in the
competition were performed. The thrust test was conducted to measure the motor’s actual thrust
so we could compare it to the thrust stated on the motor’s specifications sheet. An endurance
test was done to verify that the batteries had enough capacity to run for the needed 5 minutes.
Tests on the propulsion system were completed to help identify the final motor and battery
selection for both the Production and Manufacturing Support Aircraft. During the initial design
phase, a motor, propeller and battery were selected as a baseline for our propulsion system and
these components together created was the system that the propulsion tests were completed
with. The tests were completed in a 60x60cm wind tunnel at speeds of 10, 15, 20 and 25 m/s.
The two types of tests done were a thrust test and an endurance test. The setup consisted of
the motor and propeller being attached to an arm that created moment about a pivot point which
translates to another arm that has a scale on the end. Using statics, the thrust output of the
motor was calculated. The test results can be seen below.
Table 6.3-1 Thrust Testing Results
Speed (m/s) Thrust (N) Current Draw (A)
10 10.26 24.6
15 7.94 24.2
20 7.30 25.6
25 5.61 23.4
From this data it was shown that the thrust at takeoff (10m/s) would be the limiting factor
for the final motor selection. The Production Aircraft was calculated to need 9.53N (93% of
tested value) of thrust from 0-10m/s in order to takeoff within the required 100ft, yet to only need
2.29N (41% of tested value) of thrust to hold at cruise speed (25m/s).
To test the battery endurance we ran the motor with the same current draw as the thrust
test (~25A), starting from a fully charged battery and timed how long the battery lasted. Based
on calculations using the battery capacity, the theoretical duration should have been 16
minutes, however the battery died at 12 minutes for the start of the test. This showed that the
battery to be selected needed 33% more capacity than calculated.

60
The test results allowed the final motor/propeller/battery configurations to be chosen for
both aircraft. An AXI 2820/12 motor with an 11x7 propeller (the motor/propeller used in the test)
were selected for the Production Aircraft, with a battery pack consisting of (2) 12V 1400mAh
battery packs connected in parallel. After comparing the thrust test results to the recommended
aircraft size and appropriate usage data on the motor website, a motor was selected for the
Manufacturing Support Aircraft. An AXI 4120/14 motor with a 13x11 propeller were selected,
with a battery pack consisting of (2) 14V 2,200mAh battery packs connected in parallel.
6.4 FLIGHT CHECKLIST
A flight checklist was created to properly document the results of each flight test done on
both our aircraft. Flight testing was done to evaluate the performance of the aircraft and its
ability to complete each mission accordingly. Flight testing helped modify the design and
manufacturing techniques to produce an aircraft capable to complete all 3 missions.
Figure 8.2 - Flight Checklist

61
6.5 PROTOTYPE
A preliminary foam prototype was created to test the basic concept and maneuverability of
a small flying wing Production Aircraft. The foam airfoil was cut out using a hotwire setup and
reinforced using wooden and carbon fiber spars. Elevons were added to the trailing edge of the
prototype based on preliminary aerodynamic analysis in order to control the foam prototype.
The foam prototype was hand launched down a steep hill and remotely controlled. This test
revealed that the flying wing design was stable but pitch sensitive. The prototype was able to
perform basic s-turns which were repeated several times. This preliminary model confirmed our
proof of concept and encouraged further development of this design for the Production Aircraft.
An image of our foam prototype is shown below.
Figure 9.1 - Foam Prototype of Production Aircraft

62
7. Final Results
7.1 FINAL AIRCRAFT PERFORMANCE
The testing process began by weighing the final aircraft to compare the actual aircraft
weight to estimated aircraft weight. This was done first as the actual aircraft weights played an
important role in the aircraft’s ability to reach a speed sufficient for take-off, to sustain flight and
to properly utilize the propulsion system created. It was found that the estimated weight for the
Production Aircraft was 4 kg and the actual loaded weight was found to be 4.2 kg. Similarly the
Manufacturing Support Aircraft was weighed and found to be 6.5 kg as opposed to its estimated
weight of 7.3 kg. Since both the aircraft had exceeded their estimated weights, a safety factor
was added for aerodynamic calculations.
Before leaving for the AIAA DBF 2016 competition, both aircraft were tested. The
Production Aircraft was able to taxi very well and reach a speed fast enough for take-off, but
was unable to fly. On each flight attempt, issues were encountered with the nose wheel and
servo until, after multiple attempts, the nose wheel broke. This issue was further addressed on
site at the competition.
Initially, the Manufacturing Support Aircraft was also unable to fly during the first tests.
Unlike the Production Aircraft, this aircraft did not taxi well as too much drag was being created
by the large fuselage. The tail wheel also proved problematic due to its inadequate size.
Additionally, it could not take- off as it could not reach a speed fast enough for take- off. This
plane was also slightly overweight for similar reasons as the Production Aircraft. As with the
Production Aircraft, the problems were identified and further addressed on site at the
competition.
7.2 COMPETITION RESULTS
On site in Wichita, the main Production Aircraft issues were resolved. However, it was still
unable to fly due to its extra weight, most likely due to adhesives and aluminum components as
the extra sheets used when laminating the ribs. The Manufacturing Support Aircraft on the other

63
hand was able to fly in 30mph gusts and 20mph winds for a short period of time after some
issues were addressed. Upon arrival in Wichita, the elevator range and power output were
identified as main problems. The motor selected for the Manufacturing Support Aircraft required
a voltage of approximately 24V but with the current circuit set up it was only receiving 14V and
was unable to achieve a speed fast enough for take-off. The battery setup was adjusted by
adding an additional battery in series to output a voltage suitable for the motor. Additionally, the
position of the tail elevator could not be moved to allow more range and obtain stability.
Although correcting these two issues allowed for a short flight, the addition of a battery
increased the weight of the aircraft significantly and the additional range obtained by shifting the
elevator position was still inadequate, leading to the plane crashing shortly after take-off. The
damages sustained from the crash were irreparable and the two airplanes could not be used to
participate in the AIAA DBF 2016 competition.

64
8. Conclusion
The goal of this MQP was to successfully compete in the 2016 AIAA/Cessna/Raytheon
Design/Build/Fly competition, where teams were challenged to create two remote-controlled
electrically powered aircraft. Both aircraft, the manufacturing support and production, were to
achieve specific mission tasks as a part of receiving the highest total score. Although a score
was not received by the team during the actual competition in Wichita, KS, the manufacturing of
the project resulted in two aircraft capable of carrying their payloads based on their respective
design.
8.1 OUTCOME
In order to create a viable design and prepare a building plan, research on different aircraft
configurations, the study of aerodynamics, and the manufacturability and payload capabilities of
these concepts were compiled. Quantitative decisions were made through the use of merit
analyses and iterative design mechanisms. Final aircraft configurations selected by the team
consisted of a flying wing design for the production aircraft nested inside the wings of a
conventional design manufacturing support aircraft.
The production aircraft’s flying wing design had the requirement of having to carry the
payload of a 32oz Gatorade bottle during mission 3 of the competition. To satisfy this condition,
this aircraft was designed to have a span of 2.150 m using an MH 45 airfoil and manufactured
out of laser-cut laminated balsa plywood sheets, carbon fiber tubing, foam, MonoKote shrink
wrap and 3D-printed material. The manufacturing support aircraft’s conventional design was
required to carry a payload of the production aircraft internally. A NACA 4418 airfoil and a span
of 2.150 m was selected for the design of this aircraft. The manufacturing of this aircraft was
completed using the same processes and materials as the production aircraft, with the
exception of the 3D-printed casing. Additional wing lids were created for this aircraft as a way of
securing the payload internally. Axi motors using nickel-metal hydride batteries powered both
aircraft.
Unfortunately, adequate flight-testing of the final aircraft could not be performed by the
team due to the lengthy time allotted to the design phase of the project. This resulted in the

65
realization that the production aircraft was unable to fly due to its heavy weight while attending
the competition. Meanwhile, the manufacturing support aircraft was able to fly through 30mph
gusts and 20 mph winds after for a short period of time before crashing and sustaining
irreparable damages. Overall, the innovations in design and analysis as well as in the
manufacturing techniques performed in this project can be of use for future WPI teams
competing in the Design/Build/Fly competition.
8.2 RECOMMENDATIONS
Several unanticipated problems and setbacks that hindered the progress of the project
were experienced by the team. These complications could have been avoided had the team had
the following recommendations regarding the entire design, manufacturing and testing process
prior to the start of the project.
The first recommendation is to recruit students who have experience with the design and
building of radio-controlled aircraft. These students would be able to identify and clarify
problems in the aircraft’s design whereas students with less experience may not. They would
also be of high use during times of manufacturing and purchasing parts.
With the addition of experienced members, the team should create a business-like
structure consisting of sub-teams (propulsion, modeling, aerodynamics, etc.) who continuously
meet throughout the week. Ideally, these sub-teams and the whole team would set strict
deadlines for tasks that need to be completed through the use of a Gantt chart. This would allow
the team to utilize their time appropriately so that the project gets sufficient flight-testing and
remodeling time.
A third recommendation would be to seek funding from sponsors for this project, for the
allotted budget provided may not be a sufficient amount if the team would like to create
prototypes before the manufacturing of their final design, use good quality materials, purchase
extra materials in the case of failures or allow the whole team to travel equally. Additionally,
logistics for travel or team apparel should be planned well ahead of time.

66

67
Appendix A – Aerodynamic Analyses Results
MH 114 – Coefficient of Lift vs Alpha / Moment, Drag, and Lift to Drag / Final Results
Cruise Angle of Attack (α=0°) Take-off Angle of Attack (α=10°)
Airspeed 5 m/s 10 m/s 15 m/s 20 m/s 25 m/s 5 m/s 10 m/s 15 m/s 20 m/s 25 m/s
Cl 0.60 0.82 0.85 0.88 0.90 1.67 1.70 1.72 1.73 1.73
Cm,o -0.16 -0.19 -0.19 -0.20 -0.20 -0.14 -0.14 -0.14 -0.15 -0.15
CD 0.03 0.02 0.01 0.01 0.01 0.04 0.03 0.02 0.02 0.02
L/D 20.00 60.00 80.00 95.00 107.00 50.00 70.00 77.00 81.00 86.00

68
SD 7062 – Coefficient of Lift vs Alpha / Moment, Drag, and Lift to Drag / Final Results
Cruise Angle of Attack (α=0°) Take-off Angle of Attack (α=10°)
Airspeed 5 m/s 10 m/s 15 m/s 20 m/s 25 m/s 5 m/s 10 m/s 15 m/s 20 m/s 25 m/s
Cl 0.42 0.43 0.45 0.46 0.48 1.40 1.43 1.45 1.46 1.48
Cm,o -0.08 -0.08 -0.08 -0.08 -0.09 -0.06 -0.06 -0.06 -0.07 -0.07
CD 0.02 0.01 0.01 0.01 0.01 0.03 0.02 0.02 0.02 0.02
L/D 22.00 37.00 47.00 52.00 56.00 41.00 62.00 76.00 82.00 91.00

69
MH 83 – Coefficient of Lift vs Alpha / Moment, Drag, and Lift to Drag / Final Results
Cruise Angle of Attack (α=0°) Take-off Angle of Attack (α=10°)
Airspeed 5 m/s 10 m/s 15 m/s 20 m/s 25 m/s 5 m/s 10 m/s 15 m/s 20 m/s 25 m/s
Cl 0.47 0.47 0.48 0.48 0.48 0.87 1.50 1.57 1.58 1.59
Cm,o -0.07 -0.07 -0.07 -0.07 -0.07 -0.09 -0.06 -0.06 -0.06 -0.06
CD 0.02 0.01 0.01 0.01 0.01 0.13 0.03 0.02 0.02 0.02
L/D 25.00 33.00 37.00 41.00 42.00 7.00 45.00 70.00 82.00 89.00
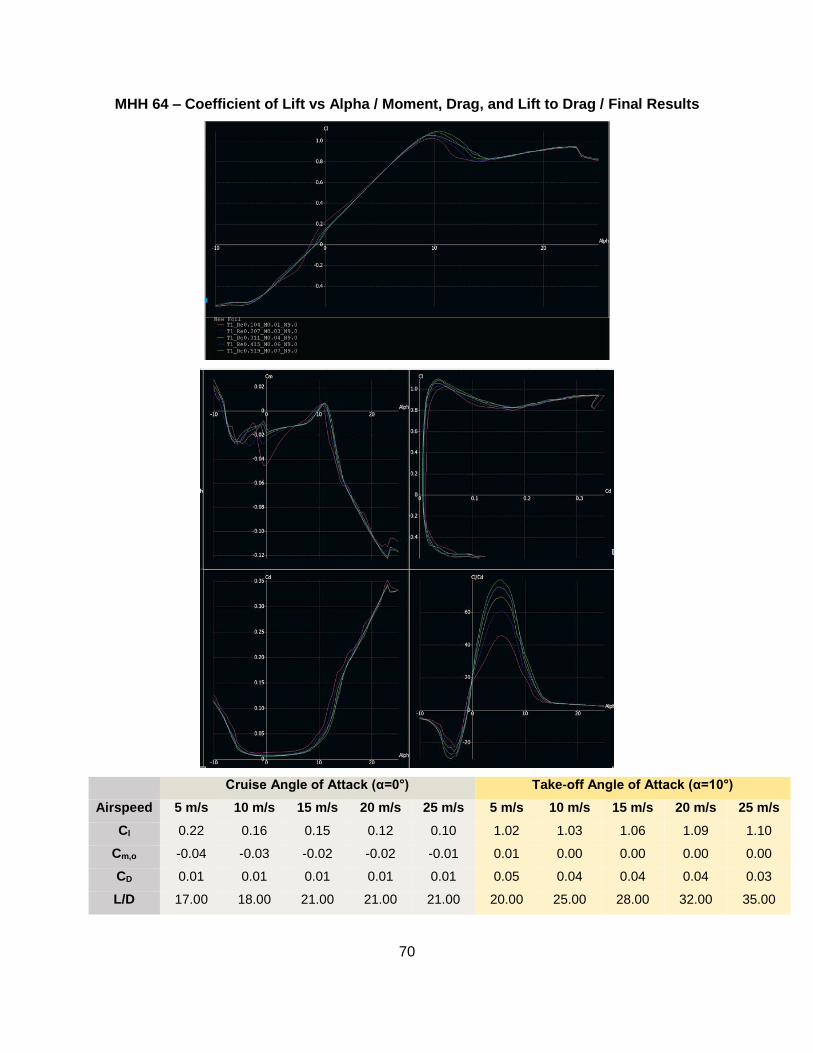
70
MHH 64 – Coefficient of Lift vs Alpha / Moment, Drag, and Lift to Drag / Final Results
Cruise Angle of Attack (α=0°) Take-off Angle of Attack (α=10°)
Airspeed 5 m/s 10 m/s 15 m/s 20 m/s 25 m/s 5 m/s 10 m/s 15 m/s 20 m/s 25 m/s
Cl 0.22 0.16 0.15 0.12 0.10 1.02 1.03 1.06 1.09 1.10
Cm,o -0.04 -0.03 -0.02 -0.02 -0.01 0.01 0.00 0.00 0.00 0.00
CD 0.01 0.01 0.01 0.01 0.01 0.05 0.04 0.04 0.04 0.03
L/D 17.00 18.00 21.00 21.00 21.00 20.00 25.00 28.00 32.00 35.00

71
S 1223 – Coefficient of Lift vs Alpha / Moment, Drag, and Lift to Drag / Final Results
Cruise Angle of Attack (α=0°) Take-off Angle of Attack (α=10°)
Airspeed 5 m/s 10 m/s 15 m/s 20 m/s 25 m/s 5 m/s 10 m/s 15 m/s 20 m/s 25 m/s
Cl 1.20 1.20 1.20 1.20 1.20 1.90 2.20 2.20 2.20 2.20
Cm,o -0.27 -0.27 -0.27 -0.27 -0.27 -0.22 -0.23 -0.24 -0.24 -0.24
CD 0.02 0.02 0.02 0.02 0.02 0.07 0.04 0.03 0.03 0.03
L/D 51.00 65.00 72.00 78.00 82.00 30.00 60.00 75.00 82.00 88.00

72
NACA 4424 – Coefficient of Lift vs Alpha / Moment, Drag, and Lift to Drag / Final Results
Cruise Angle of Attack (α=0°) Take-off Angle of Attack (α=10°)
Airspeed 5 m/s 10 m/s 15 m/s 20 m/s 25 m/s 5 m/s 10 m/s 15 m/s 20 m/s 25 m/s
Cl -0.32 0.00 0.20 0.30 0.34 0.38 0.71 1.01 1.09 1.10
Cm,o 0.03 0.00 0.00 -0.06 -0.06 0.00 0.00 -0.01 -0.02 -0.02
CD 0.05 0.03 0.20 0.02 0.20 0.10 0.06 0.03 0.02 0.02
L/D -7.00 0.00 15.00 22.00 28.00 4.00 12.00 33.00 40.00 43.00

73
MH 45 – Coefficient of Lift vs Alpha / Moment, Drag, and Lift to Drag / Final Results
Cruise Angle of Attack (α=0°) Take-off Angle of Attack (α=10°)
Airspeed 5 m/s 10 m/s 15 m/s 20 m/s 25 m/s 5 m/s 10 m/s 15 m/s 20 m/s 25 m/s
Cl 0.21 0.16 0.14 0.11 0.08 1.11 1.13 1.14 1.16 1.16
Cm,o -0.04 -0.02 -0.01 -0.01 0.00 0.00 0.00 0.00 0.00 0.00
CD 0.02 0.01 0.01 0.01 0.01 0.04 0.03 0.02 0.02 0.02
L/D 15.00 17.00 19.00 17.00 14.00 30.00 45.00 54.00 63.00 65.00

74
Appendix B – Initial Sizing Results
MH 114
Cruise Angle of Attack (α=0°) Take-off Angle of Attack (α=10°)
Airspeed 5 m/s 10 m/s 15 m/s 20 m/s 25 m/s 5 m/s 10 m/s 15 m/s 20 m/s 25 m/s
b (m) 10.68 1.95 0.84 0.46 0.28 3.84 0.94 0.41 0.23 0.15
S (m2) 3.26 0.60 0.26 0.14 0.09 1.17 0.29 0.13 0.07 0.05
AR 35.05 6.41 2.75 1.49 0.93 12.59 3.09 1.36 0.76 0.49
T/W 0.05 0.02 0.01 0.01 0.01 0.02 0.01 0.01 0.01 0.01
W/S 9.19 50.23 117.14 215.60 344.53 25.57 104.13 237.04 423.85 662.27
SD 7062
Cruise Angle of Attack (α=0°) Take-off Angle of Attack (α=10°)
Airspeed 5 m/s 10 m/s 15 m/s 20 m/s 25 m/s 5 m/s 10 m/s 15 m/s 20 m/s 25 m/s
b (m) 15.26 3.73 1.58 0.87 0.53 4.58 1.12 0.49 0.27 0.17
S (m2) 4.65 1.14 0.48 0.27 0.16 1.40 0.34 0.15 0.08 0.05
AR 50.08 12.23 5.19 2.86 1.75 15.02 3.68 1.61 0.90 0.57
T/W 0.05 0.03 0.02 0.02 0.02 0.02 0.02 0.01 0.01 0.01
W/S 6.43 26.34 62.02 112.70 183.75 21.44 87.59 199.83 357.70 566.56
MH 83
Cruise Angle of Attack (α=0°) Take-off Angle of Attack (α=10°)
Airspeed 5 m/s 10 m/s 15 m/s 20 m/s 25 m/s 5 m/s 10 m/s 15 m/s 20 m/s 25 m/s
b (m) 13.64 3.41 1.48 0.83 0.53 7.37 1.07 0.45 0.25 0.16
S (m2) 4.16 1.04 0.45 0.25 0.16 2.25 0.33 0.14 0.08 0.05
AR 44.75 11.19 4.87 2.74 1.75 24.17 3.51 1.49 0.83 0.53
T/W 0.04 0.03 0.03 0.02 0.02 0.14 0.02 0.01 0.01 0.01
W/S 7.20 28.79 66.15 117.60 183.75 13.32 91.88 216.37 387.10 608.67
MH 64
Cruise Angle of Attack (α=0°) Take-off Angle of Attack (α=10°)
Airspeed 5 m/s 10 m/s 15 m/s 20 m/s 25 m/s 5 m/s 10 m/s 15 m/s 20 m/s 25 m/s
b (m) 29.14 10.02 4.75 3.34 2.56 6.28 1.56 0.67 0.37 0.23
S (m2) 8.88 3.05 1.45 1.02 0.78 1.92 0.47 0.20 0.11 0.07
AR 95.60 32.86 15.58 10.95 8.41 20.62 5.10 2.20 1.21 0.76
T/W 0.06 0.06 0.05 0.05 0.05 0.05 0.04 0.04 0.03 0.03
W/S 3.37 9.80 20.67 29.40 38.28 15.62 63.09 146.08 267.05 421.09
S1223
Cruise Angle of Attack (α=0°) Take-off Angle of Attack (α=10°)
Airspeed 5 m/s 10 m/s 15 m/s 20 m/s 25 m/s 5 m/s 10 m/s 15 m/s 20 m/s 25 m/s
b (m) 5.34 1.34 0.59 0.33 0.21 3.37 0.73 0.32 0.18 0.12
S (m2) 1.63 0.41 0.18 0.10 0.07 1.03 0.22 0.10 0.06 0.04
AR 17.53 4.38 1.95 1.10 0.70 11.07 2.39 1.06 0.60 0.38

75
T/W 0.02 0.02 0.01 0.01 0.01 0.03 0.02 0.01 0.01 0.01
W/S 18.38 73.50 165.38 294.00 459.38 29.09 134.75 303.19 539.00 842.19
NACA 4424
Cruise Angle of Attack (α=0°) Take-off Angle of Attack (α=10°)
Airspeed 5 m/s 10 m/s 15 m/s 20 m/s 25 m/s 5 m/s 10 m/s 15 m/s 20 m/s 25 m/s
b (m) -20.03 0.00 3.56 1.34 0.75 16.87 2.26 0.71 0.37 0.23
S (m2) -6.11 0.00 1.09 0.41 0.23 5.14 0.69 0.21 0.11 0.07
AR -65.73 0.00 11.68 4.38 2.47 55.35 7.41 2.31 1.21 0.76
T/W -0.14 0.00 0.07 0.05 0.04 0.25 0.08 0.03 0.03 0.02
W/S -4.90 0.00 27.56 73.50 130.16 5.82 43.49 139.19 267.05 421.09
MH 45
Cruise Angle of Attack (α=0°) Take-off Angle of Attack (α=10°)
Airspeed 5 m/s 10 m/s 15 m/s 20 m/s 25 m/s 5 m/s 10 m/s 15 m/s 20 m/s 25 m/s
b (m) 30.53 10.34 5.09 3.64 3.21 5.78 1.42 0.62 0.35 0.22
S (m2) 9.30 3.15 1.55 1.11 0.98 1.76 0.43 0.19 0.11 0.07
AR 100.15 33.92 16.69 11.95 10.52 18.95 4.65 2.05 1.13 0.73
T/W 0.07 0.06 0.05 0.06 0.07 0.03 0.02 0.02 0.02 0.02
W/S 3.22 9.49 19.29 26.95 30.63 17.00 69.21 157.11 284.20 444.06

76
Appendix C – Detailed Airfoil
Results for Production
Aircraft
MH 45
Weight = Lift 40 N 4 kg
Density of air 1.225 kg/m^3
Coeff of lift linearization
Chord 0.2785 m
Cl = mx + b
Area required at low speed 0.60 m^2
Cl = 0.092x + 0.1
Frontal Area 0.06 m^2
Velocity (m/s)
Parameter Notation Units 10 15 20 25
Reynolds Number Re
207,000 311,000 415,000 519,000
Coeff of Lift Cl
1.20 0.48 0.27 0.17
Angle of Attack AoA degrees 11.96 4.18 1.88 0.81
Span b meters 2.15 2.15 2.15 2.15
Aspect Ratio AR
7.72 7.72 7.72 7.72
Coeff of Drag Cd
0.03 0.02 0.01 0.01
Coeff of Moment Cm
0.01 -0.01 -0.01 -0.01
Lift/Drag L/D
40.00 70.00 50.00 20.00
Drag D Newtons 1.10 1.65 1.47 2.29
Power P Watts 11.00 24.75 29.33 57.29
Thrust/Weight Ratio T/W
0.03 0.01 0.02 0.05
Wing Loading Factor W/S N/m^2 6.68 6.68 6.68 6.68

77
NACA 4412
Weight = Lift 40 N 4 kg
Density of air 1.225 kg/m^3
Coeff of lift linearization
Chord 0.3048 m
Cl = mx +b
Area required at low speed 0.60 m^2
Cl = 0.08x +0.5
Frontal Area 0.07 m^2
Velocity (m/s)
Parameter Notation Units 10 15 20 25
Reynolds Number Re
207,000 311,000 415,000 519,000
Coeff of Lift Min Cl
1.20 0.48 0.27 0.17
Angle of Attack AoA degrees 8.75 -0.19 -2.84 -4.07
Span b meters 1.96 1.96 1.96 1.96
Aspect Ratio AR
6.44 6.44 6.44 6.44
Coeff of Drag Cd
0.03 0.01 0.01 0.01
Coeff of Moment Cm
-0.07 -0.10 -0.10 -0.10
Lift/Drag L/D
50.00 60.00 55.00 55.00
Drag D Newtons 0.92 0.83 1.47 2.29
Power P Watts 9.17 12.38 29.33 57.29
Thrust/Weight Ratio T/W
0.02 0.02 0.02 0.02
Wing Loading Factor W/S N/m^2 6.68 6.68 6.68 6.68

78
MH 114
Weight = Lift 40 N 4 kg
Density of air 1.225 kg/m^3
Coeff of lift linearization
Chord 0.3048 m
Cl = mx +b
Area required at low speed 0.42 m^2
Cl = 0.09x +0.8
Frontal Area 0.05 m^2
Velocity (m/s)
Parameter Notation Units 10 15 20 25
Reynolds Number Re
207,000 311,000 415,000 519,000
Coeff of Lift Cl
1.70 0.69 0.39 0.25
Angle of Attack AoA degrees 10.00 -1.26 -4.60 -6.14
Span b meters 1.39 1.39 1.39 1.39
Aspect Ratio AR
4.55 4.55 4.55 4.55
Coeff of Drag Cd
0.03 0.01 0.01 0.01
Coeff of Moment Cm
-0.16 -0.19 -0.19 -0.19
Lift/Drag L/D
70.00 80.00 95.00 105.00
Drag D Newtons 0.78 0.58 1.04 1.62
Power P Watts 7.76 8.74 20.71 40.44
Thrust/Weight Ratio T/W
0.01 0.01 0.01 0.01
Wing Loading Factor W/S N/m^2 9.47 9.47 9.47 9.47

79
SD 7062
Weight = Lift 40 N 4 kg
Density of air 1.225 kg/m^3
Coeff of lift linearization
Chord 0.3048 m
Cl = mx +b
Area required at low speed 0.45 m^2
Cl = 0.08x +0.4
Frontal Area 0.06 m^2
Velocity (m/s)
Parameter Notation Units 10 15 20 25
Reynolds Number Re
207,000 311,000 415,000 519,000
Coeff of Lift Cl
1.60 0.65 0.36 0.23
Angle of Attack AoA degrees 15.00 3.08 -0.45 -2.09
Span b meters 1.47 1.47 1.47 1.47
Aspect Ratio AR
4.83 4.83 4.83 4.83
Coeff of Drag Cd
0.07 0.01 0.01 0.01
Coeff of Moment Cm
-0.04 -0.08 -0.08 -0.08
Lift/Drag L/D
30.00 70.00 70.00 70.00
Drag D Newtons 1.93 0.62 1.10 1.72
Power P Watts 19.25 9.28 22.00 42.97
Thrust/Weight Ratio T/W
0.03 0.01 0.01 0.01
Wing Loading Factor W/S N/m^2 8.91 8.91 8.91 8.91

80
MH 83
Weight = Lift 40 N 4 kg
Density of air 1.225 kg/m^3
Coeff of lift linearization
Chord 0.3048 m
Cl = mx +b
Area required at low speed 0.40 m^2
Cl = 0.09x +0.45
Frontal Area 0.05 m^2
Velocity (m/s)
Parameter Notation Units 10 15 20 25
Reynolds Number Re
207,000 311,000 415,000 519,000
Coeff of Lift Cl
1.80 0.73 0.41 0.26
Angle of Attack AoA degrees 15.00 3.08 -0.45 -2.09
Span b meters 1.31 1.31 1.31 1.31
Aspect Ratio AR
4.30 4.30 4.30 4.30
Coeff of Drag Cd
0.15 0.01 0.01 0.01
Coeff of Moment Cm
-0.05 -0.06 -0.06 -0.06
Lift/Drag L/D
10.00 65.00 45.00 45.00
Drag D Newtons 3.67 0.55 0.98 1.53
Power P Watts 36.67 8.25 19.56 38.19
Thrust/Weight Ratio T/W
0.10 0.02 0.02 0.02
Wing Loading Factor W/S N/m^2 10.02 10.02 10.02 10.02

81
MH 64
Weight = Lift 40 N 4 kg
Density of air 1.225 kg/m^3
Coeff of lift linearization
Chord 0.3048 m
Cl = mx +b
Area required at low speed 0.62 m^2
Cl = 0.1x +0.15
Frontal Area 0.05 m^2
Velocity (m/s)
Parameter Notation Units 10 15 20 25
Reynolds Number Re
207,000 311,000 415,000 519,000
Coeff of Lift Cl
1.15 0.46 0.26 0.17
Angle of Attack AoA degrees 10.00 3.15 1.11 0.17
Span b meters 2.05 2.05 2.05 2.05
Aspect Ratio AR
6.72 6.72 6.72 6.72
Coeff of Drag Cd
0.04 0.01 0.01 0.01
Coeff of Moment Cm
0.00 -0.15 -0.15 -0.15
Lift/Drag L/D
25.00 55.00 25.00 20.00
Drag D Newtons 1.53 0.86 1.53 2.39
Power P Watts 15.30 12.91 30.61 59.78
Thrust/Weight Ratio T/W
0.04 0.02 0.04 0.05
Wing Loading Factor W/S N/m^2 6.40 6.40 6.40 6.40
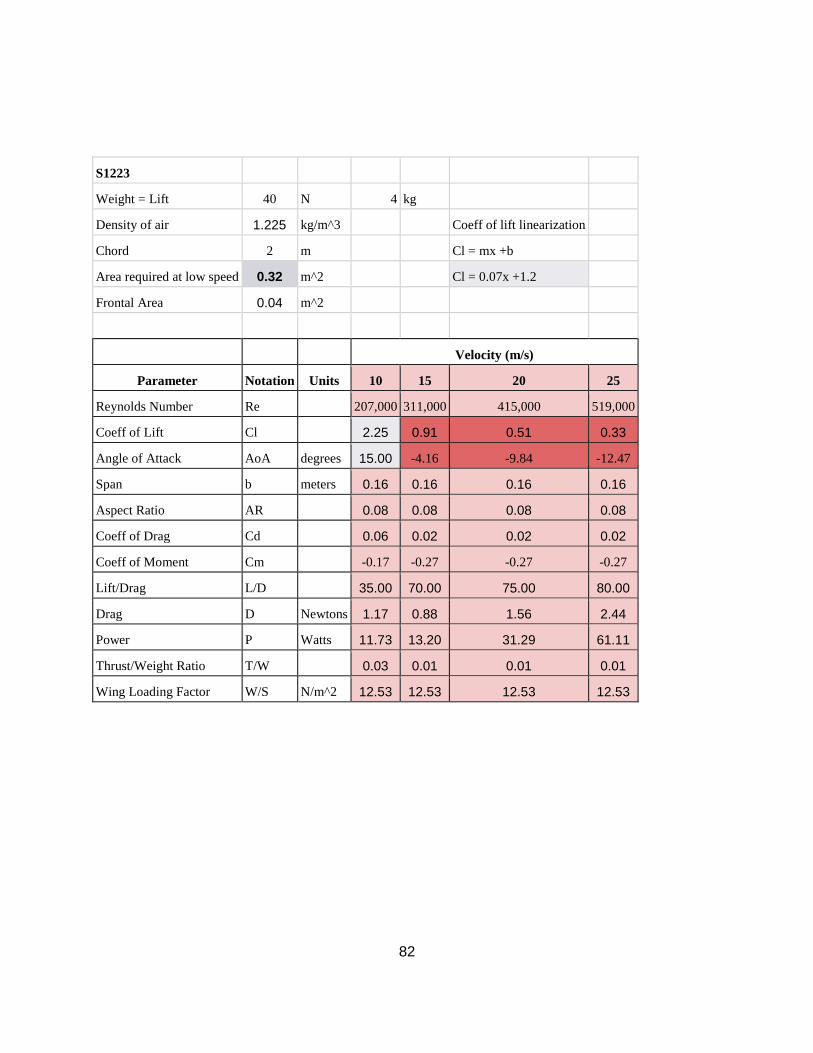
82
S1223
Weight = Lift 40 N 4 kg
Density of air 1.225 kg/m^3
Coeff of lift linearization
Chord 2 m
Cl = mx +b
Area required at low speed 0.32 m^2
Cl = 0.07x +1.2
Frontal Area 0.04 m^2
Velocity (m/s)
Parameter Notation Units 10 15 20 25
Reynolds Number Re
207,000 311,000 415,000 519,000
Coeff of Lift Cl
2.25 0.91 0.51 0.33
Angle of Attack AoA degrees 15.00 -4.16 -9.84 -12.47
Span b meters 0.16 0.16 0.16 0.16
Aspect Ratio AR
0.08 0.08 0.08 0.08
Coeff of Drag Cd
0.06 0.02 0.02 0.02
Coeff of Moment Cm
-0.17 -0.27 -0.27 -0.27
Lift/Drag L/D
35.00 70.00 75.00 80.00
Drag D Newtons 1.17 0.88 1.56 2.44
Power P Watts 11.73 13.20 31.29 61.11
Thrust/Weight Ratio T/W
0.03 0.01 0.01 0.01
Wing Loading Factor W/S N/m^2 12.53 12.53 12.53 12.53

83
Lissaman 7769
Weight = Lift 40 N 4 kg
Density of air 1.225 kg/m^3
Coeff of lift linearization
Chord 0.3048 m
Cl = mx +b
Area required at low speed 0.55 m^2
Cl = 0.1x + 0.3
Frontal Area 0.06 m^2
Velocity (m/s)
Parameter Notation Units 10 15 20 25
Reynolds Number Re
207,000 311,000 415,000 519,000
Coeff of Lift Cl
1.30 0.53 0.30 0.19
Angle of Attack AoA degrees 10.00 2.25 -0.05 -1.11
Span b meters 1.81 1.81 1.81 1.81
Aspect Ratio AR
5.95 5.95 5.95 5.95
Coeff of Drag Cd
0.02 0.02 0.02 0.02
Coeff of Moment Cm
-0.02 -0.03 -0.03 -0.03
Lift/Drag L/D
65.00 40.00 30.00 30.00
Drag D Newtons 0.68 1.52 2.71 4.23
Power P Watts 6.77 22.85 54.15 105.77
Thrust/Weight Ratio T/W
0.02 0.03 0.03 0.03
Wing Loading Factor W/S N/m2 7.24 7.24 7.24 7.24

84
Appendix D – Detailed Results
for Manufacturing Support
Aircraft
NACA 4418
Weight = Lift 75 N 7.5 kg
Density of air 1.225 kg/m^3
Coeff of lift linearization
Chord 0.4826 m
Cl = mx +b
Area required at low speed 1.08 m^2
Cl = 0.09x +0.5
Frontal Area 0.10 m^2
Velocity (m/s)
Parameter Notation Units 10 15 20 25
Reynolds Number Re
207,000 311,000 415,000 519,000
Coeff of Lift Cl
1.25 0.51 0.28 0.18
Angle of Attack AoA degrees 8.33 0.06 -2.40 -3.54
Span b meters 2.23 2.23 2.23 2.23
Aspect Ratio AR
4.63 4.63 4.63 4.63
Coeff of Drag Cd
0.02 0.01 0.01 0.01
Coeff of Moment Cm
-0.08 -0.09 -0.09 -0.09
Lift/Drag L/D
62.50 50.51 28.41 22.73
Drag D Newtons 1.32 1.49 2.64 3.30
Power P Watts 13.20 22.28 52.80 82.50
Thrust/Weight Ratio T/W
0.02 0.02 0.04 0.04
Wing Loading Factor W/S N/m^2 6.96 6.96 6.96 6.96
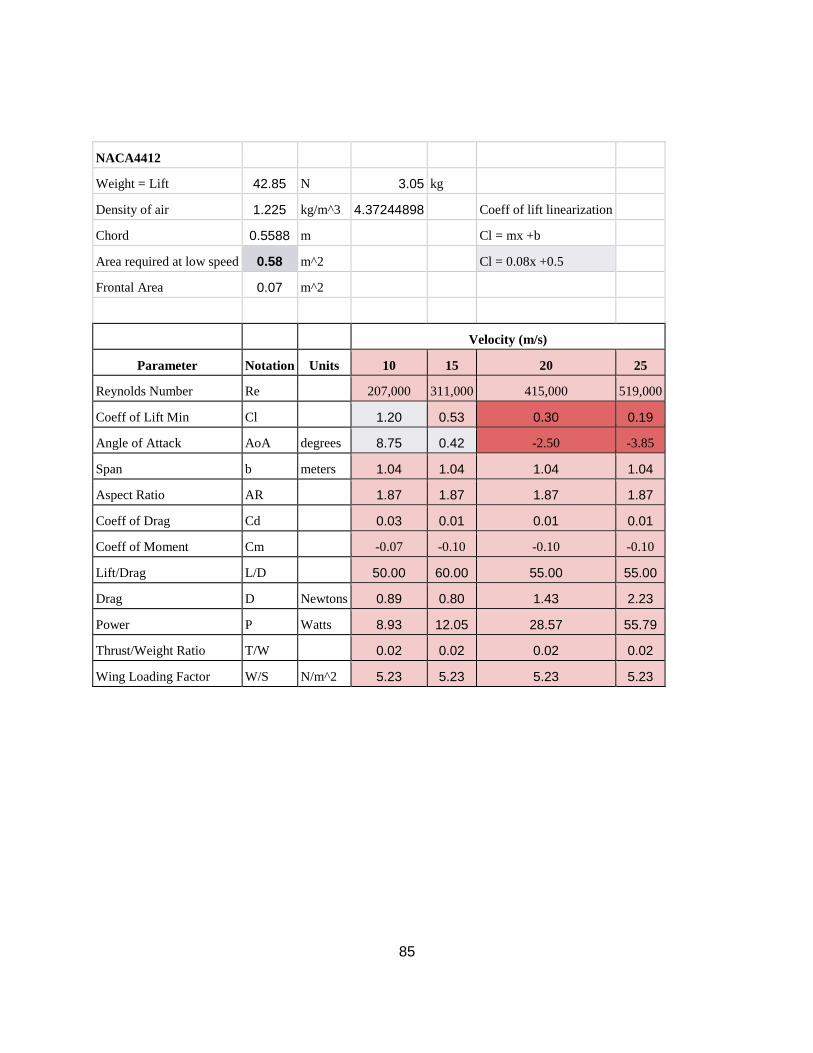
85
NACA4412
Weight = Lift 42.85 N 3.05 kg
Density of air 1.225 kg/m^3 4.37244898
Coeff of lift linearization
Chord 0.5588 m
Cl = mx +b
Area required at low speed 0.58 m^2
Cl = 0.08x +0.5
Frontal Area 0.07 m^2
Velocity (m/s)
Parameter Notation Units 10 15 20 25
Reynolds Number Re
207,000 311,000 415,000 519,000
Coeff of Lift Min Cl
1.20 0.53 0.30 0.19
Angle of Attack AoA degrees 8.75 0.42 -2.50 -3.85
Span b meters 1.04 1.04 1.04 1.04
Aspect Ratio AR
1.87 1.87 1.87 1.87
Coeff of Drag Cd
0.03 0.01 0.01 0.01
Coeff of Moment Cm
-0.07 -0.10 -0.10 -0.10
Lift/Drag L/D
50.00 60.00 55.00 55.00
Drag D Newtons 0.89 0.80 1.43 2.23
Power P Watts 8.93 12.05 28.57 55.79
Thrust/Weight Ratio T/W
0.02 0.02 0.02 0.02
Wing Loading Factor W/S N/m^2 5.23 5.23 5.23 5.23

86
MH 114
Weight = Lift 42.85 N 3.05 kg
Density of air 1.225 kg/m^3
Coeff of lift linearization
Chord 0.5588 m
Cl = mx +b
Area required at low speed 0.41 m^2
Cl = 0.09x +0.8
Frontal Area 0.05 m^2
Velocity (m/s)
Parameter Notation Units 10 15 20 25
Reynolds Number Re
207,000 311,000 415,000 519,000
Coeff of Lift Cl
1.70 0.76 0.43 0.27
Angle of Attack AoA degrees 10.00 -0.49 -4.17 -5.87
Span b meters 0.74 0.74 0.74 0.74
Aspect Ratio AR
1.32 1.32 1.32 1.32
Coeff of Drag Cd
0.03 0.01 0.01 0.01
Coeff of Moment Cm
-0.16 -0.19 -0.19 -0.19
Lift/Drag L/D
70.00 80.00 95.00 105.00
Drag D Newtons 0.76 0.57 1.01 1.58
Power P Watts 7.56 8.51 20.16 39.38
Thrust/Weight Ratio T/W
0.01 0.01 0.01 0.01
Wing Loading Factor W/S N/m^2 7.41 7.41 7.41 7.41

87
MH 104
Weight = Lift 42.85 N 4.368 kg
Density of air 1.225 kg/m^3
Coeff of lift linearization
Chord 0.5588 m
Cl = mx +b
Area required at low speed 0.58 m^2
Cl = 0.11x +0.1
Frontal Area 0.08 m^2
Velocity (m/s)
Parameter Notation Units 10 15 20 25
Reynolds Number Re
207,000 311,000 415,000 519,000
Coeff of Lift Cl
1.20 0.53 0.30 0.19
Angle of Attack AoA degrees 10.00 3.94 1.82 0.84
Span b meters 1.04 1.04 1.04 1.04
Aspect Ratio AR
1.87 1.87 1.87 1.87
Coeff of Drag Cd
0.02 0.01 0.01 0.01
Coeff of Moment Cm
-0.01 -0.02 0.00 0.00
Lift/Drag L/D
62.50 53.00 30.00 20.00
Drag D Newtons 0.70 0.80 1.43 2.68
Power P Watts 6.96 12.05 28.57 66.95
Thrust/Weight Ratio T/W
0.02 0.02 0.03 0.05
Wing Loading Factor W/S N/m^2 7.49 7.49 7.49 7.49

88
NACA2414
Weight = Lift 42.85 N 4.368 kg
Density of air 1.225 kg/m^3
Coeff of lift linearization
Chord 0.4572 m
Cl = mx +b
Area required at low speed 0.56 m^2
Cl = 0.077x +0.2
Frontal Area 0.08 m^2
Velocity (m/s)
Parameter Notation Units 10 15 20 25
Reynolds Number Re
207,000 311,000 415,000 519,000
Coeff of Lift Cl
1.25 0.56 0.31 0.20
Angle of Attack AoA degrees 13.64 4.62 1.46 0.00
Span b meters 1.22 1.22 1.22 1.22
Aspect Ratio AR
2.68 2.68 2.68 2.68
Coeff of Drag Cd
0.02 0.01 0.01 0.01
Coeff of Moment Cm
-0.03 -0.05 -0.05 -0.05
Lift/Drag L/D
62.50 56.00 31.00 20.00
Drag D Newtons 0.69 0.77 1.37 1.71
Power P Watts 6.86 11.57 27.42 42.85
Thrust/Weight Ratio T/W
0.02 0.02 0.03 0.05
Wing Loading Factor W/S N/m^2 7.80 7.80 7.80 7.80

89
S8036
Weight = Lift 42.85 N 3.05 kg
Density of air 1.225 kg/m^3
Coeff of lift linearization
Chord 0.5588 m
Cl = mx +b
Area required at low speed 0.56 m^2
Cl = 0.059x +0.2
Frontal Area 0.07 m^2
0.029 0.044 0.058 0.073
Velocity (m/s)
Parameter Notation Units 10 15 20 25
Reynolds Number Re
207,000 311,000 415,000 519,000
Coeff of Lift Cl
1.25 0.56 0.31 0.20
Angle of Attack AoA degrees 17.80 6.03 1.91 0.00
Span b meters 1.00 1.00 1.00 1.00
Aspect Ratio AR
1.79 1.79 1.79 1.79
Coeff of Drag Cd
0.03 0.01 0.01 0.01
Coeff of Moment Cm
0.00 -0.05 -0.03 -0.03
Lift/Drag L/D
42.67 56.00 31.00 20.00
Drag D Newtons 0.86 0.77 1.37 2.14
Power P Watts 8.57 11.57 27.42 53.56
Thrust/Weight Ratio T/W
0.02 0.02 0.03 0.05
Wing Loading Factor W/S N/m^2 5.45 5.45 5.45 5.45

90
Appendix E – MATLAB Code
for Power Requirement
Calculation
Stage_1_inputs:
%% Takeoff parameter calculator for RC aircraft
% To be used by WPI AIAA Design, Build, Fly teams only
% Used in conjunction WPI_DBF_flight_analysis
% Calculates
% -If plane will take off within takeoff field length
% -Takeoff velocity taking into account a 25% buffer to account for
% uncontrollable factors
function flight_output_values = stage_1_inputs(mass, weight, density, Cd0, A_drag, Cl, A_wing, prop_diam,
prop_RPM, prop_pitch)
%% Uncomment when using inputs from WPI_DBF_flight_analysis to analyze results
mass = 2.5;
v_cruise = 160;
weight = 2.5*9.8;
density = .957*1.255;
Cd0 = .021;
A_drag = .03;
A_wing = .34;
Cl = 1.20;
prop_diam = 11;
prop_RPM = 8490;
prop_pitch = 7;
%% Calculates necessary velocity for liftoff
V_takeoff = sqrt((2*weight)/(density*A_wing*Cl));
%% Calculating propeller static thrust

91
static_thrust =
(1.225*(pi*((0.0254*prop_diam)^2))/4)*((prop_RPM*.0254*prop_pitch*(1/60))^2)*((prop_diam/(3.29546*prop_pi
tch))^1.5);
thrust_initial = static_thrust;
%% Finding acceleration and velocity as a function of time
%takes into account decreasing value of dynamic thrust
%initializing variables
current_accel_value = zeros(1,500);
current_vel = zeros(1,500);
new_thrust = 0;
t_liftoff = 0;
t_count = 0;
timestep = 0.1;
%loop to find time to liftoff and t_count, a count of total recursions
for t=1:1:500
if t == 1
current_accel_value(t) = thrust_initial/mass;
current_vel(t) = current_accel_value(t)*timestep;
new_thrust = (1.225*(pi*((0.0254*prop_diam)^2))/4)*(((prop_RPM*.0254*prop_pitch*(1/60))^2)-
(prop_RPM*.0254*prop_pitch*(1/60)*current_vel(t)))*((prop_diam/(3.29546*prop_pitch))^1.5);
else
current_accel_value(t) = (new_thrust/mass) - (.5*density*A_drag*Cd0*(current_vel(t-1)^2)/mass);
current_vel(t) = current_vel(t-1)+current_accel_value(t)*timestep;
new_thrust = (1.225*(pi*((0.0254*prop_diam)^2))/4)*(((prop_RPM*.0254*prop_pitch*(1/60))^2)-
(prop_RPM*.0254*prop_pitch*(1/60)*current_vel(t)))*((prop_diam/(3.29546*prop_pitch))^1.5);
end
if current_vel(t) > 1.25*V_takeoff
t_liftoff=t*0.1;
t_count = t;
break
end
end
%% Calculates position of aircraft at moment of liftoff

92
Pos_at_liftoff = 0;
accel_total = 0;
for y = 1:1:t_count
if y == 1
Pos_at_liftoff = 0.5*current_accel_value(y)*timestep^2;
else
Pos_at_liftoff = Pos_at_liftoff + current_vel(y-1)*timestep + 0.5*current_accel_value(y)*timestep^2;
end
end
%% Outputs
flight_output_values = [Pos_at_liftoff; current_vel(t_count); t_liftoff; t_count; static_thrust];
WPI_DBF_Flight_Analysis
%% Flight Analysis Program for RC Aircraft
% To be used by WPI AIAA Design, Build, Fly teams only
%
% Used in conjunction with stage_1_inputs
% Calculates
% -If plane will take off within takeoff field length
% -Max velocity based on generated thrust
% -Power required to maintain cruising velocity
% -Total flight time
% Breaks flight into four stages
% - 1. Takeoff
% - 2. Climb
% - 3. Cruise
% - 4. Turn
% ALL VALUES EXCEPT PROP SPECS TO BE ENTERED IN METRIC UNITS
% prop thrust equation accounts for conversions
%Perameter to show liftoff failure, or failure if max_v is less than
%v_cruise
takeoff_outcome = 'Successful takeoff within prescribed field length';
%% Insert aircraft perameters

93
% weight = ; % N
% mass = weight/9.8;
% density = ; % kg/m^3
% bank_angle = ; % deg
% A_wing = ; % m^2
% A_drag = ; % m^2
% cruise_Cd0 = ;
% cruise_Cl = ;
% v_cruise = ; % desired cruise velocity
% cruise_alt = ; % m
% max_liftoff_x = ; % m
% prop_diam = ; % in
% prop_RPM = ; % rotations per minute
% prop_pitch = ; % in
% Values based upon MH45 airfoil data found by Aerodynamics team
mass = 3.5;
v_cruise = 21.5;
cruise_Cl = 0.27;
takeoff_Cl = 1.2;
weight = mass*9.8;
cruise_alt = 17;
density = .957*1.255;
Cd0 = .03;
cruise_Cd0 = 0.1;
M1_Cd = cruise_Cd0;
A_drag = .03;
A_wing = .34;
prop_diam = 11;
climb_aoa = 15;
prop_RPM = 8490;
prop_pitch = 7;
AR = 5;
max_liftoff_x = 33;
%% Stage 1: Start to takeoff time calculations, does aircraft take off in time?

94
stage_1_outputs = stage_1_inputs(mass, weight, density, M1_Cd, A_drag, takeoff_Cl, A_wing, prop_diam,
prop_RPM, prop_pitch);
takeoff_dx = stage_1_outputs(1);
takeoff_vel = stage_1_outputs(2);
t_takeoff = stage_1_outputs(3);
t_count = stage_1_outputs(4);
thrust_initial = stage_1_outputs(5)
%Liftoff space defined as liftoff_max_x - x_liftoff, must be positive for
%legal takeoff
liftoff_space = max_liftoff_x - takeoff_dx;
if liftoff_space < 10
takeoff_outcome = 'Aircraft does not take off within set takeoff area'
else
takeoff_outcome
end
%% Stage 2: Climb
%Time assuming v_climb_initial = 1.25*V_takeoff
%Part B: finding t_climb and total dx after climb
t_climb = cruise_alt/((takeoff_vel)*sin(climb_aoa*pi/180));
climb_dx = t_climb*(takeoff_vel)*cos(climb_aoa*pi/180);
%% Stage 3: Cruise
%Initializing variables
accel_value = zeros(1,500);
current_vel = zeros(1,500);
max_velocity = 0;
n_thrust = zeros(1,500);
time_to_cruiseV = 0;
t_cruiseV_count = 0;
timestep = 0.1;
thrust_cruise_v = 0;

95
%Loop to populate acceleration matrix and find aircraft max velocity
for t=1:1:500
if t == 1
accel_value(t) = thrust_initial/mass;
current_vel(t) = accel_value(t)*timestep;
n_thrust(t) = (1.225*(pi*((0.0254*prop_diam)^2))/4)*(((prop_RPM*.0254*prop_pitch*(1/60))^2)-
(prop_RPM*.0254*prop_pitch*(1/60)*current_vel(t)))*((prop_diam/(3.29546*prop_pitch))^1.5);
else
accel_value(t) = (n_thrust(t-1)/mass) - (.5*density*A_drag*Cd0*(current_vel(t-1)^2)/mass);
if accel_value(t) < 0
max_velocity = current_vel(t-1)
break
end
current_vel(t) = current_vel(t-1)+accel_value(t)*timestep;
if current_vel(t) > v_cruise
time_to_cruiseV = t*0.1;
t_cruiseV_count = t;
thrust_cruise_v = n_thrust(t-1);
current_vel(t);
break
end
n_thrust(t) = (1.225*(pi*((0.0254*prop_diam)^2))/4)*(((prop_RPM*.0254*prop_pitch*(1/60))^2)-
(prop_RPM*.0254*prop_pitch*(1/60)*current_vel(t)))*((prop_diam/(3.29546*prop_pitch))^1.5);
end
end
%Power (in watts) required for cruising velocity
power_for_cruise = n_thrust(1)*current_vel(t_cruiseV_count)
% %Finding if max velocity is greater than desired cruising velocity
% if max_velocity < v_cruise
% fail = 1;
% break
% end
%Time required to accelerate to cruise V
t_accel_2_cruiseV = time_to_cruiseV - t_takeoff;
%Finding distance covered while accelerating to cruise_V

96
cruiseV_accel_dx = 0;
accel_total = 0;
for y = t_count:1:t_cruiseV_count
if y == 1
cruiseV_accel_dx = 0.5*accel_value(y)*timestep^2;
else
cruiseV_accel_dx = cruiseV_accel_dx + current_vel(y-1)*timestep + 0.5*accel_value(y)*timestep^2;
end
end
cruiseV_accel_dx
%Total dx when cruise velocity is reached
dx_total_preCruise = cruiseV_accel_dx + takeoff_dx + climb_dx;
%Calculating total time during cruise phase
t_cruise = ((6000*12*2.54/100)-dx_total_preCruise)/v_cruise;
%% Stage 4: Turns
%assuming level turn
%order or operaions
% 1. Choose appripriate radius of turn
% 2. Use this value and your chosen cruising velocity to calculate load
% factor (should be around 1.3-1.5)
% 3. Determine the necessary bank angle of the aircraft
% Enter desired radius of turn
r_turn = 50;
turn_length = pi*r_turn;
%Calculating load factor
n = sqrt(((v_cruise^2)/(9.8*r_turn))^2 + 1)
%Calculating bank angle
bank_angle = asind(sqrt(1-(1/(n^2))))
%Calculating time spent turning
t_turn = turn_length/current_vel(t_cruiseV_count);
total_t_turn = 12*t_turn;

97
% %calculating total time of flight
t_total = t_takeoff + time_to_cruiseV + t_climb + +t_cruise + total_t_turn

100
Appendix F – CAD Package

101
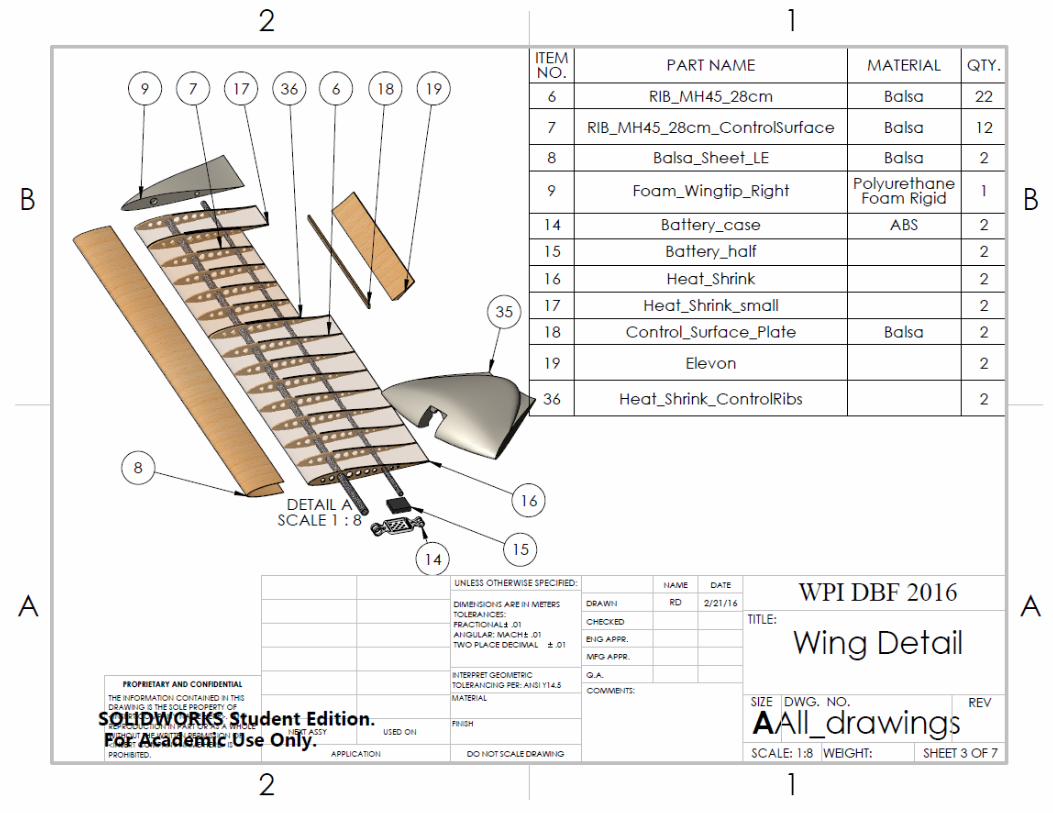
102

103

104

105

106

107
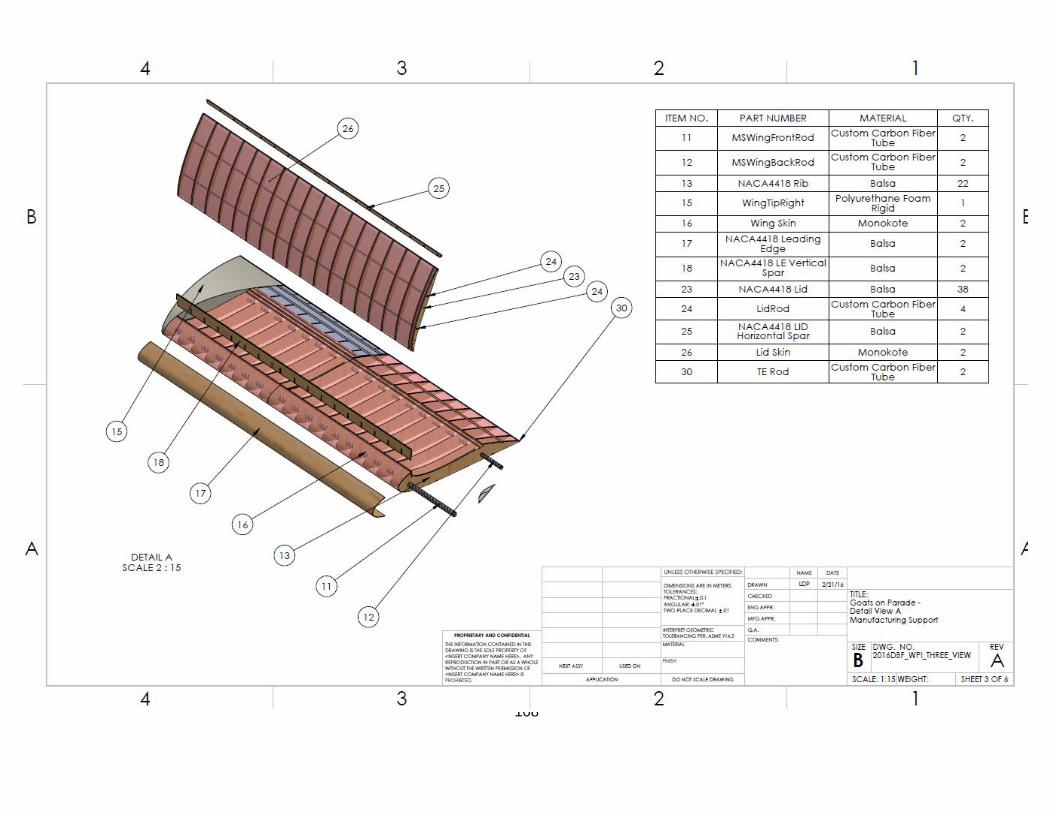
108

109
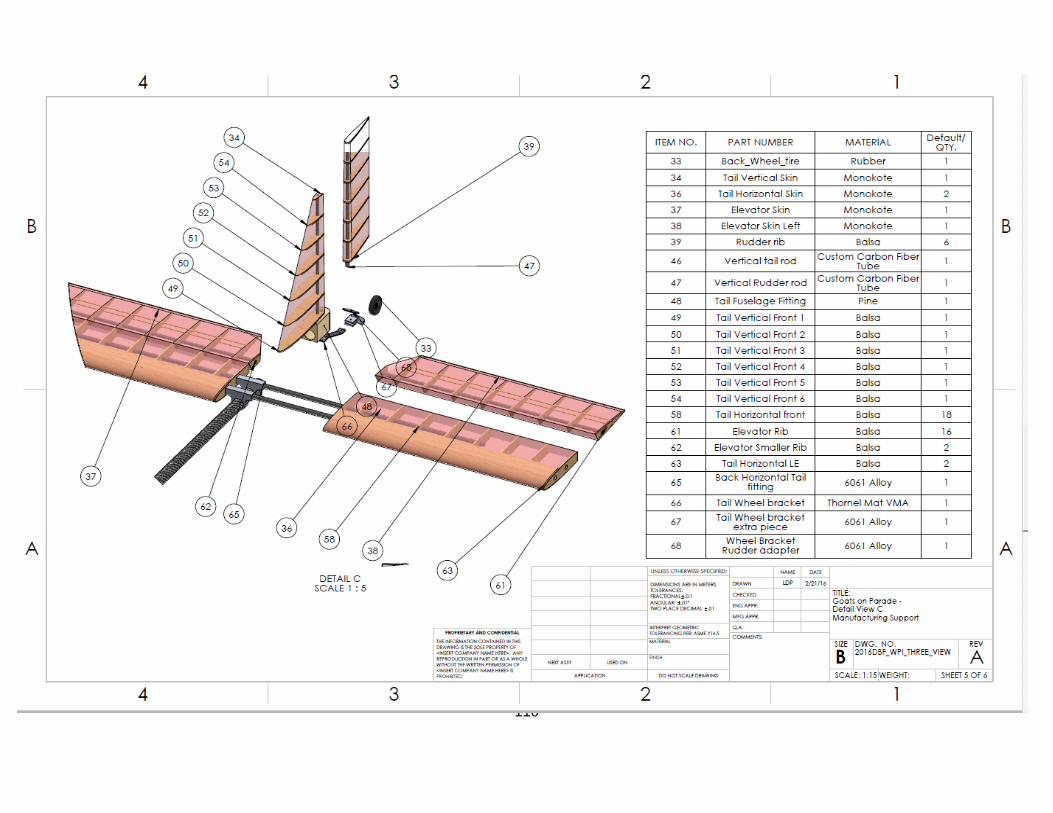
110

111

112

113

114
References
[1] Newcome, Lawrence. Unmanned Aviation: A Brief History of Unmanned Aerial Vehicles.
Reston: American Institute of Aeronautics and Astronautics, 2004. Web
[2] "Design, Build, Fly Competition." AIAA Shaping the Future of Aerospace. American Institute
of Aeronautics and Astronautics, 2015. Web. 24 Apr. 2016.
[3] "2015/16 Rules and Vehicle Design." Design Build Fly 2015/16 Contest Year 20th Annual
Event. AIAA, Oct. 2015. Web. 31 Oct. 2015.
[4] Raymer, Daniel P. Aircraft Design: A Conceptual Approach. 5th ed. Reston: American
Institute of Aeronautics and Astronautics, 2012. Print.
[5] Crathern, Kyle, Reinaldo Fonseca Vieira Lopes, Timothy Momose, and Neil Pomerleau.
Micro Aircraft Competition Design: Flying Wing. Worcester: Worcester Polytechnic
Institute, 2013. Web.
[6] "Bending Thermal Stresses in Plates." Design for Thermal Stresses Barron/Design for
Thermal Stresses (2011): 264-316. Web.
[7] CES EduPack. Computer software. Granta Material Intelligence, n.d. Web. Sept. 2015.
[8] DBF Logo. N.d. Design Build Fly 2015/16 Contest Year 20th Annual Event. Web. 10 Sept.
2015.