design and measurement of a flat dielectric lens … · using a planar near-field scanner and the...
TRANSCRIPT

AALTO UNIVERSITY School of Electrical Engineering Department of Radio Science and Engineering Kalle Piiroinen
DESIGN AND MEASUREMENT OF A FLAT DIELECTRIC LENS ANTENNA FOR BEAM STEERING
The thesis was submitted in partial fulfilment for the degree of Master of Science in Espoo, 25.9.2013 Supervisor Professor Antti Räisänen Instructor Juha Ala-Laurinaho, D.Sc. (Tech.)
II
Abstract of the Master’s Thesis
Author: Kalle Piiroinen
Title of the Thesis: Design and measurement of a flat dielectric lens antenna for beam steering
Date: 25.9.2013 Number of pages: 9 + 59
Department: Department of Radio Science and Engineering
Professorship: Radio Engineering, S-26
Supervisor: Professor Antti Räisänen
Instructor: Juha Ala-Laurinaho, D.Sc. (Tech.)
Language: English
In this thesis, flat hemi-elliptic dielectric lens antennas are studied at millimeter wavelengths. The used lens materials are teflon and a commercial plastic called preperm450, developed specifically for high frequency antenna applications. The main focus of this work is in the beam steering properties of the antennas. Proposed antenna structure is suitable for, e.g., automotive radar applications.
Two different lens configurations are studied, one based on a dielectric slab waveguide and another based on a parallel plate waveguide. The design process for both antenna types is presented in detail and the antenna structures are simulated using commercial simulation software. Both antennas are fed with a WR-10 waveguide.
Four prototype antennas (one of each type, and of both materials) are manufactured using water jet cutting. Manufactured antennas are measured using a planar near-field scanner and the results are compared with the simulated results. In the measurements and simulations beam steering is realized by changing the positioning of the waveguide feed.
The measurement results follow the simulation results to a large extent and confirm the suitability of the proposed antenna structure for beam steering applications at millimeter wavelengths. The low relative permittivity of teflon lenses limits the maximum beam steering angle, especially with the dielectric slab extended lens. Preperm450 proves to be a viable option when choosing materials for dielectric lenses and beam steering angles up to 15o can be achieved with small feed offsets.
Key words: beam steering, hemi-elliptical, integrated lens antenna, dielectric slab waveguide, parallel-plate waveguide

III
Diplomityön tiivistelmä
Tekijä: Kalle Piiroinen
Työn nimi: Keilanohjaukseen soveltuvan litteän dielektrisen linssiantennin suunnittelu ja mittaus
Päiväys: 25.9.2013 Sivumäärä: 9 + 59
Osasto: Radiotieteen ja -tekniikan laitos
Professuuri: Radiotekniikka, S-26
Valvoja: Professori Antti Räisänen
Ohjaaja: TkT Juha Ala-Laurinaho
Kieli: Englanti
Teknologian nopea kehittyminen on mahdollistanut millimetriaaltoalueen käyttöönoton mm. tiedonsiirrossa ja tutkasovelluksissa, mikä on myös kasvattanut mielenkiintoa dielektrisiä linssiantenneja kohtaan. Millimetriaaltoalueella linssiantennien fyysiset mitat ovat pieniä, mikä mahdollistaa niiden käytön myös liikuteltavissa sovelluksissa.
Tässä diplomityössä tutkitaan litteitä dielektrisiä linssiantenneja E-taajuuskaistan (71 – 86 GHz) sovelluksiin. Tutkimuksen suurin mielenkiinnon kohde on antennien keilanohjausominaisuudet, joita tutkitaan syöttöpistettä muuttamalla. Litteä linssiantenni tarjoaa viuhkamaisen keilan, jota keilaamalla voidaan kattaa laajoja alueita. Tämä mahdollistaa tutkitun antennityypin käytön esimerkiksi autotutkissa.
Työssä käsitellään kahdenlaisia antennikonfiguraatioita. Ensimmäinen koostuu linssistä, syöttöantennista ja tukirakenteista, kun taas jälkimmäisessä linssi on suljettu kahden metallilevyn väliin. Käytetyt linssimateriaalit ovat teflon ja preperm450, joka on varta vasten korkean taajuuden antennisovelluksiin suunniteltu kaupallinen muovimateriaali.
Linssien suunnitteluprosessi on kuvailtu yksityiskohtaisesti ja fyysiset mitat optimoitiin tietokoneohjelmiston avulla. Suunnitelluista antenneista valmistettiin neljä erilaista antenniprototyyppiä, jotka mitattiin lähikenttä-skannerin avulla.
Mittaustulosten ja tietokonesimulaatioiden vertailu osoittaa, että antenniprototyyppien mitattu toiminta mukailee hyvin simuloitujen linssien toimintaa. Teflonlinsseillä keilanohjausta rajoittaa matala suhteellinen permittiivisyys, mutta preperm450 osoittautuu hyvin soveltuvaksi dielektristen linssien valmistusmateriaaliksi.
Avainsanat: keilanohjaus, hemielliptinen, integroitu linssiantenni, dielektrinen liuskajohto, levyaaltoputki
IV
Preface
This Master’s thesis is carried in the Millimetre wave and THz techniques research
group in the Department of Radio Science and Engineering (RAD) of the Aalto
University School of Electrical Engineering between February and September 2013.
The measurements for this research were conducted at RAD in MilliLab, which is a
joint institute between the Technical Research Centre of Finland (VTT) and the Aalto
University, and an external laboratory of the European Space Agency (ESA). This
work if partially funded by the Academy of Finland through their Centre of
Excellence program SMARAD and by TEKES through BEAMS project. Premix
Corporation is acknowledged for providing lens materials for this study.
I’d like to thank Professor Antti Räisänen for providing me with the opportunity to
work here at the Department of Radio Science and Engineering, and for supervising
this thesis. I’d also like to thank my instructor Juha Ala-Laurinaho, D.Sc. (Tech.) for
his expert guidance throughout this process. I’m especially grateful to Aki Karttunen,
D.Sc. (Tech.) for his opinions, guidance, observations, and instructions during this, as
well as all the previous projects. Lastly, I’d like to express my gratitude to my friends
and family who made the past eight months so much easier.
In Otaniemi, Espoo, 19.9.2013
Kalle Piiroinen

V
Contents
Abstract of the Master's thesis II
Diplomityön tiivistelmä III
Preface IV
Contents V
List of abbreviations VI
List of symbols VII
1 Introduction 1
2 Dielectric lens antennas 3
3 Dielectric slab waveguide 5
3.1 Geometry of the dielectric slab waveguide. . . . . . . . . . . 5
3.2 Fields in the dielectric slab waveguide . . . . . . . . . . . . . 7
3.2.1 TE modes . . . . . . . . . . . . . . . . . . . . . . . . . . . . . . . 9
3.2.2 Symmetric and anti-symmetric modes . . . . . . . . . 9
3.2.3 TM modes. . . . . . . . . . . . . . . . . . . . . . . . . . . . . . . 12
3.3 Cut-off frequency. . . . . . . . . . . . . . . . . . . . . . . . . . . . . . 13
4 Lens design 14
5 Electromagnetic simulations 20
5.1 Optimization of the dielectric extension . . . . . . . . . . . . . 21
5.2 Microwave absorbers. . . . . . . . . . . . . . . . . . . . . . . . . . . 23
6 Other lens configurations 26

VI
6.1 Parallel plate teflon lens . . . . . . . . . . . . . . . . . . . . . . . . . 26
6.1.1 Lens design and simulation . . . . . . . . . . . . . . . . . . 28
6.2 Thick preperm450 lens . . . . . . . . . . . . . . . . . . . . . . . . 30
6.2.1 Thick preperm450 lens with parallel plates. . . . 31
6.3 Comparison between the two lens configurations . . . . . 32
7 Measurements 36
7.1 Antenna measurements . . . . . . . . . . . . . . . . . . . . . . . . . 36
7.2 Prototype antennas and the measurement setup . . . . . 38
8 Results 41
8.1 Far-field pattern measurements . . . . . . . . . . . . . . . . . . . 41
8.1.1 Losses . . . . . . . . . . . . . . . . . . . . . . . . . . . . . . . . . 44
8.2 Cross-polarization measurement . . . . . . . . . . . . . . . . . . 46
8.3 Beam steering measurements. . . . . . . . . . . . . . . . . . . . 47
8.3.1 Preperm450 lenses. . . . . . . . . . . . . . . . . . . . . . . 47
8.3.2 Teflon lenses. . . . . . . . . . . . . . . . . . . . . . . . . . . . 49
8.4 Summary . . . . . . . . . . . . . . . . . . . . . . . . . . . . . . . . . . . . 51
9 Conclusion 53
References 55

VII
List of abbreviations
2-D Two-dimensional
3-D Three-dimensional
AUT Antenna under test
CATR Compact antenna test range
DSW Dielectric slab waveguide
DUT Device under test
EM Electromagnetic
FEA Finite element analysis
FEM Finite element method
FSLL First side-lobe level
HFSS High frequency structure simulator
HPBW Half-power beamwidth
MEMS Micro-electro-mechanical systems
PPW Parallel plate waveguide
RF Radio frequency
SLL Side-lobe level
TE Transverse electric
TM Transverse magnetic
XP Cross-polarization

VIII
List of symbols
a Minor axis of an ellipse
A Constant
b Major axis of an ellipse
B Constant
c Focal point of an ellipse, speed of light
C Constant
c0 Speed of light in a vacuum
d Half of lens thickness
D Antenna dimension, Directivity, constant
e Eccentricity, exponential function
Amplitude of electric field
Electric field
f Frequency
fc Cut-off frequency
f(x) Arbitrary function of x
G Gain
Amplitude of magnetic field
Magnetic field
k0 Free-space propagation constant
kx Propagation constant into the x-direction
L Dielectric extension length
m Order of wave mode, index
n Index of refraction, order of wave mode
n1 Index of refraction of the cladding
n2 Index of refraction of the dielectric medium
neff Effective index of refraction
r Distance, spherical coordinate
R Radius
t Time
Dielectric loss tangent
Magnetic loss tangent
x Cartesian coordinate
y Cartesian coordinate
z Cartesian coordinate
α Attenuation constant
Phase constant
ΔL Correction in the dielectric extension length
ε Permittivity
ε0 Permittivity of free space

IX
εr Relative permittivity
ϴ Spherical coordinate
ϴ0 Angle of incidence
ϴ1 Angle of reflection, angle of refraction
ϴ3dB Half-power beamwidth in E-plane
ϴc Critical angle
λ Wavelength
λ0 Wavelength in free space
μ Permeability
μ0 Permeability of free space
μr Relative permeability
ϕ3dB Half-power beamwidth in H-plane
ϕ Spherical coordinate
ω Angular frequency

1
1. Introduction
The interest towards dielectric lens antennas has been increasing continuously during recent years
due to the advancement of technologies operating at the mm-wave frequencies (30 – 300 GHz). At
these frequencies the physical size and weight of the antennas become relatively small, hence making
dielectric lens antennas an attractive antenna solution, especially for mobile applications. In addition,
dielectric lens antennas traditionally offer a high gain at a low cost, and a shapeable radiation pattern.
[1 – 3]
One reason for the increased interest towards dielectric lens antennas is the growing demand for
devices with beam steering capability, i.e., changing the direction of the main beam of the radiation
pattern [4]. Typical applications exploiting steerable beams include radar [5], imaging tools [6], free-
space optical communication systems [7].
Beam steering can be realized either mechanically or electrically. Mechanical beam steering is
typically implemented with reflector antennas which are rotated in order to change the direction of
the main lobe, whereas electrical beam steering is realized by modifying the feed antenna. Recently,
electrical beam steering has become more attractive due to the small size and light weight of the
devices at mm-wave frequencies. Electrical beam steering can be realized in several ways, including
use of phased arrays [8], phase shifters based on micro-electro-mechanical systems (MEMS) [9], and
dielectric lenses with feed antenna array on focal plane. [10, 11]
A solution for beam steering in one dimension at E-band (71 – 86 GHz) using a planar dielectric lens
antenna fed with an open-ended waveguide is presented in this thesis. A fan shaped beam makes the
proposed antenna structure especially desirable for scanning radars, e.g., automotive radar, while the
relatively small size of the antenna makes it suitable for portable devices.
This thesis is structured as follows: Chapter 2 offers a short overview of dielectric lens antennas and
their structure. Chapter 3 concentrates on the underlying theory behind flat dielectric slab waveguide

2
extended lens antennas, including an elaborate and complete field solutions starting from the general
wave equation. In Chapter 4 the design process of the lens antennas is presented and physical
dimensions are calculated. Chapter 5 describes the computer simulation process and optimization
procedure, as well as discusses the importance of microwave absorbers surrounding the antenna.
Chapter 6 concentrates on the other studied lens configurations. Theory, design process, and
simulation of all the lenses are covered. Antenna measurements and the manufacturing of the
prototype antennas are discussed in Chapter 7. Measurement results are presented and discussed in
Chapter 8, followed by concluding remarks in Chapter 9.

3
2. Dielectric lens antennas
Dielectric lens antennas are fairly simple structures consisting of two main parts: the feed and the
lens. The feed can be positioned either behind the lens, for example in the case of a cylindrical lens
antenna (Figure 1a), or attached to the dielectric material, like in integrated lens antennas (Figure 1b).
This chapter concentrates on integrated lens antennas.
The feed can be essentially any kind of radiator, although in practice the vast majority of the used
feeding mechanisms are microstrip patch antennas, horn antennas, and open-ended waveguides.
Lenses are typically used to convert a spherical wave into a plane wave, and to increase directivity
compared to the plain feed antenna by collimating the radiated power into a desired direction. In
some cases, the collimation is done only in one dimension resulting in wider, fan-shaped beams which
can be used for scanning purposes. [12]
Figure 1: a) Cylindrical dielectric lens antenna [12] and b) Integrated dielectric lens antenna [13].
Microstrip antennas are low-profile, low-cost, and easy to manufacture, hence offering a viable
feeding option for integrated lens antennas. Microstrip patch antennas can be designed specifically
for a certain frequency which enables simultaneous optimization of the lens and the feed. The most
significant disadvantages of patch antennas are the narrow bandwidth and losses that increase with
4
frequency, which make the microstrip antennas less desirable at higher frequencies. If the broadband
characteristic of the lens antennas needs to be exploited, horn antennas or open-ended waveguides
can be used as feeding mechanisms. Both are easy to implement and excite, but horn antennas offer
a higher gain and provide better optimization possibilities. The biggest downside in both cases is the
bulky nature which limits the integrability. [12, 14]
Large number of studies has been published regarding integrated dielectric lens antennas.
Traditionally, lenses are symmetrical and three-dimensional (3-D) with varying shapes, such as
hemispherical (e.g., [15 – 17]) or ellipsoidal (e.g., [1, 18]). Especially hemispherical lenses are often
designed based on Lüneburg’s principle. The idea is that the relative permittivity changes from the
center to the surface, starting from 2.0 in the middle and following equation
where R is the radius of the lens, and r is the radial distance from the center. An ideal Lüneburg lens is
a complete sphere but the principle can be expanded to hemispherical lenses. In practice,
manufacturing of an ideal Lüneburg lens is not feasible but it can be approximated by using several
layers of materials with different values of relative permittivity. [19, 20]
Recent studies have shown that in addition to aforementioned symmetrically shaped lenses, different
optimization methods, such as genetic algorithms and particle swarm optimization, can be used to
design lenses of arbitrary shapes. Lens shape optimization allows the designer to synthesize lenses
based on the desired radiation pattern. The design goal can be, for example, a maximum directivity or
a pattern with a certain characteristic, e.g., a flat top. Optimization methods have been applied in lens
design in, e.g., [21 – 24].
Lenses with flat, effectively two-dimensional (2-D) structures have also been studied (e.g., [25, 26]),
although not as extensively as three-dimensional ones. Flat lenses offer some advantages compared
to 3-D lenses, most meaningful being the small physical size, which can be extremely beneficial in
mobile applications. With 2-D lenses, the thickness of the lens is an important factor in the design
process, and the field analysis is performed in a similar manner as in the design of dielectric slab
waveguides. This analysis is covered in detail in Chapter 3.
(
)
(2.1)

5
3. Dielectric slab waveguide
The field solutions within a flat lens can be found by studying a dielectric slab waveguide (DSW),
which consists of a dielectric slab surrounded by another dielectric material or air. Fields in the DSW
can be solved in a similar manner as in a traditional dielectric rectangular waveguide. The only
difference is that some permittivity corrections are required due to the fact that the fields propagate
partly as surface waves. Permittivity corrections decrease the effective relative permittivity in
comparison to the relative permittivity of the DSW material, hence increase the propagation constant
within the waveguide. Section 3.1 gives a detailed description of the DSW while Section 3.2
concentrates on the fields within the DSW, starting from the general wave equation. In Section 3.3
cut-off frequency for different wave modes is derived.
3.1. Geometry of the dielectric slab waveguide
The geometry of a DSW with a thickness of 2d is presented in Figure 2. For the purpose of the
analysis, the width and length of the slab are considered to be large compared to the thickness of the
slab. Propagation of the wave depends heavily on the angle of incidence If the angle is too large,
becomes too small and the ray does not reflect from the inner wall of the waveguide. The
minimum value of required for a total internal reflection to occur is called the critical angle . If
> the ray will reflect and continue to propagate inside the waveguide, whereas if < the ray
will partly refract into the cladding. A condition for can be determined based on Snell’s law.

6
Figure 2: Geometry of a dielectric slab waveguide. [27]
Snell’s law states that the relation between the angle of incidence and the angle of refraction is equal
to the inverse of the ratio of the indices of refraction [28]. For the critical angle, Snell’s law can be
written as
(3.1)
and the phase constant (into the direction of y-axis in Figure 2) in the slab can be written as
(3.2)
Based on these equations and the condition for the total internal reflection, limits for can be
derived as
(3.3)
The free-space wavenumber k0 and the phase constant can be used to define the effective index of
refraction of the DSW as
(3.4)
which can be inserted into (3.3) resulting in
(3.5)

7
3.2. Fields in the dielectric slab waveguide
Extensive treatments regarding the field solutions in the DSW can be found from the literature. This
section is largely based on the theory provided in [27, 29 – 32].
General solutions for the electric and magnetic fields in a homogenous waveguide are known and can
be written in time-harmonic form as
( ) ( ) (3.6)
( ) ( ) (3.7)
where subscript m refers to the wave mode in question. Inserting (3.6) into the general homogenous
wave equation
(3.8)
results in
(
) (3.9)
where µ is the permeability, is the permittivity, and n is the index of refraction of the corresponding
domain. The angular frequency ω is given by
(3.10)
where f is the operating frequency and c is the speed of light
√ (3.11)
Equation (3.9) is a constant coefficient equation which has a well-known general solution of an
exponential form. The solution is different for each part of the waveguide. Within the dielectric
(|x|< d) the solution is
( ) (3.12)
where kx is the propagation coefficient into the direction of x-axis, given by
8
√
(3.13)
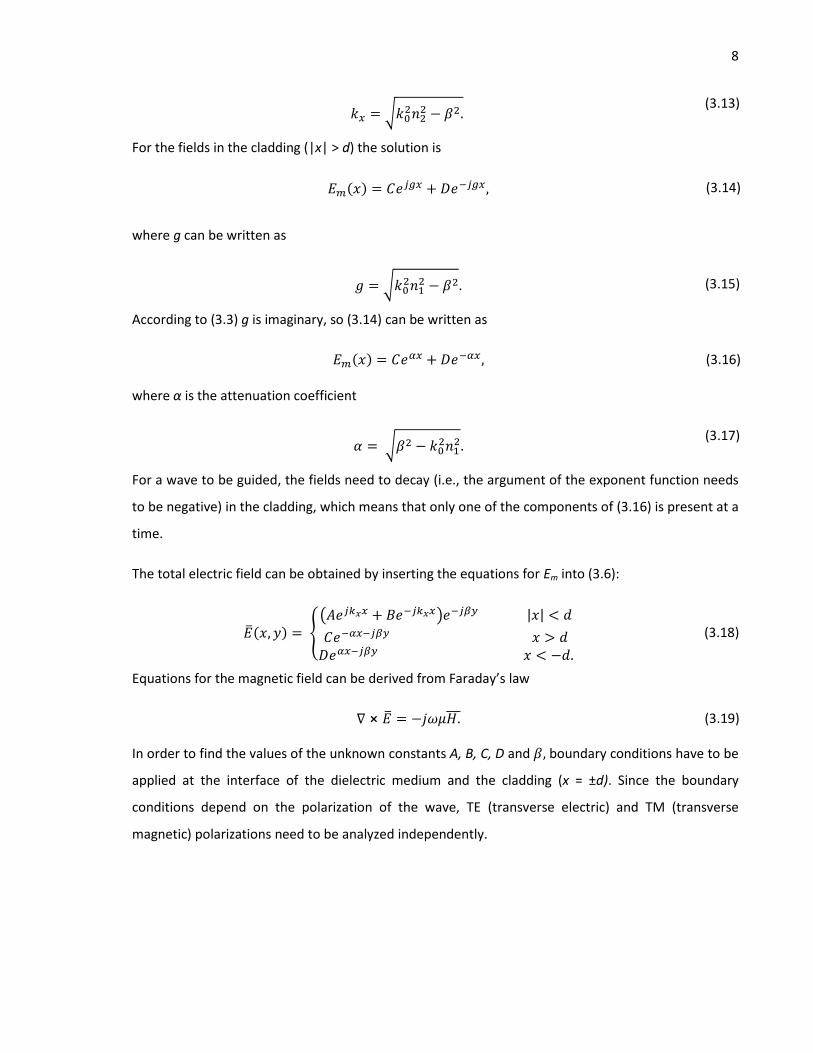
For the fields in the cladding (|x| > d) the solution is
( ) (3.14)
where g can be written as
√
(3.15)
According to (3.3) g is imaginary, so (3.14) can be written as
( ) (3.16)
where α is the attenuation coefficient
√
(3.17)
For a wave to be guided, the fields need to decay (i.e., the argument of the exponent function needs
to be negative) in the cladding, which means that only one of the components of (3.16) is present at a
time.
The total electric field can be obtained by inserting the equations for Em into (3.6):
( ) {( ) | |
(3.18)
Equations for the magnetic field can be derived from Faraday’s law
(3.19)
In order to find the values of the unknown constants A, B, C, D and boundary conditions have to be
applied at the interface of the dielectric medium and the cladding (x = ±d). Since the boundary
conditions depend on the polarization of the wave, TE (transverse electric) and TM (transverse
magnetic) polarizations need to be analyzed independently.

9
3.2.1. TE modes
In the case of TE polarization, the electric field is normal to the direction of propagation, i.e., the
electric field has only a y-component. In this case the magnetic field has both x- and z-components.
The boundary conditions state that the tangential components of the electric and magnetic fields are
continuous over the dielectric – cladding interface. Taking into account the orientation of the electric
field, Equation (3.19) results in
( )
(
) (3.20)
which means that the magnetic field is continuous if the derivative of the electric field is continuous
across the x = ± d boundaries.
The boundary conditions for the electric field can be written as
( ) ( ) (3.21)
( ) ( ) (3.22)
and for the derivative of the electric field as
( ) ( ) (3.23)
( ) ( ) (3.24)
These equations can be re-ordered to produce
{
( ) ( )
( ) ( )
( ) ( )
( ) ( )
(3.25)
3.2.2. Symmetric and anti-symmetric modes
The symmetric geometry and homogeneous index of refraction mean that the fields inside the
waveguide will be either symmetric (even) or anti-symmetric (odd) with respect to the yz-plane. This
means that the solutions for TE and TM modes need to be divided further into symmetric and anti-
symmetric cases. To illustrate this behavior, an arbitrary function f(x) can be used as an example: by

10
definition, f is even if f(x) = f(-x) and odd if f(x) = -f(-x) [33]. These definitions can be applied to (3.18)
which will help in solving the unknown parameters A, B, C, and D.
Starting with the fields at x = ± d, for even modes the result is
( ) ( ) ⇒
⇒ (3.26)
For odd modes the analysis is essentially identical but results in C = −D.
Within the waveguide, for even modes
( ) ( ) ⇒ ( ) ( ) ( ) ( )
⇒ ( )
⇒
(3.27)
and for odd modes
( ) ( ) ⇒ ( ) ( ) ( ) ( )
⇒ ( )
⇒
(3.28)
Now these results can be applied to the boundary conditions (3.25). For even modes this results in
{ ( )
( ) (3.29)
which can be simplified to
( ) (3.30)
Similarly for odd modes:
{ ( )
( ) (3.31)
which results in
( ) (3.32)
Combining these results with (3.13) and (3.17) results in
( √
)
( √
)
(3.33)

11
where
(3.34)
The equations are transcendental, meaning that they have to be solved numerically using computer
software or a calculator.
The equations can also be solved graphically by combining (3.13) and (3.17) into
(
) (3.35)
or if multiplied by d2:
( ) ( ) ( )
(
) (3.36)
Equation (3.36) represents a circle with a radius
√
(3.37)
where d is half of the waveguide thickness, and n2 and n1 are the indices of refraction of the dielectric
medium and the cladding, respectively. Values for α and kx can be determined by plotting the circle
together with the tangential and cotangential functions (multiplied by d) and finding the intersection
points. These values can then be used to find and neff for each wave mode.
The graphical solution is illustrated in Figure 3.

12
Figure 3: Illustration of the graphical solution of phase constant and effective index of refraction. The
solid blue lines correspond to the even modes, dashed blue lines represent the odd modes, and the
solid black line is a circle with a radius R defined by (3.37).
3.2.3. TM modes
The process for finding the fields of the TM modes is very similar to the case of the TE modes. Now
the magnetic field is oriented into the y-direction and the electric field has x- and z-components. The
equation for the magnetic field is
( ) ( ) (3.38)
where Hm(x) is the solution to the wave equation
( ) { ( ) ( ) | |
(3.39)
where α and kx are defined the same way as in the case of TE modes. Again, boundary conditions are
applied and the conditions for symmetric and anti-symmetric TM modes become

13
{
( )
( )
(3.40)
It is worth noting that if the DSW is surrounded by air, i.e., n1 = 1, the conditions for the TE and TM
modes are the same.
3.3. Cut-off frequency
Equation (3.37) can be used to determine the cut-off frequency for each wave mode if the waveguide
thickness is known. Conversely, if the operating frequency is known, the minimum waveguide
thickness for each mode can be determined. Radius R can be replaced with mπ/2 (zeros of the
tangential and cotangential functions), where m corresponds to the studied mode, TEm or TMm. In
order to find the cut-off frequency fc, (3.37) can be re-ordered into
√
⇒
√
(3.41)
where 2d is the thickness of the lens, n1 and n2 are the indices of refraction of the surroundings and
the dielectric medium, and c0 is the speed of light in a vacuum. The equation shows that for the
fundamental wave modes TM0 and TE0 the cut-off frequency is 0 Hz, meaning that they are always
propagating and guided. This indicates that there are no theoretical limitations regarding the
minimum thickness of the waveguide, which can be beneficial when designing 2-D lens structures.
It is often desired that only the fundamental wave mode is propagating so the higher order wave
modes do not disturb the operation of the waveguide. Equation (3.41) can be used to find the
maximum thickness for single-mode propagation if the operating frequency f is known:
√
(3.42)

14
4. Lens design
For this study, teflon and a commercial plastic preperm450 were chosen as lens materials. Teflon is
commonly used as a material for dielectric lenses due to its reasonably low price and low dielectric
losses. Preperm450 is a low-loss plastic material developed for high frequency antenna applications
by Premix corporation [34]. The dielectric properties of preperm450 were measured at 50 – 110 GHz
in [35] and were found to be
For Teflon the corresponding values are [36]
The lenses were designed for TM polarization and the mode of operation is the fundamental mode
TM0. The lenses are placed in the xy-plane and the direction of propagation is the y-direction. For TM-
polarization this means that the electric field is polarized into the direction of z-axis, and E- and H-
planes lie in yz- and xy-planes, respectively. The Cartesian and spherical coordinate systems are
defined in Figure 4.

15
Figure 4: Cartesian and spherical coordinate systems [37].
The lens is fed with a rectangular WR-10 waveguide, which has dimensions of 1.27 mm * 2.54 mm
and operates at W-band (75 – 110 GHz). Waveguide feed was chosen due to its simplicity and easy
implementation in the measurements.
In order to achieve a more realistic measurement environment, the antenna should not be assumed
to be surrounded by air. Due to the surface waves the surrounding material should be as lossless as
possible in order to avoid significant gain reductions. On the other hand, according to the equations
derived in Section 3.1 the index of refraction of the surrounding medium (n1 in Figure 2) affects the
propagation characteristics of the lens, so low relative permittivity is desired as well.
Rohacell® HF, developed by Evonik Industries, is a family of rigid and lightweight structural foam
materials designed for RF applications, especially for antennas [38]. The dielectric properties of the
used material were measured at W-band in [39] and found to be
The lens is eventually placed between two 5 mm sheets of Rohacell® HF.

16
The most important consideration in the lens design is the shape of the lens. It should be chosen as
such, that the spherical wave, radiated by the feed antenna, is converted into a plane wave. In this
study this behavior is implemented by shaping the lens as an extended hemi-ellipse. The same lens
configuration has been applied before in, e.g., [2] and [26]. The illustration of the lens structure and
formation of the plane wave is presented in Figure 5, and the design equations are presented in the
following.
General equation for an ellipse in the xy-plane is
(
)
(
)
(4.1)
where a and b are the minor and major axes, respectively. The focus points lie at
√ (4.2)
which also gives, in theory, the optimal length of the dielectric extension L. [25]

17
Figure 5: Lens structure and the formation of the plane wave [14].
From optics it is known that the eccentricity, i.e., the measure of circularity, e of an ellipse is defined
as
√
(4.3)
where neff is the effective index of refraction of the lens material [26, 33]. Now the relation between
a, b, and c can be derived as
√
(4.4)
In reality, the value for the dielectric extension suggested by (4.4) is not optimal because the phase
center of the waveguide feed is not located at the end of the waveguide, like is assumed in the above

18
analysis. This means that L needs to be tuned in order to optimize the operation of the antenna. The
optimal value for L can be found with computer simulations.
The maximum thickness for single-mode propagation at E-band ( = 86 GHz) can be calculated
from (3.42):
{
In order to ensure the single-mode propagation over the whole band, the lens thicknesses were
chosen to be 1.00 mm for teflon lens and 0.80 mm for preperm450 lens. This results in the cut-off
frequency for the first higher-order wave modes to be above 100 GHz in both cases. Furthermore, the
thickness of each lens is electrically small enough (approximately
at 78.50 GHz) for the lenses to
be treated as 2-D structures. Minor axis was chosen to be a = 25 mm. Figure 6 shows the effective
index of refraction for TM0 mode as a function of frequency at 70 – 90 GHz.
Figure 6: Effective index of refraction as a function of frequency.
Because neff is frequency-dependent, physical dimensions of the lens depend on the frequency as
well. This indicates that a lens designed for one frequency is not guaranteed to operate correctly at
another frequency. This needs to be considered in the design process when the lens antenna is

19
desired to operate over a frequency band rather than at a single frequency. In order to minimize the
frequency offset, the center of the E-band was chosen as a design frequency. From Figure 6 it can be
estimated that at 78.5 GHz
{
which can then be used to calculate the physical dimensions of the lens using (4.4). The results are
presented in Table 1.
Table 1: Physical dimensions of the designed lenses.
Material Thickness [mm] a [mm] b [mm] c = L [mm]
Teflon 1.00 25 55.9 50.0
Preperm450 0.80 25 39.3 30.3
It was discussed earlier that the cut-off frequency for the fundamental wave modes is 0 Hz, which
means that theoretically the wave can propagate in any DSW regardless of the thickness. However,
other limitations regarding the minimum thickness of the lens exist. From Figure 6 it can be seen that
the effective index of refraction is smaller at lower frequencies, eventually reaching 1.0 when the
thickness of the DSW, or the lens, reaches 0. According to (4.4), decrease of neff causes the size of the
lens to increase, which is undesirable when considering antenna solutions for portable applications.
Reduced antenna aperture also widens the beam, hence lowers the directivity and gain. Furthermore,
according to Snell’s law, the angle of refraction depends on the indices of refraction, and higher n
yields larger angle of refraction. This becomes an essential consideration in the design of beam
steering applications. Higher index of refraction could also be achieved by using materials with higher
permittivities, such as silicon or quartz, but this often results in higher losses and lower gain. A
compromise should be found between the beam steering properties and physical dimensions of the
lens while ensuring a high gain and single mode propagation at the desired frequency band.
20
5. Electromagnetic simulations
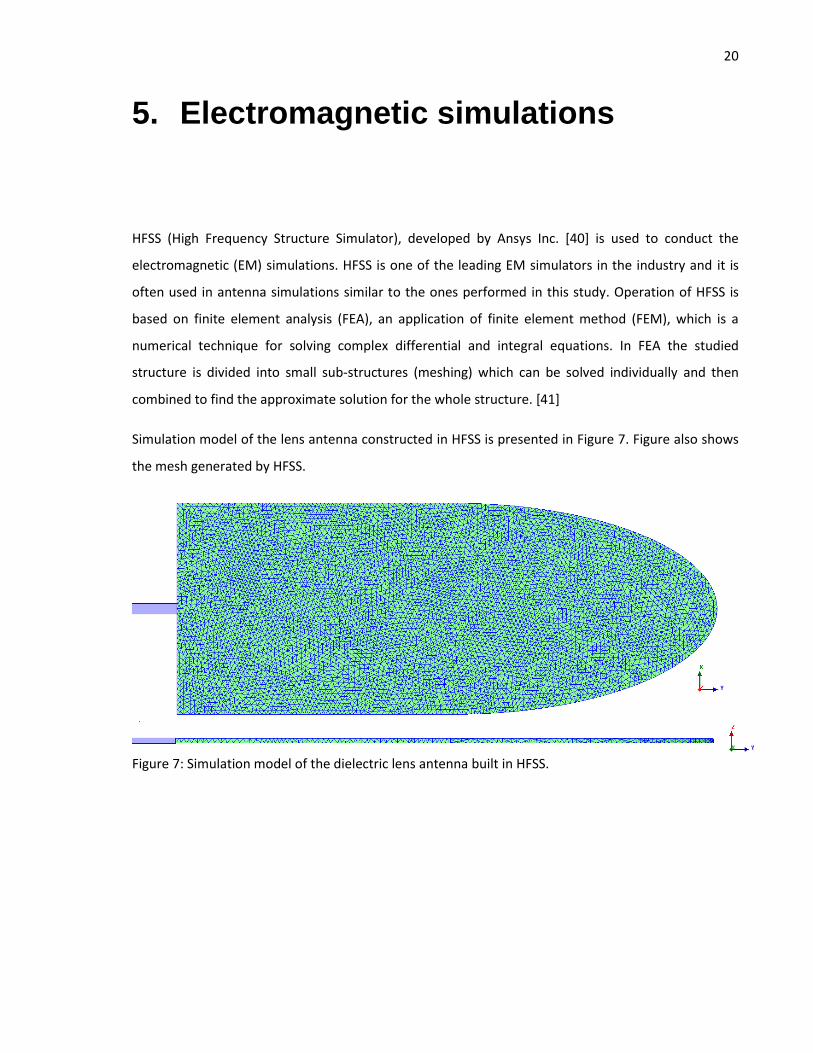
HFSS (High Frequency Structure Simulator), developed by Ansys Inc. [40] is used to conduct the
electromagnetic (EM) simulations. HFSS is one of the leading EM simulators in the industry and it is
often used in antenna simulations similar to the ones performed in this study. Operation of HFSS is
based on finite element analysis (FEA), an application of finite element method (FEM), which is a
numerical technique for solving complex differential and integral equations. In FEA the studied
structure is divided into small sub-structures (meshing) which can be solved individually and then
combined to find the approximate solution for the whole structure. [41]
Simulation model of the lens antenna constructed in HFSS is presented in Figure 7. Figure also shows
the mesh generated by HFSS.
Figure 7: Simulation model of the dielectric lens antenna built in HFSS.
21
5.1. Optimization of the dielectric extension
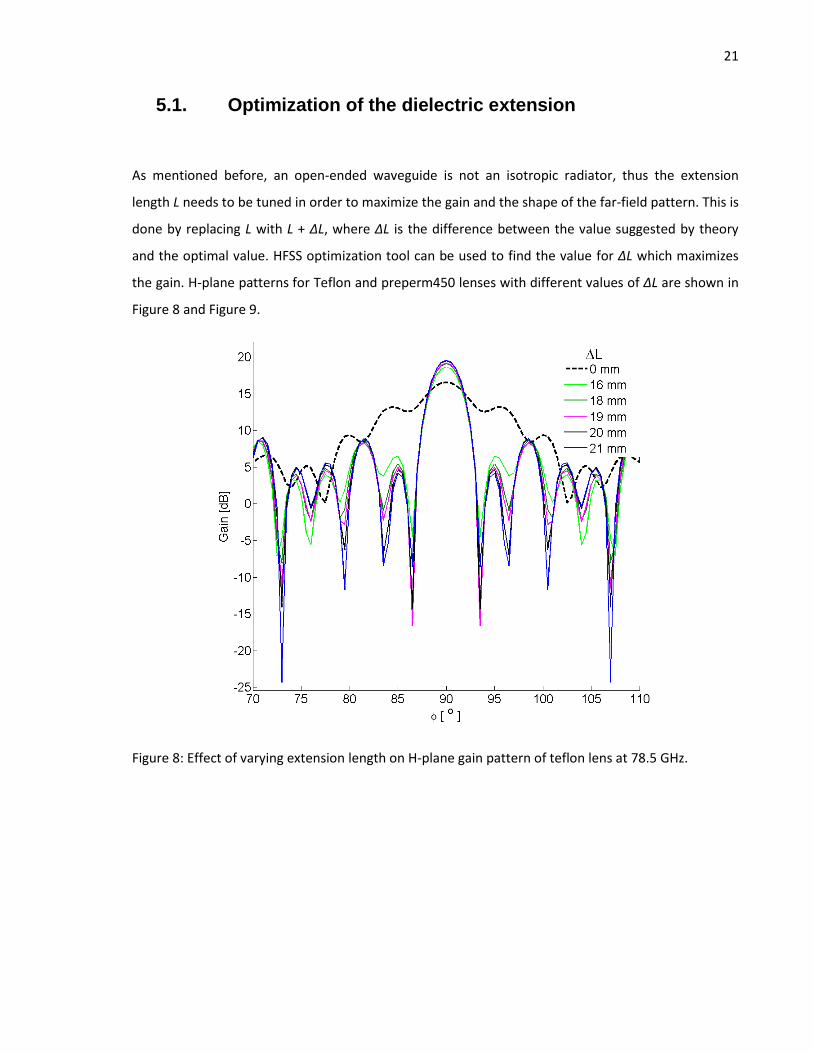
As mentioned before, an open-ended waveguide is not an isotropic radiator, thus the extension
length L needs to be tuned in order to maximize the gain and the shape of the far-field pattern. This is
done by replacing L with L + ΔL, where ΔL is the difference between the value suggested by theory
and the optimal value. HFSS optimization tool can be used to find the value for ΔL which maximizes
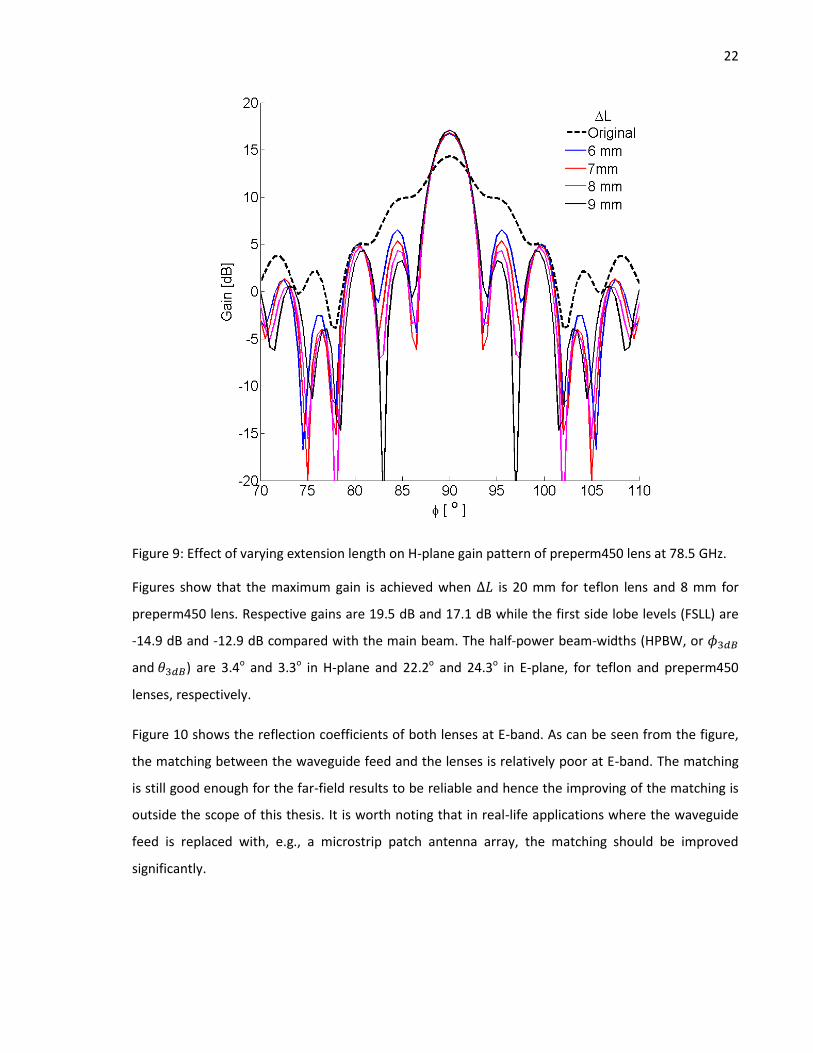
the gain. H-plane patterns for Teflon and preperm450 lenses with different values of ΔL are shown in
Figure 8 and Figure 9.
Figure 8: Effect of varying extension length on H-plane gain pattern of teflon lens at 78.5 GHz.
22
Figure 9: Effect of varying extension length on H-plane gain pattern of preperm450 lens at 78.5 GHz.
Figures show that the maximum gain is achieved when is 20 mm for teflon lens and 8 mm for
preperm450 lens. Respective gains are 19.5 dB and 17.1 dB while the first side lobe levels (FSLL) are
-14.9 dB and -12.9 dB compared with the main beam. The half-power beam-widths (HPBW, or
and ) are 3.4o and 3.3o in H-plane and 22.2o and 24.3o in E-plane, for teflon and preperm450
lenses, respectively.
Figure 10 shows the reflection coefficients of both lenses at E-band. As can be seen from the figure,
the matching between the waveguide feed and the lenses is relatively poor at E-band. The matching
is still good enough for the far-field results to be reliable and hence the improving of the matching is
outside the scope of this thesis. It is worth noting that in real-life applications where the waveguide
feed is replaced with, e.g., a microstrip patch antenna array, the matching should be improved
significantly.

23
Figure 10: Reflection coefficient S11 of both lenses at E-band.
5.2. Microwave absorbers
In order to finalize the design, microwave absorbers should be included in the simulation model.
Absorbers are very lossy materials with typical reflectivity of < -50 dB at mm-wave frequencies. They
are used to attenuate the radiated field outside the main lobe and to isolate the device under test
(DUT) from the surroundings. Absorbers are also used to capture the power radiated from the
extension part (spill-over field) ensuring that only the field radiated by the collimating part of the lens
affects the far-field pattern. [42]
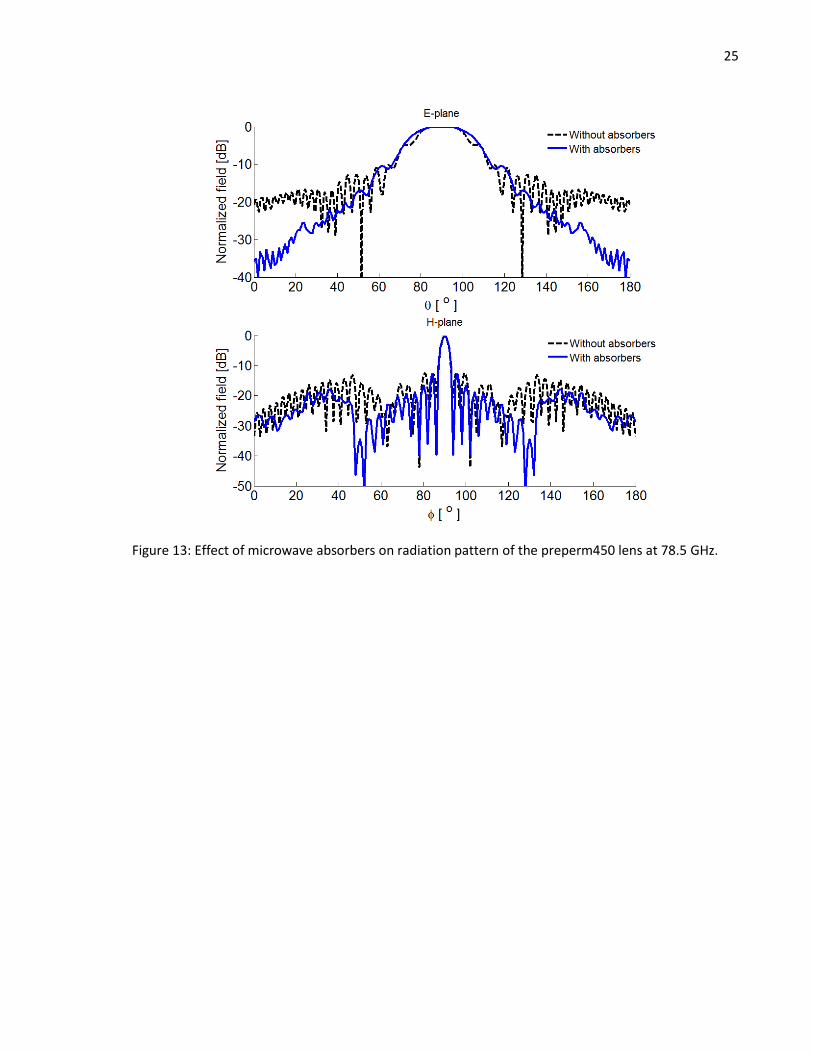
Figure 11 shows the positioning of the absorbers around the antenna and Figure 12 and Figure 13
show the effect of the absorbers on the far-field patterns.
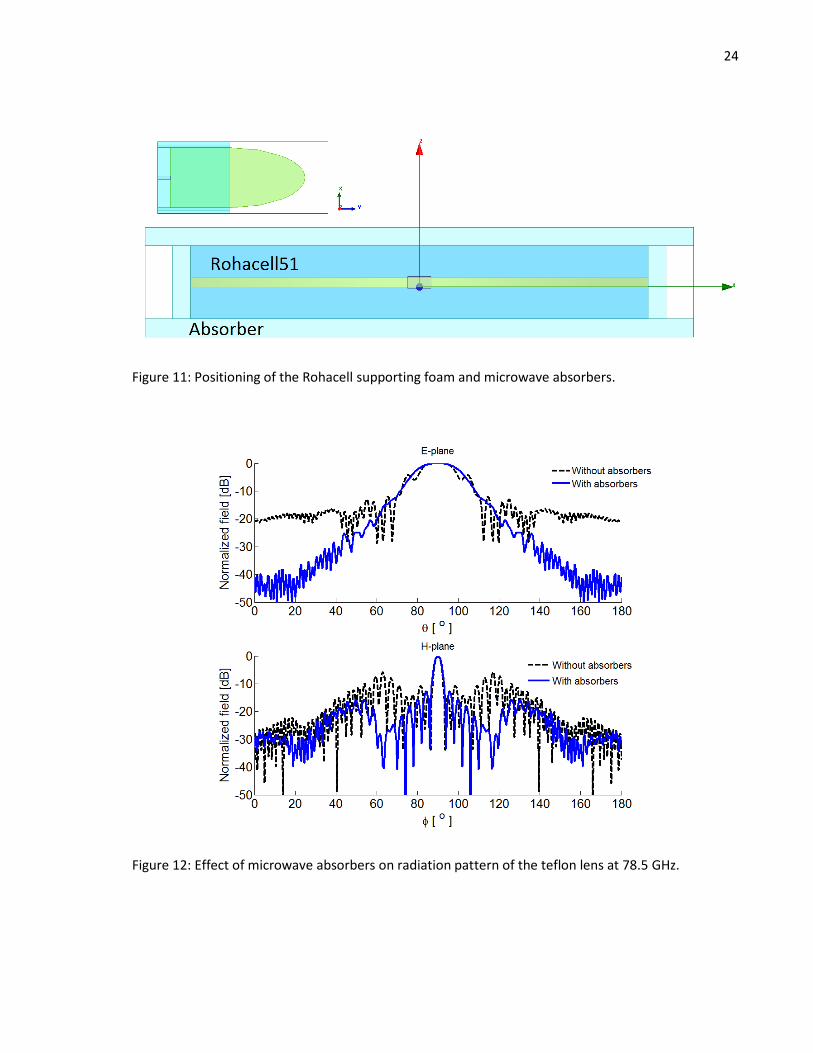
24
Figure 11: Positioning of the Rohacell supporting foam and microwave absorbers.
Figure 12: Effect of microwave absorbers on radiation pattern of the teflon lens at 78.5 GHz.
25
Figure 13: Effect of microwave absorbers on radiation pattern of the preperm450 lens at 78.5 GHz.
26
6. Other lens configurations
In addition to the antenna designed and studied in Chapter 4 and Chapter 5, some other lens
structures are studied as well. First structure, parallel plate lens, is similar to the original lens
structure but it is shielded from the top and bottom with metal plates, removing the effect of the
surrounding material. With parallel plates permittivity corrections are not required which decreases
the size of the lens. The theory behind parallel plate lenses and the design process is presented in
Section 6.1. Section 6.2 concentrates on a thicker version of the preperm450 lens with possibly
multiple propagating wave modes. While ensuring single-mode propagation would be ideal, practical
limitation prevent the manufacturing of a single-mode preperm450 lens. A thick parallel plate lens
antenna is designed as well. A comparison between the two lens configurations is performed in
Section 6.3
6.1. Parallel plate teflon lens
The structure of a parallel plate lens antenna is similar to the one presented before but in this case
the extended hemi-ellipse is shielded between two parallel metal plates. Due to the orientation of the
electric field for TM polarization, permittivity does not need to be corrected and index of refraction of
the material
√ (6.1)
is used in the lens design. [21]
Higher index of refraction presents several benefits. Firstly, according to (4.4), the physical
dimensions of the lens become smaller. Secondly, the frequency-dependence of the index of
refraction almost disappears (only the inherent dependency is left) allowing for more broadband
solutions. Lastly, metallic walls guarantee that there is no interaction between the fields and the
surroundings.
27
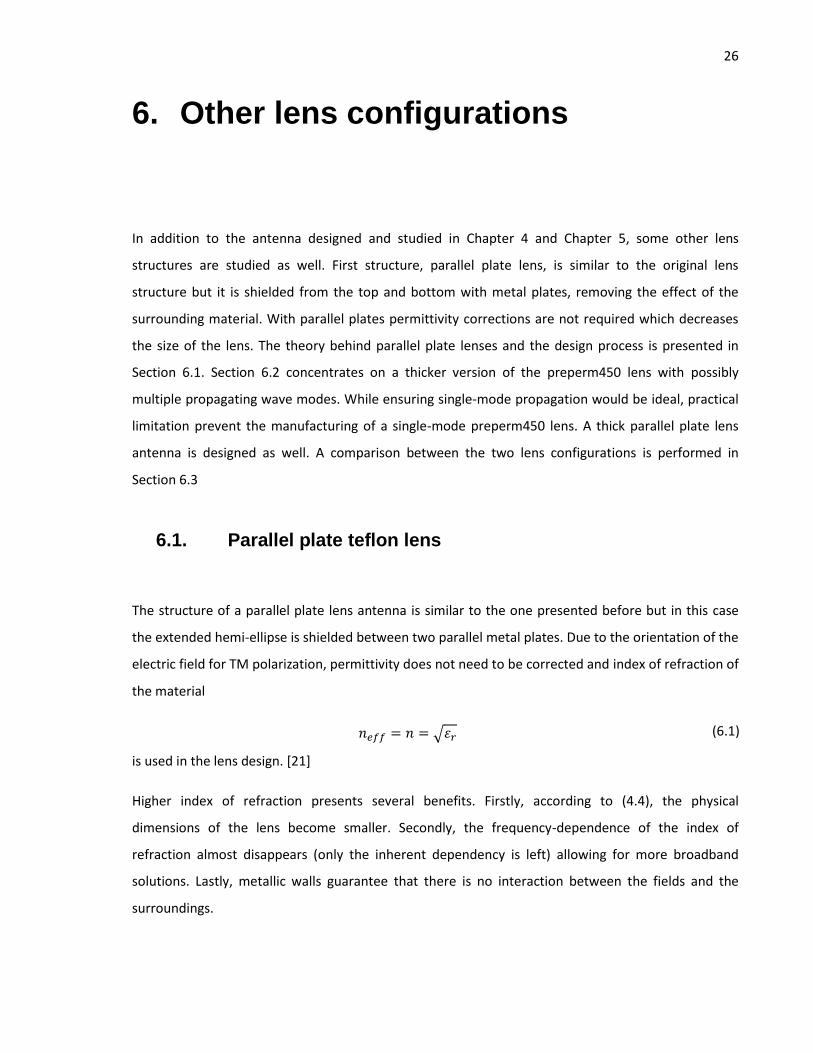
Operation of the parallel plate lens antenna is based on a parallel plate waveguide (PPW) filled with
dielectric material (Figure 14).
Figure 14: Schematic of a parallel plate waveguide.
The analysis of a parallel plate waveguide is similar to that of a traditional rectangular waveguide
(Figure 15) and detailed field analysis can be found from the literature, e.g., [43, 44] ,. However, the
condition for the cut-off frequencies change, and can be derived from that of a rectangular
waveguide [31]
√(
)
(
)
(6.2)
Where c is the speed of light, a and b are the waveguide dimensions, and m and n refer to the wave
mode in question.

28
Figure 15: Rectangular waveguide.
If is large compared to b, like in the case of a PPW, the cut-off frequency can be written as
(
) (6.3)
where n is the order of the wave mode and b is the thickness of the waveguide. For the fundamental
modes the cut-off frequency is again at 0 Hz, while for higher-order wave modes it depends on the
thickness of the waveguide and the relative permittivity of the dielectric medium:
√ (6.4)
6.1.1. Lens design and simulation
The geometry of a parallel plate lens is essentially the same as without metallic shielding, meaning
that the same equations can be used in design of physical dimensions of the lens. Width of the lens is
kept unchanged at 50 mm. For teflon n = 1.435, which yields, using (4.4),
Thickness of the lens is kept at 1.00 mm setting the cut-off frequency of the first higher order wave
mode at 104 GHz. In the simulation model 1.0 mm thick copper plates are used to model the parallel
plates. Figure 16 shows the simulation model of the parallel plate lens built in HFSS. Figure 17 shows

29
the E- and H-plane gain patterns of the designed parallel plate teflon lens. Gain of the antenna is 18.1
dB, H-plane FSLL is -12.7 dB, and HPBW in E- and H-plane are 35.5o and 3.9o, respectively.
Figure 16: HFSS simulation model of the parallel parallel plate lens antenna.
Figure 17: E- and H-plane radiation patterns of the parallel plate teflon lens at 78.5 GHz.

30
6.2. Thick preperm450 lens
Even though single-mode propagation is usually desired, it is not always feasible or practical to realize
an antenna with that characteristic. The thickness of the preperm450 material sample was 3.00 mm
and it is examined how the possible higher order wave modes affect the radiation pattern if the lens
is made 3.00 mm thick. Using (3.33) shows that neff = 2.046 at 78.50 GHz which yields lens dimensions
of b = 28.7 mm and c = L = 14.0 mm, and three possible propagating TM modes (Figure 18).
Figure 18: Graphical solution of the TM wave modes in the thick preperm450 lens.
Figure 19 shows the radiation patterns in both E- and H-plane. The corresponding patterns of the 0.8
mm thick preperm450 lens are plotted in the same figure for comparison and to confirm the absence
of the higher order wave modes.

31
Figure 19: E- and H-plane radiation patterns of the 0.8 mm thick and 3.0 mm thick preperm450 lenses
at 78.5 GHz.
The maximum gain is achieved with ΔL = 1 mm and is 14.6 dB. The HPBWs are 4.2o and 38.6o in H- and
E-plane, respectively, and H-plane FSLL is -13.0 dB. The biggest differences between the two lenses
are in the bandwidth and gain. These differences are not analyzed further because, based on the gain
and the shape of the far-field pattern of the 3.0 mm lens, the higher order wave modes do not seem
to be excited, or at least are not interfering with the operation of the antenna.
6.2.1. Thick preperm450 lens with parallel plates
Parallel plate version of the thicker preperm450 lens is designed as well. Design equations yield
dimensions of b = 28.4 mm, c = L = 13.4 mm, while a = 25 mm. Again, the parallel plates are realized
with 1.0 mm thick copper plates. Figure 20 shows the gain patterns in the H- and E-plane. Antenna
gain is 12.5 dB, H-plane is FSLL -19.4 dB, and HPBWs are 4.5o and 28.8o in H- and E-plane, respectively.

32
Figure 20: E- and H-plane radiation patterns of the thick preperm450 lens with parallel plates at 78.5
GHz.
6.3. Comparison between the two lens configurations
Comparison of the radiation patterns of the two studied lens configurations show significant
differences in beamwidth and gain. Like discussed in Chapter 3, in a dielectric slab waveguide the
waves travel mostly as surface waves. However, in a parallel plate waveguide this is not possible
because the metal plates enclose the waves completely into the dielectric. This has two main
outcomes. Firstly, the effective aperture of the antenna in z-direction is reduced, which, in theory,
results in a larger beamwidth in E-plane. Wider beam means lower directivity D, which translates into
a lower gain. Secondly, while in a DSW only dielectric losses are present, in a PPW some conductive
losses are introduced by the non-zero skin depth of the metal walls. The overall losses can be
evaluated by studying the differences between the amplitudes of directivity and gain. Directivity and
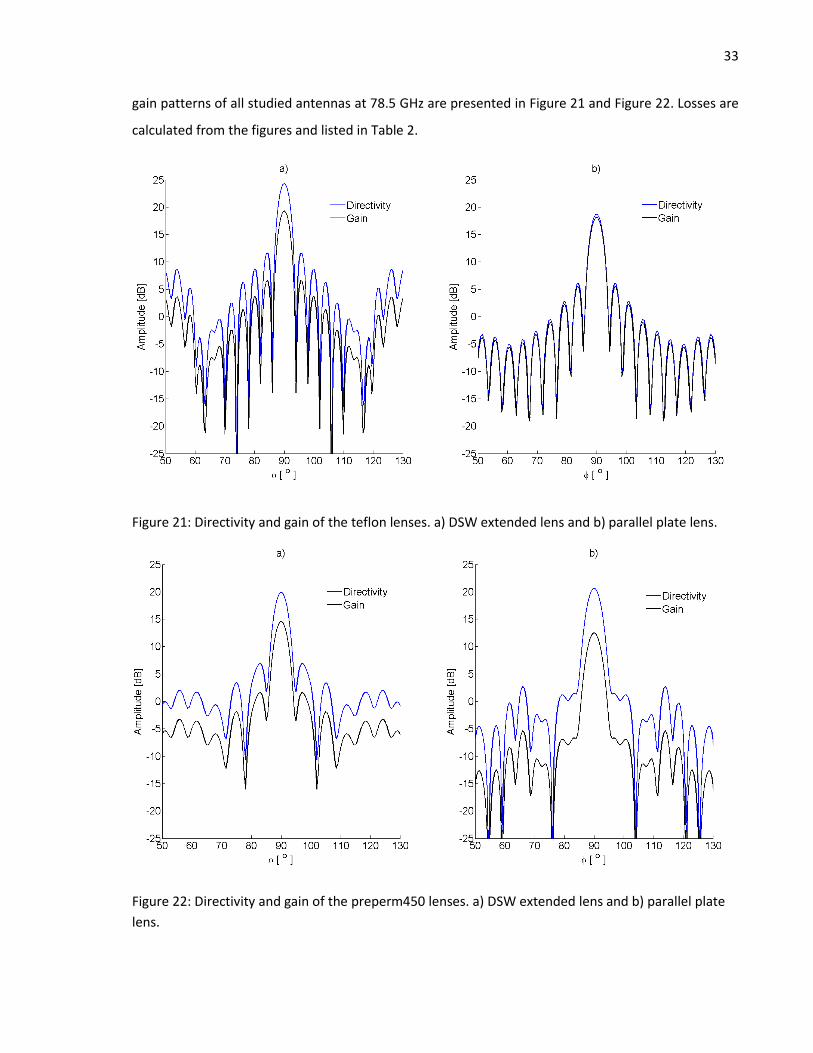
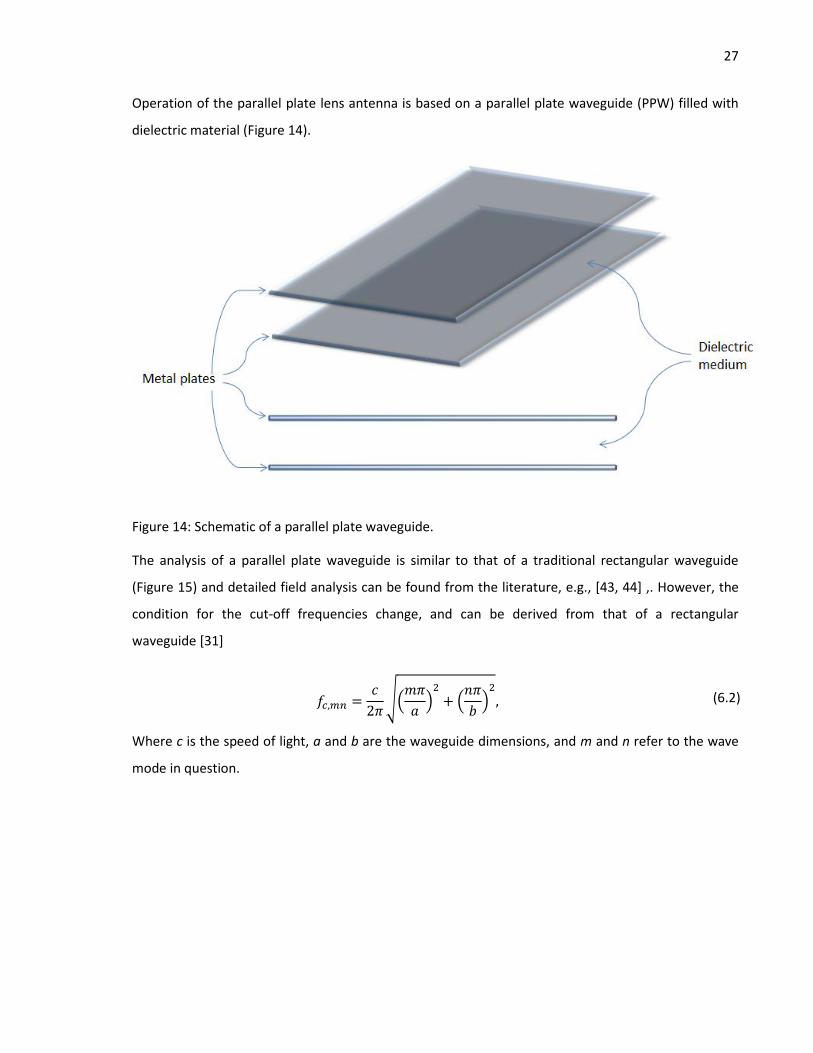
33
gain patterns of all studied antennas at 78.5 GHz are presented in Figure 21 and Figure 22. Losses are
calculated from the figures and listed in Table 2.
Figure 21: Directivity and gain of the teflon lenses. a) DSW extended lens and b) parallel plate lens.
Figure 22: Directivity and gain of the preperm450 lenses. a) DSW extended lens and b) parallel plate
lens.

34
Table 2: Losses and related parameters of the studied antennas.
Lens D [dB] G [dB] Loss [dB] S11 [dB]
DSW extended teflon 24.3 19.3 5.0 -8.2
Parallel plate teflon 18.7 18.1 0.6 -14.6
DSW extended preperm450 19.9 14.6 5.3 -4.9
Parallel plate preperm450 20.6 12.5 8.1 -5.4
The most interesting result is the loss of the parallel plate teflon lens which is significantly lower than
the loss of any other lens. A correlation can be noticed between this and the matching, which is
clearly the best in the case of the parallel plate teflon lens. Another main factor affecting the losses is
the dielectric properties of the lens material. In general for teflon, the parallel plate version
experiences significantly lower losses than the DSW extended lens, while the preperm450 lenses
behave the exact opposite. This indicates that the dielectric loss tangent of teflon is so low that when
the metallic walls enclose the waves completely into teflon, the dielectric losses are lower than when
traveling partly as surface waves in Rohacell. The dielectric loss tangent of preperm450, however, is
significantly larger, which means that in the parallel plate version the dielectric losses are also larger.
These results indicate that the conductive losses caused by the metal plates are relatively small and
dielectric losses dominate. This is also confirmed with simulations where the dielectric loss tangent of
preperm450 is varied from 0.005 to 0.010. Figure 23 and Figure 24 show that the directivity remains
close to unchanged while the difference in gain is more than 3 dB.

35
Figure 23: Directivity of the parallel plate preperm450 lens with varying tanδ.
Figure 24: Gain of the parallel plate preperm450 lens with varying tanδ.
36
7. Measurements
This chapter focuses on the measurements. Section 7.1 provides a short introduction into the
antenna far-field measurements in general. Some of the most common measurement techniques are
described, including measurement technique used in this study, which is a near-field measurement
using a planar near-field scanner. In Section 7.2 the manufactured antenna prototypes are presented
and details of the measurement setup implemented for this work are provided.
7.1. Antenna measurements
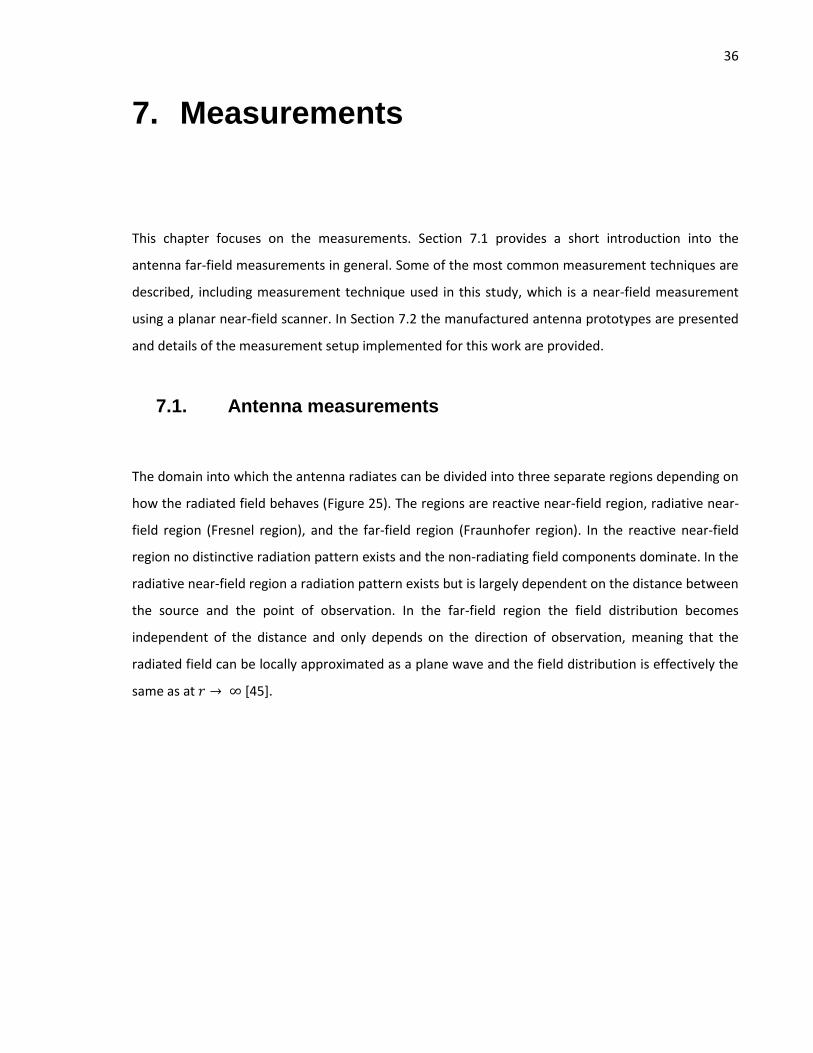
The domain into which the antenna radiates can be divided into three separate regions depending on
how the radiated field behaves (Figure 25). The regions are reactive near-field region, radiative near-
field region (Fresnel region), and the far-field region (Fraunhofer region). In the reactive near-field
region no distinctive radiation pattern exists and the non-radiating field components dominate. In the
radiative near-field region a radiation pattern exists but is largely dependent on the distance between
the source and the point of observation. In the far-field region the field distribution becomes
independent of the distance and only depends on the direction of observation, meaning that the
radiated field can be locally approximated as a plane wave and the field distribution is effectively the
same as at [45].

37
Figure 25: Illustration of the antenna field zones. [46]
In order to directly measure the far-field pattern of an antenna, the receiving antenna should be
placed in the far-field region of the transmitting antenna under test (AUT). Usually the beginning of
the far-field region is defined to begin at the so-called Fraunhofer distance [47]
(7.1)
where D is the largest antenna dimension.
At higher frequencies, as the wavelength shortens, the Fraunhofer distance can easily become so
large that a direct measurement of the antenna far-field is not feasible except for the smallest
antennas. The far-field distance becomes an issue for extremely large antennas as well, such as
reflector antennas used in the field of radio astronomy. Moreover, even if the measurement setup
could be implemented, the free-space losses may become too large as the distance between the
receiver and AUT increases. [48]
Typically in these cases either a compact antenna test range (CATR) or near-field measurements are
used to define the far-field of an antenna. In a CATR measurement a plane wave is formed by placing
a collimating element, e.g., a reflector, a hologram, or a lens, between the AUT and the receiver. This
way the far-field condition can be fulfilled in a laboratory environment. The main disadvantage of
CATRs is the requirement for high surface accuracy of the collimating element, which makes the
manufacturing difficult and expensive. [49, 50]

38
In this study the measurements are performed using a planar near field scanner to measure the near-
field of the AUT, which can be used to calculate the far-field pattern of the antenna. Near field
measurements are performed by placing a receiving antenna into the radiating near field region of
the AUT. The receiver is used to collect the near field data by scanning a pre-defined area in front of
the AUT. Based on the measurement data, the plane wave spectrum of the field can be calculated
which represents the far-field pattern of the AUT. In order to increase the accuracy of the results, a
probe correction is also performed on the measured pattern. This way the non-isotropic nature of the
feed probe is taken into account. [47]
The main benefit of the near-field measurements is that they can be performed in a laboratory
environment and in a relatively small space. The biggest downsides are the time consumption of the
scanning, which in turn means that a very stable measurement equipment and environment is
required due to drifting effects. [51]
7.2. Prototype antennas and the measurement setup
A total of four different lens configurations were produced, 1.0 mm teflon lens, 3.0 mm preperm450
lens, and parallel plate versions of each. Cutting the lenses into shape was performed by water
cutting (or water jet cutting), which is a technique used to cut wide variety of materials using
extremely high pressure water jets. The main advantages of water cutting are the high accuracy and
low operating temperature. Using water alone the method can be used to cut plastics, wood, and
other relatively soft materials, and by mixing the water with some abrasive material, e.g., sand, even
materials like steel or marble can be cut. Manufactured lenses are presented in Figure 26. Figure 27
shows a photograph of the implemented measurement setup and Figure 28 provides a closer look at
the feed – lens interface. [52, 53]

39
Figure 26: Manufactured lens prototypes.
Figure 27: Assembled measurement setup (absorbers removed from the setup for clarity).

40
Figure 28: Waveguide feed and preperm450 lens between two sheets of Rohacell51.
The near-field scanner used in the measurements is the model NSI-200V-5x5 by Nearfield Systems
Inc. The scanning area of the receiving antenna is 20 cm in x-direction and 30 cm in z-direction (see
Figure 11 for reference), and located 21 mm away from the lens. In order to fulfill the Nyquist
sampling criterion [28], the sampling interval is set at 2.00 mm (
) in both directions. The near-
field data is analyzed using NSI-2000 computer software, which calculates the far-field of the AUT
using the Fourier transform and performs the necessary probe corrections based on the radiation
pattern of the WR-10 feed. AB Millimetre MVNA-8-350 millimeter vector network analyzer is used as
a measurement device. In order to determine the gain of the AUT, a standard gain horn antenna with
known gain is measured and used as a reference value. For each lens, three measurements are
conducted using three different feed positions. Additionally, for parallel plate teflon lens one
additional measurement is conducted in order to evaluate the level of cross-polarization (XP), i.e., the
polarization orthogonal to the reference polarization [4]. The XP measurement is performed by
rotating the receiver probe by 90o. Low XP level is an important characteristic of antennas because it
enables the implementation of an additional communication channel using orthogonal polarizations
at the same frequency band. [54]
41
8. Results
This chapter presents and discusses the acquired results. The measurement results are compared
with the simulation results and the possible reasons for variation between them are analyzed. Section
8.1 focuses on the far-field radiation patterns of the antennas. Section 8.2 discusses the cross-
polarization measurement while Section 8.3 concentrates on the beam steering properties of the
studied antennas. All results are summarized and discussed further in Section 8.4. All the
measurements are conducted at 78.5 GHz.
8.1. Far-field pattern measurements
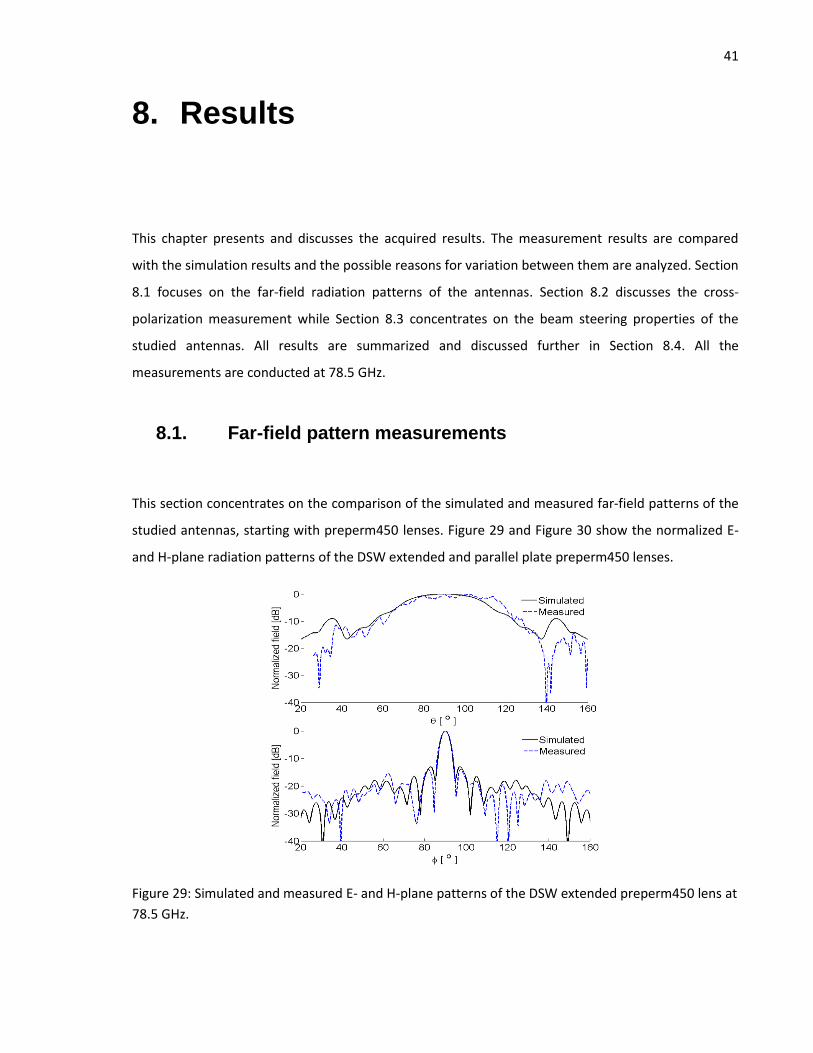
This section concentrates on the comparison of the simulated and measured far-field patterns of the
studied antennas, starting with preperm450 lenses. Figure 29 and Figure 30 show the normalized E-
and H-plane radiation patterns of the DSW extended and parallel plate preperm450 lenses.
Figure 29: Simulated and measured E- and H-plane patterns of the DSW extended preperm450 lens at
78.5 GHz.

42
Figure 30: Simulated and measured E- and H-plane patterns of the parallel plate preperm450 lens at
78.5 GHz.
From the figures it can be seen that the measured radiation patterns in both planes correspond
relatively well to the simulated radiation patterns. For both lenses, the measured HPBW in E-plane is
wider than that of the simulated lens. Larger beamwidth indicates that the effective apertures in z-
direction are smaller in reality than what is suggested by the simulations. Overall in E-plane the side-
lobe levels and the shapes of radiation patterns of the measured lenses correspond well to the
simulated ones, and larger differences are noticed only with lowest and highest ϴ-values, far away
from the main beam.
In H-plane for parallel plate lens the shape of the main beam and the first side lobes vary slightly from
the simulations. Given the asymmetry of the side lobes, it is possible that the waveguide feed has
been slightly misplaced from the center of the lens in the measurement. This would also cause the
differences in the positions of the nulls between the simulation and the measurement. Overall, the H-
plane patterns of both lens configurations correspond well to the simulations.
Figure 31 and Figure 32 show the E- and H-plane radiation patterns of the measured and simulated
teflon lenses.

43
Figure 31: Simulated and measured E- and H-plane patterns of the DSW extended teflon lens at 78.5
GHz.
Figure 32: Simulated and measured E- and H-plane patterns of the parallel plate teflon lens at 78.5
GHz.

44
The E-plane pattern of the DSW extended teflon lens is notably asymmetric with respect to
plane. This is a direct consequence of the asymmetry of the prototype lens which is caused
by the shape of the teflon sheets from which the lens is manufactured. This causes the lenses to be
slightly bent around their axes in y-direction (see Figure 33). This effect is not noticed in the E-plane
pattern of the parallel plate lens because it is pressed between the metal plates which straighten the
lens. No asymmetry is noticed in the H-plane patterns either because the symmetry is maintained in
that plane. However, in the H-plane pattern of the DSW lens very high side-lobes are noticed at
around from the center. This is thought to be because of misplaced or inefficient
absorbers. Similar behavior can be found from the H-plane pattern without absorbers shown in Figure
12. Overall, the radiation patterns of both lenses correspond well to the simulations around the main
beam.
Figure 33: DSW extended teflon lens.
8.1.1. Losses
Comparison between the directivity and gain can be used to evaluate the losses of the antennas as in
Section 6.3. Gains of the antennas are determined by measuring a 20 dB standard gain horn antenna
for reference, while directivities are calculated directly from the measurement data of each antenna

45
by the computer software. Simulated and measured losses of all lenses are listed in Table 3, together
with the gain and directivity values.
Table 3: Simulated and measured directivity, gain, and losses of the studied antennas.
Lens D [dB] G [dB] Loss [dB]
Sim. Meas. Sim. Meas. Sim. Meas.
DSW extended teflon 24.3 23.9 19.3 17.5 5.0 6.4
Parallel plate teflon 18.7 21.3 18.1 17.1 0.6 4.2
DSW extended preperm450 19.9 20.7 14.6 15.8 5.3 4.9
Parallel plate preperm450 20.6 21.4 12.5 16.1 8.1 5.3
The table shows some significant differences in the losses of both parallel plate lenses. In preperm450
lens the measured losses are significantly lower than in the simulations. This difference is likely
caused by uncertainty in the value of the dielectric loss tangent. In [35], where the dielectric
properties of preperm450 were measured, the reported measurement uncertainty for dielectric loss
tangent was ± 40 %. Figure 24 shows that an error of this magnitude could easily account for the 2.8
dB difference between the simulated and measured losses. The difference is smaller in the DSW
extended lens because the waves travel partly in Rohacell. Lower-than-expected dielectric loss
tangent also explains the difference between the measured and simulated gains of the preperm450
lenses. The measurement results acquired here would suggest that the dielectric loss tangent of
preperm450 is closer to 0.006 than 0.009 reported in [35].
In the parallel plate teflon lens the measured losses are actually more than 4 dB larger than the
simulated losses. The most likely cause is thought to be in the matching between the waveguide feed
and the lens. In the simulations the reflection coefficient is around -16 dB which is significantly better
than in the case of any other lens. It is likely that it is not possible to achieve this good matching in the
measurements due to the parallel plates, which increases the losses. Unfortunately this presumption
can not be confirmed since the S-parameter measurements are not conducted in this study.

46
8.2. Cross-polarization measurement
The measurement of the cross-polarization level of an antenna is realized by rotating the receiving
probe by 90o and repeating the original measurement. The XP measurement is conducted only for
parallel plate teflon lens but it is indicative of the general cross-polarization properties of flat
dielectric lens antennas. Measured and simulated cross-polarization levels are presented in Figure 34.
Figure 34: Simulated and measured cross-polarization level of the parallel plate teflon lens at 78.5
GHz.
The figure shows that the simulated and measured cross-polarization levels are very similar. In the
simulation the XP level increases with higher values of while in the measurement the XP level is
relatively stable over the whole range. However, around the main lobe at the
simulated and measured XP levels correspond to each other well, with only some exceptions at
around and . These inconsistencies can be expected to exist due to measurement
uncertainty.
47
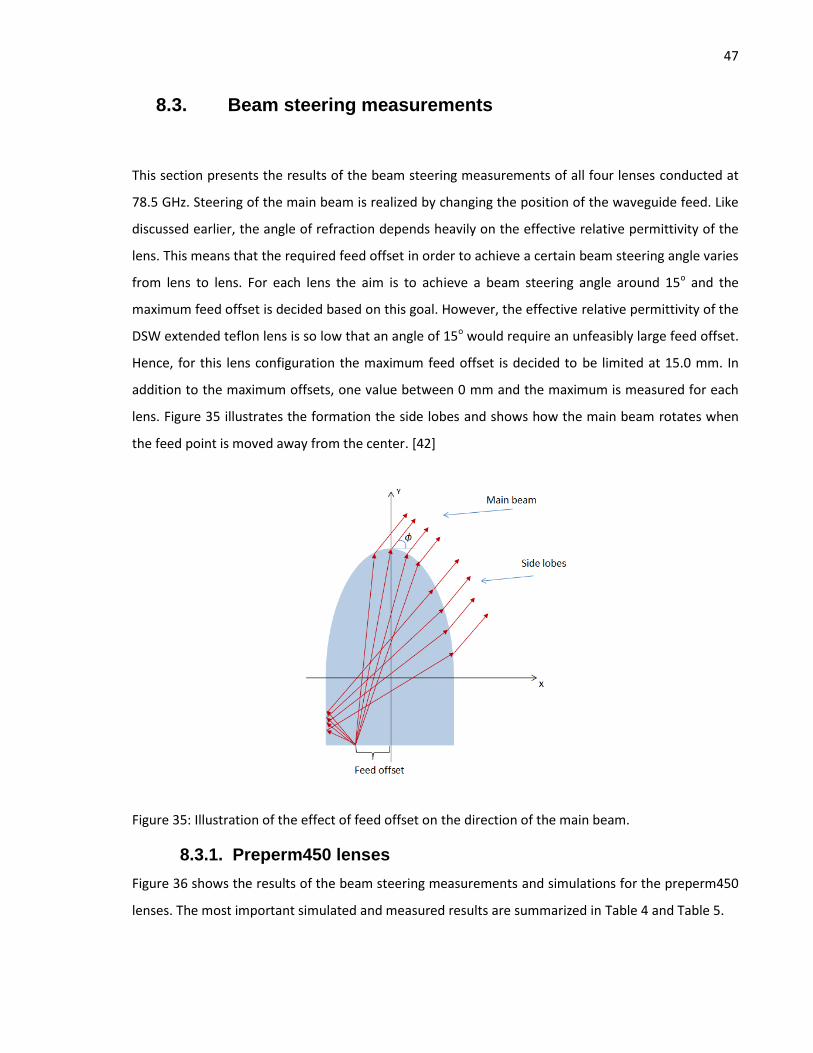
8.3. Beam steering measurements
This section presents the results of the beam steering measurements of all four lenses conducted at
78.5 GHz. Steering of the main beam is realized by changing the position of the waveguide feed. Like
discussed earlier, the angle of refraction depends heavily on the effective relative permittivity of the
lens. This means that the required feed offset in order to achieve a certain beam steering angle varies
from lens to lens. For each lens the aim is to achieve a beam steering angle around 15o and the
maximum feed offset is decided based on this goal. However, the effective relative permittivity of the
DSW extended teflon lens is so low that an angle of 15o would require an unfeasibly large feed offset.
Hence, for this lens configuration the maximum feed offset is decided to be limited at 15.0 mm. In
addition to the maximum offsets, one value between 0 mm and the maximum is measured for each
lens. Figure 35 illustrates the formation the side lobes and shows how the main beam rotates when
the feed point is moved away from the center. [42]
Figure 35: Illustration of the effect of feed offset on the direction of the main beam.
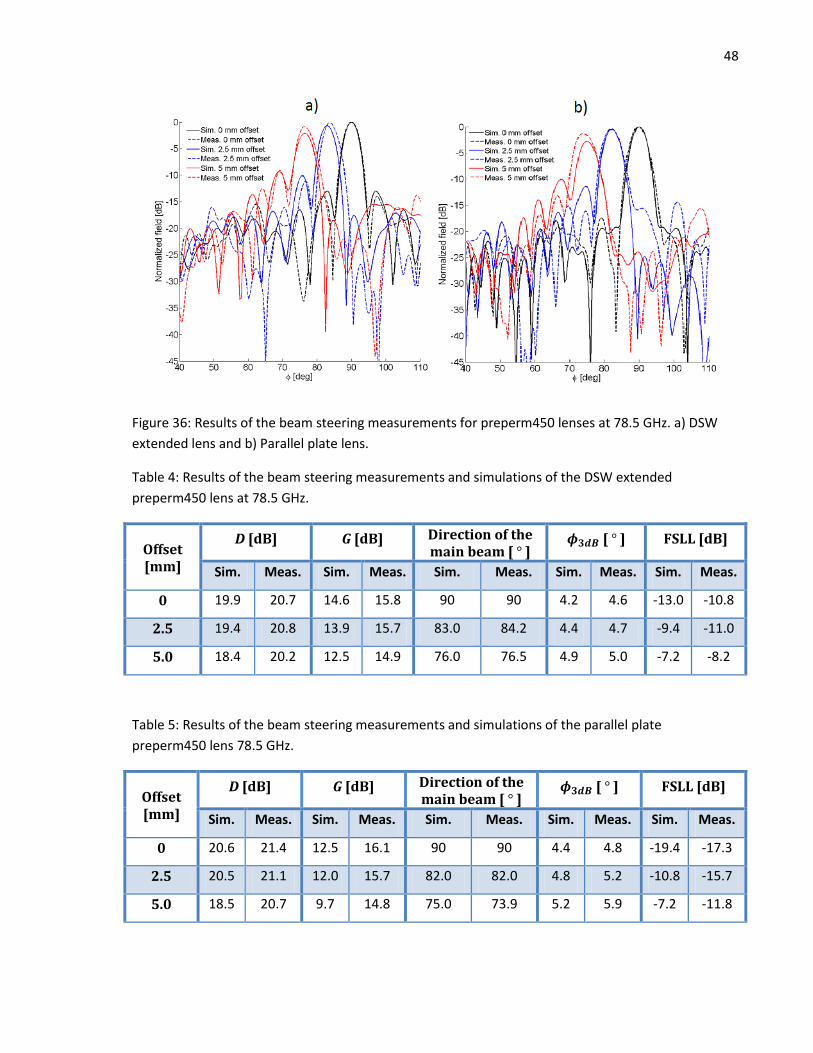
8.3.1. Preperm450 lenses
Figure 36 shows the results of the beam steering measurements and simulations for the preperm450
lenses. The most important simulated and measured results are summarized in Table 4 and Table 5.
48
Figure 36: Results of the beam steering measurements for preperm450 lenses at 78.5 GHz. a) DSW
extended lens and b) Parallel plate lens.
Table 4: Results of the beam steering measurements and simulations of the DSW extended
preperm450 lens at 78.5 GHz.
Offset [mm]
D [dB] G [dB] Direction of the main beam [ ]
[ ] FSLL [dB]
Sim. Meas. Sim. Meas. Sim. Meas. Sim. Meas. Sim. Meas.
0 19.9 20.7 14.6 15.8 90 90 4.2 4.6 -13.0 -10.8
2.5 19.4 20.8 13.9 15.7 83.0 84.2 4.4 4.7 -9.4 -11.0
5.0 18.4 20.2 12.5 14.9 76.0 76.5 4.9 5.0 -7.2 -8.2
Table 5: Results of the beam steering measurements and simulations of the parallel plate
preperm450 lens 78.5 GHz.
Offset [mm]
D [dB] G [dB] Direction of the main beam [ ]
[ ] FSLL [dB]
Sim. Meas. Sim. Meas. Sim. Meas. Sim. Meas. Sim. Meas.
0 20.6 21.4 12.5 16.1 90 90 4.4 4.8 -19.4 -17.3
2.5 20.5 21.1 12.0 15.7 82.0 82.0 4.8 5.2 -10.8 -15.7
5.0 18.5 20.7 9.7 14.8 75.0 73.9 5.2 5.9 -7.2 -11.8
49
The tables show that as the feed offset is increased the simulated gain of both lenses drops more
significantly than the measured gain. For the DSW extended lens, in the simulations the gain drop
between zero and maximum offsets is 2.1 dB while in the measurements the gain decreases by only
0.9 dB. Similarly, for the parallel plate lens the respective gain drops are 2.8 dB and 1.3 dB. This
indicates that the studied lenses are actually more suitable for beam steering than what the
simulations suggest.
Slight variation between the simulated and measured beam steering angles is likely explained by the
uncertainty in the positioning of the feed. Another possible cause is the varying relative permittivity
of preperm450. A ±10 % error in the relative permittivity measurement was reported in [35]. For DSW
extended lens the measured beam steering angles are smaller than in the simulations while for
parallel plate lens at 5.0 mm offset the angle is 1.1o larger. Because the lenses were manufactured
from different material samples, this could indicate that the relative permittivity of the DSW lens is
smaller than the one of the parallel plate lens.
The behavior of the SLL is similar in the measurements and the simulations. The measured levels are
lower which could mean that in reality more power is transmitted into absorbers and less is reflected
inside the lens. HPBWs in H-plane are wider in the measurements of both lenses. This indicates that
the effective aperture in x-direction is smaller in reality than in the simulations. However, the
differences are only around 10 % and the behavior is similar as the feed offset increases. Both these
properties, increasing SLL and growing HPBW, are limiting factors when designing the maximum feed
offsets.
8.3.2. Teflon lenses
Figure 37 shows the results of the beam steering measurements and simulations for the teflon lenses.
The most important simulated and measured results are summarized in Table 6 and Table 7.

50
Figure 37: Results of the beam-steering measurements for teflon lenses 78.5 GHz. a) DSW extended
lens and b) Parallel plate lens.
Table 6: Results of the beam steering measurements and simulations of the DSW extended teflon lens
78.5 GHz.
Offset [mm]
D [dB] G [dB] Direction of the main beam [ ]
[ ] FSLL [dB]
Sim. Meas. Sim. Meas. Sim. Meas. Sim. Meas. Sim. Meas.
0 24.3 23.9 19.3 17.5 90 90 3.4 2.9 -12.8 -11.9
7.5 23.9 22.8 18.7 16.7 85.5 85.5 3.6 3.4 -9.0 -6.2
15.0 22.3 21.8 16.8 14.7 81.0 80.5 4.3 4.1 -4.8 -4.5

51
Table 7: Results of the beam steering measurements and simulations of the parallel plate teflon lens
78.5 GHz.
Offset [mm]
D [dB] G [dB] Direction of the main beam [ ]
[ ] FSLL [dB]
Sim. Meas. Sim. Meas. Sim. Meas. Sim. Meas. Sim. Meas.
0 18.7 21.3 18.1 17.1 90 90 4.1 4.2 -12.7 -15.5
5.0 17.8 21.2 16.9 16.5 82.0 82.0 4.3 3.8 -7.0 -8.9
10.0 15.9 20.8 14.4 15.1 74.0 74.3 5.6 4.7 -4.9 -8.3
The measurement results of the DSW extended lens correspond generally well to the simulation
results. The most significant difference is in the SLL, especially with 15 mm offset, which is expected
to exist because of the asymmetry of the lens discussed earlier. The decrease in gain and the beam
steering angles are almost equal while for the parallel plate lens the gain behaves similarly as in the
case of the preperm450 lenses, decreasing less in the measurements than in the simulations.
The behavior of for parallel plate lens is not as consistent in the measurements as in the
simulations, but still in both cases it remains relatively stable when changing the position of the feed
from the center to 5 mm offset and increases significantly when increasing the feed offset further to
10 mm. For DSW extended lens at 0 mm offset is significantly narrower in the measurements
but the overall behavior is similar to that of the simulated lens.
8.4. Summary
This section summarizes the most important findings of the measurements and discusses the overall
performance of the prototype antennas in relation to the simulations. Table 8 summarizes the most
important properties of the far-field measurements.

52
Table 8: Summary of the far-field measurement results 78.5 GHz.
Antenna Gain [dB] FSLL [dB] [ ] [ ]
Sim. Meas. Sim. Meas. Sim. Meas. Sim. Meas.
DSW ext. preperm450 14.6 15.8 -13.0 -10.8 4.2 4.6 38.6 43.8
Par. plate preperm450 12.5 16.1 -19.4 -17.3 4.4 4.8 28.8 42.2
DSW ext. teflon 19.3 17.5 -12.8 -11.9 3.4 2.9 22.2 17.3
Par. plate teflon 18.1 17.1 -12.7 -15.5 4.1 4.2 35.5 32.2
The measurement and simulation data show that the operation of the prototype antennas is
relatively good in comparison with the HFSS simulations. The differences in gain of preperm450
lenses are explained by the lower dielectric loss tangent than what was expected. FSLL of each
antenna is within 3 dB of the simulated value which can be considered a good result. Same applies to
values which fall within 0.5o of the simulations. The most interesting measurement result is the
ϴ3dB of the preperm450 parallel plate lens which is almost 50 % wider compared with the simulated
value. The reason for this is the presence of the relatively high side-lobes at around ± 30o from the
center, which can be noticed in the simulated pattern but not in the measured pattern in Figure 30. It
is worth noting that the simulation results would indicate that the insertion of the parallel plates
increases the effective aperture in z-direction. This means that the measurement result, which
suggests that there is effectively no change in the effective aperture, is more sensible.
The most important finding of the beam steering measurements is that, when the feed offset is
increased, the gain does not seem to drop as drastically as predicted by the simulations. This is found
to be especially true for the preperm450 lenses. Lower gain drop is connected to the side-lobe levels
which are lower in most measurements compared with the simulations. This presumption is
supported by that fact that the only instances where the measured FSLL is larger than the simulated
FSLL (DSW extended teflon lens with 7.5 and 15 mm mm offsets), are also the only measurements
where the gain drops more than in the simulations.
A more detailed explanation for why the performance of the measured antennas is so good
compared with the simulated antennas would require a thorough investigation of the field and phase
distributions inside the lens. This is not possible to be performed within the scope of this thesis.

53
9. Conclusion
In this Master’s thesis, flat dielectric lens antennas and their beam steering properties are studied at
millimeter wavelengths. The antenna in question is interesting due to the fan shaped main beam
which enables coverage of wide areas using beam steering. This characteristic makes the antenna
especially suitable for applications such as automotive radar and wireless communication systems.
Two different lens configurations, a dielectric slab waveguide extended lens and a parallel plate lens,
are studied and designed at 78.5 GHz. Both lens types are shaped as extended hemi-ellipses. The
design process of the dielectric slab extended lens is relatively complicated due to the surface wave
propagation of the waves. This decreases the effective relative permittivity of the dielectric material,
which is inversely proportional to the physical dimensions of the lens. The solution for the effective
relative permittivity has to be performed numerically which further complicates the design process.
In addition, the frequency dependence of the effective relative permittivity limits the use of the lens
in broadband applications.
The insertion of the parallel metal plates on both sides of the lens simplifies the antenna structure
significantly. For TM polarization, the frequency dependence of the effective relative permittivity
almost disappears which allows for more broadband solutions. The physical dimensions of the lens
also decrease making the antenna more suitable for portable applications. In addition, the parallel
plates shield the lens away from the surrounding increasing the integrability of the antenna.
The lens materials chosen for this study are teflon, which is a common lens material due to its low-
loss characteristics and relatively low price, and preperm450 which is a commercial plastic developed
especially for high frequency antenna applications. A dielectric slab extended and parallel plate lens
prototypes are manufactured from both materials using water jet cutting. The measurements are
conducted using a planar near-field scanner and the lenses are fed with a WR-10 open-ended
waveguide connected to a vector network analyzer. The measurement results are compared with the
simulation results produced with commercial electromagnetic simulation software.

54
The measurement results show that, to a large extent, the behavior of the antennas is consistent with
the computer simulations. The most significant differences are found in losses of the antennas, which
are explained by the uncertainty in the dielectric properties of the materials. Some variation is also
noticed in the beam widths and side-lobe levels of the antennas, but generally the correlation
between the simulated and measured results is high. In a few measurements some notable
asymmetry in the radiation patterns is found. Most probable causes for these findings are the
asymmetry of the teflon lenses and small errors in the positioning of the waveguide feed. The cross-
polarization level of one of the lenses is measured as well and found to be very low and consistent
with the simulation results.
The objective of the beam steering measurement is to produce a beam steering angles of around 15o.
However, using a dielectric slab waveguide extended teflon lens this is not feasible due to the low
effective index of refraction of the lens, and the largest achieved beam steering angle is below 10o.
The results of the beam steering measurement show that in several cases, as the main beam is
steered, the prototype lenses perform even better than the simulated lenses, showing higher gain
levels and lower side-lobe levels relative to the gain of the on-axis fed lens. Slight variation in the
beam steering angles is noticed but it can be explained by varying relative permittivity of the
preperm450 material samples and by errors in the feed positioning.
The acquired results confirm the suitability of flat dielectric lens antennas for beam steering
applications at millimeter wavelengths. Furthermore, preperm450 is found to be an excellent
material choice for dielectric lens antennas at millimeter wave frequencies.
The next natural step towards real-life applications would be to replace the open-ended waveguide
feed with an antenna array. Future work on this topic could also include an expansion of the study
from a single frequency to a larger frequency band in order to study the broadband properties of the
flat dielectric lens antennas, and studying the possibilities to reduce the internal reflections by
shaping the extension part of the lens differently.
55
References
[1] X. Wu, G. V. Eleftheriades, and E. Van Deventer-Perkins, "Design and characterization of single
and multiple beam mm-wave circularly polarized substrate lens antennas for wireless
communications," in IEEE Antennas and Propagation Society International Symposium, Orlando,
Florida, 11-16 July 1999, vol. 4, pp. 2408-2411.
[2] A. Boriskin, R. Sauleau, and A. Nosich, "2-D Analysis of synthesis of dielectric lens antennas with
boundary integral equations," in Microwaves, Radar and Remote Sensing Symposium MRRS-
2008, Kiev, Ukraine, 22-24 September 2008, pp. 196-200.
[3] J. Costa, E. Lima, and C. Fernandez, "Compact beam-steerable lens antenna for 60-GHz wireless
communications," IEEE Transactions on Antennas and Propagation, vol. 57, no. 10, pp. 2926-
2933, October 2009.
[4] Antenna Standards Committee of the IEEE Antennas and Propagation Society, "IEEE standard
definitions of terms for antennas," IEEE Std 145-1993, p. 40, April 1993.
[5] Z. Chen, J. Liu, and L. Li, "Design of scalable beam steering system of phased array radar," in IEEE
CIE International Conference on Radar, Chengdu, China, 24-27 October 2011, vol. 2, pp. 1153-
1156.
[6] H. H. G. Hansen, R. G. P. Lopata, T. Idzenga, and C. De Korte, "High quality non-invasive full 2D
strain tensor imaging using a beam steered linear array ultrasound transducer," in IEEE
International Ultrasonics Symposium (IUS), Rome, Italy, 20-23 September 2009, pp. 159-162.
[7] C. Reardon, A. Di Falco, K. Welna, and T. Krauss, "Optical beam-steering for wireless sensor
networks," in LEOS Annual Meeting Conference Proceedings, Belek-Antalya, Turkey, 4-8 October
2009, pp. 583-583.
[8] M. Kyrö, D. Titz, V. Kolmonen, S. Ranvier, P. Pons, C. Luxey, and P. Vainikainen, "5 x 1 linear
antenna array for 60 GHz beam steering applications," in Proceedings of the 5th European
Conference on Antennas and Propagation (EUCAP), Rome, Italy, 11-15 April 2011.

56
[9] Y. Monnai, V. Viereck, H. Hillmer, K. Altmann, C. Jansen, M. Koch, and H. Shinoda, "Terahertz
beam steering using structured MEMS surfaces for networked wireless sensing," in Ninth
International Conference on Networked Sensing Systems (INSS), Antwerp, Belgium, 11-14 June
2012.
[10] J. Ala-Laurinaho, A. Karttunen, J. Säily, A. Lamminen, R. Sauleau, and . is nen, -wave
lens antenna with an integrated LTCC feed array for beam steering," in Proceedings of the fourth
European conference on antennas and propagation (EUCAP), Barcelona, Spain, 12-16 April 2010.
[11] B. Schoenlinner, X. Wu, J. P. Ebling, G. V. Eleftheriades, and G. M. Rebeiz, "Wide-scan spherical-
lens antennas for automotive radars," IEEE Transactions on Microwave Theory and Techniques,
vol. 50, no. 9, pp. 2166-2175, 2002.
[12] T. Komljenovic and Z. Sipus, "Dielectric lens antennas design at millimeter waves," in ELMAR,
2008. 50th International Symposium, Zadar, Croatia, 10-12 September 2008, pp. 621-624.
[13] Computer Simulation Technology (CST), "A dielectric lens antenna with enhanced aperture
efficiency for industrial radar applications," May 2011. [Online]. Available:
http://www.cst.com/Content/Applications/Article/A+Dielectric+Lens+Antenna+with+Enhanced+
Aperture+Efficiency+for+Industrial+Radar+Applications. [Accessed July 2013].
[14] C. Balanis, Antenna Theory: Analysis and Design, New York, Harper & Row, 1st ed., 1982, 790p.
[15] J. Qiu, W. Li, and Y. Suo, "A Novel high gain beam scanning hemispherical dielectric lens
antenna," in 6th International Conference on ITS Telecommunications, Chengdu, China, 21-23
June 2006.
[16] T. K. Nguyen, I. Woo, H. Han, I. Park, and H. Lim, "Four-leaf clover-shaped antenna on an
extended hemishperical lens for a high-output-power THz photomixer," in 35th International
Conference on Infrared Millimeter and Terahertz Waves (IRMMW-THz), Rome, Italy, 5-10
September 2010.
[17] A. Weily and N. Nikolic, "Dual-polarized planar feed for low-profile hemispherical Luneburg lens
antennas," IEEE Transactions on Antennas and Propagation, vol. 60, no. 1, pp. 402-407,
September 2012.
[18] C. Schulz, C. Baer, N. Pohl, T. Musch, and I. Rolfes, "A Multistatic feeding concept for beam
steering based on a dielectric ellipsoidal antenna," in Asia-Pacific Microwave Conference
Proceedings (APMC), Kaohsiung, Taiwan, 4-7 December 2012.

57
[19] S. Baev, S. Gechev, B. Hadjistamov, and P. Dankov, "Modeling and Simulations of Lüneburg Lens
Antennas for Communication Purposes," in 16th Telecommunications Forum TELFOR2008,
Belgrade, Serbia, 25-27 November 2008.
[20] H. Mosallaei and Y. Rahmat-Samii, "Nonuniform Luneburg and two-shell lens antennas:
Radiation characteristics and design optimization," IEEE Transactions on Antennas and
Propagation, vol. 49, no. 1, pp. 60-69, January 2001.
[21] A. Rolland, R. Sauleau, and M. Drissi, "Design of H-plane shaped flat lenses using a 2-D approach
based on FDTD and genetic algorithm," in Proceedings of the Fourth European Conference on
Antennas and Propagation (EuCAP), Barcelona, Spain, 12-16 April 2010.
[22] A. Rolland, R. Sauleau, and L. Le Coq, "Flat shaped dielectric lens antenna for 60-GHz
applications," IEEE Transactions on Antennas and Propagation, vol. 59, no. 11, pp. 4041-4048,
August 2010.
[23] B. Chantraine-Bares, R. Sauleau, L. Le Coq, and K. Mahdjoubi, "A new accurate design method for
millimeter-wave homogeneous dielectric substrate lens antennas of arbitrary shape," IEEE
Transactions on Antennas and Propagation, vol. 53, pp. 1069-1082, March 2005.
[24] B. Fuchs, R. Golubovic, A. K. Skriverick, and J. R. Mosig, "Spherical lens antenna designs with
particle swarm optimization," Microwave and Optical Technology Letters, vol. 52, no. 7, pp.
1655-1659, April 2010.
[25] L. Xue and V. Fusco, "Patch fed planar dielectric slab extended hemi-elliptical lens antenna," IEEE
Transactions of Antennas and Propagation, vol. 56, no. 3, pp. 661-666, March 2008.
[26] L. Xue and V. Fusco, "Polarisation insensitive planar dielectric slab waveguide extended hemi-
elliptical lens," IET Microwaves, Antennas & Propagation, vol. 2, no. 4, pp. 312-315, June 2008.
[27] J. E. Midwinter, Optical Fibres for Transmission, New York, John Wiley & Sons, 1979, 410p.
[28] H. Young and R. Freedman, University Physics with Modern Physics with Mastering Physics, San
Francisco, Pearson & Addison Wesley, 11th ed., 2003, 1714p.
[29] R. E. Collin, Foundations for Microwave Engineering, New York, McGraw-Hill, 2nd ed., 1966,
950p.
[30] F. E. Gardiol, Introduction to Microwaves, Massachusetts, Artech House, Inc., 1984, 495p.
[31] I. Lindell, Aaltojohtoteoria, Espoo, Otatieto, 1997, 345p.
58
[32] J. F. Lotspeich, "Explicit general eigenvalue solutions for dielectric slab waveguides," Applied
Optics, vol. 14, no. 2, 1975.
[33] R. A. Adams, Calculus: A Complete Course, Toronto, Addison Wesley Longman, 5th ed., 2003,
999p.
[34] Premix, "Preperm® L450 technical datasheet," October 2012. [Online]. Available:
http://www.premixgroup.com/wordpress/wp-content/files_mf/preperm_l450_tds.pdf.
[Accessed July 2013].
[35] K. Piiroinen, Determination of Dielectric Properties Using a Vector Network Analyzer, Special
assignment, Aalto University School of Electrical Engineering, Espoo, October 2012.
[36] Ansys Inc., HFSS v14.0 Material library.
[37] Antenna Standards Committee of the IEEE Antennas and Propagation Society, "IEEE standard
test procedures for antennas," ANSI/IEEE Std 149-1979, p. 135, December 1979.
[38] Evonik Industries, [Online]. Available: http://www.rohacell.com/product/rohacell/en/products-
services/pages/default.aspx. [Accessed June 2013].
[39] D. Bourreau, A. Péden, and S. Le Maguer, "A quasi-optical free-space measurement setup
without time-domain gating for material characterization in the W-band," IEEE Transactions on
Instrumentation and Measurement, vol. 55, no. 6, pp. 2022-2028, December 2006.
[40] High Frequency Structure Simulator (HFSS), v.14.0, [Online]. Available: www.ansys.com.
[Accessed June 2013].
[41] Ansys Inc., HFSS v14 User's manual: Technical details on finite element method.
[42] A. Karttunen, J. Ala-Laurinaho, R. Sauleau, and A. V. Räisänen, "Reduction of internal reflections
in integrated lens antennas for beam-steering," Progress in Electromagnetics Research, vol. 134,
pp. 63-78, 2013.
[43] L. Felsen, F. Akleman, and L. Sevgi, "Wave propagation inside a two-dimensional perfectly
conducting parallel-plate waveguide: hybrid ray-mode techniques and their visualizations," IEEE
Antennas and Propagation Magazine, vol. 46, no. 6, pp. 69-89, December 2004.
[44] J. A. Higgins, Measurement and simulation of parallel plate waveguide structures in the terahertz
region for sensing and material characterization applications, Master's thesis, Portland State
University, Oregon, 2012.
59
[45] K. Rasilainen, Antenna Performance in Bendable Mobile Devices, Master's thesis, Aalto University
School of Electrical Engineering, Espoo, 2012.
[46] G. Djuknic, "Method of measuring a pattern of electromagnetic radiation", USA Patent US
20030142023 A1, January 2002.
[47] A. Yaghjian, "An overview of near-field antenna measurements," IEEE Transactions on Antennas
and Propagation, vol. 34, no. 1, pp. 30-45, January 1986.
[48] University of Stuttgart, "Near-field antenna measurements," March 2006. [Online]. Available:
www.ihf.uni-stuttgart.de/forschung/forschungsgebiete/nahfeld/index.html. [Accessed June
2013].
[49] C. Parini and M. Philippakis, "Compact antenna test range reflector edge treatment," Electronics
Letters, vol. 32, no. 2, pp. 82-83, January 1996.
[50] J. Ala-Laurinaho, J. Häkli, A. Karttunen, T. Koskinen, A. Lonnqvist, J. Mallat, E. Noponen, A.
Tamminen, M. Vaaja, V. Viikari, A. Räisänen, and J. Lemanczyk, "Tests of 1.5-m Reflector
Antenna in a 650 GHz Hologram CATR," in The Second European Conference on Antennas and
Propagation (EuCAP), Edinburgh, Scotland, 11-16 November 2007.
[51] D. Janse van Rensburg and G. Hindman, "An overview of near-field sub-millimeter wave antenna
test applications," in 14th Conference on microwave techniques, COMITE 2008, Prague, Czech
Republic, 23-24 April 2008.
[52] WaterJets.org, "About water jets," 2013. [Online]. Available:
http://waterjets.org/index.php?option=com_content&task=category§ionid=4&id=46&Itemi
d=53. [Accessed August 2013].
[53] B. G. Schwacha, "Liquid cutting of hard materials", USA Patent 2985050, May 1961.
[54] A. C. Ludwig, "The definition of cross polarization," IEEE Transaction on Antennas and
Propagation, vol. 21, no. 1, pp. 116-119, January 1973.