design and implementation of software for assembly -
TRANSCRIPT

Design and Implementation of Software for Assembly andBrowsing of 3D Brain Atlases
Carl Gustafson1, Oleh Tretiak2, Louise Bertrand1 and Jonathan Nissanov1*
1Department of Neurobiology and Anatomy, Drexel University College of Medicine, 2900Queen Lane, Philadelphia, Pennsylvania, USA
2Department of Electrical and Computer Engineering, Drexel University, 3141 ChestnutStreet, Philadelphia, Pennsylvania, USA
Abstract:Visualization software for three dimensional digital brain atlasespresent many challenges in design and implementation. Thesechallenges include the design of an effective human interface,management of large data sets, display speed when slicing the data setfor viewing/browsing, and the display of delineated volumes of interest(VOI). We present a software design, implementation and storagearchitecture that addresses these issues, allowing the user to navigatethrough a reconstructed volume quickly and smoothly, with an easy-to-use human interface. The software (MacOStat, for use with MacintoshOS) allows the user to rapidly display slices of the digital atlas at anyarbitrary slicing angle, complete with delineated VOIs. The VOIs can beassigned colors of the user's choosing. The entire atlas, or selectedportions, may be resliced with slices stored as individual image files,complete with delineations. These delineations may be transferred tocorresponding sections of experimental materials using our analysisprogram (Brain). The software may be obtained from the laboratory'sweb site: http://www.neuroterrain.org
Keywords:3D brain atlas, 3D reconstruction, 3D visualization
*Corresponding Author:Tel: 1-215-991-8410; Fax: 1-215-843-9367

Introduction
Neuroanatomical atlases are widely used to guide delineation of stainedsections, assist in electrode placement, and aid in surgical planning.Numerous atlases are available [e.g. 1,2,3,4]. In general these atlases aremade of a series of non-consecutive 2D images of stained sections alongwith graphical outlines of standard nuclei and tracts; they are usuallyprovided as printed manuscripts. These atlases suffer two majordeficiencies: they support only a limited number of orientations—typicallyoffering coronal, sagittal and horizontal views, often incomplete (forexample, in rodent atlases, the olfactory bulb is often not included inhorizontal or sagittal views)—and they are sparse with substantial gapspresent between sections. Three-dimensional digital atlases can overcomethese deficits and a number are now available for the rat [5], human [6,7],mouse [8], rhesus monkey [10], fly [11] and other species.
To make use of these digital atlases, visualization software is required.There are generalized volume visualization applications available via bothcommercial (Voxblast [12], Amira [13] IDL [14]) and public (OpenVisualization Data Explorer [15]) licenses; however, these are notparticularly suitable for atlas display. While they do offer both voxel andvector display and do support arbitrary plane of view, all necessities inthis specific setting of 3D visualization, they lack support for otherimportant functions of atlases such as display of stereotaxic coordinatesdisplay, and textual annotations. They also fail to provide astraightforward means of matching experimental sections to equivalentatlas planes, natural navigational tools, or accommodation for the largesize typical of digital atlases. We designed an application (MacOStat) thatovercomes these deficits.
Design Considerations
The primary design consideration in developing MacOStat was usability.By this is meant both an intuitive human interface, with directlymanipulatable interface elements, and sufficient processing speed tomake live navigation possible. An intuitive interface is of critical

importance in any computer software but it is especially important insoftware attempting to map three dimensional data into a twodimensional display space; the third dimension must be handled in aconsistent and predictable manner, and the available commands formanipulating the display should be direct and obvious to the novice user.However, there is currently no widely-accepted standard to handle theserequirements. Most applications rely on a series of orthogonal viewsshowing the projection of the slicing plane on the volume, along with aview normal to that plane [16]. This type of interface is conceptuallysimple - one can easily specify the slice location. Unfortunately, livenavigation using this interface is not easy — an obstacle to useablity withthis scheme is that manipulation is not direct — it is necessary to adjustsettings in several separate windows to navigate the atlas, whilemonitoring the result in yet another distinct window.
Speed is the other side of the usability coin - as even moderate-resolutionatlases are quite large (a 17.9µm/pixel isotropic mouse brain atlas [9],without any delineation, can easily exceed 100MB), efficient processing iscritical to providing a satisfactory user experience. It is difficult, if notimpossible, to accurately navigate through an atlas unless refresh ratesare substantially faster than a frame per second. Handling this massiveamount of data, and selecting and displaying individual slices quickly is aanother primary challenge. In addition, both fine- and coarse-grainedmovement is required - fine grained movement alone quickly becomestedious when traversing large distances, and coarse-grained controlmakes precise positioning impossible.
To meet these criteria, we developed a system that eliminates the entireorthogonal-view paradigm, relying instead on only showing a slice of theatlas for fine-grained navigation, and a wire-frame representation of theslice’s location within the atlas’ bounding volume for coarse-grainedmovement. These displays are directly manipulated - the user selects anaction from a toolbar, then clicks and drags the mouse over the display;the display moves in direct response to the user. To support rapid displayand efficient access to atlas data, we have developed a novel data storagetechnique that is generally applicable to volume (voxel) data.

A second design consideration is an architecture that facilitatesmaintenance and enhancement. It is inevitable that software applicationswill need fixes and additional features. This is especially true in relativelynew content domains, such as interactive digital atlases. Unless the basicprogram architecture is initially well factored, and modular in nature,future attempts at enhancements will result in increasing fragility,resulting in either costly redesign, or a reluctance to add additionalfeatures.
To realize this goal, we use object-oriented design techniques, and acommercial application framework, MacApp [17]. The framework uses aModel-View-Controller (M-V-C) design pattern well-adapted to user-centric interface design, and is easily modifiable, via inheritancetechniques, to our content domain. Atlas data is abstracted into genericvoxel maps, with appropriate metadata handled by both customizedframework and purpose-built classes, acted upon by generic slicingclasses. A hierarchy of command classes abstract user interactions.Customization of framework view classes provides the displayfunctionality. An additional advantage of object-oriented design is that itfacilitates reuse of existing code bases. In our case, we have an imageacquisition and analysis package (Brain [18]), developed in-house, that weuse for 2D delineation of the data sets used in atlas creation. Many of theclasses related to the data model in Brain have been reused in thedevelopment of the atlas browser. The reuse already developed anddebugged code greatly shortens the application development cycle.
System Overview
We use an M-V-C pattern for our system. All the data structures (themodel) that comprise an atlas (gray-scale data, delineation, size andcalibration, metadata, etc.) are aggregated by a class descended from theMacApp base class TDocument (Figure 1). The atlas is displayed (theview) using classes derived from the MacApp base class TView (Figure 2).Finally, all interactions with the user (the controller) are handled byderivatives of the base class TCommand (Figure 3). Finally, we have

developed an additional class hierarchy independent of the MacAppframework used to handle data slicing for later display (Figure 3).
The Model
The atlas browser has two independent components — the program toconstruct atlas data files from separate, pre-aligned frames (Gluclose),and the browser itself (MacOStat). To the greatest extent possible, the twoshare the classes that implement the data model (the class hierarchy fromthe atlas browser is shown in Figure 1). Both also share classes with ouranalysis package, Brain; atlas data files are constructed from Brain imagefiles, and the atlas browser must export resliced images in Brain fileformat. This means that our root data model has two independentbranches, one for the atlas document and one for the image documentsthat can be matched to the atlas. The document objects used to constructan atlas (not shown in Figure 1) contain additional data elements beyondthose required by the Brain application— for example, the position andorientation of the image within atlas space. To accommodate this, wecreated a subclass of the basic Brain document to hold orientation data.All document objects have methods to read and write data files whenappropriate; this allows us to use existing classes, and add additionalcapabilities via inheritance. Part of the initialization for document classesusually includes the creation of view objects to display the document’sdata. Because this display is both not needed and computationallyexpensive when constructing an atlas from images, we further subclassthe document to eliminate this view creation step.
In addition to the document classes based on code developed for Brain,we also have been able to reuse classes developed to represent delineatedregions of interest and calibration curves. Added to this are 3D specificclasses to represent both gray-scale and binary volume data (image voxelsand volumes of interest) and metadata, as well as various collectionclasses used to manage these data objects, which were derived fromframework collection classes.
The View

Previous work provided a view class that used an offscreen buffer fordrawing; this class was used to display individual image files opened formatching purposes. A similar class was developed to handle display of thesliced atlas image. Additional classes were derived from frameworkclasses for tool and informational views, and so forth.
Most views are subclassed directly from the base framework view class,but some intermediate classes are used, primarily in the views that can bemanipulated via mouse (Figure 2). In TMouseOrientableView, the codethat responds to mouse actions resides in a superclass of the final viewobjects, as all views that can be manipulated via mouse (wire framecoarse-positioning and slice fine-positioning views) may then use commoncode.
Many views are designed to be embedded in other views, to controlvarious aspects of view behavior. For example, T3DBufferedView is theultimate destination for sliced atlas images and the associated slicedvolumes of interest. It uses an offscreen image buffer to assemble thefinal image prior to display. This view is nested into a view descendedfrom TMouseOrientableView, which controls responses to mousemovement. While it is possible to derive T3DBufferedView fromTVolumeView or TMouseOrientedView, we also allow multiple views to benested in TVolumeView - for example, it is possible to browse severaldifferent data sets, but keep all data sets at the same exact slicingorientation. By separating the view classes, we can allow TVolume view tohandle both tracking and scrolling of the views, and transfer informationto all instances of the data model; the code to handle this if thehierarchies were combined would be significantly more complex.
The Controller
A number of command classes were derived from the frameworkcommand hierarchy to encapsulate user actions such as navigation andreslicing. One advantage to this structure is that each command objectcontains the information needed to undo any actions; commands may beplaced on a stack for multiple levels of undo if desired. By supportingundo for almost all user actions, the human interface becomes much

more forgiving, allowing the user the confidence that any mistakes can berecovered.
In addition to the suite of command classes, a set of classes used toreslice volume data was created. In essence, there is one slicer class foreach type of volume data (gray-scale and binary) and display variant (8 or32 bit pixels, for example). These slicers, which are persistent objects, arecontrolled by the command objects spawned by the user’s actions. In thiscase, much of each slicer’s code is independent of the other slicers in thesuite, primarily for performance reasons - the overhead of calling virtualfunctions (the basic mechanism allowing a subclass to provide specializedbehavior) is normally negligible, but in the tight loops used in slicing, ithas the potential to become significant.
File Structure
Atlas files are stored in a tagged format. Each data item in the file ispreceded by a tag identifying the data, and by a length field specifyinghow long the field is. This structure provides several benefits; the first isposition independence — each chunk of data is interpreted independentof the data around it, and is not required to appear at a particular offsetin the disk file — it may be inserted anywhere in the file. The secondadvantage is that the file structure is effectively separated from theprogram’s version. A file created by a later version of the atlasconstruction software, Gluclose, may still be read and understood by anearlier version of MacOStat, it simply skips unrecognized tags. This inturn means that development and distribution of atlas construction andbrowsing software can proceed independently. A common problem inmany applications is the lack of forward file compatibility, this blockstructure eliminates the problem in all except the most extreme cases,and thus allows the developers more freedom in adding useful features.
Implementation Details
Data structures, either in the form of classes or other formalisms, makeup the core of an application. A well-designed data structure must modelthe reality being represented and must provide a structure easily

accessible to, and supportive of, the internal program code. Object-oriented design methods (in which classes include both the data and thefunctions to manipulate that data) are often used to meet theserequirements. Good classes present an opaque interface to the applicationallowing access to the data the instantiated objects maintain, while hidingthe actual implementational details from the application. This data hidingresults in better modularity, which allows future enhancements to bemade without disrupting the existing the program code.
Macrovoxels
As an example of the value of opaque data structures, let us first considerthe method we use for storing atlas image voxels. A typical method oforganizing volume data is in the form of a monolithic array of voxels; wedo not use this structure for reasons that will be detailed later. Instead,we group voxels into clusters we call macrovoxels, and organize thesemacrovoxels into a structure we refer to as a voxel map (Listing 1, 2). Toaccess an individual voxel, one requests a specific macrovoxel byproviding the voxel map with the macrovoxel’s address in atlas space, andthen requests the individual voxel by providing that voxel’s address to themacrovoxel. A voxel value is returned. At no point does the voxel mapneed to understand how the individual voxel data is stored, somacrovoxels supporting binary, 8, 12, 16 or wider bit data may be storedin the voxel map. In practice, the voxel map’s client needs to know the bitdimensions of the individual voxels, as it needs to set the correct pixels inthe screen buffers for display, but no other part of the application needsto be aware of this implementation detail.
We use the macrovoxel structure for both performance and storageconsiderations. Computer memory and file systems are essentially one-dimensional systems, where the only access to an individual data item isby some index from a defined location. Mapping multi-dimensional datainto memory is essentially an exercise in bookkeeping, however, localityof data is preserved only along one dimension - if the voxel at [X,Y,Z] isadjacent to the voxel at [X+1,Y,Z], and the maximum dimensions of theatlas are (m,n,o), then the distance to [X,Y,Z+1] is m x n voxels away. Thisis an important consideration when accessing large data sets for two

reasons. First, modern processors use a cache to provide quick access torecently used data, and nearby data - a fixed amount of data is moved intoa cache (a cache line), on the first access, and after this, the cached copyof the data is accessed, rather than the data in RAM. Cache memoryaccess is much faster. If the data to be accessed during slicing is localized,most of it can be loaded into cache, and processing speed enhanced. If itisn’t cached, then the “cache hit rate” drops, and processing slows down.Second, modern systems utilize a virtual memory manager (VMM), whichtrades disk storage which is slow but capacious, for RAM memory, whichis more limited in capacity but much faster. When a particular memorylocation that has been paged to disk is required, the VMM brings it intoRAM memory. This is a slow process, and so it is desirable to minimizethese page loads.
The macrovoxel architecture reduces some of the drawbacks of largemonolithic arrays. We group nearby voxels into a chunk, typically 16voxels on edge. These chunks are then arranged into a structure we call avoxel map (Figure 4). The voxel map comprises the atlas data, and is theonly entity to which the document class needs to maintain a reference. Bygrouping voxels into these macrovoxels, we now have a data block that isroughly the size of a VMM page, and also fits into a small number ofcache lines. Thus, any voxels (row, column, plane) that are spatiallyadjacent are now also physically adjacent in memory, which improvesmemory access performance. Consider an attempt to reslice an atlas: ifthe slicing plane is coincident with the data set (i.e.. examining only asingle plane of data in an array) then only the data to be displayed, pluspossibly a cache line and/or VMM page frame on either side of the dataplane need to be moved. In this case, slicing the monolithic array will befaster than a macrovoxel array, as in the latter 16 planes (based on a 16-voxel on edge macrovoxel) will need to be moved. If, however the slicingplane is perpendicular to the data set major axis (cuts across many arrayplanes), then given the nature of the array, much more data will need tobe moved for the monolithic array than for a macrovoxel array (Figure 5).
An additional advantage of the macrovoxel architecture is that it allows usto eliminate empty voxels from storage. By empty voxels we mean those

voxels that exist outside the contour of the 3D image we are representing.Biological images are rarely in the form of cubes or prisms, but that ishow most arrays (including macrovoxel arrays) represent data - thisrepresentation means that location information may be computed giventhe three dimensions of the array, rather than stored in some fashion. Theresult is a reasonably compact data representation. This fails, however, ifthe object being represented deviates significantly from a prism. In ourdomain, brain imaging, the subject matter more closely approaches anovoid. This means that the voxels in the corner of the atlas volume haveno useful data in them. By breaking our atlas space up into macrovoxels,we can identify macrovoxels that contain these empty voxels, and replacethat macrovoxel's entry in the volume map with a reference to a singleempty or "white" macrovoxel. This allows us to eliminate large amounts ofempty space, resulting in a reduced disk and memory footprint, with asavings of typically 30%. (Figure 6)
Slicing
The actual slicing (Listing 3) is handled by taking the corners of thevirtual knife (the plane to be displayed on screen), and converting froman atlas-based coordinate system, where the axis units are arbitrarilydefined relative to the atlas geometry, to a coordinate system where theunits are based on macrovoxel indexes. Atlas-based coordinates arecentered in atlas space, which facilitates the rotation and translation ofthe virtual knife, while macrovoxel-based coordinates are based on theupper front left macrovoxel, to facilitate memory accesses. Thisconversion results in the useful property that the macrovoxel containingany given voxel is specified by the whole number portion of the voxel'scoordinate. The fractional part is then scaled by the macrovoxel size(usually 16 voxels) to give the exact voxel. This scaling thus allows voxeladdress computation almost as efficiently as if a monolithic array were tobe used.
Once this scaling is completed, we divide opposite edges of the virtualknife into segments corresponding to one of the dimensions of the displayspace. From each of these segments, we project transect vectors to theopposite side of the virtual knife, and divide these into segments

corresponding to the other dimension of display space. Each of thesesegments now can be mapped directly to a voxel in our macrovoxel array,and the image buffer is populated by iterating over the segments on thevirtual knife (Figure 7).
Finally, we provide a class to specify the virtual knife location. Anychanges to slicing angle or position are forwarded to this class, to whichthe slicing classes refers. Using this mechanism, the slicing classes needno knowledge of the basic document objects - they only need to knowabout the data set to be sliced, the screen buffer the sliced image iswritten to, and the virtual knife location.
Atlas construction
Atlas construction (via Gluclose) is essentially the reverse of atlas slicing.First, an array of macrovoxels is created. Here, the entire array needs tobe allocated, as the final population will not be known until constructionis complete. Each pre-aligned frame comprising the data set is loaded, it'slocation in atlas space determined either by data included with that file orby it's position in the list of frames, and it's pixels converted to voxels andwritten to the macrovoxel collection. During this process, gray values areequalized or remapped based on any included calibration curves. Once allframes have been loaded, the collection of macrovoxels is checked fordata content, and empty macrovoxels eliminated. The completed data setis then written to disk. Delineations, in the form of outlines, areaccumulated and handled in a similar fashion. The final calibration curve,a table of VOI names and display data, and coordinate systemtransformation data are also written to file.
Human Interface
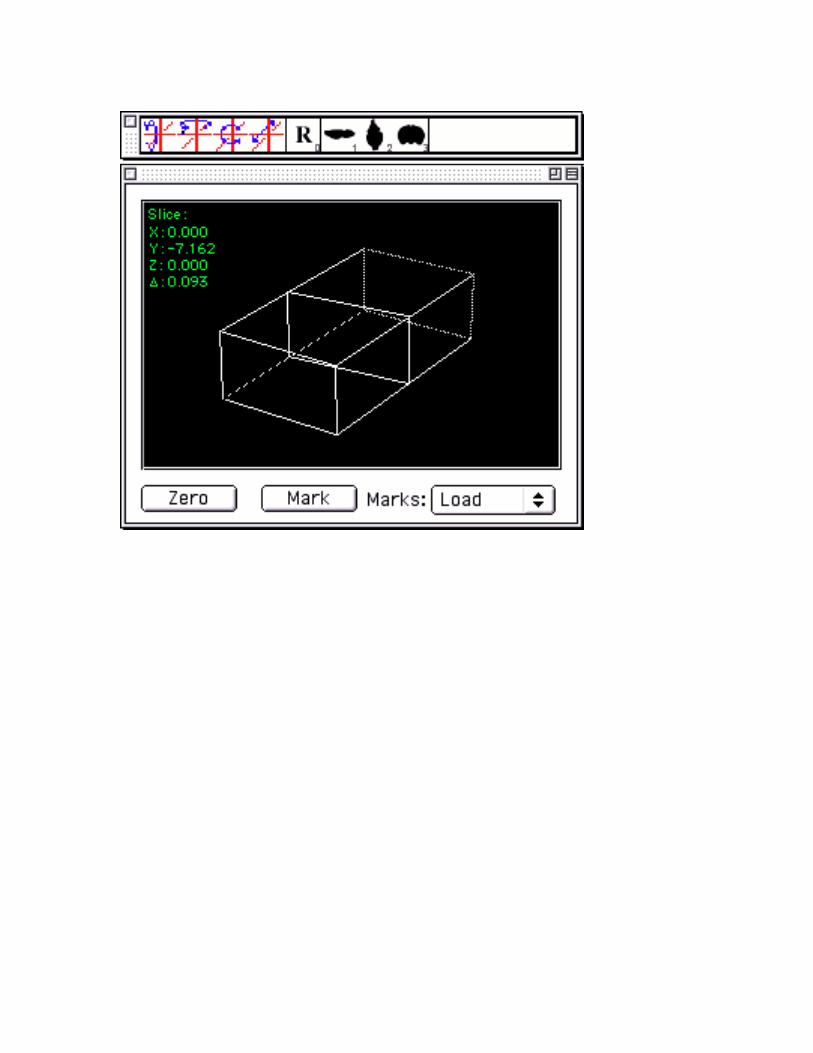
The human interface of MacOStat provides the user with a view of thedata set at the current virtual knife position and any associateddelineation, a schematic view of atlas space showing the position of thevirtual knife, and the necessary controls and menus to control theapplication (Figures 8,9).
Using a control strip,(a utility window with icons representing commands)the user can switch basic slicing axis or presentation: coronal, sagittal, orhorizontal. Rotation and translation of the virtual knife is also controlledby this strip.
Navigation through atlas space is done by translating and rotating thevirtual knife. These actions are carried out via mouse movements: Theuser selects the action desired from the navigation control strip, thenclicks and drags the mouse over either the view of the atlas slice, or overthe wire frame diagram of the virtual knife and atlas space. Dragging overthe wire frame provides coarse movement control, and the slice viewprovides fine movement control. In both cases, the display contentchanges to provide direct feedback to the user.
In addition, the rotation and translation of the virtual knife is provided inthe upper left corner of the wire frame window. In addition, a set of textentry boxes are provided to allow the user to specify these valuesnumerically. Finally, a facility is provided to remember particular virtualknife orientations, and recall them via a popup menu. These savedpositions can may be written to file, and loaded into memory.
Dragging the mouse over the atlas slice display itself also displays the X, Yand Z coordinates of the mouse, expressed in atlas units. Data needed forconversion of atlas coordinates to stereotaxic coordinates can beembedded in the atlas data files, and will be used if available. In this case,the mouse pointer location is expressed in stereotaxic coordinates ratherthan the atlas-relative coordinates.
Atlas data sets may also contain delineation data; this data is shown eitheras a colored outline on the gray-scale image, or as a translucent coloredarea. Colors are user-selectable. In addition, the user may turn thedelineation display on or off, and may define a subset of individualstructures for display (Figure 9). Display lists complete with colorspecifications may be saved to a file, and reloaded as desired. The fileitself is in the form of tab-delimited text, and so may be viewed and editedwith standard word processing and spreadsheet applications. Eachstructure is specified by both an abbreviation and a name.

Finally, it is possible to save sequential virtual slices to individual datafiles. To save these slices, the starting and stopping positions are marked,and the number of slices and manner in which the virtual knife position isinterpolated is specified. For example, if the starting and stopping slicesare not parallel, one can specify that only the starting or stopping knifeangle should be used, the mean angle, or that the angle should beinterpolated across the span. Using this facility, the user can openindividual experimental sections and match them to the 3D atlas torapidly generate a set of matching planes that can then be employed indelineation of the experimental data using Brain.
Software Availability
The software (MacOStat) may be downloaded without fee fromwww.neuroterrain.org. It requires MacOS 8.6 and CarbonLib 1.3 or later.
Acknowledgment
This work was supported by NIH award P20 MH62009 and US Air Forceagreement F30602-00-2-0501

References[1] Franklin, B. J. Keith, G. Paxinos, The Mouse Brain in Stereotaxic
Coordinates. Academic Press, San Diego, California 1997
[2] Paxinos, G., C. Watson, The Rat Brain in Stereotaxic Coordinates.Academic Press, San Diego, California 1998
[3] Swanson, L. W., Brain Maps: Structure of the Rat Brain. Elsevier,Amsterdam, Netherlands, 1992
[4] Mai, J. K., Assheuer, J., G. Paxinos, Atlas of the Human Brain.Academic Press, San Diego, California 1997
[5] Toga, A. W., E. M. Santori, R. Hazani, K. Ambach. Rat Atlas ImageDatabase, http://www.loni.ucla.edu/Research_Loni/atlases/rat/
[6] Sundsten, J W. Digital Anatomist: Interactive Brain Atlas,http://www9.biostr.washington.edu/da.html
[7] Kikinis, R. A DIGITAL BRAIN ATLAS FOR SURGICAL PLANNING,MODEL DRIVEN SEGMENTATION AND TEACHING,http://www.spl.harvard.edu:8000/pages/papers/atlas/text.html
[8] Sidman, R. L., B. Kosaras, B. Misra, S. Senft. High ResolutionMouse Brain Atlas,http://www.hms.harvard.edu/research/brain/
[9] Bertrand, L., J. Nissanov, 3D Atlas of the Mouse Brain, ComputerVision Laboratory for Vertebrate Brain Mapping, Philadelphia,2001. http://www.neuroterrain.org/
[10] Jones, E G. et al, (Resus atlas) UC Davis/UC San Diego HumanBrain Project,http://neuroscience.ucdavis.edu/hbp/project2.html
[11] Flybrain, http://flybrain.neurobio.arizona.edu/Flybrain/html/
[12] VoxBlast http://www.vaytek.com/VoxBlast.html (commercial)
[13] Amira -- visualization and reconstruction for 3D image data.http://www.amiravis.com (Commercial)
[14] IDL -- data analysis, visualization and applicationdevelopment. http://www.rsinc.com/ (Commercial)

[15] Open Visualization Data Explorer -- an application anddevelopment software package for visualizing 2D/3D data.http://www.research.ibm.com/dx/ (IBM Public License)
[16] Lohmann, K., Gundelfinger, E. D., Scheich, H., Grimm, R.,Tischmeyer, W., Richter, K., Hess, A. (1998) BrainView: acomputer program for reconstruction and interactivevisualization of 3D data sets. J Neurosci Methods 84(1-2) 143-154.
[17] Apple Computer, Inc., MacApp,http://developer.apple.com/tools/macapp/
[18] Nissanov, J., D.L. McEachron. 1991. Advances in imageprocessing for autoradiography. J. Chem. Neuroanat. 4:329-342.

Figures
Figure 1: Data model class hierarchy and interactions
Figure 2: View class hierarchy
Figure 3: Controller class hierarchy and interactions
Figure 4: Arrangement of microvoxels into macrovoxels, andmacrovoxels into an atlas.
Figure 5. Memory/cache accesses required for (a) macrovoxels vs.(b) monolithic array design.
Figure 6. Actual space occupied by image data within the atlasboundary.
Figure 7. Atlas reslicing. Transect vectors in the slicing plane (virtualknife) are used to select microvoxels for display.
Figure 8. Navigation and control palettes
Figure 9. Horizontal, coronal, and saggital slices, with shaded VOIs,and VOI selection dialog, taken from our mouse atlas [9]