design and implementation of a next generation web
TRANSCRIPT

Degree project
Design and implementation of a next generation web application SaaS prototype
Author: Roman Reva Supervisor: Jonas Lundberg External Supervisor: Carl Piva, Proposalsfactory AB Date: 2014-06-11 Course Code: 5DV00E, 30 credits Level: Master Department of Computer Science

AcknowledgementsI would like to thank to all people who supported me during my work on this master thesis. I want to thank to:
• my parents – they helped me to come to Sweden and get this education, and then supported me when I was far away from home;
• my teammates – Oleg Gumeniuk and Mykhailo Kolchenko – it was a really cool time to work with you in ProposalsFactory;
• Viktor Kostov and Andrey Slyusar – for some room space and stable wireless internet connection that you provided while I was running the performance tests, and also afterward, while I was writing my thesis report;
• all the ukrainians in Vaxjo – we spent a lot of time together and I really loved this time.
Finally, my special thanks goes to Carl Piva and Jens Riboe, who gave me and my teammates the great opportunity to become a part of fantastic adventure during the development of a new software product, who gave us a chance to feel how is it to be a part of a just born startup company, who helped us in all difficult situations and have presented us a plenty of different experience.
I really appreciate everything I got from you, guys.
i

Abstract Current master thesis work was requested by company ProposalsFactory AB on 9th of January 2012. This study was to set up a performance benchmark methodology and to run a set of load tests on the target application written in Groovy/Grails in order to investigate its performance, scalability and reliability.
Amazon Web Services were used as hosting platform during the experiments, as they combine both flexibility and easy of use. In order to automate server configuration process, Ubuntu Linux was chosen as an operating system.
Custom benchmarking tool was designed and developed, as no one of existing application did not satisfy our research criteria. The application was implemented as a distributed client-server application, what makes possible generating enough load on the target application from more than one computer.
This benchmarking tool allowed us to investigate vertical and horizontal scalability of the target application. The results of experiments has clearly demonstrated that although horizontal scaling has got a lot of benefits compared to vertical one, both approaches are able to provide significant benefit in application performance and are applicable.
Also an ability of the application to work during the continuous period of time was tested during the 12-hours continuous load test. The results of this test showed that application does not have any memory leaks and can handle high load without any problems.
It was concluded that application does not have performance problems and can be run in production mode. From economical perspective it became obvious that the most convenient server configuration is an application cluster which contains 2 or 4 small server instances.
Keywords: Amazon Web Services (AWS), Amazon Elastic Compute Cloud (EC2), Software as a Service (SaaS), Performance benchmark, Web-applications, Ubuntu Linux, Java.
ii

Content1 Introduction.....................................................................................................................1
1.1 Thesis background...................................................................................................11.2 General background and problem statement...........................................................11.3 Report structure overview........................................................................................2
2 Theoretical basement......................................................................................................32.1 Web-applications basics..........................................................................................32.2 Application performance, scalability and clustering...............................................52.3 Cloud computing and Amazon AWS evaluation ....................................................8
2.3.1 Cloud computing as a concept..........................................................................82.3.2 Amazon Web Services overview......................................................................92.3.3 Amazon AWS instance types.........................................................................102.3.4 Amazon AWS management...........................................................................11
3 Testing approaches.......................................................................................................133.1 Target application performance measurement.......................................................133.2 Automation of cluster launch.................................................................................133.3 Comparative analysis model..................................................................................143.4 Performance benchmark and final analysis...........................................................14
4 Experiments description ..............................................................................................154.1 Performance measurements...................................................................................15
4.1.1 How to measure the performance and what exactly we should measure.......154.1.2 Requirements to the measurement tool...........................................................174.1.3 Overview of existing solutions.......................................................................174.1.4 Design and implementation of a custom load benchmark tool.......................19
4.2 Automation of cluster launch.................................................................................214.2.1 Features of different server configuration types.............................................224.2.2 Using Amazon API Console Tools for server launch....................................224.2.3 Automation of software environment configuration......................................25
4.3 Comparative analysis model..................................................................................254.3.1 What data do we have and what do we need..................................................254.3.2 Metrics descriptions. Getting necessary data from benchmark report...........26
4.4 Performance benchmark and final analysis...........................................................274.4.1 The main idea of the load benchmark.............................................................274.4.2 Plan of experiments. Target configurations....................................................284.4.3 Determining configuration of a load benchmark tool.....................................284.4.4 Practical details and problems........................................................................30
5 Results of the researches...............................................................................................315.1 Vertical scaling test results....................................................................................315.2 Horizontal scaling test results................................................................................345.3 Continuous load test results...................................................................................36
6 Discussion on the results..............................................................................................386.1 Scaling investigation results..................................................................................386.2 Continuous load test results...................................................................................396.3 The economical perspective..................................................................................396.4 Further researches .................................................................................................40
7 Final discussion ...........................................................................................................428 References ....................................................................................................................439 Appendices ..................................................................................................................44
iii

1 Introduction
This chapter provides general information about current thesis work background, what technologies were used. Verbose problem description is provided. Overall report structure is described.
1.1 Thesis backgroundThe main purpose of current thesis work is to address theoretical series of practical challenges relating to usability and web technology and design a new generation web-application, which is going to be delivered using SaaS model. Several researches were taken during this work which are described in this paper and represent the main content of current master thesis.
The thesis is performed together with two other students. All works on project are distributed between the students as following:
• cloud architecture and data modeling – Roman Reva,• server-side programming – Oleg Gumenuik,• client-side programming – Mykhailo Kolchenko.
From a technology perspective the students will challenge the boundaries of what can be achieved with technologies such as Groovy/Grails, ExtJS, Apache Tomcat and MySQL, all running on Amazon AWS EC2 servers with the Ubuntu Linux on board.
The main idea of the application is under Non-Disclosure Agreement and cannot be discussed in this paper. However, all technical details are going to be described.
1.2 General background and problem statementSoftware as a Service (SaaS) is a software delivery model which provides set of services to final customer on demand. This model assumes that final customer does not need to install software at his own hardware, but can just access it via the internet. SaaS has became a common delivery model for lots of business applications.
Nowadays business web-applications become more and more needed. Big, medium and small companies use different sort of applications which can automate some processes and help to spend time and resources in a more efficient way. Although usage of such application can be very helpful for the company, building of a reliable and useful application is a kind of a strong challenge for the developers. The problem becomes even more complicated if the application is going to be used by big amount of users in the same time. Exactly this problem will represent the main topic of current work.
During the writing of this master thesis project a prototype of web-based business application was created. This application satisfies existing business requirements and is going to be finished and used in a production mode soon. Although the application is not ready for a production usage yet, we're already interested in how it will behave in real-life conditions.
That is why we are going to evaluate the ability of this application to work under high load and investigate its performance and scalability. For this purposes a set of load tests will be run and the results will be analyzed in order to understand if the application has any performance or memory problems.
Formal problem statement which is solved in the framework of current master thesis work is provided below.
To address the new situation we need to evaluate a performance of a high-loaded server application and test its scalability. As a result of a research we should obtain the comparative analysis of different server configurations,
1

knowledge what maximal load the application can handle and how it behaves under high load during the continuous period of time.
To solve this problem let us split it up into smaller sub-problems. We need:• to find a way to measure the target application performance and scalability.
Or in other words, we have to find or create a software which allows us to measure main performance characteristics of the target application, such as request-response latency, application throughput and others;
• to automate the process of cluster launch, so we are able to run different cluster configuration easily and quickly;
• to build a comparative analysis model to be able to compare different cluster configurations and find the most convenient one;
• to perform a set of performance benchmarks on a set of different cluster configurations and then analyse and compare results.
To get deeper understanding of what we need to do, let us take a deeper look into each of these problems.
1.3 Report structure overviewCurrent report contains several key sections. The list of these sections with their short descriptions can be found below.
• Theoretical basement. Current section introduces all necessary terms and provides theoretical basement for the problem. Common problems of high-loaded applications' design are discussed. Some classical solutions of these problems are provided and discussed.
• Section Testing approach defines challenges that should be resolved in the framework of current thesis work and provides a problem solution plan for this thesis work.
• Experiments description. A detailed description of experiments taken during the research work is provided in this chapter. All groundwork which was done before the experiments is described.
• Section Result of the researches contains analyzed data, all charts, tables and diagrams with short comment. Current section provides all material we need to compare different server configurations.
• The results of the main research can be found in the section Discussion on the Results. Current section contains the discussion part only, all charts and tables are provided in the previous section. Some further researches which are going to be done before the launch of the application are also described.
• The last section is called Final discussion and contains some words about the research achievements and its meaning for the project. This section summarizes the whole content of this thesis work and draws final conclusions. The role of current work for the customers and final users is described.
2

2 Theoretical basement
Current section introduces all necessary terms and provides theoretical problem basement. Common problems of high-loaded applications design are discussed. Some classical approaches of problem solution are provided.
2.1 Web-applications basicsFirst of all, to have a better understanding of the basic principles let us take a look at the architecture of a typical web-application.
Interaction with web-applications is based on Hypertext Transfer Protocol (HTTP). HTTP is a protocol over a plain TCP transport layer. It defines a standard way of interaction between client and server in a request-response manner. As HTTP assumes sending of non-encrypted data, it cannot be used for sending sensitive data. In this case HTTP Secure (HTTPS) protocol is used instead. HTTPS is ordinary HTTP, but it is delivered using a SSL (Secure Socket Layer) TCP transport layer instead of plain TCP. Although the production version of application uses HTTPS protocol, in the context of this work only interaction via HTTP protocol will be discussed, as far as it is much easier to run load benchmark over the plain HTTP.
From technical perspective we can define a simplest web-application as a standalone application which listens to the incoming connections on the port 80. When connection is established web-application reads HTTP-request, processes it and replies with HTTP-response (see figure 2.1).
Figure 2.1 The simplest web-application interaction schema.
In common case HTTP-message can contain different types of data, starting from plain text or XML-message and finishing with binary files. All web-applications can be divided into two main groups:
• web-sites – web-application which can be accessed using web-browser and which are designed for human usage; web-sites usually provides information in a human-readable format;
• web-services – web-applications which are designed to be used by other software applications; web-services usually provide responses in formats which can be easily read programmatically, like XML or JSON.
Quite often web-applications need to use databases for storing data. In this way interaction becomes a bit more complex, like it is presented on the figure 2.2.
Figure 2.2 Schema of web-application which interacts with one database server.
3

During the last years web-applications become more and more necessary and a lot of approaches and technologies which simplify a creation of web-applications were developed. Particularly Java web-applications are usually based on servlets. Servlets represent the lowest layer in Java web-applications which is responsible for processing HTTP-requests and generation of HTTP-responses. By its nature java servlet itself cannot be run as a standalone application, so it required to be run by another server application which is called servlet container.
In a very simplified manner nature of servlet container is represented on the following diagram (figure 2.3).
Figure 2.3 Servlet container. Simplified diagram.
Servlet containers are mainly responsible for handling incoming HTTP-requests and redirecting them to the corresponding deployed application according to the request URL. Also they provide some additional functionality, like HTTP-session management, listening and redirection of incoming socket connections on particular port, memory and CPU consumption monitoring, or database-connection management. Some of these features (like HTTP-session mechanism) are accessible by deployed web-applications, some of them not.
Nowadays plenty of different servlet containers exist. The most popular distributions are:
• Apache Tomcat Servlet Container;• JBoss Application Server;• Oracle WebLogic Server;• Sun Glassfish Enterprise Server;• WebSphere Application Server.
Although different servlet containers have got different characteristics and possibilities, but they are all used for a common purpose – running Java web-applications.
4

2.2 Application performance, scalability and clusteringNow, when we understand web-applications basics, let us discuss the questions of performance and scalability. First let us try to understand what the performance is. Some basic common definitions are provided by Lawrey (2012), but we will use these terms more in the context of web-applications.
Application performance in general case can be defined as a ratio between an amount of useful work performed by the application and amount of the consumed resources. We can say that performance is high when application can perform some operations using small amount of memory and CPU time, and it is low otherwise.
Latency is a time delay in a request-response interaction. Latency can be one-way and round-trip . One-way latency shows how much time does it take to send a message (request or response) from one computer to another. Round-trip latency is the time it takes for a client to send a request to the server and receive the response from the server. Latency is usually measured in milliseconds.
Throughput is a rate which shows how many requests can be handled by the server-application over some period of time. Mathematically it can be represented as total number of successful requests divided by time of experiment. Usually throughput is measured by number of handled requests per second. For example, if during 120 seconds system was able to process 600 requests, then the throughput equals 600 / 120 = 5 requests per second.
Degree of concurrency is a rate which shows how many concurrent requests are handled by the server in average in each moment of time. Degree of concurrency can be defined as a multiplication of a latency and a throughput. For instance, if throughput equals 5 requests/sec and in average it takes 200 ms to receive the response from server, than degree of concurrency can be calculated as 5 * 0.200 = 1.
We also want to introduce a concept of application scalability. Formally scalability can be defined as a ratio between increasing of computing power and benefit in application performance. We can say that application is highly scalable if increasing of computing power gives sufficient benefit in performance.
When we are talking about the high-loaded web-applications, we can say that its performance in a good way is represented by its throughput. Obviously, higher throughput means better performance of this particular application. We can claim that scalability of web-application can be defined as an ability of the application to increase its throughput when hardware resources are added.
The figure 2.4 illustrates difference between highly and poorly scalable applications.
Figure 2.4 Current chart illustrates how the throughput changes for highly and poorly scalable applications when the
number of processors on a server is increased.
5

In general case web applications scaling can be divided into horizontal and vertical. Horizontal scaling assumes increasing the number of application servers where the application is run. Vertical scaling suggests to upgrade underlying hardware only without changing its quantity.
According to our experiences the vertical scaling usually can be done easier than horizontal one, it quickly faces its upper limit when further upgrade is impossible. We can claim that horizontal scalability is more flexible, but how should it be organized? Now we need to introduce a concept of application clustering.
Let us say that hardware server – is a computer hardware system which has a purpose to provide some services to other computers via computer network. Then application cluster is a set of hardware servers which is used for running distributed applications. The simplest cluster architecture is provided in figure 2.5.
Figure 2.5 Simple application cluster architecture.
Let us discuss main components of such application cluster.• Application servers. Application server is usually represented by hardware
server with a single servlet container there. Each servlet container has got its own copy of application which can interact with databases.
• Database server. Usually it is represented by a hardware server with some database management system installed on it. In the simplest cluster there is usually one or two database servers. The main server is called master and the second one – slave. In this case application servers interact only with master, while slave contains replicated from the master copy of the database. This guarantees that actual database backup exists in each moment of time. Also if master server becomes unavailable for some reasons, replicated server can temporary replace it.
• Load balancer. The main responsibility of the load balancer is distribution of the incoming traffic between the application servers. All end users do not know anything about application servers, but they know address of load balancer. When some user send request to the balancer, the last selects the application server with the smallest load and redirects the request to that server. Application
6

server receives request, process it and return back to the load balancer, which redirects request to the end user.
Although such cluster architecture is quite simple, some tricky moments exist. Let us discuss some aspects of clustering in details.
Clustering of stateful application. First of all, described clustering model works fine for stateless applications, but as soon as we have stateful system, first small problem appears. It is well known, that each servlet container stores HTTP-session data in the file system of current hardware server. Each application server has got no clue what is happening on other servers, they just do not know about each other.
Now let us imaging such a situation. End user sends first request to clustered application and is redirected to the application server A by the load balancer. The application performs credentials check and saves result in the HTTP-session, so it could recognize current user during the next request. When user sends second request, the load balancer redirects him to the application server B. Application at server B does not know anything about this user (because all authentication information about this user exists only at the server A) and rejects a request to perform a required action.
This problem can be solved at least in three different ways. First way is to save session information in the shared place, for example in the database. This works fine if number of user is not so big, but if there are hundreds or thousands of unique users, this will cause extra load on the database server, so it will become a bottle-neck of the whole system.
The second approach is called session replication. Some servlet containers, for example Apache Tomcat 7 (2012), can be configured in a way that each application server in the cluster was aware of all other instances. This creates a kind of abstraction that all instances have got single shared session storage. The main disadvantage of current method is that number of connections between application servers rises quadratically when the number of servers is increased. This makes current method useful for small clusters, but absolutely inappropriate for big ones.
The last method is called sticky sessions. The main idea of this approach is to configure load balancer in a way that it remembers each user and redirect each one to his own application server. Usually each user is “sticked” to a particular application server during the first request when HTTP-session is created, and released when HTTP-session is destroyed. During the experiments we're going to use exactly this method, as far as it provides us good flexibility and small overhead.
Bottle-necks in the cluster. Another clustering problem lies in the fact that the whole system should be balanced properly. In other words, all elements of cluster should have more or less equal throughput, otherwise the total throughput of the system can be limited by one single server. For example, if database server cannot handle more that 100 concurrent connections, it can easily become a weak part of the system and latency of the system could be several times higher if we compare it to the normally balanced cluster. In this case we will have a lot of application servers which most part of the time are just waiting for a database connection.
In general case each element of the system should be configured manually so that system could provide maximal capacity during its work.
Application servers health checks. Another problem appears if we try to answer the question: “What happens if one of the application servers dies?”. As this situation is quite real, we need to configure load balancer in a way, so it perform regular checks if all application servers are alive. We should also define a policy what should happen if some server dies. If this happens, load balancer can either remove dead server from the list of healthy nodes and distribute the load over the rest of instances, or redirect all traffic to some particular node. The last option can be useful, when different application
7

servers have different roles in the system, or when it is important not to lost HTTP-sessions which are replicated to the reserved server.
As a conclusion for this section we can say that clustering is really powerful approach which allows to scale application horizontally. Although the main idea of clustering is very simple, we should notice that configuration of a real cluster for real application can become tricky in some situations. As soon as every application has got its own specifics, application cluster should be configured according to this specifics.
2.3 Cloud computing and Amazon AWS evaluation Current section describes the basics of cloud computing concepts and introduces the main delivery models. A brief overview of Amazon Web Services is given together with the most common types of servers that are provided by the vendor.
2.3.1 Cloud computing as a conceptCloud computing as a concept became quite popular during the recent years. It solves some old problems in a new way, and this way is really impressive. Let us discuss what benefits cloud computing can provide us compared to classical approach in the context of creation of high-loaded web-applications. First of all let us define, what the cloud computing is.
Wikipedia (2012) provides quite nice definition for the cloud computing concept:
“ Cloud computing refers to the delivery of computing and storage capacity as a service to a heterogeneous community of end-recipients. The name comes from the use of clouds as an abstraction for the complex infrastructure it contains in system diagrams. Cloud computing entrusts services with a user's data, software and computation over a network.”
Cloud computing service providers can deliver capacity to the end user using three basic models: Software-as-a-Service (SaaS), Platform-as-a-Service (PaaS) and Infrastructure-as-a-Service (IaaS).
Software-as-a-Service assumes providing not a capacity itself, but a software product which uses this capacity. Many famous services like Google Docs, Gmail or Dropbox are cloud-based and provide computing or storage capacity together with native software. Each end user can easily use this software products which are hosted at the remote hardware servers according to the terms of agreement between him and service provider.
Platform-as-a-Service services usually provide not a software, but a configured server environment. Environment could include either vanilla operating system, or have some installed software, for instance, database or application servers. This environment is used by client for deployment of his own applications, which are provided as a service to the end users. Good example of PaaS delivery model is Google App Engine.
Infrastructure-as-a-Service model provides capacities in the most flexible but also in the most complicated manner. IaaS assumes providing not ready for usage servers, but an infrastructure which allows client to configure necessary server configurations manually. It means that client should configure operating system, application servers and interaction between servers himself, what gives him great power. Today the best example of IaaS services are Amazon Web Services (AWS).
In the context of current thesis work we're going to use IaaS model as it provides the highest flexibility according to the definition. So, let us take a detailed look at Amazon Web Services and try to understand how can we use it for our purposes.
8
2.3.2 Amazon Web Services overviewAmazon Web Services were introduces in the year 2006 and has been improved a lot since that time. Today Amazon offers a set of different products which are known as Amazon Web Services. As we need scalable and easily configurable hosting platform, we could be interested in some services, which are described below.
Simple Storage Service (S3) is a service which provides flexible internet storage mainly for developers. Amazon provides (2012) following description of S3 service:
“Amazon S3 provides a simple web services interface that can be used to store and retrieve any amount of data, at any time, from anywhere on the web. It gives any developer access to the same highly scalable, reliable, secure, fast, inexpensive infrastructure that Amazon uses to run its own global network of web sites. The service aims to maximize benefits of scale and to pass those benefits on to developers.”
Amazon S3 is mostly interesting for developers who supports web-systems which have got really a lot of static or media content, like video-files, images or audio records.
Elastic Compute Cloud (Amazon EC2) is a web service which provides compute capacity in the cloud. Official Amazon web-sited provides (2012) such a description for EC2 services:
“Amazon EC2’s simple web service interface allows you to obtain and configure capacity with minimal friction. It provides you with complete control of your computing resources and lets you run on Amazon’s proven computing environment. Amazon EC2 reduces the time required to obtain and boot new server instances to minutes, allowing you to quickly scale capacity, both up and down, as your computing requirements change. Amazon EC2 changes the economics of computing by allowing you to pay only for capacity that you actually use. Amazon EC2 provides developers the tools to build failure resilient applications and isolate themselves from common failure scenarios.”
Amazon EC2 allows to create virtual servers instances inside the cloud and configure them remotely via Secured Shell (SSH) protocol. For launch of a new instance an operating system image should be provided. As server is represented by virtual machine it is possible to deploy so called Amazon Machine Image (AMI) without installing operating system manually. Plenty of ready images of most popular operating systems like Linux, FreeBSD and even Windows exists and can be used by every AWS client. After launch server is connected to the internal network and can be accessed by public DNS name via SSH.
EC2 offers different hardware server configurations, so the client can choose the most convenient one for his purposes. EC2 instance types are described in details in the section (2.3.3) of current report.
Elastic Block Store (Amazon EBS) provides virtual hard drives which can be connected to the EC2 server instances. Official site provides (2012) the following explanation according to the Amazon EBS:
9

“Amazon Elastic Block Store (EBS) provides block level storage volumes for use with Amazon EC2 instances. Amazon EBS volumes are off-instance storage that persists independently from the life of an instance. Amazon Elastic Block Store provides highly available, highly reliable storage volumes that can be attached to a running Amazon EC2 instance and exposed as a device within the instance. Amazon EBS is particularly suited for applications that require a database, file system, or access to raw block level storage.”
Amazon EBS is extremely important service because EC2 server instances do not provide any reliable hard drives. This means if instance is rebooted or terminated, there is a risk that all data will be lost. To solve this problem EBS Boot Instances were introduces recently. Eric Hammond in his blog (2012) strongly recommend to use this type of instances, but it is anyway recommended to save important data on a separate EBS volume.
2.3.3 Amazon AWS instance typesAs different applications require different type of hardware, Amazon provides different types of instances which are grouped into several categories. For today there are following groups of instances:
• Standard instances – the most common configurations which can be used by the most types of applications.
• Micro instances – for today there is only one instance in this group. Micro instances have got only 600 MB of memory and can run only light-weight applications.
• High-memory instances – server instance types which have got from 17 up to 68 GB of memory, which can be used for high memory consumptive applications.
• High-CPU instances – can be used for solving complex mathematical and algorithmic problems.
• Cluster Compute instances – the most powerful type of instances, which with increased network performance.
• Cluster GPU Instances – these instances are similar to Cluster Compute instances, but additionally they have got 2 NVIDIA cards on the board, what makes these instances well-suitable for running graphical tasks, for example, 3D model rendering.
We will pay attention only to the standard instances, as they're providing enough capacities for running our application and have got the lowest price. There are four types of standard instances according to the official Amazon Web-Site (2012).
• Small instance has got 1.7 GB of memory, 160 GB of disk space and single-core processor with 1 EC2 Compute Unit.
• Medium instance has got 3.75 GB of memory, 410 GB of disk space and single-core processor with 2 EC2 Compute Units.
• Large instance possesses 7.5 GB of memory, 850 GB of instance storage and dual-core processor, each core with 2 EC2 Compute Units.
• Extra large instance has 15 GB of memory, 1,690 GB of disk space and quad-core processor with 2 EC2 Compute Units each.
10
We should notice that one EC compute unit is some abstract measure of performance which can be changed. However, for current moment Amazon informs (2012) that:
“One EC2 Compute Unit provides the equivalent CPU capacity of a 1.0-1.2 GHz 2007 Opteron or 2007 Xeon processor. This is also the equivalent to an early-2006 1.7 GHz Xeon processor referenced in our original documentation.”
As we can see, even small EC2 server instance provides enough capacity for running ordinary application or database server.
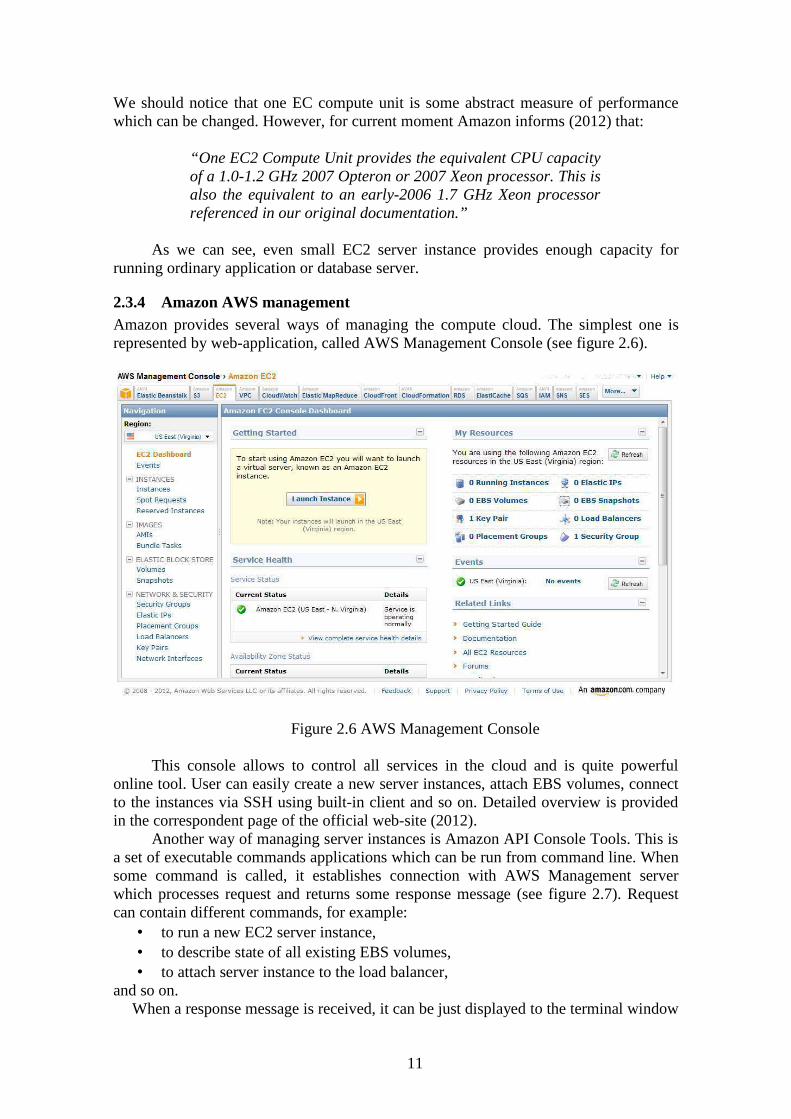
2.3.4 Amazon AWS managementAmazon provides several ways of managing the compute cloud. The simplest one is represented by web-application, called AWS Management Console (see figure 2.6).
Figure 2.6 AWS Management Console
This console allows to control all services in the cloud and is quite powerful online tool. User can easily create a new server instances, attach EBS volumes, connect to the instances via SSH using built-in client and so on. Detailed overview is provided in the correspondent page of the official web-site (2012).
Another way of managing server instances is Amazon API Console Tools. This is a set of executable commands applications which can be run from command line. When some command is called, it establishes connection with AWS Management server which processes request and returns some response message (see figure 2.7). Request can contain different commands, for example:
• to run a new EC2 server instance,• to describe state of all existing EBS volumes,• to attach server instance to the load balancer,
and so on. When a response message is received, it can be just displayed to the terminal window
11

or saved to the file using standard stream mechanism.
Figure 2.7 Main idea of AWS instance management
As all parameters for each command are transferred as command arguments it is possible to call it from other applications or scripts. This is the great benefit of Amazon Web Services, as it becomes possible to automate the whole process of application server launch. The most simple way is to write shell scripts which use API Console Tools to control server instances in the cloud.
Shell script is a script which can be executed by the command line interpreter which is built in each Unix-like operating system. Shell scripts are very common because they become really powerful when they are combined with other command line tools and standard console streams.
All these features make Amazon Web Services perfect platform for deployment of high-loaded applications, because it provides great flexibility as well as simplicity of use. In current thesis work we are going to automate launch of different application servers in order to shorten server configuration time. All details according to this topic are provided in the section experiment description of current report.
12

3 Testing approaches
As it was already said, an enterprise server application was created by group of three students during writing of this master thesis work. As we need to be sure that current software application can serve sufficient amount of customers we need to find an appropriate hardware server configuration, so that our server application was able to handle all user requests. This section describes approaches what are used for this purposes.
3.1 Target application performance measurementWe need to solve current problem in order to achieve all data that is necessary for the final analysis phase. To solve it we have to run a set of performance tests, which will measure different characteristics of the target application.
We can define main two groups of load tests:1. Short stress-tests. Stress-tests have purpose to find what maximal load can be
handled by the application which is run on different hardware configurations. Stress tests are going to be run during a short period of time, for instance 20-30 minutes, and will show how the application behave under critical load. As a result we will get statistical information about each request which was sent to the application under each hardware configuration.
2. Continuous load-tests. During these tests we will test the ability of application to work for a continuous period of time under the load about 80-90% from maximal. Application memory state is going to be monitored during these tests. This will simulate a normal application work flow and will show if the application has got any memory leaks, or some other hidden problems.
During running both stress-tests and load-tests we will track full response time for each request, response content generation time and some other properties. All this information will be used as raw data for the final analysis in the last phase of the research. On this step we should find or create which will run load benchmark on target application.
3.2 Automation of cluster launchTo run the application on a remote server a corresponding software environment should be configured there. Ubuntu Server 11.10 was selected as an operating system for the server, and the application relies on the following underlying software:
• Java 6 represented by OpenJDK;• Apache Tomcat 7 application server;• MySQL 5 database server.
Launching one server in general case assumes an installation of operating system, setting up security policy, installation of necessary software, configuration of this software and further deployment of the application itself. As soon as we want to perform stress and load tests on different hardware configurations, we will need to set up these configurations before each test. In other words, manual configuration of each application server takes lots of time.
That is one more reason why we have chosen Amazon Web Services as a deployment platform. Using Amazon API Console Tool we can automate launch of a new application server or even launch of the whole application cluster. In other words, cluster launch automation will make taking performance experiments easier and will help to concentrate on the main flow of the research instead of technical implementation.
13

3.3 Comparative analysis modelAfter performance benchmark is done we will need to understand what does the output mean. Performance tests will provide raw data which is hard to read and understand. As soon as we are going to have tests on different hardware configurations we will need to compare different configurations between each other and find an optimal one. Also we need to understand how scalable the application is and if there are any scaling boundaries.
To make performance tests output more readable we need to build up a model which will process raw data. For each configuration this model should provide the following information:
• maximal achieved throughput;• typical response time;• maximal and minimal response time;• distribution of the response time.
Using this data we will be able to compare different server configurations, analyze scalability of the target application, and then stick to the most convenient configuration for the first period of time.
3.4 Performance benchmark and final analysisAfter the performance benchmark is taken we will apply the analysis model to the raw data and will be able to summarize up and discuss achieved results. We will need to analyse if application has got any problems, and if it has – to define the reasons of this problems.
This is actually the final step of the research which will solve the main problem of this master thesis work. The research results and a discussion on it are going to be described in the section Results of the researches.
14

4 Experiments description
Current sections describes all preparations we need to do to run performance benchmark. It describes the what data do we need to collect and why, what are the ways of obtaining this data, how can we automate the server launch process and what comparative criterias should we introduce.
4.1 Performance measurementsIn this subsection we describe how to the round-trip latency should be measured for the web-applications, clarify set of requirements to the performance benchmark tool, review existing solutions and provide arguments why it is better to design and implement our own utility.
4.1.1 How to measure the performance and what exactly we should measureTo understand what exactly we should measure, let us take a look at the HTTP request-response life cycle. A simplified diagram is provided in figure 4.1.
Figure 4.1 HTTP request and response processing
Even in the simplest case time it is possible to measure time on different parts on the HTTP-request route, as far as we have 4 different nodes in the chain. The most easiest case is to measure how much time does it take for client to receive response from the server system. In this way we should just fix the time when the request was sent and when the response was received, and then subtract the second value from the first one. The obtained value will show how much time does it take for server to reply for a request. In other words we will receive exactly round-trip latency.
In a different case we may be interested in how much time does it takes to redirect HTTP-request from web server to application server. Then we should subtract round-trip latency of application server from round-trip latency of web server and we will get necessary value.
As soon as we are going to have a performance benchmark in order to understand how our application behaves under high load, the only parameter we should know is only round-trip latency for the whole system. Here we should remind one more interesting detail.
If we are talking about web-sites, then we should understand that when user opens a web-page in his browser, it sends not a single request, but a plenty of them. The first request for an HTML page content is always sent to the application server, but the rest of resources can be downloaded from a separate server which contains static content only. Sometimes this could even be the web-server which stands in from of application server. In this case the full page load time should be measured like it is shown on the figure 4.2.
15

Figure 4.2 Simplified schema illustrating how the round-trip latency for the full HTML page with static content should be measured
In real world the diagram is even more complicated, as modern browsers always download all static content in several threads in the same time, but not one by one. Some browsers, like Google Chrome or Mozilla Firefox can show a waterfall diagram how the resources are being downloaded during the page load. As an example of such diagram from the Firebug is provided in figure 4.3.
Figure 4.3 Firebug displays a waterfall diagramhow HTML page with resources is downloaded
The main idea is the same: the round-trip latency should be measured from the first request for the page content to the last response which provides any kind of page resource.
16

4.1.2 Requirements to the measurement toolAfter we have defined what exactly do we need to measure, we are able to define a list of requirements for a software utility to perform a load testing and collect necessary data.
• First of all, application should be able to generate sufficient load at the target system. Otherwise the obtained throughput will indicate not a maximal throughput of the target application, but the maximal throughput of the request generating software. We should remember that we are going to deploy target application to the application cluster, so the maximal load which can be handled by this system can be quite high.
• The application should also provide either all necessary aggregated data in a convenient format, or raw data about each request which was sent to the target system, so we were able to analyze this data later on. Raw data is preferable as it can be processed later on if we need, while aggregated data contains a statistics which cannot be processed properly.
• Then, if application fails, we probably would like to know the reason, what error occurred. It means that application should return a content for the response which HTTP-code means that something went wrong.
• We also need to emulate user browser interaction in a realistic way. To be more precise, we need to download not only a generated page, but also a set of resources which it contains.
• Application should be able to pass authentication on the target system, otherwise each request will trigger not a target action itself, but application security system.
• We may want to separate how much time does it take to (a) establish connection with the server, (b) load HTML page content (c) load resources in order to know what part of page load process should be optimized in the future.
Now, having these requirements behind eyes we can try to find suitable application for load benchmarking.
4.1.3 Overview of existing solutionsAs far as problem of load testing is very common, there is a plenty of software applications which can run a stress tests on the target system. Let us take a short look what popular tools exist.
Apache JMeter is a powerful open source java application which can be run both in desktop and console mode. Official site provides (2012) such a description for this software application:
“Apache JMeter may be used to test performance both on static and dynamic resources (files, Servlets, Perl scripts, Java Objects, Data Bases and Queries, FTP Servers and more). It can be used to simulate a heavy load on a server, network or object to test its strength or to analyze overall performance under different load types. You can use it to make a graphical analysis of performance or to test your server/script/object behavior under heavy concurrent load.”
JMeter allows to run performance benchmarks either from local or from remote machine and can export test data into CSV files for further analysis. Also JMeter has
17

got cookies management (what is necessary for authentication) and can emulate browser behavior by downloading all found resources.
LoadUI is a desktop application which is designed for a complex load tests. The most interesting features of this application are:
• running distributed load tests from Amazon cloud-based;• visual editor for load test creation;• load generators which support different algorithms of traffic generation;• running Groovy scripts which use Geb framework for navigation through the
pages of the target system;• powerful report system;• export of statistical data.
Actually, LoadUI is created by commercial company Smart Bear, it is a free analog of commercial application LoadUI Pro, and it is distributed with open source code.
Load test services. Of course there are also some commercial software solutions. Most of them are provided as a services with a subscription for some period of time. The subscription price usually depends on the capacity of load test. Good examples are services LoadStorm (http://loadstorm.com/) and LoadImpact (http://loadimpact.com/), but even these two services provide not the best set of collected data.
Although the list about is really short and incomplete, it already demonstrates that there are both opensource and commercial products which can be used for load tests. However, we have evaluated each of this tool and it was decided to write our own utility for this purposes. There are several reasons of this.
• First of all, it was decided not to spend money on commercial services, as soon as they are quite expensive and some of them do not provide enough data. It also was not possible to subscribe for a trial period for these services, as soon as all of them have got significant limitations of use.
• Second of all, any of free application do not provide the full set of necessary features. Apache JMeter seemed to be the most convenient tool, but it does not provide any details from target system, so it is hard to fetch debug information from the application in a case when some single requests failed. Also it can measure only a full round-trip latency, what makes impossible collecting some data (like average resource download time) what is necessary for fine configuration of the target system. LoadUI has got a lot of bugs in its current implementation, what makes it absolutely inconvenient for our purposes. During the overview of this application we could not make it work properly and generate a load in a distributed way.
• As soon as the target application is going to be run at the production environment, we will definitely need a tool which can be easily modified to collect some other information about this particular system. In this case modifying of an existing opensource application will take more time than modification of our own utility or even may become impossible.
To summarize up everything we can say that for set of experiments which were taken in the framework of this thesis it was possible to use Apache JMeter. However, as we are going to take another experiments on the target application and as we would like to have more control over the benchmark utility, it was decided to write our own application for these purposes. Let us take a short look at the benchmark tool which was designed for current set of load tests.
18

4.1.4 Design and implementation of a custom load benchmark toolThe main idea of the load benchmark tool is displayed in figure 4.4. As soon as we need to generate quite high load, it should be able to generate traffic using several remote servers. These servers should be controlled by a single client, which manages the whole process of a load benchmark. During the benchmark each server should measure the round-trip latency for each request, and after the benchmark is stopped the client should be able to connect to each server and download benchmark statistics. When the statistics is downloaded, the report providing all necessary data is built.
Figure 4.4 The main idea of distributed load benchmark tool
When the benchmark is started, each load generating server creates several virtual users. Each virtual user is run in a separate thread and has his own light-weight browser. In the very beginning user passes authentication and then starts executing test scenario. Test scenario is represented by a list of URLs with different parameters, so that when virtual user opens this page, it triggers correspondent action on the target application. Different action can return different output results, like HTML page or JSON message. If HTML page is received, integrated tiny browser will search for a resources and then will try to download them in parallel using multiple threads.
During the load test run application comes through the following steps.1. First client read client configuration from the file, which contains the addresses
of the target application and load generating servers. If configuration file is parsed successfully, client establishes the connection with all servers and checks that each server responses to the ping command.
2. Server configuration is read from configuration file and uploaded to all remote servers. Configuration contains information about what data should be included into the final report, logger settings, number of virtual user to run and so on.
3. Load test scenario is uploaded to an each server.4. Client sends command to start “warm up” process of the target application.
During the warm up target all virtual users are launched and are being run during some period of time. This enforces the target application to load all necessary classes, open necessary number of connection with the database and so on.
5. Client sends command to start performance benchmark. Starting from this moment all servers start collecting data about each request which is sent to the target application.
6. When the test time is up, client sends command to terminate all running tests.
19
Then data collection is turned off and all virtual users on each server are stopped..
7. At the last step client send request to each server to provide all collected data. When all data is received, it is merged into one report, which is either analyzed on the fly, or is saved to a binary file for a further analysis.
In current implementation the client-server interaction is implemented using socket connections over TCP protocol. Data is not encrypted, as no sensible information is transferred.
During the implementation there were several tricky problems. Although all of them were successfully solved, let us discuss them.
• Connection between client and server should be checked before each step. A situation when one server is lost during the benchmark should be considered as a normal.
• When termination command is received from client, server should not only stop sending requests to the target system, but also wait for the responses for all requests which were sent earlier. Then benchmark stop time should be set not when stop command was received, but when the last response from server was received.
• When real browser downloads resources for some HTML page, they are cached. It means that if resources are loaded once, there is no need to download it second time. We had to implement a similar behavior in the tiny browser which is used by virtual users.
• When response is received and parsed, it should be released. Otherwise we will get a memory leak which will make our tool inapplicable for its main purpose.
• When HTML page is parsed in order to get URLs to the resources, we should be careful and do not confuse links to the static content with the links to other HTML pages. Otherwise we can get infinite loop.
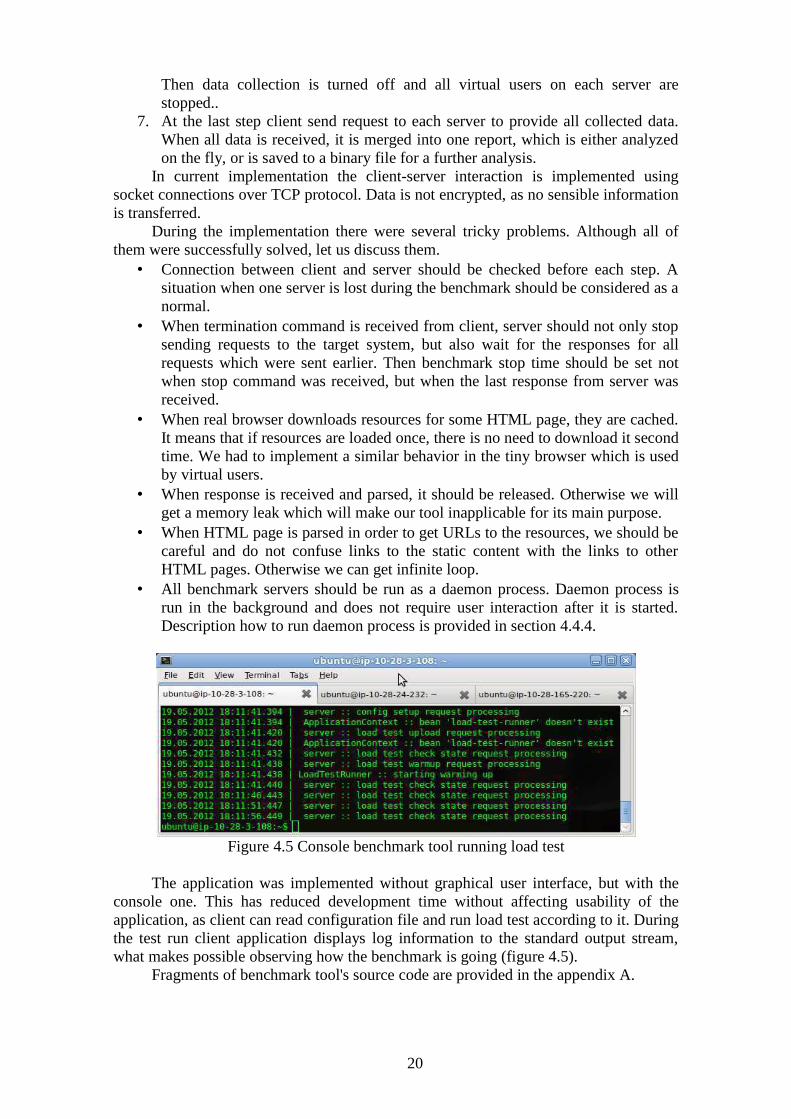
• All benchmark servers should be run as a daemon process. Daemon process is run in the background and does not require user interaction after it is started. Description how to run daemon process is provided in section 4.4.4.
Figure 4.5 Console benchmark tool running load test
The application was implemented without graphical user interface, but with the console one. This has reduced development time without affecting usability of the application, as client can read configuration file and run load test according to it. During the test run client application displays log information to the standard output stream, what makes possible observing how the benchmark is going (figure 4.5).
Fragments of benchmark tool's source code are provided in the appendix A.
20

4.2 Automation of cluster launchCurrent section describes how can we automate the process of server launch in Amazon cloud. It provides general description what are the steps of server launch and how is it implemented using Amazon API Console Tools.
For current set of experiments we can separate four main types of server configurations we need to be able to launch:
• single instance application server;• clustered application server;• database server;• load benchmark load generating server.
First we are going to describe first some common principles how the instance can be launched. Then we will describe what exact software do we need to install for each particular configuration.
Before looking at the practical implementation let us describe the general idea how server instance is being launched (see figure 4.6).
Figure 4.6 Interaction between different servers during instance launch.
In general case we will have typical set of actions:1. The client sends commands to AWS Management Server to create instance and
verifies that it has started successfully. During the instance start a start up script is uploaded and is run.
2. The client creates a EBS volume and verifies that it is ready for being mounted.3. The client sends command to the mount EBS volume to the created instance and
verifies that operation is successful.4. Start up script at server instance was waiting for EBS drive, and as soon as it is
mounted script connects to GitHub, downloads the rest of the installation scripts and runs them.
5. Installation scripts establish connection with Ubuntu Software Repository and download and install all necessary software.
6. If we are running application server, installation scripts should also connect to continuous integration server, download the latest stable version of the application and deploy it.
21

4.2.1 Features of different server configuration typesAs we already said, in our case we can run four main types of servers: single instance application server, clustered application server, database server and load generating server. However, we need to admit that all of them should have some common software application to be installed.
• Git client – this application is required to download the rest of installation scripts. Git client is installed by start up script.
• Emacs23 – sometimes we may need to connect to the server via SSH and modify some configuration files. In this case emacs is really helpful, so we decided to include it into the list of tools which should be installed.
• Nmap – this is a powerful port scanner which is used for verification that all necessary services are running after installation. For example, by scanning port 3306 we can verify that MySQL is running.
Now let us take a detailed look at each configuration and discuss what software do we need to have according to each type.
Single instance application server is a hardware server which contains all software that is necessary to run our target application. In our case it is:
• Java 6 OpenJDK – required for running Tomcat application server;• Apache Tomcat 7 application server – container servlet which is required to run
target application;• MySQL 5 database server – is required by target application.• Curl – small but powerful library which allows to check that target application
was deployed successfully and is running.Clustered application server differs from single instance server in a way that it
does not need database server, but the rest of applications must be installed anyway.Database server has just an opposite specifics. It does not have anything what is
necessary for running application server, but has got only a MySQL server. Load generating server is be used only for running performance benchmark tool
server application. As it is written in java, we need to install OpenJDK there, but nothing more is needed.
4.2.2 Using Amazon API Console Tools for server launchNow let us take a look at the main operations we need to perform if we need to run a new server instance in the cloud using Amazon API Console Tools.
The first thing we should know is that all space in Amazon cloud is separated into several regions, each region represents geographical location where the instance is going to be run. Currently the following regions exist:
• us-east-1 – United States East (Virginia),• us-west-2 – United States West (North California),• us-west-1 – United States West (Oregeon),• eu-west-1 – European Union West (Ireland),• sa-east-1 – South America (Sao Paulo),• ap-northeast-1 – Asia Pacific (Tokyo),• ap-southeast-1 – Asia Pacific (Singapore).
Each region is divided into several availability zones. Server instances can interact with each other only if they are in the same zone of the same region, so each availability zone creates an abstract space which allows to organize instances within one region. When instance is launched you need to provide an availability zone you want to put it in.
Another important details is that each EC2 API command should be called with
22

attached private key and certificate. The Amazon API authentication is implemented in this way. Almost every command requires path to the private key and certificate of current user. All these credentials are can be downloaded from an Amazon account settings page. In the further discussion we will not include security credentials in the list of commands' arguments.
The first step we need to take is to check is the availability zone before running a new instance. This can be done using following command:
ec2-describe-availability-zones
This command can be run without parameters, then it will describe all availability zones for a default region (us-east-1). Usually output would be similar to the following:
AVAILABILITYZONE us-east-1a available
AVAILABILITYZONE us-east-1b available
AVAILABILITYZONE us-east-1c available
AVAILABILITYZONE us-east-1d available
This output easily can be parsed by a bash script, so that we can understand if we can use some particular zone.
After this the instance can be started. Let us take a look at the following command:
ec2-run-instances ami-6fa27506 -n 1 -t m1.small -z us-east-1d -k keypair.name -f /path/to/startup/script.sh
In common case this command has got quite big number of parameters, which are described on the corresponding page of official API documentation (2012). The most important arguments are provided above, so let us provide a small overview on them:
• ami-6fa27506 – AMI identifier which tells command what operating system should we deploy to the new instance; for this particular set of experiments we are going to user AMI with identifier ami-6fa27506, what is an image of vanilla Ununtu 11.10 Server operating system.
• -n 1 – number of server instances to run; just a one instance for our case;• -t m1.small – instance type to run; in this example we are going to run small
instance;• -z us-east-1-d – availability zone for the new server – just an availability zone, it
does not matter what zone exactly we are going use, but we should stick to the same zone for all instances;
• -k keypair.name – name of key pair that should be used to access current instance later on; Amazon is aware of what key pairs do we have so we need just to provide a string name of necessary one;
• -f /path/to/startup/script.sh – path to a script which is going to be uploaded and run when the instance is started.
Running this command will provide output similar to the following:
23

INSTANCE i-bb0671dd ami-6fa27506 pending 0
t1.micro us-east-1 aki-225fa18b ebs
paravirtual xen sg-234b77b
All this information describes just launched instance. The full description of the output format is provided in the official documentation. Right now we only need to know instance identifier, and in current case it is i-bb0671dd. Also we should notice that right now instance is in state pending, what means that it is now started yet. To ensure that instance has started successfully we can check its state with some period until the state is changed to available. To do this we can use the following command:
ec2-describe-instances i-bb0671dd
Running this command without any parameters will provide all data about all instances; providing instance ID as an argument to this command will make it display information only about necessary instance. The output is provided in a format which is similar to the output of command ec2-run-instances, so we can easily parse it and ensure that server was started successfully.
When instance is started and is available we can create a EBS drive and attach it to the instance. This can be done by the following command.
ec2-create-volume --size 4 –availability-zone us-east-1d
This command will create of a new EBS volume with size 4 GB in the zone us-east-1d. If operation is successful, it will provide an output similar to the following:
VOLUME vol-9abea7f5 4 us-east-1d
creating 2012-05-18T11:40:24+0000
Execution of this command also takes some time to create EBS volume. So we need to wait until for volume is created and check its state from time to time. We can get volume state with the help of command:
ec2-describe-volumes vol-9abea7f5
As soon as EBS volume change its state to available, we can attach it using command ec2-attach-volume.
ec2-attach-volume vol-9abea7f5 -i i-bb0671dd -d /dev/xvdf
Running this command will attach the EBS volume to the server instance with a device name /dev/xvdf. This EBS drive can be easily mounted to some particular folder in the server's file system using bash command mount /dev/xvdf /mnt/ebs. Now we have to check that EBS volume has been mounted successfully, and we can do this
24

using the same command ec2-describe-volumes. If state volume state is changed to attached, then operation has passed successfully.
Using these several command it is possible to run a single server instance just in 2 minutes. In the similar way we can run even the whole application cluster, as soon as basic operations are the same and the difference is only in what software each instance will have inside.
4.2.3 Automation of software environment configurationAs far as we need to run server configuration process, we are going to use a start up script which will take care of the rest of installation process. Let us take a detailed look what exactly start-up script does.
1. As we are using Ubuntu, first of all we should update repository index using command apt-get update. This will make package manager connect to the remote repository and get information about the latest version of software.
2. Then we need to download the rest of executing scripts from GitHub repository. For this purpose we should install git client using command apt-get install git. After installing the client we can clone remote repository which contains all necessary for further software installation shell scripts with the help of the command git clone https://[email protected]/repository/project.
3. As a next step just downloaded scripts should be run, which will take care of the rest of software we need to install. In Ubuntu installation of the software can be done by running command apt-get install application-name. This makes automatic installation of necessary packages really simple.
4. After the software is installed, we may need to change configuration files of some particular application servers. For example, we should increase the default amount of memory for Apache Tomcat, as the default value is 256 MB. This also can be done by simple bash scripts.
5. If we are configuring instance which will be used as application server, we need to download and deploy the target application. To do this we should connect to the continuous integration server, download the latest version of the application, put it to the Tomcat webapps/ folder and then restart application server.
6. As the final step, we should clean up the home folder and remove unnecessary scripts. We do not need any garbage in our home, do we?
Usually the whole installation and configuration takes not more than 15 minutes for database server and not more that 20 minutes for application server. After installation is finished all servers are ready to work and can be used in production mode.
Fragments of server launch scripts are provided in the Appendix B.
4.3 Comparative analysis modelCurrent section introduces the main terms that are required for understanding the key prociples of performance benchmark. This section also provides the grounding what data is required to build an extended mathematical model for comparative analysis of performance benchmarks.
4.3.1 What data do we have and what do we needAfter the load tests our benchmark tool provides us big amount of raw data. To be more precise, this data is represented by set of statistical data about each request which was sent to the target system during the benchmark. Let us see what information does it collect about each request.
• Request URL. If some errors occur during the benchmark we will need to understand what request causes the error.
25

• Response HTTP code. We need it to understand if target system has responded successfully or error occurred during the request processing.
• HTML-page generation time. In other word, how how much time does it take to send this particular HTTP-request and receive an HTTP-response.
• Page content. If error occurred during the request processing, an error message with the stacktrace will be saved so we can fix this problem later on.
Of course, if we are talking about the performance benchmarking, the most interesting piece of information is HTML-page generation time. Exactly this data after correspondent processing will provide us all necessary statistics.
Let us take a detailed look at how this raw data should be processed to be able to tell us exactly what do we need.
4.3.2 Metrics descriptions. Getting necessary data from benchmark reportAlmost all terms were already introduced in the Theoretical basement section, so let us just remind what are the main performance characteristics and how they're calculated.
Throughput. This is may be the most important indicator which shows how much concurrent users can use the target application. Throughput can be calculated using the following formula:
TP=Rnum
Tstop�Tstart,
where:• TP – throughput, measured in requests per second;• Rnum – number of requests sent during the benchmark;• Tstart, Tstop – benchmark start and stop time correspondingly, seconds.
Average latency. This indicator shows how much time does it take in average to get a response from the target system. Although average latency can provide some understanding of the target application performance, sometime it could be a bit inaccurate when sample has got too big maximal or too small minimal values. However, we need to know this value and it can be easily calculated using the following formula:
LTCavg=LTC1+LTC2+...+LTCn
Rnumwhere:
• LTCavg – average latency, measured in seconds;• LTCk – latency of each K-response, where k=1...n;• Rnum, n – number of requests sent during the benchmark test.
Percentiles. Percentiles represent a time which is necessary to get response for some particular amount of requests. For example 80% percentile shows within what time 80% of all requests are processed. 50% percentile is also known as median and represents time which was necessary for half of requests to be processed. Sometimes median value is used instead of average for latency, as it shows performance in a more realistic way. Percentiles can be calculated by sorting latencies for all requests and taking necessary element in this set. For these experiments we are going to calculate 20%, 50% and 80% percentiles.
These three indicators should provide us enough data to understand how the target application behave under different load, so after performance benchmark we will be able to analyze target application behavior.
26

4.4 Performance benchmark and final analysisCurrent section describes in details how the experiment was taken. It contains the main idea how the load benchmark test is held, what tests are going to be run and what is the optimal configuration for benchmark tool.
4.4.1 The main idea of the load benchmarkThe diagram displayed in figure 4.7 explains how different servers interact during the benchmark.
Figure 4.7 Architecture of performance benchmark test
All servers which are run in cloud can be divided into two groups. The first group supplies hardware for target application and represents application cluster, and the second contains servers which generate load at the target system. The whole benchmark process is controlled by single client. The whole benchmark can be divided into several steps.
• The client run scripts which launches cluster servers and ensures that application is deployed and is running.
• Then client launches load generating servers and check that connection can be established.
• Performance benchmarking itself is started, so client connects to all load generating servers and starts benchmark according generated scenario.
• When all tests on some particular configuration are done, cluster instances are terminated, and next configuration is launched.
When all tests finished, all servers are terminated.
27

4.4.2 Plan of experiments. Target configurations.Let us describe what exact configuration is going to be tested. According to the plan, we are going to investigate vertical and horizontal scalability of the target application.
In order to test vertical scalability we will run instances with different capacities and will see if there is any difference in application performance. The following server configurations are going to be tested.
1. Application server: 1 small instance. Database server: 1 small instance. Tomcat memory limit: 1 GB.
2. Application server: 1 medium instance. Database server: 1 medium instance. Tomcat memory limit: 3 GB.
3. Application server: 1 large instance. Database server: 1 medium instance. Tomcat memory limit: 6 GB.
For all configurations above the number of maximal connections with MySQL server is increased up to 500 concurrent connections. Apache Tomcat maximal number of connected users is set to 300, and slots numbers in connection queue has a limit of 200. Load balancer is not included into the cluster as we have got only one instance of application server, so load generating servers establish direct connection with the Tomcat.
For horizontal scalability tests we will use different application cluster configurations. We are going to stick to small server instances only, so the only parameter we are going to change is number of application servers in the cluster. The following cluster configuration are going to be tested.
1. Application cluster: 2 small instances. Database server: 1 small instance. 2. Application cluster: 4 small instances. Database server: 1 small instance.
For this set of experiments the limit of concurrent connections to database server was increased to 2048. Number of concurrent users for each tomcat was the same, as for vertical scalability tests. Tomcat memory limit was set to 1GB.
During the load test the performance of the target application is going to be measured when different number of virtual concurrent users trying to access different pages in the application. To be more precise, during this benchmark we are going to test what throughput is provided by application when 16, 64, 112, 160 and 208 users are trying to access different application pages in the same time. All scalability tests are going to be run during 20 minutes.
For continuous load test we are going to run one single configuration, but the test time will be 12 hours instead of 20 minutes. During this period load generating servers will emulate 64 concurrent users who works with application at small single instance server. Apache Tomcat memory limit will be exceeded up to 1 GB, and number of connections will be increased up to 250 both for database and application servers.
This test will show us how the application can handle high load for long period of time. If application has got memory leaks, it will be really easy to notice degradation of application performance.
4.4.3 Determining configuration of a load benchmark toolBefore running the performance benchmark we should answer the question: “What amount of load generating servers do we need to use?”. This question as its origin has got quite simple idea. When we have got 2 systems, which are interacting with each other in a way, that one system is sending data to another, that data flow can be limited by both of them. This means that if we are going to measure a performance of target system, we need to ensure that we are not measuring the performance of load generating tool.
To solve this problem it was decided to take a preliminary test which will show
28

which amount of load generating servers is enough to create sufficient load at the target system. During this test 1, 2, 4 and 8 servers were generating requests to the target application having 1, 5, 10 and 20 virtual users on board.
The target system was represented by one single server, containing Tomcat application server and MySQL database server at the same instance. Tomcat memory limit was set to 512MB, MySQL and Tomcat concurrent connections limit was not changed and had its default values.
The results of this preliminary tests are provided in the table 4.1.
Table 4.1 Results of preliminary performance benchmark
If we will aggregate these data by total number of concurrent users, we will be able to build chart, which is displayed in figure 4.8.
Figure 4.8 Throughput values of the same target application for different number of load generating servers
Obtained throughput was growing up to a particular limit while number of load generating servers has being increased. We can notice that for 40 and 80 users 4-servers and 8-servers configuration have got similar values. This can be considered as an indicator, that throughput is limited not by the request-generating side, but by the
29

request-processing application. It is quite logical, because we have increased the number of request generators in 2 times, but the values has left almost as they were before.
Therefore we are going to use 8 load generating servers for our performance benchmark. We have finished all preparative work and now can start performance benchmark itself. However, during the benchmark some small problems occurred. The next paragraph describes what practical challenges were faced during the main performance benchmark.
4.4.4 Practical details and problemsAs usual within every experiment, when everything look clear and fine in theory, in practice you will face plenty of unsuspected problems. Let us mention a couple of moments which have surprised us during this one.
Running application as a daemon. When load generating servers were started, an SSH connection with each one was established to monitor how the benchmark goes. To see console output of load generating servers, they were run manually in the terminal. This was very convenient during some first period of time. However, if internet connection is lost, all SSH sessions are terminated and load generating server also stops it work in the middle of the test. To solve this problem it was decided to use daemons. As we got load generating server application as runnable JAR file, the daemon process could be run very simply:
sudo daemon -o logfile.txt java -jar server.jar
In this case the daemon process will be run in the background mode and it will redirect the output stream to the file logfile.txt . If the SSH connection with the server will be dropped, the benchmark will not be interrupted.
Changes in server capacity. Another unsuspected problem was found when we got first test results during vertical scalability investigation. Suddenly it turned out that the same server instance in different time provides different capacity. For example, we got absolutely different result for the same small server instance, when the same test was run in the evening of the first day, and then in the morning of the next day. Difference in capacity was more than 50%! The reason for this cannot be determined for sure, but we consider this is a back side of resources virtualization in Amazon cloud. Each server instance created in Amazon cloud is run as a virtual machine over other hardware servers, so if the load on the hardware servers is increased, the performance of virtual machine can become lower. To reduce the inaccuracy of the benchmark it was decided to run the same tests on different configuration in the same time. In this case even if cloud capacity will be changed, the performance of different instances will be changed proportionally. During vertical scalability benchmark we had 10 running servers (1 application server + 1 database server + 8 load generating servers) for each of three configurations, i.e. 30 servers were running in parallel. During the cluster run we had 11 servers for small cluster testing (2 application servers + 1 database server + 8 load generating servers) and 13 servers for big cluster (4 application server + 1 database server + 8 load generating servers), so 24 servers in total. However, it was not a problem to have such big number of servers running, as all of them were run and configured automatically. Finally, we should notice, that if we deal with an application cluster instead of a single server, we also had to check the performance of each application server which is included in to the cluster. Otherwise the results also could be inaccurate.
30

5 Results of the researches
Current section provides the results of the performance benchmark of the target application. This section will provide all obtained information about vertical and horizontal scalability investigation. The results of continuous load test are presented.
5.1 Vertical scaling test resultsThe target of vertical scalability test was to investigate what throughput can be provided by small, medium and large instances. The results are displayed in figure 5.1.
Figure 5.1 Dependency between number of concurrent users and target application throughput during on different server configurations
The throughput values for different number of concurrent user are quite different for each configuration. Obviously, the higher values of throughput are better, as in this case application can serve bigger amount of concurrent users. Looking at this figure 5.1 we can draw a conclusion that large instance provides the best performance.
Figure 5.2 Dependency between number of concurrent users and average latency during on different server configurations
0 50 100 150 200 2500
20
40
60
80
100
120
Small-Xmx1024mMedium-Xmx3072mLarge-Xmx6144m
Number of virtual users
Thro
ugh
pu
t
0 50 100 150 200 2500
2000
4000
6000
8000
10000
12000
Small-Xmx1024mMedium-Xmx3072mLarge-Xmx6144m
Number of virtual users
Ave
rage
late
ncy
, ms
31

The chart in figure 5.2 demonstrates how each type of instance can handle growing load and what average latency do they provide. Lower values are better in the context of this chart, as it means that final user will get the response in a shorter time. The lines are almost straight what tells us that target application does not degrade quickly with growth of load. However, we should admit that application which is run on a small instance degrades more quickly compared to medium and large servers. Also it is obvious, that large instance in average can handle request in a much shorter time than small instance, and in more than 2 times shorter time compared to medium size instance.
The figures 5.3-5.5 demonstrate how the latency percentile values were changed when the load has been increased. Let us stick to figure 5.3 and discuss what conclusions can be drawn looking on this chart.
Figure 5.3 Values of 20%, 40%, 60% and 80% percentiles for latency depending on number of users. Small instance.
First thing we should notice is when the load is smaller, than variance of response time is also smaller. This means that we can predict more precisely how much time will it take to get a response on a request to the target application. However, when the load become higher, the distribution become more “flat”, what makes getting low and high latency for a particular single response equally possible.
We should also notice, that when load not too much high, the 20%, 40% and 60% percentiles are more similar to each other, than to 80% percentile. This indicates that most part of requests are processed in the more or less constant time, but also there are outliers which are processed longer. Based on this we can draw a conclusion that for small single instance load should not exceed 64 users, otherwise we will not be able to predict how much time will it take to process some particular request with a fine precision. Also for web-application it is critical to have page load time not more than 2-3 seconds, otherwise the user will have feeling that application works very slowly.
Almost the same conclusions could be drawn looking at figures 5.4 and 5.5. The only difference is that for medium size instance maximal load which can be easily handled by the system is 112 concurrent users, while large instance works well even with 208. Although the character of percentiles distribution is similar to what we have for small instance, the absolute latency values are much better.
32

Figure 5.4 Values of 20%, 40%, 60% and 80% percentiles for latency depending on number of users. Medium instance.
Figure 5.5 Values of 20%, 40%, 60% and 80% percentiles for latencydepending on number of users. Large instance.
We should notice, that virtual user is a user which sends next request as soon as a response for previous one is received. For instance, if for large instance average latency is 1.8 second, than virtual user sends requests with frequency of 1.8 seconds. However, as soon as in real life users will send in average one request per 30 seconds, we can say that maximal number of real concurrent users for large application server equals 208 users * 30 seconds / 1.8 second = 3470 concurrent users. For small instance this limit equals to 960 users, and for medium size instance – 1680.
33

5.2 Horizontal scaling test resultsThe goal of horizontal scaling test was to verify how the application throughput will be changed on different cluster configurations under different load. During the tests we have run 2 types of cluster, 2-node and 4-node application clusters. Here are the results of the experiments.
Figure 5.6 Dependency between number of concurrent users and target application throughput during on different cluster configuration
Looking at figure 5.6 we can claim that the results are also quite well. Although single instance and small cluster have quickly reach their saturation point, 4-server cluster did not reach it even when number of users was increased to the maximal value of 208 users.
Figure 5.7 Dependency between number of concurrent users and average latency during on different server configuration
0 50 100 150 200 2500
20
40
60
80
100
120
Small single instance-Xmx1024m
Application cluster2 small instances-Xmx1024m
Application cluster4 small instances-Xmx1024m
Number of concurrent users
Th
rou
pu
t, re
q/s
ec
0 50 100 150 200 2500
2000
4000
6000
8000
10000
12000
Small single instance-Xmx1024m
Application cluster2 small instances-Xmx1024m
Application cluster4 small instances-Xmx1024m
Number of concurrent users
Ave
rag
e la
ten
cy, m
s
34

Figure 5.7 also provides some interesting information. On this chart the lower values are better. It is obvious, that introduction of even one more application server has affected the average latency and reduced it in several times. Of course, the best values of average latency is provided by large cluster which contains 4 application servers.
Looking at the percentile distribution charts which are provided in figures 5.8-5.10, we can draw a conclution that the best percentile distribution has got 4-server cluster (lower values are better for this type of diagram).
Figure 5.8 Values of 20%, 40%, 60% and 80% percentiles for latency depending on number of users. Small single instance.
Figure 5.9 Values of 20%, 40%, 60% and 80% percentiles for latency depending on number of users. Cluster of 2 small instances.
Looking at figures 5.8 and 5.9 we can say that normal load for this configurations is 64 and 112 virtual concurrent users correspondingly. Exactly with this particular load each server will be able to send a response for most part of the requests within 2 seconds.
35

Figure 5.10 Values of 20%, 40%, 60% and 80% percentiles for latency depending on number of users. Cluster of 4 small instances.
The last chart which is displayed in figure 5.10 has got almost perfect percentile distribution. We should notice that when the load on the application is increased, the response time distribution becomes more flat, but not significantly. This provides us a good basement to claim that even when application works with 208 concurrent users, 80% of all requests will be processed in 2 seconds, and half of them will be processed less than in 1.5 second.
We also may notice that for small load of 16 and 64 concurrent users 80% of response are generated in less than 500 milliseconds.
5.3 Continuous load test resultsContinuous load test was taken in order to check how the application works under high load during some significant period of time. For this experiment one single application server was run under the load of 64 concurrent users during 12 hours.
Figure 5.11 Target application average latency during the continuous load test
36

According to figure 5.11, the latency did not change significantly during the time. This is a good indicator which means that system do not degrade with time under the load. Please pay attention at splashes of latency. We should notice that there are distributed evenly during when whole period of time. These splashes appears when garbage collector starts its work and cleans up the heap space. Looking at height of this splashes, we can assume that garbage collection takes not more than 3 seconds if application is running on this particular hardware configuration.
Figure 5.12 Target application throughput dynamics during the continuous load test
Looking at charts how the throughput was changed we can also draw a conclusion that during the whole period of time throughput is quite constant and varies just in 0.6 request per second. This means that although the system was providing maximal throughput in each moment of time, garbage collection works fine and there are no memory leaks in the application.
The last chart represents distribution of percentiles for latency during the continuous load test. On X-axis you can find test hours, on Y-axis – latency. This chart demonstrates that in each moment of time page load distribution is more or less the same. This is also a good indicator which shows that system behavior is stable.
Figure 5.13 Target application latency dynamics during the continuous load test
1 2 3 4 5 6 7 8 9 10 11 1223.2
23.3
23.4
23.5
23.6
23.7
23.8
23.9
24
Throughput
Time, hours
Th
rou
gh
put
, re
qu
est
s /
se
con
d
1 2 3 4 5 6 7 8 9 10 11 1210001200
140016001800
20002200
24002600
28003000
Perc. 20%
Perc. 40%
Avg. LTC
Med. LTC
Perc. 60%
Perc. 80%
Test hours
La
ten
cy, m
s
37

6 Discussion on the results
Current section contains the discussion on the results which were obtained during the researches of current master thesis work. The main stress in this chapter is made on what was archived during the researches and what conclusions can we make on this data.
6.1 Scaling investigation resultsSeems that now we are able to draw some conclusions about the target application. The main conclusion we can draw according to the performance benchmark results is that target application scales really well and can work under high load during continuous period of time. Let us look what makes us so confident about this.
Figure 5.1 shows that vertical scaling provides quite sufficient effect on the target application throughput. We can say that while the performance of small instance quite quickly riches its saturation point, medium and big instances can handle proportionally higher load. Although small instance does not provide good growth of the throughput, at least it does not not degrade when number of concurrent users is increased.
Medium size instance has demonstrated best results for 64 concurrent users – it was able to process 60 requests per second; but with further growth of load medium size instance has lost its productivity, so the throughput was equal just to 47 requests per second when the number of concurrent users was increased up to 208.
Obviously, the large instance has the best characteristics. It has provided the highest throughput when 160 concurrent users have been sending requests to the application – 99 request per second. When this number was increased up to 208 users, the throughput became smaller, but not significantly – it fell to 98 request per seconds.
Figure 5.2 indicates that the average latency also becomes bigger, when the load is increased. This is not very good from practical point of view, but we should understand that this is absolutely normal behavior. When the throughput is limited by hardware and the load is increased, the tomcat tries to perform more request in parallel and this causes higher latency.
There is one more good indicator which shows that application is healthy. Charts in figures 5.3 – 5.5 show 20%, 40%, 60 and 80% percentiles for latency depending on the different number of concurrent users. These values are growing proportionally when the load is increased. This tells us that distribution of latency does not change its shape, but just values. This is quite good because in this case latency will grow linearly what makes application more predictable. We also should notice that difference between 20%, 40%, 60% and 80% also increases linearly for high number of users, what means that latency distribution is quite flat. This is not really good, as we cannot predict the response time with a high precision, so we should not allow application to work with such high load.
Although the throughput of the application becomes lower when the load is big enough, in general application does not degrade too quickly and scales vertically quite well. Almost the same we can say about horizontal scaling. Correspondent charts are provided in figures 5.6-5.10. In general the picture look very similar. However, we should notice, that cluster based on 4 application servers has provided a bit better performance than one large instance. The point is that not only that absolute throughput value is higher for cluster, but also that the system still did not get to its saturation point even when number of concurrent users was increased to the maximal value of 208 users.
Large instance has got 7.5 GB of memory and dual-core processor, each core with 2 EC2 Compute Units and is running Apache Tomcat with 6GB of heap space. In the
38

same time, small instance has got 1.7 GB of memory and single-core processor with 1 EC2 Compute Unit, and Apache Tomcat has only 1 GB limitation for heap size. In other words, although we are using more or less the same underlying hardware, it is obvious that horizontal scaling provides more benefits.
• Average latency for 4-servers cluster is lower than for one single large server instance.
• 4-server cluster provides higher throughput and has more high saturation point compared to the large single instance solution.
• If the target application is overloaded 2-server cluster degrades a bit slower than medium size single instance server.
• Horizontal scaling is not limited by hardware resources. It is not possible to increase capacity of processor infinitely, but we can easily do this with server instances.
In other words, horizontal scaling allows to use the same resources in a more efficient way and has got less limitations on usage than vertical one. Also it is possible to combine both of these approaches, for example we can start with horizontal scaling and then continue with vertical when big number of servers will be in use. Or vise versa, it is possible to start with vertical scaling and then continue with horizontal when upper limit of vertical scaling is achieved.
6.2 Continuous load test resultsContinuous load test has also provided some interesting results. First of all, figure 5.12 shows that the throughput was quite stable: during the 12 hours a vibration of application throughput did not exceed 3%. It is obvious that application does not degrade with time, so it can be used for production.
One more interesting chart is provided in figure 5.11. It displays how the average latency has being changed during the time, but all values are aggregated by seconds. According to the chart, there are moments of time when the average response time was increased in several times, and these moments are repeated with a clear period. The most logical explanation for this phenomena is an assumption that garbage collector was run in these moments. If this assumption is right, then we should admit that garbage collector cleans up memory in a quite efficient way, as the application does not no degrade with time. As garbage collector is run each 30 minutes and it takes not more that 2 seconds in average to collect all garbage, we can say that current delay is acceptable.
We also should notice that in the middle of benchmark the performance of application was a bit lower than in the beginning and in the end. We consider that this is a side effect of Amazon AWS virtualization and it will not become a problem in the production environment.
6.3 The economical perspectiveThe Amazon official site (2012) contains the prices for different instances for US East region. These prices are provided in the Table 6.1.
Table 6.1 Prices for different type of instances in Amazon AWSInstance type Windows usage, $/hour Linux usage, $/hour
Small instance $0.115 $0.08
Medium instance $0.230 $0.16
Large instance $0.460 $0.32
39

It is obvious, that price for each type of the instance is 2 times bigger than for previous one. As we are using Ubuntu Linux, we are interested only in the right column for now. Let us compare what maximal throughput can we obtain for the same price. To build comparative chart let us stick to 208 concurrent users and compare throughput for
Figure 6.1 Comparison of throughput which can be reached for the same price using horizontal and vertical scaling.
Horizontal scaling provides a bit better results for the same price, so it is more convenient from economical perspective. The chart in figure 6.1 demonstrates that the best throughput we can receive for $0.32/hour is a cluster of 4 small instances.
We should admit that this chart does not cover one more way, when both of this approaches are combined. For example, instead of having cluster of 4 small instances we can run it with 2 medium for the same price. Actually, according to our assumption this might be the most efficient way.
6.4 Further researches Although the this work covers all basic aspects of performance benchmark, all these experiments just introduce us into the world of high performance and application scaling. The research described in current work has just has set up the process of load testing, and is going be applied multiple times later on. It should be clear that in this work we have applied the described performance analysis for the simplest case, and we should admit that there is still a lot of work which should be done on this project.
The first and the most important question which is still open asks if the horizontal scaling can be done infinitely on current application. The most probable answer for this question is NO, but then another question occurs: what maximal throughout can be provided by the application before some of its characteristics become inconvenient?
To answers this question we should increase number of load generating servers to be able to generate load more than 208 users. For today our target is to run application which can handle 1000 of virtual concurrent users. This number is defined by estimated number of potential customers and corresponds to 15000 of real users.
There is one more very interesting feature from Amazon, which allows to make server maintenance cheaper. This feature is called autoscaling and it allows to use hardware resources in a most efficient way and save quite sufficient amount of funds.
40

Usually, load on the application always has got irregular nature. The nature of the load is defined by users and depends on purpose of the application. For example, if we are talking about business application – the most frequently it will be used during the business days, but will not be used at all during the weekend.
As Amazon AWS is distributed using pay-as-you-go model, it is possible to terminate not used instanced and run it only when we need it again. Amazon autoscaling allows to set up triggers which control number of running instances according to the load. One more challenge we need to resolve is configuration and testing of autoscaling.
Another approach which can be introduced in order to achieve benefit in the performance is using of database cache. This can be implemented either by running one more instance with some special caching software like MemCacheD, or by using Amazon ElastiCache service. Both of these approaches are applicable, so the question which one is more convenient also needs to be investigated.
One more important future problem that should not be forgotten is database replication. When number of application servers is increased up to a particular limit it is possible that interaction with database will become a bottle-neck of the whole system. In this case we will have to setup several database servers and configure a master-slave replication between them. All write operations in this case must be performed on master database, while replicated slaved can be used for reading data. One more set of experiments is related to this architectural approach.
Also if we are running application in production mode, we really need to take care of data of our customers. In other words we need to automate backup creation, and this also required configured database replication. Replicated slave is necessary because when backup is created, database cannot process any other concurrent requests. After each of these improvements we will have to run performance benchmark once again to see, how each of these changes affects the target application.
Finally, we can say that current work indeed just opens the door to the world of high performance and Amazon Web Services. All mentioned above problems are related to the topic of current master thesis and are going to be solved before the project is run in a production mode.
41

7 Final discussion
To summarize up the whole content of current master thesis work let us remind what main challenges were resolved:
• In order to run performance benchmark a set of business requirement to the tool were defined. According to these requirements existing software solutions were evaluated. When results were analyzed the decision to build custom load test utility was taken. Such custom utility was designed and developed according to the list of existing business requirements.
• The process of server launch was automated in order to shorter time for experiments. A set of bash-scripts which can launch either single instance application server, or clustered application server was created. During each launch a set of server instances is created, all necessary software is installed, server interaction is configured and application is downloaded and deployed.
• The performance benchmark was run on the target application. This benchmark consists of several group of tests. During these tests vertical and horizontal scalability of application was investigated. Also an ability to work under high load during continuous period of time was tested.
• The results of performance benchmark were analyzed from technical and economical perspectives. The most convenient server configuration was found according to existing business requirements.
All these achievements are important both from technical and business perspective. From technical perspective we developed a methodology which allows to run performance benchmarks whenever it is necessary. During the further work on the project a lot of architectural improvements are going to be done, which need to be tested before application is run in the production environment.
From business perspective we have analyzed economical component, and this makes possible to estimate how much funds will application need on technical maintenance during the first period of time. Also now, when a maximal number of possible users is known for each server configuration, it is possible to stick to the particular server configuration which will deliver reliable application to the final user depending on number of customers.
42

8 References
APACHE JMETER (2012) Official web-site [Online]. Available from: http://jmeter.apache.org/ [Accessed 16/02/12]
APACHE TOMCAT 7 (2012) Clustering/Session Replication HOW-TO [WWW] The Apache Software Foundation. Available from: http://tomcat.apache.org/tomcat-7.0-doc/cluster-howto.html [Accessed 15/05/12]
AMAZON WEB SERVICES (2012) Amazon EC2 Instance Types [Online]. Available from: http://aws.amazon.com/ec2/instance-types/ [Accessed 15/02/12]
AMAZON WEB SERVICES (2012) Amazon EC2 Pricing [Online]. Available from: http://aws.amazon.com/ec2/pricing/ [Accessed 15/02/12]
AMAZON WEB SERVICES (2012) Amazon Elastic Block Storage (Amazon EBS) [Online]. Available from: http://aws.amazon.com/ebs/ [Accessed 15/02/12]
AMAZON WEB SERVICES (2012) Amazon Elastic Compute Cloud (Amazon EC2) [Online]. Available from: http://aws.amazon.com/ec2/ [Accessed 15/02/12]
AMAZON WEB SERVICES (2012) Amazon Simple Storage Service (Amazon S3) [Online]. Available from: http://aws.amazon.com/s3/ [Accessed 15/02/12]
AMAZON WEB SERVICES (2012) AWS Management Console [Online]. Available from: http://aws.amazon.com/console/ [Accessed 15/02/12]
AWS DOCUMENTATION (2012) Amazon Elastic Compute Cloud CLI Reference [Online]. Available from: http://docs.amazonwebservices.com/AWSEC2/latest/CommandLineReference/Welcome.html [Accessed 18/05/12]
ERIC HAMMOND (2012) You Should Use EBS Boot Instances on Amazon EC2. Alesic.com. Weblog [Online] 3d January. Available from: http://alestic.com/2012/01/ec2-ebs-boot-recommended. [Accessed 15/05/12]
LOADIMPACT.COM (2013) Official Web-Site [Online]. Available from: http://loadimpact.com/ [Accessed 18/04/13]
LOADSTORM.COM (2013) Official Web-Site [Online]. Available from: http://loadstorm.com/ [Accessed 18/04/13]
PETER LAWREY (2012) What is latency, throughput and degree of concurrency? Vanila #Java. Weblog [Online]. 16 April. Available from: http://vanillajava.blogspot.se/2012/04/what-is-latency-throughput-and-degree.html. [Accessed 14/05/12]
SMARTBEAR (2012) Open Source API Load Testing Tool [Online]. Available from: http://smartbear.com/product/open-source/loadui [Accessed 17/05/12]
WIKIPEDIA (2012) Cloud computing. [Online]. Available from: http://en.wikipedia.org/wiki/Cloud_computing [Accessed 15/05/12]
43

9 Appendices
Appendix A. Fragments of load benchmark tool source codeA.1 LoadTestRunner.java
package com.pf.loadbenchmark.runner;
import java.util.Collections;
import java.util.Comparator;
import java.util.LinkedList;
import java.util.List;
import java.util.Random;
import com.pf.loadbenchmark.common.ApplicationContext;
import com.pf.loadbenchmark.common.LoadTestState;
import com.pf.loadbenchmark.common.Logger;
import com.pf.loadbenchmark.common.ServerConfigs;
import com.pf.loadbenchmark.report.LoadTestReport;
import com.pf.loadbenchmark.report.LoadTestReportItem;
import com.pf.loadbenchmark.test.LoadTest;
/**
* Current class performs run of the load test and controls the process.
*
* @author Roman
*/
public class LoadTestRunner extends Thread {
/**
* Application context identifier
*/
public final static String CONTEXT_ID = "load-test-runner" ;
/*
* Test data
*/
private LoadTestState state = LoadTestState. NOT_STARTED;
private final ServerConfigs config ;
private final LoadTest test ;
private final List<VirtualUser> users = new LinkedList<VirtualUser>();
private LoadTestReport finalReport = null;
/*
* Control flags
*/
private boolean startBenchmarkFlag = false;
private boolean stopBenchmarkFlag = false;
44

private boolean stopWorkFlag = false;
/**
* Constructor
*/
public LoadTestRunner(LoadTest loadTest) {
config = (ServerConfigs) ApplicationContext. getInstance().find(
ServerConfigs. CONTEXT_ID);
this. test = loadTest;
this. finalReport = new LoadTestReport( test .getTargetUrl());
}
/**
* Current method performs test itself
*
* @return
*/
public void run() {
try {
Logger. log( "LoadTestRunner :: starting warming up" );
warmUp();
// waiting for start benchmark command
while ( true) {
synchronized (LoadTestRunner. class) {
if ( startBenchmarkFlag ) {
break;
}
}
}
Logger. log( "LoadTestRunner :: starting benchmark" );
startCollectingData();
// waiting for stopping benchmark command
while ( true) {
synchronized (LoadTestRunner. class) {
if ( stopBenchmarkFlag ) {
break;
}
}
}
Logger. log( "LoadTestRunner :: starting cooldown" );
coolDown();
Thread. sleep( config . coolDownTime );
Logger. log( "LoadTestRunner :: collecting reports" );
collectReportsAndStopUsers();
} catch (InterruptedException e) {
e.printStackTrace();
}
45
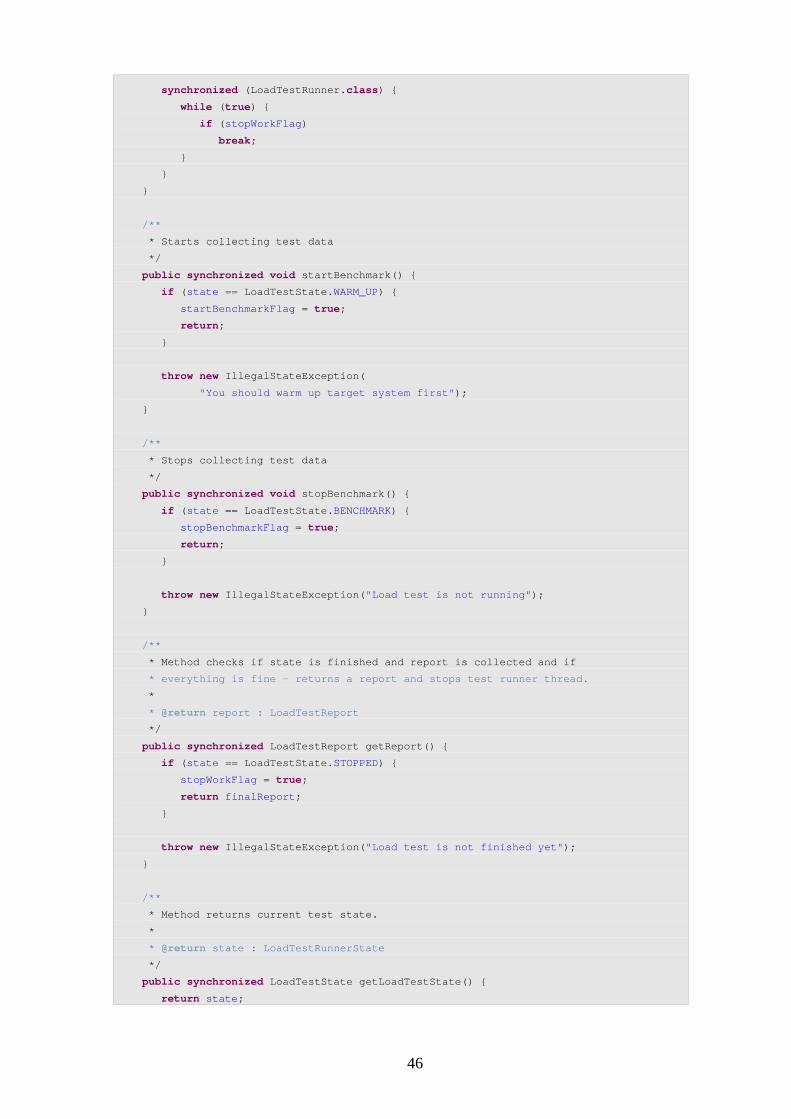
synchronized (LoadTestRunner. class) {
while ( true) {
if ( stopWorkFlag )
break;
}
}
}
/**
* Starts collecting test data
*/
public synchronized void startBenchmark() {
if ( state == LoadTestState. WARM_UP) {
startBenchmarkFlag = true;
return;
}
throw new IllegalStateException(
"You should warm up target system first" );
}
/**
* Stops collecting test data
*/
public synchronized void stopBenchmark() {
if ( state == LoadTestState. BENCHMARK) {
stopBenchmarkFlag = true;
return;
}
throw new IllegalStateException( "Load test is not running" );
}
/**
* Method checks if state is finished and report is collected and if
* everything is fine - returns a report and stops test runner thread.
*
* @return report : LoadTestReport
*/
public synchronized LoadTestReport getReport() {
if ( state == LoadTestState. STOPPED) {
stopWorkFlag = true;
return finalReport ;
}
throw new IllegalStateException( "Load test is not finished yet" );
}
/**
* Method returns current test state.
*
* @return state : LoadTestRunnerState
*/
public synchronized LoadTestState getLoadTestState() {
return state ;
46

}
/**
* Current method starts load test, but doesn't collect any
* data to warm - up
* target system.
*/
private void warmUp() {
synchronized (LoadTestRunner. class) {
if ( state != LoadTestState. NOT_STARTED) {
throw new IllegalStateException(
"You should initialize runner first" );
}
state = LoadTestState. STARTING_UP;
}
// creating users according to the configs
for ( int i = 0; i < config . userNumber ; i++) {
users .add( new VirtualUser( test ));
}
// starting users with some shift
try {
// sleeping 2 seconds. Just for fun!
Thread. sleep(2000);
for (VirtualUser user : users ) {
user.start();
if (user.isAlive()) {
Logger. log( "LoadTestRunner :: user " + user.getUserName()
+ " started" );
}
// some predetermined in configs shift +/- 20% random shift,
// to make test more realistic and do not have
// 1-second-ddos -atack
Random rand = new Random();
long randomShift = ( long) (rand
.nextInt( config . userStartStopShift ) * 0.2);
randomShift = randomShift * (rand.nextB oolean() ? -1 : 1);
Thread. sleep( config . userStartStopShift + randomShift);
}
} catch (InterruptedException e) {
e.printStackTrace();
}
Logger. log( "LoadTestRunner :: all users started" );
synchronized (LoadTestRunner. class) {
state = LoadTestState. WARM_UP;
}
}
/**
* Current method starts collecting report data.
47

*/
private void startCollectingData() {
synchronized (LoadTestRunner. class) {
if ( state != LoadTestState. WARM_UP) {
throw new IllegalStateException(
"You should warm up the target first" );
}
}
finalReport .setBenchmarkStartedTime(System. currentTimeMillis());
for (VirtualUser user : users ) {
user.collectData();
}
synchronized (LoadTestRunner. class) {
state = LoadTestState. BENCHMARK;
}
}
/**
* Current method stops collecting data and then stops users.
*/
private void coolDown() {
synchronized (LoadTestRunner. class) {
if ( state != LoadTestState. BENCHMARK) {
throw new IllegalStateException(
"You didn't start benchmark yet" );
}
}
finalReport .setBenchmarkStoppedTime(System. currentTimeMillis());
for (VirtualUser user : users ) {
user.stopCollectData();
}
synchronized (LoadTestRunner. class) {
state = LoadTestState. COOL_DOWN;
}
}
/**
* Current method collects all report data and s tops
* virtual users threads.
*/
private synchronized void collectReportsAndStopUsers() {
// check state
if ( state != LoadTestState. COOL_DOWN) {
throw new IllegalStateException( "You didn't start benchmark yet" );
}
// getting reports from each user
for (VirtualUser user : users ) {
List<LoadTestReportItem> reportItems = use r.getReportItems();
List<LoadTestReportItem> itemsToRemove = new LinkedList<LoadTestReportItem>();
48

// if some request were sent after the cool down st arted then
// let's not include them to the report
for (LoadTestReportItem item : reportItems) {
if (item.getStartTime() > finalReport .getBenchmarkStoppedTime()) {
itemsToRemove.add(item);
}
}
reportItems.removeAll(itemsToRemove);
finalReport .addReportItems(reportItems);
}
// sorting the overall report by start time
Collections. sort( finalReport .getReportItems(),
new Comparator<LoadTestReportItem>() {
@Override
public int compare(LoadTestReportItem it1,
LoadTestReportItem it2) {
if (it1.getStartTime() < it2.getStartTime()) {
return 1;
} else if (it1.getStartTime() > it2.getStartTime()) {
return -1;
}
return 0;
}
});
// stopping users
for (VirtualUser user : users ) {
user.stopBrowsing();
}
// changing state to final
state = LoadTestState. STOPPED;
}
}
A.2 VirtualUser.java
package com.pf.loadbenchmark.runner;
import java.util.List;
import java.util.Random;
import com.pf.loadbenchmark.browser.BrowserPage;
import com.pf.loadbenchmark.browser.TinyBrowser;
import com.pf.loadbenchmark.common.ApplicationContext;
import com.pf.loadbenchmark.common.Logger;
import com.pf.loadbenchmark.common.ServerConfigs;
import com.pf.loadbenchmark.common.StopWatch;
import com.pf.loadbenchmark.report.LoadTestReport;
import com.pf.loadbenchmark.report.LoadTestReportItem;
import com.pf.loadbenchmark.test.LoadTest;
import com.pf.loadbenchmark.test.LoadTestItem;
import com.pf.loadbenchmark.test.LoadTestRequest;
49

/**
* Current class simulates real user who uses the t arget
* system. Each user performs his own request progr am.
*
* @author Roman
*/
public class VirtualUser extends Thread {
private static final String[] NAMES = { "William" , "John" , "Robert" ,
"Richard" , "Roger" , "Ralph" , "Thomas" , "Henry" , "Geoffrey" ,
"Walter" , "Hugh" , "Gilbert" , "Peter" , "Adam" , "Simon" , "Nicholas" ,
"Reginald" , "Stephen" , "Alexander" , "Philip" };
private static int userCount = 0;
/**
* Just user name, to see who is who
*/
private final String name;
/**
* Responsible for sending http requests
*/
private TinyBrowser browser ;
/**
* List of requests to be performed
*/
private final LoadTest loadTest ;
/**
* Load test report
*/
private final LoadTestReport report ;
/**
* Flag which shows when user should stop
*/
private boolean stopWork = false;
/**
* Flag which shows when user should start colle cting report data
*/
private boolean collectData = false;
/**
* Load test configs
*/
private final ServerConfigs config ;
/**
* Flag indicating that login was successful. If false - user stops
*/
private final boolean successfulLogin ;
50

public VirtualUser(LoadTest loadTest) {
super();
if (!loadTest.isImmutable()) {
throw new RuntimeException(
"Load test can be started only if it's immutable" );
}
this. loadTest = loadTest;
config = (ServerConfigs) ApplicationContext. getInstance().find(
ServerConfigs. CONTEXT_ID);
report = new LoadTestReport(loadTest.getTargetUrl());
browser = new TinyBrowser();
if ( config . authUsername != null) {
String authUrl = loadTest.getTargetUrl() + config . authPage ;
successfulLogin = browser .login(authUrl, config . authUsername ,
config . authPassword );
} else {
successfulLogin = true;
}
synchronized (VirtualUser. class) {
this. name = NAMES[ new Random().nextInt( NAMES. length )] + "-"
+ userCount++;
if ( config . detailedLog ) {
Logger. log( name + " says: Hello, world!" );
}
}
}
public String getUserName() {
return name;
}
public void run() {
while ( successfulLogin ) {
for (LoadTestItem testItem : loadTest .getTestItems()) {
// processing page request
if (testItem instanceof LoadTestRequest) {
String pageUrl = ((LoadTestRequest) testItem).getUrl();
pageUrl = RandomMarkerParser. replaceMarkers(pageUrl);
String url = loadTest .getTargetUrl() + pageUrl;
// measuring time
if ( config . detailedLog ) {
Logger. log( name + " :: sending request to " + url);
}
StopWatch stopWatch = new StopWatch();
BrowserPage page = browser .openPage(url, stopWatch);
stopWatch.set(StopWatch. PAGE_LOADED);
synchronized ( name.intern()) {
if ( collectData ) {
if ( config . detailedLog ) {
51

Logger. log( name + " :: saving data" );
}
// if error or flag is on - let's include content t o
// the report
boolean includeContent = page.getHttpCode() >= 400
|| config . includeAllContent ;
String pageContent = includeCo ntent ? page
.getContent() : "not-included" ;
// creating report item
LoadTestReportItem reportItem = new LoadTestReportItem(
getUserName(), pageUrl, stopWatch,
page.getHttpCode(), page Content,
page.isResourcesNotLoade d());
report .addReportItem(reportItem);
}
}
// wtf ? Throwing an exception!
} else {
throw new IllegalStateException(
"Unsupported type of operation!" );
}
// now let's sleep some time
try {
Thread. sleep(getSleepTime());
} catch (InterruptedException e) {
e.printStackTrace();
}
}
synchronized ( name.intern()) {
if ( stopWork ) {
if ( config . detailedLog ) {
Logger. log( name + " says: Goodbye!" );
}
break;
}
}
}
if (! successfulLogin ) {
Logger. log( "user " + name + " cannot login into the system" );
}
}
private long getSleepTime() {
long randomValue = new Random().nextInt(( int) config . requestDelay ) / 3;
randomValue *= new Random().nextBoolean() ? 1 : -1;
return config . requestDelay + randomValue;
}
52

public void stopBrowsing() {
synchronized ( name.intern()) {
stopWork = true;
}
}
public void collectData() {
synchronized ( name.intern()) {
collectData = true;
}
}
public void stopCollectData() {
synchronized ( name.intern()) {
collectData = false;
}
}
public List<LoadTestReportItem> getReportItems() {
return report .getReportItems();
}
public LoadTestReport getReport() {
return report ;
}
}
A.3 ClientLoadTestRunner.java
package com.pf.loadbenchmark.runner;
import java.util.LinkedList;
import java.util.List;
import com.pf.loadbenchmark.common.ClientConfig;
import com.pf.loadbenchmark.common.Logger;
import com.pf.loadbenchmark.common.ServerConfigs;
import com.pf.loadbenchmark.report.LoadTestReport;
import com.pf.loadbenchmark.test.LoadTest;
/**
* Current class runs complex distributed load test and creates a final test
* report.
*
* @author Roman
*/
public class ClientLoadTestRunner {
/**
* How much time should we check for report afte r sending stop request.
*/
private static final int WAITING_NUM = 720; // number of cycles, 5 seconds each
/**
53

* List of remote servers
*/
private final List<String> serverList ;
/**
* Load test itself
*/
private final LoadTest loadTest ;
/**
* Server config
*/
private final ServerConfigs configuration ;
/**
* List of client test runners
*/
private final List<ClientRunner> clientRunners = new LinkedList<ClientRunner>();
/**
* List of client test runners, which have died during the test run
*/
private final List<ClientRunner> deadClientRunners = new LinkedList<ClientRunner>();
/**
* List of final reports
*/
private final List<LoadTestReport> reports = new LinkedList<LoadTestReport>();
/**
* Constructor
*/
public ClientLoadTestRunner(List<String> serverList, Load Test loadTest,
ServerConfigs configs) {
this. serverList = serverList;
this. loadTest = loadTest;
this. configuration = configs;
// just simpliest checks
assert loadTest != null;
assert serverList.size() > 0;
}
/**
* Constructor
*/
public ClientLoadTestRunner(List<String> serverList, Load Test loadTest) {
this. serverList = serverList;
this. loadTest = loadTest;
this. configuration = null;
// just simpliest checks
assert loadTest != null;
assert serverList.size() > 0;
}
54
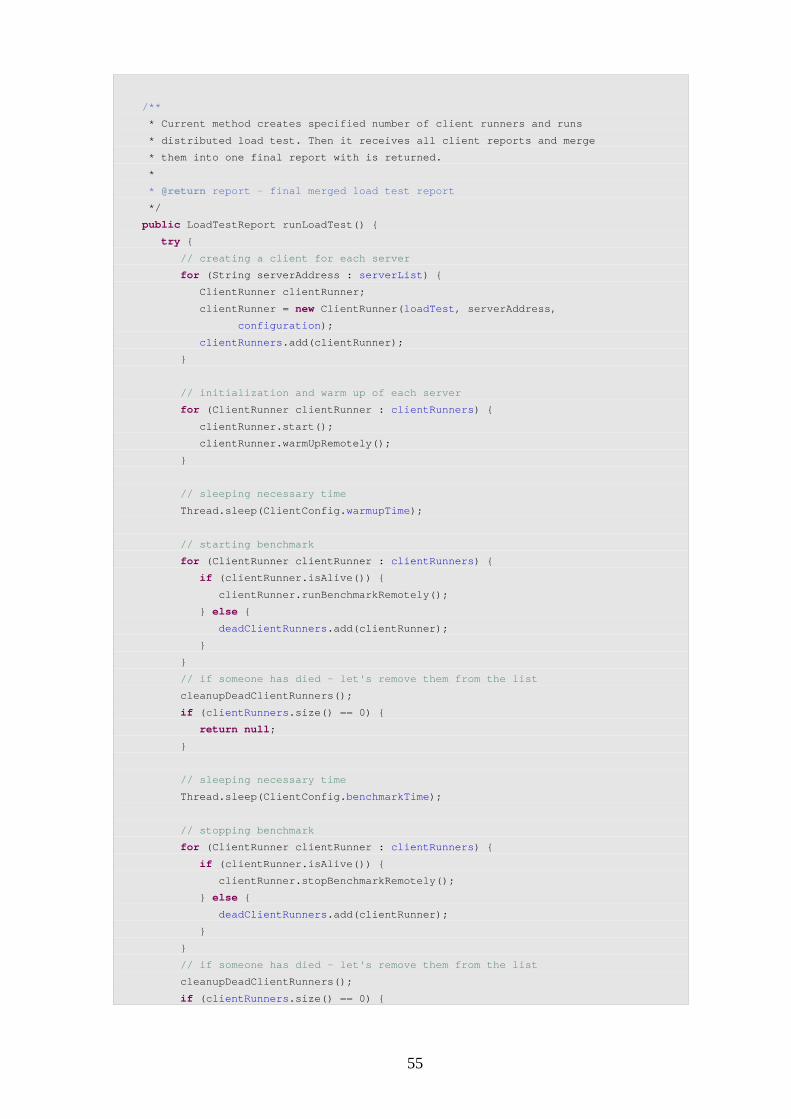
/**
* Current method creates specified number of cl ient runners and runs
* distributed load test. Then it receives all c lient reports and merge
* them into one final report with is returned.
*
* @return report - final merged load test report
*/
public LoadTestReport runLoadTest() {
try {
// creating a client for each server
for (String serverAddress : serverList ) {
ClientRunner clientRunner;
clientRunner = new ClientRunner( loadTest , serverAddress,
configuration );
clientRunners .add(clientRunner);
}
// initialization and warm up of each server
for (ClientRunner clientRunner : clientRunners ) {
clientRunner.start();
clientRunner.warmUpRemotely();
}
// sleeping necessary time
Thread. sleep(ClientConfig. warmupTime);
// starting benchmark
for (ClientRunner clientRunner : clientRunners ) {
if (clientRunner.isAlive()) {
clientRunner.runBenchmarkRemotely();
} else {
deadClientRunners .add(clientRunner);
}
}
// if someone has died - let's remove them from the list
cleanupDeadClientRunners();
if ( clientRunners .size() == 0) {
return null;
}
// sleeping necessary time
Thread. sleep(ClientConfig. benchmarkTime);
// stopping benchmark
for (ClientRunner clientRunner : clientRunners ) {
if (clientRunner.isAlive()) {
clientRunner.stopBenchmarkRemotely() ;
} else {
deadClientRunners .add(clientRunner);
}
}
// if someone has died - let's remove them from the list
cleanupDeadClientRunners();
if ( clientRunners .size() == 0) {
55

return null;
}
// waiting for reports
Logger. log( "Runner :: waiting for report receiving" );
int counter = 0, runnersNumber = clientRunners .size();
while ( true) {
// counting how many reports are received
int readyReportNumber = 0;
for (ClientRunner clientRunner : clientRunners ) {
LoadTestReport report = clientRunner .getReport();
if (report != null) {
readyReportNumber++;
}
}
// if all received or number of tries too big
if (readyReportNumber == runnersNumber
|| counter++ > WAITING_NUM) {
// then we should save all reports
for (ClientRunner clientRunner : clientRunners ) {
LoadTestReport report = clientRun ner.getReport();
reports .add(report);
}
// and stop waiting
break;
}
// otherwise wait 5 seconds more
Thread. sleep(5000);
}
} catch (InterruptedException e) {
e.printStackTrace();
}
// creation of the final report
if ( reports .size() > 0) {
return buildFinalReport();
}
return null;
}
/**
* Method removes dead clients runners from the main client runner list
*/
private void cleanupDeadClientRunners() {
// if some thread has died - let's clean it up
if ( deadClientRunners .size() > 0) {
for (ClientRunner deadClientRunner : deadClientRunners ) {
clientRunners .remove(deadClientRunner);
}
56

}
// and clean the dead-list itself also
deadClientRunners .clear();
}
/**
* Current method iterates over all reports and creates a final version of
* it by simple merge of all results.
*
* @return final report - LoadTestReport
*/
private LoadTestReport buildFinalReport() {
LoadTestReport finalReport = new LoadTestReport( loadTest .getTargetUrl());
// if report only one
if ( reports .size() == 1) {
return reports .get(0);
}
// of there are more reports
long startTime = 9999999999999999L;
long stopTime = 0;
for (LoadTestReport report : reports ) {
if (report.getBenchmarkStartedTime() < startTime) {
startTime = report.getBenchmarkStartedT ime();
}
if (report.getBenchmarkStoppedTime() > stopTime) {
stopTime = report.getBenchmarkStoppedTi me();
}
finalReport.addReportItems(report.getRepor tItems());
}
finalReport.setBenchmarkStartedTime(startTime );
finalReport.setBenchmarkStoppedTime(stopTime) ;
finalReport.sortData();
return finalReport;
}
}
57

Appendix B. Fragments of server launch scriptsB.1 Script _config.sh
#!/bin/bashecho ""echo "###################################"echo ""
## EC2 console tools paramertersEC2_PRIVATE_KEY="privatekey.pem"EC2_CERT="certificate.pem"EC2_CRED_STR="-K $EC2_PRIVATE_KEY -C $EC2_CERT"
## Instance settingsINST_ZONE="us-east-1a"INST_TYPE="m1.small" INST_AMI="ami-6fa27506"INST_NUM="1"INST_KEY_PAIR="keypair"
EBS_VOL_SIZE="1" # can be interger value only!EBS_VOL_DEV_NAME="/dev/sdf"
## Common server configuration paramsSERVER_SSH_KEY="ssh-key.pem"SERVER_USER="ubuntu"SERVER_LOG_FOLDER="logs"SERVER_EBS_MNT_POINT="/mnt/data"SERVER_EBS_DEV_NAME="/dev/xvdf"
# DB server configsDBSERVER_SCRIPTS_DIR="./dbserver"DBSERVER_STARTUP_SCRIPT="./startup-script-db.sh"
# Application server configsAPPSERVER_SCRIPTS_DIR="./appserver"APPSERVER_STARTUP_SCRIPT="./startup-script-app.sh"
PING_KEYWORD="supercalifragilisticexpialidocious"PING_PAGE="/login/auth"
NO_SSH_CONFIRM=" -o StrictHostKeyChecking=no "
## Load test configsWORKER_INST_NUM=1WORKER_STARTUP_SCRIPT="./startup-script-worker.sh"WORKER_SERVER_SCRIPTS_DIR="./worker"WORKER_INST_TYPE="t1.micro"
## Configuration checks echo " * testing configuration"if [ -z $EC2_HOME ]; then echo "Wrong config! EC2_HOME is not defined!"; ex it 1;fiif [ ! -e $SERVER_SSH_KEY ]; then echo "Wrong config! Server SSH key not found!"; e xit 1;fiif [ ! -e $EC2_PRIVATE_KEY ]; then echo "Wrong config! EC2 private key not found!"; exit 1;fiif [ ! -e $EC2_CERT ]; then echo "Wrong config! EC2 certificate not found!"; exit 1;fiif [ ! -e $DBSERVER_SCRIPTS_DIR ]; then echo "Wrong config! DB-server scripts folder does n't exist or is empty!"; exit 1;fiif [ ! -e $APPSERVER_SCRIPTS_DIR ]; then echo "Wrong config! APP-server scripts folder doe sn't exist or is empty!"; exit 1;fi
58

B.2 Script run.sh
#!/bin/bash
# including configs. ./_configs.sh
# check if zone is availableecho " * checking '$INST_ZONE' zone availability"ZONE_AVAILABLE=`ec2-describe-availability-zones $EC 2_CRED_STR | grep "$INST_ZONE" | grep "available"`if [ -z "$ZONE_AVAILABLE" ]; then echo " - Error! Zone '$INST_ZONE' is unavailabl e"; exit 1else echo " - zone '$INST_ZONE' is available";fi
# db-server launchecho "===================="echo " DB-Server launch"echo "====================". ./run-db.sh
# app-servers launchecho "===================="echo " APP-Server launch"echo "===================="
. ./run-app.sh
B.3 Script run-db.sh
#!/bin/bash
# running 'ec2-run-instances' commandecho " * launching $INST_NUM instance(s) ($INST_TYP E, $INST_AMI, $INST_ZONE, $INST_KEY_PAIR)"INSTANCE_DATA=`ec2-run-instances $EC2_CRED_STR $INS T_AMI -n 1 -t $INST_TYPE -z $INST_ZONE -k $INST_KEY_PAIR -f $DBSERVER_STARTUP_S CRIPT | grep "INSTANCE"`echo " - fetching instance ID"INSTANCE_ID=`echo $INSTANCE_DATA | grep -o 'INSTANC E\s*i-[a-z0-9]*' | grep -o 'i-[a-z0-9]*'`echo " - instance is running with ID='$INSTANCE_I D'"
# launching EBS storageecho " * creating EBS volume"VOLUME_DATA=`ec2-create-volume $EC2_CRED_STR --size $EBS_VOL_SIZE --availability-zone $INST_ZONE`echo " - fetching volume ID..."VOLUME_ID=`echo $VOLUME_DATA | grep -o 'VOLUME\s*vo l-[a-z0-9]*' | grep -o 'vol-[a-z0-9]*'`echo " - volume is created with ID=$VOLUME_ID"
# waiting for instance startecho " * waiting for instance start..."INSTANCE_STATUS="initializing"while [ "$INSTANCE_STATUS" != "running" ]; do INSTANCE_STATUS=`ec2-describe-instances $EC2_CRED _STR $INSTANCE_ID | grep -o "running"` if [ "$INSTANCE_STATUS" == "running" ]; then echo " - status is '$INSTANCE_STATUS'! Instan ce's ready!" else echo " - pending..."; fidone;
# fetching instance url - right now, not earlier! I nstance MUST start!echo " * fetching instance URL"INSTANCE_HOST_NAME=`ec2-describe-instances $EC2_CRE D_STR | grep "INSTANCE" | grep "running" | grep "$INSTANCE_ID" | awk '/[0-9a-z\.\- ]*/ { print $4 }'`if [ -z "$INSTANCE_HOST_NAME" ]; then echo " - cannot get instance public URL!" exit 1else echo " - instance public URL is '$INSTANCE_HOST _NAME'"
59

fi
# attaching device to instanceecho " * attaching EBS volume to the instance"ATTACHMENT_RESULT=`ec2-attach-volume $EC2_CRED_STR $VOLUME_ID -i $INSTANCE_ID -d $EBS_VOL_DEV_NAME | grep -o "attaching"`echo " - volume is been $ATTACHMENT_RESULT now"echo " * verifing that volume is attached"
# waiting for attachment confirmationwhile [ "$ATTACHMENT_RESULT" != "attached" ] ; do ATTACHMENT_RESULT=`ec2-describe-volumes $EC2_CRED _STR $VOLUME_ID | grep "ATTACHMENT" | grep "$INSTANCE_ID" | grep -o "attached"` if [ "$ATTACHMENT_RESULT" == "attached" ] ; then echo " - volume is attached successfully!" else echo " - pending..." fidone
# uploading ip-getterecho " * uploading ip-address getter"scp $NO_SSH_CONFIRM -i $SERVER_SSH_KEY ip.sh $SERVE R_USER@$INSTANCE_HOST_NAME:/home/$SERVER_USER/ip.sh &> /dev/null
# getting database server internal IP addressecho " * getting internal IP address"INTERNAL_DB_IP=`ssh $NO_SSH_CONFIRM -i $SERVER_SSH_ KEY $SERVER_USER@$INSTANCE_HOST_NAME /home/$SERVER_USER/ip.sh`echo " - internal ip $INTERNAL_DB_IP"
echo " * seems everything works fine!"
B.4 Script run-app.sh
#!/bin/bash
# running proper number of application serversfor (( k=1; k<=$INST_NUM; k++))do echo " ### Processing instance $k of $INST_NUM"
# running 'ec2-run-instances' command echo " * launching 1 instance ($INST_TYPE, $INST _AMI, $INST_ZONE, $INST_KEY_PAIR)" INSTANCE_DATA=`ec2-run-instances $EC2_CRED_STR $ INST_AMI -n 1 -t $INST_TYPE -z $INST_ZONE -k $INST_KEY_PAIR -f $APPSERVER_STARTUP_ SCRIPT | grep "INSTANCE"` echo " - fetching instance ID" INSTANCE_ID=`echo $INSTANCE_DATA | grep -o 'INST ANCE\s*i-[a-z0-9]*' | grep -o 'i-[a-z0-9]*'` echo " - instance is running with ID='$INSTANC E_ID'"
# waiting for instance start echo " * waiting for instance start..." INSTANCE_STATUS="initializing" while [ "$INSTANCE_STATUS" != "running" ]; do INSTANCE_STATUS=`ec2-describe-instances $EC2_ CRED_STR $INSTANCE_ID | grep -o "running"` if [ "$INSTANCE_STATUS" == "running" ]; then echo " - status is '$INSTANCE_STATUS'! I nstance's ready!" else echo " - pending..."; fi done;
# fetching instance url - right now, not earlier ! Instance MUST start! echo " * fetching instance URL" INSTANCE_HOST_NAME=`ec2-describe-instances $EC2_ CRED_STR | grep "INSTANCE" | grep "running" | grep "$INSTANCE_ID" | awk '/[0-9a-z\.\- ]*/ { print $4 }'` if [ -z "$INSTANCE_HOST_NAME" ]; then echo " - cannot get instance public URL!" exit 1 else echo " - instance public URL is '$INSTANCE_ HOST_NAME'" fi
sleep 30 # just waiting to be sure...
60

# patching instance hosts file echo " * patching hosts file" ssh $NO_SSH_CONFIRM -i $SERVER_SSH_KEY $SERVER_U SER@$INSTANCE_HOST_NAME "sudo echo '$INTERNAL_DB_IP db.server' >> /etc/hosts" echo " - done!" echo " * Instance web address: http://$INSTANCE_ HOST_NAME:8080"
done
B.5 Script startup-script-db.sh
#!/bin/bash
############################################## this script is supposed to be run as root #############################################
# configsHOME_DIR="/home/ubuntu"
GIT_USER="username"GIT_PASS="password"GIT_URL="https://$GIT_USER:[email protected]/Com panyName/Repository.git"GIT_REPO="$HOME_DIR/scripts"
# copying scripts from GIT repo apt-get install git-core --yesgit clone $GIT_URL $GIT_REPOmv $GIT_REPO/cluster/dbserver/* $HOME_DIRrm -rf $GIT_REPOchmod 775 $HOME_DIR/*
. $HOME_DIR/configs.sh
# waiting for the device attachmentWAIT_TIME=120WAIT_DELAY=10FOUND=0while [ $WAIT_TIME -ne 0 ]; do if [ -e "$DEV_NAME" ]; then FOUND=1 break fi WAIT_TIME=`expr $WAIT_TIME - $WAIT_DELAY` echo "waiting..." sleep $WAIT_DELAYdoneif [ $FOUND -eq 1 ]; then echo "success! running installation scripts..." &> $HOME_DIR/$LOGFOLDER/startup.log sleep 10 cd $HOME_DIR touch "installation.started" ./setup.shelse echo "/mnt/data/lost+found folder was not found => drive is not mounted" &> $HOME_DIR/$LOGFOLDER/startup.logfi
rm *.shrm *.started
61
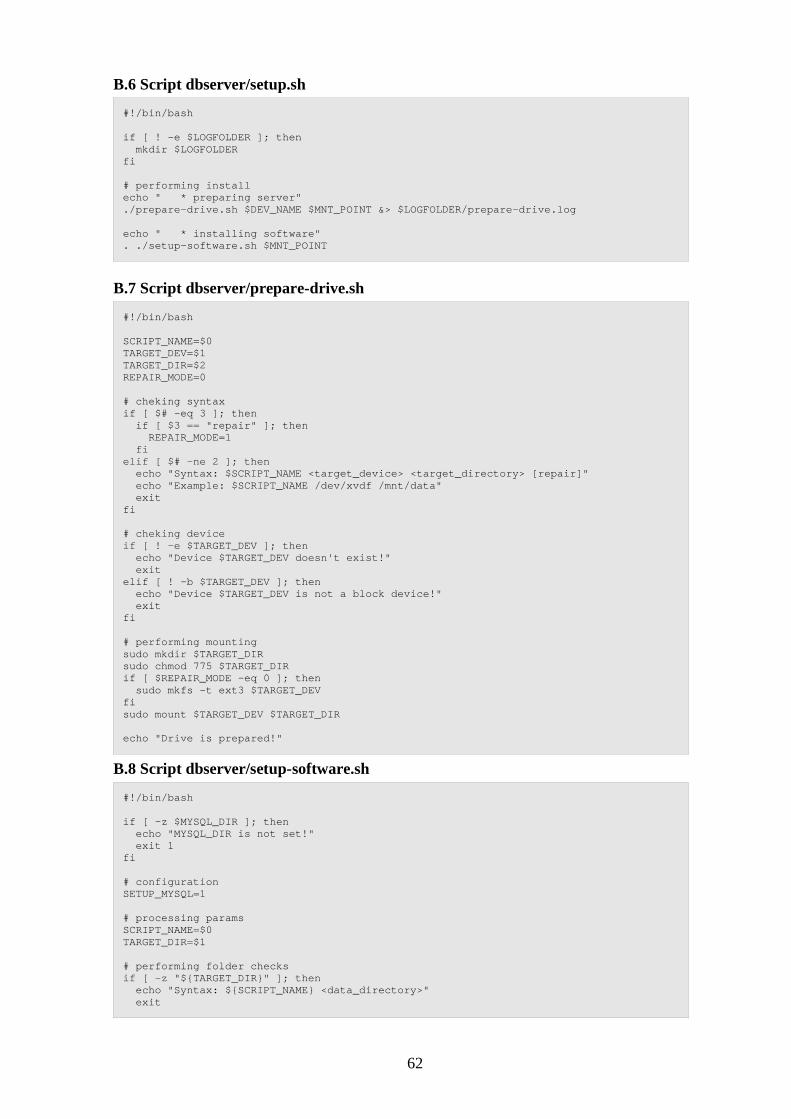
B.6 Script dbserver/setup.sh
#!/bin/bash
if [ ! -e $LOGFOLDER ]; then mkdir $LOGFOLDERfi
# performing installecho " * preparing server"./prepare-drive.sh $DEV_NAME $MNT_POINT &> $LOGFOLD ER/prepare-drive.log
echo " * installing software". ./setup-software.sh $MNT_POINT
B.7 Script dbserver/prepare-drive.sh
#!/bin/bash
SCRIPT_NAME=$0TARGET_DEV=$1TARGET_DIR=$2REPAIR_MODE=0
# cheking syntaxif [ $# -eq 3 ]; then if [ $3 == "repair" ]; then REPAIR_MODE=1 fielif [ $# -ne 2 ]; then echo "Syntax: $SCRIPT_NAME <target_device> <targe t_directory> [repair]" echo "Example: $SCRIPT_NAME /dev/xvdf /mnt/data" exitfi
# cheking deviceif [ ! -e $TARGET_DEV ]; then echo "Device $TARGET_DEV doesn't exist!" exitelif [ ! -b $TARGET_DEV ]; then echo "Device $TARGET_DEV is not a block device!" exitfi
# performing mountingsudo mkdir $TARGET_DIRsudo chmod 775 $TARGET_DIRif [ $REPAIR_MODE -eq 0 ]; then sudo mkfs -t ext3 $TARGET_DEVfi sudo mount $TARGET_DEV $TARGET_DIR
echo "Drive is prepared!"
B.8 Script dbserver/setup-software.sh
#!/bin/bash
if [ -z $MYSQL_DIR ]; then echo "MYSQL_DIR is not set!" exit 1fi
# configurationSETUP_MYSQL=1
# processing paramsSCRIPT_NAME=$0TARGET_DIR=$1
# performing folder checksif [ -z "${TARGET_DIR}" ]; then echo "Syntax: ${SCRIPT_NAME} <data_directory>" exit
62

fi
if [ -e ${TARGET_DIR} ]; then sudo chmod 775 ${TARGET_DIR} echo " * ${TARGET_DIR} is ready"else echo " * folder ${TARGET_DIR} doesn't exist!" exitfi
# updating repoecho " * updating repository"sudo apt-get update &> $LOGFOLDER/apt-update.log
# setup utilsecho " * setting up utils"./setup-utils.sh &> $LOGFOLDER/utils.log
# setup MySQLecho " * setting up MySQL". ./setup-mysql.sh $TARGET_DIR/$MYSQL_DIR $MYSQL_RO OT_PASS &> $LOGFOLDER/mysql.logecho " * scanning MySQL port..."sleep 15 MYSQL_SCAN_RESULT=`scanPort 3306`if [ "$MYSQL_SCAN_RESULT" == "closed" ]; then echo " - critical error! MySQL port 3306 is clos ed!" exit 1else echo " - MySQL is running on port 3306!"fi
echo " * creating database, user and granting user permissions". ./create-db.sh &> $LOGFOLDER/mysql-create-db.log echo " * restarting database server"sudo service mysql restart
echo " * Job is done! Bye!"
B.9 Script dbserver/incl-functions.sh
#!/bin/bash
# function scans defined port and prints "open" or "closed" to standard outputfunction scanPort { PORT=$1 SCAN_RESULT="closed" NUMBER_OF_TRIES=3 while [ "$SCAN_RESULT" == "closed" ]; do if [ $NUMBER_OF_TRIES -lt 1 ]; then break fi SCAN_RESULT=`sudo nmap -sS -p -PN T${PORT} $SER VER_IP_ADDR | grep "${PORT}/tcp" | grep -o "closed"` NUMBER_OF_TRIES=`expr $NUMBER_OF_TRIES - 1` sleep 2 done echo $SCAN_RESULT}
B.10 Script dbserver/setup-utils.sh
#!/bin/bash
# setting up useful toolssudo apt-get install emacs --yessudo apt-get install nmap --yessudo apt-get install curl --yes
B.11 Script dbserver/setup-mysql.sh
############################ Processing params
63

###########################
SCRIPT_NAME=$0MYSQL_DIR=$1MYSQL_PASS=$2
############################ Setup###########################
echo " # setting up MySQL server"echo mysql-server mysql-server/root_password passwo rd ${MYSQL_PASS} | sudo debconf-set-selectionsecho mysql-server mysql-server/root_password_again password ${MYSQL_PASS} | sudo debconf-set-selectionssudo DEBIAN_FRONTEND=noninteractive apt-get -q inst all mysql-server -y
echo " # stopping MySQL server"sudo service mysql stop
echo " # creation of MySQL folder"echo " # moving mysql folders"
sudo mkdir ${MYSQL_DIR}sudo chmod 775 ${MYSQL_DIR}
sudo mkdir ${MYSQL_DIR}/etc ${MYSQL_DIR}/lib ${MYSQ L_DIR}/logsudo mv /etc/mysql ${MYSQL_DIR}/etc/sudo mv /var/lib/mysql ${MYSQL_DIR}/lib/sudo mv /var/log/mysql ${MYSQL_DIR}/log/
echo " # creation of mount folders"sudo mkdir /etc/mysqlsudo mkdir /var/lib/mysqlsudo mkdir /var/log/mysql
echo " # mounting mysql folders"echo "${MYSQL_DIR}/etc/mysql /etc/mysql none bi nd" | sudo tee -a /etc/fstabsudo mount /etc/mysqlecho "${MYSQL_DIR}/lib/mysql /var/lib/mysql none bi nd" | sudo tee -a /etc/fstabsudo mount /var/lib/mysqlecho "${MYSQL_DIR}/log/mysql /var/log/mysql none bi nd" | sudo tee -a /etc/fstabsudo mount /var/log/mysql
echo " # patching mysql"echo " * server ip address is $SERVER_IP_ADDR"sudo cp /etc/mysql/my.cnf /etc/mysql/my.baksudo sed -e "s/127.0.0.1/$SERVER_IP_ADDR/" /etc/mys ql/my.bak > /etc/mysql/my.cnf
echo " # starting server!.."sudo service mysql start
64

Faculty of Technology SE-391 82 Kalmar | SE-351 95 Växjö Phone +46 (0)772-28 80 00 [email protected] Lnu.se/faculty-of-technology?l=en