design and harware implementation of a supervisory...
TRANSCRIPT

University of ManitobaDepartment of Electrical & Computer Engineering
ECE 4600 Group Design Project
Progress Report
Design and Harware Implementation of a Supervisory Controller for
a Wind Power Turbine
byGroup 09
Alimujiang, Abulizijiang Gill, AjaypalPrzybytkowski, Daniel Uppal, Laraib
Academic Supervisor(s)
Annakkage, Udaya D., P.Eng
McNeill, Dean, P.Eng
Industry Supervisors
Bagen Bagen, Dr. – Manitoba Hydro
Date of Submission
January 12, 2015Copyright © 2015 Abulizijiang Alimujiang, Ajaypal Gill, Daniel Przybytkowski, Laraib
Uppal

Supervisory Controller TABLE OF CONTENTS
Table of Contents
1 Introduction . . . . . . . . . . . . . . . . . . . . . . . . . . . . . . . . . . . . . . . . . 1
2 Project Progress . . . . . . . . . . . . . . . . . . . . . . . . . . . . . . . . . . . . . . 1
2.1 Pitch Angle Control in Software (Ajaypal, Laraib) . . . . . . . . . . . . . . . 1
2.2 Optimum Power Control in Software (Ajaypal, Laraib) . . . . . . . . . . . . . 2
2.3 Breaker Control in Software (Ajaypal) . . . . . . . . . . . . . . . . . . . . . . 2
2.4 Fault Introduction and Duration Control in Software (Laraib) . . . . . . . . . 2
2.5 Pitch Angle Control in Hardware (Abulizijiang, Daniel) . . . . . . . . . . . . 3
2.6 Optimum Power Control in Hardware (Daniel) . . . . . . . . . . . . . . . . . 3
2.7 Fault Detection in Hardware (Abulizijiang, Daniel) . . . . . . . . . . . . . . . 4
2.8 Low Voltage Ride-Through in Hardware (Abulizijiang) . . . . . . . . . . . . . 4
3 Future Work . . . . . . . . . . . . . . . . . . . . . . . . . . . . . . . . . . . . . . . . 5
4 Conclusions . . . . . . . . . . . . . . . . . . . . . . . . . . . . . . . . . . . . . . . . . 6
References . . . . . . . . . . . . . . . . . . . . . . . . . . . . . . . . . . . . . . . . . . . . . . 7
Appendix A Updated Gantt Chart . . . . . . . . . . . . . . . . . . . . . . . . . . . . . . 8
Appendix B Updated Budget . . . . . . . . . . . . . . . . . . . . . . . . . . . . . . . . . 10
Appendix C Power Curve . . . . . . . . . . . . . . . . . . . . . . . . . . . . . . . . . . . 12
Appendix D Low Voltage Ride-Through . . . . . . . . . . . . . . . . . . . . . . . . . . 14
i

Supervisory Controller 1 Introduction
1 Introduction
In a modern wind power plant, a supervisory controller is used to control the operation of multiple
wind turbines. The objective of this project is to design a supervisory controller for a single Type-3
2MW rated wind turbine. The supervisory controller will control the power output of the wind
turbine through the regulation of rotor speed and rotor blade pitch angle as per industry practice.
Under normal conditions, the controller will monitor wind speed, and the turbine will generate
power in accordance with the typical power curve of a Type-3 wind turbine. The controller will
carry out Low Voltage Ride-Through (LVRT) under fault conditions as required by the Canadian
Grid Code for Wind Development.
At this present time, the supervisory controller simulation in RSCAD and the hardware im-
plementation are progressing as scheduled. Future work will consist of optimizing the controller
performance and analyzing the behavior of the wind power system.
2 Project Progress
The project is progressing on schedule as shown in the updated Gantt Chart in Appendix A, Figure
A.1. The total cost used thus far is $159.20 out of the allocated $400.00 for the project budget
shown in Appendix B, Figure B.1. The progress made for the project will be discussed in the
following eight sections. The sections refer to the regions of the power curve [1] shown in Appendix
C, Figure C.1 and the low voltage ride-through curve [2] shown in Appendix D, Figure D.1.
2.1 Pitch Angle Control in Software (Ajaypal, Laraib)
The pitch angle control was designed to change the blade angle of the wind turbine model in
RSCAD. The pitch angle can be modified using a control system which receives the wind turbine
speed as an input and calculates the pitch angle in degrees as an output. A comparator block was
designed that sends the turbine speed as an input to the pitch angle control system for wind speeds
1

Supervisory Controller 2 Project Progress
between 11.5 m/s and 20 m/s. The control system contains a limiter that limits the blade angle
between 0 and 36 degrees. The calculated pitch angle is then sent back to the wind turbine through
a feedback loop in order to maintain rated power output for wind speeds between 11.5 m/s and 20
m/s.
2.2 Optimum Power Control in Software (Ajaypal, Laraib)
In order to maintain a constant tip to speed ratio for winds speeds between 3 m/s and 11.5
m/s, an optimal power calculation logic was simulated to determine the optimum torque for any
given wind speed. The optimum torque enables the control of the rotor speed of the Doubly-Fed
Induction Generator (DFIG). In order to implement a constant tip to speed ratio in hardware,
the understanding and testing of the provided optimum power block in RSCAD was necessary, as
explained further in the hardware section.
2.3 Breaker Control in Software (Ajaypal)
Control logic was designed which detects the wind speed and determines whether the wind turbine
system should be connected to the transmission system. A breaker control system was simulated
which disconnects the wind turbine system from the grid for wind speeds below 3 m/s and above
20 m/s.
2.4 Fault Introduction and Duration Control in Software (Laraib)
The simulation of the wind turbine for fault conditions began with the design and introduction of
a 50 km transmission line within a separate RSCAD file. The transmission line connects the wind
turbine to the strong grid, enabling the introduction, detection, and control of faults on the sending
end of the transmission line after a 33kV/230kV step-up transformer.
A 3-phase line to ground fault simulating a worst case scenario was introduced using a push
button. The plot of the three phase voltage displayed the effect of the fault on both the turbine
2
Supervisory Controller 2 Project Progress
and the power grid sides of the line. The next step was to control the duration of the fault, which
provided a method to determine the voltage recovery time of the system for varied fault durations.
2.5 Pitch Angle Control in Hardware (Abulizijiang, Daniel)
To maintain constant rated power output for wind speeds between 11.5 m/s and 20 m/s, the power
output is controlled through the control of pitch angle. An Arduino Due microcontroller reads the
wind speed through an analog input converting this voltage to a numerical value. If the wind speed
is under 11.5 m/s, the pitch angle is set to zero by sending a zero voltage through a DAC to RDTS.
Once above 11.5 m/s, the speed of the rotor is measured through an analog input pin. The rotor
speed should be maintained at a rated speed of 1.2 pu, resulting in maximum power output of 2
MW. As the wind speed increases, the rotor speed will also increase. The rotor speed is decreased
by stepping up the voltage sent from the DAC to RDTS, which results in an increase of pitch angle
to maintain the rotor speed at 1.2 pu.
2.6 Optimum Power Control in Hardware (Daniel)
The turbine power is controlled by a constant tip to speed ratio between wind speeds of 3 m/s
and 11.5 m/s through the calculation of optimum torque. The rotor speed is measured through
an analog pin on the Arduino Due. Taking into account the turbine speed ratio and DFIG to
turbine factor, the optimum torque is calculated on the Arduino Due and sent back to RDTS.
With the use of the slip angle, the rotor currents in RSCAD are converted into their respective
direct and quadrature axis components, allowing control of electrical torque and excitation current.
The calculated quadrature axis rotor current is subtracted from the reference signal, which is the
optimum torque that the Arduino Due calculates, which in turn adjusts the firing angle of the rotor
side voltage source converter.
3

Supervisory Controller 2 Project Progress
2.7 Fault Detection in Hardware (Abulizijiang, Daniel)
Issues arose with being able to detect a fault because the Arduino Due cannot accept negative
voltage on its analog pins. Therefore, the full wave line voltage could not be used. The first
solution was to send the line voltage to the Arduino Due through a half wave rectifier with a
smoothing capacitor. When a fault occurs, the line voltage drops to zero. Smoothing the waveform
with a capacitor between half waves would keep the voltage above zero and an interrupt could be
used to detect a voltage drop to zero. This method would, however, introduce a delay of a few
milliseconds if a fault occurred during the smoothing cycle. Also, the Arduino Due’s interrupt
would trigger at a low voltage of 1.5V causing a fault to almost constantly be detected. Therefore,
a new method was required.
A full wave rectifier could not be used because RTDS was unable to provide the positive and
negative of the line voltage signal. The second method designed was to use a summing amplifier.
The full waveform of the line voltage could now be used without a rectifier and no interrupts.
A DC offset was inputted to shift the waveform above zero volts. When a fault occurs, the DC
offset voltage is the new zero voltage and the offset voltage can be used to determine if a fault has
occurred.
2.8 Low Voltage Ride-Through in Hardware (Abulizijiang)
Using the line voltage mentioned in section 2.7, an analog input pin was assigned for reading the
line voltage, and an output pin was assigned for tripping the system. The line voltage was scaled to
an acceptable range for the Arduino Due. When the system needs to be stalled, the tripping signal
is set to low, which results in the transmission line breakers to trip. At the same time, the electrical
torque is set to zero, causing the rotor speed to drop to zero as well. When the system needs to
be reconnected, the tripping signal is set to high, resulting in the closing of the breakers and the
DFIG to be connected back to the strong grid. The tripping signal functionality was successfully
tested for normal and fault conditions with the interface of RSCAD and RTDS.
4

Supervisory Controller 3 Future Work
LVRT was implemented on the Arduino Due by reading the line voltage using a polling method.
The polling method reads the line voltage each time the Arduino Due cycles through its entire
program. The line voltage is a sinusoidal waveform with a DC offset that passes through the offset
voltage every 8.33 milliseconds. If the offset voltage is detected, the line voltage is instantly read
again in order to determine whether a fault has occurred. If a fault is detected, the program is
delayed by 130 milliseconds in order to obtain the 150 milliseconds duration based on Appendix D,
Figure D.1. The tripping signal is set to low if the fault has not been cleared at this time instant. In
order to avoid the 150 milliseconds delay during the next cycle, a fault condition boolean variable
is set to true, and a counter begins to increment. At the moment that the counter has reached
a value corresponding to a 3 second duration, the line voltage is read again. If there is a voltage
recovery of 85%, the system is reconnected by setting the tripping signal to high.
3 Future Work
Future work will consist of the design of a breaker control system in RSCAD. The breaker system
will detect whether a fault has occurred on the sending end of the transmission line. If a fault is
detected, the breaker system will use control logic in order to disconnect the wind turbine from the
strong grid. The control logic will perform the low voltage ride-through based on the Canadian Grid
Code. Upon the successful completion of the supervisory controller functionality for both software
simulation and hardware implementation, the software and hardware performance of pitch angle
control, optimum power, real output power, and low voltage ride-through will be compared.
The length of the transmission line will be varied, and the behavior of the system will be
analyzed. The pitch angle control, optimum power, and low voltage ride-through will also be
optimized to improve system performance. However, the varying of the length of the transmission
line and the optimization of the hardware system are beyond the scope of the project proposal and
will be completed if time permits.
5

Supervisory Controller 4 Conclusions
4 Conclusions
As of present, the project is progressing on schedule as can be seen in the updated Gantt Chart.
Individual members of the team have fulfilled their respective roles and responsibilities towards the
project. The total cost used thus far is $159.20 out of the allocated $400.00 for the project budget.
The tasks to be completed include the design of the breaker control system in RSCAD simulation.
The project is expected to be completed by the proposed deadline.
6

Supervisory Controller REFERENCES
References
[1] Vestas. 2 mw platform (2013 edition). [Online]. Available: http://www.vestas.com/en/products and services/turbines
[2] G. Hassan. Canadian grid code for wind development- review and recommendations (2005 edi-tion). [Online]. Available: http://www.nrcan.gc.ca/energy/publications/sciences-technology/renewable/smart-grid/6081
7
Supervisory Controller
Appendix A
Updated Gantt Chart
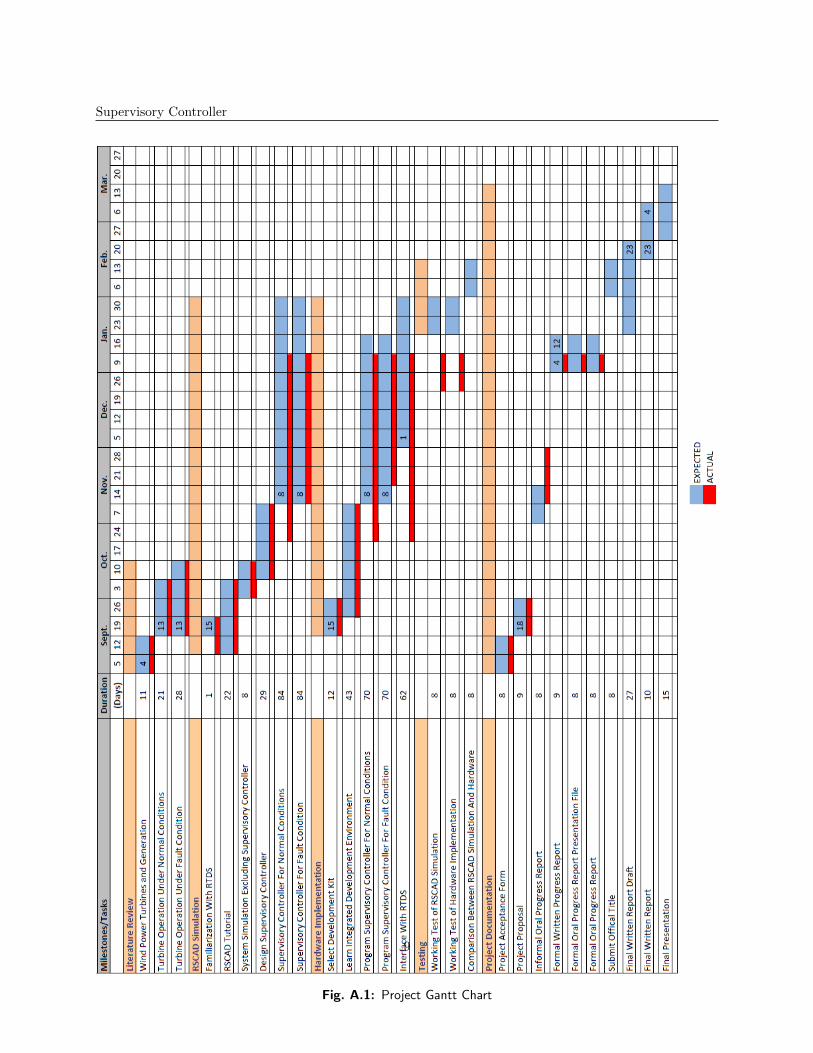
The updated Gantt chart for the project is shown in Figure A.1. The project is progressing on
schedule. The leftmost column shows the milestones and the corresponding tasks that are to be
completed for the project. The orange bars in the Gantt chart represent the total expected time
to complete each milestone. The bars that are colored in blue represent the expected start and
completion date of each task. The bars that are colored in red represent the actual start and
completion up-to-date of each task.
8
Supervisory Controller
Fig. A.1: Project Gantt Chart
9

Supervisory Controller
Appendix B
Updated Budget
The total expected cost is $359.20 out of the budget of $400 that is allocated for the capstone
design project as shown in Figure B.1. The only cost comes from ordering one Arduino Due and
two MAX520BCPE+-ND DACs, both supplied by Digikey. An overhead cost of 20% has been
included to cover costs of components supplied by the tech shop. A replacement development kit
is still included in the budget and has been allocated $200. However, the Arduino Due has been
sufficient thus far, and there has been no need to order a new kit.
10

Supervisory Controller
Fig. B.1: Project budget
11

Supervisory Controller
Appendix C
Power Curve
The supervisory controller must control operation of the turbine under normal conditions based
on the power curve of the V110-2.0 MW shown in Figure C.1. For wind speeds under 3 m/s, the
turbine will be stalled. At the cut-in wind speed of 3 m/s up to the rated wind speed of 11.5 m/s,
the turbine will operate at a constant tip to speed ratio through the control of rotor speed. From
the rated wind speed of 11.5 m/s to the cut-out wind speed of 20 m/s, the pitch angle of the turbine
will be controlled to maintain a constant rated power of 2MW. Due to engineering design limits
and safety constraints, the turbine will be stalled at wind speeds above 20 m/s.
12

Supervisory Controller
Fig. C.1: Power Curve
13

Supervisory Controller
Appendix D
Low Voltage Ride-Through
According to the Canadian Grid Code for Wind Development, the wind turbines must adhere to
the LVRT curve as shown in Figure D.1. When a fault occurs, the wind turbine will continue
operating for a period of 150ms after which the turbine must be stalled. After a total duration of 3
seconds after a fault has occurred, the system will check for an 85% or greater recovery of voltage.
If the voltage has recovered to the 85% or greater level, the turbine will be re-connected to the
system. However, should this threshold not be met after the 3 second time interval, the system will
remain stalled.
14

Supervisory Controller
Fig. D.1: Low Voltage Ride-Through
15