design and fabrication of solar water distillation system
TRANSCRIPT

Design and Fabrication of Solar
Water Distillation System for
Developing Countries
IDA FLATVAL ULEBERG
SUPERVISOR
Associate Professor Souman Rudra
University of Agder, 2017
Faculty of Engineering and Science
Department of Engineering Sciences


i
Abstract
The local population in Somalia is experiencing a shortage of fresh drinking water due to high
salt content in the ground water. The humanitarian organization Yme is a big contributor for
providing clean and safe drinking water for local communities. Yme is interested in building
an effective water distillation system to improve the water quality and better the health
situation in the country.
The main goal of this thesis was to contribute to improving water quality by building a solar
water distillation system. As the system is meant for local communities in Somalia, the
technology should be easy and without modern control system.
The project was highly limited by time. The parts for the prototype was therefore ordered
from stock and not custom made for the project. It was also limited by location. Fabrication
and testing were conducted in Norway, and not Somali conditions.
To design the prototype an optimization was performed in Matlab to find optimal system
temperatures. A pinch analysis was performed based on the temperatures, and the size of key
components were calculated. Prior to fabrication, a 3D model of the system was made in
Solidworks in order to design the system.
Due to low temperatures during testing, the prototype was not able to evaporate the saline
water. The main reason for the system’s inability to distillate water was the external
conditions in the testing environment. Calculations indicates that the system should be able to
evaporate the water in Somali conditions.
For future work, the system should be insulated and tested under various conditions to find
the external conditions requirements for the distillation to take place.

ii

iii
Acknowledgements
I would first like to thank the organization Yme, and their manager Geir Helge Ommundsen
specially, for giving me the opportunity to work with this project and for financing the
prototype. In addition, I would like to thank IUG Sørlandet, for help with financing the
prototype.
I would then like to thank my supervisor, Associate Professor Souman Rudra at the University
of Agder. His door was always open, and his support much appreciated.
I would also like to thank Senior Engineer Johan Olav Brakestad, at the University of Agder,
for his helpful advices. And the people at Tratec Koab AS for their help with fabrication and
testing of the prototype.
I would also like to acknowledge the master students, Marius Christoffersen, Endre
Danielsen, Christian H. Frivold and Amund R. Hval, in renewable energy engineering at the
University of Agder, for providing an optimization code in Matlab.
Finally, I must express my gratitude to my parents and my friends for encouraging and
supporting me throughout my five years at the university and through the writing of this
thesis. Thank you.
Author
Ida Flatval Uleberg

iv
v
Contents
Contents ...................................................................................................................................... v
List of Tables ........................................................................................................................... viii
List of Figures ........................................................................................................................... ix
1 Introduction ........................................................................................................................ 1
1.1 Motivation ................................................................................................................... 1
1.2 Problem Statement ....................................................................................................... 1
1.3 Objectives .................................................................................................................... 1
1.4 Limitations ................................................................................................................... 2
1.5 Method ......................................................................................................................... 2
1.6 Thesis Outline .............................................................................................................. 2
2 Theory ................................................................................................................................ 3
2.1 Background .................................................................................................................. 3
2.1.1 Distillation System ............................................................................................... 3
2.1.2 Solar Collector ...................................................................................................... 5
2.1.3 Heat Exchangers ................................................................................................... 5
2.1.4 Heating fluid ......................................................................................................... 6
2.1.5 System Temperatures ........................................................................................... 6
2.1.6 Water Storage ....................................................................................................... 6
2.1.7 Water quality ........................................................................................................ 7
2.2 Assumptions ................................................................................................................ 7
2.3 Water Quality Requirements ....................................................................................... 7
3 Method ............................................................................................................................... 9
3.1 Optimization ................................................................................................................ 9
3.1.1 Matlab Optimization ............................................................................................ 9
3.1.2 Pinch Analysis .................................................................................................... 11

vi
3.1.3 Aspen Plus Simulation ....................................................................................... 12
3.2 Modeling .................................................................................................................... 13
3.2.1 Design ................................................................................................................. 13
3.2.2 Salt Cleaning ...................................................................................................... 13
3.2.3 Water Level Control ........................................................................................... 14
3.3 Testing approach ........................................................................................................ 15
4 Results .............................................................................................................................. 17
4.1 Optimization .............................................................................................................. 17
4.1.1 Matlab Optimization .......................................................................................... 17
4.1.2 Pinch Analysis .................................................................................................... 18
4.1.3 Aspen Plus Simulation ....................................................................................... 22
4.2 Design ........................................................................................................................ 23
4.2.1 Evaporator and Condenser ................................................................................. 23
4.2.2 Solar Collector .................................................................................................... 23
4.2.3 Pump and Solar Panel ........................................................................................ 24
4.2.4 Heating Fluid, Water Storage and Filter ............................................................ 24
4.2.5 System Design .................................................................................................... 25
4.2.6 Building Process ................................................................................................. 30
4.3 Economics ................................................................................................................. 33
4.3.1 System Cost ........................................................................................................ 33
4.3.2 Alternative Budget ............................................................................................. 34
4.4 Experiment ................................................................................................................. 35
4.4.1 External Conditions ............................................................................................ 35
4.4.2 System Temperatures ......................................................................................... 36
4.4.3 Heat Transfer ...................................................................................................... 39
5 Discussion ........................................................................................................................ 41
5.1 Optimization .............................................................................................................. 41

vii
5.2 Design ........................................................................................................................ 41
5.3 Experiment ................................................................................................................. 42
6 Conclusion ........................................................................................................................ 44
7 Future Work ..................................................................................................................... 45
References ................................................................................................................................ 46
Appendices .................................................................................................................................. I

viii
List of Tables
Table 2-1: The assumed temperatures in the system [1]. ........................................................... 6
Table 3-1: Description of the temperatures in the optimization. .............................................. 11
Table 4-1: Results of the Matlab optimization. ........................................................................ 17
Table 4-2: Calculations of enthalpy change for the hot streams in the system. ....................... 18
Table 4-3: Calculations of enthalpy change for the cold streams in the system, ..................... 18
Table 4-4: Cost of the prototype. ............................................................................................. 33
Table 4-5: Alternative budget for the production of the system. ............................................. 34
Table 4-6: The external conditions during the test. .................................................................. 36
Table 4-7: The measurements of the system temperatures. ..................................................... 38

ix
List of Figures
Figure 2-1: An example of a basin type distillation system [2]. ................................................ 3
Figure 2-2: A simple overview of the system based on Yme’s original design. ........................ 5
Figure 3-1: Objective function for Matlab optimization. ......................................................... 10
Figure 3-2: Constraints for Matlab optimization. ..................................................................... 10
Figure 3-3: Matlab optimization code, made by first year master students. ............................ 11
Figure 3-4: The Aspen plus model of the streams in the system. ............................................ 13
Figure 3-5: A typical floating valve [20]. ................................................................................ 14
Figure 3-6: A picture of the pH meter [21]. ............................................................................. 16
Figure 4-1: The combine composite curve for the evaporator. ................................................ 19
Figure 4-2: Grand composite curve for the evaporator. ........................................................... 19
Figure 4-3: Combined composite curve for the condenser. ..................................................... 20
Figure 4-4: Grand composite curve for the condenser. ............................................................ 20
Figure 4-5: Combined composite curve for the system. .......................................................... 21
Figure 4-6: Grand composite curve for the system. ................................................................. 21
Figure 4-7: The Aspen plus model, with the temperatures of the streams displayed. ............. 22
Figure 4-8: 3D model of the system, including descriptions of the parts. ............................... 26
Figure 4-9: 3D model of the system, seen from the side. ......................................................... 27
Figure 4-10: 3D model of the rig. With the main dimensions in millimetre. ........................... 28
Figure 4-11: The parts of the heat exchanger. Tube bundle on the left, shell in the middle and
end piece on the right. .............................................................................................................. 28
Figure 4-12: 3D model of the evaporator. ................................................................................ 29
Figure 4-13: The solar collector on the left and a single evacuated tube on the right. ............ 29
Figure 4-14: The rig, built by Tratec Koab AS. ....................................................................... 30
Figure 4-15: The finished system seen from the solar collector side. ...................................... 31
Figure 4-16: The finished system seen from the heat exchanger side. .................................... 32
Figure 4-17: The thermometer measuring the temperature of the heating fluid. ..................... 37
Figure 4-18: The system temperatures displayed graphically. ................................................. 39

x

1
1 Introduction
This report includes the work that has been done for the course ENE 500 – Master’s Thesis
Renewable Energy at the University of Agder. It is the final thesis for the Master of Science
in renewable energy engineering. The work is based on the preliminary study “Solar Water
Distillation System for Developing Countries”.
1.1 Motivation
Somalia experiences a shortage of drinking water due to a high salt content in the ground
water. The humanitarian organization Yme is a big contributor for providing clean and safe
drinking water for local communities. Yme wants to build an effective water distillation
system to improve the water quality and better the health situation in the country. Renewable
energy in the form of solar energy is highly available in Somalia, and can be used as an
energy source to clean the saline ground water.
1.2 Problem Statement
The main goal of this thesis is to contribute to improving water quality by designing a solar
water distillations system. The system should be able to supply 20 litres of water per day,
which, according to Yme, is approximately the demand for one household.
As the system is meant for local communities in Somalia, the technology should be easy and
without modern control system. The system should also be robust, and require low
maintenance.
1.3 Objectives
The general objective of the thesis is to design and build a prototype of the solar water
distillation system and test that prototype for further improvement. The test should determine
the system temperatures during production, the production rate and the quality of the distilled
water.
The specific objectives are to optimize the system temperatures and determine the size of the
different system parts. Further, to find the cost of the prototype, as well as an alternative
budget for any future production. The last specific objective before building the prototype is
to make a 3D model of the solar water distillation system.

2
1.4 Limitations
The most significant limitation for the project is the time limit. The parts for the prototype are
therefore ordered based on delivery time rather than cost. All parts are purchased from
Norwegian suppliers.
The prototype is built in Norway, and also tested in Norway. The results are therefore not
from Somali conditions.
1.5 Method
The system temperatures are optimized in Matlab. A pinch analysis are conducted to find the
optimal required heat in the system, and thereby the size of the evaporator, condenser and
solar collector. Aspen plus is used to do a simple simulation on the streams in the system, to
find the actual system temperatures. A 3D model of the system is made in Solidworks, to
determine how to assemble the parts of the system.
The testing of the prototype is conducted in Norway. To simulate the Somali groundwater,
salt is added to fresh water when testing the solar water distillation system.
1.6 Thesis Outline
Chapter 2 contains the theory behind the thesis. The main part of this chapter is an overview
of the preliminary study conducted before the thesis. Chapter 3 contains the description of
method. Matlab optimization, pinch analysis and Aspen plus simulation are described.
Additionally, the modelling and testing approach are described. In Chapter 4 the results are
presented. The chapter includes the result from the optimization in Matlab, the pinch analysis
and the simulation in Aspen plus. Further, it includes the calculation of the evaporator,
condenser and solar collector sizes, as well as the determination of the remaining system
parts. The system design, system cost and result of the experiment on the prototype are also
presented in Chapter 4. Chapter 5 and 6 are the discussion of the results and the conclusion of
the thesis. The final Chapter 7 gives suggestions for future work.

3
2 Theory
This chapter includes the theory behind the thesis. First, an overview is given of the
preliminary study the thesis is based on. Then the assumptions behind the calculations are
given. Lastly, the requirements for good water quality are described.
2.1 Background
A preliminary study was conducted prior to the master thesis. This section contains an
overview of the literature review and results from the preliminary study “Solar Water
Distillation Systems for Developing Countries” [1].
2.1.1 Distillation System
There are several different methods for solar distillation, like basin distillation, indirect solar
desalination and humidification-dehumidification desalination. The basin distillation is the
simplest solar desalination technology. A basin with an inclined glass cover is partly filled
with saline water. Solar irradiation evaporates the water in the basin, which rises and
condenses as it meets the glass cover. As the glass cover is inclined, the condensed water will
run down the glass and be collected as clean water in the bottom of the basin. An example of
a basin type distillation system is displayed in Figure 2-1 [2].
Figure 2-1: An example of a basin type distillation system [2].

4
Indirect solar desalination includes several methods for desalinating water. Common to them
all are that they use a solar collector as the heating source for the saline water, rather than the
water being heated directly by the solar irradiation.
Humidification-dehumidification desalination is an indirect solar desalination where dry air is
used as working fluid. The dry air is humidified by the evaporated saline water. The humid air
transport the clean water vapor to a condenser, where the water is condensed and can be
collected as clean drinking water.
Indirect solar desalination is the method used in this project, where a solar collector with a
heating fluid is used as the heat source. Additionally to the solar collector, the system consist
of two heat exchangers, one that evaporate the saline water and one that condense the steam
from the evaporator.
The saline water is stored in a water storage tank before it is preheated in the condenser
tankside. The evaporator is connected to a solar collector that works as the heat source. A
heating fluid flows in a loop through the solar collector and the evaporator tubeside, where it
heats the saline water located in the evaporator tankside. To ensure the flow of the heating
fluid, a small pump, supplied by a solar panel, is used. The evaporated water flows from the
evaporator and through the tubes in the condenser where the steam condenses. Lastly, the
distilled water flows through a remineralization filter before it is collected in a second storage
tank. Figure 2-2, overleaf, shows an overview of the system. The figure is a modified version
of the original drawing made by Yme.

5
Figure 2-2: A simple overview of the system based on Yme’s original design.
2.1.2 Solar Collector
The three main suitable solar collectors for distillation are flat plate, evacuated tube, and
parabolic trough solar collector. The flat plate solar collector does not reach high enough
temperatures to evaporate the saline water and is therefore not suitable for this project. After
reviewing the collectors, the evacuated tube solar collector was considered the best option
based on availability, price and temperature range.
2.1.3 Heat Exchangers
Both the evaporator and condenser should be counter-flow heat exchangers, as the counter-
flow has a higher effectiveness than parallel-flow heat exchangers. Both will also be shell and
tube heat exchangers, as it is the most common and versatile heat exchanger [3]. The
condenser will be positioned, so the streams will flow by the force of gravity. The evaporated
water will flow into the condenser due to steam pressure.
The heat transfer area was in the preliminary study calculated to be 0.292 m2 and 0.14 m2 for
the evaporator and condenser, respectively. The size of the shell was calculated to
approximately 13x17x132 cm for the evaporator and 13x14x68 cm for the condenser.

6
2.1.4 Heating fluid
A heating fluid will be used to heat the water in the evaporator tank. After comparing several
heat transfer fluids, silicone was decided to be the best alternative as it is non-corrosive, long-
lasting and has a high boiling point [1].
It was also decided that a pump will be used to ensure the flow of the heating fluid. To power
the pump a small solar panel is to be used. A regular pump has 230 V rated voltage, and a
small solar cell typically has a 12 V system voltage. An inverter will, therefore, be used to
apply the rated voltage to the pump.
2.1.5 System Temperatures
For analysis and calculations, the temperatures in the system must be known. The temperature
of the saline ground water is, according to Yme, 30°C. The steam temperature was set to be
100°C, as water evaporates at this temperature in atmospheric pressure [4]. The remaining
temperatures were assumed in the preliminary study. Table 2-1 displays the assumed system
temperatures. Where TH,in and TH,out is the temperature of the hot stream in and out of the two
heat exchangers. TC,in and TC,out are the cold stream in and out of the two heat exchangers.
Table 2-1: The assumed temperatures in the system [1].
Temperature Evaporator Condenser
TH,in 150°C 100°C
TH,out 80°C 40°C
TC,in 50°C 30°C
TC,out 100°C 50°C
For the evaporator, the hot streams in and out are the heating fluid in and out of the
evaporator. The cold streams in and out are the preheated water and the steam, respectively.
For the condenser, the hot streams in and out are the steam and the distilled water,
respectively. The cold streams in and out are the saline water and the preheated water,
respectively.
2.1.6 Water Storage
There will be two storage tanks in the system. One for the saline water before it enters the
condenser and one for the produced water after distillation. As the goal is to produce 20 litres

7
of water per day, the storage tank for the distilled water will have to be a 20 litres tank. The
storage tank for the saline water will have to be bigger, as the saline water is containing salt
and minerals that will not be in the distilled water. The saline water storage tank was set to
have 25 litres of volume in the preliminary study.
2.1.7 Water quality
Important aspects of the water quality are content of salt, metals and bacteria. As the water
will be distilled, salt and metals will not leave the evaporator tank when the water evaporates.
When water boils, all pathogens are killed. Salt, metals and bacteria in the water will therefore
not be an issue [1].
The issue with distilled water is the low content of minerals and possible issues with taste and
odour. The distilled water will, therefore, be filtered in a remineralization filter before
entering the storage tank. The filter will add calcium to the water.
2.2 Assumptions
In the preliminary study, the calculations were based on four hours of operation per day, with
average solar irradiation 915.75 W/m2. The sun irradiates all day, and a longer production
time is therefore possible. For the thesis, the production time is assumed eight hours per day.
The irradiation is set to 756.67 W/m2, which is the average irradiation in Somalia between
08.00 – 16.00. The irradiation is calculated from the average daily irradiation in December, as
December is a month with medium solar irradiation in Somalia. The solar irradiation
information was found in the online solar calculator PVGis [5].
A project funded by the European Union measured the groundwater quality in different areas
of Somalia in 2012. They found salinity levels between 160 μS/cm and 11 000 μS/cm, or
approximately between 96 mg/l and 6 600 mg/l [6, 7]. 6 600 mg/l will be assumed the salt
content in this thesis, as the system should be able to handle the worst case scenario.
2.3 Water Quality Requirements
An important part of testing the system will be on the water quality. As mentioned in Section
2.1.7, the issues with distilled water are low mineral content and possible issues with taste and
odour. Besides testing the taste and odour by drinking and smelling the water, the pH value
will be tested, as it can affect the taste. The pH value should be between 6.5 and 8.5 [1].

8
Additionally, the calcium content of the water will be tested, as the remineralization filter will
add calcium to the distillate. Due to uncertainties regarding mineral nutrition from drinking
water, the World Health Organization does not make recommendations for the minimum
content of calcium. Although, they give a taste threshold for the calcium between 100 and 300
mg/l [8]. The National Institute of Public Health in the Czech Republic states in a report that
the minimum and optimal values for calcium content in drinking water are 20 mg/l and 40-80
mg/l, respectively [9].
Salt content is not an issue, required the system functions correctly. The water salinity should
therefore be tested, to make sure saline water has not entered the condenser tubeside. Salinity
is measured by the conductivity of the water. No Somali requirements for salt content in the
drinking water were found. According to Norwegian regulations concerning water supply and
drinking water, the conductivity of drinking water can not exceed 2500 μS/cm, or 1 500 mg/l
[10].

9
3 Method
This chapter contains an explanation of the methods used to design the solar water distillation
system. It includes the methods behind the optimization of the system, the modelling of the
system, and finally the testing approach.
3.1 Optimization
The system temperatures is first optimized in Matlab, then the optimized temperatures are
used to conduct a pinch analysis. Lastly, a simulation is done on the system temperatures in
Aspen plus.
3.1.1 Matlab Optimization
Matlab is a software that uses matrix-based language to express computational mathematics.
It is used to analyse and design systems and products, and for solving science and engineering
problems [11]. Matlab is used in this project to optimize the system temperatures.
To produce 20 litres of water, with density 1000kg/m3, during the course of eight hours, the
average flow rate of the produced water, the steam and the saline water from the storage tank
should be approximately 1/1440 kg/s. The specific heat of water is 4800 J/kg*K. Clearco
supplies a silicone heating fluid. It has specific weight 0.95 and specific heat 1.6 kJ/kg*K
[12].
From the preliminary study, the volume of the heating fluid is approximately 1.04 litres [1].
Assuming the heating fluid circulates once every five minutes, the flow rate is 0.0012 kg/s.
The objective function is based on the thermal energy balance in the two heat exchangers. The
heat transfer rate, or thermal energy per time, is calculated by Equation 1 [13].
�̇� = �̇� ∗ ∆𝑇 ∗ 𝑐𝑝 Equation 1
Where:
�̇� = Heat transfer rate [W]
�̇� = Mass flow [kg/s]
∆𝑇 = Temperature difference between inlet and outlet [K]
𝑐𝑝 = Specific heat [J/kg*K]

10
Additional to the thermal heat calculated by Equation 1, the system needs heat to change the
phase of the water first from liquid to gas and then back to liquid, also called latent heat. The
heat transfer rate of the latent heat can be calculated to 1567 W by Equation 2.
�̇� = �̇� ∗ 𝐿 Equation 2
Where:
�̇� is the heat transfer rate [W]
�̇� is the mass flow rate [kg/s]
L is the specific latent heat [kJ/kg] (2257 kJ/kg for water [14])
For the optimization, the system is assumed ideal and losses are not included. Figure 3-1
shows the Matlab code for the objective function.
Figure 3-1: Objective function for Matlab optimization.
Figure 3-2 shows the Matlab code for the temperature constraints. The different temperatures
are described in the following Table 3-1, overleaf.
Figure 3-2: Constraints for Matlab optimization.

11
Table 3-1: Description of the temperatures in the optimization.
Heat exchanger Stream Name
T1 Condenser Cold in Raw water
T2 Condenser / Evaporator Cold out/Cold in Preheated raw water
T3 Evaporator/Condenser Cold out/Hot in Steam
T4 Condenser Hot out Distilled water
T5 Evaporator Hot in Heating fluid
T6 Evaporator Hot out Heating fluid
Figure 3-3 shows the Matlab optimization code. The initial guess of the temperatures are set
to the temperature assumptions made in the preliminary study, listed in Table 2.1 in Section
2.1.5.
Figure 3-3: Matlab optimization code, made by first year master students.
3.1.2 Pinch Analysis
From the optimized temperatures, a pinch analysis is performed to calculate the correct size of
the two heat exchangers and the solar collector.
To conduct a pinch analysis, the enthalpy change must be known. The enthalpy change is
found as the heat transfer rate calculated by Equation 1 and Equation 2 for thermal and latent
heat, shown in Section 3.1.1.
The pinch analysis is conducted in an online tool written by Jeffrey S. Umbach [15]. The
analysis is conducted for each the evaporator and condenser to determine the optimal heating
area needed in each. It is also conducted for the two heat exchangers combined, to find the
minimum heat requirement for the total system. For shell and tube heat exchangers the
minimum temperature difference between hot and cold stream is often set between 3-5°C
[13]. The minimum temperature difference is, for the thesis, set to 5°C for the three analyses.

12
From the minimum required heating the heat transfer area of the evaporator and condenser is
calculated by Equation 3 [13].
𝐴 =
�̇�
𝑈 ∗ ∆𝑇𝑙𝑚
Equation 3
Where:
A is the required heat transfer area [m2]
�̇� is the ideal minimum required heating [W]
U is the overall heat transfer coefficient [W/m2K]
∆Tlm is the logarithmic mean temperature difference [K]
The area of the solar collector is calculated by Equation 4.
𝐴 =
�̇�
𝐼 ∗ 𝜂
Equation 4
Where:
A is the solar collector area [m2]
�̇� is the heat transfer rate in the system [W]
I is the solar irradiation [W/m2]
𝜂 is the efficiency of the solar collector [-]
3.1.3 Aspen Plus Simulation
A simple model was made in Aspen plus. Aspen plus is a software for design, operation and
optimization of chemical processes [16]. The software is used in the thesis to simulate the
operation of the solar water distillation system.
The Aspen plus model consists of the two heat exchangers and the streams in the system. In
the software, the heat exchangers were designed by the shortcut method, which is a simplified
model of a heat exchanger.
The process diagram of the system in Aspen plus is shown in Figure 3-4, overleaf. EVA and
COND are the evaporator and condenser, respectively. HINEVA, HOUTEVA, CINEVA and
COUTEVA are the hot streams in and out of the evaporator and the cold streams in and out of
the evaporator, respectively. Lastly, the CINCOND and COUTCOND are the cold streams in
and out of the condenser.

13
Figure 3-4: The Aspen plus model of the streams in the system.
3.2 Modeling
The prototype is designed as a 3D model before it is fabricated. The design is made in the
designing software Solidworks. Additional to the assembling of the parts of the solar water
distillation system, salt cleaning and water lever control are important aspects of the design.
3.2.1 Design
The prototype of the solar water distillation system is designed in Solidworks. Solidworks is a
complete 3D software tool. It can be used to design, simulate, publish and manage data [17].
For the thesis, the software is used to design the prototype, and determine how to assemble
the parts.
The parts in the system is first made separately. The sizes of the parts are determined by the
information given by suppliers. All the parts are then assembled, and a rig is designed based
on the assembly.
3.2.2 Salt Cleaning
When desalinating water, heat exchanger fouling needs to be considered. Fouling occurs
because of unwanted deposits on the heat exchanger surfaces [18]. In this project, the build-up
of salt in the evaporator tank is the main reason for fouling.
There are several methods for cleaning heat exchangers. They are divided into two main
groups; on-line and off-line cleaning. The groups indicate whether or not the heat exchanger
is connected to the stream during cleaning. On-line techniques often use chemicals or
mechanical mechanisms, and are therefore not optimal for the prototype, as it should be easy

14
to maintain. The on-line techniques generally need additional equipment that is included in
the design [18]. As the heat exchangers in this project will not be custom made, additional
equipment will not be implemented in the design.
Off-line cleaning methods can be chemical or mechanical as well, but the group also includes
manual cleaning and steam- or hydro-blasting [18, 19]. Blasting means the inside of the heat
exchanger is cleaned with pressurized steam or water.
The evaporator used for the prototype is small enough to be disconnected from the system so
the salt could be manually poured out. Disconnecting the evaporator would cause the heating
fluid to leak out, and should therefore be avoided. Hydro-blasting is a better option for the
prototype. The evaporator then only needs to be disconnected from the condenser, and the salt
can be flushed out by pressurized water.
3.2.3 Water Level Control
For the distilled water to be clean, it cannot mix with the saline water. It is important to
control the water level, and avoid the saline water to rise in the evaporator tankside and mix
with the distilled water in the condenser tubeside.
A floating valve is a good option for controlling the water level. The valve would be placed in
the evaporator tank inlet, and it would close when the water level is close to the outlet. Figure
3-5 shows a typical floating valve. The valve closes when the ball floats up with the increase
in water level.
Figure 3-5: A typical floating valve [20].

15
Unfortunately, a floating valve is too big to fit in the evaporator tank, due to the tubes inside.
In a custom-made evaporator, there could be made room for a floating valve. In the prototype,
the water level will be controlled manually by opening and closing a spout on the storage tank
with the saline water. The manual control will be approximate, as the water level can not be
seen from the outside of the evaporator tank.
3.3 Testing approach
To test the system, it must be fed with saline water. As mentioned in Section 2.2, the
Somalian groundwater has a salt content up to 6 600 mg/l. To achieve the correct salinity, salt
will be added to freshwater. Approximately 0.13 kg of salt is added to 20 litres of water to
obtain 6 600 mg/l salt content.
The testing will be conducted outside in Norwegian conditions. It will be conducted in
Birkeland in the beginning of May. The test lasts for eight hours, between the hours of 09.00
and 17.00. As the testing is conducted outside and not in a lab, external conditions are not
controlled and are, therefore, registered. External conditions include the solar irradiation,
cloudiness and ambient temperature.
The amount of produced water and the water quality will be tested. PH value and calcium
content will be measured to find the quality of the water. Salt content will be measured to
determine if any saline water has entered the condenser tubeside.
The pH value will be measured by a digital meter from 24shop.no. The pH meter measures
pH from 0.0 – 14.0, with 0.1 pH uncertainty [21]. The pH meter is displayed in Figure 3-6.

16
Figure 3-6: A picture of the pH meter [21].
Test paper strips will measure salt content. The strips measure salt content from 400 ppm to
7000 ppm, or 400 mg/l to 7 000 mg/l [22]. The calcium content will be measured by a
titration test, where a reagent is dripped into a sample of the produced water until the colour
of the sample changes. The calcium content is found by counting the number of drops needed
to change the colour. Each drop translates to 20 mg/l [23].
Further, system temperatures will be measured. The temperature of the hot stream in and out
of the evaporator and the cold stream into the evaporator will be measured. The streams
contain the preheated water from the condenser, the steam flow, and the heating fluid into the
evaporator, respectively.

17
4 Results
This chapter contains the results of the thesis. The results from the optimization, design and
testing are included. The economics of the solar water distillation system are also included in
this chapter. Finally, the results from the experiment are presented.
4.1 Optimization
As described in Section 3.1.1, the system temperatures are optimized in Matlab. The result of
the optimization is then used in a pinch analysis to find minimum heating and cooling in the
system. From the pinch analysis, the sizes of the evaporator, condenser and solar collector are
calculated. Finally, a simulation is conducted in Aspen plus to find the actual system
temperatures.
4.1.1 Matlab Optimization
In the Matlab optimization, the objective function is based on the thermal energy balance of
the two heat exchangers. In the constraints the temperature of the saline water is set to be
30°C, and the temperature of the steam flow is set to be 100°C. Table 4-1 shows the results of
the Matlab optimization.
Table 4-1: Results of the Matlab optimization.
Temperature [°C]
T1 30.00
T2 64.02
T3 100.00
T4 40.00
T5 140.73
T6 89.27
The temperature of the saline water and the steam are 30°C and 100°C, respectively, as set in
the constraints. Further, the temperatures of the preheated water, the produced water and the
heating fluid in and out of the evaporator have optimized values 64.02°, 40°C, 140.73°C and
89.27°C, respectively.

18
4.1.2 Pinch Analysis
Table 4-2 and Table 4-3 displays the calculations of the enthalpy change used in the pinch
analysis for, respectively, the hot and cold streams of the system. Where H1 and H2 are the
heating fluid and the produced water, respectively. C1 and C2 are the saline water from the
storage tank and the water in the evaporator, respectively.
Table 4-2: Calculations of enthalpy change for the hot streams in the system.
Hot streams Flow rate * Specific heat Supply
temperature
Target
temperature
Enthalpy
change
H1 0.0012 kg/s * 1.6 kJ/kg*K 140.73 °C 89.27 °C 98.8 W
H2 1/1440 kg/s * 4.18 kJ/kg*K 100 °C 40 °C 174.2 W
Condensation 1/1440 kg/s * 2257 kJ/kg* - - 1567 W
Table 4-3: Calculations of enthalpy change for the cold streams in the system,
Cold streams Flow rate * Specific heat Supply
temperature
Target
temperature
Enthalpy
change
C1 1/1440 kg/s * 4.18 kJ/kg*K 30 °C 64.02 °C 98.8 W
C2 1/1440 kg/s * 4.18 kJ/kg*K 64.02 °C 100 °C 104.4 W
Evaporation 1/1440 kg/s * 2257 kJ/kg - - 1567 W
The evaporator is analysed by inserting stream H1, C2 and evaporation, from Table 4-2 and 4-
3, into the online pinch analysis tool. The pinch temperature is 69.02°C, the ideal minimum
heating required is 1572.6 W and there is no minimal cooling required. Figure 4-1 and Figure
4-2, overleaf, from the online pinch analysis tool, displays the combined composite curve and
the grand composite curve, respectively.
19
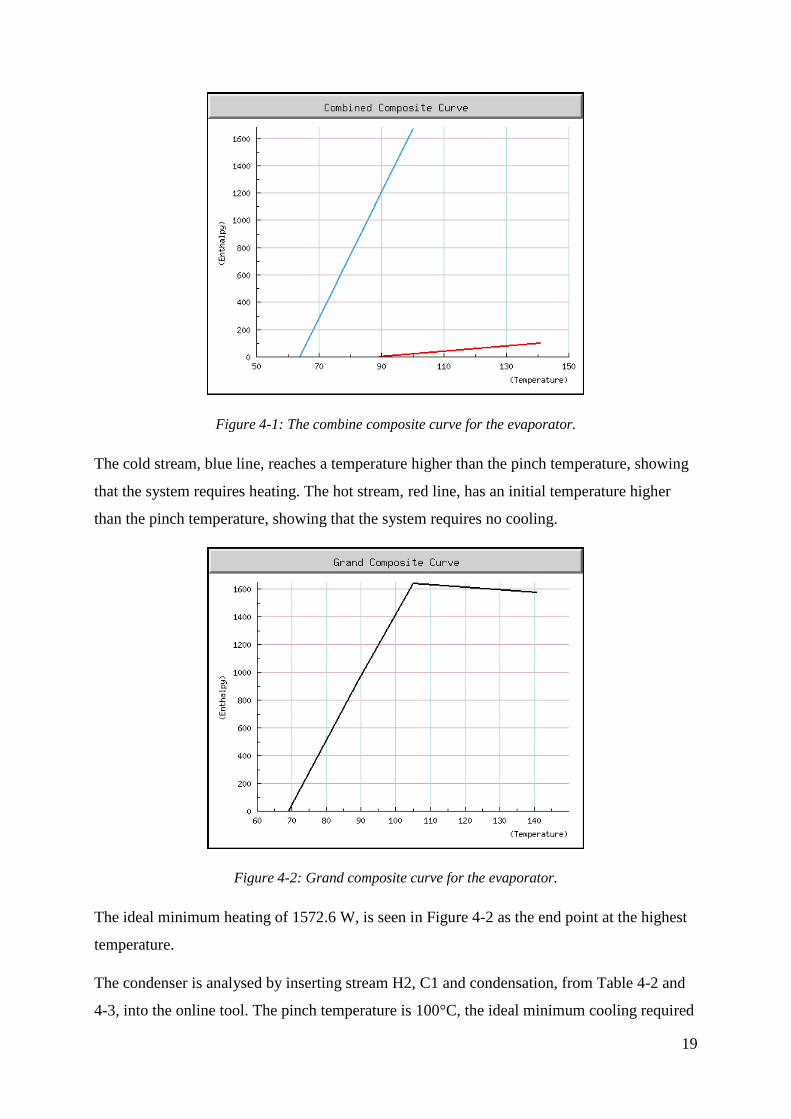
Figure 4-1: The combine composite curve for the evaporator.
The cold stream, blue line, reaches a temperature higher than the pinch temperature, showing
that the system requires heating. The hot stream, red line, has an initial temperature higher
than the pinch temperature, showing that the system requires no cooling.
Figure 4-2: Grand composite curve for the evaporator.
The ideal minimum heating of 1572.6 W, is seen in Figure 4-2 as the end point at the highest
temperature.
The condenser is analysed by inserting stream H2, C1 and condensation, from Table 4-2 and
4-3, into the online tool. The pinch temperature is 100°C, the ideal minimum cooling required

20
is 1642.4 W and there is no minimal heating required. Figure 4-3 and Figure 4-4 display the
combined composite curve and the grand composite curve, respectively.
Figure 4-3: Combined composite curve for the condenser.
The cold stream, blue line, increases to a temperature lower than the pinch temperature,
showing that the system requires no heating. The hot stream, red line, has an initial
temperature lower than the pinch temperature, showing that the system requires cooling.
Figure 4-4: Grand composite curve for the condenser.
The ideal minimum cooling of 1642.4 W, is seen in Figure 4-2 as the start point at the lowest
temperature.

21
For the analysis of the system all the streams from Table 4-2 and 4-3 are inserted in the online
tool. The analysis gives 69.02°C pinch temperature, 743.36 W ideal minimum cooling and
673.56 W ideal minimum heating. Figure 4-5 and Figure 4-6, overleaf, displays the combined
composite curve and the grand composite curve, respectively.
Figure 4-5: Combined composite curve for the system.
The cold stream, blue line, reaches a temperature higher than the pinch temperature, showing
that the system requires heating. The hot stream, red line, has an initial temperature lower
than the pinch temperature, showing that the system requires cooling.
Figure 4-6: Grand composite curve for the system.

22
The ideal minimum cooling of 743.36 W is shown as the start point at the lowest temperature.
The ideal minimum heating of 673.56 W is shown as the end point at the highest temperature.
The required heat transfer for the system was found by adding the minimum heating and
cooling found in the pinch analysis, giving a total required heat transfer rate of 1 416.92 W.
4.1.3 Aspen Plus Simulation
The Aspen plus model was used to simulate the temperatures of the system. By inserting the
optimized temperatures found in Section 4.1.1, the solution would not converge. The
temperature of the hot stream out of the evaporator was changed until a solution converged. It
was found that for the model to have a solution, the temperature of the hot stream out of the
evaporator had to be 90°C.
The simulation gave a high temperature for the hot stream out of the condenser, which is the
distilled water. This temperature was then set to 40°C, which was found in the optimization.
The result of this was an increase in temperature for the cold stream into the evaporator,
which is the preheated water. The simulation showed the temperature of the preheated water
had to be 80°C.
Also, the cold side of the heating fluid increased its temperature. By setting 140°C, as found
in the Matlab optimization, as the hot stream into the evaporator, the hot stream out had a
temperature of 121°C.
Figure 4-7 shows the result of the Aspen plus simulation, with the system temperatures
displayed.
Figure 4-7: The Aspen plus model, with the temperatures of the streams displayed.

23
4.2 Design
First in the design process, the size of the evaporator, condenser and solar collector are
calculated. The specifications of the remaining parts of the system are then determined.
Finally, before the building of the prototype, the system is designed by making 3D models of
the parts and determine their assembly.
4.2.1 Evaporator and Condenser
Based on assumptions in the preliminary study, the overall heat transfer coefficient of the
evaporator is 300 W/m2K and the logarithmic mean temperature difference is 39.15°C [1].
From the pinch analysis on the evaporator and by Equation 3, this gives a heat transfer area
for the evaporator of 0.13 m2, approximately what was calculated for the condenser in the
preliminary study.
VidaXL supplies heat exchangers with diameter 13.4 cm and various lengths [24]. Assuming
there is a correspondence between heat transfer area and volume, the length would have to be
87.8 cm to have the same volume calculated for the condenser in the preliminary study. The
largest heat exchanger from vidaXL is 61.3 cm. As the evaporator was found to be smaller
than what was calculated for the condenser in the preliminary study, the 61.3 cm long heat
exchanger will be used as the evaporator.
From the minimum required cooling in the pinch analysis on the condenser, Equation 3 is
used to calculate the required heat transfer area of the condenser. Based on the assumptions in
the preliminary study that the overall heat transfer coefficient is 1000 W/m2K and the
logarithmic mean temperature difference is 24.85°C, the required heat transfer area is 0.066
m2 for the condenser [1]. The area is around half the size of the evaporator. The heat
exchanger from vidaXL with length 35.5 cm will be used as the condenser.
4.2.2 Solar Collector
Agder Solenergi supplies solar collectors [25]. From their solar collector data sheet in
Appendix A, the efficiency of the collector is found to be 74.4 % for all the collector sizes. As
mentioned in Section 2.2, the average irradiation is set to 756.67 W/m2. The needed solar
collector area is then calculated by Equation 4 to be 2.5 m2. As the tubes in the collector are
1.7 m long and have a diameter of 58 mm, the number of tubes needed is 25.

24
4.2.3 Pump and Solar Panel
As mentioned in Section 2.1.4, a pump will be used to ensure the flow of the heating fluid.
The pump will be connected to the closed loop between the solar collector and the evaporator.
As mentioned, the evacuated tubes of the solar collector are 1.7 m long. The maximum height
of the solar collector is then 1.7m. By taking into account some additional height for the rig
the collector is mounted to, the pump should have a head of at least two metres. The pump
will be placed on the outlet side of the evaporator, and should be able to withstand liquid with
a temperature of around 120 °C , as found in the Aspen plus simulation for the hot stream out
of the evaporator. Grundfos Alpha 2 is a small circulation pump with four meters maximum
head, and maximum liquid temperature of 110 °C [26]. This pump is suitable for the
prototype. Further pump specifications are listed in Appendix C.
To power the pump, a small solar panel will be used. The pump has 230 V rated voltage, and
a maximum current consumption of 0.18 A. The solar panel should, therefore, be able to
supply at least 40 W of power. A 55 W solar cell from sparelys.no is chosen for the prototype
[27]. The specifications of the solar cell are listed in Appendix D.
The system voltage of the solar cell is 12 V, while the rated voltage of the pump is 230 V. An
inverter is needed to operate the pump. To supply the needed power to the pump, the inverter
should also be able to supply at least 40 W. Elfadistrelec.no supplies a variety of electrical
components. Their smallest inverter for conversion from 12 VDC to 230 VAC has a
maximum output power of 110 W, which is sufficient to run the pump [28]. The technical
specifications for the inverter are listed in Appendix E.
4.2.4 Heating Fluid, Water Storage and Filter
Additional to the parts described in Section 4.2.1 through Section 4.2.3, the prototype needs
heating fluid, water storage tanks and filter. Silicone was preferred as the heating fluid, as it is
long-lasting and has a high boiling point [1]. Instead, a glycol heating fluid is purchased, due
to it being the only heating fluid available from Norwegian suppliers. Varmeshop.no delivers
the glycol based heating fluid Fernox Solar S1 [29]. The specifications of the heating fluid are
listed in Appendix F.
Two storage tanks with a volume of 20 litres is purchased. The size is decided based on
availability. They are supplied by Biltema, and they are the largest supplied tanks that are

25
suitable for drinking water. The water tanks each have a cap that can be removed to fill water,
and a spout with a closing mechanism.
Klart vann AS is a Norwegian supplier of different filter medias. They have a marble called
“Juraperle marmor” which is suitable for remineralization of distilled water [30]. It raises the
pH of the water and adds calcium. The datasheets for the filter house and the marble, obtained
from an e-mail from Klart Vann AS, are listed in Appendix G.
4.2.5 System Design
A 3D model of the system was made in Solidworks. The model was made to determine how
to assemble the parts when building the prototype. The solar panel and inverter are not
included in the model, as they are not fixed parts, but only needs to be connected to the pump
through electrical wires.
The parts were made separately in Solidworks, based on information from the suppliers. The
information can be found in Appendices A-G. They were then assembled and connected by
pipes. A 2D sketch of the model with dimensions is shown in Appendix H.
Figure 4-8 and 4-9, overleaf, displays the 3D model of the system in two different views. In
the first figure, descriptions of the parts are included. The figures display where the
components will be placed on the rig, but the mounting is not shown.

26
Figure 4-8: 3D model of the system, including descriptions of the parts.

27
Figure 4-9: 3D model of the system, seen from the side.
As can be seen in the previous figures, the two heat exchangers are vertical. This is so gravity
can pull the water down, instead if needing to use pumps. The condenser will have to be
parallel flow, to be able to take advantage of the gravitational force.
Figure 4-10 shows the rig with the main dimensions in millimetre. The dimensions of the rig
were based on the size of the system after assembly.

28
Figure 4-10: 3D model of the rig. With the main dimensions in millimetre.
The design for the two heat exchangers consists of an assembly of three parts, tube bundle,
shell and an end piece in each end. The heat exchanger parts are displayed in Figure 4-11,
where the tube bundle is on the left, the shell is in the middle and the end piece is on the right
side of the figure.
Figure 4-11: The parts of the heat exchanger. Tube bundle on the left, shell in the middle and end piece
on the right.

29
Figure 4-12 shows the evaporator. A cut is made in the figure to display the inside of the
evaporator. The condenser is similar, only shorter.
Figure 4-12: 3D model of the evaporator.
The solar collector consists of several evacuated tubes. Figure 4-13 displays the solar
collector on the left, and one evacuated tube on the right. The heat pipe is shown sticking out
of the top of the tube.
Figure 4-13: The solar collector on the left and a single evacuated tube on the right.

30
The remaining system parts, the storage tanks, pump and filter, are displayed separately in
Appendix I.
4.2.6 Building Process
The rig for the system, described in the previous section, was built by Tratec Koab AS. They
based the construction on the sketch in Figure 4-10, and were allowed to make modifications
if needed, as they have good knowledge about steel constructions. The modifications they
made were adding support beams underneath the rig to make it more stable for transportation.
The finished rig is displayed in Figure 4-14.
Figure 4-14: The rig, built by Tratec Koab AS.

31
Tratec Koab AS also mounted the system components to the rig. After the parts were mounted
to the rig, a plumber finished the piping to connect the parts. Figure 4-15 and 4-16 displays
the finished system from two sides, ready for testing.
Figure 4-15: The finished system seen from the solar collector side.

32
Figure 4-16: The finished system seen from the heat exchanger side.

33
4.3 Economics
This section includes an overview of the cost of the prototype and an alternative budget for
future production.
4.3.1 System Cost
Due to the projects time limitation, the choosing of parts was based mainly on delivery time.
Therefore, the size of the parts depend on what is available. They were be purchased with
similar properties as calculated but were not custom made to the optimal values. All parts
were purchased from Norwegian suppliers, to avoid having the parts held up at customs.
The purchased parts are described in Section 4.2. The purchased solar collector has 10 pipes
and not the 25 pipes calculated in Section 4.2.2. This is due to a miscalculation that was not
corrected before the tubes were purchased. Additional to the purchased parts, the system
includes a rig and piping to connect the parts, as mentioned in Section 4.2.6.
Table 4-4 shows the real cost for the prototype, including the different parts of the system and
the supplier of each part.
Table 4-4: Cost of the prototype.
Item Supplier Cost Shipping
Evaporator + Condenser vidaxl.no [24] 3 390 NOK -
Solar collector Agder Solenergi [25] 2 900 NOK -
Filter Klart vann AS [30] 5 662 NOK
Pump BilligVVS.no [26] 1 899 NOK 149 NOK
Solar cell Sparelys.no [27] 995 NOK 169 NOK
Inverter Elfa Distrelec [28] 2 147.5 NOK -
Heating fluid Varmeshop.no [29] 995 NOK 210 NOK
Storage tanks Biltema 298 NOK -
Piping and plumbing Rørlegger Roald Lien 14 786 NOK -
Rig and mounting Tratec Koab AS 17 500 NOK -
SUM 50 572.5 NOK
As Table 4-4 shows, the cost of the system parts sums up to 33 072.5 NOK, and the total cost
of the system is 50 572.5 NOK.

34
4.3.2 Alternative Budget
An alternative budget was made for the system parts. In this budget the focus was on the cost
of the various parts, as the system cost is an important aspect of any production of the system.
The delivery and customs cost is not included in the alternative budget, as the cost is not
known for larger orders of several parts.
Table 4-5 displays the alternative budget, to make the system cheaper when time is less of a
limit. The parts have similar properties and dimensions as the parts used in the prototype. The
price of the piping is based on the amount of piping in the 3D model in Section 4.2.5. The
prices were stated in American dollars or British pounds. For easier comparison of the two
budgets, the cost is converted to Norwegian kroner. The conversion is made based on the
exchange rate given by DNB at 20.04.2017 [31].
Table 4-5: Alternative budget for the production of the system.
Item Supplier Cost
Evaporator + Condenser Baode heat exchanger
www.made-in-china.com
1034 NOK
Solar collector DIMAN overseas
www.dimanoverseas.net
2 016 NOK
Filter Vitev
www.vitev.com
1 284 NOK
Pump Screwfix
www.screwfix.com
1 327 NOK
Solar cell Hurricane wind power
www.hurricanewindpower.com
603 NOK
Inverter AIMS power
www.aimscorp.net
939 NOK
Heating fluid Clearco
www.clearcoproducts.com
733 NOK
Storage tanks Plastic-mart
www.plastic-mart.com
827 NOK
Piping The home depot
www.homedepot.com
832 NOK
SUM 9 595 NOK

35
The alternative budget in Table 4-5 is just a rough estimate, and does not take into account
shipping or customs cost. Possible deals regarding large orders for lower price or cost of
labour are also not taken into account, neither are materials for and building of the rig, as the
cost will vary a lot depending on labour cost. The cost of the prototype sum up to 9 595 NOK
in the alternative budget.
The heating fluid is more expensive in the alternative budget than in the budget for the
prototype. The reason for this is that in the alternative budget the heating fluid is a silicone
fluid, as was decided the best option in the preliminary study [1].
4.4 Experiment
The prototype was taken out of a storage in the morning to test it outside. The ambient
temperature in the storage was 11°C. During the testing, the pump was connected to a 230 V
power outlet instead of the solar panel. This was to test the functionality of the system,
regardless of the solar panels ability to supply the pump. The pump automatically ensured a
flow of 1.0 m3/h for the heating fluid.
4.4.1 External Conditions
As the testing was conducted outside, and not in a lab, external conditions were registered.
The cloudiness, ambient temperature, and irradiation are the main external factors that can
affect the test results. The irradiation at Birkeland was found in PVGis. Based on the average
daily irradiation in the month of May, the average irradiation for the eight hours of testing was
543 W/m2 [5]. Table 4-6, overleaf, shows the external conditions during the test. The
measurements were obtained hourly.

36
Table 4-6: The external conditions during the test.
Cloudiness Ambient Temperature [°C]
09:00 Clear sky 7.9
10:00 Clear sky 9.2
11:00 Clear sky 10.5
12:00 Clear sky 11.4
13:00 Partly cloudy 10.4
14:00 Cloudy 10.1
15:00 Cloudy 10.1
16:00 Cloudy 9.7
17:00 Cloudy 9.6
The ambient temperature was at its highest at noon, before it decreased as the sky became
cloudy, as shown in Table 4-6.
4.4.2 System Temperatures
The temperature was measured at three points in the system. It was measured at the cold
stream in and out of the evaporator and the hot stream into the evaporator. Meaning the pipe
with the preheated water from the condenser to the evaporator, the steam outlet of the
evaporator and the inlet of the evaporator where the heating fluid enters were the measured
streams. Figure 4-17 displays the thermometer measuring the temperature of the heating fluid
as it enters the evaporator.

37
Figure 4-17: The thermometer measuring the temperature of the heating fluid.
The temperature was measured once every 20 minutes during testing. Table 4-7, overleaf,
shows the temperature measured at the different points in the system.

38
Table 4-7: The measurements of the system temperatures.
Preheated flow [°C] Steam flow [°C] Heating fluid [°C]
09:00 11 11 11
09:20 12 11 12
09:40 12 11 13
10:00 18 12 30
10:20 24 12 40
10:40 32 13.5 48.5
11:00 37 15 52.5
11:20 42 16 56
11:40 45 16.5 59
12:00 48 17 59.5
12:20 49.5 18 62
12:40 51 18.5 64
13:00 52 19 64
13:20 53 20 65
13:40 54 20 67
14:00 52 17 64
14:20 54 18 66
14:40 55 18 67.5
15:00 55 17.5 66
15:20 52 16 62
15:40 49 15 57
16:00 44 13 50
16:20 37 11 40
16:40 30 10.5 34
17:00 30 10 32
Table 4-7 shows that the all measured system temperatures were equal to the ambient
temperature of the storage space, at the beginning of testing. The highest temperature of the
three measurement point was 55°C, 20°C and 67.5°C for the preheated water flow, steam
flow and heating fluid, respectively. All three temperatures were lower than what was found

39
in the simulation in Section 4.1.3. The temperature measurements are shown graphically in
Figure 4-18.
Figure 4-18: The system temperatures displayed graphically.
As shown in Figure 4-18, the temperatures rapidly increased from the start of the testing until
noon. The temperature increase was slower after noon until 15:00 when the temperature
started to decrease rapidly.
4.4.3 Heat Transfer
As mentioned in Section 2.2, the solar irradiation in Somalia and Norway is 756.67 W/m2 and
543.0 W/m2, respectively. Meaning the irradiation is 1.39 times higher in Somalia in
December than in Norway in May when the testing was conducted.
Equation 1, from Section 3.1, calculates the heat transfer from the solar collector to the
heating fluid. From the heating fluid data sheet in Appendix F, the density and specific heat
capacity of the fluid is 1.035 kg/l and 3.65 kJ/kg*K, respectively. As mentioned the pump
ensured a flow of 1 m3/h, meaning the mass flow of the heating fluid was 0.29 kg/s.
By not taking into account the time with a decrease in temperature, the thermal heat transfer
rate while heating the heating fluid from 11°C to 66°C was 58.21 kW. As the irradiation is
1.39 times higher in Somalia, the heat transfer for the same amount of time should be 1.39
times higher. The heat transfer rate in Somali conditions is therefore assumed to be 80.76 kW.

40
By rearranging Equation 1, the increase in temperature is calculated to be 76.3°C in Somali
conditions.
The ambient temperature in Somalia is higher than in Norway. It can, therefore, be assumed
the initial temperature of the heating fluid would be higher in Somali conditions. In the month
of December, the average minimum temperature is 23°C in the south of Somalia [32].
Assuming the initial temperature of the heating fluid is equal to the ambient temperature, the
fluid should reach a temperature of 99.3°C. Which may be sufficient for the evaporation to
start in the evaporator.

41
5 Discussion
The main goal of the thesis was to design and fabricate a solar water distillation system to
help better the health situation in Somalia, where they have a shortage of clean drinking
water. The system was tested at Birkeland in Norway in the beginning of May. Only one test
was conducted. The results from the experiment showed that the system was not able to
produce any distilled water.
The heating fluid reached 67.5 °C as the highest temperature before it started decreasing. This
temperature was not high enough to evaporate the saline water in the evaporator tank. The
system was, therefore, not able to produce any distilled water, and no test on water quality
was conducted.
5.1 Optimization
Some of the temperatures in the Aspen plus simulation were different from what was found in
the Matlab optimization. The simulations mainly show that the temperature of the steam will
start to decrease in the pipe between the evaporator and condenser, and that the preheated
water needed to have a higher temperature than found in the optimization.
5.2 Design
As the parts of the system were not custom made, salt cleaning and water level control were
not implemented in the system. This did not pose problems during testing, as the system did
not manage to distillate the water. As described in Section 3.2.2, the salt cleaning could be
done manually by hydro-blasting. This was not tested in the system, as there was no need to
clean the salt when there was no evaporation.
The system was designed with the two heat exchanger in vertical position, for the water flow
to take advantage of the gravitational force. The vertical position of the evaporator could
affect the heat transfer from the heating fluid. As the water level in the evaporator had to be
controlled to avoid the saline water flowing into the condenser tubeside, part of the evaporator
tubes with the heating fluid was not in contact with the saline water.
As mentioned in Section 4.3, a solar collector with fewer tubes was purchased, than the
number of tubes found in the optimization in Section 3.2.3. This could contribute to the low
temperature of the heating fluid, by not absorbing enough heat from the solar irradiation.

42
5.3 Experiment
The heating fluid reached a temperature of 67.5°C, which is less than half of the optimized
temperature found in the Matlab optimization and the Aspen plus simulation. The preheated
water had an optimized temperature of 64.02°C. The temperature in the Aspen plus
simulation was 80°C for the preheated water. In the testing, the preheated water only reached
55°C. As there was no evaporation, the raw water was preheated by the heating fluid, and not
the condensing steam. The heat was transferred by the heating fluid, to the saline water in the
evaporator tank and back through the pipe to the condenser tank.
The temperature of the cold stream out of the evaporator reached much lower temperatures
than the other measured temperatures, with 20°C as the highest temperature. The temperature
also started decreasing earlier than the two other temperatures. As the system did not
evaporate the saline water, the stream did not contain steam. The system was standing outside
in the sun, and the increase in temperature could due to air in the pipe being heated by the
surroundings. As the temperature in the pipe was higher than the ambient temperature, the
increase could also be due to heat radiation from the saline water in the evaporator tank.
The external conditions seem to have a great impact on the performance of the system. The
temperature increased until the sky was clouded, the temperatures than decreased. The
ambient temperature during testing was low compared to the temperature of the heating fluid.
The lack of insulation around the pipes and heat exchangers may have contributed to a large
heat loss to the surroundings, leading to the system not being able to reach the temperature for
evaporation.
Also, the low initial temperature of the heating fluid could have contributed to the system not
being able to distillate the saline water. The system was not able to heat the fluid enough
before the sky was clouded, it might have been able to with a higher initial temperature.
Some challenges occurred during the project that could have had an impact on the results. The
fabrication of the system took longer than expected and contributed to allowing less time for
testing, and not allowing time for modifications. With only one testing day, it was not
conducted tests with various external conditions. Higher ambient temperature and less clouds
could have given a different result.

43
As shown by the calculations in Section 5.3, the system might reach high enough
temperatures to distillate the water with the Somali irradiation, compared to the irradiation in
Norway. The system might also reach high enough temperatures in the Norwegian irradiation,
with different weather conditions, as mentioned.

44
6 Conclusion
Somalia is experiencing a shortage of potable drinking water due to a high salt content in the
country’s ground water. The humanitarian organization Yme wanted to build an effective
water distillation system to improve the water quality and better the health situation in
Somalia. Yme is a big contributor for providing clean and safe drinking water for local
communities.
The goal of this thesis was to design and fabricate a prototype of a solar water distillation
system. The system should consist of simple technology and require low maintenance.
Renewable energy in the form of solar energy is highly available in Somalia, the distilling
system, therefore, used solar energy as heat source.
The prototype was tested at Birkeland in Norway in the beginning of May. System
temperatures were measured, and the external conditions were registered. The measured
temperatures were of the cold stream in and out of the evaporator and the hot stream into the
evaporator, meaning the preheated water, steam flow and heating fluid. The external
conditions registered was solar irradiation, cloudiness and ambient temperature.
The temperatures in the system increased during testing, but the prototype did not produce
any distilled water. The system did not reach high enough temperatures to evaporate the saline
water, it was, therefore, no production of water.
There are several possible reasons for the systems inability to distillate the saline water, as
discussed in Chapter 9. The external conditions seems to have the greatest impact, especially
the cloudiness. Further testing needs to be conducted on the prototype to determine its ability
to distillate saline water. By modifying it, better results can be obtained in the future.
With some modifications and more testing in more suitable conditions, the implications of
this thesis could be a better health situation for areas struggling with a shortage of clean
drinking water. This system could potentially be used all over the world in areas with high
solar irradiation.

45
7 Future Work
Future work should include modification of the system, then further testing. The system
should be tested in various external conditions to determine the required conditions for the
water production to start. It should also be tested to find the amount of produced water for
different conditions. Suggestions for modifications are listed below.
Increase the number of solar collector tubes.
Insulating the piping and heat exchangers.
Perform tests in conditions more similar to the climate in Somalia.
Further testing should also be conducted on the system with the pump connected to the solar
panel, to find the panels ability to supply the needed power to the pump.

46
References
[1] I. Uleberg, “Solar Water Distillation System for Developing Countries,” Unpublished,
Grimstad, 2016.
[2] H. Aybar, “Mathematical modeling of an inclined solar water distillation system,”
Desalination, vol. 220, 2006.
[3] K. S. Ramesh and P. S. Dusan , “Fundamentals of Heat Exchanger Design,” Hoboken,
New Jersey, John Wiley & Sons, 2003.
[4] G. Buset and S. E. Pedersen, “Termodynamikk grunnlag for ingeniørfag,” Oslo,
Universitetsforlaget, 1995.
[5] “photovoltaic-software.com,” [Online]. Available:
http://re.jrc.ec.europa.eu/pvgis/apps4/pvest.php?lang=en&map=africa. [Accessed 6
October 2016].
[6] FAO-SWALIM, “Hydrogeological Survey and Assessment of Seletced Areas in
Somaliland and Puntland.,” Technical Report No. W-20, FAO-SWALIM
(GCP/SOM/049/EC), Nairobi, Kenya, 2012.
[7] H. Anderson and D. Cummings, “Agriculture Victoria,” November 1999. [Online].
Available: http://agriculture.vic.gov.au/agriculture/farm-management/soil-and-
water/salinity/measuring-the-salinity-of-water. [Accessed 13 Febuary 2017].
[8] World Health Organization, Giudelines for drinking-water quality - 4th edition, 2011.
[9] F. Kožíšek, “Health significance of drinking water calcium and magnesium.,” National
Institute of Public Health, 2003.
[10] “Lovdata,” 22 December 2016. [Online]. Available:
https://lovdata.no/dokument/SF/forskrift/2016-12-22-1868?q=drikkevann. [Accessed 8
April 2017].
[11] “MATLAB,” [Online]. Available: https://se.mathworks.com/products/matlab.html.
[Accessed 18 May 2017].
[12] “Clearco,” [Online]. Available: http://www.clearcoproducts.com/pdf/heat-transfer-
fluids/NP-PSF%2020cSt%20Silicone%20Heat%20Transfer%20Fluid.pdf. [Accessed
27 February 2017].
[13] M. Sahdev, “Pinch Technology: Basics for the Beginners,” 8 November 2010.
[Online]. Available: http://www.cheresources.com/content/articles/heat-transfer/pinch-
technology-basics-for-beginners?pg=3. [Accessed 3 February 2017].

47
[14] N. Jelley, “A Dictionary of Energy Science,” Oxford University Press, 2017. [Online].
Available:
http://www.oxfordreference.com/view/10.1093/acref/9780191826276.001.0001/acref-
9780191826276-e-394?rskey=kNSHkQ&result=391. [Accessed 7 March 2017].
[15] J. S. Umbach, “Online Pinch Analysis Tool,” [Online]. Available: http://www.uic-
che.org/pinch/. [Accessed 2 February 2017].
[16] “aspentech,” [Online]. Available: http://origin-
www.aspentech.com/products/engineering/aspen-plus/. [Accessed 18 May 2017].
[17] “SOLIDWORKS,” [Online]. Available:
http://www.solidworks.com/sw/183_ENU_HTML.htm. [Accessed 18 May 2017].
[18] T. Bott, Fouling of Heat Exchangers, Elsevier, 1995.
[19] H. Müller-Steinhagen, Heat Exchanger Fouling: Mitigation and Cleaning Techniques,
Institution of Chemical Engineers, 2000.
[20] “Valves online,” [Online]. Available: http://www.valvesonline.co.uk/manual-
valves/float-valves/brass-ball-float-valve.html. [Accessed 2 April 2017].
[21] “24hshop.no,” [Online]. Available: https://www.24hshop.no/hjem-fritid/ovrigt-hjem-
fritid/ovrig-fritidsprodukter/ph-maler-for-vann. [Accessed 18 April 2017].
[22] “Basseng a/s,” [Online]. Available: https://www.basseng.no/kjemi/diverse-
vanntester/teststrips-salt-10-stk. [Accessed 18 April 2017].
[23] “JBL,” [Online]. Available: https://www.jbl.de/en/aquarium-saltwarer-
products/detail/2520/jbl-calcium-test-set-ca. [Accessed 18 April 2017].
[24] “vidaxl.no,” [Online]. Available: https://www.vidaxl.no/g/2832/tilbehor-til-basseng-
og-spa. [Accessed 3 March 2017].
[25] “Agder Solenergi,” [Online]. Available: https://www.agdersolenergi.no/vakuumror-
solfangere. [Accessed 2 March 2017].
[26] “Billigvvs.no,” [Online]. Available: https://www.billigvvs.no/Varmesystemer-Pumper-
Varme-Grundfos--Grundfos-NY-Alpha2-25-40-Sirkulasjonspumpe-180-mm-A-
merket-til-varme-658508.html. [Accessed 3 March 2017].
[27] “Sparelys.no,” [Online]. Available:
https://www.sparelys.no/index.php?page=shop.product_details&flypage=flypage_ny.tp
l&product_id=2308&category_id=26&option=com_virtuemart&Itemid=39. [Accessed
3 March 2017].
[28] “Elfa Distrelec,” [Online]. Available: https://www.elfadistrelec.no/no/inverter-110-
mascot-

48
9150120000/p/16971154?q=110w+inverter&page=1&origPos=1&origPageSize=50&s
imi=91.83. [Accessed 3 March 2017].
[29] “varmeshop.no,” [Online]. Available: http://www.varmeshop.no/products/fernox-solar-
s1-10-ltr. [Accessed 3 March 2017].
[30] “Klart Vann,” [Online]. Available: https://www.klart-vann.no/produkt/juraperle/.
[Accessed 6 March 2017].
[31] “DNB,” [Online]. Available: https://www.dnb.no/bedrift/markets/valuta-
renter/kalkulator/valutakalkulator.html. [Accessed 20 April 2017].
[32] “climatemps.com,” [Online]. Available:
http://www.mogadishu.climatemps.com/december.php. [Accessed 10 May 2017].
[33] SWALIM, “faoswalim.org,” [Online]. Available:
http://www.faoswalim.org/water/water-resources/ground-water. [Accessed 14 February
2017].
[34] Lenntech Water treatment & purification Holding B.V, “lenntech.com,” [Online].
Available: http://www.lenntech.com/calculators/conductivity/tds-engels.htm.
[Accessed 13 February 2017].
[35] “engineeringtoolbox.com,” [Online]. Available:
http://www.engineeringtoolbox.com/water-salinity-d_1251.html. [Accessed 13
February 2017].

I
Appendices
Appendix A – Heat exchangers
Evaporator details
Condenser details:

II
Appendix B – Solar collector

III

IV

V
Appendix C - Pump
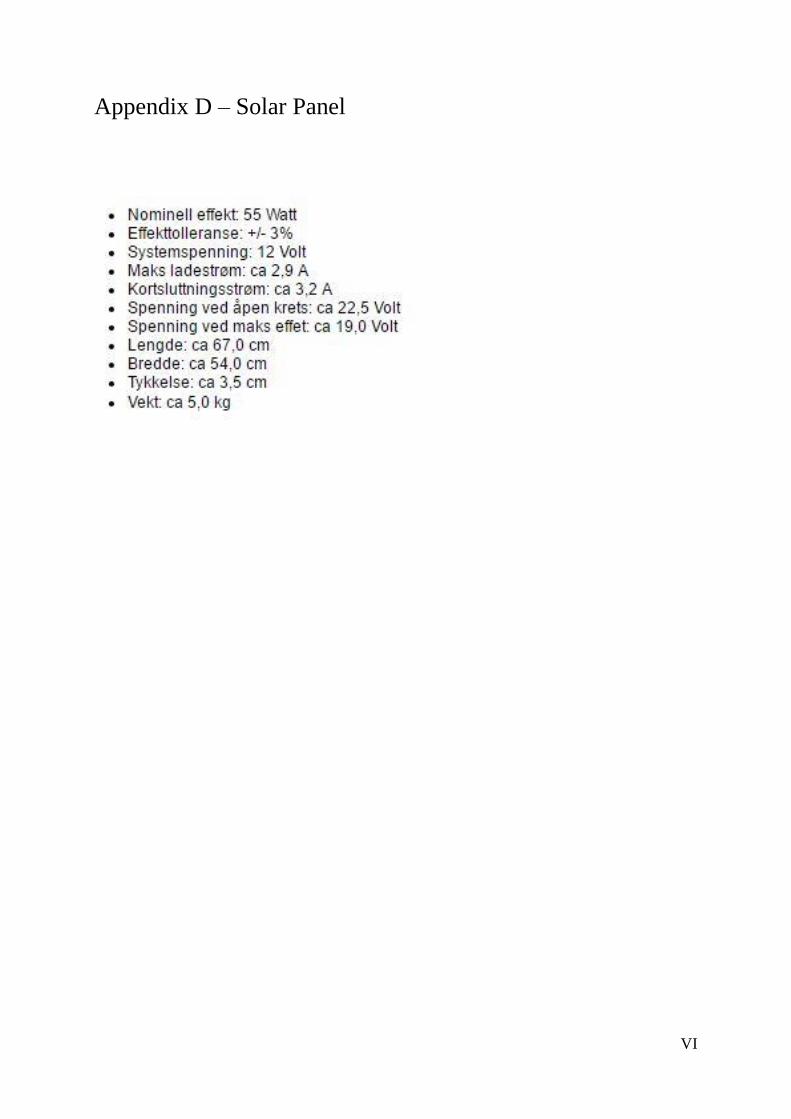
VI
Appendix D – Solar Panel

VII
Appendix E – Inverter

VIII
Appendix F – Heating fluid

IX

X
Appendix G – Filter and Marble

XI

XII
Appendix H – 2D sketch of system
Dimensions are in millimetres.

XIII
Appendix I
Storage tank for distilled water.
Storage tank for saline water.

XIV
Pump.
Filter.