design and evaluation of a lean-premixed hydrogen injector
TRANSCRIPT
Design and Evaluation of a Lean-Premixed Hydrogen Injector
with Tangential Entry in a Sector Combustor
David Sykes
Thesis submitted to the faculty of the
Virginia Polytechnic Institute and State University
in partial fulfillment of the requirements for the degree of
Master of Science
In
Mechanical Engineering
Dr. Uri Vandsburger, Chair
Dr. Walter F. O’Brien
Bruce Cambata
May 3, 2007
Blacksburg, Virginia
Keywords: Hydrogen, Lean-Premixed Combustion, Fuel Injection,
Gas Turbine

Design and Evaluation of a Lean-Premixed Hydrogen Injector with
Tangential Entry in a Sector Combustor
David Sykes
(ABSTRACT)
Hydrogen use in a gas turbine engine has many benefits. Chief among these is the
elimination of carbon-based emissions. The only products and emissions from the
combustion process with air are water vapor and oxides of nitrogen (NOx). However due
to the lower flammability limit of hydrogen, it can be burned at much lower equivalence
ratios than typical hydrocarbon fuels, thus reducing the emissions of NOx. Multiple
efforts have been made for the design of premixing injectors for gaseous hydrocarbon
fuels, but very few attempts have been made for hydrogen.
To this end a premixing hydrogen injector was designed for the cruise engine
condition for a PT6-20 turboprop engine. Swirl generated by tangential entry was
utilized as a means to enhance mixing and as a convenient means to stabilize the flame.
A prototype was designed to prevent flashback and promote a high degree of mixing, as
well as a test combustor to evaluate the performance of the injector at scaled engine
conditions. Numerical simulations were also performed to analyze the flowfield at the
engine conditions. Performance and emissions data are used to draw conclusions about
the feasibility of the injectors in the PT6 engine.

- iii -
Acknowledgements
I would like to acknowledge the sponsors of this research, Bruce Cambata and
Winfred J. Garst of Electric Jet, L.L.C. Their enthusiasm and drive to foster innovation
and encourage its development served as great motivation for this work. I would also
like to thank Bruce for serving in my committee. Additionally I would like to thank my
advisor, Dr. Uri Vandsburger, for his guidance and advice during my graduate studies
career. Without his help, I would not have the deep appreciation for the fundamentals of
engineering and the use of literature as to learn from the advancements of the past. He
has shown much faith in me as a student and I wish him the best. I would like to thank
Dr. Walter F. O’Brien for his guidance and advice especially during the design phases of
the research.
I would also like to thank Steve Lepera and Joseph Homitz. As the lab director,
his efforts made the research possible by the development and maintenance of the
facilities as well as inspiring new developments with the project. Joseph Homitz
designed a similar injector and served to make the research challenging and rewarding.
Joseph helped make the project interesting and in the process has become a good friend.
I wish him all the best of luck in his future endeavors.
Finally, I would like to thank my friends and family. Without their support and
guidance, none of this research would be possible. They have always had my best
interests at heart, and I am truly grateful.
- iv -
Table of Contents
Abstract ………………………………………………………………………... ii
Acknowledgements …………………………………………………………..... iii
Table of Contents ……………………………………………………………… iv
List of Figures …………………………………………………………………. vi
List of Tables ………………………………………………………………….. ix
Chapter 1: Introduction ……………………………………………………….. 1
1.1 Background and Motivation ………………………………………. 1
1.2 Research Goals ……………………………………………………. 5
Chapter 2: Literature Review ……………………………….………………… 7
2.1 Sector Combustors……………………………… ………………... 7
2.2 Hydrogen-Enriched Methane Experiments ……………………….. 10
2.3 Gas-Turbine Hydrogen Injector Developments …………………... 13
Chapter 3: Design of Sector Combustor and Test Injector……………………. 20
3.1 Sector Combustor Design ……...………………………………… 20
3.2 Test Injector Design…… …………………………………………. 29
Chapter 4: Experimental and Computational Setup …………………………. 38
4.1 Computational Setup ……………………………………………... 38
4.2 Experimental Setup .……………………………………………... 41
Chapter 5: Injector Performance at Atmospheric Conditions and
Simulation Results ……………………………………………………………. 47
5.1 Simulation Results and Discussion...……………………………… 47
5.1.1 Flowfield and Velocity Results…... ……………………. 47
5.1.2 Pressure Loss Characteristics ……………………….….. 50
5.1.3 Mixing Characteristics… ………………………………. 51
5.2 Experimental Results and Discussion ……………………………. 55
5.2.1 Blowoff and Stability….. ………………………………. 55
5.2.2 Pressure Loss Map and Discussion……………………… 59
5.2.3 NO Emissions Map and Discussion…………………….. 62
5.2.4 Summary of Experimental Results…………………….... 66
Chapter 6: Conclusions and Future Work …………………………………… 68
7.1 Conclusions ………………………………………………………. 68
7.2 Future Work and Recommendations …………………………….. 70
References ……………………………………………………………………. 73
Appendix A: Sector Combustor Drawings…………………………………... 76
Appendix B: Injector Drawings ………………………………..………..…... 83

- v -
Appendix C: Specifications for Computational Setup ……………………..... 86
Appendix D: Flame Pictures………………………………………………….. 92
Appendix E: Error Analysis…………………………………………………... 95
- vi -
List of Figures:
Figure 1: Pictoral view of a Swirl Stabilized Flame………………………………. 4
Figure 2a: Assembly of test section …………………………………………….. 22
Figure 2b: Assembly of Pressure Shell…………………………………………… 22
Figure 3: Wire Frame View of the Test Combustor……………………………… 23
Figure 4: Assembly View of Test Combustor Body, Burner Plate,
and Window Holders……………………………………………………………… 25
Figure 5: Drawing of the Top Window Holder (units in inches)………………… 26
Figure 6: Optical Access Assembly……………………………………………… 28
Figure 7: Outside view of the injector…………………………………………… 32
Figure 8: Cut view of the designed injector……………………………………… 33
Figure 9: Exploded view of the injector……………………………………….… 37
Figure 10: Mesh Generated by GAMBIT……………………………………….. 39
Figure 11: Flow Diagram for the CSDL Facility………………………………… 43
Figure 12: Installed Test Section and arrangement of injectors…………………. 44
Figure 13: Pathlines for the Steady State Solution for Mixing Flow in the
Injector…………………………………………………………………………… 48
Figure 14: Velocity Vectors at the end of the Injector at the Center Plane……... 49
Figure 15a: Velocity Vectors at Air Inlets ……………………………………. 50
Figure15b: Total Pressure at Air Inlets………………………………………….. 50
Figure 16: Total Pressure Contour on the Centerline of the Domain…………… 51
Figure 17: Equivalence Ratio Contour at Exit of the Injector…………………… 53
Figure 18: Iso-Contour of high Equivalence Ratios……………………………... 54
- vii -
Figure 19: Blowoff Curve for the single injector test……………………………. 56
Figure 20a: Stable Flame………………………………………………………… 57
Figure 20b: Unstable Flame……………………………………………………… 57
Figure 21: Stability Map for the Three Injector Case……………………………. 59
Figure 22: Pressure Loss Surface Plot for the Single Injector Test……………… 60
Figure 23: Pressure Loss Curves for Different Fuel Flow Rates………………… 61
Figure 24: Pressure Loss Curves for the Three Injector Test…………………….. 62
Figure 25: NO Concentrations for the Single Injector Test………………………. 63
Figure 26: NO Concentration versus Equivalence Ratio for the Single
Injector Test……………………………………………………………………….. 65
Figure 27: NO Concentration versus Equivalence Ratio for the Three
Injector Test……………………………………………………………………….. 66
Figure A.1: Engineering Drawing of the far side of the Sector Combustor……… 76
Figure A.2: Engineering Drawing of the near side of the Sector Combustor…….. 77
Figure A.3: Engineering Drawing of the top of the Sector Combustor…………. 78
Figure A.4: Engineering Drawing of the bottom of the Combustor……………… 79
Figure A.5: Pictoral View of the Sector Combustor Welded together…………… 80
Figure A.6: Engineering Drawing of the Burner Plate which holds the Injectors.. 81
Figure A.7: Engineering Drawing of the Window Holder……………………….. 82
Figure B.1 : Engineering Drawing for the Casing of the Injector………………… 83
Figure B.2: Engineering Drawing of the Centerbody of the Injector…………….. 84
Figure B.3: Drawing for the Centerbody Cap of the Injector…………………….. 85
Figure C.1: Velocity Vectors for vertical plane y = -10.16 mm……………….. 86
- viii -
Figure C.2: Velocity Vectors for vertical plane y = -5.08 mm………………… 87
Figure C.3: Velocity Vectors for the Center Plane of the Injector……………... 87
Figure C.4: Velocity Vectors for vertical plane y = 5.08 mm………………….. 88
Figure C.5: Velocity Vectors for vertical plane y = 10.16 mm………………… 88
Figure C.6: Equivalence Ratio Contour for the Plane y = -10.16 mm…………. 89
Figure C.7: Equivalence Ratio Contour for the Plane y = -5.08 mm…………... 89
Figure C.8: Equivalence Ratio Contour for the Center Plane of the Injector…... 90
Figure C.9: Equivalence Ratio Contour for the Plane y = 5.08 mm……………. 90
Figure C.10: Equivalence Ratio Contour for the Plane y = 10.16 mm…………. 91
Figure D.1: Equivalence Ratio of 0.4 Single Injector…………………………... 92
Figure D.2: Equivalence Ratio of 0.5 Single Injector…………………………... 93
Figure D.3: Equivalence Ratio of 0.8 Single Injector…………………………... 93
Figure D.4: Equivalence Ratio of 1.0 Single Injector…………………………... 94
Figure E.1: Air Flow Uncertainty over the Flow Range Tested………………… 95
Figure E.2: Fuel Flow Uncertainty over the Flow Range Tested……………….. 96
Figure E.3: Equivalence Ratio Uncertainty for the Single Injector……………... 97
Figure E.4: Equivalence Ratio Uncertainty for Three Injector…………………. 98
- ix -
List of Tables:
Table1: Design Contraints for the size of the test combustor………………… 21
Table 2: Overall design Constraints for the premixer………………………… 30
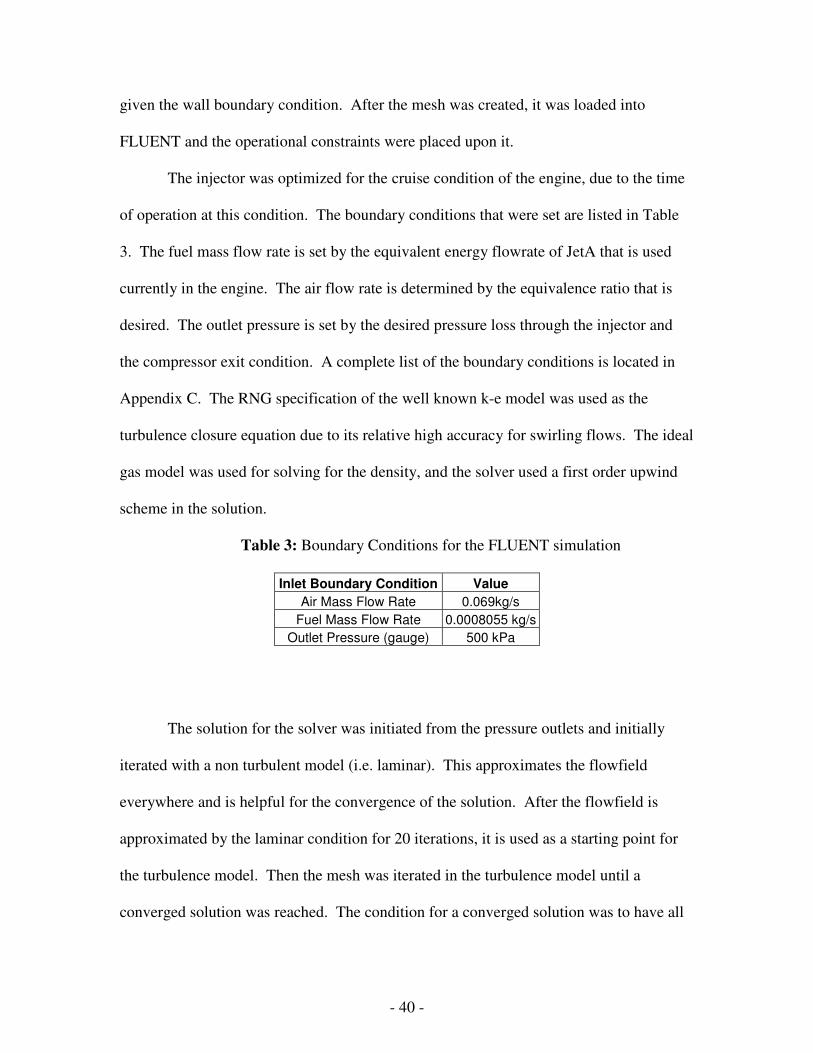
Table 3: Boundary Conditions for the FLUENT simulation…………………. 40
Table 4: Conditions tested for the premixed injector………………………… 46
Table 5: Summary of Important Results……………………………………… 69
Table C.1: Fluent Model Parameters………………………………………….. 86
Table E.1: Error of measured quantities………………………………………. 95
- 1 -
Chapter 1: Introduction
Section 1.1: Background and Motivation
The increased demand and limited supply of petroleum fuels has sparked a
renewed interest in the search for alternative fuels for all modes of transportation
including aviation, and electrical power generation. One of the candidates for replacing
conventional fossil fuels is hydrogen, due to its high gravimetric energy density.
However it is not without its problems due to a very low density, which yields a low
volumetric energy density and increases the weight and volume penalties for using
hydrogen. Other alternatives that are currently being investigated are biodiesel and
ethanol derived from crops such as switch grass, sugar cane, and corn. Hydrogen, while
presenting much more difficult engineering problems, also has the benefit of reducing the
green house emissions from engines. A combustion engine will still produce water
vapor, which is the product of ideal combustion, and pollutants NO and NO2 (NOx).
Water vapor also contributes to the greenhouse effect if it is released in the upper
atmosphere, but its residence time is much less than that of CO2. [1] The focus of this
study is the combustion of hydrogen as it relates to typical aeroderivative gas turbine
engines.
Water vapor cannot be avoided when burning hydrogen in an engine; however,
NOx can be limited. NOx is produced in two main ways in air breathing engines. The
first is prompt or Fenimore NOx which is caused from nitrogen atoms reacting with
hydrocarbon radicals as the fuel breaks down. [2] This type is of little concern for the
current study due to the lack of hydrocarbon radicals in the fuel. Another type of NOx
- 2 -
that is produced is called thermal NOx. This second type of NOx is formed via the
Zeldovich mechanism given by:
ONOON
NNOON
+⇔+
+⇔+
2
2
The balance of these two reactions is shifted to the right as an exponential function of
temperature. Generally speaking the kinetics of this are slower than that of the
combustion chemistry of hydrocarbons, and therefore, occur downstream of where the
primary reaction zone is located.[2] This is the predominant mode of NOx production
that will occur in the current study. For reasons both legislative and environmental a
considerable effort has been made to limit the emissions of oxides of nitrogen (NOx).
The EPA’s strict regulation on emissions has given birth to a few types of
combustion strategies that limit the formation of NOx. One of the first strategies used
was water or steam injection. The fuel and air mixing and burning in the same spatial
region (also known as Lean Direct Injection) can create locally higher equivalence ratios
and subsequently temperatures. To circumvent this water or steam is injected and acts
like a heat sink for the reaction zone, thus lowering the overall temperature and inhibiting
the formation of thermal NOx as described above. [3] The next strategy takes a staged
approach to the problem. This strategy is called Rich-Quench-Lean (RQL). The first
stage is a rich combustion where NOx is limited by the lack of excess oxygen. The limit
of this region is up until soot formation occurs. Next the flow is quenched by additional
air bringing the temperature much lower. Finally the last bit of fuel is burned in a
secondary combustion zone where the mixture is much leaner than stoichiometric. Here
the formation of NOx is suppressed by the lower temperatures associated with the lean
burning. The controlling stage on this configurations effectiveness is the quenching stage.
- 3 -
[4] Another strategy for reducing the formation of NOx is termed Dry Low NOx(DLN).
In this configuration, the air and the fuel are premixed before entering the main reaction
zone. This reduces the flame temperature dramatically due to the excess oxygen such
that thermal NOx is prohibited. In fact GE has boasted a NOx range of 9-15 ppm for such
an arrangement. [3] A potential downfall to this configuration is the limited stability
ranges because of blowoff, flashback, and thermoacoustic instabilities. [5] The Dry Low
NOx approach is taken by the current study with hydrogen as the fuel. Hydrogen has an
extremely low Lower Flammability Limit of 0.1 equivalence ratio. By comparison
methane has a Lower Flammability Limit of 0.4 equivalence ratio. Thus hydrogen can be
run at lower equivalence ratios and therefore lower flame temperatures and a potential for
lower thermal NOx emissions.
Not unlike the control strategies for reducing NOx, there are many ways to
implement premixers for a DLN combustor. Using swirl, which indicates nonzero
velocities in the tangential and axial directions resulting in a helical flow, is one method
to implement premixers. Many industrial gas burners use a swirling flow arrangement
with an annular mixing geometry in the premixer.[6,8] A swirling geometry shortens the
length of the premixer due to the enhanced mixing and provides a convenient method of
stabilization. A swirling flow with an annular geometry introduced to a sudden
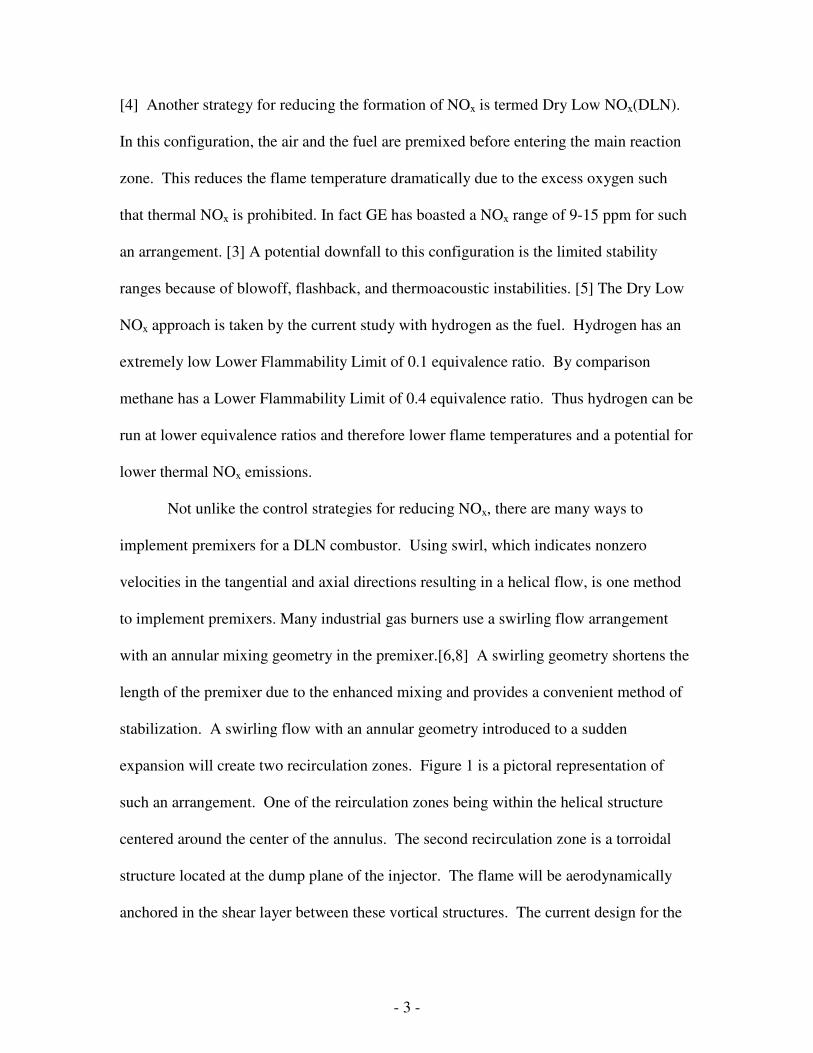
expansion will create two recirculation zones. Figure 1 is a pictoral representation of
such an arrangement. One of the reirculation zones being within the helical structure
centered around the center of the annulus. The second recirculation zone is a torroidal
structure located at the dump plane of the injector. The flame will be aerodynamically
anchored in the shear layer between these vortical structures. The current design for the
- 4 -
premixer uses this arrangement for mixing and flame stabilization. A detailed description
of the injector geometry follows in chapter 3.
Figure 1: Pictoral view of a Swirl Stabilized Flame
There are two methods that are typically used to introduce swirl to the annular
flow channel. One method is to use a row of stators or swirl vanes, which take an
exclusively axial fluid motion and force a tangential component. The second method is
to guide the flow into the premixer itself normal to the axial direction and away from the
centerline of the premixer, otherwise known as tangential entry. The current design of
the injector utilizes the tangential entry method of introducing swirl.
As stated above, one of the engineering problems with the DLN arrangement to
solve the NOx problem can lead to instabilities. There are a few different types of
combustion instabilities that can occur in a DLN system. The first instability occurring
near the lean blowout point. At this point the flame can become strained or stretched,
leading to heat loss and local extinction. [9] This type is not important in this study
because the operating modes will be well above the LFL. The second and more studied
instability is thermoacoustic instabilities. These are the result of pressure and heat release
Centerbody Flame stabilization
Recirculation zones
- 5 -
fluctuations that occur when the acoustic pressure wave and the heat release are in phase,
satisfying the Rayleigh Criterion.[10, 11] These instabilities can be caused by
equivalence ratio perturbations, or by velocity perturbations. These perturbations, if
excited at the natural resonant frequency of the combustor and are in phase,
thermoacoustic instabilities will perpetuate.
Traditionally the problem has been avoided by geometrical changes in the
combustor itself. Shortening the combustor considerably, which raises the resonant
frequency above the bandwidth of the flame, is one such change. The other method to
treating and attenuating the instabilities is through active control in which either the fuel
or the air is modulated at the instability frequency but out of phase with the pressure
wave. This causes a negative Rayleigh index and attenuation of the instability occurs.
The goal in the current injector design is the former method of attenuation.
Section 1.2: Research Goals
The challenge for DLN combustion is to sufficiently premix the fuel and oxidizer
to lower the flame temperature and reduce NOx, avoid flashback and blowoff, and avoid
all combustion instabilities. One of the goals of the research is to develop an injector that
can operate at typical turboprop inlet conditions to serve as evidence that hydrogen can
be used as an alternative fuel. Also, another goal is to develop a test bed for the
evaluation of a wide range of the injectors. More specifically the goals are listed below.
• Design a premixing injector for a PT6-20 engine
• Develop a test bed sector combustor to test the different injector designs
• Test the injector at actual engine conditions for stability
• Determine the pressure drop associated with the injector over the entire
stability range

- 6 -
• Determine the emission of oxides of nitrogen from the injector over the entire
stability range
The structure of the document will follow with a literature review of hydrogen
combustion, sector DLN combustor, and premixed swirl injectors. Next the design
process for both the injector and the sector combustor will be discussed. Next the test
matrix of both the CFD evaluation and experimental evaluation, along with the facilities
details will be discussed. Next the results from the CFD and the experiments will be
examined with the operation of the engine as a criteria. The final section of the work are
conclusions and suggestions for further work.
- 7 -
Chapter 2: Literature Review
This section contains a discussion of the recent and past design efforts and
direction of the engineering community with regard to the premixed combustion of
hydrogen. The first portion of the review describes previous work done on sector
combustors. The second part of the review focuses on hydrogen itself and the properties
that are associated with it as a fuel. The final portion of the review describes prior work
in the area of premixing injectors using swirl and prior art associated with swirl injectors
utilizing tangential entry.
Section 2.1: Sector Combustors
Most aircraft engines, turboprop, turboshaft, turbofan, and turbojet, have annular
combustors that operate on liquid fuels. It is important not only to examine the behavior
of a single injector, but also the interactions between the injectors. The neighboring
injectors heat release is a different boundary condition than a cold wall or additional
cooling flow. Therefore sector combustors are an integral part of the design cycle for
annular combustors. There have been several studies in the past that have used sector test
combustors to study interactions and fluid flow with multiple injectors.
In 1998, Ziemann et al.[1] developed a rectangular sector combustor in which two
premixing nozzle concepts were tested. The sector itself was unique in that it was not
one row of injectors, but three in a staggered arrangement, and represented 60 degrees of
a 30,000 lbf class engine. Two mixing concepts were to use a perforated plate lean
premixed scheme and a high shear lean direct injection scheme. The combustors were
- 8 -
run at scaled operating conditions, followed by either a reduction or increase in airflow
rate over time scales of 0.2 sec or 2 sec. This changes the equivalence ratio dramatically
over a short period of time and tests the combustors resistance to blowoff, flashback, and
instabilities. It was found in the premixed case that inlet velocity profile non-uniformities
caused local flashback and blowoff in several cases. In this sector the individual burners
could not be relit with neighboring burners, which is important for operation of the
potential combustor. Thus it is important to keep the inlet condition to premixing
injectors as uniform as possible to achieve the highest combustion efficiency. It is also
important to note that the apparatus itself did not have a liner to provide back wall
convective cooling.
In 1998 Zelina et al.[12] developed an interchangeable sector combustor, which is
rectangular in shape, and tested a full annular combustor at scaled, simulated engine
conditions. Four separate sector designs and one full annular design were tested for the
emissions of CO and NOx. It was shown that having a swirling airflow along with a
swirling atomized fuel flow gives the best mixing and the lowest emissions for the sector
combustor. It was also measured that the maximum CO and UHC measurements occur
between the injectors, and that the maximum NOx emissions occur at the centerline of the
injectors. Good agreement between the full annular test and the sector tests was shown,
implying that the rectangular cross section can serve as a good approximation of the
annulus. Finally a correlation was developed between the inlet pressure, temperature,
and overall fuel to air ratio and the resulting relative NOx from the combustion.
In 2001 Carl et al.[13] conducted an investigation on a planar combustor sector at
engine operating conditions. The experimental rig was a rectangular section that
- 9 -
converged on the downstream end with dilution cooling holes in the converging section.
Spatially resolved OH* chemiluminescence, Quantitative Light Scattering, PDA, and
LDV were used to measure a liquid fueled swirling Rich-Quench-Lean combustor. The
extensive optical access for this particular experimental rig was shown to be useful for
capturing flowfields and light scattering data. It was shown at higher fuel loading
parameters, the swirling flow expansion angle was reduced, as was the reverse flow in the
vortex core region. It was also shown that the staggered dilution jets downstream of the
primary zone created fast mixing and effectively quenched product stream from the
primary zone. Several off center planes were measured with similar results of OH*.
Finally it was shown that the areas in which the dilution jets created a high fluctuating
component of vertical velocity were also areas of high RMS signal of OH*. This last
statement is important to the current project because the liner design cooling can impact
the primary zone and thus the emissions created. The test facility was used to directly
compare to an actual combustor. As such, the dimensions, asymmetry and orientation
reflected a specific practical application.
In 2001 Kurosawa et al.[14] developed and tested a methane fueled swirl LP
laboratory rectangular sector combustor. The walls of the combustor also served as the
optical access for the measurements. The optical access extended to the exit plane of the
injectors such that the entire flowfield including the issuing point could be measured.
This experiment was oriented such that two identical swirling injectors were used in
either a diffusion combustion mode or a premix combustion mode. With this type of
design PIV, LDV and other optical techniques can be used in the flame front and the
immediate recirculation zone at the dump plane. The overall goal was to measure the
- 10 -
interaction between the injectors. It was measured with PIV that the recirculation zone
between the injectors for the premix case was much stronger than the diffusion case.
Also, complete combustion was possible within the recirculation zone for the premixed
mode and not possible for the diffusion mode. It was shown that the overall NOx
resulting from the diffusion flame was higher than the premixed case with the maximum
in both cases occurring at the centerline of the injector, or in the recirculation zone. This
is expected due to the locally high equivalence ratios encountered when operating a
combustor in a diffusion mode. The experimental apparatuses referenced in this section
served as a basis for the design process for the current design.
Section 2.2: Hydrogen-Enriched Methane Experiments
This section includes a discussion of hydrogen as a fuel addressing all the
properties that are important to combustion. Hydrogen combustion has been attractive in
the past due to its high gravimetric heat of combustion. More recently however,
hydrogen is being investigated due to its potential for elimination of carbon containing
combustion products. NOx pollutant formation in hydrogen flames is not a property of
the fuel (i.e. there are no nitrogen atoms within the fuel structure to activate the Fenimore
mechanism) but is a function only of the temperatures that the exhaust gases reach. For a
discussion of the so-called Zeldovich mechanism for thermal NOx formation the reader is
referred to texts on combustion, e.g. Turns. [2] The other properties of hydrogen
combustion such as flammability limits, flame speed, and flame temperature are also very
important, especially for the design process.
- 11 -
In 1957, NACA[15] produced a document for the properties of hydrogen from the
data that had been assembled at that point in time. These engineering properties included
laminar flame speed, quenching distance, upstream and downstream propagation
flammability limits, flame temperatures, and explosion limits. Furthermore the
temperature and pressure dependence on these properties was also investigated. Firstly
the laminar flame speed was found as a function of equivalence ratio. The maximum was
found to be approximately 1.00 m/s by extrapolation. Furthermore, it was shown that the
pressure has virtually no effect on the laminar flame speed at equivalence ratios less than
approximately 0.6. The majority of more recent correlations all relate the turbulent flame
speed to a function of the laminar flame speed and the turbulence intensity. Therefore the
inlet pressure condition will not affect the flashback point for the design. However, the
inlet temperature has a near linear effect on the flame speed for moderate temperatures.
The correlation suggested is a power relationship with an exponent of 1.413. The
quenching distance was also investigated as a function of inlet pressure and equivalence
ratio. It was found that at atmospheric pressure and an equivalence ratio of 0.4, the
quenching distance is 1 mm. Extrapolating to the typical pressures see in the engine, the
quenching distance will be 0.173 mm. The flame temperature was also found as a
function of the inlet temperature, pressure, and equivalence ratio. For lean premixed
applications at typical compressor exit conditions (~500 K, 5-6 atm, 0.4 equivalence
ratio), the flame temperature was found to be 1570 K. Finally, the downward
propagating flammability limits were measured for a range of temperatures, which the
dependence was found to be linear. For the compressor exit temperature of 520 K, the
lean flammability limit is 0.21. This comprises most of the engineering data needed to
- 12 -
accurately design a premixing nozzle. The turbulent flame speed remains as an important
property of the mixture that needs to be accounted for.
As mentioned in the Chapter 1, hydrogen has engineering challenges such as
flame speed. In 2002 Lipatnikov and Chomiak[16] published a review for turbulent
flame speed. It details the different flame regimes within the turbulence spectra and
reviews the correlations for the turbulent flame speed. The majority of the correlations
for the literature took the form
'CuSS Lt +=
where C is an experimentally based constant. However the value of the constant varies
depending on the source, and does not predict the turbulent flame speed well in weak
turbulent situations. However, to calculate the turbulent flame speed, one needs to know
the turbulence level within the wetted volume and the value of C sufficiently accurately.
Without extensive measurement within the particular apparatus that is tested, the
turbulence level cannot be accurately obtained.
In 2003, Kido et al.[17] broadened the turbulent flame speed investigation by
including hydrogen-hydrocarbon mixtures to determine a model. The experimental setup
was a near spherical combustor having a spark ignition source at the center that was filled
with mixtures of fuel and air. Fans located on the walls of the apparatus generated
isotropic turbulence. It was shown that hydrogen has a larger turbulent burning velocity
than propane or methane even when the laminar flame speed and the turbulence intensity
were kept nearly equal. To explain this phenomenon, a preferential diffusion model was
hypothesized. Hydrogen has a higher mass diffusivity than oxygen in air. Therefore in
lean mixtures when the fuel is consumed, the hydrogen is more readily transported to the
- 13 -
flame front giving a locally higher equivalence ratio and subsequently higher turbulent
flame speed. A correlation was put forth relating the length scales, flame speeds and the
Karlovitz number in which all of the fuels for all the different equivalence ratios
followed. The high diffusivity and this preferential diffusion effect could explain the
wide flammability and high flame speed of hydrogen.
Section 2.3: Gas-Turbine Hydrogen Injector Developments
This section includes a discussion of premixed combustion and swirl. It is by no
means a new idea to use swirl to stabilize a premixed flame that utilizes gaseous fuels.
Lilley[18] published a review article of the subject in 1977. According to Lilley, there is
a critical swirl number of 0.6. Above this limit, the adverse pressure gradient overcomes
the momentum forces in the flow causing backward flow. This is extremely important in
combustion applications because the back flow of the hot gases serves the purpose of
continuously igniting the reactant mixture. As the swirl number increases the ratio of
mass flow rate transported upstream to the initial mass flow rate increases. Additionally,
the size ratio of the sudden expansion modifies the size and shape of the recirculation
zone. To account for this a modified swirl number is used which follows the form
D
dSS =*
where d is the diameter of the injector, and D is the length scale of the combustor. The
modified swirl number needs to be larger than 0.18 for a “strongly established
recirculation zone”. For strongly swirling flows (S>1), a torroidal vortex develops at the
wall boundary to accompany the central recirculation zone. According to Lilley the
- 14 -
optimum Swirl number for a D/d =2 is 1.15 for best stabilization and reduction in
pressure losses.
In 1984, Gupta et al.[7] published a book reviewing swirling flows in general.
One section specifically discusses the flame stabilization mechanism associated with
swirling flow. It was shown that in high swirl number flows, the normalized reversed
flow mass equals 80% in the non-combusting case, and 70% in the combusting case.
Additionally the central recirculation zone for the swirling flow is much larger than the
swirler diameter and is caused by a flow “vacuum” created by the movement of the fluid
outward radially once it exits the swirler. It is also suggested that having a modified
Richardson Number larger than 0 promotes the stabilization of the flame. More recent
contributions to the field of swirling premix combustion were driven by the need for low
emissions, specifically CO and NOx.
In 1993 McVey et al.[8] investigated three different injector designs for
application in dry low NOx combustion. One design was a swirling lean direct injection
(LDI), one was a swirl based lean premixed (LP) design, and the final was a perforated
plate lean premixed design. Methane was used as the fuel in the experiment. It was first
shown that the radial profile for the NOx emissions for all three injector types is
approximately flat, and that the two premixed designs both had significantly lower
emissions than the direct injection method. The swirl-based design was achieved by
tangential entry swirl vanes with fuel injection upstream. The flow was then turned axial
in a quarter ellipsoid profile. The emissions reported for an extrapolated 20:1
compression ratio engine was found to be 12 ppm, which is better performance than the
perforated plate design, and is most likely due to its lower flame temperatures. However,
- 15 -
the pressure losses reported were much higher for the swirl injector (9%) than the
perforated plate (3%). It was also demonstrated that the swirl type configuration could
yield wide operability limits with no evidence of instabilities. Furthermore with a 10%
piloted mixture through the center of the injector, a lean blowout limit of 0.44
equivalence ratio was achieved.
To further investigate the swirl flow combustion, Lovett and Mick[6] investigated
the spatial positioning of fuel spokes, vane driven swirlers, and the presence of a nozzle
piece inside an annular premixing device and its effects on operability and emissions. It
was shown that the position of the swirler with respect to the fuel injection spokes was
not important for stabilization, and the importance of the mixing length was minimal. It
was also shown that the NOx production was primarily a function of the number of fuel
spokes used (i.e. the initial spatial uniformity of the fuel). Also it was found that having
the fuel spokes downstream of the swirlers decreased the amount of swirl, as evidenced
by the flame shape. He warns against using excessive swirl in a premixed swirl injector.
This is because the higher swirl will produce a greater expansion angle at the dump plane,
which improves the stability through shear layer mixing, but it also increased the thermal
loading on the walls of the combustor. The swirl number was approximated as 0.7 for the
specific tests used here.
Another important feature of a premixer is the methodology in which the fuel and
oxidizer are mixing. One popular method is to use a jet in crossflow. Varatharajan et al.
[19] investigated a premixing dump combustor, which used a jet in crossflow method of
fuel-air mixing. Two geometries were investigated. One geometry consisted of fuel
being introduced at 90 degrees relative to the air crossflow. A second geometry consisted
- 16 -
of fuel injected into the air crossflow at a relative angle of 45 degrees. It was shown that
the wake behind the fuel jet was significantly reduced by the 45-degree entry relative to
the 90-degree entry, but the dispersion of the fuel was also reduced. The smaller wake
behind the jet creates a smaller region capable of flameholding and thus reduces the
probability for sustained flashback within the injector. The majority of premixing swirl
injectors utilize a jet in a swirling crossflow method.
Using a swirl stabilized premixed flame is not a unique concept as well as using
tangential entry to generate the swirling flow. In 1971 Bell filed for US patent
3,605,405[20] in which the invention uses vanes to guide the tangential entry of the air.
The difference between this type of injector and the one detailed in chapter 3 is that the
tangential entry for this device is still vane driven. Additionally the invention uses two
swirling flow paths to enhance the mixing at the shear layer to promote combustion.
Another feature of the invention is that the purge air assembly is a plurality of passages
though the back plate oriented in such a way that the purge air will also create a swirling
flow. This method introduces the fluid at the upstream location of the injector and the
swirling flow propagates toward the flame location. The next method of tangential entry
uses a continuous addition method.
Additionally to this type of basic design, there is a different method of utilizing
tangential entry. The following paragraphs describe the prior art that pertains to this
method of premixing fuel and air. US Patents 5,402,633 , 5,671,597 , 5,699,667, and the
geometry investigated by Snyder et al. all have the same form.[21-24] Generally a
cylindrical device is used with either a longitudinal row of holes or slits oriented off of
the central axis to promote the swirl. The most common name given to this type of
- 17 -
injector is a “scroll” type injector. Generally the air is introduced in this manor and a
central fuel spoke which shape is a cone with a rounded point introduces the fuel. The
cone centerbody and cylindrical outer housing gradually reduce the velocity of the air
fuel mixture from the upstream high velocity section. This is a preventative measure to
flashback and allows for the extended mixing time of the fuel and air. Additionally this
design utilizes the vortex breakdown within the mixer itself to stabilize the flame. The
continued introduction of air along the longitudinal row of holes or slit cools the
hardware both at and downstream of the flame location. This is different from the first
method of tangential entry because the introduction of the air is continuous along the axis
of the mixer.
To further investigate this basic method for tangential entry swirl premixers,
Snyder et al.[24] measured the performance an emissions for aeroderivative engine
conditions. Inlet pressures ranged from 15 to 19 atm, with an inlet temperature of 740 K.
Several different fuel inserts were compared. These inserts were the injection means of
the fuel into the swirling flow of the premixer. It was shown that the highest penetration
of the fuel from the correspsonding insert yielded the lowest combustion temperatures
and the lowest concentrations of NOx. More importantly, this type of fuel injector did not
develop any instabilities or flashback or blowoff problems during the entire mode of
operation.
The predecessor to the “scroll” type of premixer was developed by ABB in the
late 1980s and early 1990s called the EV burner. In 1992, Sattelmayer et al.[25] describe
the second generation of the EV burner, known as the AEV. It is constructed by cutting a
cone lengthwise and offsetting the two halves. The fuel entry, either gaseous or liquid
- 18 -
fuel, is introduced at the tip of the cone. The split cone arrangement creates a continuous
tangential entry into a premixer whose area expands towards the downstream end. This
design incorporates the concept of sudden breakdown of a swirling flow described by
Escudier and Keller[26]. The flame is anchored on the near stagnation at this breakdown
point with several key features. First, the length of the premixer promotes good mixing
and the velocity profiles inhibit flashback. Additionally since the flame is located far
from the hardware itself with a reactant flow in between, the thermal loading is kept to a
minimum. They were able to show that with either liquid or gaseous fuel, that full
premixing was possible and NOx levels were reported at or below 10 ppm for lean
conditions near blowout. It was also shown that the placement for the liquid injector has
an optimal point in between two extremes in which poor atomization and incomplete
vaporization occurs and alternatively poor mixing profiles contributing also to
combustion noise. Finally, injector staging was investigated with temperature profiles.
To achieve low NOx the burners must operate at a low equivalence ratio at all times, even
though the demand changes dramatically. The solution to this problem is fueling a
certain number of burners based on the demand needed while eliminating a drastic
temperature pattern factor for a turbine inlet. This was achieved by alternating sizes of
the EV burner. The smaller were pilots and fueled all of the time, and the larger EV
burners were fueled for power. The enhanced mixing between the exits of the individual
burners, cold or otherwise, effectively eliminated the pattern factor for the inlet of the
turbine.
The final documented method of creating a swirling flow in a premixing injector
uses a discrete number of passages oriented either completely tangentially with respect to

- 19 -
the mixing cylinder or annulus or in a hybrid axial/tangential configuration. There are
very few that have tried such a configuration. The majority of the literature focuses on
the aforementioned radial vane type, and “scroll” type tangential entry.

- 20 -
Chapter 3: Design of Test combustor and Injector
This chapter describes the design process of a sector combustor and the test
injectors used for this study. The specific design choices in the process were governed by
the practical application of using the injectors in a turboprop engine.
3.1: Sector Combustor Design:
This section covers the design of the test combustor. The injector design required
to be tested before its installation into the PT6-20 to confirm flame stabilization regions
and expected emissions measurements from the perfectly stirred reactor model as
described in the master’s thesis of Joseph Homitz. [25] The flame temperature expected
from these simulations is 1550 K. A full-scale sector combustor was designed to be
similar to the actual engine liner geometrically and kinetically. Table 1 shows the design
constraints for the combustor. It is important to note that the width of the combustor is
52.1 mm, which is the width of the combustion liner of the PT6-20. The length of the
test combustor was designed to be 388 mm, which follows the design constraint. A three
injector rectangular section was chosen to evaluate a central injector with periodic
boundary conditions on either side. The combustor needed to be at least 203 mm in
length to ensure that the entire flame was visible and the flame did not impinge on the
end of the liner. Following the overall dimensions of the combustor, the experimental rig
also needed to be implemented into an existing flowtrain and have the capability of
operating at high pressures.

- 21 -
Table1: Design Contraints for the size of the test combustor
Dimension or Constraint Value Reason
Width 52.1 mm Identical to PT6-20 combustor liner
Number of injectors in engine 18 Spacing every 20 degrees around the annulus
Number of injectors in test combustor 3 Sufficient for testing the interaction between injectors
Injector Spacing 59.87 mm Constrained by number of injectors and size of combustor annulus
Length of test combustor >203.2 mm Length of the actual combustor liner in the PT6-20
Pressure Rating >655 kPa Estimated pressure of the compressor outlet of the engine
The test combustor was designed such that it could be implemented in the existing
flow train of the modular combustor rig in the CSDL Laboratory at Virginia Tech, and is
capable of producing conditions seen in the engine from idle to full power. Figure 2a
shows the assembly view of the test section that was designed, while figure 2b shows the
pressure shell, which fits around the test section. The pressure shell is made from
schedule 80 14” stainless steel pipe with two 150 pound class flanges on the ends. The
flow train and the test section were designed to withstand 150 psig, which is much more
than the estimated 77.9 psig compressor outlet pressure at full power of the engine. The
pressure shell has two 0.5” air inlets welded near the plenum end of the combustor. The
flow through the volume between the test section and the pressure shell thermally
protects the shell. Thus the test section is designed to withstand the change in
temperature across its boundary and the purpose of the outer shell is to withstand the
pressure difference between the experiment and ambient. Finally the pressure shell is
outfitted with a sealed port window for optical access. The optical access is circular and
the extent of the field of view is the flame zone of the first injector and the periphery of
the neighboring injectors.
- 22 -
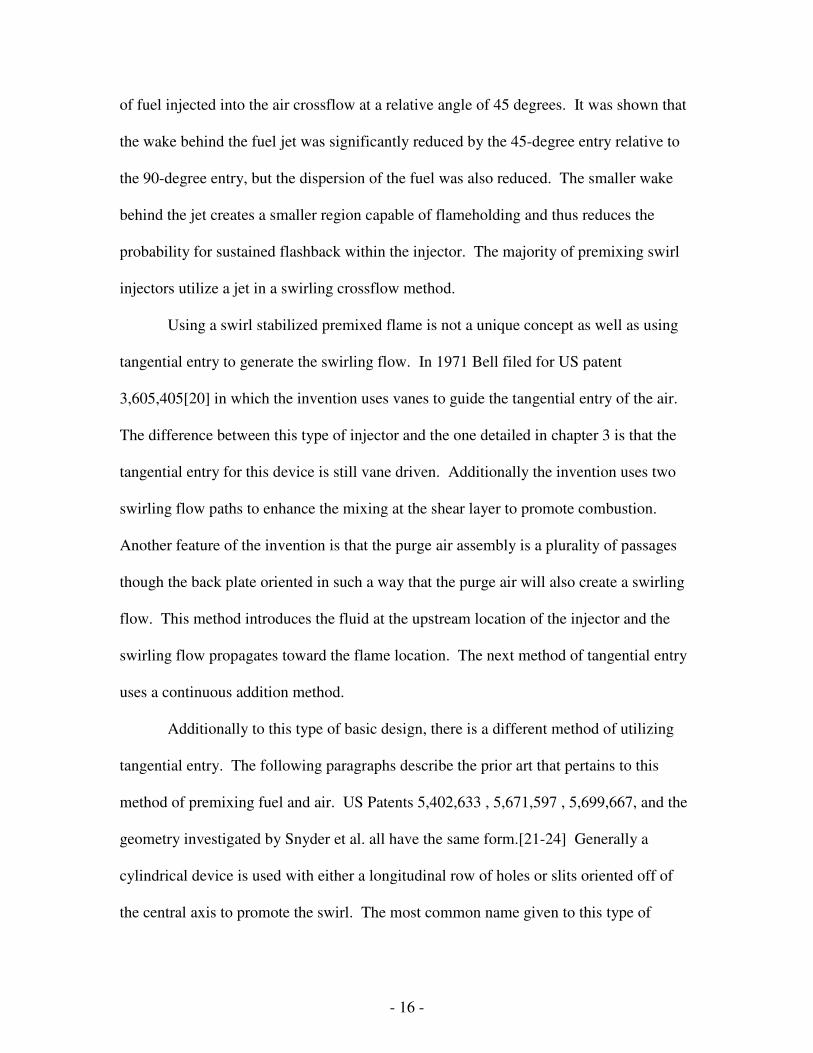
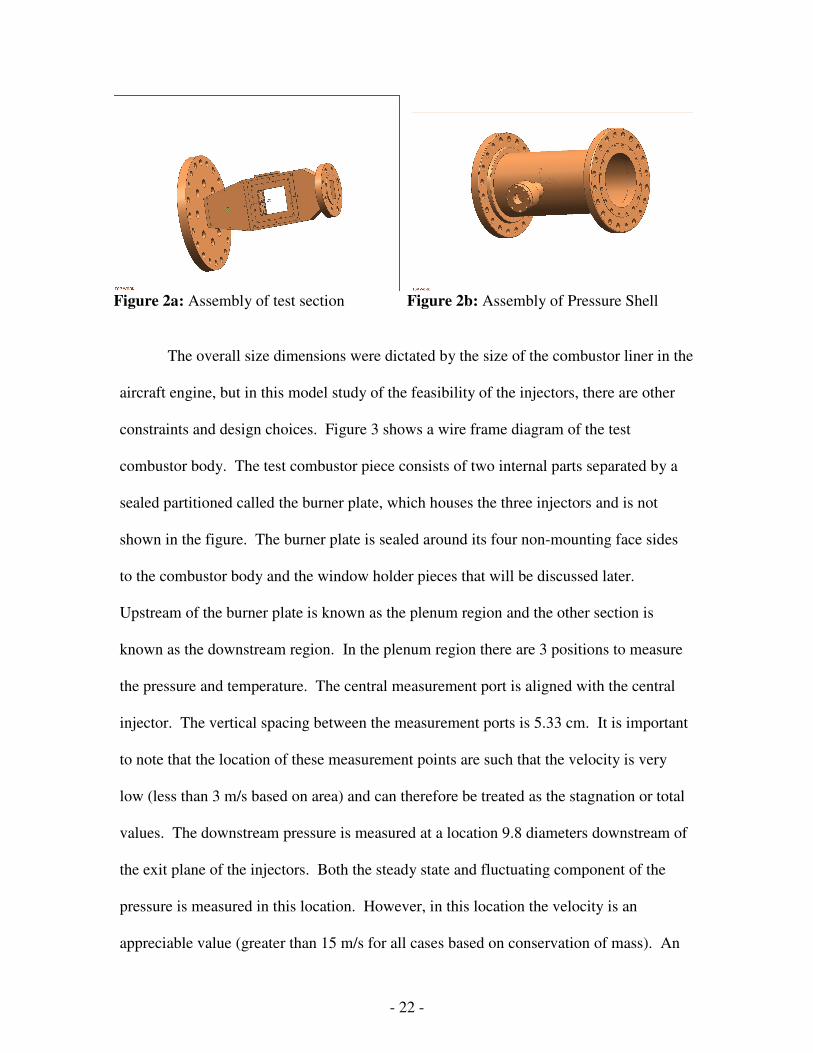
Figure 2a: Assembly of test section Figure 2b: Assembly of Pressure Shell
The overall size dimensions were dictated by the size of the combustor liner in the
aircraft engine, but in this model study of the feasibility of the injectors, there are other
constraints and design choices. Figure 3 shows a wire frame diagram of the test
combustor body. The test combustor piece consists of two internal parts separated by a
sealed partitioned called the burner plate, which houses the three injectors and is not
shown in the figure. The burner plate is sealed around its four non-mounting face sides
to the combustor body and the window holder pieces that will be discussed later.
Upstream of the burner plate is known as the plenum region and the other section is
known as the downstream region. In the plenum region there are 3 positions to measure
the pressure and temperature. The central measurement port is aligned with the central
injector. The vertical spacing between the measurement ports is 5.33 cm. It is important
to note that the location of these measurement points are such that the velocity is very
low (less than 3 m/s based on area) and can therefore be treated as the stagnation or total
values. The downstream pressure is measured at a location 9.8 diameters downstream of
the exit plane of the injectors. Both the steady state and fluctuating component of the
pressure is measured in this location. However, in this location the velocity is an
appreciable value (greater than 15 m/s for all cases based on conservation of mass). An
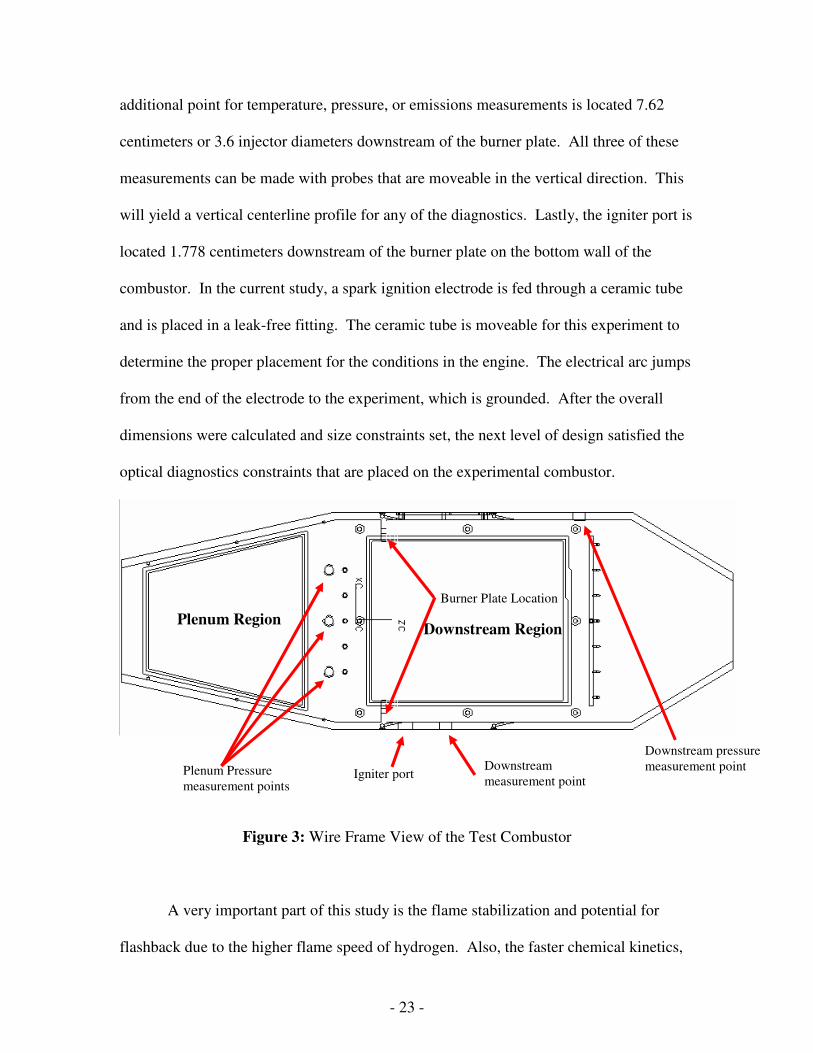
- 23 -
additional point for temperature, pressure, or emissions measurements is located 7.62
centimeters or 3.6 injector diameters downstream of the burner plate. All three of these
measurements can be made with probes that are moveable in the vertical direction. This
will yield a vertical centerline profile for any of the diagnostics. Lastly, the igniter port is
located 1.778 centimeters downstream of the burner plate on the bottom wall of the
combustor. In the current study, a spark ignition electrode is fed through a ceramic tube
and is placed in a leak-free fitting. The ceramic tube is moveable for this experiment to
determine the proper placement for the conditions in the engine. The electrical arc jumps
from the end of the electrode to the experiment, which is grounded. After the overall
dimensions were calculated and size constraints set, the next level of design satisfied the
optical diagnostics constraints that are placed on the experimental combustor.
Figure 3: Wire Frame View of the Test Combustor
A very important part of this study is the flame stabilization and potential for
flashback due to the higher flame speed of hydrogen. Also, the faster chemical kinetics,
Plenum Region Downstream Region
Burner Plate Location
Downstream
measurement point Plenum Pressure
measurement points
Downstream pressure
measurement point Igniter port
- 24 -
premixing of the fuel and air, and having a gaseous fuel will make the flame much
shorter than what is seen in the original spray flame of the combustor for the PT6-20.
Therefore it is important that the optical access must begin at the exit plane of the injector
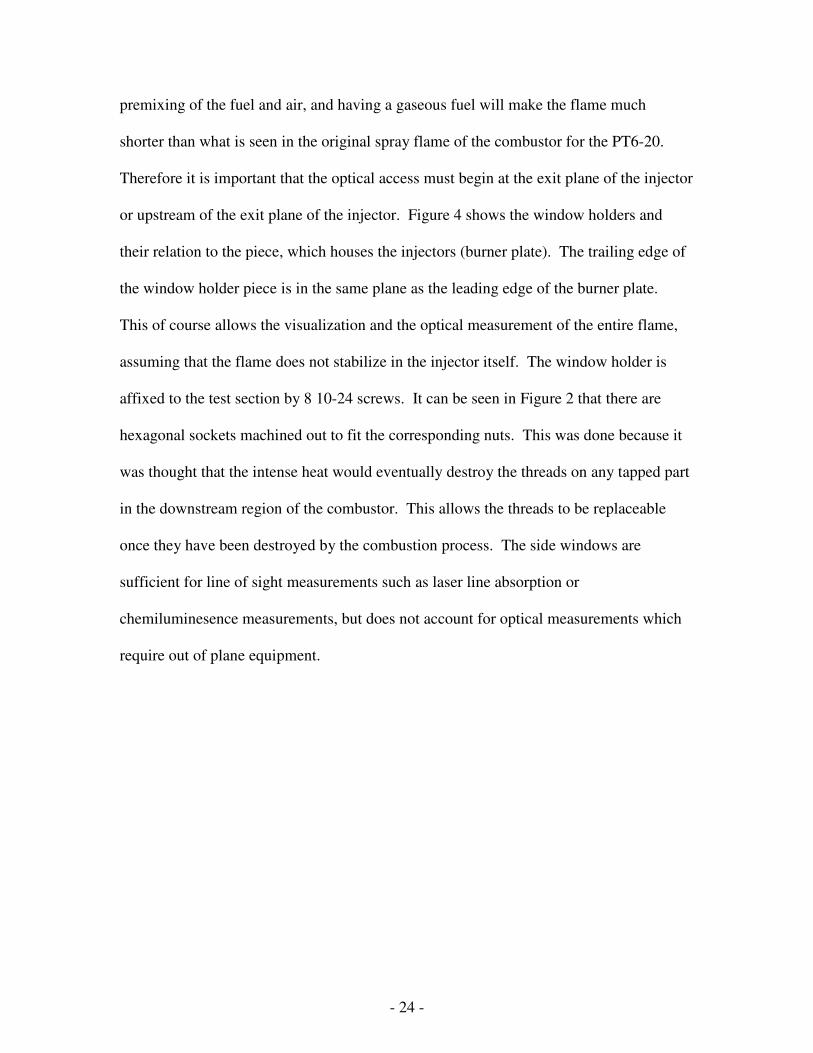
or upstream of the exit plane of the injector. Figure 4 shows the window holders and
their relation to the piece, which houses the injectors (burner plate). The trailing edge of
the window holder piece is in the same plane as the leading edge of the burner plate.
This of course allows the visualization and the optical measurement of the entire flame,
assuming that the flame does not stabilize in the injector itself. The window holder is
affixed to the test section by 8 10-24 screws. It can be seen in Figure 2 that there are
hexagonal sockets machined out to fit the corresponding nuts. This was done because it
was thought that the intense heat would eventually destroy the threads on any tapped part
in the downstream region of the combustor. This allows the threads to be replaceable
once they have been destroyed by the combustion process. The side windows are
sufficient for line of sight measurements such as laser line absorption or
chemiluminesence measurements, but does not account for optical measurements which
require out of plane equipment.
- 25 -
Figure 4: Assembly View of Test Combustor Body, Burner Plate, and Window Holders
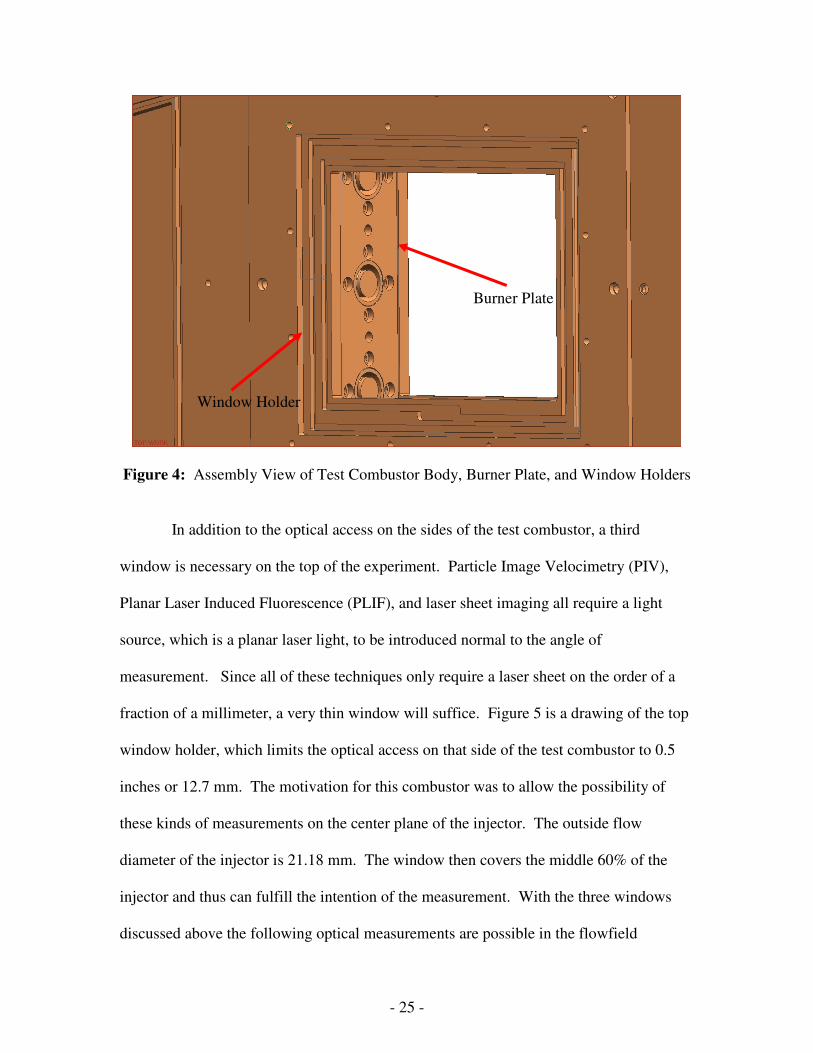
In addition to the optical access on the sides of the test combustor, a third
window is necessary on the top of the experiment. Particle Image Velocimetry (PIV),
Planar Laser Induced Fluorescence (PLIF), and laser sheet imaging all require a light
source, which is a planar laser light, to be introduced normal to the angle of
measurement. Since all of these techniques only require a laser sheet on the order of a
fraction of a millimeter, a very thin window will suffice. Figure 5 is a drawing of the top
window holder, which limits the optical access on that side of the test combustor to 0.5
inches or 12.7 mm. The motivation for this combustor was to allow the possibility of
these kinds of measurements on the center plane of the injector. The outside flow
diameter of the injector is 21.18 mm. The window then covers the middle 60% of the
injector and thus can fulfill the intention of the measurement. With the three windows
discussed above the following optical measurements are possible in the flowfield
Burner Plate
Window Holder
- 26 -
downstream of the injector; PIV, PLIF, LDV, PDPA, shadowgraph, schielren, and
interferometry. The mounting of the windows and sealing issues were addressed in the
following design section.
Figure 5: Drawing of the Top Window Holder (units in inches)
From previous experience with sealing glass onto a metal surface, the windows
were designed to be sealed and mounted to an independent frame, and have the
independent frame be sealed to the test combustor. A benefit of this sealing technique is
that the fused silica pane, which is used for the optical access, needs only to be sealed one
time for the entire battery of experiments, thereby reducing the chance of dirt
accumulation and breaking. Also this configuration allows the optical access to extend to
the exit plane of the injector. For these reasons, the current configuration was designed.
Figure 6 shows the exploded view of this assembly. The window holder plate is bolted to
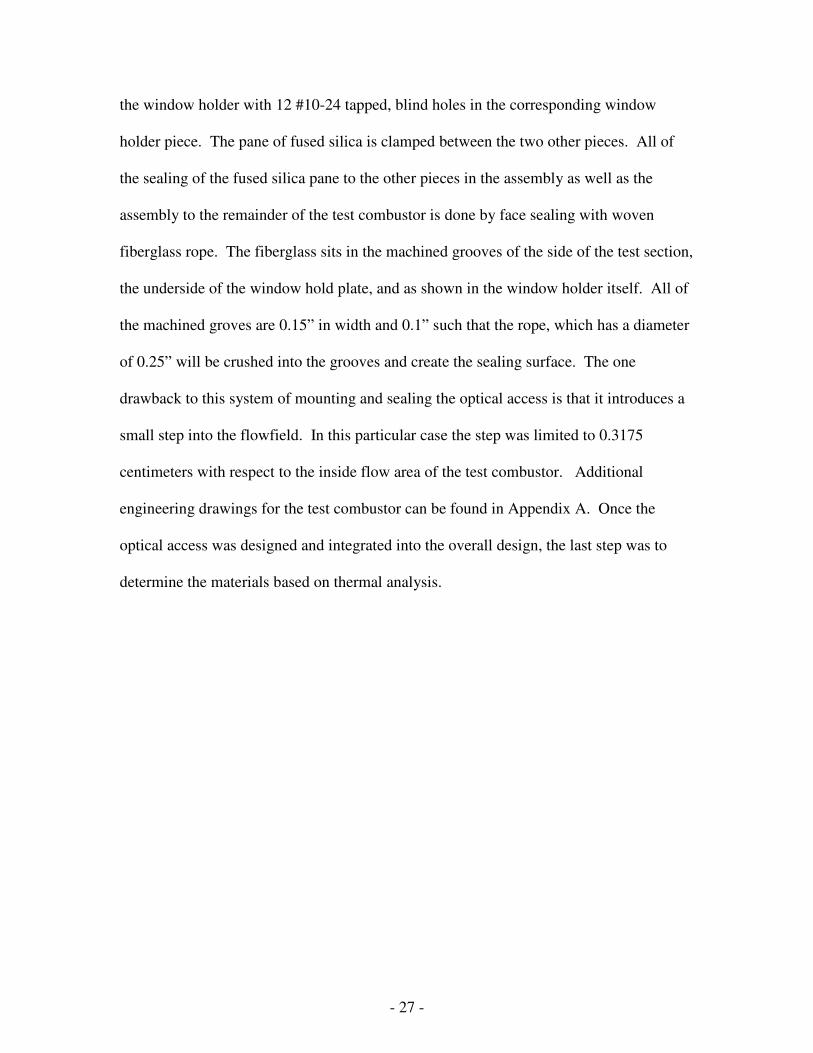
- 27 -
the window holder with 12 #10-24 tapped, blind holes in the corresponding window
holder piece. The pane of fused silica is clamped between the two other pieces. All of
the sealing of the fused silica pane to the other pieces in the assembly as well as the
assembly to the remainder of the test combustor is done by face sealing with woven
fiberglass rope. The fiberglass sits in the machined grooves of the side of the test section,
the underside of the window hold plate, and as shown in the window holder itself. All of
the machined groves are 0.15” in width and 0.1” such that the rope, which has a diameter
of 0.25” will be crushed into the grooves and create the sealing surface. The one
drawback to this system of mounting and sealing the optical access is that it introduces a
small step into the flowfield. In this particular case the step was limited to 0.3175
centimeters with respect to the inside flow area of the test combustor. Additional
engineering drawings for the test combustor can be found in Appendix A. Once the
optical access was designed and integrated into the overall design, the last step was to
determine the materials based on thermal analysis.
- 28 -
Figure 6: Optical Access Assembly
The combustion liner in the actual engine has both dilution holes and film cooling
slots to protect it from the high temperatures of the Jet-A flame. The same paradigm
needed to be applied to the test combustor. However the temperatures that the walls
would see were still unknown, so a thermal analysis was performed to identify and test
cooling methods and materials that would be needed to ensure that the test combustor
could survive the temperatures seen during the testing of the injector. It was chosen that
4 rows of cooling holes were to be machined into the top and bottom of the test section.
All of the film cooling passages were 4.76 millimeters in diameter and were drilled at an
angle of 15 degrees with respect to the wall. The dilution is provided by a large rake of
holes located at the downstream end of the optical access. This rake is located on both
Sealant Groove
Window Holder Plate
Window Holder
Fused Silica
- 29 -
sides of the test combustor. It was calculated that the amount of cooling air that could be
delivered by the film cooling/dilution system can match the combustion air at 0.4
equivalence ratio. Once mixed it will yield a mean bulk flow exit temperature of 950 K.
However a full thermal analysis needed to be performed.
Solving for the thermal pattern on the walls of the proposed combustor would be
impossible to do analytically. Therefore a CFD simulation was performed on the wetted
surface of the test combustor. A simple one step reaction mechanism was used with
idealized flow conditions. It was found that the maximum temperature occurs where the
window faces are, and is 1470 K. The softening temperature for a fused silica window is
1600 K. The pressure difference across the window at all operating pressures is very
low. Therefore there was not need to cool the windows with film cooling. However the
window holder area and the burner plate area would be exposed to temperatures of
approximately 1200K. That temperature cannot be contented with by stainless steel.
Therefore, Hastelloy X was determined to be the material suitable to handle the
temperature associated with the combustion. The material for the remainder of the sector
combustor was chosen to be stainless steel because of the exposure to high humidity and
very high temperatures, which would cause carbon steel to rust. The test section and
pressure shell were then designed, leaving the injector still to be designed. The next
section will discuss the design process for the premixing injectors themselves.
3.2 Injector Design:
This section discusses the design process of the hydrogen-air injector. The design
specifications for the injector followed the PT6-20 engine requirements. Since varying
- 30 -
conditions of the engine (take off, cruise, and full power) are possible, there are three
possible optimizations for the injector. The cruise condition was chosen for the
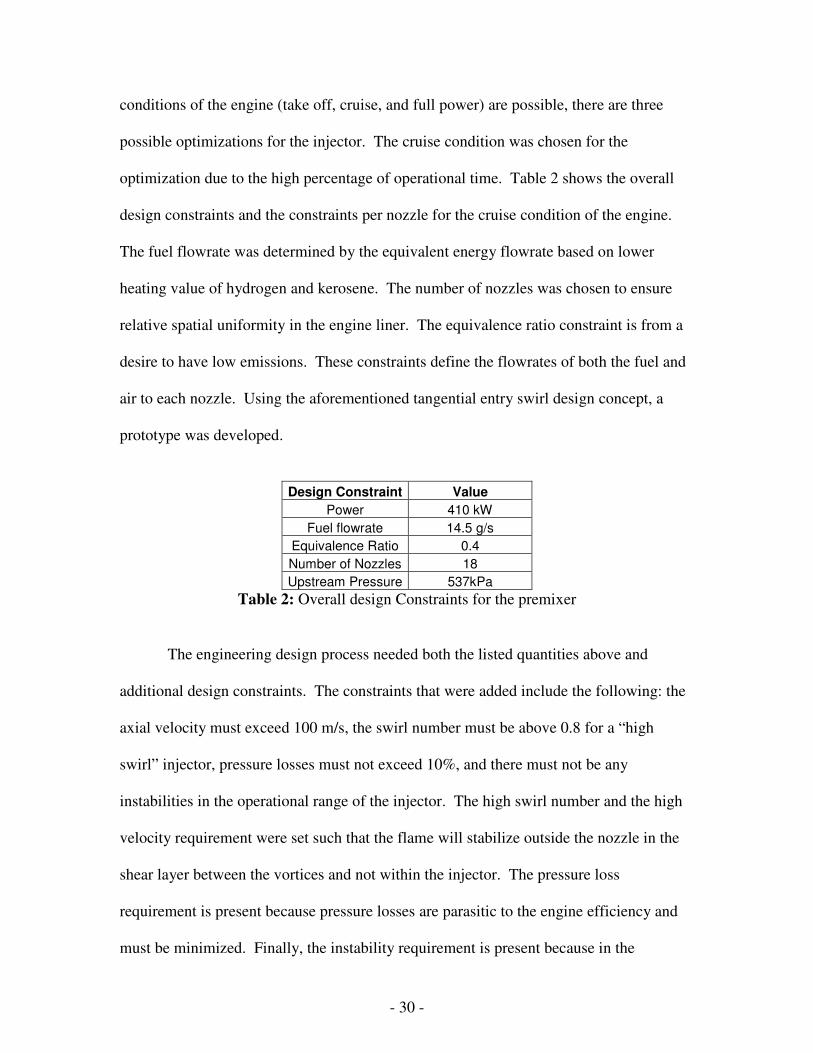
optimization due to the high percentage of operational time. Table 2 shows the overall
design constraints and the constraints per nozzle for the cruise condition of the engine.
The fuel flowrate was determined by the equivalent energy flowrate based on lower
heating value of hydrogen and kerosene. The number of nozzles was chosen to ensure
relative spatial uniformity in the engine liner. The equivalence ratio constraint is from a
desire to have low emissions. These constraints define the flowrates of both the fuel and
air to each nozzle. Using the aforementioned tangential entry swirl design concept, a
prototype was developed.
Design Constraint Value
Power 410 kW
Fuel flowrate 14.5 g/s
Equivalence Ratio 0.4
Number of Nozzles 18
Upstream Pressure 537kPa
Table 2: Overall design Constraints for the premixer
The engineering design process needed both the listed quantities above and
additional design constraints. The constraints that were added include the following: the
axial velocity must exceed 100 m/s, the swirl number must be above 0.8 for a “high
swirl” injector, pressure losses must not exceed 10%, and there must not be any
instabilities in the operational range of the injector. The high swirl number and the high
velocity requirement were set such that the flame will stabilize outside the nozzle in the
shear layer between the vortices and not within the injector. The pressure loss
requirement is present because pressure losses are parasitic to the engine efficiency and
must be minimized. Finally, the instability requirement is present because in the
- 31 -
presence of instabilities pressure forces can damage hardware, the increased radiation has
the potential of melting the hardware, and local regions with high equivalence ratios are
formed, raising emissions, and the overall combustion efficiency decreases. The next
section describes an embodiment of the injector with all of these constraints applied.
The conceptual design of the injector is to have an annular mixing chamber with
swirling flow. In this design, tangential entry was used to create the swirling flow.
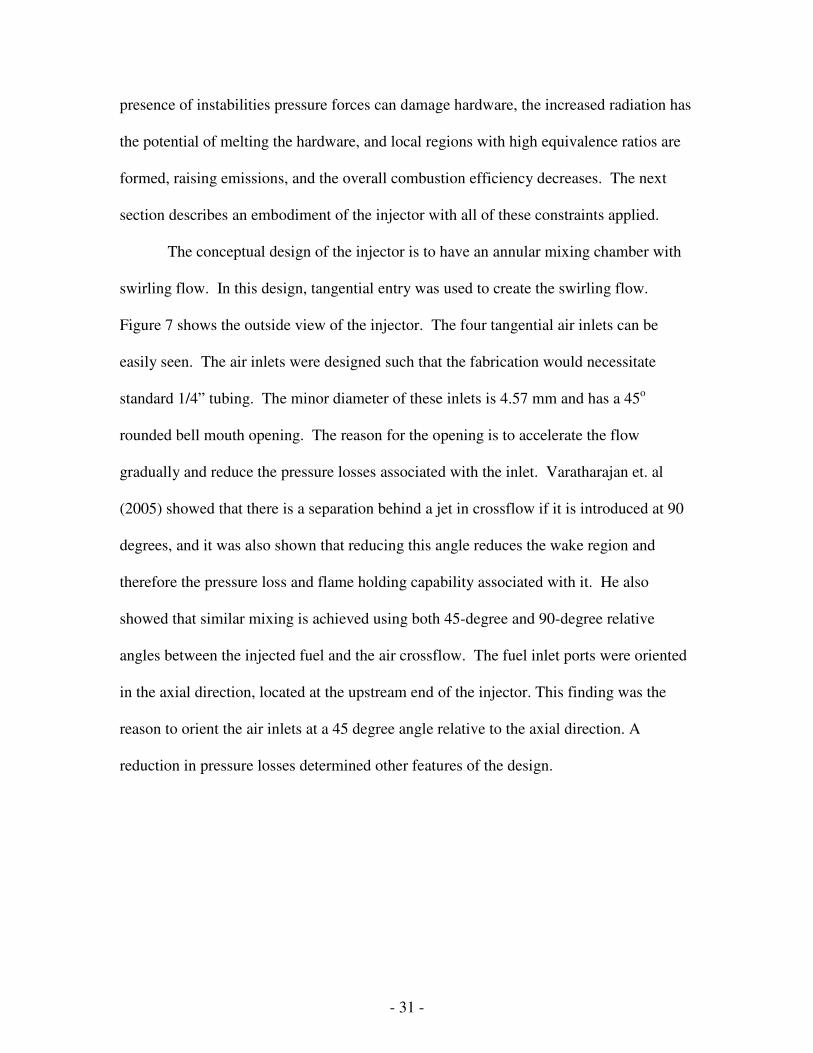
Figure 7 shows the outside view of the injector. The four tangential air inlets can be
easily seen. The air inlets were designed such that the fabrication would necessitate
standard 1/4” tubing. The minor diameter of these inlets is 4.57 mm and has a 45o
rounded bell mouth opening. The reason for the opening is to accelerate the flow
gradually and reduce the pressure losses associated with the inlet. Varatharajan et. al
(2005) showed that there is a separation behind a jet in crossflow if it is introduced at 90
degrees, and it was also shown that reducing this angle reduces the wake region and
therefore the pressure loss and flame holding capability associated with it. He also
showed that similar mixing is achieved using both 45-degree and 90-degree relative
angles between the injected fuel and the air crossflow. The fuel inlet ports were oriented
in the axial direction, located at the upstream end of the injector. This finding was the
reason to orient the air inlets at a 45 degree angle relative to the axial direction. A
reduction in pressure losses determined other features of the design.
- 32 -
Figure 7: Outside view of the injector
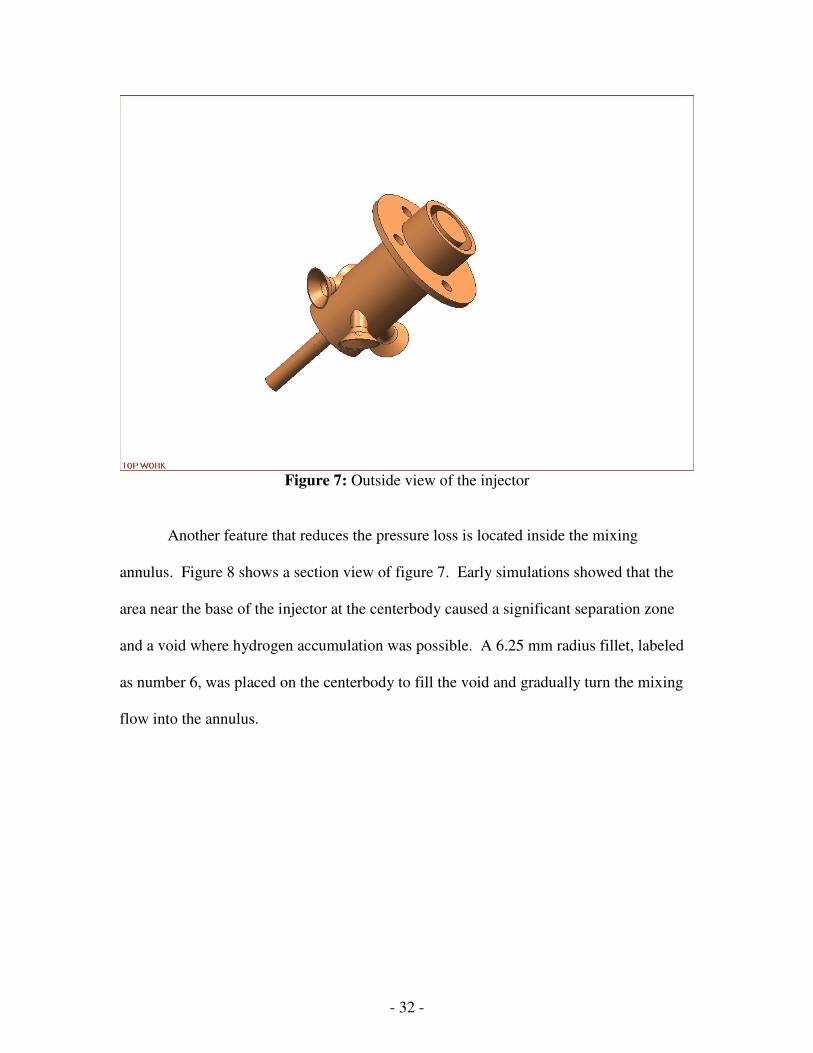
Another feature that reduces the pressure loss is located inside the mixing
annulus. Figure 8 shows a section view of figure 7. Early simulations showed that the
area near the base of the injector at the centerbody caused a significant separation zone
and a void where hydrogen accumulation was possible. A 6.25 mm radius fillet, labeled
as number 6, was placed on the centerbody to fill the void and gradually turn the mixing
flow into the annulus.
- 33 -
1
2
4
5
6
5
8
Figure 8: Cut view of the designed injector
The annulus, labeled as number 8, has an outer diameter of 21.18 mm and an
inner diameter of 15.24 mm, yielding an exit area of 0.0001699 m2. Using the mass flow
rate and the area, the area average velocity is approximately 113 m/s based on ideal gas
behavior. This high velocity is good flashback prevention because the turbulent flame
speed will not approach such a high value. It is important to note that this is for the
design condition only. During startup of the engine, when the flowrate is much lower,
flashback is a possibility that must be tested for. The next design choices were made on
the fuel system design of the injector.
The fuel side design decisions were made as precautions to failures and problems
typically seen in premixing injectors. With the flame zone for a swirling annular injector
- 34 -
being close to the end cap of the centerbody, there is potential for the thermal failure of
the centerbody cap. To help alleviate this problem the hydrogen fuel provides convective
back wall cooling before it is introduced into the annular mixing chamber. To achieve
this, the fuel is routed from the inlet tube, labeled as 1 in figure 8, to the centerbody cap,
labeled as 2 in figure 8. Here it provides the back wall cooling to the centerbody cap and
is routed to the base of the injector, and finally through the fuel delivery ports, labeled as
4 in figure 8.
The next precaution in the fuel delivery system is the onset and sustaining of
thermoacoustic instabilities in the combustor. These instabilities can be caused by
equivalence ratio perturbations caused by the acoustic wave propagated upstream through
the fuel delivery system. One method to circumvent this communication is to have the
fuel inlet ports to be choked (Ma = 1). This fixes the fuel axial velocity. The fuel inlets
being choked eliminates the possibility for equivalence ratio perturbations, but mixing
perturbations can still exist leading to instabilities. It is however important that the bulk
mixing qualities remain constant, which are determined in part by the momentum ratio
defined as
2
2
aa
ff
V
Vj
ρ
ρ=
where the subscripts a and f refer to the air and fuel respectively. In a choked passage
the mass flow rate is determined by the pressure, which positively correlates to the
density. It is important that the fuel stream does not over penetrate into the air crossflow
disrupting the mixing processes. Therefore the area of the fuel delivery ports was chosen
to be the largest area in which the passage remained choked during the idle condition of
- 35 -
the engine. The idle condition of the engine is the lowest mass flow rate of fuel that is
required. Simulations performed in FLUENT suggested a fuel port size of .406 mm. The
diameter ratio between the air inlet ports and the fuel inlet ports is 11.24, which is
relatively small. A benefit for making the fuel ports larger is that the surface area on the
windward side of the fuel jet becomes large, aiding in the fuel shedding and mixing
process. An additional benefit of maximizing the fuel inlet ports is that the hydrogen
inlet pressure is minimized. This could potentially be a parasitic loss on the engine
power, depending on the storage method of the hydrogen.
As stated above, the high axial component of the velocity is a good flashback
prevention mechanism. A second preventative measure namely the quenching distance
can be taken in this design. The quenching distance is defined as the smallest passage
through which a flame can propagate. The inlet pressure is a main factor when
determining this dimension. For the cruise condition of the PT6-20 with an inlet pressure
of 5.3 atm the quenching distance was found to be 0.173 mm. The size constraints of the
combustion liner do not make this possible. The area needs to remain the same, but with
a passage height of 0.173 mm, the diameter of the nozzle would be extremely large, and
could not physically fit in the space for the liner. Therefore, the main flashback
prevention aspect of the design is the high velocities within the injector.
In summary the design choices for the injector were all derived from the engine
power required from the fuel. The power needed determined the flowrate of hydrogen.
The equivalence ratio specification to reduce NOx determined the air flowrate and thus
the annulus crossectional area. Furthermore, evidence has been shown that decreasing
the relative angle between the air stream and fuel stream decreases the flameholding
- 36 -
capability of a jet in cross flow arrangement. This finding along with the desire to have a
high degree of swirl determined the angle of the air inlets. The fuel inlets were sized to
enhance mixing and still remain sonic at all operating conditions. Finally the end wall
cooling of the fuel and the smoothing of the air inlets were designed to increase the
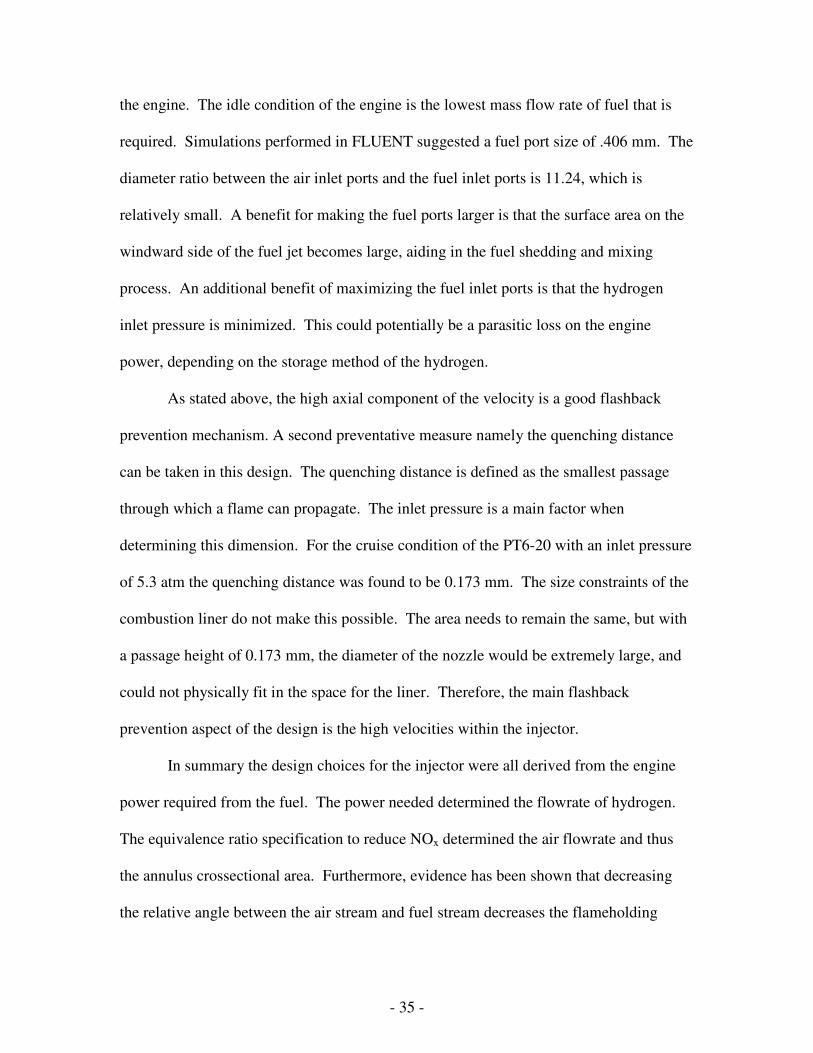
durability lifetime and reduce the pressure losses. The quenching distance could not be
achieved as the annulus width, but the high velocities are a sufficient measure to prevent
flashback. After the injectors were designed, the manufacturing considerations were
taken into account.
Figure 9 shows the exploded view of the machinable injector. It was decided that
the injector was to be made in three parts. The three parts are the centerbody, casing, and
the feed tube. The feed tube is a standard ¼ inch stainless steel tube that can be inserted
into the casing and welded at the back end. The centerbody houses the feed tube. The
fuel plenum is created with cross drilled holes, and the fuel injection holes are created
with a wire EDM machine. The casing itself is made from a single cylinder. The bell
mouth air entrances can be made from flareable tubing and then welded into place. A
counterbore exists in the casing to locate the centerbody during assembly and ensure a
flush fit. The casing is then press fit around the centerbody to create the sealing surface
for the fuel plenum. This satisfies the objective of a manufacturable test injector for
turboprop operating conditions. The next chapter discusses the experimental setup for
the testing of the injectors.
- 37 -
Figure 9: Exploded view of the injector

- 38 -
Chapter 4: Experimental and Computational Setup
The following chapter describes the experimental setup for the CFD evaluation of
the mixing for the premixing injector. Additionally the experimental setup for the
pressure testing of the flame characteristics and behavior is also presented.
4.1: Computational Setup
This section includes a discussion of an experimental setup for the CFD
evaluation of the premixing injector. The concept and overall geometry for the injector
was designed using specific design guidelines for the engine. However solving for the
specific flow pattern and the mixing characteristics analytically is impossible. Thus, to
get a prediction and approximate performance characteristics, a CFD package was used.
The physical mesh was created by the program GAMBIT. The CFD package FLUENT
applies the Navier Stokes equations and the energy equation to each volume in the mesh.
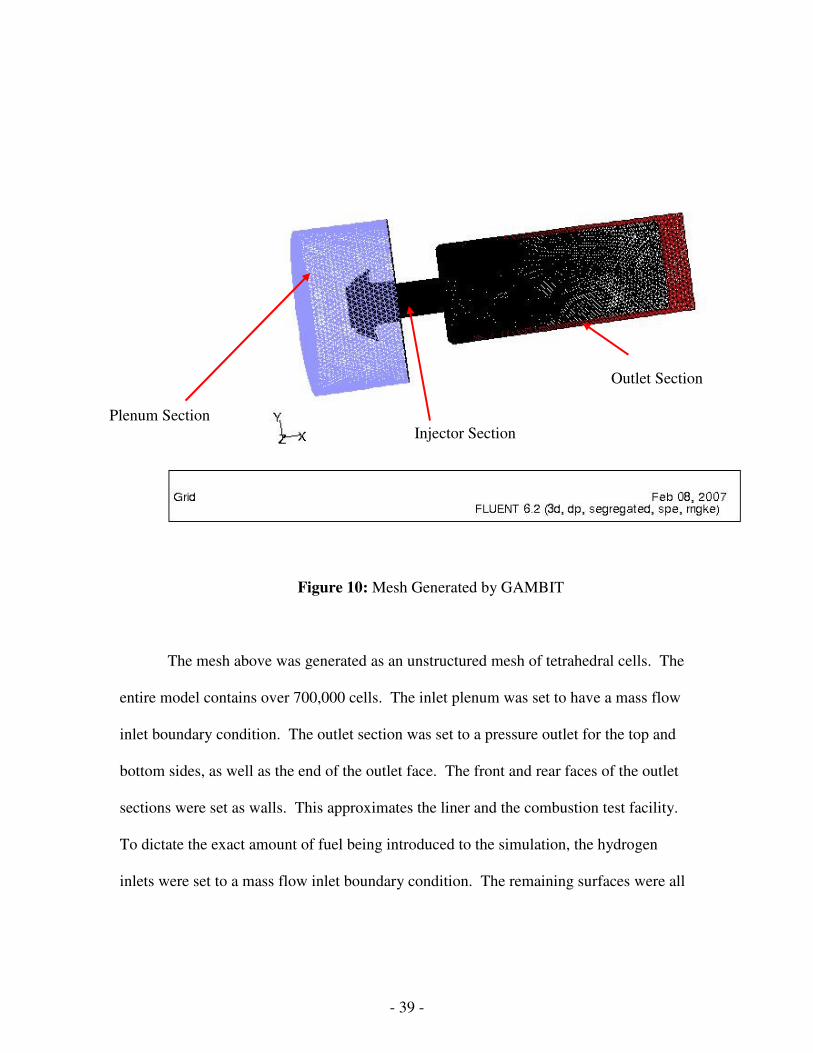
Figure 10 shows the mesh generated by GAMBIT. The model used is broken
down into three parts. The first section of the model is a single 2” diameter annular
plenum surrounding the air inlets. The purpose is to eliminate assumptions on the inlet
velocity profiles to the inlets and includes the losses associated with the air inlets. The
second portion of the model is the wetted volume of the injector itself. All of the features
associated are accounted for as described in the design section including the air inlets,
annular mixing chamber, hydrogen injection ports, and the fillet at the upstream end of
the injector. The size of the final portion of the model is representative of both the
combustor liner and the test combustor.
- 39 -
Figure 10: Mesh Generated by GAMBIT
The mesh above was generated as an unstructured mesh of tetrahedral cells. The
entire model contains over 700,000 cells. The inlet plenum was set to have a mass flow
inlet boundary condition. The outlet section was set to a pressure outlet for the top and
bottom sides, as well as the end of the outlet face. The front and rear faces of the outlet
sections were set as walls. This approximates the liner and the combustion test facility.
To dictate the exact amount of fuel being introduced to the simulation, the hydrogen
inlets were set to a mass flow inlet boundary condition. The remaining surfaces were all
Outlet Section
Plenum Section Injector Section
- 40 -
given the wall boundary condition. After the mesh was created, it was loaded into
FLUENT and the operational constraints were placed upon it.
The injector was optimized for the cruise condition of the engine, due to the time
of operation at this condition. The boundary conditions that were set are listed in Table
3. The fuel mass flow rate is set by the equivalent energy flowrate of JetA that is used
currently in the engine. The air flow rate is determined by the equivalence ratio that is
desired. The outlet pressure is set by the desired pressure loss through the injector and
the compressor exit condition. A complete list of the boundary conditions is located in
Appendix C. The RNG specification of the well known k-e model was used as the
turbulence closure equation due to its relative high accuracy for swirling flows. The ideal
gas model was used for solving for the density, and the solver used a first order upwind
scheme in the solution.
Table 3: Boundary Conditions for the FLUENT simulation
Inlet Boundary Condition Value
Air Mass Flow Rate 0.069kg/s
Fuel Mass Flow Rate 0.0008055 kg/s
Outlet Pressure (gauge) 500 kPa
The solution for the solver was initiated from the pressure outlets and initially
iterated with a non turbulent model (i.e. laminar). This approximates the flowfield
everywhere and is helpful for the convergence of the solution. After the flowfield is
approximated by the laminar condition for 20 iterations, it is used as a starting point for
the turbulence model. Then the mesh was iterated in the turbulence model until a
converged solution was reached. The condition for a converged solution was to have all
- 41 -
of the residuals at 1*10e-04 or less. This ensures a close approximation to the given
boundary conditions.
The solution to the model has several purposes before the actual testing of the
injectors. Firstly, an approximation of the mixing can be determined. Secondly, the
expansion angle and the post injector fluid mechanics can be analyzed such as the size
and strength of the cold flow recirculation zones. Thirdly the pressure losses can be
approximated. The three metrics for testing the injector using the CFD package are the
level of mixedness, denoted by the spatial variation in equivalence ratio, the pressure loss
of the injector, denoted by the pressure drop between the plenum and outlet, and the
angle of expansion, denoted by the path lines of the fluid in the simulation. The results of
this test are shown in chapter 5 along with the experimental results. The following
section includes a description of the setup for the experimental evaluation of the injectors.
4.2: Experimental Setup
The injectors were tested on the modular combustion rig at the Combustion
Systems Dynamics Lab at Virginia Tech. The actual test combustor is described in detail
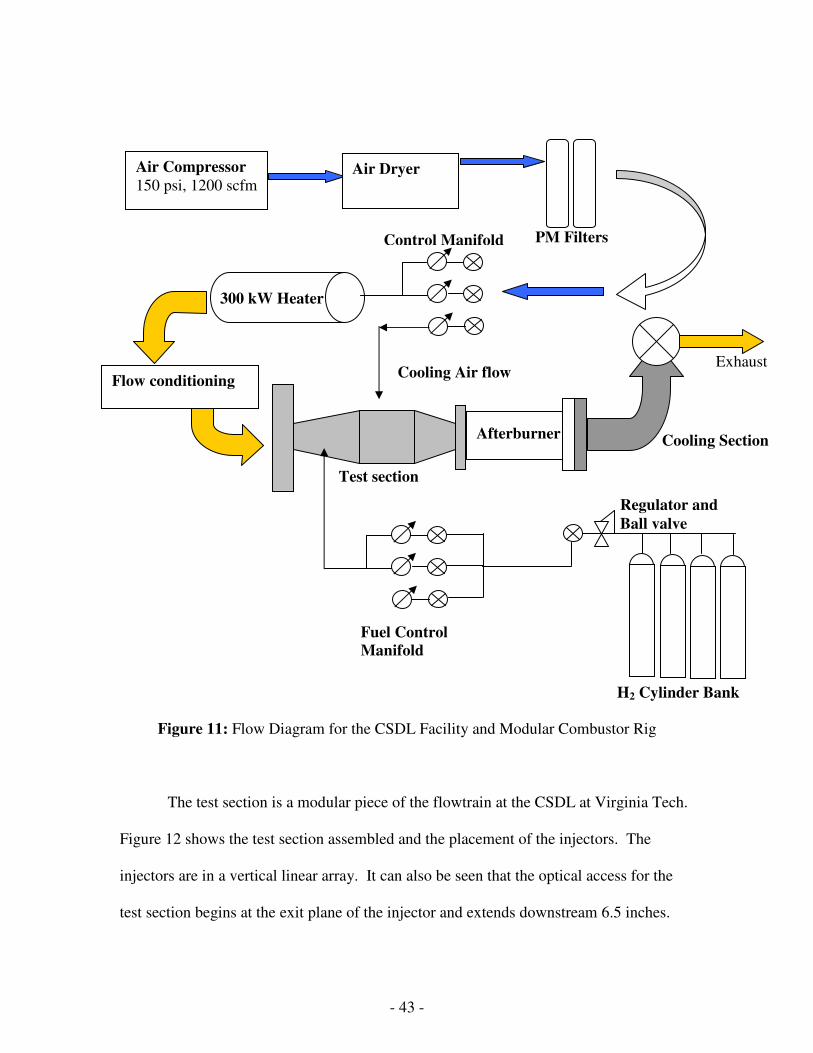
in chapter 3. Figure 11 shows a schematic of the components of the test system. A
compressor is used to supply the air at a maximum flowrate of 1200 scfm and 150 psig.
The air then flows to a storage tank, then to an air dryer. The air then travels through
filters for particulate matter and into the building. The air pressures and flowrates are
controlled with a series of pneumatic valves with full PID computer control. The air then
- 42 -
travels through a 300kW electrical process heater. The flow then enters the flow train
and is conditioned before entering the test section.
The fuel source was a manifold of hydrogen cylinders. From there, the pressure
was regulated down to 300 psi by a standard gas cylinder two stage regulator for the tests.
A new high flow pressure regulator was installed to deliver the 600 psi and the high flow
rates of hydrogen needed for the high operating pressure conditions. A shut off ball valve
is located between the bottle regulator and the metering manifold. From there the
hydrogen flows into the bank of pneumatic PID controlled valves. The flowrates for the
fuel and air were measured by thermal type mass flow meters. The valves for both the
fuel and air were controlled with a single computer utilizing LABview. The computer
also recorded the data that is relevant from the same program.
- 43 -
Figure 11: Flow Diagram for the CSDL Facility and Modular Combustor Rig
The test section is a modular piece of the flowtrain at the CSDL at Virginia Tech.
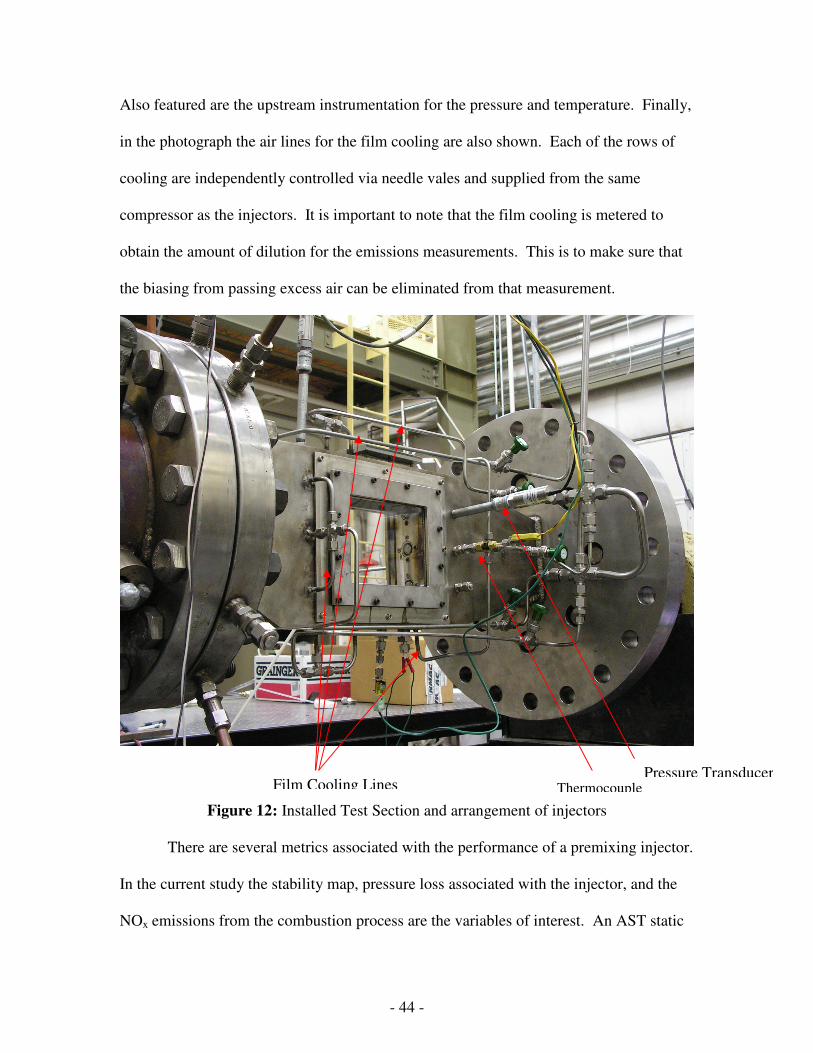
Figure 12 shows the test section assembled and the placement of the injectors. The
injectors are in a vertical linear array. It can also be seen that the optical access for the
test section begins at the exit plane of the injector and extends downstream 6.5 inches.
Test section
Cooling Air flow
Air Compressor
150 psi, 1200 scfm Air Dryer
PM Filters
300 kW Heater
Flow conditioning
Control Manifold
Regulator and
Ball valve
Fuel Control
Manifold
H2 Cylinder Bank
Exhaust
Afterburner Cooling Section
- 44 -
Also featured are the upstream instrumentation for the pressure and temperature. Finally,
in the photograph the air lines for the film cooling are also shown. Each of the rows of
cooling are independently controlled via needle vales and supplied from the same
compressor as the injectors. It is important to note that the film cooling is metered to
obtain the amount of dilution for the emissions measurements. This is to make sure that
the biasing from passing excess air can be eliminated from that measurement.
Figure 12: Installed Test Section and arrangement of injectors
There are several metrics associated with the performance of a premixing injector.
In the current study the stability map, pressure loss associated with the injector, and the
NOx emissions from the combustion process are the variables of interest. An AST static
Film Cooling Lines Thermocouple
Pressure Transducer
- 45 -
pressure sensor in the plenum section of the combustor measures the upstream pressure.
The downstream pressure is measured far downstream of the combustor by an Omega
static pressure sensor to measure the pressure drop due to friction or mixing which is
assumed to be negligible due to the bulk velocities being low. The difference between
these two measurements approximated as the pressure drop across the injector. The NOx
measurements are conducted by a NO-NO2 Thermal analyzer (model 42C High Level).
The location for the emissions is .247 meters downstream of the burner plate. The
collection method for the measurement is a vertical rake, which serves to spatially
average the sample. The flame presence is measured by a far downstream thermocouple,
which is at the same downstream location of the emissions measurement, and by visual
and auditory inspection. From these methods, the metrics for the injectors are
determined.
The goal of the present research is to test the feasibility of the premixing injector
for use in a PT6-20 engine. Thus it is important to test the injectors at a multitude of inlet
conditions. The literature by NACA suggests that the flame speed will not be affected by
the pressure but will be affected by the inlet temperature. The flame speed will be a
maximum at a maximum temperature. However, the flame speed also increases
dramatically with equivalence ratio if the equivalence ratio is below 1.95. So if the
equivalence ratio is significantly higher than the design operating equivalence ratio, the
test is good for determining flashback. As such the entire test matrix was executed at the
ambient temperature of approximately 298 K. Table 4 shows the specific conditions that
were chosen as characteristic for the engine. Test 1 is an atmospheric test which only
tests the operation of one injector. Test 2 is the stability map for three injectors operating

- 46 -
simultaneously. The flow rates for air and fuel are multiplied by three from Test 1. Thus
the only difference is the interaction between the injectors is now active. The fuel mass
flow rate range limits the boundaries that the stability map will be measured on. The
design case for the single injector case is 6.22 scfm of fuel. Therefore the 2 scfm case
has a turndown ratio of .322. This will test the flashback resistance of the injector
beyond the demands of the engine. The next chapter discusses the results from the tests
outlined above.
Table 4: Conditions tested for the premixed injector
Test # # of Injectors Used Fuel Flow Rate (scfm) Equivalence Ratios
1 1 2.9 Blowoff-0.8
1 4.5 Blowoff-0.9
1 5.7 Blowoff-0.10
1 6.3 Blowoff-0.11
1 7.2 Blowoff-0.12
2 3 8.7 Blowoff-Stability Limit
3 13.5 Blowoff-Stability Limit
3 17.1 Blowoff-Stability Limit
3 18.9 Blowoff-Stability Limit
3 21.6 Blowoff-Stability Limit
- 47 -
Chapter 5: Injector Performance at Atmospheric Conditions and
Simulation Results
This section includes a discussion of the FLUENT computations and the
experimental results from the combustion tests described in chapter 3. The emphasis for
the testing of the injectors is on the cruise condition due to the high percentage of time in
that operating condition.
5.1: Simulation Results and Discussion
5.1.2 Flowfield and Velocity Results
The metrics or tests of a good swirl based premixing nozzle is that it has low
pressure loss, high degree of mixing, and a moderate or high amount of swirl. Figure 13
shows the particle path lines or streamlines, because the FLUENT solution is for the
steady case only. The color of the path lines represents the velocity magnitude. It is
clearly evident that there is a high degree of swirl. The swirl number is an indication of
the amount of swirl in the flow and is defined as
∫∫
=drrV
drVrVS
z
z
2
θ
where Vz is the axial velocity, θV is the tangential velocity, and r is the radial coordinate.
The swirl number was calculated for this condition to be .886. According to Lilley
(1977), this is classified as a “high swirl” flow and should be good for flame stabilization.
Also, the spatial position that the velocity magnitude rapidly decreases is the exit of the
injector. This creates a convenient stabilization point for the reacting flow. Finally the
expansion of the pathlines downstream of the exit of the nozzle is evidence that central
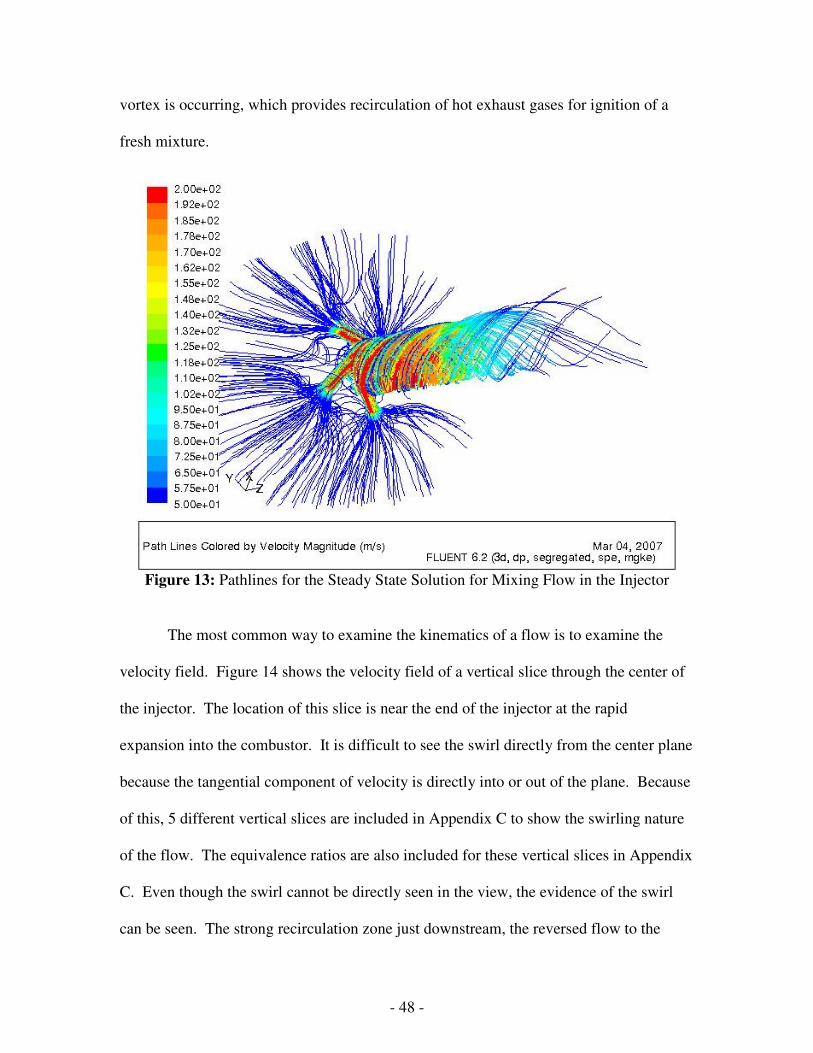
- 48 -
vortex is occurring, which provides recirculation of hot exhaust gases for ignition of a
fresh mixture.
Figure 13: Pathlines for the Steady State Solution for Mixing Flow in the Injector
The most common way to examine the kinematics of a flow is to examine the
velocity field. Figure 14 shows the velocity field of a vertical slice through the center of
the injector. The location of this slice is near the end of the injector at the rapid
expansion into the combustor. It is difficult to see the swirl directly from the center plane
because the tangential component of velocity is directly into or out of the plane. Because
of this, 5 different vertical slices are included in Appendix C to show the swirling nature
of the flow. The equivalence ratios are also included for these vertical slices in Appendix
C. Even though the swirl cannot be directly seen in the view, the evidence of the swirl
can be seen. The strong recirculation zone just downstream, the reversed flow to the
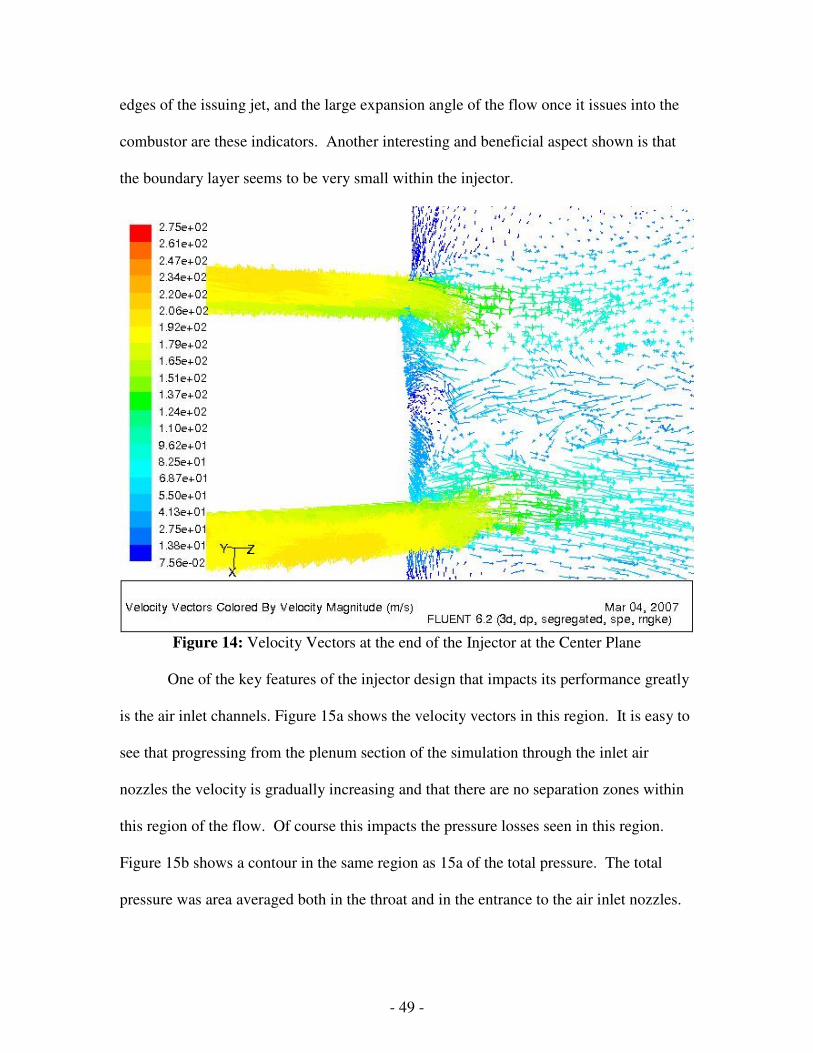
- 49 -
edges of the issuing jet, and the large expansion angle of the flow once it issues into the
combustor are these indicators. Another interesting and beneficial aspect shown is that
the boundary layer seems to be very small within the injector.
Figure 14: Velocity Vectors at the end of the Injector at the Center Plane
One of the key features of the injector design that impacts its performance greatly
is the air inlet channels. Figure 15a shows the velocity vectors in this region. It is easy to
see that progressing from the plenum section of the simulation through the inlet air
nozzles the velocity is gradually increasing and that there are no separation zones within
this region of the flow. Of course this impacts the pressure losses seen in this region.
Figure 15b shows a contour in the same region as 15a of the total pressure. The total
pressure was area averaged both in the throat and in the entrance to the air inlet nozzles.

- 50 -
The resulting pressure loss across this portion of the injector was calculated to be 12.974
kPa, or 13.4% of the total pressure loss across the entire injector that is described below.
Figure 15a: Velocity Vectors at Air Inlets Figure15b: Total Pressure at Air Inlets
5.1.2 Pressure Loss Characteristics
Another important feature of a premixing injector is the low amount of pressure
losses incurred from the device. Figure 16 shows a contour plot of the total pressure.
The contour is oriented on the centerline of the injector with the inlet at the left of the
image and the exit being at the right of the image. There are some interesting features of
the pressure contour. First there are three discrete regions of very similar total pressure.
This indicates that there are two non-friction pressure loss sources. The first of these is
the air entrance region at the upstream area of the mixing annulus. In this region there is
a rapid expansion and mixing between two fluid streams, both which lead to total
pressure losses. As mentioned above pressure loss is calculated across the air inlet region
at 2.04%. The second region of non-friction related total pressure loss is located at the
exit of the injector where the mixed fluid is issued through a sudden expansion.
Although this method of premixing creates a convenient stabilization region, a
consequence is the non-recoverable pressure loss due to the shear layer mixing of the
fluids. There is a 6.8 % total pressure loss across this sudden expansion region. The
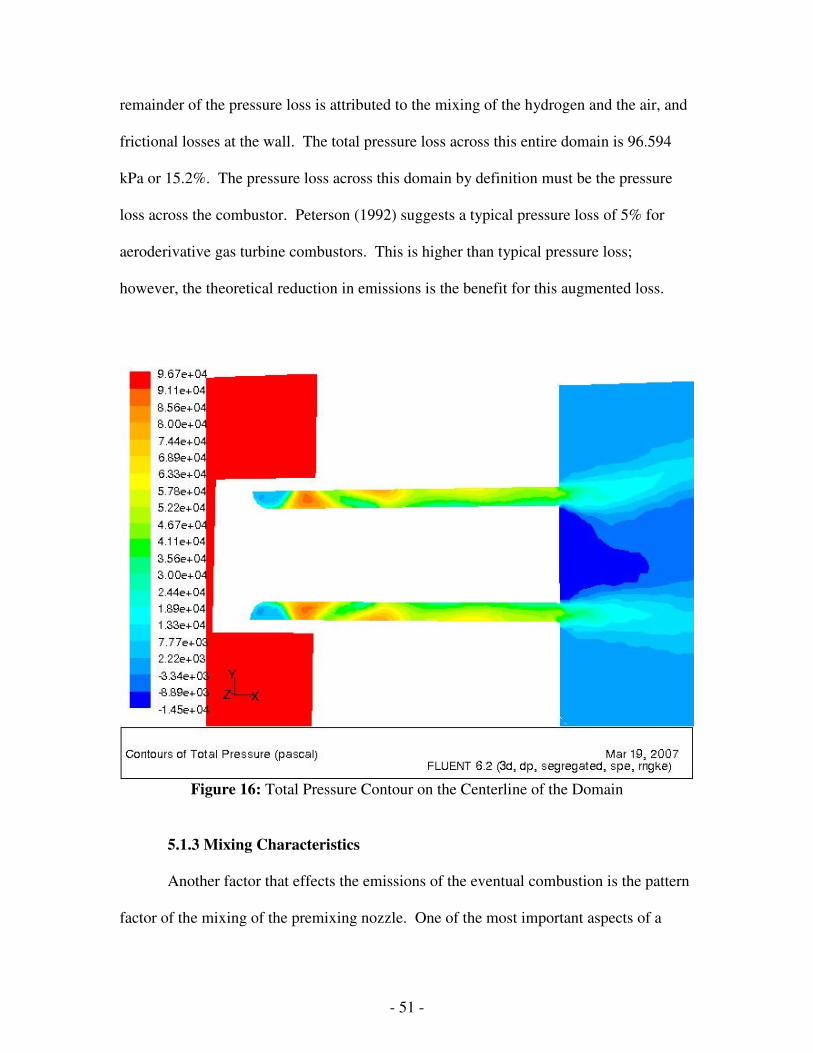
- 51 -
remainder of the pressure loss is attributed to the mixing of the hydrogen and the air, and
frictional losses at the wall. The total pressure loss across this entire domain is 96.594
kPa or 15.2%. The pressure loss across this domain by definition must be the pressure
loss across the combustor. Peterson (1992) suggests a typical pressure loss of 5% for
aeroderivative gas turbine combustors. This is higher than typical pressure loss;
however, the theoretical reduction in emissions is the benefit for this augmented loss.
Figure 16: Total Pressure Contour on the Centerline of the Domain
5.1.3 Mixing Characteristics
Another factor that effects the emissions of the eventual combustion is the pattern
factor of the mixing of the premixing nozzle. One of the most important aspects of a
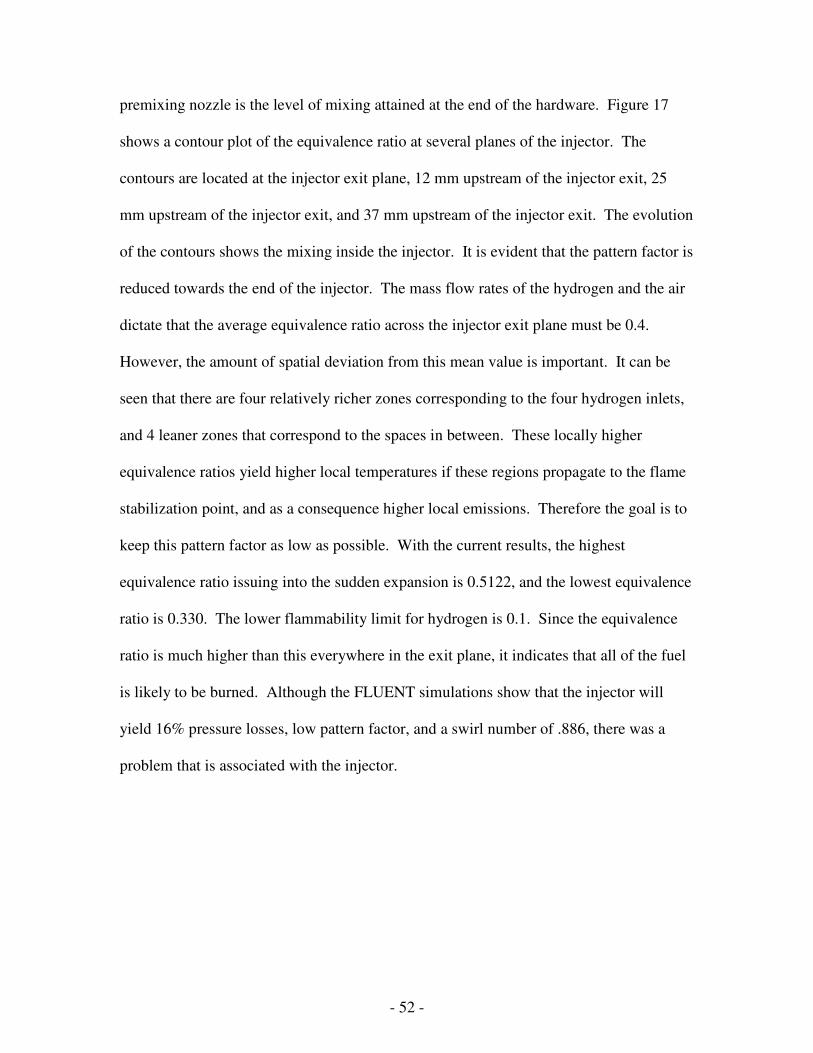
- 52 -
premixing nozzle is the level of mixing attained at the end of the hardware. Figure 17
shows a contour plot of the equivalence ratio at several planes of the injector. The
contours are located at the injector exit plane, 12 mm upstream of the injector exit, 25
mm upstream of the injector exit, and 37 mm upstream of the injector exit. The evolution
of the contours shows the mixing inside the injector. It is evident that the pattern factor is
reduced towards the end of the injector. The mass flow rates of the hydrogen and the air
dictate that the average equivalence ratio across the injector exit plane must be 0.4.
However, the amount of spatial deviation from this mean value is important. It can be
seen that there are four relatively richer zones corresponding to the four hydrogen inlets,
and 4 leaner zones that correspond to the spaces in between. These locally higher
equivalence ratios yield higher local temperatures if these regions propagate to the flame
stabilization point, and as a consequence higher local emissions. Therefore the goal is to
keep this pattern factor as low as possible. With the current results, the highest
equivalence ratio issuing into the sudden expansion is 0.5122, and the lowest equivalence
ratio is 0.330. The lower flammability limit for hydrogen is 0.1. Since the equivalence
ratio is much higher than this everywhere in the exit plane, it indicates that all of the fuel
is likely to be burned. Although the FLUENT simulations show that the injector will
yield 16% pressure losses, low pattern factor, and a swirl number of .886, there was a
problem that is associated with the injector.
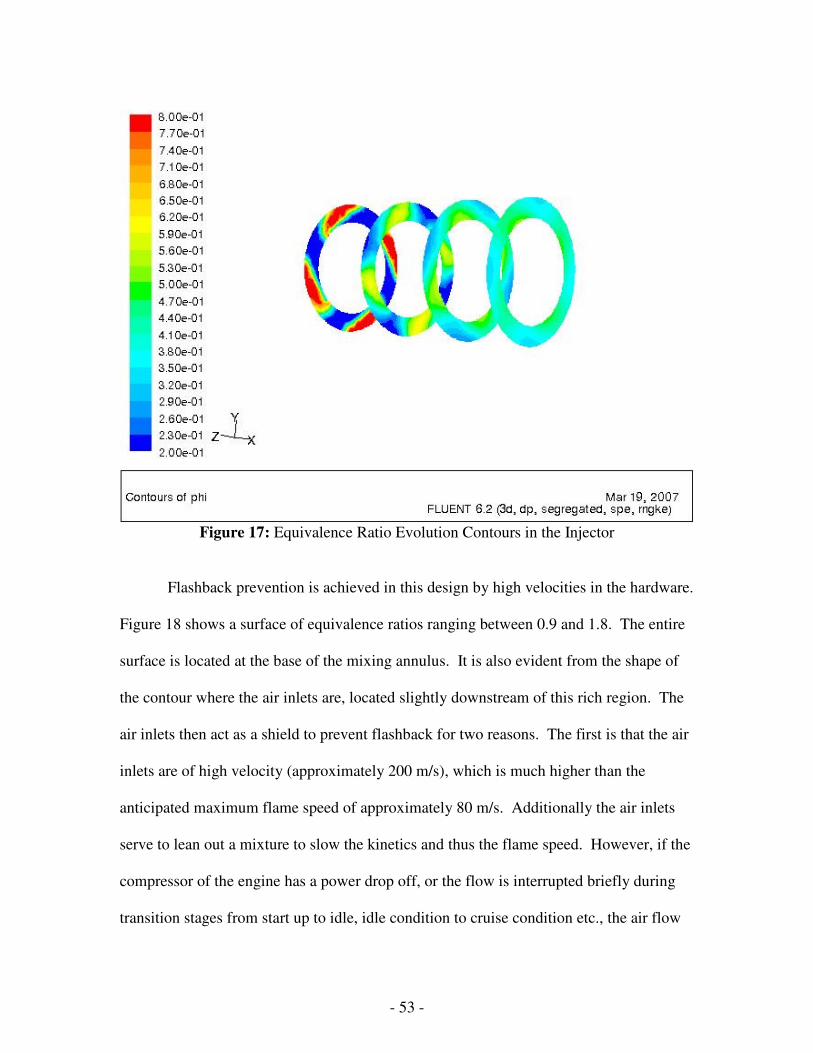
- 53 -
Figure 17: Equivalence Ratio Evolution Contours in the Injector
Flashback prevention is achieved in this design by high velocities in the hardware.
Figure 18 shows a surface of equivalence ratios ranging between 0.9 and 1.8. The entire
surface is located at the base of the mixing annulus. It is also evident from the shape of
the contour where the air inlets are, located slightly downstream of this rich region. The
air inlets then act as a shield to prevent flashback for two reasons. The first is that the air
inlets are of high velocity (approximately 200 m/s), which is much higher than the
anticipated maximum flame speed of approximately 80 m/s. Additionally the air inlets
serve to lean out a mixture to slow the kinetics and thus the flame speed. However, if the
compressor of the engine has a power drop off, or the flow is interrupted briefly during
transition stages from start up to idle, idle condition to cruise condition etc., the air flow

- 54 -
will have a sudden drop off. This will reduce the velocity of the air inlets and thus the
shielding effect is diminished and flashback is possible. Additionally once the air flow
rate recovers, the shielding effect will contain the flame at the base of the injector and not
at the proper stabilization point. This, of course, will cause damage to the injector and
potentially cause thermal failure. Therefore it is an operational challenge to avoid the
sudden interruptions in air flow, or to adjust the fuel flow to compensate for this shielding
effect.
Figure 18: Iso-Contour of high Equivalence Ratios
FLUENT was used as a design tool for the premixing injector. The condition that is most
important with the performance of the injector is at the cruise condition. The FLUENT
results show that the injector has a high swirl number, low pattern factor, axial velocities
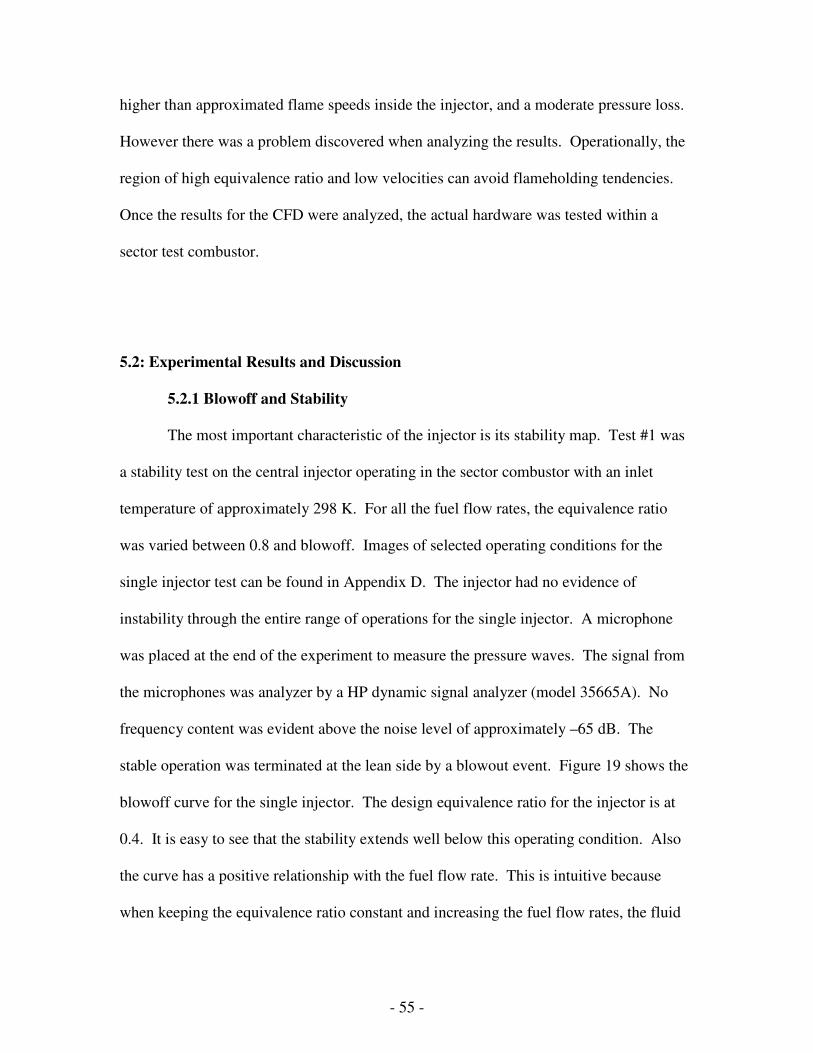
- 55 -
higher than approximated flame speeds inside the injector, and a moderate pressure loss.
However there was a problem discovered when analyzing the results. Operationally, the
region of high equivalence ratio and low velocities can avoid flameholding tendencies.
Once the results for the CFD were analyzed, the actual hardware was tested within a
sector test combustor.
5.2: Experimental Results and Discussion
5.2.1 Blowoff and Stability
The most important characteristic of the injector is its stability map. Test #1 was
a stability test on the central injector operating in the sector combustor with an inlet
temperature of approximately 298 K. For all the fuel flow rates, the equivalence ratio
was varied between 0.8 and blowoff. Images of selected operating conditions for the
single injector test can be found in Appendix D. The injector had no evidence of
instability through the entire range of operations for the single injector. A microphone
was placed at the end of the experiment to measure the pressure waves. The signal from
the microphones was analyzer by a HP dynamic signal analyzer (model 35665A). No
frequency content was evident above the noise level of approximately –65 dB. The
stable operation was terminated at the lean side by a blowout event. Figure 19 shows the
blowoff curve for the single injector. The design equivalence ratio for the injector is at
0.4. It is easy to see that the stability extends well below this operating condition. Also
the curve has a positive relationship with the fuel flow rate. This is intuitive because
when keeping the equivalence ratio constant and increasing the fuel flow rates, the fluid
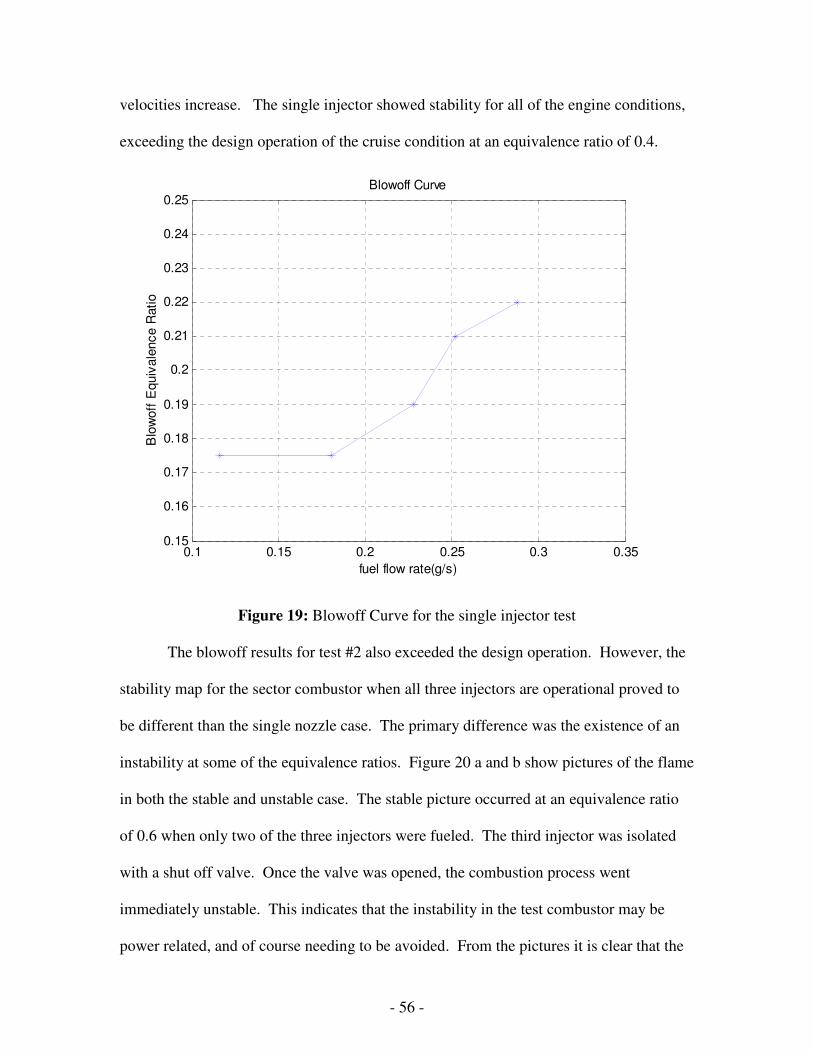
- 56 -
velocities increase. The single injector showed stability for all of the engine conditions,
exceeding the design operation of the cruise condition at an equivalence ratio of 0.4.
0.1 0.15 0.2 0.25 0.3 0.350.15
0.16
0.17
0.18
0.19
0.2
0.21
0.22
0.23
0.24
0.25
fuel flow rate(g/s)
Blo
woff
Equiv
ale
nce R
atio
Blowoff Curve
Figure 19: Blowoff Curve for the single injector test
The blowoff results for test #2 also exceeded the design operation. However, the
stability map for the sector combustor when all three injectors are operational proved to
be different than the single nozzle case. The primary difference was the existence of an
instability at some of the equivalence ratios. Figure 20 a and b show pictures of the flame
in both the stable and unstable case. The stable picture occurred at an equivalence ratio
of 0.6 when only two of the three injectors were fueled. The third injector was isolated
with a shut off valve. Once the valve was opened, the combustion process went
immediately unstable. This indicates that the instability in the test combustor may be
power related, and of course needing to be avoided. From the pictures it is clear that the
- 57 -
stable flame case has a well-defined cone shape, whereas in the unstable case the bluish
region of the flame seems to be vibrating and blurred. Additionally the glow of the
combustor walls is much greater in the unstable case indicating that there is enhance
radiation heating when the flame is unstable. In practice in an engine, this enhanced
radiation heating decreases the lifetime of the combustor liner. It was also measured by a
microphone located near the end of the test section that when the combustion process
went unstable, an approximate 2 kHz tone accompanied it. The tone frequency tended to
drift slightly between 2.0 and 2.3 kHz depending on the test condition. This pressure
oscillation was extremely strong, on average 31 dB above the noise floor. In addition to
the tone itself, the pressure oscillations loosened screws that held the assembly together,
even though the operation time in this mode was severely limited. It is clear that this
mode of instability needs to be avoided in the operation of the combustor.
Figure 20a: Stable Flame Figure 20b: Unstable Flame
With the instability issue in mind, a new procedure was taken to limit the damage
caused by the combustion instability. The stability ranges were tested for in between the
blowoff point and the onset of this instability. The onset of the instability was quantified
- 58 -
as a minimum of a consistent 20 dB above the noise level of the experiment. Figure 21
shows the stability map of test 2 given this new criterion. As suggested earlier the graph
tends to support the theory that the power level of the combustor is a large factor for the
instability. As the combustor power is increased, by increasing the fuel flow rate, the
instability exists at lower equivalence ratios. Additionally the blowoff point rises slightly
when the fuel flow rate is increased for reasons discussed earlier. Thus the stability
envelope of the combustor shrinks from top and bottom with increasing fuel flow rates.
The red star on the graph indicates the design point of the injector. The design point is
near the upper end of the stability envelope, so it is possible to move this point down in
equivalence ratio, but it would have detrimental effects on the pressure loss of the system,
which is a very important metric of a test injector.

- 59 -
Figure 21: Stability Map for the Three Injector Case
5.2.1 Pressure Loss Map and Discussion
After its operational limits are identified, the metrics for the combustor
performance are mixture homogeneity and pressure loss, which have implications on
engine efficiency. This section discusses the findings for the pressure loss for both Test
#1 and Test#2. Figure 22 shows a 3-d surface plot of the fuel mass flow rate in g/s,
equivalence ratio, and pressure drop across the injector in kPa for Test#1. The point that
is the black asterisk is the design point of the injector at the scaled fuel flow rate of .2522
g/s and an equivalence ratio of 0.4. At this point there is a pressure loss of 17.8 kPa. The
surface shows that with a decrease in equivalence ratio, or a increase in fuel flow rate at
the same equivalence ratio yields a higher pressure drop. This is intuitive because in both
Design Point
Stable Region
Unstable Region
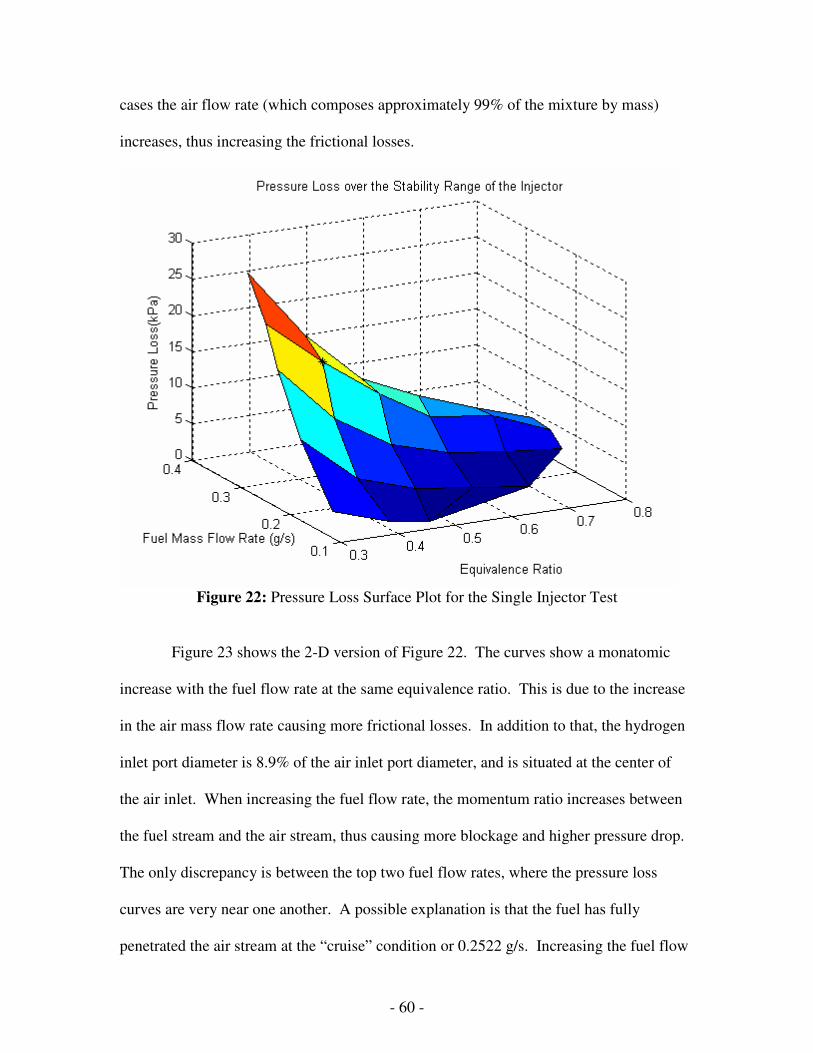
- 60 -
cases the air flow rate (which composes approximately 99% of the mixture by mass)
increases, thus increasing the frictional losses.
Figure 22: Pressure Loss Surface Plot for the Single Injector Test
Figure 23 shows the 2-D version of Figure 22. The curves show a monatomic
increase with the fuel flow rate at the same equivalence ratio. This is due to the increase
in the air mass flow rate causing more frictional losses. In addition to that, the hydrogen
inlet port diameter is 8.9% of the air inlet port diameter, and is situated at the center of
the air inlet. When increasing the fuel flow rate, the momentum ratio increases between
the fuel stream and the air stream, thus causing more blockage and higher pressure drop.
The only discrepancy is between the top two fuel flow rates, where the pressure loss
curves are very near one another. A possible explanation is that the fuel has fully
penetrated the air stream at the “cruise” condition or 0.2522 g/s. Increasing the fuel flow
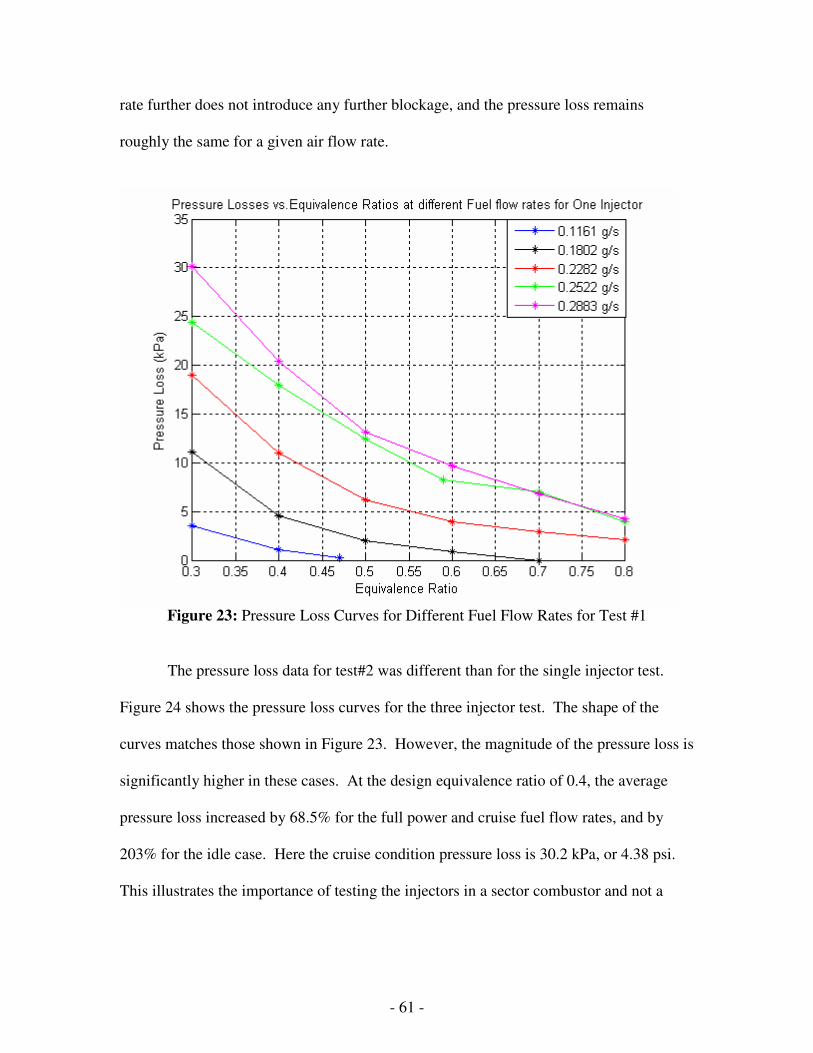
- 61 -
rate further does not introduce any further blockage, and the pressure loss remains
roughly the same for a given air flow rate.
Figure 23: Pressure Loss Curves for Different Fuel Flow Rates for Test #1
The pressure loss data for test#2 was different than for the single injector test.
Figure 24 shows the pressure loss curves for the three injector test. The shape of the
curves matches those shown in Figure 23. However, the magnitude of the pressure loss is
significantly higher in these cases. At the design equivalence ratio of 0.4, the average
pressure loss increased by 68.5% for the full power and cruise fuel flow rates, and by
203% for the idle case. Here the cruise condition pressure loss is 30.2 kPa, or 4.38 psi.
This illustrates the importance of testing the injectors in a sector combustor and not a

- 62 -
simple can combustor. The pressure losses are very misleading when only looking at a
single injector.
Figure 24: Pressure Loss Curves for the Three Injector Test
5.2.3 NO Emissions Map and Discussion
Even though the pressure drop across the injectors is relatively high when
compared with the industry standard of 10%, which corresponds to 10.1 kPa, the
emissions of NOx and more specifically NO were well within limits. NOx is primarily
consisted of NO and NO2. Throughout all of the tests, the measurements of NO2 were
either zero or negligible compared to the emissions of NO. Therefore, the emissions of
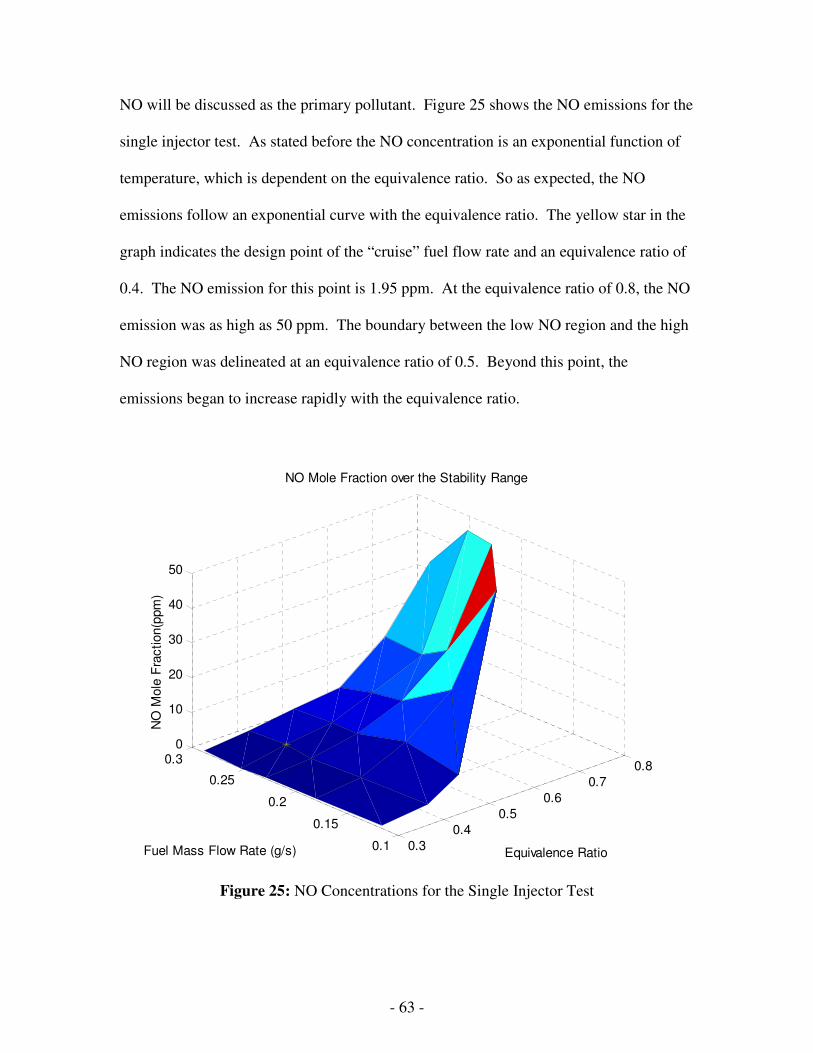
- 63 -
NO will be discussed as the primary pollutant. Figure 25 shows the NO emissions for the
single injector test. As stated before the NO concentration is an exponential function of
temperature, which is dependent on the equivalence ratio. So as expected, the NO
emissions follow an exponential curve with the equivalence ratio. The yellow star in the
graph indicates the design point of the “cruise” fuel flow rate and an equivalence ratio of
0.4. The NO emission for this point is 1.95 ppm. At the equivalence ratio of 0.8, the NO
emission was as high as 50 ppm. The boundary between the low NO region and the high
NO region was delineated at an equivalence ratio of 0.5. Beyond this point, the
emissions began to increase rapidly with the equivalence ratio.
0.3
0.4
0.5
0.6
0.7
0.8
0.1
0.15
0.2
0.25
0.30
10
20
30
40
50
Equivalence Ratio
NO Mole Fraction over the Stability Range
Fuel Mass Flow Rate (g/s)
NO
Mole
Fra
ction(p
pm
)
Figure 25: NO Concentrations for the Single Injector Test

- 64 -
To get different kind of information out of the emissions data, it was plotted while
being segregated by fuel flow rate. Figure 26 shows the graph of NO emissions versus
equivalence ratio for the different fuel flow rates for the single injector test. All of the
fuel flow rates resulted in very low emissions of NO for equivalence ratios less than 0.5.
However, at the higher equivalence ratios, the different fuel flow rates began to show a
trend. As the fuel flow rate increases for a given equivalence ratio, the emissions
decrease. As stated above, one explanation is that when increasing the fuel flow rate, the
penetration of the fuel jet into the air crossflow increases. This causes extra blockage for
the air yielding in higher pressure losses, but also disperses the fuel into a greater area.
This causes better mixing. The better mixing reduces the number and severity of hot
spots. The reduction in hot spots reduces the overall NO concentration of the exhaust.
For example, at the equivalence ratio of 0.7, increasing the fuel flow rate from 0.18 g/s to
0.25 g/s yields a NO reduction of 63.8%. So the figure below is more evidence of the
momentum ratio/penetration explanation of the performance of the injector.
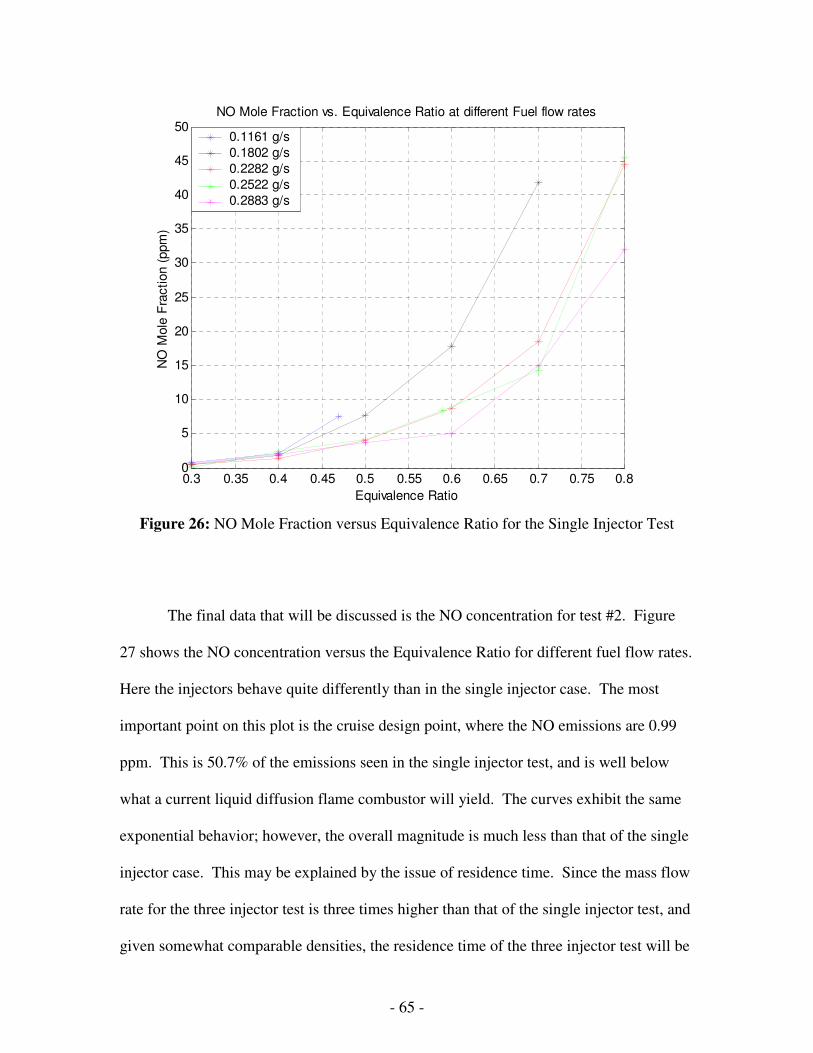
- 65 -
0.3 0.35 0.4 0.45 0.5 0.55 0.6 0.65 0.7 0.75 0.80
5
10
15
20
25
30
35
40
45
50
Equivalence Ratio
NO
Mole
Fra
ction (
ppm
)
NO Mole Fraction vs. Equivalence Ratio at different Fuel flow rates
0.1161 g/s
0.1802 g/s
0.2282 g/s
0.2522 g/s
0.2883 g/s
Figure 26: NO Mole Fraction versus Equivalence Ratio for the Single Injector Test
The final data that will be discussed is the NO concentration for test #2. Figure
27 shows the NO concentration versus the Equivalence Ratio for different fuel flow rates.
Here the injectors behave quite differently than in the single injector case. The most
important point on this plot is the cruise design point, where the NO emissions are 0.99
ppm. This is 50.7% of the emissions seen in the single injector test, and is well below
what a current liquid diffusion flame combustor will yield. The curves exhibit the same
exponential behavior; however, the overall magnitude is much less than that of the single
injector case. This may be explained by the issue of residence time. Since the mass flow
rate for the three injector test is three times higher than that of the single injector test, and
given somewhat comparable densities, the residence time of the three injector test will be
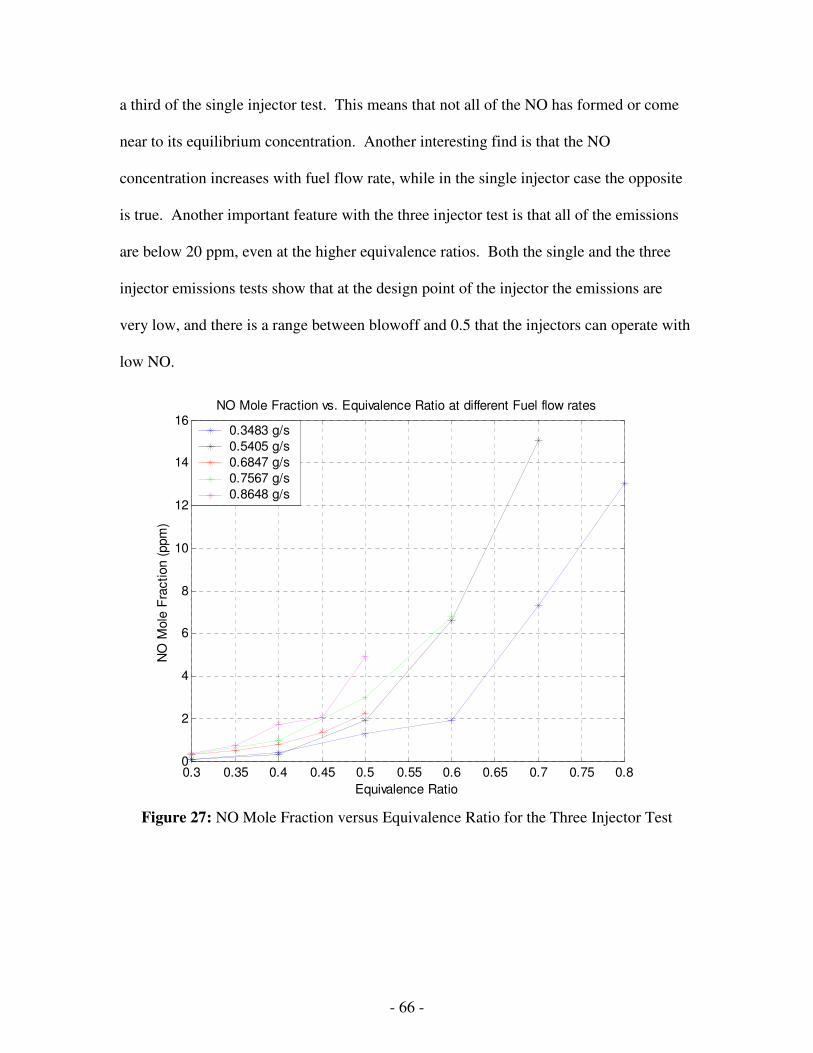
- 66 -
a third of the single injector test. This means that not all of the NO has formed or come
near to its equilibrium concentration. Another interesting find is that the NO
concentration increases with fuel flow rate, while in the single injector case the opposite
is true. Another important feature with the three injector test is that all of the emissions
are below 20 ppm, even at the higher equivalence ratios. Both the single and the three
injector emissions tests show that at the design point of the injector the emissions are
very low, and there is a range between blowoff and 0.5 that the injectors can operate with
low NO.
0.3 0.35 0.4 0.45 0.5 0.55 0.6 0.65 0.7 0.75 0.80
2
4
6
8
10
12
14
16
Equivalence Ratio
NO
Mole
Fra
ction (
ppm
)
NO Mole Fraction vs. Equivalence Ratio at different Fuel flow rates
0.3483 g/s
0.5405 g/s
0.6847 g/s
0.7567 g/s
0.8648 g/s
Figure 27: NO Mole Fraction versus Equivalence Ratio for the Three Injector Test
- 67 -
5.2.4 Summary of the Experimental Results
The goal of the reported study was to measure the performance of the injectors by
measuring them while operating individually and in a three injector operation mode in the
sector combustor. From the previous sections of this chapter it can be seen that the
injectors stability range extends well below the design point of .2522 g/s of fuel and an
equivalence ratio of 0.4. Also there is an instability with a frequency of approximately 2
kHz that is present which limits the safe operation of the injectors and forces the
operation below an equivalence ratio of 0.5. The pressure loss data shows a large
difference between operating a single injector, and operating three injectors. The
pressure drop is 17.8 kPa for the single injector, and 30.2 kPa for the three injector case
for the design condition. Both of these are much higher than that of the upper limit of the
industry standard of 10%, or 10.1 kPa. However, with the increased pressure loss, the
mixing was also enhanced, which is evidenced by the emissions data. For the design
condition, the NO emissions for the single injector was 1.95 ppm, and for the three
injectors it was slightly lower at 0.99 ppm. Both of these values are well below the target
for the combustor.
- 68 -
Chapter 6: Conclusions and Future Work
6.1: Conclusions
The goal of this study was to design and test the performance of a premixing
swirl-based injector which utilizes tangential entry. The performance needed was based
on the energy and emissions requirements of the combustor of a PT6-20. FLUENT
simulations were done on the geometry as a design tool. The results from the simulations
showed that the injector design itself had good mixing, a fairly large pressure drop of
16%, and a high degree of swirl, with a swirl number of 0.886. All of these qualities
were confirmed by the single injector tests in the sector combustor that was designed.
The loss coefficient is defined as
2
21 V
P
ρξ
∆=
where ∆P is the total pressure loss, ρ is the density of the fluid, and V is the velocity of
the fluid at the exit plane of the injector. The experimental results for the single injector
converged at a value of 2.9 for Reynolds numbers increasing past 20,000. If this
correlation is used, the pressure loss at the engine condition is 18.2%. This agrees well
with the simulation and gives validity to the simulation as a whole.
The experimental tests were split into two configurations. One with only one
injector having air and fuel through it, and the other with all three with air and fuel
flowing through them. The results are very different between these two configurations.
Table 5 summarizes the important results. The pressure drop is 69.7% higher with three
injectors than with one, even though the flow per injector remains constant. One
explanation could be a separation problem in the plenum section of the combustor due to
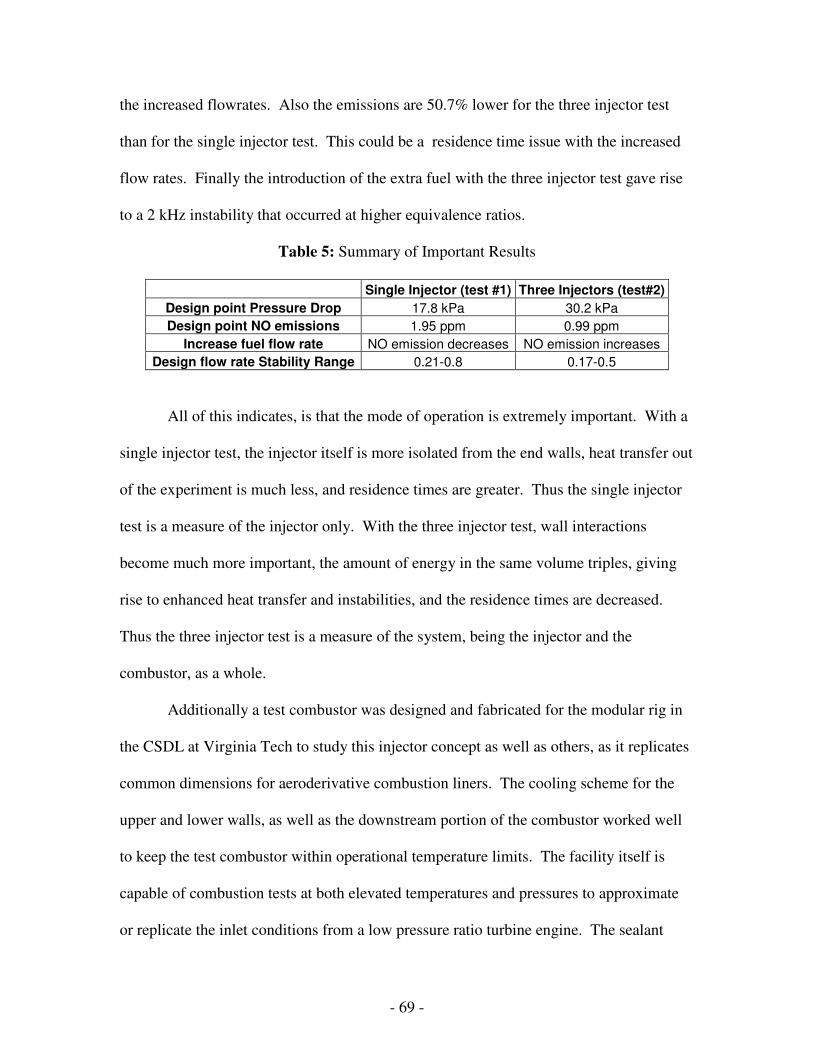
- 69 -
the increased flowrates. Also the emissions are 50.7% lower for the three injector test
than for the single injector test. This could be a residence time issue with the increased
flow rates. Finally the introduction of the extra fuel with the three injector test gave rise
to a 2 kHz instability that occurred at higher equivalence ratios.
Table 5: Summary of Important Results
Single Injector (test #1) Three Injectors (test#2)
Design point Pressure Drop 17.8 kPa 30.2 kPa
Design point NO emissions 1.95 ppm 0.99 ppm
Increase fuel flow rate NO emission decreases NO emission increases
Design flow rate Stability Range 0.21-0.8 0.17-0.5
All of this indicates, is that the mode of operation is extremely important. With a
single injector test, the injector itself is more isolated from the end walls, heat transfer out
of the experiment is much less, and residence times are greater. Thus the single injector
test is a measure of the injector only. With the three injector test, wall interactions
become much more important, the amount of energy in the same volume triples, giving
rise to enhanced heat transfer and instabilities, and the residence times are decreased.
Thus the three injector test is a measure of the system, being the injector and the
combustor, as a whole.
Additionally a test combustor was designed and fabricated for the modular rig in
the CSDL at Virginia Tech to study this injector concept as well as others, as it replicates
common dimensions for aeroderivative combustion liners. The cooling scheme for the
upper and lower walls, as well as the downstream portion of the combustor worked well
to keep the test combustor within operational temperature limits. The facility itself is
capable of combustion tests at both elevated temperatures and pressures to approximate
or replicate the inlet conditions from a low pressure ratio turbine engine. The sealant
- 70 -
scheme work well with the fiberglass insulation and the fitted grooves, making the test
combustor have easy maintenance.
The essence of the research is to answer the simple question of whether or not the
injector will operate given the conditions of a PT6-20 turboprop. As stated before the
pressure drop is higher than the industry standard, but its stability range extends well past
the design point of 0.4 and the emissions levels of 1.95 and 0.99 ppm measured for both
cases compare very favorable to the values measured previously of 25 ppm at the cruise
condition. The excessive pressure drop will dictate the modifications necessary in the
combustion liner to ensure the correct amount of air flow enters the injector, and the
correct amount is routed through the cooling passages of the liner. Also, the
manufacturing of the injectors and the maintenance required for the injectors is done
easily with the injector design, because the injector is easily split and cleaned.
6.1: Future Work and Recommendations
The current work focused on the atmospheric testing of one and three injector
combinations with ambient inlet air temperature. It was discovered that there is vast
differences when testing either one or three injectors. However, this has not been
extended to alternate inlet temperatures and pressures. Therefore, the next area of
research would be to vary these parameters with the current injector model, to see the
effect of the stability map, pressure loss, instability strength and frequency, and emissions
measurements. A design metric was not investigated in the present study, which is
known as the combustion efficiency. This calculation is important when considering the
integration of the combustor into the engine, and should be calculated in future testing of
- 71 -
the injector. Also the investigation of the instability to determine the sources and
possible solutions is also a worthwhile study. The final portion of extended work would
be to test similar geometries, but with different characteristics such has swirl number and
velocities. This would find the optimum for reducing the high pressure loss, and yielding
little with the NO emissions success and stability success.
The air inlet passages were made specifically small to help with mixing of the fuel
and the air at the expense of the pressure loss. Also the air inlets were positioned to give
a large amount of swirl to the mixing flow within the annulus. Two of the problems
associated with the injector are that the pressure loss is too high, and the high degree of
swirl shapes the flame such that it thermally loads the sidewalls extensively. One of the
possible design changes would be to sacrifice the degree of mixing and swirl by lessening
the angle of the air inlets, and also making the air inlets larger. Another area to help
solve the excessive pressure loss would be to eliminate the sudden expansion at the
upstream end of the injector. The air inlets could be guided into four helical independent
passages inside of the injector instead of the mixing occurring in a complete annulus.
CNC fabrication or investment casting would be required for such a modification.
The test combustor handles the thermal loading very well except for the hastelloy
X sidewalls. One recommendation would be a slight redesign of the combustor to
incorporate cooling specifically on the hastelloy X pieces to lengthen the life of the
combustor. The combustor was also designed for optical measurements. A further
avenue of both studying the stable and unstable flames would be to incorporate a
measurement technique such as PLIF to get a phase locked measurement of the flame in

- 72 -
the different phases of a stable and unstable flame. This could yield understanding of the
instability mechanism and possible solutions.
- 73 -
References:
[1] Ziemann, J., Shum, F., Moore, M., Kluyskens, D., Thomaier, D., Zarzalis, N., and
Eberius, H., 1998, “Low-NOx Combustors for Hydrogen Fueled Aero Engine,”
International Journal of Hydrogen Energy, Vol.23, No. 4, pp.281-288.
[2] Turns, S. R., An Introduction to Combustion: Concepts and Applications, 2nd ed.,
McGraw-Hill, Singapore, 2000.
[3] Powers, B., et al., 1999, “Cost Analysis of NOx Control Alternatives for
Stationary Gas Turbines”, Final Report Prepared for the US Department of
Energy: Environmental Programs, May 3 1999.
[4] Rizk, N. and Mongia, H., 1991, “Low NOx Rich-Lean Combustion Concept
Application,” (AIAA-91-1962) 27th AIAA/SAE/ASME Joint Propulsion
Conference, Sacramento, California, 1991.
[5] Lefebvre, A. H., Gas Turbine Combustion, 2nd ed., Taylor and Francis,
Philadelphia, PA, 1999.
[6] Lovett, J., Mick, W., 1995, “Development of a Swirl and Bluff-Body Stabilized
Burner for a Low-NOx, Lean-Premixed Combustion,” Proceedings from
International Gas Turbine and Aeroengine Congress and Exposition. June 1995.
ASME paper No. 95-GT-166.
[7] Gupta, A. K., Siwrl Flows, Abacus Press, Cambridge, Massachusetts, 1984.
[8] McVey, J., Padget, F., Rosfjord, T., Hu, A., Perracchio, A., Schlein, B., Tegel, D.,
1993, “Evaluation of Low-NOx Combustor Concepts for Aeroderivative Gas
Turbine Engines,” Journal of Engineering for Gas Turbines and Power, Vol. 115,
pp. 581-587.
[9] Ren,J., Qin, W., Egolfopolous, F., Tsotsis, T., 2001, “Strain-Rate Effects on
Hydrogen-Enhanced Lean Premixed Combustion,” Combustion and Flame, Vol.
124, No. 4, pp. 717 720.
[10] Ducruix, S., et al., 2003, “Combustion Dynamics and Instabilities: Elementary
Coupling and Driving Mechanisms,” Journal of Propulsion and Power, Vol. 19,
No. 5, pp.722-734.
[11] Culick, F., “Combustion Instabilities: Mating Dance of Chemical, Combustion,
and Combustor Dynamics,” (AIAA-2000-3178) 36th AIAA/ASME/SAE/ASEE
Joint Propulsion Conference and Exhibit, Huntsville, Alabama, 2000.
- 74 -
[12] Zelina, J., Cardenas, M., Tomondi, C., Penko, P., 1998, “Low-Emissions Gas
Turbine Combustor Development Using Sector and Full Annular Rigs,”
Proceedings from 34th
AIAA/ASME/SAE/ASEE Joint Propulsion Conference and
Exhibit. July 1998. AIAA paper No. 98-3528.
[13] Carl, M. et al., 2001, “Experimental and Numerical Investigation of a Planar
Combustor Sector at Realistic Operating Conditions,” Journal of Engineering for
Gas Turbines and Power, Vol.123, No.10, pp. 810-816.
[14] Kurosawa, Y. et al., “Structure of Swirler Flame in Gas Turbine Combustor,”
Fifteenth International Symposium on Air Breathing Engines, Bangalore, India,
2001.
[15] Drell, L. and Belles, F., 1957, “Survey of Hydrogen Combustion Properties,”
Research Memorandum for the National Advisory Committee for Aeronautics,
Washington, July 26, 1957.
[16] Lipatnikov, A. and Chomiak, J., 2002, “Turbulent Flame Speed and Thickness:
Phenomenology, Evaluation, and Application in Multi-Dimensional Simulations,”
Progress in Energy and Combustion Science, Vol. 28, No. 1, pp.1-74.
[17] Kido, H., Nakahara, M., Nakashima, K., 2003, “A Study on Premixed Turbulent
Combustion of Hydrogen including Hydrocarbon,” Proceedings from 39th
AIAA/ASME/SAE/ASEE Joint Propulsion Conference and Exhibit. July 2003.
AIAA paper No. 2003-4638.
[18] Lilley, D., 1977, “Swirl Flows in Combustion: A Review,” AIAA Journal, Vol.15,
No.8, pp. 1063-1078.
[19] Varatharajan, B. et al., “Hydrogen Combustion for Gas-Turbine Combustor
Applications – Experiments,” Joint Meeting of the US Sections of the
Combustion Institute, Drexel University, 2005.
[20] Du Bell, T.L., 1971, “Carbon Eliminating and Cooling Improvement to Scroll
Type Combustors,” U.S. Patent #3,605,405.
[21] Hu, A.S., 1995, “Premix Gas Nozzle,” U.S. Patent #5,402,633.
[22] Bulter, A. S., and Madden, T. J., 1997, “Low NOx Fuel Nozzle Assembly,” U.S.
Patent #5,671,597.
[23] Joos, F., 1997, “Gas Operating Premixing Burner for Gas Turbine,” U.S. Patent
#5,699,667.
[24] Snyder, T.et al., “Emissions and Performance of a Lean-Premixed Gas Fuel
Injection System for Aeroderivative Gas Turbine Engines,” International Gas
Turbine and Aeroengine Congress and Exposition, June 1994.
- 75 -
[25] Sattelmayer, T., Felchlin, M. P., Haumann, J., Hellat, J., and Styner, D., 1992,
“Second Generation Low Emissions Combustors for ABB Gas Turbines: Burner
Development and Tests at Atmospheric Pressure,” Journal of Engineering for Gas
Turbines and Power, Vol. 114, pp.118-125.
[26] Escudier, M. and Keller, J., 1985, “Recirculation in Swirling Flow: A
Manifestation of Vortex Breakdown,” AIAA Journal, Vol.23, No.1, pp. 111-116.
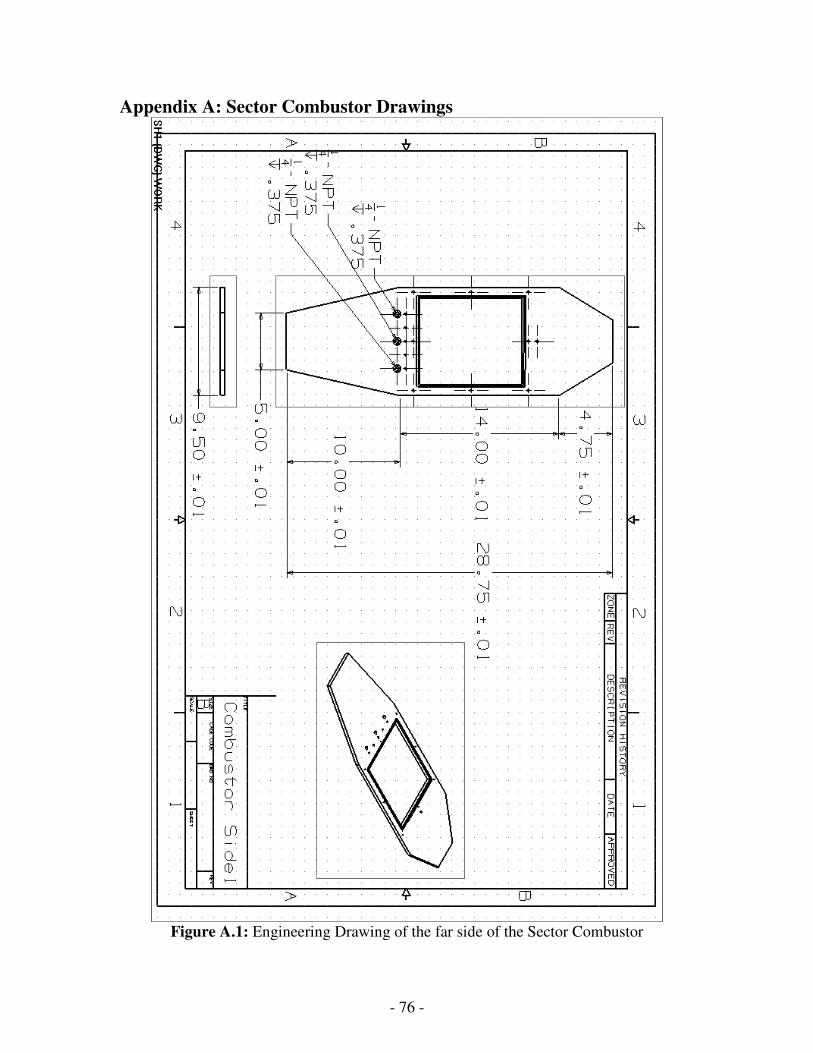
- 76 -
Appendix A: Sector Combustor Drawings
Figure A.1: Engineering Drawing of the far side of the Sector Combustor
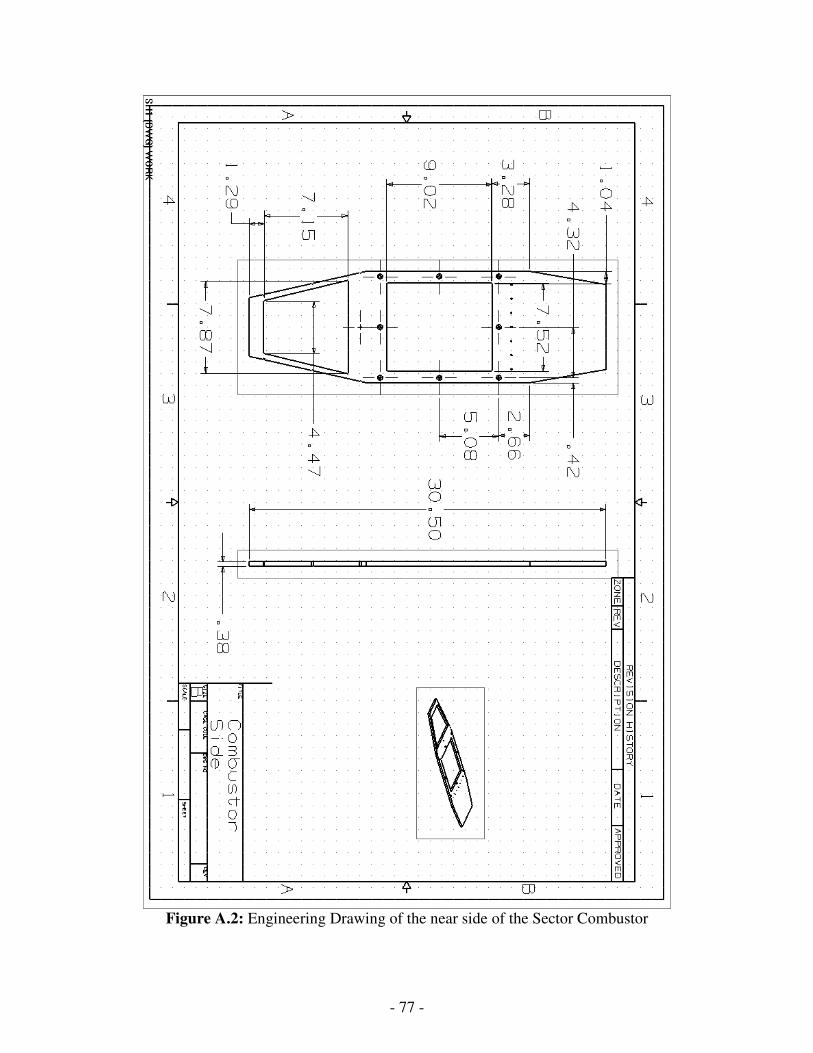
- 77 -
Figure A.2: Engineering Drawing of the near side of the Sector Combustor

- 78 -
Figure A.3: Engineering Drawing of the top of the Sector Combustor
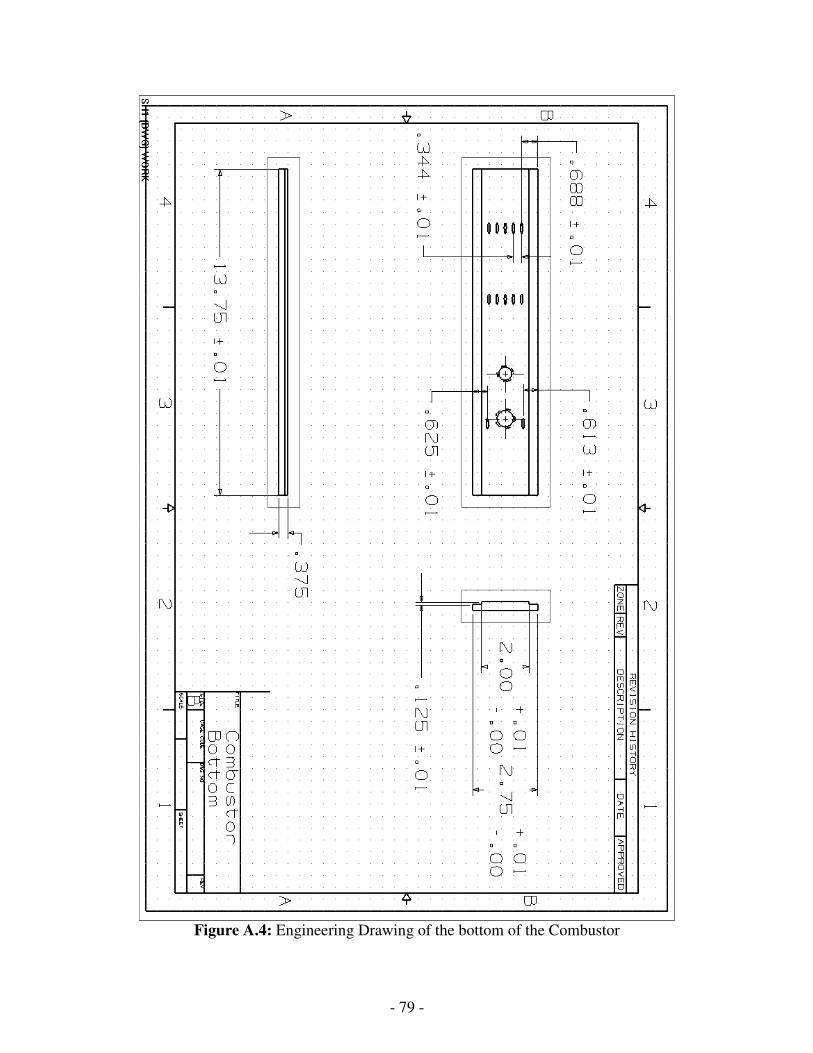
- 79 -
Figure A.4: Engineering Drawing of the bottom of the Combustor

- 80 -
Figure A.5: Pictoral View of the Sector Combustor Welded together
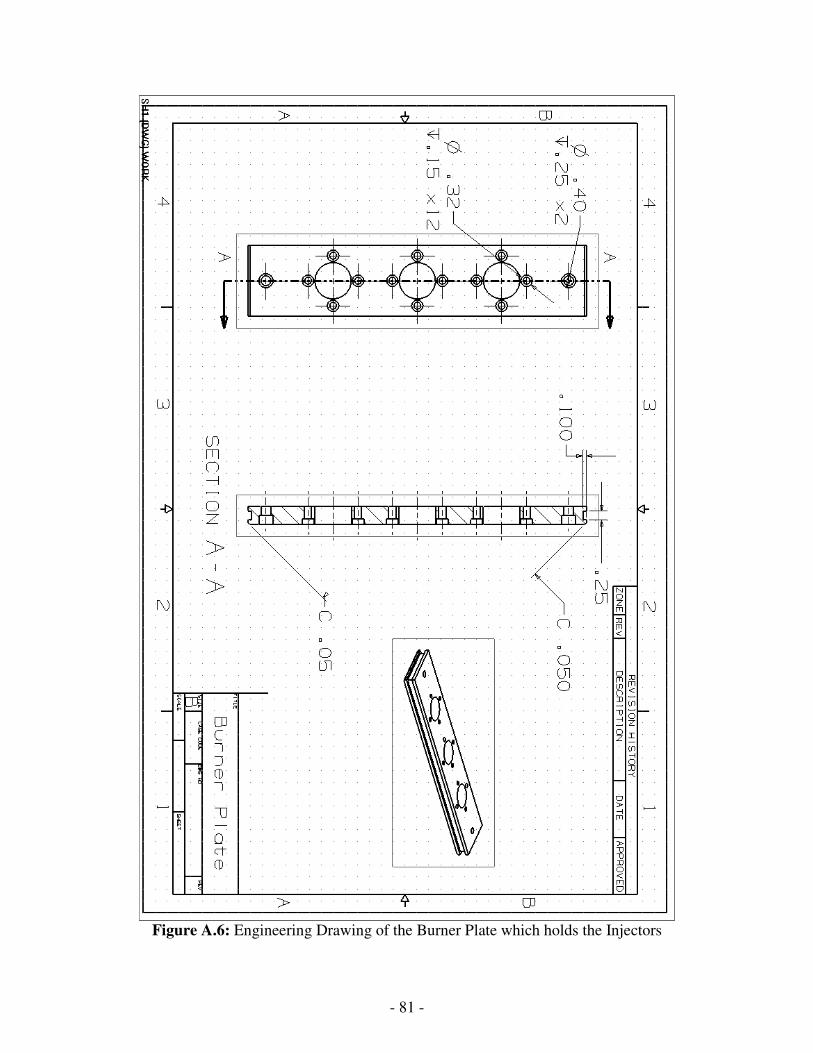
- 81 -
Figure A.6: Engineering Drawing of the Burner Plate which holds the Injectors
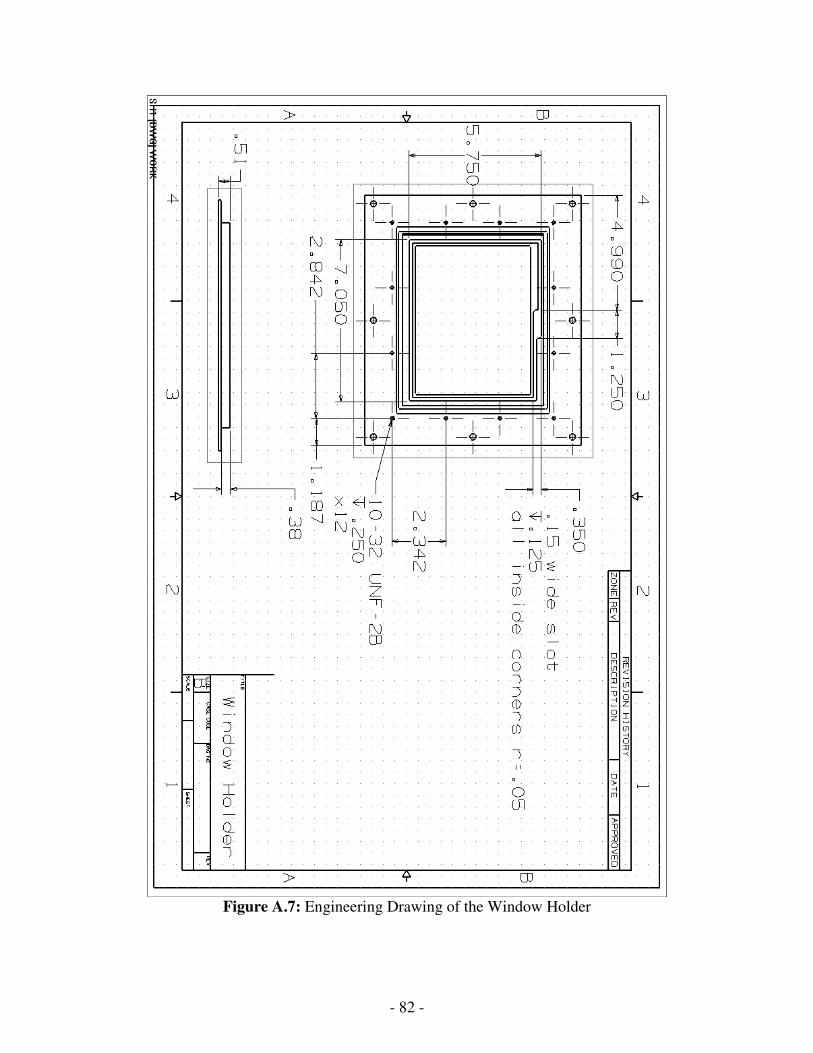
- 82 -
Figure A.7: Engineering Drawing of the Window Holder
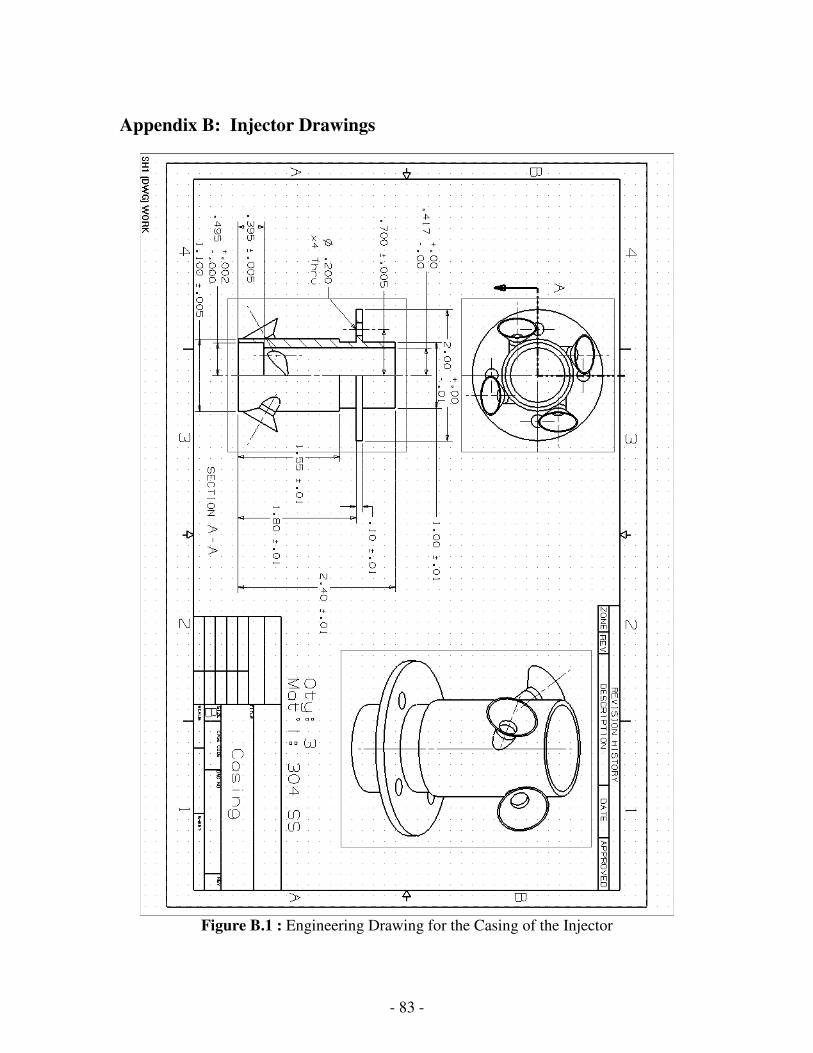
- 83 -
Appendix B: Injector Drawings
Figure B.1 : Engineering Drawing for the Casing of the Injector
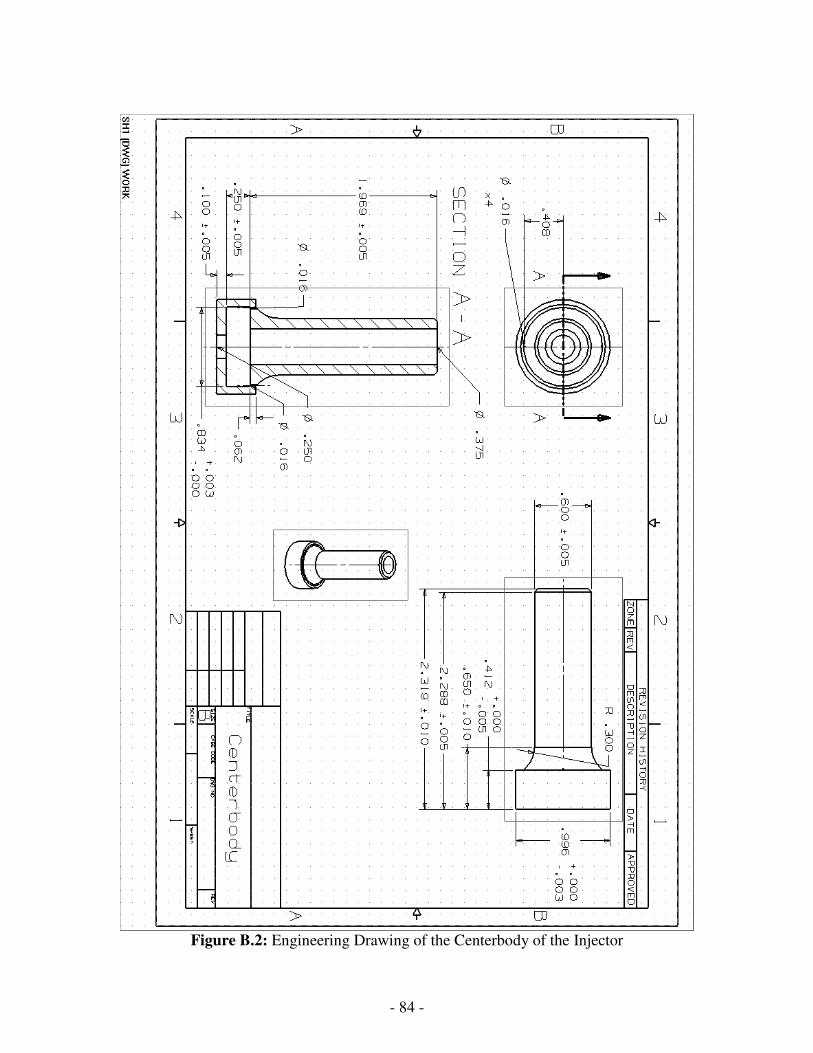
- 84 -
Figure B.2: Engineering Drawing of the Centerbody of the Injector
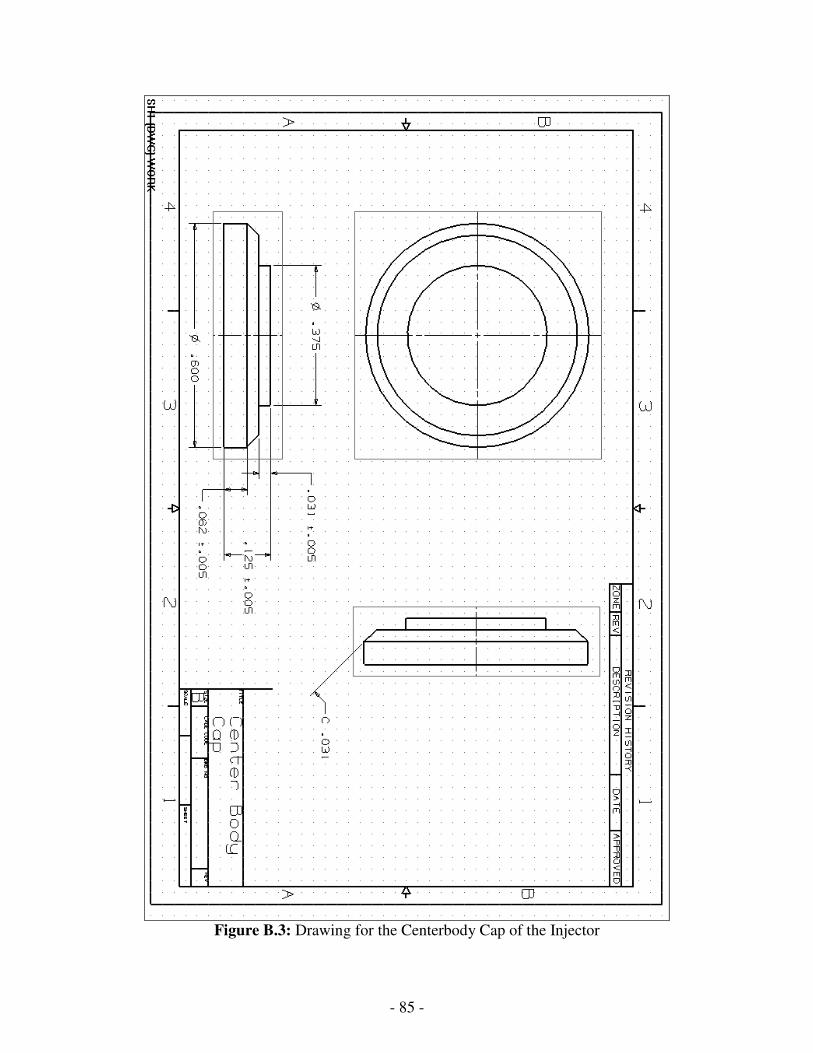
- 85 -
Figure B.3: Drawing for the Centerbody Cap of the Injector
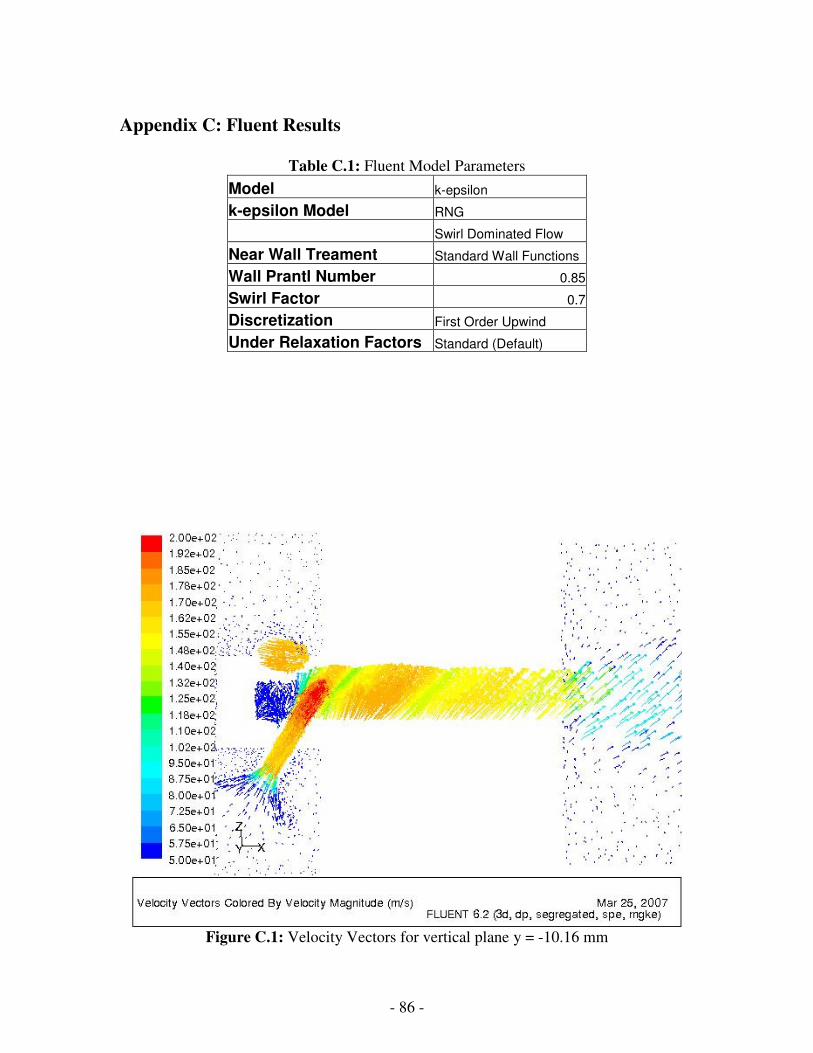
- 86 -
Appendix C: Fluent Results
Table C.1: Fluent Model Parameters
Model k-epsilon
k-epsilon Model RNG
Swirl Dominated Flow
Near Wall Treament Standard Wall Functions
Wall Prantl Number 0.85
Swirl Factor 0.7
Discretization First Order Upwind
Under Relaxation Factors Standard (Default)
Figure C.1: Velocity Vectors for vertical plane y = -10.16 mm
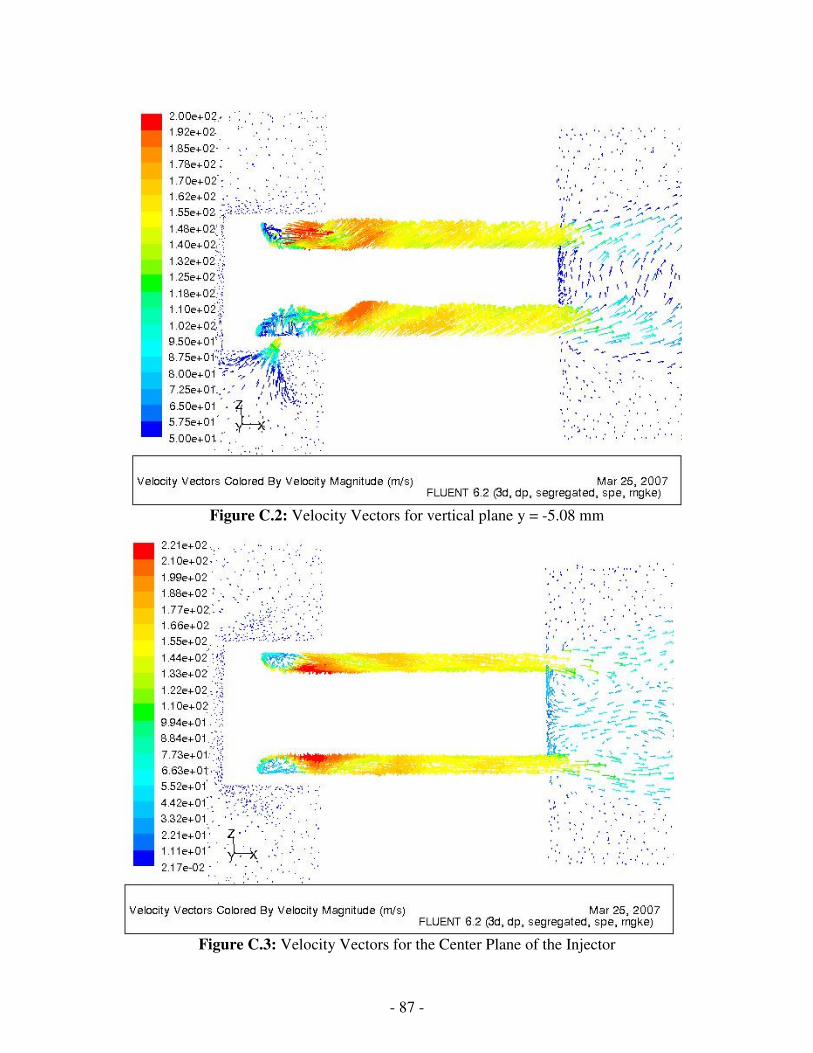
- 87 -
Figure C.2: Velocity Vectors for vertical plane y = -5.08 mm
Figure C.3: Velocity Vectors for the Center Plane of the Injector
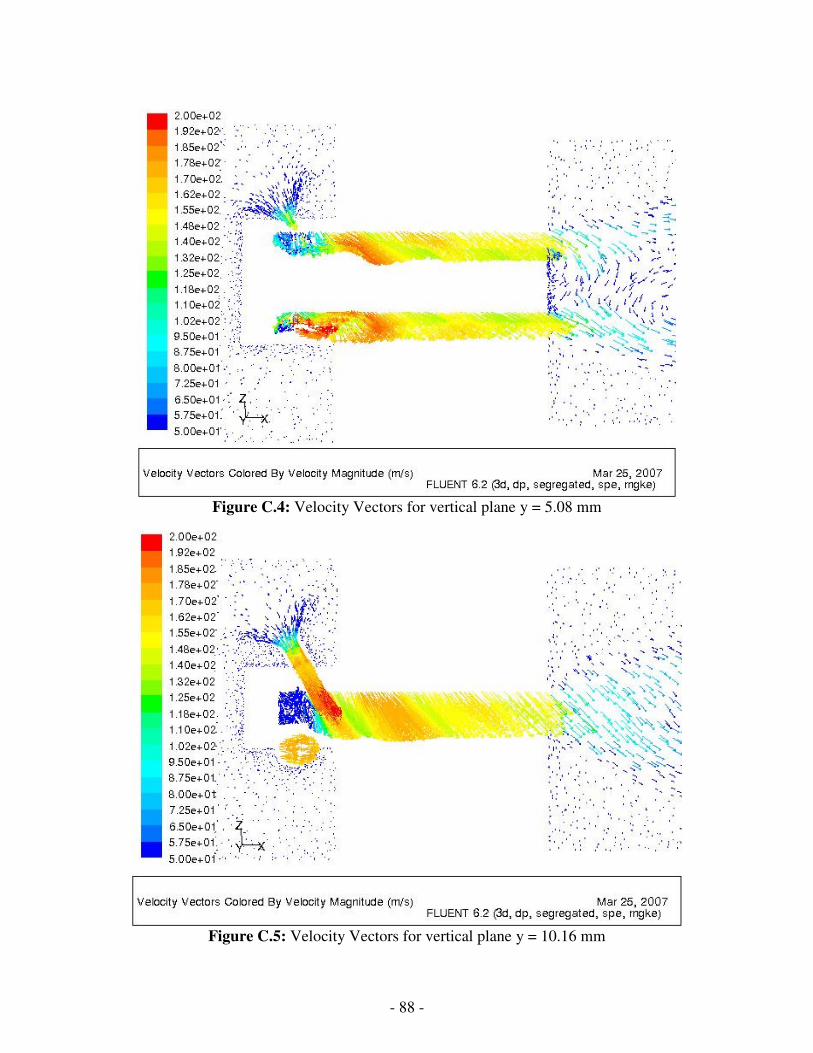
- 88 -
Figure C.4: Velocity Vectors for vertical plane y = 5.08 mm
Figure C.5: Velocity Vectors for vertical plane y = 10.16 mm

- 89 -
Figure C.6: Equivalence Ratio Contour for the Plane y = -10.16 mm
Figure C.7: Equivalence Ratio Contour for the Plane y = -5.08 mm
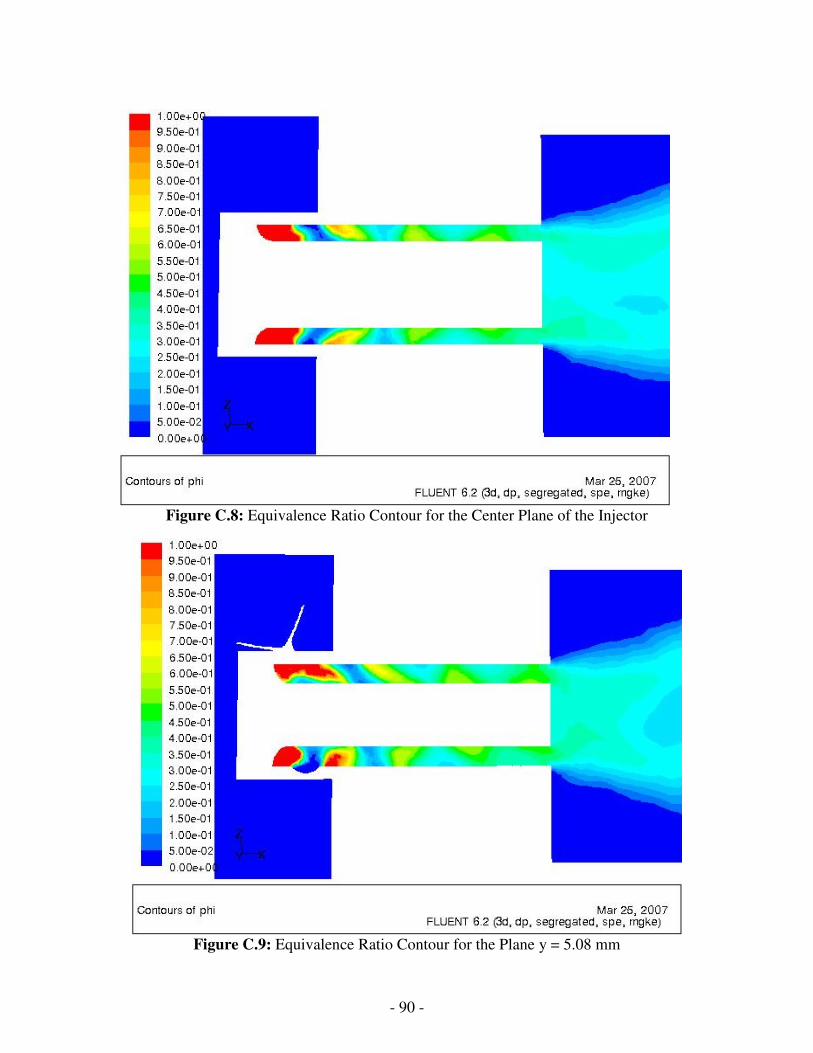
- 90 -
Figure C.8: Equivalence Ratio Contour for the Center Plane of the Injector
Figure C.9: Equivalence Ratio Contour for the Plane y = 5.08 mm
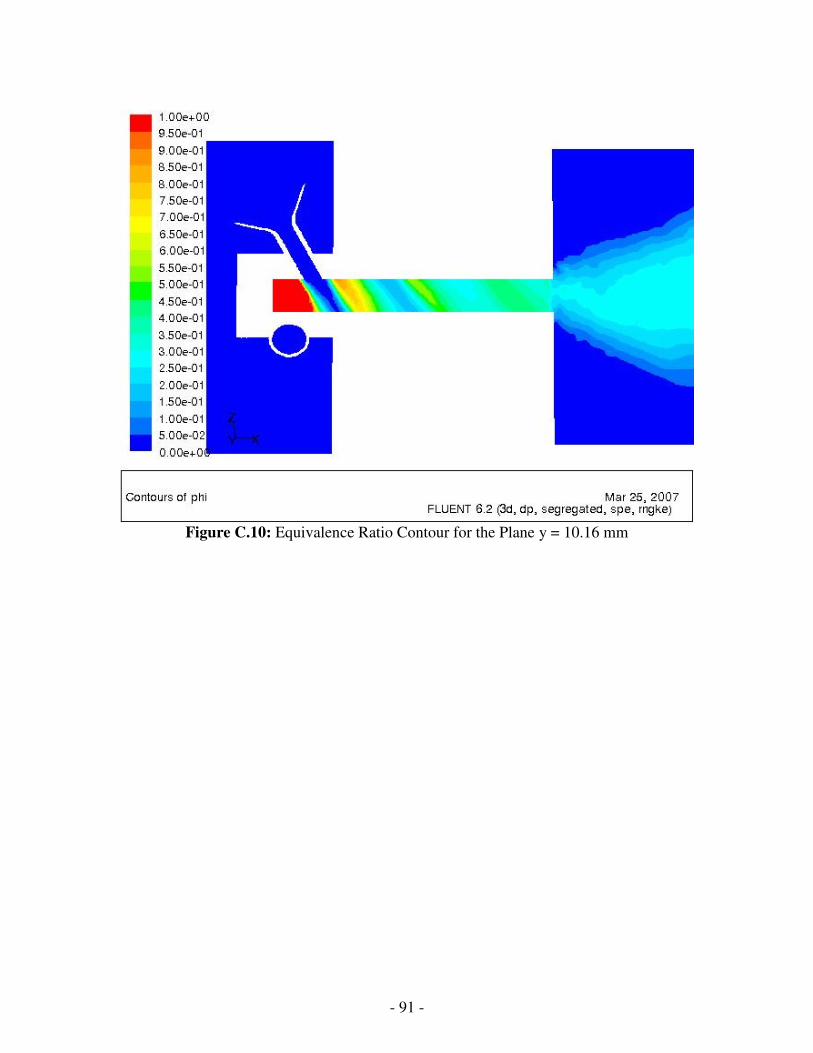
- 91 -
Figure C.10: Equivalence Ratio Contour for the Plane y = 10.16 mm

- 92 -
Appendix D: Flame Pictures at the “Cruise” Condition
Figure D.1: Equivalence Ratio of 0.4 Single Injector
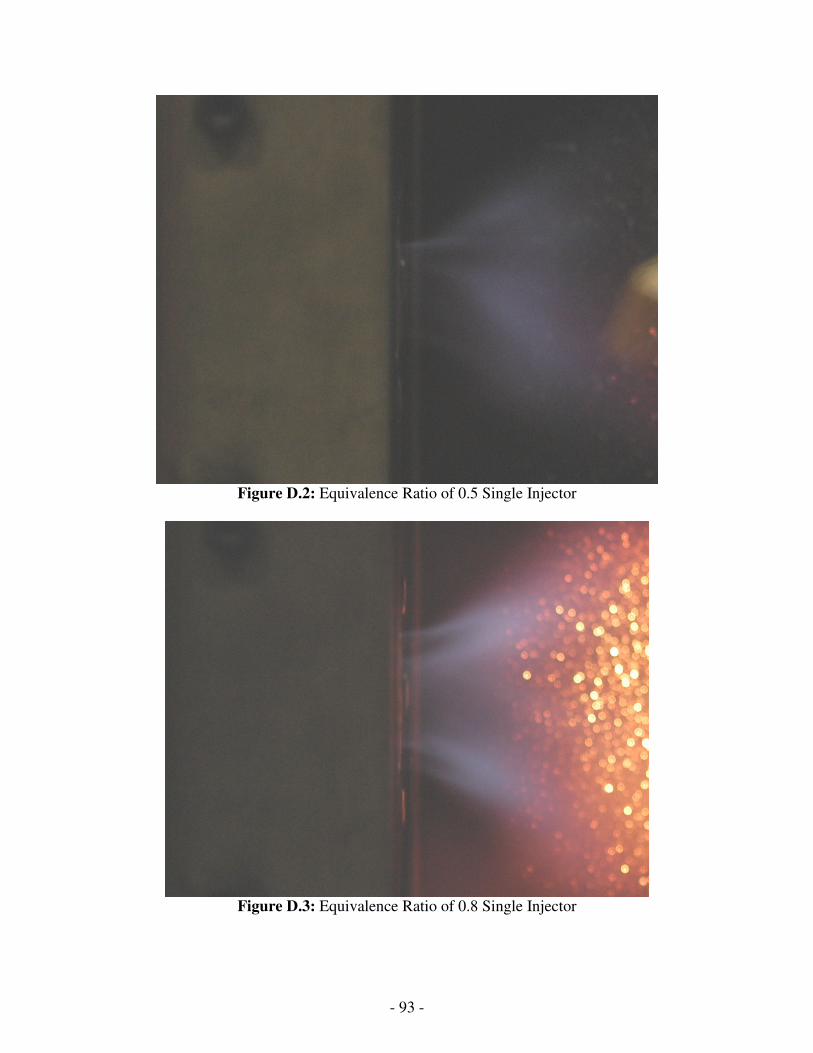
- 93 -
Figure D.2: Equivalence Ratio of 0.5 Single Injector
Figure D.3: Equivalence Ratio of 0.8 Single Injector
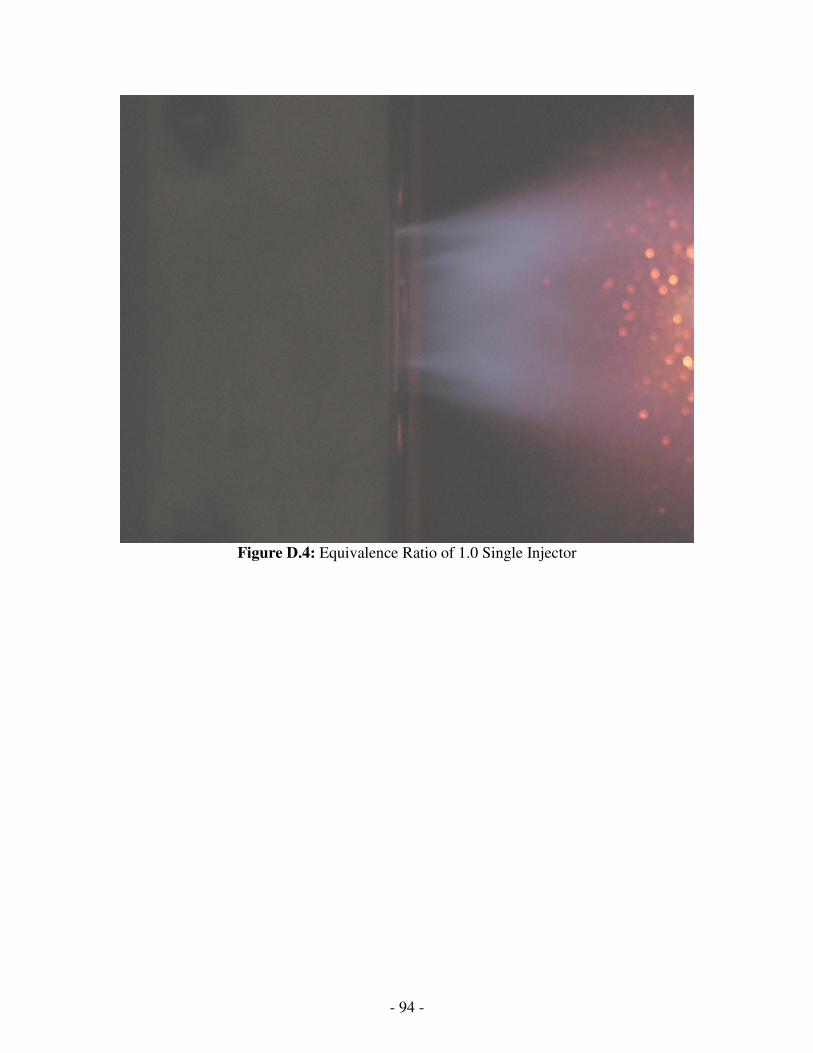
- 94 -
Figure D.4: Equivalence Ratio of 1.0 Single Injector
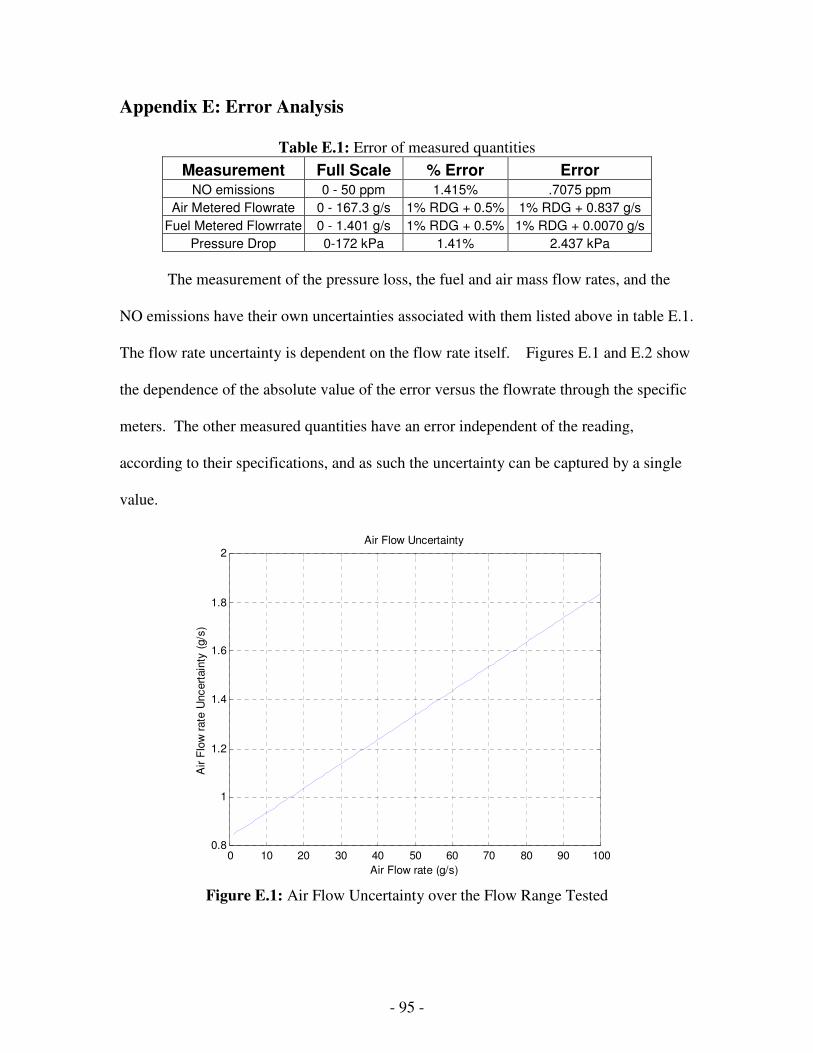
- 95 -
Appendix E: Error Analysis
Table E.1: Error of measured quantities
Measurement Full Scale % Error Error NO emissions 0 - 50 ppm 1.415% .7075 ppm
Air Metered Flowrate 0 - 167.3 g/s 1% RDG + 0.5% 1% RDG + 0.837 g/s
Fuel Metered Flowrrate 0 - 1.401 g/s 1% RDG + 0.5% 1% RDG + 0.0070 g/s
Pressure Drop 0-172 kPa 1.41% 2.437 kPa
The measurement of the pressure loss, the fuel and air mass flow rates, and the
NO emissions have their own uncertainties associated with them listed above in table E.1.
The flow rate uncertainty is dependent on the flow rate itself. Figures E.1 and E.2 show
the dependence of the absolute value of the error versus the flowrate through the specific
meters. The other measured quantities have an error independent of the reading,
according to their specifications, and as such the uncertainty can be captured by a single
value.
0 10 20 30 40 50 60 70 80 90 1000.8
1
1.2
1.4
1.6
1.8
2
Air Flow rate (g/s)
Air F
low
rate
Uncert
ain
ty (
g/s
)
Air Flow Uncertainty
Figure E.1: Air Flow Uncertainty over the Flow Range Tested
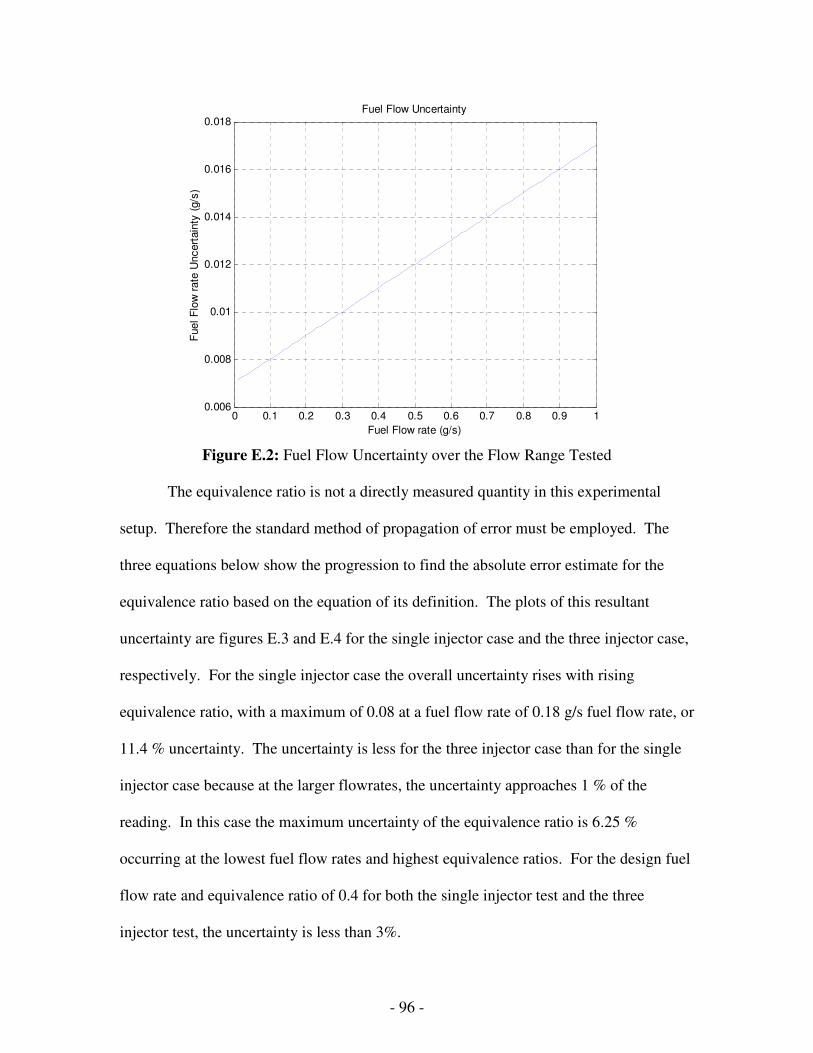
- 96 -
0 0.1 0.2 0.3 0.4 0.5 0.6 0.7 0.8 0.9 10.006
0.008
0.01
0.012
0.014
0.016
0.018
Fuel Flow rate (g/s)
Fuel F
low
rate
Uncert
ain
ty (
g/s
)
Fuel Flow Uncertainty
Figure E.2: Fuel Flow Uncertainty over the Flow Range Tested
The equivalence ratio is not a directly measured quantity in this experimental
setup. Therefore the standard method of propagation of error must be employed. The
three equations below show the progression to find the absolute error estimate for the
equivalence ratio based on the equation of its definition. The plots of this resultant
uncertainty are figures E.3 and E.4 for the single injector case and the three injector case,
respectively. For the single injector case the overall uncertainty rises with rising
equivalence ratio, with a maximum of 0.08 at a fuel flow rate of 0.18 g/s fuel flow rate, or
11.4 % uncertainty. The uncertainty is less for the three injector case than for the single
injector case because at the larger flowrates, the uncertainty approaches 1 % of the
reading. In this case the maximum uncertainty of the equivalence ratio is 6.25 %
occurring at the lowest fuel flow rates and highest equivalence ratios. For the design fuel
flow rate and equivalence ratio of 0.4 for both the single injector test and the three
injector test, the uncertainty is less than 3%.
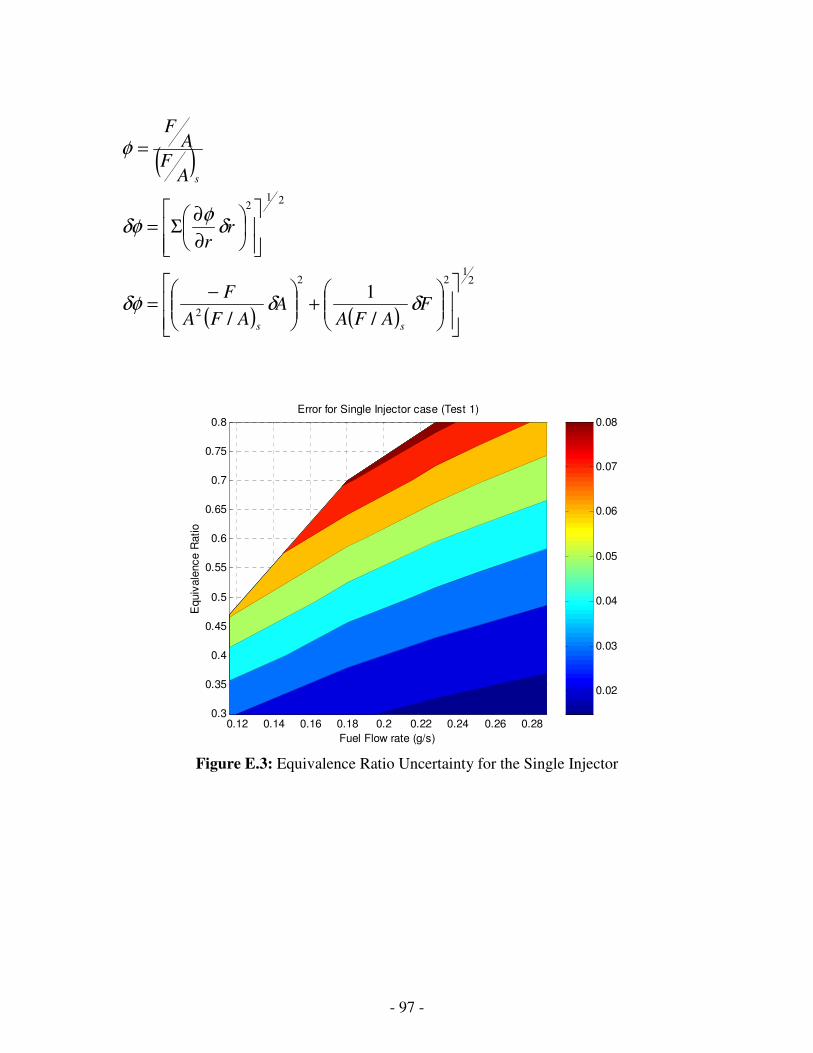
- 97 -
( )
( ) ( )
21
22
2
212
/
1
/
+
−=
∂
∂Σ=
=
FAFA
AAFA
F
rr
AF
AF
ss
s
δδδφ
δφ
δφ
φ
0.02
0.03
0.04
0.05
0.06
0.07
0.08
0.12 0.14 0.16 0.18 0.2 0.22 0.24 0.26 0.280.3
0.35
0.4
0.45
0.5
0.55
0.6
0.65
0.7
0.75
0.8
Fuel Flow rate (g/s)
Equiv
ale
nce R
atio
Error for Single Injector case (Test 1)
Figure E.3: Equivalence Ratio Uncertainty for the Single Injector
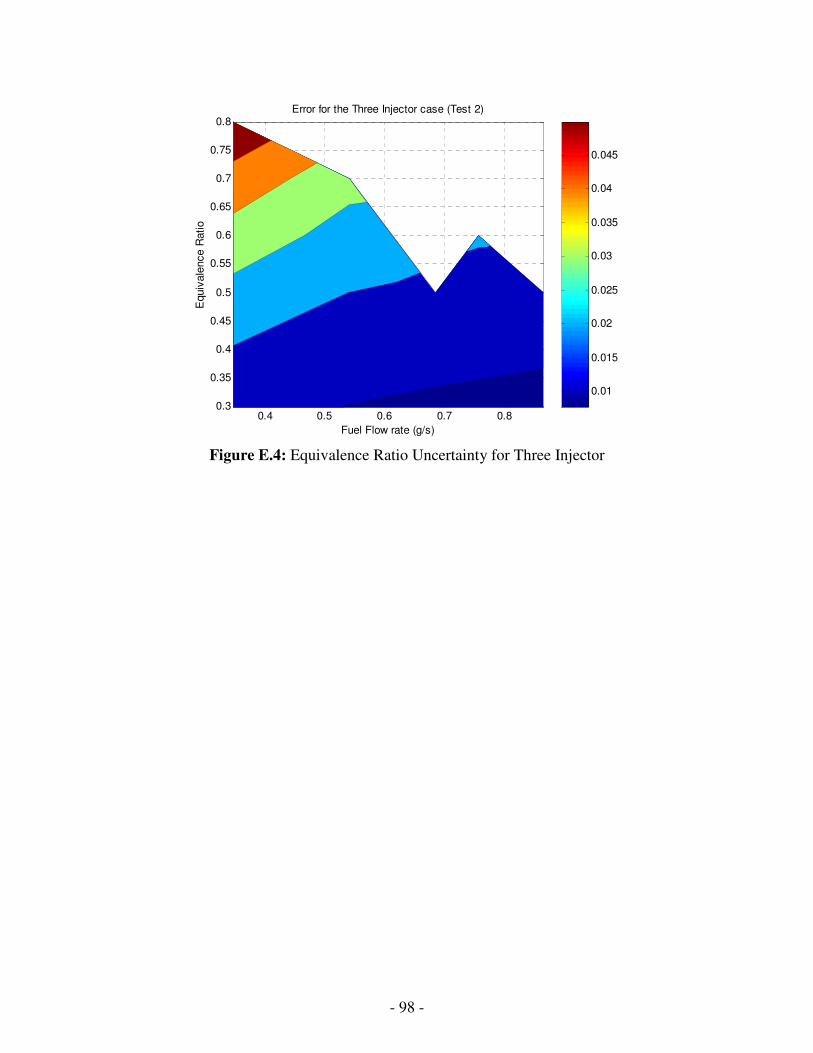
- 98 -
0.01
0.015
0.02
0.025
0.03
0.035
0.04
0.045
0.4 0.5 0.6 0.7 0.80.3
0.35
0.4
0.45
0.5
0.55
0.6
0.65
0.7
0.75
0.8
Fuel Flow rate (g/s)
Equiv
ale
nce R
atio
Error for the Three Injector case (Test 2)
Figure E.4: Equivalence Ratio Uncertainty for Three Injector