design and development of an efficient network intrusion
TRANSCRIPT

Research ArticleDesign and Development of an Efficient Network IntrusionDetection System Using Machine Learning Techniques
Thomas Rincy N 1 and Roopam Gupta2
1Department of Computer Science and Engineering, University Institute of Technology, Rajiv Gandhi Proudyogiki Vishwavidyalaya,Bhopal, M.P, India2Department of Information Technology, University Institute of Technology, Rajiv Gandhi Proudyogiki Vishwavidyalaya, Bhopal,M.P, India
Correspondence should be addressed to Thomas Rincy N; [email protected]
Received 17 March 2021; Revised 16 April 2021; Accepted 14 May 2021; Published 28 June 2021
Academic Editor: Philippe Fournier-Viger
Copyright © 2021 Thomas Rincy N and Roopam Gupta. This is an open access article distributed under the Creative CommonsAttribution License, which permits unrestricted use, distribution, and reproduction in any medium, provided the original workis properly cited.
Today’s internets are made up of nearly half a million different networks. In any network connection, identifying the attacks bytheir types is a difficult task as different attacks may have various connections, and their number may vary from a few tohundreds of network connections. To solve this problem, a novel hybrid network IDS called NID-Shield is proposed in themanuscript that classifies the dataset according to different attack types. Furthermore, the attack names found in attack types areclassified individually helping considerably in predicting the vulnerability of individual attacks in various networks. The hybridNID-Shield NIDS applies the efficient feature subset selection technique called CAPPER and distinct machine learning methods.The UNSW-NB15 and NSL-KDD datasets are utilized for the evaluation of metrics. Machine learning algorithms are applied fortraining the reduced accurate and highly merit feature subsets obtained from CAPPER and then assessed by the cross-validationmethod for the reduced attributes. Various performance metrics show that the hybrid NID-Shield NIDS applied with theCAPPER approach achieves a good accuracy rate and low FPR on the UNSW-NB15 and NSL-KDD datasets and shows goodperformance results when analyzed with various approaches found in existing literature studies.
1. Introduction
Research in network security is a vastly emerging topic in thedomain of computer networking due to the ever-increasingdensity of advanced cyberattacks. The intrusion detectionsystems (IDSs) are designed to avert the intrusions and toprotect the programs, data, and illegitimate access of thecomputer systems. The IDSs can classify the intrinsic andextrinsic intrusions in the computer networks of an organiza-tion and instigate the alarm if security infringement is com-prised in an organization network [1]. One of the notabledefinitions for intrusion is that it produces malignant, out-wardly activated functional violations. The primary goal ofintrusion detection systems is to recognize a broad varietyof intrusions, heretofore identified and unidentified attacks;to discover and adapt to unfamiliar attacks; and to detectand recognize intrusions in a prompt pattern [2]. The pre-
liminary work on IDSs was researched by Anderson [3]who recommended means of examining data. Subsequentto Anderson’s work, the previous work was aimed at develop-ing the algorithms and procedures for online automatedsystems. The Sytek project [4] started producing audit trailshaving enhanced security and considered differentapproaches for analyzing automated systems. These observa-tions contributed to the first empirical evidence that the endusers can be recognized from each other through user actionof using the computer [5]. The proof of SRI and Sytek studies[6] was the foundation of real-time IDS. The behavior of theusers, whether it is normal or suspected, is continuouslymonitored by these systems. The real-time IDS relies ontwo techniques: (1) intrusions whether normal or suspectedcan be tracked by the flagged departure from the factual pat-terns of respective users and (2) perceived system susceptibil-ities and various infractions of the system-aimed security
HindawiWireless Communications and Mobile ComputingVolume 2021, Article ID 9974270, 35 pageshttps://doi.org/10.1155/2021/9974270

protocols are best tracked from rule-based expert systems.The stability of precision and detection is primarily two mea-sures applied mainly to assess the IDSs [7], and in recentyears, many IDS research surveys have been accomplishedto enhance these measures [8]. In the inception stages, manyof the research studies mainly focus on the rule-based expertsystem and statistical approach. However, the various perfor-mance results show that these approaches when applied tolarge datasets are not accurate and precise [9].
To get the better of the above-mentioned problem, datamining approaches [10, 11] and machine learning techniqueswere introduced [12]. Some machine learning paradigmscontaining Graph-based methods [13], Linear Genetic Pro-gramming [14], Bayesian Network [15], k-NN [16], K-meansclustering [17], Hidden Markov Model [18], Self-organizingmap [19], etc. have been explored for the architecture of IDSs.Machine learning [20] can detect the correlation between fea-tures and classes found in training data and identify relevantsubsets of attributes by feature selection and dimensionalityreduction, then use the data to build amodel for classifying datato perform predictions. The data dimensionality related to datamining and machine learning has doubled in the last decadethat leads to several questions to current learning approaches[21]. Due to the presence of excessive cardinal features, themodel that tends to learn gets overfitted, resulting in the perfor-mance degradation of the model.
To solve the problem of data dimensionality in machinelearning and data mining, various dimensionality reductionapproaches have been accessed which is considered as anessential step in the area of machine learning and datamining. Feature selection is an extensively employed andefficient technique applied for dimensionality reduction.The main aim of feature selection is to select the limitedfeature subsets from primary features conferring to rele-vancy appraisal standard that manages the training modelto accomplish greater performance outcomes and reducedexecution time and achieve higher model predictability.Most of the classification problem needs the supervisedlearning where the class-conditional possibilities and cardi-nal class are not familiar and the class labels and itsinstances are associated with each other [22]. There is ascarcity of knowledge in real-world applications relatedto relevant features. Endless feature candidates areacquired to generate the more coherent domain, whichresults in the existence of irrelevant and redundant fea-tures to the target approach or objective function. Forthe target approach, the relevant or significant featuresare not irrelevant or redundant; neither the redundant fea-ture is spontaneously correlated with the target approachor objective function but impacts the learning approach.The new events are not added by the redundant featuresto the target approach or objective function. In the major-ity of the classification problems, it is a composite to learneven if the classifier is competent due to the presence ofan enormous number of data, till the redundant featuresare excluded from the objective function. For the classifi-cation problem, the features are once generated theninstead of processing with full data; the feature selectionwill bring about the feature subsets from the initial fea-
tures and then process with the feature subsets to a learn-ing algorithm. The nominally sized feature subsets for theclassification problem are selected by the feature selectionapproach conferring to the following criterion:
(i) Normally, the classifier accuracy does not declineconsiderably
(ii) Among all the likely features, the initial distributionof the class shall be approximately close to the pro-ceeding distribution of the class whenever the valuesare likely towards the features selected
To obtain the high merit feature subsets from 2m subsets,the feature subset selection approaches search feature subsetsconferring to a few significant appraisal criteria. However,this approach is intensive for the conclusion of the best sub-set and to select the intermediate-sized feature subsets withthe volume (m); the strategy is expensive and restrictive. Var-ious approaches like heuristic and random search lower thecomputational intricacy by a trade-off. To prohibit the fea-ture subsets from exhaustively searching, a stopping criterionis required. A feature selection approach [23] does the job bysubset generation, subset evaluation, stopping criterion, andthe result from the validation. With the likely searchapproach, the chosen feature subsets are sent for subset eval-uators with significant evaluation criteria. After the stoppingcriterion is performed, the feature subset that is competentenough to fit in the evaluation strategy is preferred, and then,finally, the finest feature subset is selected and gets authenti-cated by employing the domain knowledge or validation.
The detection methods of intrusion detection systems areclassified into three major types: anomaly-based, signature-based, and hybrid-based. The signature-based IDS andanomaly-based IDS were the most favored methods in anorganization until numerous shortcomings were observed,which leads to the development of hybrid intrusion detectionsystems. In the designing of IDS, classifying the datasetsaccording to attack types and selecting the good feature sub-sets are a hard problem. The classifying of datasets accordingto attack types aids in predicting the vulnerability of individ-ual attacks in various networks. Moreover, relevant featuresshould not be irrelevant or redundant so that accurate andhighly merit feature subsets are obtained. To address thisissue, a new hybrid network intrusion detection system calledNID-Shield is designed that classifies the dataset according toattack types. Furthermore, the hybrid CAPPER approach isapplied as a feature subset selection approach. Screening isapplied to those features by the CAPPER approach which isredundant having a high-class correlation. Moreover,machine learning algorithms are applied for selecting highmerit and accurate feature subsets.
The major contributions of this manuscript are asfollows:
(i) An efficient hybrid NID-Shield NIDS is proposed inthis manuscript that classifies the UNSW-NB15 andNSL-KDD datasets according to the attack types andattack names
2 Wireless Communications and Mobile Computing

(ii) An effective hybrid feature subset selection methodcalled CAPPER is applied as a feature subset selec-tion that combines the CFS and Wrapperapproaches for obtaining the reduced accurate andhigh merit feature subsets
(iii) The reduced accurate and high merit datasetsobtained from CAPPER are trained by the machinelearning approaches and assessed by a 10-foldcross-validation method
(iv) The hybrid NID-Shield network intrusion detectionsystem shows overall good improvement results onthe different approaches found in the existing litera-ture studies
The remaining article is coordinated accordingly. Section2 focuses on related work. Section 3 proposes the architectureof the hybrid NID-Shield NIDS. Section 4 relates to the char-acteristics of UNSW-NB15 and NSL-KDD datasets. Section 5discusses the performance evaluation of the hybrid NID-Shield NIDS approach with various existing approaches onthe UNSW-NB15 and NSL-KDD dataset, and Section 6 thenconcludes the work.
2. Related Work
This section introduces the existing literature studies on thehybrid network intrusion detection system. Moreover, thissection discusses the advantage of a hybrid intrusion detec-tion system over a traditional intrusion detection system.Furthermore, distinct machine learning approaches areacquainted and discuss the usefulness of selecting specificmachine learning techniques.
2.1. State-of-the-Art Network IDSs. The research in the man-uscript is focused on studying the appropriateness of intru-sion detection approaches to recognize network-levelintrusions, as the network structures generate resources moresusceptible to intrusions than autonomous machines. Threefacets of network structures generate resources more exposedto attack by an autonomous machine: (1) networks generallyprovide additional resources than autonomous machines; (2)networks are usually formed to aid resource sharing; and (3)the global security policies that are applied to the IDS are lim-ited [24]. Moreover, the hybrid methods are suggested overthe signature and anomaly-based IDS, as the integration ofmultiple approaches into a distinct hybrid system retainsthe advantages of multiple techniques, while reducing manyof the deficiencies [25].
Acharya and Singh [26] conclude that for obtaining thebest possible detection and accuracy rate, the hybrid learningapproaches can be a good choice and proposed intelligentwater drop (IWD) algorithm, introduced by Shah–Hosseini[27]. This approach applies the support vector machine(SVM) as a classification algorithm and IWD approach as afeature selection technique that is inspired by the nature.IWD approach selects the best feature subsets, and the eval-uation of the subsets is executed by the SVM classifier. Theproposed model lowers the forty-five features from the
applied dataset to the lowest of ten features. KDD-Cup ‘99dataset is used for the appraisal of metrics. The proposedapproach attains an accuracy, detection, and precision of99%. The disadvantage of applying the elemental IWD algo-rithm is the likelihood of choosing the adjacent node for awater drop to stream.
Arif et al. [28] introduced the hybrid approach for IDSs.In this approach, pruning of the node is performed by PSOand pruned decision tree is applied for the classification pur-pose in a NIDS. The proposed approach applies the singleand multiple-objective particle swarm optimization (PSO)algorithms. The KDD-Cup ‘99 dataset is used as an experi-mental evaluation approach. From the 10% KDD-Cup ‘99training and testing dataset, thirty arbitrary samples are cho-sen for evaluation purposes. The statistical records in everytraining and testing dataset are 12,000 and 24,000 accord-ingly for the appraisal of the metrics. The precision of99.95% and accuracy of 93.5% are achieved using the aboveapproaches. But there are some primary problems involvedwith traditional PSO when adopted as a feature selectionapproach. The most significant problem submits the follow-ing question: in a random initialization, from the initial pop-ulation, how far is it to reach an optimal solution. If theoptimum answer tells that the predicted prediction is far dis-tant, then it may not be possible to obtain the global optimalsolution within the allocated time. The second probleminvolves the conventional upgrading mechanism of globalbest and personal best of the PSO approach, as these mecha-nisms may result in losing some valuable features.
Ahmed et al. [29] applied a triple strategy to build ahybrid IDS in which the Naive Bayes feature subset selector(NBFS) technique has been applied for dimensionality reduc-tion. For the outlier rejection, optimized support vectormachines (OSVM) are applied, whereas prioritized k-near-est neighbors (PKNN) are applied as a classifier. The NSL-KDD, KDD-Cup ‘99, and Kyoto 2006+ datasets are usedfor evaluation purposes. 18 efficient features are preferredfrom the KDD-Cup ‘99 dataset with a detection ratio of90.28%. 24 features are selected from the Kyoto 2006+ data-set having a detection ratio of 91.60%. The author has com-pared with previous work and has the best overall detectionratio of 93.28%. The major disadvantage with the NaiveBayes is that it presumes prediction of the features that aremutually independent to one another. The features withmutual independence are consistently hard to get in real-world problems.
Dash et al. [30] reports two new hybrid intrusion detec-tion methods that are GS and sequence of GSPSO which isthe combination of gravitational search and the particleswarm optimization algorithms. It involves search agentswho relate to each other having heavy masses from the grav-itational force, and their performance is assessed by theirmass. The combination approach has been carried out totrain ANN with models such as GS-ANN and GSPSO-ANN. The random selection of 10% features is selected fortraining purposes, while 15% is used for testing purposesand is applied successfully for intrusion detection purposes.The author does not apply any feature selection technique.The KDD-Cup ‘99 dataset was applied as a metric for
3Wireless Communications and Mobile Computing

Table 1: Taxonomy of latest hybrid intrusion detection methods.
Hybrid-based intrusion detection techniques with feature selection techniques
YearResearchpapers
Algorithms Techniques DatasetEvaluationcriteria
Featureselection
Results
2017 [26] SVM, IWD
SVM is applied as aclassifier. Featurereduction applying
IWD (intelligent waterdrop) method
KDD-Cup‘99 dataset
Detection rate,precision rate,accuracy rate,false alarm rate
IWD
Achieves a detectionrate of 99.40%,precision rate of
99.10%, false alarm of1.40%, accuracy rate of
99.05%
2017 [28]Particle swarm
optimization (PSO)
Particle swarmoptimization (PSO)algorithm is applied
for pruning the node ofDT, and the prunedDT is applied for the
network IDSclassification
KDD-Cup‘99 dataset
Accuracy rate,precision rate,FPR., IDR, time
PSO
Accuracy of 96.65%, aprecision of 99.98%,FPR of 0.136, IDR of92.71%, and executiontime of 383.58 sec. is
obtained
2017 [29]
Prioritized KNNalgorithm, optimizedSVM algorithm, NaïveBayes feature selection
approach
PKNN is used fordetecting input attacks,hybrid HIDS strategy(based on Naïve Bayesfeature selection);
OSVM is applied foroutlier rejection. NaïveBayes is applied as the
feature selectorapproach
Kyoto2006+dataset,
KDD-Cup‘99 dataset,and NSL-KDDdataset
Specificity,sensitivity,
detection rate,precision
NBFS
An overall sensitivityrate of 53.24%,detection rate of
94.6%, precision of56.62%, specificity of98.21% are obtained
on all datasets
2017 [30]Artificial neural
network
Particle swarmoptimization (GSPSO)is employed to trainANN, gravitationalsearch (GS), andcombination of GS
NSL-KDDdataset
MSE, detectionrate, time
Not applied
MSE of 0.4527%, adetection ratio of
95.26%, and executiontime of 103.70 seconds
are obtained
2017 [31]Hybrid multilevel datamining algorithm
Flexible mutualinformation-basedfeature selection
(FIMS) is employed asfeature selector, MH-ML (multilevel hybridmachine learning),MH-DE (multilevel
hybrid dataengineering), MEM
(micro expert module)for training the KDD-
Cup ‘99 dataset
KDD-Cup‘99 dataset
Detection rate,recall, accuracyrate, F-value,precision rate
FIMS
A detection rate of66.69%, accuracy of96.70%, recall of
96.70%, precision of96.55%, and F-value of96.60% are achieved
2018 [32]Support vectormachine (SVM)
Chisqselectoremploying the SVMclassifier for reduction
of features
KDD-Cup‘99 dataset
AUPR, AUROC,time
Chisqselector
AUPR of 96.24%,AUROC of 99.55%,and execution time of10.79 seconds are
obtained
4 Wireless Communications and Mobile Computing

Table 1: Continued.
Hybrid-based intrusion detection techniques with feature selection techniques
YearResearchpapers
Algorithms Techniques DatasetEvaluationcriteria
Featureselection
Results
2018 [33]Vector-based genetic
algorithm
Three feature selectionmethods are employed,linear correlation-
based feature selection(LCFS), modified
mutual information-based feature selection(MMIFS), and forward
feature selectionalgorithm (FFSA),chromosomes as
vector and trainingdata as metrics
KDD-Cup‘99 datasetand CTU-13 dataset
FPR, accuracyrate
LCFS, FFSA,MMIFS
FPR of 0.17% isachieved, and accuracyrate for the DoS is
99.8%
2018 [34]
Neural network withresilient backpropagation
algorithm, CART
Neural network withresilient back
propagation algorithmto update the weights;feature reduction isperformed by CART
ISCX &ISOTdataset
Detection rate,accuracy rate,
FPRCART
An accuracy rate of99.20%, detection rateof 99.08%, and FPR of0.75% are obtained
2018 [35]
Symmetricaluncertainty and
genetic algorithm (SU-GA) is used asclassificationalgorithm
Genetic algorithm isused on selected
features; symmetricuncertainty is appliedto find best features
UCIdataset
Accuracy rate GA
An accuracy of 83.83%is obtained, and an
execution time of 0.23seconds is achieved on
all approaches
2018 [36] Genetic algorithm
Neurofuzzy inferencesystem, neural fuzzygenetic, fuzzy logiccontroller, multilayerperception for attack
classification
KDD-Cup‘99 dataset
Accuracy rate Fuzzy rule
A true attack detectionand false alarm
detection accuracy upto 99% rate of 1%.
2019 [37]Random forest, NaiveBayes, J-48, k-nearestneighbor algorithm
WrapperSubsetEvaland CfsSubsetEval areapplied as two featureselection techniques,while random forest, k-NN algorithm, NaiveBayes, and J-48 are
applied as theclassifiers
NSL-KDDdataset
Detection rate,accuracy rate, F–measure, TP rate,FP rate, MCC,
and time
Wrapper andfilter
Overall accuracy rateof 99.86%, overall FPRof 0.00035%, overalldetection ratio of
0.9828%, F-measure of0.706%, overall TPR of0.929%, overall MCCof 0.955%, and totalexecution time of10.625 seconds
(executed on NSL-KDD dataset with 25attributes on all attack
types)
2019 [38]K-means clustering,DBSCAN, SMO
K-means is applied fordata grouping,
DBSCAN is employedto eliminate noise from
data, and SMO isapplied for intrusion
detection
KDD-Cup‘99 dataset
Detection rate,accuracy rate
DBSCAN
An approx detectionrate of 70% and anapprox accuracy of98.1% are obtained
5Wireless Communications and Mobile Computing

Table 1: Continued.
Hybrid-based intrusion detection techniques with feature selection techniques
YearResearchpapers
Algorithms Techniques DatasetEvaluationcriteria
Featureselection
Results
2019 [39]
Intelligent flawlessfeature selection
algorithm (IFLFSA),entropy-basedweighted outlier
rejection (EWOD),intelligent layered
classificationalgorithm
EWOD is used todetect outliers in data,IFLFSA is used as
feature selection, andintelligent layered
classificationalgorithm is applied to
classify the data
KDD-Cup‘99 dataset
Accuracy rate IFLFSAOverall accuracy of99.45% is achieved
2019 [40]ID3, k-nearest
neighbor, isolationforest
k-nearest neighbor isused to apply a class tounknown data point,ID3 is used as featureselector, and isolationforest is employed tosegregate normal data
from anomaly
NSL-KDD& KDD-Cup ‘99dataset
Detection rate,accuracy rate,false alarm rate
k-NN
The performance withKDD-Cup ‘99 datasethas a detection rate of97.20%, accuracy of96.92%, and FPR of7.49%. Performanceon NSL-KDD datasethas a detection rate of95.5%, accuracy of
93.95%, and a FPR of10.34%
2019 [41]Best first search andNaïve Bayes (BFS-NB)
algorithm
Best search is appliedas attributeoptimization
approach, and NaïveBayes is employed as
classifier
KDDdatasetsfrom theUS AirForce
Accuracy,sensitivity,specificity
Naive Bayes
Sensitivity analysis of97%, accuracy of
92.12%, and specificityof 97.5% are obtained
2020 [42]Deep neural network(DNN), classical
AutoEncoder (CAE)
Deep neural network(DNN) is applied asclassification, and
classical AutoEncoder(CAE) is applied as a
feature selectorapproach
UNSW-NB15dataset
(DNN)Classical
AutoEncoder(CAE)
Precision of 92.08%, F-measure of 91.35%,accuracy of 91.29%,recall of 90.64%, and
FPR of 0.805
2020 [43]
k-nearest neighbor (k-NN), extreme
learning machine(ELM), hierarchicalextreme learningmachine (H-ELM),SDN controller
Hierarchical extremelearning machine (H-
ELM), extremelearning machine
(ELM), and k-nearestneighbor (k-NN) are
applied forclassification, and SDNcontroller is employedas a feature selection
approach
NSL-KDDdataset
(k-NN), (ELM),(H-ELM)
SDNcontroller
An accuracy of84.29%, FPR of 6.3%,precision of 94.18%,recall of 77.18%, F-measure of 84.83%
2021 [44]ANN is applied as a
classifier
An integrationtechnique
(CFS + ANN) isemployed to improvethe classification
accuracy
NSL-KDDdatasetand
UNSW-NB15dataset
(CFS + ANN)
Correlation-based featureselectiontechnique
An accuracy of98.45%, specificity of94.38%, sensitivity of92.94%, and executiontime of 500 seconds areobtained on the NSL-KDD dataset. For theUNSW-NB15 dataset,an accuracy of 96.44%,specificity of 98.4%, asensitivity of 50.4%,
6 Wireless Communications and Mobile Computing

calculation. Normalization of the dataset was done for uni-form distribution by MATLAB. An average detection ratioof 95.26% was achieved. The gradual shift of the search agentencourages the relevant solution of the algorithm, but themajor weakness is its speed of convergence that slows downin subsequent stages and has the tendency to get trapped inthe local optimum solution.
Yao et al. [31] introduced a hybrid framework for IDS. K-means algorithm is employed for clustering purposes. In theclassification phase, many machine learning algorithms(SVM, ANN, DT, and RF) which are all supervised learningalgorithms are compared on different parameters. The super-vised learning algorithm has various parameters for differentkinds of attacks (DoS, U2R, Probe, and R2L). FIMS is appliedas a feature selection technique. The proposed approach hasobtained an accuracy rate reaching 96.70% with the KDD-Cup ‘99 dataset. The drawback with the FIMS approach isthat the correlation between the candidate features and theirclass is not considered.
Suad and Fadl [32] introduced an IDS model applyingthe machine learning algorithm to the big data environment.This paper employs a Spark-Chi-SVM model. ChisqSelectoris applied as a feature selection method, and an IDS modelis constructed by applying the SVM as a classifier. The com-parison is done with the Spark-Chi-SVM classifier and Chi-logistic-regression classifier. The KDD-Cup ‘99 dataset isused for the metrics of the evaluation process. The resultshows that the Spark-Chi-SVM model shows good perfor-mance having an AUROC of 99.55% and an AUPR of96.24%. The disadvantage of ChisqSelector is having a larger
sensitiveness towards the sample size. However, when thesample size increases, the total differences become smallerthan the predicted value.
Ijaz et al. [33] introduce a genetic algorithm, which isbased on vectors. In this technique, vector chromosomesare applied. The uniqueness of this algorithm is that it showsthe chromosomes as a vector and training data as metrics. Itgrants multiple pathways to have a fitness function. Threefeature selection techniques are chosen: forward featureselector algorithm (FFSA), linear correlation feature selector(LCFS), and modified mutual information feature selector(MMIFS). The novel algorithm is tested in two datasets(CDU-13 and KDD-Cup ‘99). Performance metrics demon-strate that the vector genetic algorithm has a high detectionratio of 99.8% and a low false positive rate of 0.17% on thedenial of service (DoS) attack. However, the authors do notevaluate the U2R, Probe, and R2L attacks which are consid-ered important metrics in the IDS.
Alauthaman et al. [34] proposed an approach of peer-to-peer bot detection build on a feed-forward neural network inassistance with the DT. CART is then applied as a featureselection approach to obtain the significant features. Networktraffic reduction techniques were applied by using six rules topick the most relevant features. Twenty-nine features areselected from six rules. The proposed approach obtained anaccuracy of 99.20% and a detection ratio of 99.08%, respectively.The disadvantage of utilizing a CART is that the decision treemay not be stable and the CART splits the variables one by one.
Venkataraman and Selvaraj [35] report an efficienthybrid feature selection structure for the classification of
Table 1: Continued.
Hybrid-based intrusion detection techniques with feature selection techniques
YearResearchpapers
Algorithms Techniques DatasetEvaluationcriteria
Featureselection
Results
and an execution timeof 1023 seconds are
achieved
2021 [45]SVM, modified binarygray wolf algorithm
SVM is used as aclassifier and, modified
binary gray wolfalgorithm is applied as
feature selectionapproach
NSL-KDDdataset
SVM
Modifiedbinary gray
wolfalgorithm
An accuracy of 96%,FPR of 0.03, detection
rate of 0.96, andexecution time of
69.6 h
2021 [46]Multiclassifier, deep
neural network, kerneldensity
Random forestdifferential evaluationwith kernel density forpredicting unusualactivities. For inputclassification, amulticlassifier is
applied, while a deepneural network isemployed as the
learning and trainingof the data. Kerneldensity is used forclustering and
prediction of data.
HHARdataset
Random forestdifferential
evaluation withkernel density,multiclassifier,deep neural
network, kerneldensity
Basic sort-merge tree
An accuracy rate of98.4%, a sensitivity of
96.02%, and aspecificity of 99.8%
7Wireless Communications and Mobile Computing

the data. For classification purposes, symmetrical uncertaintyis applied to find the relevant features. Moreover, GA isapplied to search for the merit subset with higher accuracy.The author combined SU-GA as a hybrid feature selectionapproach. MATLAB and Weka tools are applied for evalua-tion purposes. Different classification algorithms (KStar,J48, NB, SMO, DT, JRIP, Multilayer Perceptron, and Ran-dom forest) are used to classify different attacks. The averagelearning accuracy withMulti Perpn and SU-GA is the highesthaving 86.0%. The major drawback of a genetic algorithm isthat it may be computationally expensive, as the training ofthe model is required for the appraisal of each candidate.GA is stochastic, so it may require a longer time to converge.
Kumar and Kumar [36] introduce an intelligent-basedhybrid NIDS model. This model then integrates the multi-layer perception, fuzzy logic controller, adaptive neurofuzzyinterference system, and a neurofuzzy genetic. The authorapplied fuzzy logic as a feature selection method. The pro-posed system has three key elements: analyzer, collector,and predictor modules, for gathering and filtering networktraffic to classify the data and prepare the final decision inassuming knowledge on the accurate attack. The experimentis assessed on the KDD-Cup ‘99 dataset that achieves animprovement of true attack detection and false alarm detec-tion accuracy upto 99% rate of 1% using MATLAB. The dis-advantage of fuzzy logic is that the results are observed basedon assumptions, and due to this reason, accuracy is some-times incorrect.
Cavusoglu et al.[37] applied the hybrid approach for IDSusing machine learning techniques. k-nearest neighbor andNaive Bayes algorithms are used for classification purposes,while the random forest algorithm is used as a classifier.The author applied two feature selection techniques calledthe CfsSubsetEval and WrapperSubsetEval approach. J48algorithm is applied in conjunction with WrapperSubsetEvalfor selecting accurate attributes. For the evaluation of met-rics, the NSL-KDD dataset is applied. The overall accuracyof 99.86% is obtained on all types of attacks.
Saxena et al. [38] implemented a DBSCAN-based hybridtechnique for obtaining the high-quality feature subsets forIDS. DBSCAN is employed as a method for eliminating noisefrom data. For grouping data, K-means clustering is pro-posed. The SMO classifier is applied for classification pur-poses. The KDD-Cup ‘99 dataset is applied for evaluationpurposes with reduced attributes. The proposed approach,DBKSMO, achieved an accuracy of about 98%. Weka andMATLAB tools are applied for the execution of the results.However, the major disadvantage of DBSCAN is that when-ever there is a cluster having variations in density or the clus-ters having similar variation, its performance declines, themajor reason being the setting of ε (distance threshold),and minimum points for determining the neighborhoodpoints will change from clusters to clusters, whenever densitychanges. This problem exists for high-dimensional data, asthe ε (distance threshold) becomes difficult to examine.
Kambattan and Rajkumar [39] introduced effective IDS,which employs a feature selection technique named IFLFSAto select the finest reduced features that are effective for ana-lyzing the attacks. To identify the outliers from the dataset,
the EWOD approach is utilized. An intelligent layered tech-nique is employed for efficient classification. For experimen-tal purposes, the KDD-Cup ‘99 dataset is applied. Thecomprehensive detection rate wraps the detection rate onfour types of attacks, namely, Probe, DoS, U2R, and R2L.The detection rate of the proposed system is achieved at arate of 99.45%. The weakness of using intelligent agents isthat whenever the global constraints are applied, the intelli-gent agent fails to deliver appropriately. Each agent is moreeffective in dealing individually with the main or central con-troller. The agents make the decisions based on locallyacquired knowledge; whenever there is global knowledgeavailable, the agents are missing the major available knowl-edge globally.
Kar et al. [40] utilize the decision tree algorithm calledID3 which is applied for the classification of the data intoits corresponding classes. To designate the class labels to itsunexplored data point on its class labels to the k-nearestpoint, the k-NN approach is applied. Isolation forest is intro-duced to isolate the anomaly against normal instances. Thesuggested approach HFA has applied to the NSL-KDD andKDD-Cup ‘99 dataset. The metrics on the KDD-Cup ‘99dataset obtained the ACC of 96.92%, DR of 97.20%, andFPR of 7.49%. The proposed algorithm performance withthe NSL-KDD dataset has an ACC of 93.95%, DR of 95.5%,and FPR of 10.34%. However, the main drawback of applyingthe k-NN is that whenever the size of the variables increases,the k-NN finds it difficult in predicting the output of the newdata positions. On the other side, the k-NN does well with thevariables having smaller numbers.
Mishra et al. [41] applied the BFS-NB hybrid structure inIDS. This paper proposes the best first search technique fordimensionality reduction which was employed for the attri-bute selection technique. For the classification of data, NaïveBayes classifier is applied for a classification purpose and tomaximize the accuracy of detecting intrusion. The BFS-NBalgorithm is analyzed with the KDD dataset gathered fromthe US Air Force. The classification accuracy of BS-NFB is93% while the sensitivity analysis of 97% is achieved. Themajor disadvantage with the Naive Bayes is that it presumesprediction of the features that are mutually independent toone another.
Dutta et al. [42] introduced a hybrid model for improvingthe classification metrics in a NIDS. The literature applies adeep neural network for enhancing classification accuracy.Furthermore, classical autoencoder is used as a feature subsetselection technique. The efficiency of a proposed technique isevaluated with the UNSW-NB15 dataset. A precision rate of92.08%, a recall of 90.64%, an accuracy of 91.29%, and F-measure of 91.35%, and an FPR of 0.805 are obtained fromthe proposed architecture. The deep neural network has activa-tion functions and multiple layers that produce nonconvexshapes. The drawback of a deep neural network probably intro-duces the complex error space, leading to the substantially tun-ing of hyperparameters to be able to get into a small error spaceso that the model can be beneficial. Moreover, the training isvery slow due to the tuning of many hyperparameters.
Latah and Toker [43] introduce an efficient flow-basedmultilevel hybrid intrusion detection system. The author
8 Wireless Communications and Mobile Computing

applies the k-NN, H-ELM, and ELM which are used for clas-sification purposes, and the SDN controller is used as a fea-ture selection method. An accuracy of 84.29%, FPR of 6.3%,a precision of 94.18%, a recall of 77.18%, and F-measure of84.83% are obtained from the proposed approach. However,the disadvantages of k-NN are that it is not able to handlewell with large and high-dimensional datasets. Furthermore,the k-NN is sensitive to the noise in the dataset.
Sumaiya Thaseen et al. [44] applied the integrated tech-niques CFS + ANN to improve the classification accuracy.CFS is applied as a feature selection approach for selectingthe best feature subsets, while the ANN is employed as a clas-sifier. UNSW-NB15 and NSL-KDD datasets are used forevaluating purposes. An accuracy of 98.45%, a sensitivity of92.94%, a specificity of 94.38%, and an execution time of500 seconds are obtained on the NSL-KDD dataset. For theUNSW-NB15 dataset, an accuracy of 96.44%, a sensitivityof 50.4%, specificity of 98.4%, and an execution time of1023 seconds are achieved. The major disadvantage ofANN is that it takes a longer time for training the data.
Safaldin et al. [45] applied the improved binary gray wolfoptimizer as a feature selection method and support vectormachine for classification in an IDS in a wireless sensor net-work. The proposed approach attains an accuracy of 96%,FPR of 0.03, a detection rate of 0.96, and an execution timeof 69.6 h. The choosing of a good kernel function is hardwhich is the major disadvantage of the SVM classifier. More-over, SVM takes a longer time in training the large datasets,and to store all the support vectors, the memory consump-tion is extensive.
Vallathan et al. [46] introduce the skeptical action detec-tion system that is based on the deep learning approach inIoT surroundings. Unexpected activities obtained from thefootage of the N/W surveillance devices are predicted withthe help of deep learning approaches and RFKD. For classifi-cation purposes, the multiclassifier approach is used, whileDNN is used for training and learning the data. Moreover,for prediction and clustering of data, the kernel densityapproach is applied. The proposed approach uses the basicmerge-sort tree as a feature subset selection approach. Forevaluation purposes, HHAR datasets are used. The proposedapproach obtained an accuracy rate of 98.4%, specificity of99.8%, and a sensitivity of 96.02%, on the HHAR dataset.However, the main drawback of the neural network is thatthe training is very slow due to the tuning of manyhyperparameters.
Table 1 depicts the taxonomy of the latest hybrid IDStechniques with its various feature selection approaches.When the literature studies are analyzed, most of them donot classify the dataset according to attack types and attacknames thus preventing the assessment of individual attackson the various networks. Distinct attacks may have peculiarconnections as some of the attacks such as R2L and U2Rmay have very few N/W connections, while other attackssuch as Probe and DoS may have a large number of N/Wconnections or can be a combination of any of them. Theattack names found in the attack types help in predictingthe vulnerability of individual attacks in various networks.Moreover, a feature selection approach that utilizes highly
merit and accurate feature subsets which apply machinelearning techniques is not utilized. Furthermore, perfor-mance metrics such as precision, MCC, ROC area, PRC area,kappa statistic, MAE, RAE, RMSE, and RRSE which are con-sidered important metrics in model predictability are not uti-lized in the existing works of literature.
Due to the reviewed problem in the literature studies, anovel hybrid network IDS named NID-Shield has been intro-duced that employs a distinct machine learning and efficienthybrid feature subset selection approach called CAPPER thatis the sequence of the CFS and Wrapper method. Moreover,the hybrid NID-Shield NIDS classifies the dataset accordingto the various attack names and their types found in thedataset.
2.2. Advantages of Hybrid NIDSs. This section introduces theproblem of the existing approaches of IDSs based on anom-aly and signature IDSs and explains the advantages of hybridnetwork intrusion detection systems.
Cybersecurity ventures [47] in the report estimate thatthe damages arising due to cybercrime in 2025 will increaseto $10.5 trillion annually as compared to $3 trillion in 2015.Furthermore, there is a prediction of nearly 7.5 billion activeinternet users by the end of 2030 worldwide and spending oncybersecurity aggregately surpasses $1 trillion approximatelyin the coming five years globally.
Despite having enormous financing in the field of IDSs,the losses brought by the intrusions are soaring at an alarm-ing rate leading to enormous debt revenues to the organiza-tions. Considering the efficiency of the IDS, there should bean analytical and stringent proceeding to be acclimated sothat network susceptibilities can be classified in a preciseand accurate fashion. In past decades, the IDS has been theblocking source for ever-growing intrusion violations and itis utilized as a primary prevention method against computerattacks, safeguarding networks and computer systems. IDSemploys statistical techniques, logical operation, andmachine learning approaches to analyze distinct kinds of net-work behaviors [48]. Although present-day IDSs are cer-tainly effective and pursue upgrades, they still developnumerous false alarm rates and fail to analyze the unidenti-fied attacks. Utmost IDSs rely upon inappropriate andredundant inferior level network data to observe cyber intru-sions [49]. At two layers of supervision, the existing intrusiondetection approaches work to counter the cyberattacks, thehost, and the network level. NIDS audits the details of N/Wconnections to identify the cyberattacks. Contrarily, HIDSscans the workstations’ stature and internals of the comput-ing structure utilizing definitive IDS techniques so that atthe host level, the potential intrusions can be detected. NIDSis the operating system and platform-independent that doesnot require any modification when NIDS operates. Thismakes NIDS more scalable and robust compared with HIDS.
Machine learning analysts classify IDS within threeextensive categories: anomaly-based, signature-based, andhybrid-based [50]. The anomaly-based IDS employs thenew action profiles which are created every time to distin-guish the deviation of outliers from the new profiles.Anomaly-based IDS depends on analytical methods to
9Wireless Communications and Mobile Computing

constitute an attack predictor model. The attack that does nothave predefined signatures is recognized by the anomaly-based IDS as its main strength. However, a major weaknesslies in the difficulty in creating new action profiles every time.Moreover, the deviations of outliers from the new profilesalways are not an attack. Failing to analyze the perimetersof new actions leads to the false prediction of new actionsas an attack, possibly ending in a high false-positive rate.The signature-based intrusion detection systems evaluateresemblance among occurrences under scrutiny and thefamiliar attack patterns. If the patterns formerly establishedare recognized, then alarms are triggered. For signature-based IDS, e.g., the SNORT [51] is among the utmost prefer-able, consistently adapted technique. SNORT carries outcontent seeking, content resembling, and real-time trafficinvestigation to recognize attacks by employing the prede-fined precise signatures. Although these systems are definitein analyzing the identified attack, they are incapable to per-ceive the unidentified attack.
The hybrid-based IDS integrates the anomaly and signa-ture detection approaches to detect attacks. However, thecomputational expense of utilizing the anomaly and signa-ture IDS that examines the N/W connections is the majordrawback of hybrid approaches. The anomaly and signatureIDS were the most preferred methods in an organizationuntil various weaknesses were observed leading to the devel-opment of hybrid intrusion detection systems. Furthermore,when Table 1 is observed related to hybrid network IDS,most of the literature studies do not classify the datasetaccording to attack types and their names leading to the dif-ficulty in predicting the attacks individually on different net-works. To solve this problem, a novel hybrid NIDS calledNID-Shield is proposed in the manuscript that classifies adataset according to different attack types.
2.3. Machine Learning Algorithms Used in This Study. Dis-tinct machine learning algorithms such as neural network[52], decision trees [53], k-nearest neighbor [54], and sup-port vector machine [55] are introduced by the researchersto attain learning on the datasets. Under the contrastingstructure of the datasets, the particular algorithms apply dis-tinct methods for achieving higher performance from thedatasets. The relevant approach may be applied accordingto the divergent form of the datasets [56]. Machine learningalgorithms such as Naive Bayes, random forest, and J48 (C4.5) are applied in this study for analyzing the outcome offeature selection and training of the classifier. These algo-rithms are known to be prominent in the area of machinelearning and have proven appropriate in the process.
2.3.1. Random Forest. Random forest [57] is the sequel of treepredictors, and every tree corresponds to the profit of ran-dom vector that is sampled independently, and there is anidentical distribution of entire trees in the forest. In a forest,as the tree grows larger, the generalization error coincidesto a greater extent. The generalization error from a forestrelies on the individual strengths of a tree in the forest andcorrelation between each other in a forest of classifier trees.The random forest performs sequences of inputs or the
inputs that are randomly selected at every node so that theaccuracy can be increased. By applying this method, the cor-relation is decreased and simultaneously yields efficacy toforests. The random forest constructs the random featuresat every node by dividing the limited number from the inputvariables and electing the features randomly. In the randomforest, the tree is grown with the same procedure as theCART [58] approach and the branch that is to be developedis determined by the Gini index. Random forest applies bag-ging [59] besides the selection of random features. From thestandard training dataset, a contemporary training dataset isperformed with substitution, and then, on the contemporarytraining dataset with the help of random feature selection, thetree is grown. Pruning of the tree is not performed on therandom forest; rather, the trees are grown in this approach.
Employing bagging has mainly two benefits. Firstly, theaccuracy is increased each time the random features areenforced. Secondly, estimation of the generalization errorcontaining the ensemble tree combination and the correla-tions and its intensity appraisal is provided by the bagging.The assessment is carried out-of-bag [60]. The mainapproach behind the out-of-bag estimation is the incorpora-tion of nearly one-third of classifiers from the continuingprevailing sequence. Whenever the statistic of the sequenceis incremented, the rate of error declines. Therefore, the con-temporary error rate can be augmented by out-of-bag esti-mation; hence, it is necessary to pass on from the areawhere the merging of the error occurs. In the cross-valida-tion, there is a high probability of the existence of bias; also,the degree of extent of the bias is unfamiliar, whereas theout- of-bag estimation is free from bias. The random forestapplies two-thirds of the data and for testing one-third ofthe data from training data, to grow the tree. Out-of-bag datais simply the one-third data from the training data. Pruningis not performed by the random forest which thus aids in fastand high performance. Moreover, having the multiple treeconstruction, the random forest performs reasonably wellwith additional tree framework and it achieves a higherperformance rather than any other decision tree method.
2.3.2. Naïve Bayes. Naive Bayes [61] is the classifier havingthe probabilistic nature, having the relationship relevant toBayes belief with the strong expectation, and having naiveindependence between its features. With the kind of probabi-listic analysis, the Naive Bayes represent the knowledge. Inmathematical terms, the Naive Bayes can be defined as
PRS
� �= P Rð Þ S/Rð Þ
P Sð Þ , ð1Þ
where R and S are the events and PðRÞ and PðSÞ are theevents.
PðR/SÞ is the posterior probability, having the probabilityof observation of the event R, given that the S is true. PðRÞand PðSÞ are called the prior probabilities of R and S. PðS/RÞ is called likelihood, the probability of observation of anevent S, given that R is true. The Naive Bayes version that isapplied in this study is the implementation by [62]. Thenominal feature probabilities are approximated from the
10 Wireless Communications and Mobile Computing

given data and the Gaussian distribution. The highly appar-ent class for the given instance based on the entire data distri-bution is predicted by the Bayes classifier or Bayes rule.Whenever the log probabilities are applied, the Naive Bayesis easy to understand. There are added scoring objectivesand natural expression capabilities found in the log probabil-ities. High accuracy can be obtained from the Bayes classifier.Whenever the redundant features have been eliminated, theperformance of the Naive Bayes improves considerably, asdiscussed by Langley and Sage [63]. Moreover, when modestdependencies prevail in the data, the Naive Bayes performsexceptionally, as discussed by Domingos and Pazzani [64].A minimal execution time is needed from Naive Bayes totrain the data.
2.3.3. J48(C4.5) Decision Tree Generator. C4.5 [65] decisiontree is applied in this study. C4.5 is a descendent of an ID3algorithm. C4.5 is commonly known as J48 in the Wekalibrary. C4.5 constructs the decision trees, and the pruningis performed on the decision trees with the help of the top-
down method. The construction of the trees is performedby C4.5 by finding the feature sets having distinct best char-acteristics so that on the root node of a tree, the testing of thefeatures can be performed. The nodes of the tree relate to itsfeatures and branches that relate to its values. The leaf of thetree is reciprocal to the classes, and to classify the newinstance, one needs to analyze the features that are tested atthe nodes of the tree and pursue the branch correspondingto the values noticed in an instance. The process gets termi-nated, whenever it arrives at the leaf and also the nominationof the class to its instance.
The greedy approach is used by C4.5 to construct thedecision trees which applies the information-theoretic esti-mates. For obtaining the attribute for tree root, this algorithmsplits the instances of the training into subsets which coin-cides with the attributes corresponding amount. If there isinsignificant entropy among the labels of the class in a subsetcorresponding to labels of the class in the entire trainingdataset, gaining the information is done by dividing the attri-bute. The gain ratio principle is enforced by C4.5 for the
Dataset
Transformation procedure(nominal to numeric)
Normalization procedure(minimal–maximal normalization)
CFS approach Wrapper approach
Attribute evaluator: CfsSubsetEvalSearch technique: Best first search
√m+m(m–1)nffacccv = 1
n <vi, qi>𝜖 s
Highly merit and accurate reduced various attack type dataset fromCAPPER approach
Evaluate classifier performance according to attack type
End
CAPPER (CFS +Wrapper)
CFS featuresubset
Wrapper featuresubset
Division of dataset according to various attack types
Start
Attribute evaluator: J48 AlgorithmSearch technique: Best first search
Fs =mncf
𝛿 (I(S/Si, vi), qi)
Figure 1: The simplified block diagram of hybrid NID-Shield NIDS according to various attack types.
11Wireless Communications and Mobile Computing

Calculate featurecorrelation
Feature class
Class
Feature-feature:
Search
Featureevaluation
Featureset Merit
Search
Feature Evaluation:
Machine learning algorithm
Featureset + CV
foldHypothesis
CFS
Attained the highmerit feature
subsetsfor example,
f2, f4, f6
Attained thefinest
feature subsetfor example,
f3, f5, f7
CAPPER approachfor example,
f2, f3, f4, f5, f6, f7
Transformation procedure(nominal value to
numeric value)
Machinelearning
algorithm
Hypothesis
Finalevaluation
(10 fold crossvalidation)
Estimatedaccuracy
Estimatedaccuracy
Wrapper
Division of datasets accordingto the
various attack types
Start
Stop
Dataset
Normalization procedure(Min-max normalization)
Training andtesting of
dataset
Dat
a Pr
epro
cess
ing
f1 f2 f3 f4
f1 f2
f3 f4
Evaluateclassifier
performanceaccording toattack types
Feature
Figure 2: A proposed architecture of hybrid NID-Shield network intrusion detection system
Table 2: Four categories of attack.
Attack category Name of attack
Denial of service (DoS) teardrop, smurf, neptune, back, land, pod
Probe satan, nmap, ipsweep, portsweep
User to root (U2R) loadmodule, buffer_overflow, rootkit
Remote to local (R2L) multihop, phf, ftp_write, warezclient, imap, guess_passwd, warezmaster
Table 3: Number of instances in NSL-KDD and NSL-KDD 20% training on normal and attack type.
NSL-KDD dataset Normal Probe DoS U2R R2L Total instances
NSL-KDD training 67343 11656 45927 52 995 125973
NSL-KDD 20% training 13449 2289 9234 11 209 25192
12 Wireless Communications and Mobile Computing

selection tree of the root attribute. The gain ratio principleelects those attributes which have an average or better gainbetween its distinct attributes.
By employing the algorithm iteratively, subtrees are con-structed in this algorithm. Furthermore, the algorithm termi-nates upon finding the likely subset that contains a distinctclass. The main distinction between C4.5 and ID3 is thatpruning is performed on decision trees by C4.5; hence, by
applying the pruning, the simplification is done on the deci-sion trees and has the high chance of reducing the overfittingon a training data. C4.5 performs pruning by employing theconfidence interval upper bound on the resubstitution error.The succession of the node is preceded by the best leaf, when-ever the error of the estimation of the leaf is situated within asingle standard deviation from the predicted error of a node.C4.5 is considered as an efficient algorithm, whenever the
Table 4: Features of NSL-KDD 20% dataset.
Index Feature name Type Missing Distinct Unique Mean Std. Dev.
1 duration Numeric 0 758 682 0.007 0.063
2 protocol_type Nominal 0 3 0 0.125 0.283
3 service Nominal 0 66 1 0.157 0.198
4 flag Nominal 0 11 0 0.062 0.103
5 src_bytes Numeric 0 1665 864 0 0.006
6 dst_bytes Numeric 0 3922 2377 0.001 0.017
7 land Nominal 0 2 0 0 0.009
8 wrong_fragment Numeric 0 3 0 0.008 0.087
9 urgent Numeric 0 2 1 0 0.006
10 hot Numeric 0 22 7 0.003 0.028
11 num_failed_logins Numeric 0 5 2 0 0.011
12 logged_in Numeric 0 2 0 0.395 0.489
13 num_compromised Numeric 0 28 18 0 0.012
14 root_shell Numeric 0 2 0 0.002 0.039
15 su_attempted Numeric 0 3 0 0.001 0.024
15 num_root Numeric 0 28 20 0 0.012
17 num_file_creations Numeric 0 20 13 0 0.013
18 num_shells Numeric 0 2 0 0 0.019
19 num_access_files Numeric 0 7 2 0.001 0.012
20 num_outbound_cmds Numeric 0 1 0 0 0
21 is_host_login Nominal 0 1 0 0 0
22 is_guest_login Numeric 0 2 0 0.009 0.095
23 count Numeric 0 466 70 0.164 0.225
24 srv_count Numeric 0 414 69 0.052 0.142
25 serror_rate Numeric 0 70 9 0.286 0.447
26 srv_serror_rate Numeric 0 56 25 0.284 0.448
27 rerror_rate Numeric 0 72 9 0.119 0.319
28 srv_rerror_rate Numeric 0 42 10 0.12 0.322
29 same_srv_rate Numeric 0 97 7 0.661 0.44
30 diff_srv_rate Numeric 0 79 14 0.062 0.179
31 srv_diff_host_rate Numeric 0 57 4 0.096 0.257
32 dst_host_count Numeric 0 256 1 0.716 0.388
33 dst_host_srv_count Numeric 0 256 1 0.451 0.434
34 dst_host_same_srv_rate Numeric 0 101 0 0.52 0.449
35 dst_host_diff_srv_rate Numeric 0 101 0 0.083 0.187
36 dst_host_same_src_port_rate Numeric 0 101 0 0.147 0.308
37 dst_host_srv_diff_host_rate Numeric 0 63 8 0.032 0.111
38 dst_host_serror_rate Numeric 0 100 5 0.286 0.445
39 dst_host_srv_serror_rate Numeric 0 88 19 0.28 0.446
40 dst_host_rerror_rate Numeric 0 101 0 0.118 0.306
41 dst_host_srv_rerror_rate Numeric 0 100 7 0.119 0.317
13Wireless Communications and Mobile Computing

efficacy regarding the machine learning algorithm is assessed;also, it is fast, robust, and accurate whenever the knowledge isbrought in. Moreover, it performs well with feature subsetselection on the relevant and redundant data, thus aiding inincreasing the accuracy.
3. The Proposed Hybrid NID-Shield NetworkIntrusion Detection System
This section introduces the various techniques applied by thehybrid NID-Shield NIDS. The data preprocessing steps areperformed by applying the transformation and normaliza-tion operations on datasets, and then, an effective hybrid fea-ture subset selection technique called CAPPER is applied forobtaining the accurate and highest merit feature subsets.Finally, the hybrid NID-Shield NIDS is suggested as a wholeexclusively.
3.1. Data Preprocessing. In data preprocessing, the transfor-mation and normalization operation is performed on NSL-KDD 20% dataset. It can help to better expose the underlyingstructure of the data to the learning algorithm and, in turn,may result in better predictive performance.
3.1.1. Data Transformation. In the transformation operation,the nominal values are converted to numeric values. TheIDSs are considered as the classification issue and some clas-sification approaches are not able to handle the nominal fea-tures [66]. In the NSL-KDD 20% dataset, the attributes suchas protocol_type, service, and flag are transformed fromnominal to numeric values and the final NSL-KDD 20%dataset contains the entire numeric values for the classifica-tion process.
3.1.2. Data Normalization. Data normalization is an essentialparadigm, specifically in the area of classification. Theinstances are observed as a multidimensional area in the lin-ear classification approaches. Without normalization, fewobjective functions do not work accordingly due to the widevariations of raw data. For example, if the particular featurehas wide value ranges, then the range within the points iscontrolled by the distinct feature. Thus, normalization ofthe numeric features needs to be done so that every featureprovides nearly proportional to the eventual distance. There-fore, by applying the normalization, there is a significantimprovement in accuracy and speed. For this study,minimal-maximal normalization approach is applied to thedataset. The minimal-maximal normalization is given as
z = x −minimal xð Þmaximal xð Þ −minimal xð Þ½ � : ð2Þ
The minimal-maximal normalization technique linearlyscales each feature to the interval of [0, 1]. Resizing of theinterval [0, 1] is performed by altering every feature valuesuch that the minimum value is 0, and then, division is per-formed by the current maximum value. The current maxi-mum value is the change among the initial maximum valueand minimum value which is obtained from equation (2).
3.2. Feature Selection Approaches. A hybrid feature subsetselection approach named CAPPER [67] is employed for fea-ture subset selection that combines the feature subsets fromthe CFS and Wrappers for the feature subset selectionmethod. This section introduces the CAPPER approach.
3.2.1. Correlation-Based Feature Subset Approach. CFS is thefilter method that utilizes correlation-based searching for theappraisal of the feature subsets. The feature subset ranking isaccomplished by conferring to correlation-based searching.The bias is accessed to those subsets which are greatly corre-lated to its class and uncorrelated among them. Thisapproach ignores the features that are irrelevant and havingfewer correlations among its class. The screening is appliedto the features which are redundant and hugely correlatedamong its class. The acceptance of the features is done bythe CFS when the residual features do not predict the pre-dicted class in the instant space.
FS =mncfffiffiffiffiffiffiffiffiffiffiffiffiffiffiffiffiffiffiffiffiffiffiffiffiffiffiffiffiffiffiffiffiffiffi
m +m m − 1ð Þ nf f
q , ð3Þ
where FS is the heuristic merit of the feature subset S havingthe m features, nff is the average feature-feature intercorrela-tion, and ncf are the feature mean class correlation. Thesearching of the space is performed with the help of a best-first approach. The high-quality subset of the features isobtained by equation (3), which aids in reducing the dimen-sional reduction of testing and training data. Moreover, thenumerator of equation (3) illustrates that how remarkablythe class predictability is with feature sets and the denomina-tor denotes the redundancy between the features.
3.2.2. Wrapper Subset Selection Approach. In the Wrapperapproach, the feature subset selector is performed with thehelp of an induction approach. The searching of the featuresubset space is performed with the help of backward elimina-tion and forward selection methods. The backward elimina-tion begins with complete feature sets and removing thosefeatures that degrade the performance. The forward selection
Table 5: Total instances in UNSW-NB 15 training and testingdataset.
S.no. Total instancesTraining dataset(UNSW-NB15)
Testing dataset(UNSW-NB15)
1 Normal 56000 37000
2 DoS 12264 4089
3 Fuzzers 18184 6062
4 Analysis 2000 677
5 Worms 130 44
6 Exploits 33393 11132
7 Shellcode 1133 378
8 Generic 40000 18871
9 Reconnaissance 10491 3496
10 Backdoor 1746 583
14 Wireless Communications and Mobile Computing

begins with empty feature sets and starts adding the good fea-tures. The goal of this approach is to obtain the state with thehighest appraisal by applying the heuristic function. For the
appraisal function, the five fold cross-validation approach isperformed, and it is replicated numerous times by examiningthe accuracy estimation and its standard deviation. The k
Table 6: Features of UNSW-NB 15 dataset.
Index Feature name Type Missing Distinct Unique Mean Std. Dev.
1 id Numeric 0 82332 82332 0.5 0.289
2 dur Numeric 0 39888 35946 0.017 0.079
3 proto Nominal 0 131 0 0 0.002
4 service Nominal 0 13 0 0.26 0.438
5 state Nominal 0 7 2 0.047 0.5
6 spkts Numeric 0 420 174 0.002 0.013
7 dpkts Numeric 0 436 205 0.002 0.01
8 sbytes Numeric 0 4489 2570 0.001 0.012
9 dbytes Numeric 0 4034 2446 0.001 0.01
10 rate Numeric 0 40616 32279 0.082 0.149
11 sttl Numeric 0 11 1 0.71 0.398
12 dttl Numeric 0 8 0 0.378 0.461
13 sload Numeric 0 42873 38993 0.012 0.034
14 dload Numeric 0 40614 37491 0.03 0.115
15 sloss Numeric 0 253 101 0.001 0.012
15 dloss Numeric 0 311 124 0.001 0.01
17 sinpkt Numeric 0 39970 36718 0.013 0.103
18 dinpkt Numeric 0 37617 34993 0.002 0.022
19 sjit Numeric 0 39944 37503 0.004 0.038
20 djit Numeric 0 38381 36358 0.001 0.008
21 swin Nominal 0 11 9 0.523 0.499
22 stcpb Numeric 0 39219 37322 0.253 0.324
23 dtcpb Numeric 0 39108 37295 0.25 0.322
24 dwin Numeric 0 14 11 0.503 0.5
25 tcprtt Numeric 0 26130 22613 0.015 0.03
26 synack Numeric 0 24934 20749 0.009 0.022
27 ackdat Numeric 0 24020 19622 0.009 0.019
28 smean Numeric 0 1282 178 0.078 0.141
29 dmean Numeric 0 1222 236 0.078 0.163
30 trans_depth Numeric 0 8 4 0.001 0.004
31 response_body_len Numeric 0 1190 809 0 0.007
32 ct_srv_src Numeric 0 57 0 0.138 0.179
33 ct_state_ttl Numeric 0 7 1 0.228 0.178
34 ct_dt_ltm Numeric 0 50 1 0.082 0.145
35 ct_src_dport_ltm Numeric 0 50 1 0.068 0.145
36 ct_dst_sport_ltm Numeric 0 33 1 0.072 0.16
37 ct_dst_src_ltm Numeric 0 57 0 0.104 0.184
38 is_ftp_login Numeric 0 3 0 0.004 0.046
39 ct_ftp_cmd Numeric 0 3 0 0.004 0.046
40 ct_ftw_http_mthd Numeric 0 8 0 0.008 0.04
41 ct_src_ltm Numeric 0 50 1 0.093 0.145
42 ct_srv_dst Numeric 0 57 0 0.134 0.182
43 is_sm_ips_ports Numeric 0 2 0 0.011 0.105
44 attack_cat Nominal 0 10 0 0.074 0.261
45 label Numeric 0 2 0 0.551 0.497
15Wireless Communications and Mobile Computing

-fold cross-validation is also called an out-of-sample test orrotation estimation. S is the original sample, which splits intofolds of S1, S2, S3,...,Sn relatively identical size every time t Єf1, 2,:⋯ , kg trained on S \ St and tested on St . The inductionapproach is tested and trained k times. The estimation of thecross-validation accuracy is the comprehensive figure ofaccurate classifications divided from the total instances fromthe dataset. Let Si is the testing set that contains the instancespi = <vi, qi > ; then, the estimation of cross-validation accu-racy is obtained as
acccv =1n
〠<vi ,qi>Є S
δ I S \ Si, við Þ, qið Þ: ð4Þ
The best-first approach is applied as the search tech-nique. Upon arriving at the goal, the best-first search usuallyterminates. The accuracy estimation is obtained from equa-tion (4). By combining the feature subsets from Wrapperand CFS approaches, CAPPER attains the accurate andhigh-quality feature subsets.
3.3. Ensemble Learning. Ensemble learning [68] was initiallyevolved in automated decision-making systems to lessenthe variance and thus increase the accuracy. The problemsin machine learning domains such as error correction, esti-mation confidence, missing features, and cumulative learningare strongly addressed by ensemble learning techniques.Ensemble learning is widely used in the area of pattern recog-nition, artificial intelligence, machine learning, data mining,and neural networks. Ensemble learning has proved its effi-ciency and functionality in an extensive area of real-worldproblems.
The ensemble learning combines various base learners orweak learners and integrates them to make a strong learner.The superiority of ensemble learning is that it increases theaccuracy of the weak learning system so that the comprehen-sive accuracy of the classifier on the training datasets isincreased as compared to the single base learning algorithms.
3.3.1. Stacking. In stacking [69], the cardinal classifier obtainsa new dataset from the original datasets. If the same instancesare generated from the original dataset by the cardinal classi-fier, then there is high speculation that the data gets over-fitted, which is the primary reason the datasets withcontemplating nature need to be obtained for discardingthe overfitting of the data. There is a suggestion to use thecross-validation approach for the new instances of the cardi-nal classifier; also, the group of features has to be consideredfor the contemporary training dataset and the different cate-gories of the learning algorithms on the Meta-learner. Dis-tinct learning algorithms are applied for obtaining thecardinal learner. Then, the new datasets are used withMeta-learner to train the data. Stacking is the induction ofnumerous machine learning approaches.
3.4. k-Fold Cross-Validation. Cross-validation techniques arefrequently mentioned as test/train holdout approach by theresearchers. In the k-fold cross-validation [70], the repetitionon the dataset is performed k times. At every round, the data-
set is split into k parts; one part is applied for the validationand the residual k-1 parts of the datasets are combined intoa training subset for appraisal of the model. In k-fold cross-validation, a complete set of testing and training data is used,and the main idea of this technique is to lessen the fatalisticbias by applying the major number of training data whilekeeping the large testing datasets separately. The folds ofthe test data do not overlap each other. In k-fold cross-valida-tion, each of the samples is applied for validation. Sometimes,it is necessary to choose the exact value of k to avoid the highbias in the model. Usually, the value of k = 10 is chosenmostly, as the various experimental results show that themodel has small bias and low variance whenever this valueis applied. The results from this approach are then combinedor averaged to generate the distinct estimation.
3.5. The Proposed Hybrid NID-Shield Network IntrusionDetection System Using Hybrid Feature Selector. The prelim-inary design approach behind the hybrid NID-Shield is theclassification of datasets according to different attack types.The advantage of classification of the dataset according toattack types is that it can find a set of arbitrary features.Moreover, the attack names found in the attack types helpin predicting the vulnerability of individual attacks in variousnetworks. Distinct machine learning algorithms are analyzedas per the individual attack types. The machine learning algo-rithms having high accuracy; low FPR are selected for differ-ent attack types and applied in the designing of the hybridNID-Shield NIDS. The hybrid NID-Shield NIDS applies thehybrid approach called CAPPER for selecting the optimalfeature subsets. The hybrid CAPPER approach for featureselection combines the optimal feature subsets from theCFS and Wrappers for the feature subset selection method.From the CFS approach, a prominently superior feature sub-set is obtained which is independent of irrelevant and redun-dant features. The wrapper method uses induction learningalgorithms to attain a highly accurate feature subset. By com-bining the filter and wrapper approaches, high merit andaccurate feature subsets are obtained which is then appliedfor training and testing purposes.
For designing the hybrid NID-Shield NIDS, single andensemble learning algorithms are used together so that ahigh-performance rate and lower FPR can be achieved. Test-ing is performed with single and ensemble learning algo-rithms; it has been found that ensemble learning achievedhigh-performance results, where the NSL–KDD 20% havingfewer samples in some of its attack types. The high-performance classifier is determined for different attacktypes, and for the classifier performance, the k-fold cross-
Table 7: Confusion matrix.
ClassPredicted negative
classPredicted positive
class
Actual negativeclass
FP TN
Actual positiveclass
TP FN
16 Wireless Communications and Mobile Computing

validation approach is applied. The advantage of this methodis that all observations are used for training and validation,and each observation is used for validation exactly once.For the classification problem, a cross-validation techniquewith 10-fold is applied. The folds are selected in a mannersuch that every fold consists of the approximately identicaldistribution of the class. To test the network data accordingto attack type, the various attack type data are passed to dif-ferent layers of the hybrid NID-Shield NIDS; the high-performance classifier determines the data as normal orattack type. Figure 1 depicts the simple block diagram ofthe hybrid NID-Shield network intrusion detection systemand Figure 2 displays the architecture of the hybrid NID-Shield NIDS.
Table 8: DOS attack evaluated with hybrid NID-Shield NIDS approach.
(a)
Total instances 22,683
Correctly classified instances 22,679 (99.98%)
Incorrectly classified instances 4 (0.00176%)
Execution time 6.77 seconds
Kappa measures 0.9997
MAE 0.0003
RMSE 0.0081
RAE 0.2207%
RRSE 2.9778%
(b)
Accuracy TP rate FP rate Precision Recall F-measure MCC ROC area PRC area Class
100% 1.000 0.000 1.000 1.000 1.000 1.000 1.000 1.000 normal
100% 1.000 0.000 1.000 1.000 1.000 1.000 1.000 1.000 back
100% 1.000 0.000 1.000 1.000 1.000 1.000 1.000 1.000 land
100% 1.000 0.000 1.000 1.000 1.000 1.000 1.000 1.000 neptune
94.7% 0.947 0.000 0.973 0.947 0.960 0.960 1.000 0.997 pod
99.6% 0.996 0.000 0.998 0.996 0.997 0.997 1.000 1.000 smurf
100% 1.000 0.000 1.000 1.000 1.000 1.000 1.000 1.000 teardrop
Weighted Avg. 100% 1.000 0.000 1.000 1.000 1.000 1.000 1.000 1.000
(c)
Confusion matrixa b c d e f g
13,449 0 0 0 0 0 0
0 196 0 0 0 0 0
0 0 4 0 0 0 0
0 0 0 8279 0 0 0
0 0 1 0 36 1 0
0 0 0 0 2 527 0
0 0 0 0 0 0 188
a—classified as normal, b—classified as back, c—classified as land, d—classified as neptune, e—classified as pod, f—classified as smurf, g—classified asteardrop.
90
92
94
96
98
100Accuracy
norm
al
back
land
neptun
e
pod
smurf
teardrop
Figure 3: Accuracy of the normal and attack types evaluated by theNID-Shield NIDS on DoS attack.
17Wireless Communications and Mobile Computing

4. Dataset Characteristics
For the performance of the hybrid NID-Shield NIDS, twocontemporary UNSWNB-15 and NSL-KDD 20% datasetsare utilized for evaluation purposes. These datasets arerelated to cybersecurity and are high-dimensional and classimbalanced datasets [71]. For the NSL-KDD dataset, the sta-tistical prevalence of around 36% was found in denial of ser-vice (DoS), while for other attack types like Root to Local(R2L) and User to Root (U2R), the prevalence is lesser than1%. This shows that NSL-KDD is a highly imbalanced data-
set. For the UNSW-NB15 dataset, the normal class frequencyis about 32%, while attack type frequency is very few and dif-fers highly. For example, Worms and Exploits attack patternsvary around 257 times. This reflects that UNSW-NB15 is ahighly imbalanced dataset.
4.1. NSL-KDD Dataset. From DARPA 98 intrusion detectionsystem appraisal programs, the KDD-Cup ‘99 dataset isobtained and widely applied dataset in the domain of IDS,but the main disadvantage of the KDD-Cup ‘99 datasetshas various duplicate and redundant records. The duplicaterecords have a total of 75%. The redundant record has a totalof 78%. Due to this duplication and redundant informationhinders from categorizing the additional records [72]. Anew NSL-KDD dataset was suggested [73] that does not con-tain the duplicate and redundant records in testing and train-ing data [74], which aided in removing the duplicate andredundant issues which is an implicit issue in KDD-Cup ‘99dataset. The arrangements of elected records from everyadversity class level are inversely proportional to the percentof records available in the standard KDD datasets. With theseresults, the classifying rates of apparent machine learningapproaches differ in an extensive range that makes it moreefficient to obtain a precise appraisal of distinct learningapproaches. The statistical records in the training and testingsets are feasible that causes it to be reasonable to conduct theexperiments on an entire set, thus preventing the unneces-sary need to randomly select the limited part. Therefore,
0.9
0.92
0.94
0.96
0.98
1TP-Rate
norm
al
back
land
neptun
e
pod
smurf
teardrop
Figure 4: TP rate of the normal and attack types evaluated by theNID-Shield NIDS on DoS attack.
0 0 0 0 0 0 00
0.2
0.4
0.6
0.8
1FP-Rate
norm
al
back
land
neptun
e
pod
smurf
teardrop
Figure 5: FP rate of the normal and attack types evaluated by theNID-Shield NIDS on DoS attack.
0.9
0.92
0.94
0.96
0.98
1Precision
norm
al
back
land
neptun
e
pod
smurf
teardrop
Figure 6: Precision of the normal and attack types evaluated by theNID-Shield NIDS on DoS attack.
0.9
0.92
0.94
0.96
0.98
1Recall
norm
al
back
land
neptun
e
pod
smurf
teardrop
Figure 7: Recall of the normal and attack types evaluated by theNID-Shield NIDS on DoS attack.
0.9
0.92
0.94
0.96
0.98
1F-Measure
norm
al
back
land
neptun
e
pod
smurf
teardrop
Figure 8: F-measure of the normal and attack types evaluated bythe NID-Shield NIDS on DoS attack.
18 Wireless Communications and Mobile Computing

the classified results will be persistent and proportionate.There are entirely 37 attacks in a testing dataset out of which21 different attacks are of training dataset and the remainingattacks are available only for testing the data. Table 2 showsthe four categories of attack. Table 3 depicts the total numberof instances on the distinct attack types and normal and onthe NSL-KDD and 20% of the NSL-KDD training dataset.The attack classes are categorized into Probe, DoS, U2R,and R2L categories, and Table 4 shows the features of theNSL-KDD 20% dataset.
(i) Denial of service (DoS). These kinds of attack resultin the unavailability of computing resources to legit-imate users. The intruder overloads the resources, byaccomplishing the resources of the computer active,so that authentic users are unable to utilize the fullresources of the computer. In DoS, there are 13449normal instances and 9234 attack instances withsix attack names, namely, neptune, smurf, back,teardrop, pod, and land
(ii) Probe. The intruder gathers the knowledge from thenetworks or hosts and scans the whole networks orhosts that are prone to attacks. An intruder thenexploits the system vulnerabilities by looking at theknown security breaches so that the whole systemis compromised for malicious purposes. In Probe,there are 13449 normal instances and 2289 attackinstances with four attack names, namely, nmap,ipsweep, satan, and portsweep
(iii) User to root (U2R). An intruder tries to acquireaccessing the system roots or the administrator priv-ileges by sniffing the passwords. The attacker thenlooks for the vulnerabilities in the system, to acquirethe gain of the administrator authorization. In U2R,there are 13449 normal instances and 11 attackinstances with three attack names, namely, loadmo-dule, buffer_overflow, and rootkit
(iv) Root to local (R2L). The intruder attempts by gaininga connection to the remote machine, which does not
Table 9: Probe attack evaluated with hybrid NID-Shield NIDS approach without stacking.
(a)
Total instances 15,738
Correctly classified instances 15,685
Incorrectly classified instances 53
Execution time 4.23 seconds
Kappa measures 0.9872
MAE 0.0034
RMSE 0.0343
RAE 3.1818%
RRSE 14.9173%
(b)
Accuracy TP rate FP rate Precision Recall F-measure MCC ROC area PRC area Class
99.9% 0.999 0.016 0.997 0.999 0.998 0.988 1.000 1.000 normal
99.3% 0.993 0.000 1.000 0.993 0.997 0.996 0.999 0.998 portsweep
96.8% 0.968 0.000 0.999 0.968 0.983 0.982 0.999 0.996 satan
99.3% 0.993 0.001 0.989 0.993 0.991 0.990 1.000 0.996 ipsweep
95.3% 0.953 0.000 0.976 0.953 0.965 0.964 0.998 0.992 nmap
Weighted Avg. 99.7% 0.997 0.014 0.997 0.997 0.997 0.988 1.000 0.999
(c)
Confusion matrixa b c d e
13441 0 1 0 3
2 593 0 0 0
4 0 679 1 2
2 0 0 718 2
0 0 0 3 287
a—classified as normal, b—classified as portsweep, c—classified as satan, d—classified as ipsweep, and e—classified as nmap.
19Wireless Communications and Mobile Computing

have the necessary and legal privilege to access thatmachine. The attacker then exploits the susceptibil-ity of the remote system and tries gaining accessrights to the remote machine. There are 13449 nor-mal instances and 209 attack instances in this data-set. There are eight attack names in this dataset,namely, ftp_write, guess_passwd, multihop, phf,imap, warezclient, spy, and warezmaster
4.2. UNSW-NB15 Dataset. The UNSW-NB15 [75] datasetwas generated at the cyber range lab by the IXIA Perfect-Storm tool at the Center for cybersecurity, Australia. Thereare 2,540,044 records in the dataset. The part of the datasetis further divided into train and test sets. There are 82,332records in the testing set and 1,75,341 records in the trainingset, having normal and attack instances. There are 45 featuresin this dataset obtained in immaculate format, including classand label. Moreover, there are nine attack types in a UNSW-NB15 dataset: DoS, Analysis, Backdoor, Exploit, Fuzzers,Generic, Worm, Shellcode, and Reconnaissance and a Nor-mal instance. Table 5 shows the total instances in UNSW-
NB 15 training and testing dataset, and Table 6 depicts theUNSW-NB 15 dataset and its features.
For the evaluation of the proposed approach, themachine learning workbench tool, Weka 3.8 [76], is used.In Weka, the Wrapper approach, the CFS approach, andthe classifier algorithms like J48, Naïve Bayes, and Randomforest are implemented in Java, and evaluation of code isaccomplished on Intel i3 8100 processor with 2.20GHz hav-ing 4.00GB RAM and carried out on NetBeans 8.0.2.
5. Performance Metrics
For validation of the results, this section presents variousperformance evaluation metrics. The researchers apply falsenegative (FN), true negative (TN), true positive (TP), falsepositive (FP), etc. [77] for the justification of the results.
Definition 1 (confusion matrix). Also called error metric,which allows the interaction among actual and predictedclasses. It is significant for calculating precision, recall, accu-racy, specificity, AUC, and ROC curve. On the testing
Table 10: Probe attack evaluated with hybrid NID-Shield NIDS approach with stacking.
(a)
Total instances 15,738
Correctly classified instances 15,690
Incorrectly classified instances 48
Execution time 42.99
Kappa measures 0.9884
MAE 0.002
RMSE 0.0318
RAE 1.8696%
RRSE 13.82%
(b)
Accuracy TP rate FP rate Precision Recall F-measure MCC ROC area PRC area Class
99.9% 0.999 0.010 0.998 0.999 0.999 0.990 0.999 1.000 normal
99.7% 0.997 0.000 1.000 0.997 0.998 0.998 1.000 1.000 portsweep
97.7% 0.977 0.000 0.993 0.977 0.985 0.984 0.995 0.990 satan
99.3% 0.993 0.001 0.987 0.993 0.990 0.990 0.999 0.994 ipsweep
96.3% 0.963 0.001 0.967 0.963 0.965 0.964 0.997 0.986 nmap
Weighted Avg. 99.7% 0.997 0.009 0.997 0.997 0.997 0.990 0.999 0.999
(c)
Confusion matrixa b c d e
13435 0 5 5 4
2 585 0 0 0
8 2 675 1 2
1 2 0 705 4
3 2 4 3 290
a—classified as normal, b—classified as portsweep, c—classified as satan, d—classified as ipsweep, and e—classified as nmap.
20 Wireless Communications and Mobile Computing

dataset, the confusion matrix allows visualizing the algo-rithms’ efficiency and is usually adapted to describe the clas-sifier performance. Table 7 shows the confusion matrix.
Definition 2 (accuracy). The proportion of correct predic-tions of calculating the classification instances precisely isobtained from
acc =TP + TN
TN + FN + TP + FPð Þ : ð5Þ
Definition 3 (error rate). The proportion of whole predictionsdone that are classified falsely: it is given by
ERR = 1 − acc: ð6Þ
Definition 4 (true positive). The intrusions are accuratelyclassified as an attack by the intrusion detection systems. Itis also called sensitivity, recall, or detection rate. It is obtainedfrom
TPR =TP
TP + FN: ð7Þ
Definition 5 (false positive). The usual patterns which aremisclassified as attacks and calculated as
FPR = FPFP + TN
: ð8Þ
Definition 6 (true negative). The usual patterns that are pre-cisely analyzed as normal and obtained from
TNR = 1 − FPR: ð9Þ
Definition 7 (false negative). The intrusions misclassified asnormal and obtained from
FNR = 1 − TPR: ð10Þ
Definition 8 (precision). The behaviors that are exactlyarrayed as attacks and given by
Precision =TP
FP + TP: ð11Þ
Definition 9 (F-measure). It is interpreted as the harmonicmean of recall and precision. Also known as F-score or F-value and calculated as
FM = 2 ×precision x recallprecision + recall
: ð12Þ
Definition 10 (Matthews’s correlation coefficient). Appliedonly in the binary intrusion detection system in which it
95
96
97
98
99
100Accuracy
norm
al
portsw
eep
satan
ipsw
eep
nmap
Figure 9: Accuracy of the normal and attack types evaluated by theNID-Shield NIDS on Probe attack.
0.95
0.96
0.97
0.98
0.99
1TP-Rate
norm
al
portsw
eep
satan
ipsw
eep
nmap
Figure 10: TP-Rate of the normal and attack types evaluated by theNID-Shield NIDS on Probe attack.
0 0 0.001 0.00100.0020.0040.0060.0080.010.012
FP-Rate
norm
al
portsw
eep
satan
ipsw
eep
nmap
Figure 11: FP-Rate of the normal and attack types evaluated by theNID-Shield NIDS on Probe attack.
0.95
0.96
0.97
0.98
0.99
1Precision
norm
al
portsw
eep
satan
ipsw
eep
nmap
Figure 12: Precision of the normal and attack types evaluated by theNID-Shield NIDS on Probe attack.
21Wireless Communications and Mobile Computing

computes the observed and predicted values of binary classi-fication. It is calculated by
MCC =TPxTNð Þ − FPxFNð Þffiffiffiffiffiffiffiffiffiffiffiffiffiffiffiffiffiffiffiffiffiffiffiffiffiffiffiffiffiffiffiffiffiffiffiffiffiffiffiffiffiffiffiffiffiffiffiffiffiffiffiffiffiffiffiffiffiffiffiffiffiffiffiffiffiffiffiffiffiffiffiffiffiffiffiffiffiffiffiffiffi
TP + FPð Þ TP + FNð Þ TN + FPð Þ TN + FNð Þp :
ð13Þ
Definition 11 (kappa statistic). It is applied to calculate theconcurrence between observed and predicted values of thedatasets, while the concurrence is corrected that occurs unex-pectedly. It is calculated by
k =p0 − pe1 − pe
, ð14Þ
where p0 is the comparative noticed concurrence between theestimates and pe is the assumed likelihood of possibleconcurrence.
Definition 12 (mean absolute error). It is the averaging of themagnitude of the distinctive error and the computing thestandard of absolute errors. It is calculated as
MAE =p1 − a1j j+⋯+∣pn − an ∣
n, ð15Þ
where p1 is the value predicted on the test instances and a1 isthe actual value.
Definition 13 (root mean-squared error). The RMSE calcu-lates the dissimilarities among observed values and predictedvalues of a model. It is given by
RMSE =ffiffiffiffiffiffiffiffiffiffiffiffiffiffiffiffiffiffiffiffiffiffiffiffiffiffiffiffiffiffiffiffiffiffiffiffiffiffiffiffiffiffiffiffiffiffiffiffip1 − a1ð Þ2+⋯+ pn − anð Þ2
n
r, ð16Þ
where p1 is the value predicted on the test instances and a1 isthe actual value.
Definition 14 (relative absolute error). The errors are normal-ized from the errors of simple predictors in which the averagevalue is predicted. It is calculated as
RAE =p1 − a1j j+⋯+∣pn − an ∣∣a1 − �a∣+⋯+∣an − �a ∣
, ð17Þ
where p1 is the value predicted on the test instances and a1 isthe actual value.
Definition 15 (root relative squared error). It normalizes thetotal squared error by division of the total squared error fromthe simple predictor. It is obtained from
RRSE =
ffiffiffiffiffiffiffiffiffiffiffiffiffiffiffiffiffiffiffiffiffiffiffiffiffiffiffiffiffiffiffiffiffiffiffiffiffiffiffiffiffiffiffiffiffiffiffiffip1 − a1ð Þ2+⋯+ pn − anð Þ2a1 − �að Þ2+⋯+ an − �að Þ2
s, ð18Þ
where p1 is the value predicted on the test instances and a1 isthe actual value.
Definition 16 (AUC and ROC). ROC explains detection ratiochanges in contrast to its internal verge to develop a high orlow FPR. The larger the AUC values, the better the perfor-mance of the classifier.
5.1. Performance Evaluation with NSL-KDD 20% accordingto Attack Types. This section evaluates the DOS, Probe,U2R, and R2L, the types of attack of the NSL-KDD 20% data-set. The NID-Shield NIDS is assessed with J48 as an attributeselection approach, and finally, the selected attributes areappraised with a machine learning algorithm as a classifier.
5.1.1. Evaluation of DoS Attack with Normal and AttackInstances on Hybrid NID-Shield NIDS
(1) DoS Attack Evaluated with Hybrid NID-Shield NIDS. Thefollowing algorithms were applied for evaluation of featuresubsets: attribute evaluator: CAPPER, attribute evaluatoralgorithm: J48, search method: best first, classifier evaluator:random forest.
The CAPPER evaluated subsets are as follows: 3, 4, 5, 6, 7,8, 10, 12, 23, 24, 25, 29, 30, 36, 38, and 41.
In this section, the DoS attack is evaluated by the hybridNID-Shield NIDS on the DoS attack dataset. The CAPPER
0.95
0.96
0.97
0.98
0.99
1Recall
norm
al
portsw
eep
satan
ipsw
eep
nmap
Figure 13: Recall of the normal and attack types evaluated by theNID-Shield NIDS on Probe attack.
0.95
0.96
0.97
0.98
0.99
1F-Measure
norm
al
portsw
eep
satan
ipsw
eep
nmap
Figure 14: F-measure of the normal and attack types evaluated bythe NID-Shield NIDS on Probe attack.
22 Wireless Communications and Mobile Computing

feature selector obtains the highest merit and accurate featuresubsets from the combination of CFS and Wrapperapproaches. Table 8 depicts the metrics of the DoS attackwith its attack names classified individually. In the DoS, thereare six attacks, namely, neptune, back, land, smurf, pod, andteardrop, and the normal instances. Figure 3 shows that theNID-Shield NIDS achieved an accuracy of 100% on the nor-mal instances and 100% accuracy on the attack names suchas land, back, teardrop, and neptune, while on the names ofthe attack such as pod and smurf, the NID-Shield NIDSachieves an accuracy of 94.7% and 99.6%, respectively. Over-all, the weighted average of the accuracy of the normal andattack names is calculated; the NID-Shield NIDS achieves100% accuracy on normal and all the attack types. Figure 4shows the NID-Shield NIDS achieved a TP rate of 1.000 onthe normal instances and a TP rate of 1.000 on attack namessuch as land, back, teardrop, and neptune, while on the attacknames such as pod and smurf, the NID-Shield NIDS achievesa TP rate of 0.947 and 0.996, respectively. Overall, theweighted average of the TP rate is measured on normal andall attack names; the NID-Shield NIDS achieves 100% TPrate on normal and all attack names. Figure 5 depicts theFP rate evaluated by the NID-Shield NIDS on normal and
attacks names, the NID-Shield NIDS achieves a 0.000 false-positive rate on all attack names, and an FP rate of 0.000 isachieved on the normal instance.
Figure 6 illustrates the precision of the NID-Shield NIDSwhich is assessed with normal and attack names. The NID-Shield NIDS obtained a precision of 1.000 on all normalinstances and a precision of 1.000 on attack names such asneptune, back, land, and teardrop, while the precision of0.998 and 0.973 is obtained on smurf and pod attack by theNID-Shield NIDS. Overall, a weighted average of 1.000 isobtained on precision for normal instances and attack names.Figure 7 depicts the recall appraised with NID-Shield NIDSon normal and attack names, the normal instances achievea recall of 1.000 by the NID-Shield NIDS, and the attacknames such as neptune, land, back, and teardrop achieve arecall of 1.000 by the NID-Shield NIDS, while the NID-Shield NIDS achieves a recall 0.996 and 0.947 on the attacknames such as smurf and pod, respectively. Overall, theweighted average of recall is appraised for normal and alltypes of attack names; the NID-Shield NIDS obtained a recallof 1.000 on normal and attack names. Figure 8 depicts the F-measure of the NID-Shield NIDS appraised with the normaland attack names; the NID-Shield NIDS achieves an F
Table 11: U2R attack evaluated with hybrid NID-Shield NIDS approach.
(a)
Total instances 13,460
Correctly classified instances 13,460
Incorrectly classified instances 0
Execution time 1.86 seconds
Kappa measures 1
MAE 0.0003
RMSE 0.0066
RAE 11.2411%
RRSE 19.9452%
(b)
Accuracy TP rate FP rate Precision Recall F-measure MCC ROC area PRC area Class
100% 1.000 0.000 1.000 1.000 1.000 1.000 1.000 1.000 normal
100% 1.000 0.000 1.000 1.000 1.000 1.000 1.000 1.000 buffer_overflow
100% 1.000 0.000 1.000 1.000 1.000 1.000 1.000 1.000 loadmodule
100% 1.000 0.000 1.000 1.000 1.000 1.000 1.000 1.000 rootkit
Weighted Avg. 100% 1.000 0.000 1.000 1.000 1.000 1.000 1.000 1.000
(c)
Confusion matrixa b c d
13423 0 0 0
0 7 0 0
0 0 13 0
0 0 0 17
a—classified as normal, b—classified as buffer_overflow, c—classified as loadmodule, and d—classified as rootkit.
23Wireless Communications and Mobile Computing

-measure of 1.000 on normal instances and attack namessuch as neptune, land, back, and teardrop; and the NID-Shield NIDS achieves an F-measure of 1.000, while for attacknames such as smurf and pod, the NID-Shield NIDS obtainsthe F-measure of 0.997 and 0.960, respectively. Overall, theweighted average is appraised for F-measure on normaland all attack names; the NID-Shield NIDS obtained an F-measure of 1.000 on normal and attack names. For the
MCC, the NID-Shield NIDS is appraised with the normaland attack names; the NID-Shield NIDS achieves an MCCof 1.000 on normal instances and with attack names suchas neptune, back, land, teardrop; and the NID-Shield NIDSachieves an MCC of 1, while for attack names such as smurfand pod, the NID-Shield NIDS obtains theMCC of 0.997 and0.960, respectively. Overall, the weighted average of MCC ismeasured for normal and on all attack names; the NID-Shield NIDS obtained an MCC of 1.00, respectively.
For the ROC area, the NID-Shield NIDS achieves anoverall 1.000 on normal and all attack names, respectively.For the PRC area, the NID-Shield NIDS obtained a 1.000on normal instances, while for attack names such as land,back, teardrop, smurf, and neptune, the NID-Shield NIDSobtained a PRC area of 1.000 and for attack names calledpod, the NID-Shield NIDS obtained a PRC area of 0.997.Overall, the weighted average is calculated for the PRC areaon normal and all attack names; the NID-Shield NIDSachieved a PRC area of 1.000 on normal and all attack names.
5.1.2. Evaluation of Probe Attack with Normal and AttackInstances on Hybrid NID-Shield NIDS
(1) Probe Attack Evaluated with Hybrid NID-Shield NIDS.The following algorithms were applied for evaluation of fea-ture subsets: attribute evaluator: CAPPER, attribute evaluatoralgorithm: J48, search method: best first, classifier evaluator:random forest.
The CAPPER evaluated subsets are as follows: 2, 3, 4, 12,24, 27, 29, 31, 32, 35, 36, 37, and 40.
In this section, the Probe attack is evaluated with thehybrid NID-Shield NIDS on the Probe attack dataset. Thestacking is applied for further improvement of the metrics.The stacked ensemble applies the random forest plus theNaive Bayes as a base classifier. Table 9 shows the Probeattack evaluation metrics without stacking ensemble, andTable 10 shows the evaluation of the Probe attack with astacked ensemble. A considerable improvement in the FPrate is noticed when the NID-Shield NIDS is evaluated witha stacked ensemble. In the Probe attack, there are fourattacks, namely, portsweep, satan, ipsweep, and nmap, and
95
96
97
98
99
100Accuracy
norm
al
buffer_overflo
w
loadmod
ule
rootkit
Figure 15: Accuracy of the normal and attack types evaluated by theNID-Shield NIDS on U2R attack.
0.95
0.96
0.97
0.98
0.99
1TP-Rate
norm
al
buffer_overflo
w
loadmod
ule
rootkit
Figure 16: TP-Rate of the normal and attack types evaluated by theNID-Shield NIDS on U2R attack.
0 0 0 00
0.2
0.4
0.6
0.8
1FP-Rate
norm
al
buffer_overflo
w
loadmod
ule
rootkit
Figure 17: FP-rate of the normal and attack types evaluated by theNID-Shield NIDS on U2R attack.
0.95
0.96
0.97
0.98
0.99
1Precision
norm
al
buffer_overflo
w
loadmod
ule
rootkit
Figure 18: Precision of the normal and attack types evaluated by theNID-Shield NIDS on U2R attack.
24 Wireless Communications and Mobile Computing

the normal instances. Figure 9 shows that the NID-ShieldNIDS achieved an accuracy of 99.90% on the normalinstances and for the attack names such as portsweep, satan,ipsweep, and nmap, the NID-Shield NIDS achieved an accu-racy of 99.7%, 97.7%, 99.3%, and 96.3%, respectively. Overall,the weighted average of accuracy is calculated on normal andattack names; the NID-Shield NIDS obtains 99.7% accuracyon normal and on all attack names.
Figure 10 depicts that the NID-Shield NIDS achieved aTP rate of 0.999 on the normal instances and attack namessuch as portsweep, satan, ipsweep, and nmap; the NID-Shield NIDS achieved an accuracy of 0.997, 0.977, 0.993,and 0.963, respectively. Overall, the weighted average of theTP rate is measured on normal and attack names; the NID-Shield NIDS achieves a TP rate of 0.997 on normal and allattack names. Figure 11 depicts the FP rate evaluated by theNID-Shield NIDS on normal and attacks names; the NID-Shield NIDS achieves a 0.000 false-positive rate on attacknames such as portsweep and satan; and for other attacknames like ipsweep and nmap, the NID-Shield NIDS obtainsan FP rate of 0.001, respectively. For the normal instance, anFPR of 0.010 is achieved by the proposed NIDS. Figure 12depicts that the precision of the NID-Shield NIDS is assessedwith normal and attack names. The NID-Shield NIDSachieves a precision of 0.998 on normal instances, and forattack names such as portsweep, satan, ipsweep, and nmap,the NID-Shield NIDS achieved a precision of 1.000, 0.993,0.987, and 0.967, respectively.
Figure 13 depicts the recall appraised with NID-ShieldNIDS on normal and attack names; the normal instancesachieve a recall of 0.999, while for the attack names such asportsweep, satan, ipsweep, and nmap, the NID-Shield NIDSachieves a recall of 0.997, 0.977, 0.993, and 0.963, respec-tively. Overall, a weighted average of the recall is appraisedfor normal and on all types of attack names; the NID-Shield NIDS obtains a recall of 0.997. Figure 14 illustratesthe F-measure of the NID-Shield NIDS assessed with thenormal and attack names, the NID-Shield NIDS achievesan F-measure of 0.999 on normal instances, and on attackname types such as portsweep, satan, ipsweep, and nmap,the NID-Shield NIDS achieves an F-measure of 0.998,0.985, 0.990, and 0.965, respectively. Overall, the weightedaverage is appraised for F-measure on normal and on alltypes of attack names; the NID-Shield NIDS obtained an F-measure of 0.997. For the MCC, the NID-Shield NIDS isappraised with the normal and attack names, the NID-Shield NIDS achieves an MCC of 0.990 on normal instances,and with attack names such as portsweep, satan, ipsweep, andnmap, the NID-Shield NIDS achieves an MCC of 0.998,0.984, 0.990, and 0.964, respectively.
Overall, the weighted average of MCC is calculated fornormal and on all attack names; the NID-Shield NIDSobtained an MCC of 0.990, respectively. The NID-ShieldNIDS obtained a ROC of 0.999 on normal instances, andwith attack names such as portsweep, satan, ipsweep, andnmap, the NID-Shield NIDS achieves a ROC area of 1.000,0.995, 0.999, and 0.997, respectively. Overall, the weightedaverage of 0.999 is obtained by the NID-Shield NIDS in theROC area. For the PRC area, the NID-Shield NIDS achieves
1.000 on normal instances, and with attack names such asportsweep, satan, ipsweep, and nmap, the NID-Shield NIDSachieves a PRC area of 1.000, 0.990, 0.994, and 0.986, respec-tively. Overall, a weighted average is appraised for the PRCarea; the NID-Shield NIDS achieves a PRC area of 0.999,respectively.
5.1.3. Evaluation of U2R Attack with Normal and AttackInstances on Hybrid NID-Shield NIDS
(1) U2R Attack Evaluated with Hybrid NID-Shield NIDS. Thefollowing algorithms were applied for evaluation of featuresubsets: attribute evaluator: CAPPER, attribute evaluatoralgorithm: J48, search method: best first, classifier evaluator:random forest.
The CAPPER evaluated subsets are as follows: 3, 4, 6, 9,10, 13, 14, 17, 18, 33, and 36.
In this section, the U2R attack is evaluated by the hybridNID-Shield NIDS on the U2R attack dataset. Table 11 showsthe metrics of the U2R attack with the three attack names inthe U2R attack, namely, buffer_overflow, loadmodule, androotkit. Figure 15 shows that the NID-Shield NIDS achievedan accuracy of 100% on the normal instances and all attacktypes. Figure 16 shows the NID-Shield NIDS achieved a TPrate of 1.000 on the normal instances and all attack names.Figure 17 depicts the FP rate evaluated by the NID-Shield
0.950.960.970.980.99
1Recall
norm
al
buffer_overflo
w
loadmod
ule
rootkit
Figure 19: Recall of the normal and attack types evaluated by theNID-Shield NIDS on U2R attack.
0.950.960.970.980.99
1F-Measure
norm
al
buffer_overflo
w
loadmod
ule
rootkit
Figure 20: F-measure of the normal and attack types evaluated bythe NID-Shield NIDS on U2R attack.
25Wireless Communications and Mobile Computing

NIDS on normal and attacks names; the NID-Shield NIDSachieves a 0.000 false-positive rate on all attack names andnormal instances. Figure 18 depicts the precision of theNID-Shield NIDS assessed with normal and attack names.The NID-Shield NIDS achieves a precision of 1.000 on allnormal instances and attack names. Figure 19 depicts therecall appraised with NID-Shield NIDS on normal and attacknames the normal instances and attack names achieve a recallof 1.000. Figure 20 illustrates the F-measure with NID-ShieldNIDS evaluated with the normal instances and attack names;
the NID-Shield NIDS achieves an F-measure of 1.000 onnormal instances and attack names.
For the MCC, the NID-Shield NIDS is appraised with thenormal and attack names; the NID-Shield NIDS achieves anMCC of 1.000 on normal instances and attack names. For theROC area and PRC area, the NID-Shield NIDS achieves anoverall 1.000 on normal and all attack names, respectively.
5.1.4. Evaluation of R2L Attack with Normal and AttackInstances on Hybrid NID-Shield NIDS
Table 12: R2L attack evaluated with hybrid NID-Shield NIDS approach.
(a)
Total instances 13,658
Correctly classified instances 13,648
Incorrectly classified instances 10
Execution time 1.92 seconds
Kappa measures 0.9758
MAE 0.0005
RMSE 0.0118
RAE 7.3124%
RRSE 20.4253%
(b)
Accuracy TP rate FP rate Precision Recall F-measure MCC ROC area PRC area Class
100% 1.000 0.019 1.000 1.000 1.000 0.978 1.000 1.000 normal
100% 1.000 0.000 1.000 1.000 1.000 1.000 1.000 1.000 ftp_write
100% 1.000 0.000 0.875 1.000 0.933 0.935 1.000 0.982 imap
100% 1.000 0.000 0.900 1.000 0.947 0.949 1.000 1.000 phf
100% 1.000 0.000 1.000 1.000 1.000 1.000 1.000 1.000 multihop
100% 1.000 0.000 1.000 1.000 1.000 1.000 1.000 1.000 warezmaster
97.4% 0.974 0.000 0.974 0.974 0.974 0.974 1.000 0.999 warezclient
91.7% 0.917 0.000 1.000 0.917 0.957 0.957 1.000 0.969 spy
100% 1.000 0.000 1.000 1.000 1.000 1.000 1.000 1.000 gess_passwd
Weighted Avg. 99.99% 0.999 0.019 0.999 0.999 0.999 0.978 1.000 1.000
(c)
Confusion matrixa b c d e f g h i
13444 0 0 0 0 0 0 0 0
0 5 0 0 0 0 0 0 0
0 0 7 0 0 0 0 0 0
0 0 0 9 0 0 0 0 0
0 0 0 0 6 0 0 0 0
0 0 0 0 0 12 0 0 0
0 0 0 0 0 0 150 0 0
0 0 1 0 2 0 0 11 0
0 0 0 1 0 2 4 0 4
a—classified as normal, b—classified as ftp_write, c—classified as imap, d—classified as phf, e—classified as multihop, f—classified as warezmaster, g—classified as warezclient, h—classified as spy, i—classified as guess_passwd.
26 Wireless Communications and Mobile Computing

(1) R2L Attack Evaluated with Hybrid NID-Shield NIDS. Thefollowing algorithms were applied for evaluation of featuresubsets: attribute evaluator: CAPPER, attribute evaluatoralgorithm: J48, search method: best first, classifier evaluator:random forest.
The CAPPER evaluated subsets are as follows: 4, 5, 6, 10,11, 17, 22, 31, 32, 33, 36, and 38.
In this section, the R2L attack is evaluated by the hybridNID-Shield NIDS approach on the R2L attack dataset.Table 12 shows the evaluation metrics of the R2L attack. In
the R2L attack, there are eight attack names, namely, ftp_write, guess_passwd, phf, imap, warezmaster, multihop,warezclient, and spy, and normal instance. Figure 21 showsthat the NID-Shield NIDS achieved an accuracy of 100% onthe normal instances and for attack names such as ftp_write,guess_passwd, phf, imap, warezmaster, and multihop, theNID-Shield NIDS achieved an accuracy of 100%, respec-tively, while for the attack names such as warezclient andspy, the NID-Shield NIDS achieves an accuracy of 97.4%and 91.7%, respectively. Overall, the weighted average interms of accuracy is appraised for the normal and attacknames; the NID-Shield NIDS achieves 99.99% accuracy onnormal and all attack names. Figure 22 depicts that theNID-Shield NIDS achieved a TP rate of 1.000 on the normalinstances and for the attack names such as ftp_write, guess_passwd, phf, imap, warezmaster, and multihop, the NID-Shield NIDS achieved a TP rate of 1.000, respectively, whilethe attack names such as warezclient and spy, the NID-Shield NIDS achieved a TP rate of 0.974 and 0.917, respec-tively. Overall, the weighted average of the TP rate is mea-sured on normal and an attack name; the NID-Shield NIDSachieves a TP rate of 0.999 on normal and all attack names.Figure 23 depicts the FP rate evaluated by the NID-ShieldNIDS on normal and attacks names; the NID-Shield NIDSachieves a 0.000 false-positive rate on all attack names. Forthe normal instance, an FPR of 0.019 is achieved. Overall, aweighted average FP rate of 0.019 is obtained on normaland attack names. Figure 24 shows that the precision of theNID-Shield NIDS is evaluated with normal and attacknames. The NID-Shield NIDS achieved a precision of 1.000on normal instances, and for attack names such as guess_passwd, ftp_write, multihop, warezmaster, and spy, theNID-Shield NIDS achieved a precision of 1.000, respectively,while for attack names such as imap, phf, and warezclient, theNID-Shield NIDS obtained a precision of 0.875, 0.900, and0.974, respectively. Overall, a weighted average precision of0.999 is achieved on normal and attack names. Figure 25depicts the recall appraised with NID-Shield NIDS on nor-mal and attack names, the normal instances achieve a recallof 1.000, and for the attack names such as guess_passwd,ftp_write, imap, phf, multihop, and warezmaster, the NID-Shield NIDS achieves a recall of 1.000, respectively, whilefor attack names such as warezclient and spy, a recall of
9092949698100
Accuracy
norm
al
ftp_w
rite
imap phf
multih
op
warezmaster
warezclient spy
guess_passwd
Figure 21: Accuracy of the normal and attack types evaluated by theNID-Shield NIDS on R2L attack.
0.90.920.940.960.98
1TP-Rate
norm
al
ftp_w
rite
imap phf
multih
op
warezmaster
warezclient Spy
guess_passwd
Figure 22: TP-rate of the normal and attack types evaluated by theNID-Shield NIDS on R2L attack.
0 0 0 0 0 0 0 00
0.005
0.01
0.015
0.02FP-Rate
norm
alftp
_write
imap phf
multih
opwarezmaster
warezclient spy
guess_passwd
Figure 23: FP-rate of the normal and attack types evaluated by theNID-Shield NIDS on R2L attack.
0.8
0.85
0.9
0.95
1Precision
norm
al
ftp_w
rite
imap phf
multih
op
warezmaster
warezclient spy
guess_passwd
Figure 24: Precision of the normal and attack types evaluated by theNID-Shield NIDS on R2L attack.
27Wireless Communications and Mobile Computing

0.974 and 0.917 is achieved by the proposed NIDS. Overall,the weighted average of the recall is appraised for normaland all types of attack names; the NID-Shield NIDS obtaineda recall of 0.999, respectively. Figure 26 depicts the F-mea-sure with the NID-Shield NIDS assessed with the normaland attack names, the NID-Shield NIDS achieves an F-measure of 1.000 on normal instances, and with attacknames such as guess_passwd, ftp_write, multihop, andwarezmaster, the NID-Shield NIDS achieves an F-measureof 1.000, respectively, while for attack names such as ware-zclient, spy, phf, and imap, the NID-Shield NIDS achievesan F-measure of 0.974, 0.957, 0.947, and 0.933, respectively.
Overall, the weighted average is calculated for F-measureon normal and all types of attack names; the NID-ShieldNIDS obtained an F-measure of 0.999, respectively, on nor-mal and attack names. For the MCC, the NID-Shield NIDSis appraised with the normal and attack names, the NID-Shield NIDS achieves an MCC of 0.978 on normal instances,and with attack names such as guess_passwd, ftp_write, mul-tihop, and warezmaster, the NID-Shield NIDS achieves anMCC of 1.000, respectively, and on attack names such asimap, phf, warezclient, and spy, the NID-Shield NIDSobtained an MCC of 0.935, 0.949, 0.974, and 0.957, respec-tively. Overall, a weighted average is appraised for MCC;the NID-Shield NIDS achieves an MCC of 0.978 for normaland attacks names. For the ROC area, the NID-Shield NIDSachieves a 1.000 on normal instances and attack names. Forthe PRC area, the proposed NID-Shield NIDS achieves a1.000 on normal instances, and with attack instances suchas guess_passwd, ftp_write, phf, multihop, and warezmaster,the NID-Shield NIDS achieves a PRC area of 1.000, and forattack names such as warezclient, imap, and spy, the PRCarea obtained is 0.999, 0.982, and 0.969, respectively. Overall,a weighted average PRC area of 1.000 is obtained by the NID-Shield NIDS for all normal instances and attack names.
5.1.5. Evaluation of UNSW-NB15 Dataset with Normal andAttack Instances on Hybrid NID-Shield NIDS. The followingalgorithms were applied for the evaluation of feature subsets:attribute evaluator: CAPPER, attribute evaluator algorithm:J48, search method: best first, classifier evaluator: randomforest.
The CAPPER evaluated subsets for Reconnaissanceattack are as follows: 2, 3, 7, 12, 27, 31, 36, 40, and 41.
The CAPPER evaluated subsets for Backdoor attack areas follows: 2, 3, 7, 10, 16, 27, 28, 39, and 40.
The CAPPER evaluated subsets for DoS attack are as fol-lows: 3, 7, 8, 9, 10, 16, 31, 36, 40, and 41.
The CAPPER evaluated subsets for Exploits attack are asfollows: 2, 3, 7, 8, 9, 10, 15, 17, 31, 36, and 40.
The CAPPER evaluated subsets for Analysis attack are asfollows: 2, 3, 7, 8, 10, 12, 17, 28, 36, 40, and 41.
The CAPPER evaluated subsets for Fuzzers attack are asfollows: 3, 7, 8, 9, 10, 12, 17, 32, and 33.
The CAPPER evaluated subsets for Worms attack are asfollows: 3, 7, 8, 9, 10, 12, 17, 32, and 33.
The CAPPER evaluated subsets for Shellcode attack areas follows: 2, 3, 7, 8, 12, 27, 33, and 36.
The CAPPER evaluated subsets for Generic attack are asfollows: 2, 3, 7, 8, 9, 25, 31, 39, and 40.
In this section, the UNSW-NB15 dataset attack is evalu-ated by the hybrid NID-Shield NIDS approach on theUNSW-NB15 testing dataset. Table 13 illustrates the evalua-tion metrics of the UNSW-NB15 normal and attackinstances. In the UNSW-NB15 dataset attack, there are nineattack names, namely, Backdoor, Reconnaissance, Exploits,DoS, Fuzzers, Analysis, Worms, Generic, and Shellcode,and normal instances. Figure 27 shows that the NID-ShieldNIDS achieved an accuracy of 100% on the normal instancesand Worms attack while for other attacks such as Backdoor,Reconnaissance, Exploits, DoS, Fuzzers, Analysis, Generic,and Shellcode, the NID-Shield NIDS achieved an accuracyof 99.71%, 99.45%, 98.70%, 99.10%, 90.14%, 99.20%,99.70%, and 99.61%, respectively. Overall, the weighted aver-age in terms of accuracy is appraised for the normal and anattack name; the NID-Shield NIDS achieves 99.89% accuracyon normal and all attack names. Figure 28 shows that theNID-Shield NIDS achieved a TP rate of 1 on the normalinstances and Worms attack while for other attacks such asBackdoor, Reconnaissance, Exploits, DoS, Fuzzers, Analysis,Generic, and Shellcode, the NID-Shield NIDS achieved aTP rate of 0.997, 0.994, 0.987, 0.991, 0.901, 0.992, 0.997,and 0.996, respectively. Overall, the weighted average interms of TP rate is appraised for the normal and attacknames; the NID-Shield NIDS achieved an accuracy of 0.998
0.8
0.85
0.9
0.95
1Recall
norm
al
ftp_w
rite
imap phf
multih
op
warezmaster
warezclient spy
guess_passwd
Figure 25: Recall of the normal and attack types evaluated by theNID-Shield NIDS on R2L attack.
0.8
0.85
0.9
0.95
1F-Measure
norm
al
ftp_w
rite
imap phf
multih
op
warezmaster
warezclient spy
guess_passwd
Figure 26: F-measure of the normal and attack types evaluated bythe NID-Shield NIDS on R2L attack.
28 Wireless Communications and Mobile Computing
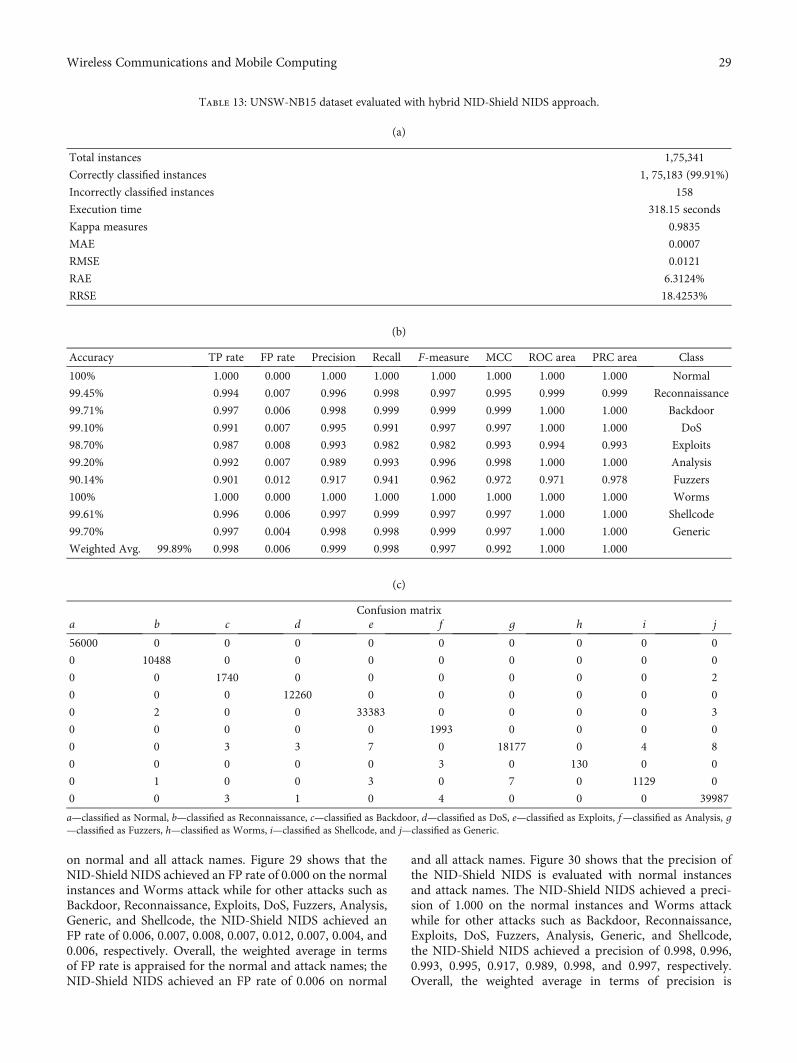
on normal and all attack names. Figure 29 shows that theNID-Shield NIDS achieved an FP rate of 0.000 on the normalinstances and Worms attack while for other attacks such asBackdoor, Reconnaissance, Exploits, DoS, Fuzzers, Analysis,Generic, and Shellcode, the NID-Shield NIDS achieved anFP rate of 0.006, 0.007, 0.008, 0.007, 0.012, 0.007, 0.004, and0.006, respectively. Overall, the weighted average in termsof FP rate is appraised for the normal and attack names; theNID-Shield NIDS achieved an FP rate of 0.006 on normal
and all attack names. Figure 30 shows that the precision ofthe NID-Shield NIDS is evaluated with normal instancesand attack names. The NID-Shield NIDS achieved a preci-sion of 1.000 on the normal instances and Worms attackwhile for other attacks such as Backdoor, Reconnaissance,Exploits, DoS, Fuzzers, Analysis, Generic, and Shellcode,the NID-Shield NIDS achieved a precision of 0.998, 0.996,0.993, 0.995, 0.917, 0.989, 0.998, and 0.997, respectively.Overall, the weighted average in terms of precision is
Table 13: UNSW-NB15 dataset evaluated with hybrid NID-Shield NIDS approach.
(a)
Total instances 1,75,341
Correctly classified instances 1, 75,183 (99.91%)
Incorrectly classified instances 158
Execution time 318.15 seconds
Kappa measures 0.9835
MAE 0.0007
RMSE 0.0121
RAE 6.3124%
RRSE 18.4253%
(b)
Accuracy TP rate FP rate Precision Recall F-measure MCC ROC area PRC area Class
100% 1.000 0.000 1.000 1.000 1.000 1.000 1.000 1.000 Normal
99.45% 0.994 0.007 0.996 0.998 0.997 0.995 0.999 0.999 Reconnaissance
99.71% 0.997 0.006 0.998 0.999 0.999 0.999 1.000 1.000 Backdoor
99.10% 0.991 0.007 0.995 0.991 0.997 0.997 1.000 1.000 DoS
98.70% 0.987 0.008 0.993 0.982 0.982 0.993 0.994 0.993 Exploits
99.20% 0.992 0.007 0.989 0.993 0.996 0.998 1.000 1.000 Analysis
90.14% 0.901 0.012 0.917 0.941 0.962 0.972 0.971 0.978 Fuzzers
100% 1.000 0.000 1.000 1.000 1.000 1.000 1.000 1.000 Worms
99.61% 0.996 0.006 0.997 0.999 0.997 0.997 1.000 1.000 Shellcode
99.70% 0.997 0.004 0.998 0.998 0.999 0.997 1.000 1.000 Generic
Weighted Avg. 99.89% 0.998 0.006 0.999 0.998 0.997 0.992 1.000 1.000
(c)
Confusion matrixa b c d e f g h i j
56000 0 0 0 0 0 0 0 0 0
0 10488 0 0 0 0 0 0 0 0
0 0 1740 0 0 0 0 0 0 2
0 0 0 12260 0 0 0 0 0 0
0 2 0 0 33383 0 0 0 0 3
0 0 0 0 0 1993 0 0 0 0
0 0 3 3 7 0 18177 0 4 8
0 0 0 0 0 3 0 130 0 0
0 1 0 0 3 0 7 0 1129 0
0 0 3 1 0 4 0 0 0 39987
a—classified as Normal, b—classified as Reconnaissance, c—classified as Backdoor, d—classified as DoS, e—classified as Exploits, f—classified as Analysis, g—classified as Fuzzers, h—classified as Worms, i—classified as Shellcode, and j—classified as Generic.
29Wireless Communications and Mobile Computing

appraised for the normal and attack names; the NID-ShieldNIDS achieved a precision of 0.999 on normal and all attacknames. Figure 31 depicts the recall appraised with NID-Shield NIDS on normal and attack names, the NID-ShieldNIDS achieved a recall of 1.000 on the normal instancesand Worms attack, while for other attacks such as Backdoor,Reconnaissance, Exploits, DoS, Fuzzers, Analysis, Generic,and Shellcode, the NID-Shield NIDS achieved a recall of0.999, 0.998, 0.982, 0.991, 0.941, 0.993, 0.998, and 0.999,
respectively. Overall, the weighted average in terms of recallis appraised for the normal and attack names; the NID-Shield NIDS achieved a recall of 0.998 on normal and allattack names. Figure 32 shows the F-measure of the NID-Shield NIDS evaluated with the normal and attack names;the NID-Shield NIDS achieved an F-measure of 1.000 onthe normal instances and Worms attack, while for otherattacks such as Backdoor, Reconnaissance, Exploits, DoS,Fuzzers, Analysis, Generic, and Shellcode, the NID-ShieldNIDS achieved an F-measure of 0.999, 0.997, 0.982, 0.997,0.962, 0.996, 0.999, and 0.997, respectively. Overall, theweighted average in terms of F-measure is appraised for thenormal and attack names; the NID-Shield NIDS achievedan F-measure of 0.997 on normal and all attack names.
For the MCC, the NID-Shield NIDS is appraised with thenormal and attack names; the NID-Shield NIDS achieved anMCC of 1.000 on the normal instances and Worms attack,while for other attacks such as Backdoor, Reconnaissance,Exploits, DoS, Fuzzers, Analysis, Generic, and Shellcode,the NID-Shield NIDS achieved an MCC of 0.999, 0.995,0.993, 0.997, 0.972, 0.998, 0.997, and 0.997, respectively.Overall, the weighted average in terms of MCC is appraisedfor the normal and attack names; the NID-Shield NIDSachieved an MCC of 0.992 on normal and all attack names.The NID-Shield NIDS achieves a ROC and PRC area of1.000 on normal and attack instances.
Table 14 shows the hybrid NID-Shield NIDS with theexisting approaches in this literature. The details of the exist-ing approaches are shown in Table 1. For the evaluation ofthe hybrid NID-Shield NIDS approach, the proposed hybridNID-Shield NIDS evaluates the attack names on the UNSW-NB15 dataset, and overall performance metrics are consid-ered such as Probe, DoS, R2L, and U2R, and attack nameson the NSL-KDD 20% dataset. The NID-Shield NIDSachieves a 99.89% on the UNSW-NB15 dataset and overallaccuracy of 99.90% on the NSL-KDD dataset, which is thehighest among all other approaches. When the TP rate iscalculated, overall, the NID-Shield NIDS obtained a TPRof 0.999 on the NSL-KDD 20% dataset and 0.9998 onthe UNSW-NB15 dataset which is the best among allother approaches. When FPR is comprehensively evalu-ated, the literature proposed by Cavusoglu achieves anoverall best FPR of 0.000035 and the NID-Shield NIDS
80
85
90
95
100
Normal
Reconn
aissance
Backdo
orDoS
Exploits
Analysis
Fuzzers
Worms
Shellcod
eGeneric
Accuracy
Figure 27: Accuracy of normal and attack types evaluated by theNID-Shield NIDS on UNSW-NB15 dataset.
0.8
0.85
0.9
0.95
1
Normal
Reconn
aissance
Backdo
orDoS
Exploits
Analysis
Fuzzers
Worms
Shellcod
eGeneric
TP‒Rate
Figure 28: TP-Rate of normal and attack types evaluated by theNID-Shield NIDS on UNSW-NB15 dataset.
0000.0020.0040.0060.0080.010.0120.014
Normal
Reconn
aissance
Backdo
orDoS
Exploits
Analysis
Fuzzers
Worms
Shellcod
eGeneric
FP-Rate
Figure 29: FP-rate of normal and attack types evaluated by theNID-Shield NIDS on UNSW-NB15 dataset.
0.8
0.85
0.9
0.95
1
Normal
Reconn
aissance
Backdo
orDoS
Exploits
Analysis
Fuzzers
Worms
Shellcod
eGeneric
Precision
Figure 30: Precision of normal and attack types evaluated by theNID-Shield NIDS on UNSW-NB15 dataset.
30 Wireless Communications and Mobile Computing

achieves a second-best FPR of 0.007 and 0.006 on NSL-KDD 20% and UNSW-NB15 datasets. The TNR is evalu-ated globally; the NID-Shield NIDS achieved the true neg-ative rate of 0.993 on both datasets which are the highestamong all other approaches.
The literature proposed by Arif et al. achieves the highestprecision of 0.9998, and the NID-Shield NIDS achieves thesecond-best precision of 0.9990 on NSL-KDD 20% dataset.The NID-Shield NIDS achieves a recall of 0.999 and 0.989on NSL-KDD 20% and UNSW-NB 15 datasets which is thehighest among all other approaches. The F-measure is evalu-ated comprehensively; the NID-Shield NIDS achieves thehighest F-measure of 0.997 and 0.999 on UNSW-NB15 andNSL-KDD 20% datasets. When MCC is appraised globally,the NID-Shield NIDS achieves the best MCC of 0.992 onboth datasets which are overall best among all approaches.The ROC and PRC area of the NID-Shield NIDS is evaluatedcomprehensively; the NID-Shield NIDS achieves the bestROC and PRC area on both datasets which are the bestamong all other approaches. When the execution time isevaluated, the literature proposed by Venkataraman andSelvaraj achieves the lowest execution time of 0.23 sec-onds, followed by an execution time of 10.79 seconds bythe literature proposed by Suad and Fadl and executiontime of 10.62 seconds by the literature proposed by Cavu-soglu. The NID-Shield NIDS achieves an execution time of318.15 and 13.785 seconds on the UNSW-NB15 and NSL-KDD 20% datasets. Overall, the NID-Shield NIDS achievesthe highest measures in terms of accuracy, TP rate, TNR,F-measure, MCC, recall, PRC, and ROC area on boththe datasets.
For the insight of the discussion of the results, CAPPERand the random forest is the primary speculation for obtain-ing high metrics on both datasets. CAPPER is an effectivefeature subset selection technique that obtains accurate andhigh merit feature subsets from CFS and Wrapper methods.CFS searches the space of the feature subset by employingthe best first search method and calculates the feature-classcorrelations and feature-feature correlations by applying theapproaches based on conditional entropy. The high meritsubset is measured by equation (3), which greatly aids indimensionality reduction of both the testing and training
data. In Wrapper, the feature subset search is executed bythe best first search approach. The best first search at eachiteration creates its successors having a node with maximalestimation accuracy. The induction algorithm is employedas a feature subset selection approach. The induction algo-rithm is run k times, and the training set uses the k − 1 parti-tions, while the test set employs other partitions. Five foldcross-validation techniques are applied as the subset evalua-tion approach. The estimation of the accuracy is obtainedby equation (4). To obtain the accurate and finest featuresubsets, the machine learning approaches are applied by theWrapper approach. The accurate and high merit feature sub-sets obtained by CFS and Wrapper are then combined toobtain the reduced dataset.
The random forest is considered as the most efficientclassifier as compared to other classifiers. The foremost rea-son for obtaining the high accuracy is applying the baggingby the random forest. Employing bagging has mainly twobenefits. Firstly, the accuracy is increased each time the ran-dom features are enforced. Secondly, estimation of the gener-alization error containing the ensemble tree combination andthe correlations and its intensity appraisal is provided by thebagging. The assessment is carried out-of-bag. The mainapproach behind the out-of-bag estimation is the incorpora-tion of nearly one-third of classifiers from the continuingprevailing sequence. Whenever the statistic of the sequenceis incremented, the rate of error declines. Therefore, the con-temporary error rate can be augmented by out-of-bag esti-mation; hence, it is necessary to pass on from the areawhere the merging of the error occurs. In the cross-valida-tion, there is a high probability of the existence of bias;also, the degree of extent of the bias is unfamiliar, whereasthe out-of-bag estimation is free from bias. The randomforest applies two-thirds of the data and for testing one-third of the data from training data, to grow the tree.Out-of-bag data is simply the one-third data from thetraining data. Pruning is not performed by the randomforest and thus aids in fast and high performance. More-over, having the multiple-tree construction, the randomforest performs reasonably well with an additional treeframework and it achieves a higher performance ratherthan any other decision tree method.
0.8
0.85
0.9
0.95
1
Normal
Reconn
aissance
Backdo
orDoS
Exploits
Analysis
Fuzzers
Worms
Shellcod
eGeneric
Recall
Figure 31: Recall of normal and attack types evaluated by the NID-Shield NIDS on UNSW-NB15 dataset.
0.8
0.85
0.9
0.95
1
Normal
Reconn
aissance
Backdo
orDoS
Exploits
Analysis
Fuzzers
Worms
Shellcod
eGeneric
F-Measure
Figure 32: F-measure of normal and attack types evaluated by theNID-Shield NIDS on UNSW-NB15 dataset.
31Wireless Communications and Mobile Computing

Table 14: Comparison of the hybrid NID-Shield NIDS with existing approaches in this study.
Accuracy TPR FPR TNR Precision RecallF
-measureMCC ROC PRC
Time(seconds)
Proposedapproach withNSL-KDD 20%dataset
99.90 0.9990 0.007 0.993 0.999 0.999 0.999 0.992 1.000 1.000 13.785
Proposedapproach withUNSW-NB15dataset
99.89 0.9989 0.006 0.993 0.999 0.989 0.997 0.992 1.000 1.000 318.15
Neha et al. [26] 99.05% 0.994 0.014 _ 0.991 _ _ _ _ _ _
Arif et al. [28] 96.65% 0.9271 0.136 _ 0.9998 _ _ _ _ _ _
Ahmed et al.[29]
_ 0.9577 _ 0.975 0.5662 _ _ _ _ _ 3112.87
Tirtharaj [30] _ 0.9526 _ _ _ _ _ _ _ _ 103.70
Yao et al. [31] 99.20% 0.6699 _ _ 0.9655 0.967 _ _ _ _ _
Suad et al. [32] _ _ _ _ _ _ _ _ 0.995 0.962 10.79
Ijaz et al. [33] 99.8% (DoS) _0.17(DoS)
_ _ _ _ _ _ _ _
Alauthamanet al. [34]
99.20% 0.9908 0.75 _ _ _ _ _ _ _ _
Venkataramanand Selvaraj[35]
83.83% _ _ _ _ _ _ _ _ _ 0.23
Kumar andKumar [36]
99% _ _ _ _ _ _ _ _ _ _
Cavusoglu [37]99.86%(overall)
0.9292(overall)
0.000035(overall)
_ _ _0.706
(overall)0.954
(overall)_ _
10.62(overall)
Saxena et al.[38]
98.1% 0.7 _ _ _ _ _ _ _ _ _
Kambattan andRajkumar [39]
99.45% _ _ _ _ _ _ _ _ _ _
Kar et al. [40] 93.95% 0.955 0.1034 _ _ _ _ _ _ _ _
Mishra et al.[41]
92.12% 0.971 _ _ _ _ _ _ _ _ _
Dutta et al. [42] 91.29% _ _ _ 92.08% 90.64% 0.91 _ _ _ _
Latah andToker [43]
84.29% _ 0.063 _ _ 77.18% 84.83% _ _ _ _
SumaiyaThaseen et al.[44]
98.45%, onNSL-KDDdataset and96.44% onUNSW-NB15dataset
0.9294 onNSL-KDDdataset and0.504 onUNSW-NB15dataset
_
0.9438 onNSL-KDDdataset and0.984 onUNSW-NB15dataset
_ _ _ _ _ _
500 onNSL-KDDdataset and1023 onUNSW-NB15dataset
Safaldin et al.[45]
96% 0.96 0.03 _ _ _ _ _ _ _ 69.6 h
Vallathan et al.[46]
98.4% 0.9602 _ 0.998 _ _ _ _ _ _ _
32 Wireless Communications and Mobile Computing

6. Conclusion and Future Work
An efficient hybrid NID-Shield NIDS is proposed in this lit-erature. Moreover, CAPPER an effective hybrid feature selec-tion method is applied for accurate and highly merit featuresubsets. The proposed hybrid NID-Shield NIDS classifiesthe UNSW-NB15 and NSL-KDD 20% dataset according toattack types and attack names. Distinct attacks may havepeculiar connections as some of the attacks such as R2Land U2R may have very few N/W connections, while otherattacks such as Probe and DoS may have a large number ofN/W connections or can be a combination of any of them.Moreover, the hybrid NID-Shield NIDS calculates the per-formance metrics of attack names found in the NSL-KDD20% dataset (DoS, Probe, U2R, and R2L) and UNSW-NB15dataset individually. This approach further helps us to knowthe metrics of individual attack names and the vulnerabilityof the attack on the individual network. From the concludingresults, it is noticed that the proposed hybrid NID-ShieldNIDS with an effective CAPPER hybrid feature selectionapproach can improve various performance metrics on thenetwork intrusions.
When Tables 8–14 are examined, the proposed hybridNID-Shield NIDS obtains a comprehensive excellent perfor-mance in terms of various performance metrics on all attacktypes. The hybrid NID-Shield NIDS with its various param-eters is investigated with existing literature studies; it hasbeen found that the hybrid NID-Shield NIDS is the most effi-cient of all approaches found in the existing literature studies.In future work, we will consider applying the hybrid NID-Shield NIDS to fog computing.
Data Availability
The data used to support the findings of this study are avail-able from the corresponding author upon request.
Conflicts of Interest
The authors declare that they have no conflict of interest.
References
[1] L. Hung-Jen and C.-h. R. Lin, “Intrusion detection system acomprehensive review,” Journal of network and applications,vol. 36, no. 1, pp. 16–24, 2013.
[2] H. L. Motoda and H. Motoda, Feature Selection for KnowledgeDiscovery and Data Mining, vol. 454, Springer, 1998.
[3] J. P. Anderson, Computer Security Threat Monitoring and Sur-veillance, Technical report, James P. Anderson Company, FortWashington, Pennsylvania, 1980.
[4] T. F. Lunt, J. van Horne, and L. Halme, “Automated analysis ofcomputer system audit trails,” in Proceedings of the Ninth DOEComputer Security Group Conference, Las Vegas, Nevada,1986.
[5] H. S. Javitz, A. Valdes, D. E. Denning, and P. G. Neumann,Analytical Techniques Development for a Statistical IntrusionDetection System (SIDS) Based on Accounting Records, Techni-cal report, SRI International, Menlo Park, California, 1986.
[6] D. Anderson, T. Frivold, and A. Valdes, Next-GenerationIntrusion Detection Expert System (NIDES). A Summary, SRIInternational Computer Science Laboratory Technical ReportSRI-CSL-95-07, 1995.
[7] L. D. S. Silva, A. C. Santos, T. D. Mancilha, J. D. Silva, andA. Montes, “Detecting attack signatures in the real networktraffic with ANNIDA,” Expert Systems with Applications,vol. 34, no. 4, pp. 2326–2333, 2008.
[8] A. Patcha and J. M. Park, “An overview of anomaly detectiontechniques: existing solutions and latest technological trends,”Computer Networks, vol. 51, no. 12, pp. 3448–3470, 2007.
[9] C. Manikopoulos and S. Papavassiliou, “Network intrusionand fault detection. A statistical anomaly approach,” IEEECommunications Magazine, vol. 40, no. 10, pp. 76–82, 2002.
[10] P. Fournier-Viger, C. W. Lin, A. Gomariz et al., “The SPMFopen-source data mining library version 2,” in Joint Europeanconference on machine learning and knowledge discovery indatabasespp. 36–40, Cham, Riva del Garda, Italy, 2016.
[11] P. Fournier-Viger, J. C.-W. Lin, R. U. Kiran, Y. S. Koh, andR. Thomas, “A survey of sequential pattern mining,” Data Sci-ence and Pattern Recognition, vol. 1, no. 1, pp. 54–77, 2017.
[12] A. Smola and S. V. N. Vishwanathan, Introduction to MachineLearning, Cambridge University Press, 2008, ISBN-10:0521825830.
[13] Z. Xiaojin, Semi-Supervised Learning Literature Survey, vol. 2,Computer Science, University of Wisconsin, Madison, 2008.
[14] S. Mukkamala, A. H. Sung, and A. Abraham, “Modeling intru-sion detection systems using linear genetic programmingapproach,” in The 17th international conference on industrial& engineering applications of artificial intelligence and expertsystems, innovations in applied artificial intelligence, pp. 633–642, Berlin, Heidelberg, 2004.
[15] J. Pearl, “Bayesian networks. A model of self-activated mem-ory for evidential reasoning,” in Proceedings of the 7th Confer-ence of the Cognitive Science Society, University of California,pp. 329–334, Irvine, CA, 2009.
[16] N. S. Altman, “An introduction to kernel and nearest-neighbornonparametric regression (PDF),” The American Statistician,vol. 46, no. 3, pp. 175–185, 1992.
[17] J. B. MacQueen, “Some methods for classification and analysisof multivariate observations,” in 5th Berkeley Symposium onMathematical Statistics and Probability, pp. 281–297, Univer-sity of California Press, 1967.
[18] L. E. Baum and T. Petrie, “Statistical inference for probabilisticfunctions of finite state Markov chains,” The annals of mathe-matical statistics, vol. 37, no. 6, pp. 1554–1563, 1966.
[19] T. Kohonen, “The self-organizing map,” Proceedings of IEEE,pp. 1464–1480, 1990.
[20] M. Mohammed, M. B. Khan, and E. B. Bashier, MachineLearning Algorithms and Applications, CRC press Taylor andFrancis Group, 2016, ISBN-10: 1498705383.
[21] T. Hastie, R. Tibshirani, and J. Friedman, The Elements of Sta-tistical Learning, vol. 2, Springer, 2009, ISBN 978-0-387-84858-7.
[22] M. Dash and H. Liu, “Feature selection for classification,”Intelligent data analysis, vol. 1, no. 1-4, pp. 131–156, 1997.
[23] H. Liu and L. Yu, “Towards integrating feature selection algo-rithms for classification and clustering,” IEEE Transactions onKnowledge and Data Engineering, vol. 17, no. 4, pp. 491–502,2005.
33Wireless Communications and Mobile Computing

[24] R. Heady, G. Luger, A. Maccabe, and M. Servilla, The Architec-ture of Network Level Intrusion Detection System, Technicalreport CS90-20, Department of computer science, Universityof New Mexico, 1990.
[25] E. Carter, CCSP Self-Study: Cisco Secure Intrusion DetectionSystem (CSIDS), Cisco Press, 2nd edition, 2004, ISBN-10:9781587051449.
[26] A. Neha and S. Shailendra, “An IWD-based feature selectionmethod for intrusion detection system,” Soft computing,vol. 22, pp. 4407–4416, 2017.
[27] H. Shah-Hosseini, “Optimization with the nature-inspiredintelligent water drops algorithm,” in Evolutionary Computa-tion, W. P. Dos Santos, Ed., pp. 298–320, I-Tech, Vienna,2009, ISBN 978-953-307-008-7.
[28] J. Arif, F. Malik, and K. Aslam, “A hybrid technique usingbinary particle swarm optimization and decision tree pruningfor network intrusion detection,” Cluster Computing, vol. 21,pp. 667–680, 2017.
[29] I. Ahmed, L. Saleh, M. Fatma, and L. Talaat, “A hybrid intru-sion detection system (HIDS) based on prioritized k-nearestneighbors and optimized SVM classifiers,” Artificial Intelli-gence Review, vol. 51, pp. 403–443, 2017.
[30] D. Tirtharaj, “A study on intrusion detection using neural net-works trained with evolutionary algorithms,” Soft Computing,vol. 21, pp. 2687–2700, 2017.
[31] Y. Haipeng and W. Qiyi, “An intrusion detection frameworkbased on hybrid multi-level data mining,” International Jour-nal of Parallel Programming, vol. 47, pp. 740–758, 2017.
[32] M. Suad and M. Fadl, “Intrusion detection model usingmachine learning algorithm on Big Data environment,” Jour-nal of big data, vol. 5, pp. 1–12, 2018.
[33] S. Ijaz, F. A. Hashmi, S. Asghar, and M. Alam, “Vector basedgenetic algorithm to optimize predictive analysis in networksecurity,” Applied intelligence, vol. 48, no. 5, pp. 1086–1096,2018.
[34] A. Mohammad and A. Nauman, “A P2P Botnet detectionscheme based on decision tree and adaptive multilayer neuralnetworks,” Neural Computing & Applications, vol. 29,pp. 991–1004, 2018.
[35] V. Sivakumar and S. Rajalakshmi, “Optimal and novel hybridfeature selection framework for effective data classification,”in Advances in Systems, Control and Automation, pp. 499–514, Springer, Singapore, 2018.
[36] K. Neeraj and K. Upendra, “Knowledge computational intelli-gence in network intrusion detection systems,” in KnowledgeComputing and Its Applications, pp. 161–176, Springer, Singa-pore, 2018.
[37] C. Unal, “A new hybrid approach for intrusion detection usingmachine learning methods,” Applied Intelligence, vol. 49,pp. 2735–2761, 2019.
[38] S. Akash and S. Khushboo, “Hybrid technique based onDBSCAN for selection of improved features for intrusiondetection system,” in Emerging Trends in Expert Applicationsand Security, pp. 365–377, Springer, Singapore, 2019.
[39] K. Rajesh and R. Manimegalai, “An effective intrusion detec-tion system using flawless feature selection, outlier detectionand classification,” in Progress in Advanced Computing andIntelligent Engineering, pp. 203–213, Springer, Singapore,2019.
[40] P. Kar, S. Banerjee, K. C. Mondal, G. Mahapatra, andS. Chattopadhyay, “A hybrid intrusion detection system for
hierarchical filtration of anomalies,” in Information and Com-munication Technology for Intelligent Systems, vol. 106,pp. 417–426, Springer, Singapore, 2019.
[41] S. Mishra, C. Mahanty, S. Dash, and B. K. Mishra, “Implemen-tation of BFS-NB hybrid model in intrusion detection system,recent developments in machine learning and data analytics,”in Recent Developments inMachine Learning and Data Analyt-ics, vol. 740, pp. 167–175, Springer, Singapore, 2019.
[42] V. Dutta, M. Choras, R. Kozik, and M. Pawlicki, “Hybridmodel for improving the classification effectiveness on net-work intrusion detection system,” in Conference on Complex,Intelligent, and Software Intensive Systems, Cham, 2020.
[43] M. Latah and L. Toker, “An efficient flow-based multi-levelhybrid intrusion detection system for software-defined net-works,” CCF Transactions on Networking, vol. 3, pp. 26–271,2020.
[44] I. Sumaiya Thaseen, J. Saira Banu, K. Lavanya, M. RukunuddinGhalib, and K. Abhishek, “An integrated intrusion detectionsystem using correlation-based attribute selection and artificialneural network,” Transactions on Emerging Telecommunica-tions Technologies, vol. 32, no. 2, article e4014, 2021.
[45] M. Safaldin, M. Qtair, and L. Abualigah, “Improved binarygray wolf optimizer and SVM for intrusion detection systemin wireless sensor networks,” Journal of Ambient Intelligenceand Humanized Computing, vol. 12, no. 2, pp. 1559–1576,2021.
[46] G. Vallathan, A. John, and C. Thirumalai, “Suspicious activitydetection using deep learning in secure assisted living IoTenvironments,” The Journal of Supercomputing, vol. 77,pp. 3242–3260, 2021.
[47] Hackerpocalypse-cybercrime report, In Cybersecurity Ven-tures, 2016.
[48] A. AlEroud, G. Karabatis, P. Sharma, and P. He, “Context andsemantics for detection of cyber attacks,” International Journalof Information and Computer Security, vol. 6, no. 1, pp. 63–92,2014.
[49] A. AlEroud and G. Karabatis, “Toward zero-day attack identi-fication using linear data transformation techniques,” in IEEE7th international conference on software security and reliability(SERE’13), pp. 159–168, Washington, D.C., 2013.
[50] S. Axelsson, “Intrusion detection systems: a survey and taxon-omy,” 2000.
[51] R. M. Snort, “Lightweight intrusion detection for networks,” inProceedings of thirteenth USENIX conference on system admin-istration, (LISA ‘99), pp. 229–238, Seattle, Washington, USA,1999.
[52] J. Cannady, “Artificial neural networks for misuse detection,”in National information systems security conference, vol. 26,pp. 368–381, Arlington, Virginia, United States, 1998.
[53] R. C. Quinlan, 4.5: Programs for Machine Learning, MorganKaufmann publishers Inc, San Francisco, 1993, ISBN: 978-1-55860-238-0.
[54] T. Denoeux, “A k-nearest neighbor classification rule based onDempster-Shafer theory,” IEEE Transactions on Systems, Man,and Cybernetics, vol. 25, no. 5, pp. 804–813, 1995.
[55] C. Cortes and V. N. Vapnik, “Support-vector networks,”Machine Learning, vol. 20, no. 3, pp. 273–297, 1995.
[56] E. Alpaydin, Introduction to Machine Learning, MIT Press,Cambridge, 2014, ISBN: 978-0-262-028189.
[57] L. Breiman, “Random forests,” Machine Learning, vol. 45,pp. 5–32, 2001.
34 Wireless Communications and Mobile Computing

[58] L. Breiman, J. H. Friedman, R. A. Olshen, and C. J. Stone, Clas-sification and Regression Trees, Wadsworth & Brooks/ColeAdvanced books & Software, Monterey, CA, 1984.
[59] L. Breiman, “Bagging predictors,” Machine Learning, vol. 24,pp. 123–140, 1996.
[60] L. Breiman, Out-of-Bag Estimation, Technical Report, Dept. ofstatistics, University of California, Berkeley, 1996.
[61] D. Mladenic and M. Grobelnik, “Feature selection for unbal-anced class distribution and naive bayes,” in ICML ‘99: Pro-ceedings of the Sixteenth International Conference onMachine Learning, vol. 99, pp. 258–267, Bled, Slovenia, 1999.
[62] G. H. John, R. Kohavi, and K. Pfleger, “Irrelevant features andthe subset selection problem,” Machine learning proceedings, ,pp. 121–129, 1994.
[63] P. Langley and S. Sage, “Scaling to domains with irrelevant fea-tures,” in Computational Learning Theory and Natural Learn-ing Systems, R. Greiner, Ed., vol. 4, MIT Press, 1994.
[64] P. Domingos and M. Pazzani, “Beyond independence: condi-tions for the optimality of the simple Bayesian classifier,” inMachine Learning: Proceedings of the Thirteenth InternationalConference on Machine Learning, pp. 105–112, San Francisco,CA, 1996.
[65] R. C. Quinlan, 4.5: Programs for Machine Learning, MorganKaufmann publishers Inc, San Francisco, 1993.
[66] J. D. Rodriguez, A. Perez, and J. A. Lozano, “Sensitivity analy-sis of k-fold cross validation in prediction error estimation,”IEEE Transactions on Pattern Analysis and Machine Intelli-gence, vol. 32, no. 3, pp. 569–575, 2010.
[67] N. Thomas Rincy and R. Gupta, “An efficient feature subsetselection approach for machine learning,” Multimedia toolsand applications, vol. 80, pp. 12737–12830, 2021.
[68] Z. H. Zhou, Ensemble Methods Foundation and Algorithms,CRC press: Taylor and Francis Group, 2012.
[69] P. Smyth and D. Wolpert, “Stacked density estimation,” inAdvances in Neural Information Processing Systems, pp. 668–674, MIT Press, Cambridge, MA, 1998.
[70] S. Samdani and S. Shukla, “A novel technique for convertingnominal attributes to numeric attributes for intrusion detec-tion,” in 2017 8th International Conference on Computing,Communication and Networking Technologies (ICCCNT),pp. 1–5, Delhi, 2017.
[71] A. Binbusayyis and T. Vaiyapuri, “Comprehensive analysisand recommendation of feature evaluation measures for intru-sion detection,” Heliyon, vol. 6, no. 7, 2020.
[72] S. Revathi and A. Malathi, “A detailed analysis on NSL-KDDdataset using various machine learning,” International Journalof Engineering Research & Technology, vol. 2, no. 12, pp. 1848–1853, 2013.
[73] M. Tavallaee, E. Bagheri, W. Lu, and A. A. Ghorbani, “Adetailed analysis of the KDD CUP-‘99 data set,” in Proceedingsof the IEEE Symposium on Computational Intelligence in Secu-rity and Defense Applications, Ottawa, Canada, 2009.
[74] P. Kavitha and M. Usha, “Anomaly based intrusion detectionin WLAN using discrimination algorithm combined withNaïve Bayesian classifier,” Journal of Theoretical and AppliedInformation Technology, vol. 62, no. 1, pp. 77–84, 2014.
[75] N. Moustafa and J. Slay, “UNSW-NB15 a comprehensive dataset for network intrusion detection systems (UNSW-NB15network data set),” inMilitary Communications and Informa-tion Systems Conference (MilCIS), pp. 1–6, Canberra, 2015.
[76] I. H. Witten and E. Frank, Data Mining: Practical MachineLearning Tools and Techniques, Morgan Kaufmann, San Fran-cisco, 2nd edition, 2005.
[77] H. Hanan and B. David, “A taxonomy and survey of intrusiondetection system design techniques, network threats and data-sets,” pp. 1–35, 2018, https://arxiv.org/abs/1806.03517.
35Wireless Communications and Mobile Computing