design and development of a maximum power point tracking
TRANSCRIPT

American Journal of Engineering Research (AJER) 2016
American Journal of Engineering Research (AJER)
e-ISSN: 2320-0847 p-ISSN : 2320-0936
Volume-5, Issue-5, pp-15-22
www.ajer.org Research Paper Open Access
w w w . a j e r . o r g
Page 15
Design and Development of a Maximum Power Point Tracking
(MPPT) charge controller for Photo-Voltaic (PV) power
generation system
Muhammad Riazul Hamid1, Jakaria Rahimi
1, Sabrina Chowdhury
1,
T.M. Moniruzzaman Sunny2
1Ahsanullah University of Science and Technology, Dhaka,.
2 Bondstein Technologies Ltd., Dhaka, Bangladesh
Abstract: - This paper describes how to implement MPPT using the most popular switching power supply
topology. There are many published works on this topic, but only a tiny portion of them show how to actually
implement the algorithms in hardware, as well as state common problems and pitfalls. In our work to keep the
design simple we have used Arduino Nano. It has features like: LCD display, Led Indication and it is equipped
with various protections to protect the circuitry from abnormal condition. This design is suitable for a 50W
solar panel to charge a commonly used 12V lead acid battery. As the maximum power point (MPP) of
photovoltaic (PV) power generation systems changes with changing atmospheric conditions (e.g. solar
radiation and temperature), an important consideration in the design of efficient PV systems is to track the
MPP correctly. We have implemented the most common MPPT algorithm named Perturb and Observe (PO) to
control the output of a synchronous buck-converter.
Keywords: - Photovoltaic systems, MPPT techniques, Perturb and Observe, Buck converter, Arduino
I. INTRODUCTION Using a solar panel or an array of panels without a controller that can perform Maximum Power Point
Tracking (MPPT) will often result in wasted power, which ultimately results in the need to install more
panels for the same power requirement. For smaller/cheaper devices that have the battery connected directly
to the panel, this will also result in premature battery failure or capacity loss, due to the lack of a proper end-
of-charge procedure and higher voltage. In the short term, not using an MPPT controller will result in a higher
installation cost and, in time, the costs will escalate due to eventual equipment failure. Even with a proper
charge controller, the prospect of having to pay 30-50% more up front for additional solar panels makes the
MPPT controller very attractive [1].The buck converter is used since it has a linear voltage transfer function
when operating in Continuous Conduction Mode (CCM). This simplifies things a lot, and the MPPT
controller can be implemented by operating directly on the converter duty cycle. The other topologies have a
nonlinear voltage transfer function, and operating directly on the duty cycle will yield unpredictable results,
especially at high duty cycles. In this case, the algorithm modifies the solar panel operating voltage by using a
proportional integral (PI) control loop, which steers the voltage to the desired value [2-9]. In the subsequent
part of this paper, the section 2 presents the basics of MPPT. In section 3 the PO algorithm is explained in
brief. The Buck converter is discussed in section 4. The total hardware design procedure is illustrated in
section 5and 6. The output results are presented in section 7. Finally concluding remarks are included in
section 8.
II. MAXIMUM POWER POINT TRACKING Maximum power point tracking (MPPT) is a technique used with wind turbines and photovoltaic (PV)
solar systems to maximize power output. PV solar systems exist in several different configurations. The most
basic
version sends power from collector panels directly to the DC-AC solar inverter, and from there directly to the
electrical grid.
A second version, called a hybrid inverter, might split the power at the inverter, where a
percentage of the power goes to the grid and the remainder goes to a battery bank. The third version is not
connected at all to the grid but employs a dedicated PV inverter that features the MPPT. In this configuration,

American Journal of Engineering Research (AJER) 2016
w w w . a j e r . o r g
Page 16
power flows directly to a battery bank. A variation on these configurations is that instead of only one single
inverter, micro inverters are deployed, one for each PV panel. This allegedly increases PV solar efficiency by
up to 20%. New MPPT equipped specialty inverters now exist that serve three functions: grid-connecting
wind power as well as PV, and branching off power for battery charging. [10]
This paper is about the application of MPPT concerns itself only with PV solar. Solar cells have a complex
relationship between temperature and total resistance that produces a non-linear output efficiency which can be
analyzed based on the I-V curve as shown in figure 1. It is the purpose of the MPPT system to sample the
output of the PV cells and apply the proper resistance (load) to obtain maximum power for any given
environmental conditions. MPP (Maximum power point) is the product of the MPP voltage (Vmpp) and MPP
current (Impp) [12].
(a) (b)
Figure 1.( a) IV characteristics of PV panel for different irradiance level . (b) PV characteristics
corresponding to IV characteristics in (a). Red dot shows the Maximum power point (MPP).
The author [10, 11] compares and evaluates the percentage of power extraction with MPPT and without
MPPT.
It clearly shows that when we use MPPT with the PV system, the power extraction efficiency is increase to
97%. The study of developing a PV charging system for li-ion batteries by integrating MPPT and charging
control for the battery is reviewed. The overall block diagram of PV panel with dc-dc converter and MPPT is
shown in figure 2 [12].
Figure 2. Block diagram of a MPPT controller.
w w w . a j e r . o r g Page 17
American Journal of Engineering Research (AJER) 2016
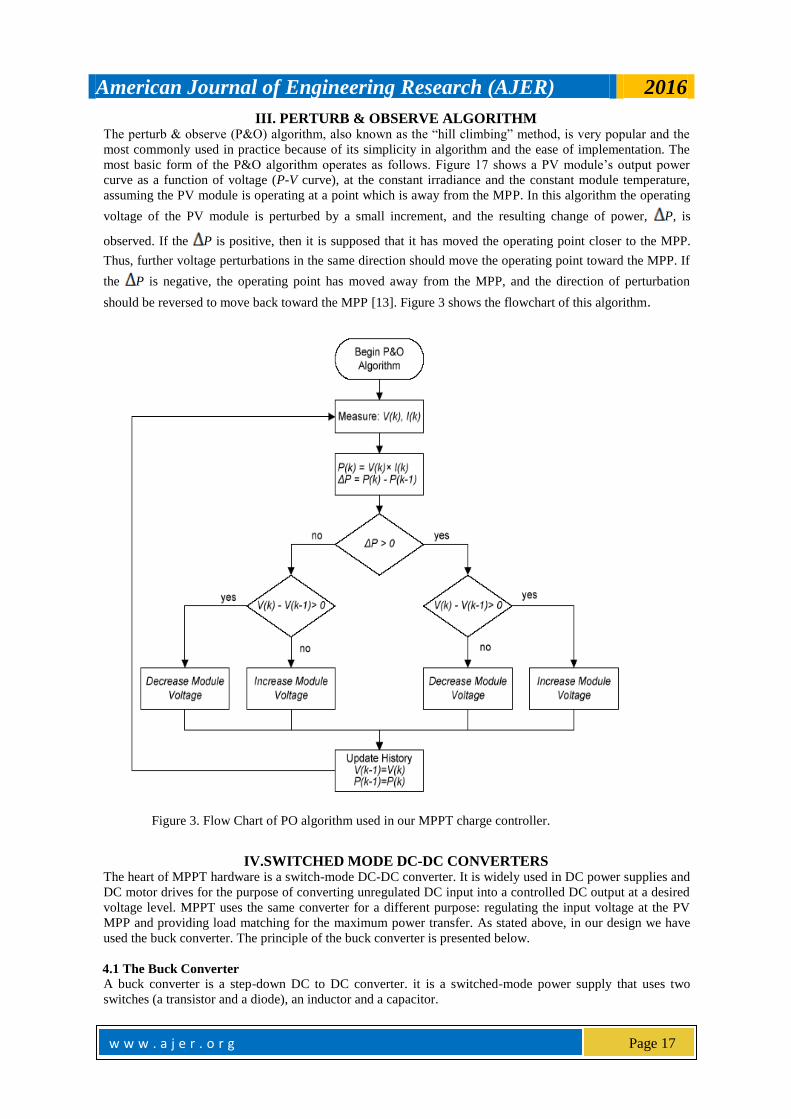
III. PERTURB & OBSERVE ALGORITHM The perturb & observe (P&O) algorithm, also known as the “hill climbing” method, is very popular and the
most commonly used in practice because of its simplicity in algorithm and the ease of implementation. The
most basic form of the P&O algorithm operates as follows. Figure 17 shows a PV module’s output power
curve as a function of voltage (P-V curve), at the constant irradiance and the constant module temperature,
assuming the PV module is operating at a point which is away from the MPP. In this algorithm the operating
voltage of the PV module is perturbed by a small increment, and the resulting change of power, P, is
observed. If the P is positive, then it is supposed that it has moved the operating point closer to the MPP.
Thus, further voltage perturbations in the same direction should move the operating point toward the MPP. If
the P is negative, the operating point has moved away from the MPP, and the direction of perturbation
should be reversed to move back toward the MPP [13]. Figure 3 shows the flowchart of this algorithm.
IV.SWITCHED MODE DC-DC CONVERTERS The heart of MPPT hardware is a switch-mode DC-DC converter. It is widely used in DC power supplies and
DC motor drives for the purpose of converting unregulated DC input into a controlled DC output at a desired
voltage level. MPPT uses the same converter for a different purpose: regulating the input voltage at the PV
MPP and providing load matching for the maximum power transfer. As stated above, in our design we have
used the buck converter. The principle of the buck converter is presented below.
4.1 The Buck Converter
A buck converter is a step-down DC to DC converter. it is a switched-mode power supply that uses two
switches (a transistor and a diode), an inductor and a capacitor.
Figure 3. Flow Chart of PO algorithm used in our MPPT charge controller.
w w w . a j e r . o r g Page 18
American Journal of Engineering Research (AJER) 2016
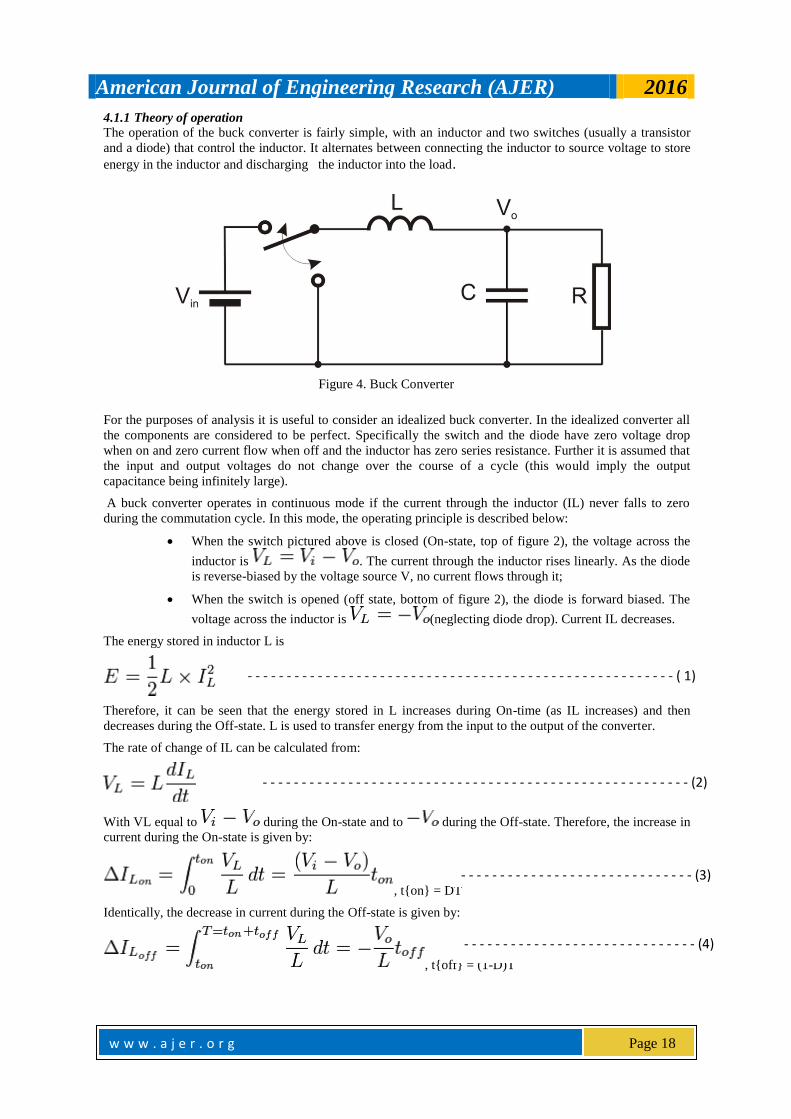
4.1.1 Theory of operation The operation of the buck converter is fairly simple, with an inductor and two switches (usually a transistor
and a diode) that control the inductor. It alternates between connecting the inductor to source voltage to store
energy in the inductor and discharging the inductor into the load.
For the purposes of analysis it is useful to consider an idealized buck converter. In the idealized converter all
the components are considered to be perfect. Specifically the switch and the diode have zero voltage drop
when on and zero current flow when off and the inductor has zero series resistance. Further it is assumed that
the input and output voltages do not change over the course of a cycle (this would imply the output
capacitance being infinitely large).
A buck converter operates in continuous mode if the current through the inductor (IL) never falls to zero
during the commutation cycle. In this mode, the operating principle is described below:
When the switch pictured above is closed (On-state, top of figure 2), the voltage across the
inductor is . The current through the inductor rises linearly. As the diode
is reverse-biased by the voltage source V, no current flows through it;
When the switch is opened (off state, bottom of figure 2), the diode is forward biased. The
voltage across the inductor is (neglecting diode drop). Current IL decreases.
The energy stored in inductor L is
Therefore, it can be seen that the energy stored in L increases during On-time (as IL increases) and then
decreases during the Off-state. L is used to transfer energy from the input to the output of the converter.
The rate of change of IL can be calculated from:
With VL equal to during the On-state and to during the Off-state. Therefore, the increase in
current during the On-state is given by:
, t{on} = DT
Identically, the decrease in current during the Off-state is given by:
, t{off} = (1-D)T
Figure 4. Buck Converter
- - - - - - - - - - - - - - - - - - - - - - - - - - - - - - - - - - - - - - - - - - - - - - - - - - - - - - - ( 1)
- - - - - - - - - - - - - - - - - - - - - - - - - - - - - - (3)
- - - - - - - - - - - - - - - - - - - - - - - - - - - - - - (4)
- - - - - - - - - - - - - - - - - - - - - - - - - - - - - - - - - - - - - - - - - - - - - - - - - - - - - - - (2)
w w w . a j e r . o r g Page 19
American Journal of Engineering Research (AJER) 2016
If we assume that the converter operates in steady state, the energy stored in each component at the end of a
commutation cycle T is equal to that at the beginning of the cycle. That means that the current IL is the same
at t = 0 and at t = T (see figure 4).
So we can write from the above equations:
It is worth noting that the above integrations can be done graphically: In figure 4, is proportional to the area of
the yellow surface, and to the area of the orange surface, as these surfaces are defined by the
inductor voltage (red) curve. As these surfaces are simple rectangles, their areas can be found easily:
for the yellow rectangle and for the orange one. For steady state operation,
these areas must be equal.
As can be seen on figure 4, and . D is a scalar called the duty cycle with a value
between 0 and 1. This yield:
From this equation, it can be seen that the output voltage of the converter varies linearly with the duty cycle
for a given input voltage. As the duty cycle D is equal to the ratio between ton and the period T, it cannot be
more than 1. Therefore, . This is why this converter is referred to as step-down converter. So, for
example, stepping 12 V down to 3 V (output voltage equal to a fourth of the input voltage) would require a
duty cycle of 25%, in our theoretically ideal circuit.
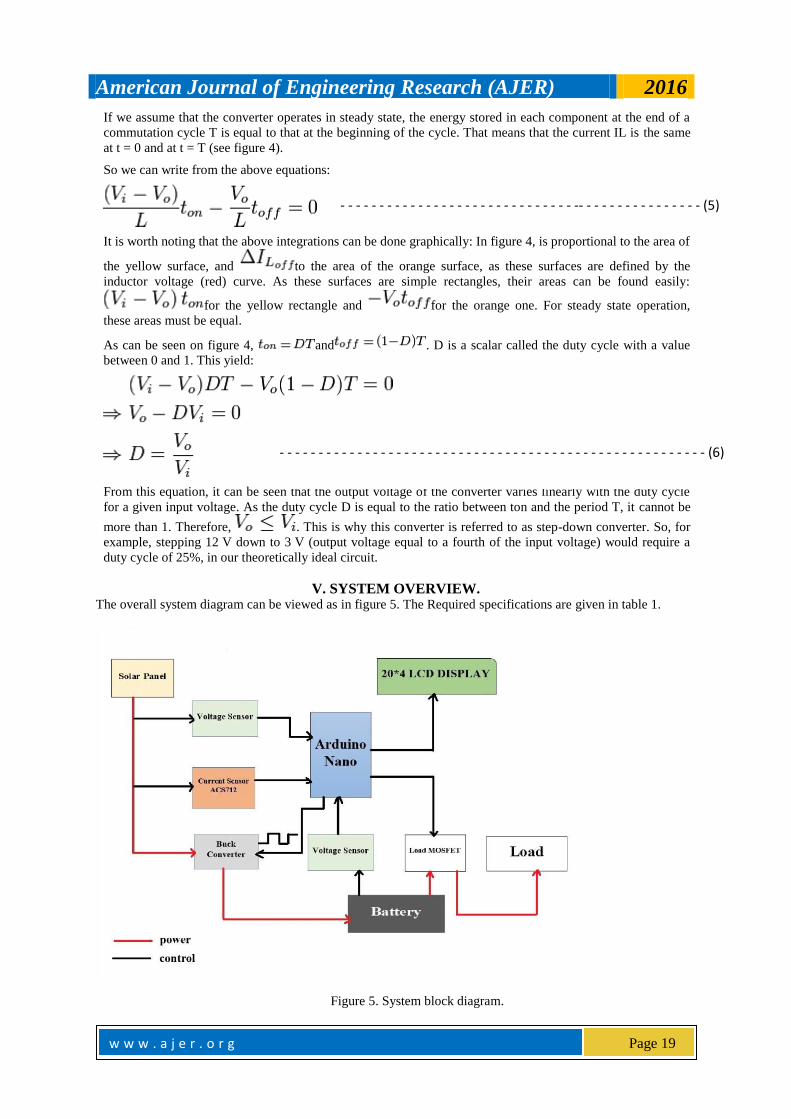
V. SYSTEM OVERVIEW. The overall system diagram can be viewed as in figure 5. The Required specifications are given in table 1.
Figure 5. System block diagram.
- - - - - - - - - - - - - - - - - - - - - - - - - - - - - - - - - - - - - - - - - - - - - - - - - - - - - - - (6)
- - - - - - - - - - - - - - - - - - - - - - - - - - - - - - -- - - - - - - - - - - - - - - - (5)
w w w . a j e r . o r g Page 20
American Journal of Engineering Research (AJER) 2016
Table 1. Features of the MPPRT controller Specification of the prototype of solar charge
controller
1. Based on Perturb and observe MPPT algorithm
2. LED indication for the state of charge
3. 20x4 character LCD display for displaying
voltages, current, power etc.
4. Overvoltage / Lightning protection.
5. Reverse power flow protection.
6. Short Circuit and
7.Over load protection
Electrical Specification of
Buck converter
1. Output Voltage =12 V
2. Max. Output Current = 5A.
3. Output Power = 50 W.
4. Input = 12-25V.
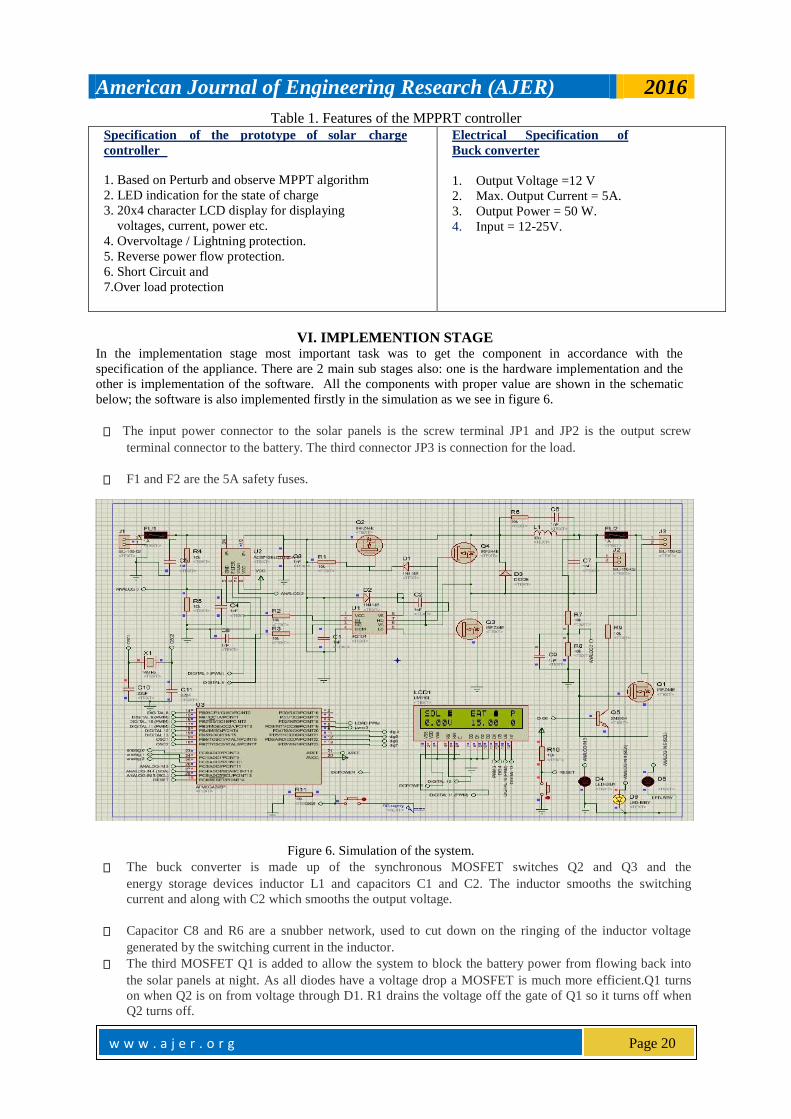
VI. IMPLEMENTION STAGE In the implementation stage most important task was to get the component in accordance with the
specification of the appliance. There are 2 main sub stages also: one is the hardware implementation and the
other is implementation of the software. All the components with proper value are shown in the schematic
below; the software is also implemented firstly in the simulation as we see in figure 6.
The input power connector to the solar panels is the screw terminal JP1 and JP2 is the output screw
terminal connector to the battery. The third connector JP3 is connection for the load.
F1 and F2 are the 5A safety fuses.
Figure 6. Simulation of the system.
The buck converter is made up of the synchronous MOSFET switches Q2 and Q3 and the
energy storage devices inductor L1 and capacitors C1 and C2. The inductor smooths the switching
current and along with C2 which smooths the output voltage.
Capacitor C8 and R6 are a snubber network, used to cut down on the ringing of the inductor voltage
generated by the switching current in the inductor.
The third MOSFET Q1 is added to allow the system to block the battery power from flowing back into
the solar panels at night. As all diodes have a voltage drop a MOSFET is much more efficient.Q1 turns
on when Q2 is on from voltage through D1. R1 drains the voltage off the gate of Q1 so it turns off when
Q2 turns off.

w w w . a j e r . o r g Page 21
American Journal of Engineering Research (AJER) 2016
The diode D3 (HER 507) is an ultra-fast diode that will start conducting current before Q3 turns on. It is
supposed to make the converter more efficient.
The IC IR2104 is a half bridge MOSFET gate driver. It drives the high and the low side MOSFETs
using the PWM signal from the arduino (Pin -D9) .The IR2104 can also be shut down with the control
signal (low on pin -D8) from the Arduino on pin 3.
D2 and C7 are part of the bootstrap circuit that generates the high side gate drive voltage for Q1 and Q2.
The software keeps track of the PWM duty cycle and never allows 100% or always on. It caps the PWM
duty cycle at 99.9% to keep the charge pump working.
There are two voltage divider circuits (R 1 , R 2 and R3,R4) to measure the solar panel and
battery voltages. The output from the dividers are feeds the voltage signal to Analog pin-0 and Analog
pin-2 .
The ceramic capacitors C3 and C4 are used to remove high frequency spikes.
The MOSFET Q4 is used to control the load. The driver for this MOSFET is consists of a transistor and
resistors R9 , R10.
The diode D4 and D5 are TVS diodes used for over voltage protection from solar panel and load side.
The current sensor ACS712 sense the current from the solar panel and feeds to the Arduino
analog pin-1.
The 3 LEDs are connected to the digital pins of the microcontroller and serve as an output interface to
display the charging state.
Reset switch is helpful if the code gets stuck.
The back light switch is to control the back light of LCD display.
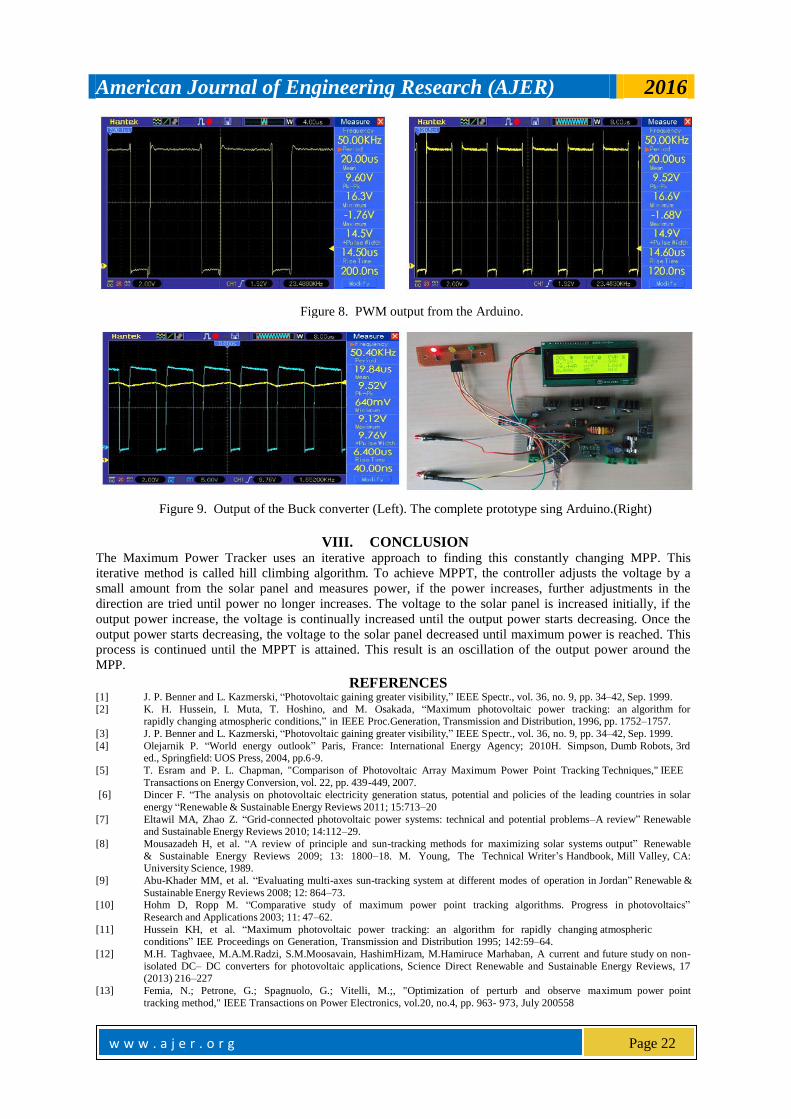
VII. HARDWARE TESTING STAGE In this step especially the input and output of the buck converter is tested.
Figure 7. Test schematic (Left) and Hardware prototype of the (Right) system.
w w w . a j e r . o r g Page 22
American Journal of Engineering Research (AJER) 2016
Figure 9. Output of the Buck converter (Left). The complete prototype sing Arduino.(Right)
VIII. CONCLUSION
The Maximum Power Tracker uses an iterative approach to finding this constantly changing MPP. This
iterative method is called hill climbing algorithm. To achieve MPPT, the controller adjusts the voltage by a
small amount from the solar panel and measures power, if the power increases, further adjustments in the
direction are tried until power no longer increases. The voltage to the solar panel is increased initially, if the
output power increase, the voltage is continually increased until the output power starts decreasing. Once the
output power starts decreasing, the voltage to the solar panel decreased until maximum power is reached. This
process is continued until the MPPT is attained. This result is an oscillation of the output power around the
MPP.
REFERENCES [1] J. P. Benner and L. Kazmerski, “Photovoltaic gaining greater visibility,” IEEE Spectr., vol. 36, no. 9, pp. 34–42, Sep. 1999.
[2] K. H. Hussein, I. Muta, T. Hoshino, and M. Osakada, “Maximum photovoltaic power tracking: an algorithm for rapidly changing atmospheric conditions,” in IEEE Proc.Generation, Transmission and Distribution, 1996, pp. 1752–1757.
[3] J. P. Benner and L. Kazmerski, “Photovoltaic gaining greater visibility,” IEEE Spectr., vol. 36, no. 9, pp. 34–42, Sep. 1999.
[4] Olejarnik P. “World energy outlook” Paris, France: International Energy Agency; 2010H. Simpson, Dumb Robots, 3rd ed., Springfield: UOS Press, 2004, pp.6-9.
[5] T. Esram and P. L. Chapman, "Comparison of Photovoltaic Array Maximum Power Point Tracking Techniques," IEEE
Transactions on Energy Conversion, vol. 22, pp. 439-449, 2007. [6] Dincer F. “The analysis on photovoltaic electricity generation status, potential and policies of the leading countries in solar
energy “Renewable & Sustainable Energy Reviews 2011; 15:713–20
[7] Eltawil MA, Zhao Z. “Grid-connected photovoltaic power systems: technical and potential problems–A review” Renewable and Sustainable Energy Reviews 2010; 14:112–29.
[8] Mousazadeh H, et al. “A review of principle and sun-tracking methods for maximizing solar systems output” Renewable
& Sustainable Energy Reviews 2009; 13: 1800–18. M. Young, The Technical Writer’s Handbook, Mill Valley, CA: University Science, 1989.
[9] Abu-Khader MM, et al. “Evaluating multi-axes sun-tracking system at different modes of operation in Jordan” Renewable &
Sustainable Energy Reviews 2008; 12: 864–73. [10] Hohm D, Ropp M. “Comparative study of maximum power point tracking algorithms. Progress in photovoltaics”
Research and Applications 2003; 11: 47–62.
[11] Hussein KH, et al. “Maximum photovoltaic power tracking: an algorithm for rapidly changing atmospheric conditions” IEE Proceedings on Generation, Transmission and Distribution 1995; 142:59 –64.
[12] M.H. Taghvaee, M.A.M.Radzi, S.M.Moosavain, HashimHizam, M.Hamiruce Marhaban, A current and future study on non-
isolated DC– DC converters for photovoltaic applications, Science Direct Renewable and Sustainable Energy Reviews, 17 (2013) 216–227
[13] Femia, N.; Petrone, G.; Spagnuolo, G.; Vitelli, M.;, "Optimization of perturb and observe maximum power point
tracking method," IEEE Transactions on Power Electronics, vol.20, no.4, pp. 963 - 973, July 200558
Figure 8. PWM output from the Arduino.