design and construction of mse slopes associated...
TRANSCRIPT

Design and Construction of MSE Slopes Associated With the Port
Mann Bridge, Vancouver, British Columbia
Gordon Fung, E.I.T. Geotechnical Engineer, MEG Consulting Ltd., Richmond, BC.
German Cajigas, M. Eng., P. Eng. Regional Design Engineer, Tensar International Corporation, Burnaby, BC.
Ryan Tones, P. Eng. Project Sponsor, Kiewit Flatiron General Partnership, Vancouver, BC
Dan MacDonald, P. Eng. Manager, MSE Group, Nilex, Burnaby, BC.
John R. Kerr, M. Eng., P. Eng. Regional Manager, Tensar International Corporation, Calgary, Alberta
Ender Parra C., Ph.D. Principal, MEG Consulting Ltd., Richmond, BC.
John P. Sully, Ph.D., P.Eng. Principal, MEG Consulting Ltd., Richmond, BC. ABSTRACT This paper presents the seismic modeling performed for the design of a 9-m high 70o SierraSlope® with an upper 2H:1V fill slope up to 4 m high. The SierraSlope®, a Mechanically Stabilised Earth (MSE) reinforced soil slope using geogrids, was introduced by Tensar International Corporation (Tensar). The facing of the slope is composed of welded wire mesh forms with a synthetic wrap system of Tensar Biaxial Geogrid. The FLAC (Fast Lagrangian Analysis of Continua) finite difference program was used to model the SierraSlope® under seismic loading conditions. The FLAC analyses are considered to provide a comparison and evaluation of the standard design approaches as well as an additional insight into the seismic performance of the SierraSlope®.
Project Overview
The Port Mann/Highway 1 Improvement Project is a $2.4 billion design-build project that includes the widening of 37 kilometers of Highway 1, from McGill Street to 216th Street in Langley, BC and construction of a new 10-lane cable-stayed Port Mann Bridge. The project is being undertaken by design-build contractor Kiewit/Flatiron General Partnership (KFGP) with H5M being the lead designer for the onshore works. H5M is a joint venture between Hatch Mott MacDonald and MMM Group. The project involves upgrading of interchanges to improve access and safety on Highway 1 to benefit the more than 100,000 commuters who travel the highway each day. In addition, it will provide capability for rapid-bus transportation and provide a new dedicated cycling network. The new Port Mann Bridge will be a tolled bridge and will be operational in December 2012, with project completion in 2013. The Port Mann/Highway 1 Improvement Project is part of the Province of British Columbia’s Gateway Program to respond to the impact of growing regional congestion, improve the movement of people, goods and transit and provide efficient transportation choices for the public. The project itself is divided into four segments that are classified as West (Vancouver, Burnaby), Central
(Coquitlam), Bridge (the site of the new bridge at the Fraser River Crossing), and East (Surrey, Langley).
The critical SierraSlope® section considered in the dynamic soil structure interaction analysis is located in Central Segment’s Cape Horn Interchange on the western approach to the new Port Mann Bridge. The Cape Horn Interchange is an area with complex geotechnical conditions. The representative soil profile for the area consists of a 3-m layer of engineered fill underlain by a thick sequence of sand and silty sand (about 30 m), followed by about 20 m of clay and silt which is finally underlain by till-like soils. Ground improvements for the area consisting of stone columns and were installed to mitigate the liquefaction potential of the sand and silty sand strata. The SierraSlope® retention system provided a solution for the highway widening that was capable of accommodating the construction and post construction settlements predicted in the area while meeting the stringent seismic performance criteria of the project.
Geotechnical Aspects
The geotechnical investigation for the site was conducted by MEG Consulting Ltd., which was retained by H5M, the

project’s prime consultant. The geotechnical study aimed at evaluating the soil properties for the foundation and design of the subject structure and other MSE structures proposed for the west abutment of the new Port Mann Bridge as well as assessing the site specific seismic response of the soils.
Stratigraphy According to the Geological Survey of Canada Map No. 1484A, the native soils found at the site are part of the Fraser River Sediments (Fc, Fd) geological unit underlain by Capilano Sediments (Ce) and Pre-Vashon Deposits (Pvf, Pvg). The representative soil stratigraphy at the site as interpreted by MEG consists of an upper layer of sandy fill overlying a 2.0 m thick layer of silt underlain by a 15 m thick layer of loose to compact silty sand to sand, followed by 15 m of dense sand which in turn overlies deposits of clayey silt and till-like soils.
Groundwater Seasonal variation of the groundwater table was estimated from piezometer monitoring in the range of elevation +0.5 m to +2.2 m above sea level. An average groundwater elevation of +1.5 m was used in the geotechnical analyses. The subject SierraSlope® is founded at elevations ranging between +3.4 m and +5.4 m above sea level.
Slope Design
Engineering design and site assistance was provided by Tensar International in conjunction with its Western Canada distributor, Nilex, Inc. The design team was awarded the work by Kiewit-Flatiron General Partnership, the project general contractor. The type of structure chosen for this site was Tensar SierraSlope® retention system which is a Reinforced Soil Slope consisting of a facing unit made of welded wire mesh forms with a wrap of Tensar Biaxial Geogrid (secondary reinforcement) that provides surficial stability to the reinforced fill; a pocket of plantable fill protected with a North American Green Erosion Control Mat (ECM); the primary reinforcement consists of Tensar Uniaxial geogrids. A typical layout of a SierraSlope® is shown on Fig. 1.
The SierraSlope® under construction ranges from 8 m to 9 m in height with an inclination at the face of 70 degrees to the horizontal (3H:8V). The geometry of the SierraSlope® used in the FLAC analysis differs from the one under construction to account for the different geometries expected in the project. In the numerical analysis an unreinforced 4.0 m high backslope inclined at 2H:1V was modelled on top of a 9 m high, 70 degree, reinforced slope.
Design Methodology The design of the reinforced slope was conducted following the guidelines and methodology proposed by the Federal Highway Administration in its document FHWA-NHI-00-043 (2001) and under the project specifications.
Consequently, the design was carried out using limit equilibrium slope stability methods - in this particular case the Bishop Method modified to account for the stabilizing effect of the geogrid reinforcements. The GSlope version
4.15 computer program (Mitre Software, 2006) was used for this purpose.
Internal Design The cohesionless reinforced fill within the SierraSlope® consists of poorly graded, clean sand with a friction angle of 34 degrees and unit weight of 18.5 kN/m
3.
The primary reinforcement consists of Tensar Uniaxial geogrids with ultimate tensile strengths ranging from 70 kN/m to 144 kN/m. Reduction factors (RF) used in the design consider a structure life of 75 years: FRcr (creep) =2.6; FRid (installation damage) = 1.1; RFd (durability) = 1.1.
Internal design included the analysis of potential circular failure surfaces passing through and behind the reinforced fill (compound stability). Minimum factors of safety under static conditions were set at 1.5. Other conditions analyzed considered the effect of the temporary fill due to the preload surcharge, traffic surcharge, additional surcharge due to re-grading of the wall after the occurrence of construction settlement and rapid drawdown due to flood conditions with a 200-yr return period.
External Design The external design involved the analysis of potential deep seated circular and non-circular failures. The minimum factor of safety for this portion of the analysis was set at 1.5 under static conditions. Sliding at any level of the slope and bearing capacity of the foundation were also checked. Construction settlements of the SierraSlope® were estimated in the range of 380 mm behind the reinforced mass and 170 mm at the toe of the slope. Post construction settlements in 75 years were estimated at 125 mm and 120 mm, respectively.
Fig. 1. Typical Layout of a SierraSlope®
Pseudo-static Design Seismic design of the reinforced slope was conducted using the limit equilibrium analysis pseudo-static approach for seismic events with return periods of 475-yr, 975-yr and subduction. The Peak Ground Acceleration (PGA) values for these seismic events are 0.28g, 0.36g and 0.20g, respectively. Minimum factors of safety for potential circular failure surfaces under seismic conditions (internal
and external) were set at 1.2, 1.1 and 1.2, respectively. Seismic performance of the SierraSlope® was also analyzed through numerical modelling as described in the following section of this paper.
Seismic Design
As part of the earthworks construction for the Port Mann Highway 1 upgrade project, a number of SierraSlopes® are being built as part of the highway widening. The SierraSlopes® vary in height across the project and have been designed by Tensar based on in-house design procedures that have developed over the years. In addition, based on design requirements imposed by the Ministry of Transportation and Infrastructure (MoTI) for soil-structure interaction analyses, a dynamic finite difference program has been used to model the response of the SierraSlope® under earthquake loading. As with traditional design approaches for the proprietary SierraSlope® design, MEG has analyzed the global stability of the wall while Tensar has analyzed the combined (external and internal) stability of the slope/wall.
Based on the design requirements for slopes steeper than 45 degrees, the SierraSlope® was designed to provide acceptable seismic performance during a seismic event with a return period of 975 years (5 percent probability of exceedence in 50 years). The SierraSlope® was designed in accordance with the AASHTO standard guidelines. Specific performance requirements for the SierraSlope® under the design earthquake loading require that: • collapse prevention with limited access to emergency
traffic;
• significant damage and permanent deformations are
permitted, but no collapse or loss of primary supports
are allowed.
The paper considers the case of a wall built on a potentially liquefiable layer. Ground improvement using stone columns was used to mitigate the liquefaction hazard in order to satisfy performance requirements. In addition, the length and the spacing of reinforcement are determined to achieve target factors of safety for potential slip mechanisms.
Numerical modeling (FLAC) The finite difference software FLAC Version 6.0 (Itasca 2008) was used to perform the 2D nonlinear dynamic analyses of the SierraSlope®.
Table 1 Soil properties used in the FLAC analysis * a, b and x0 are constants used in the FLAC Sig3 Model.
FLAC simulates nonlinear behavior by a generalized finite difference model, allows large-strain formulations, has built-in constitutive models, allows the use of interface and structural elements and uses a stable explicit solution method that marches-on in time. The FLAC analyses are based on effective stresses with no coupled flow (no drainage) in the analyses. Details of the soil and structural input properties used in the FLAC analyses are described in the following sections.
The purpose of the numerical modeling was to assess the performance of the SierraSlope® under seismic loading conditions. Results of the FLAC analyses include horizontal displacements of the SierraSlope® and forces in the geogrids during and after a design earthquake. The results provide an insight into the performance of the SierraSlope® under earthquake loading.
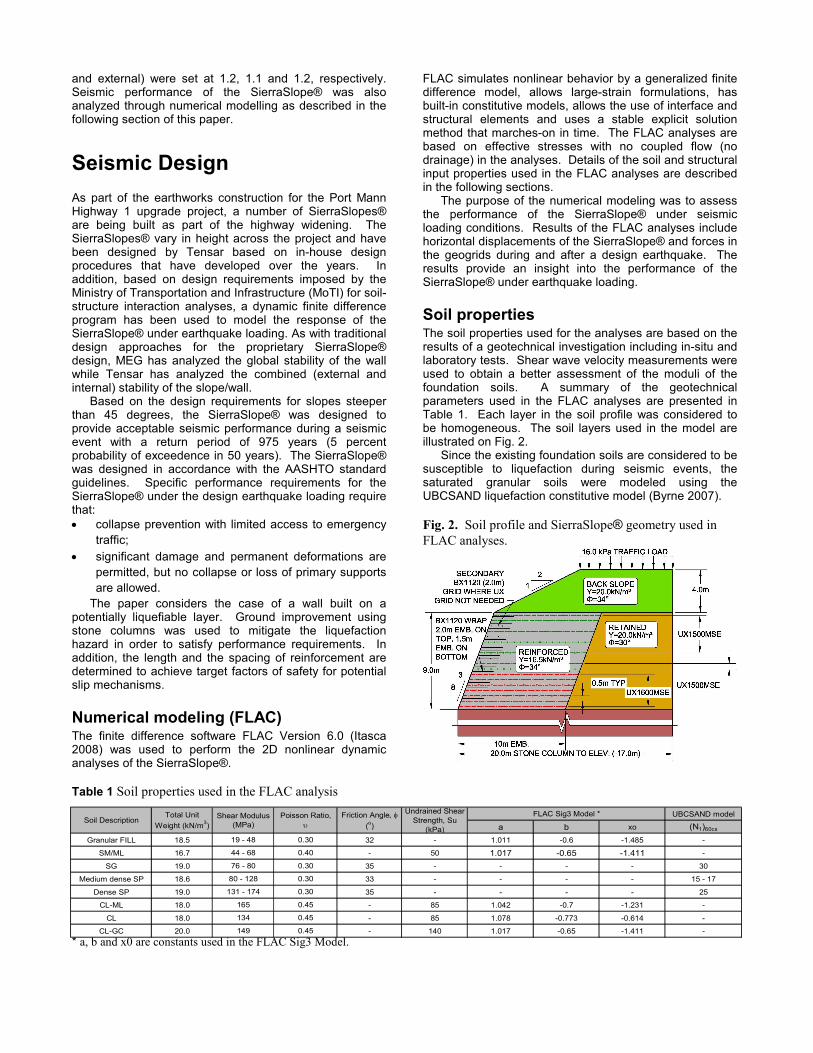
Soil properties The soil properties used for the analyses are based on the results of a geotechnical investigation including in-situ and laboratory tests. Shear wave velocity measurements were used to obtain a better assessment of the moduli of the foundation soils. A summary of the geotechnical parameters used in the FLAC analyses are presented in Table 1. Each layer in the soil profile was considered to be homogeneous. The soil layers used in the model are illustrated on Fig. 2.
Since the existing foundation soils are considered to be susceptible to liquefaction during seismic events, the saturated granular soils were modeled using the UBCSAND liquefaction constitutive model (Byrne 2007).
Fig. 2. Soil profile and SierraSlope® geometry used in FLAC analyses.
UBCSAND model
a b xo (N1)60cs
Granular FILL 18.5 32 - 1.011 -0.6 -1.485 -
SM/ML 16.7 - 50 1.017 -0.65 -1.411 -
SG 19.0 35 - - - - 30
Medium dense SP 18.6 33 - - - - 15 - 17
Dense SP 19.0 35 - - - - 25
CL-ML 18.0 - 85 1.042 -0.7 -1.231 -
CL 18.0 - 85 1.078 -0.773 -0.614 -
CL-GC 20.0 - 140 1.017 -0.65 -1.411 -
FLAC Sig3 Model *Poisson Ratio,
υ
0.30
0.30
0.30
0.45
44 - 68
19 - 48
0.45
76 - 80
0.40
0.30
Total Unit
Weight (kN/m3)
Soil DescriptionShear Modulus
(MPa)
Undrained Shear
Strength, Su
(kPa)
Friction Angle, φ
(o)
149
80 - 128
131 - 174
165
134 0.45

Calibration of soil models For cohesive and unsaturated granular materials, a Mohr-Coulomb elastic-plastic model with a built-in FLAC sig3 hysteretic damping model was used. The parameters for the sig3 model were selected to match published G/Gmax and damping (versus shear strain) curves presented by Vucetic and Dobry (1991) for cohesive soils and EPRI (1993) for sands. A comparison of the G/Gmax and damping curves obtained from the FLAC sig3 model and those from the referenced literature are presented on Fig. 3. The agreement between the two curves is generally very good up to shear strains of about 1%. Table 1 presents the input parameters for the FLAC sig3 model.
The saturated granular materials were modeled using the dynamic liquefaction model UBCSAND. The UBCSAND model was calibrated using field data obtained from SPT and CPT results from site investigation data in the area of the wall. The equivalent clean sand corrected SPT blow count [(N1)60cs] was found to vary from 15 to 25 with depth in the sand layer at the specific site of the SierraSlope®
For the granular soils, the dilation angle was estimated to be about [(N1)60cs]/10, as recommended for the UBCSAND model. The equivalent SPT blow count and the dilation parameters are defined as those needed to match the curve derived from liquefaction case histories, as suggested by Seed et al. (1985). A comparison of the prediction of the occurrence of initial liquefaction based on the UBCSAND model and the case histories presented by Seed et al. (1985) is presented on Fig. 4.
For the stone-column reinforced sand layer, a minimum [(N1)60cs] value of 30 was used for a normalized earthquake magnitude of 7.5. A summary of the constitutive model parameters for each of the soil layers used in the FLAC analyses is presented in Table 1.
Calibration of 1D site response analyses For the FLAC analyses, the input acceleration records were de-convoluted using SHAKE to a depth corresponding to the assigned basal layer. The soil models described above were used in FLAC to perform an equivalent 1D site response analysis that was compared with the results from both SHAKE and DESRA.
SHAKE and DESRA are equivalent linear and nonlinear codes, respectively, that are widely used for 1D site-specific seismic response analyses. It should be noted that UBCSAND pore pressure model was not used in the FLAC 1D model since liquefaction was not considered in any of the 1D site response analysis comparison.
The material (Rayleigh) damping at small strain for the FLAC analyses was also calibrated to obtain the best-possible match between the response spectra obtained using FLAC, SHAKE and DESRA. The Rayleigh damping for the FLAC model was estimated to be about 2.5%. The results from SHAKE, DESRA and FLAC, including the response spectra and time histories, are summarized and presented on Fig. 5.
Structural properties The reinforcement (geogrid) is modeled as strip elements programmed in FLAC Version 6.0 and the structural properties used in the FLAC analyses are summarized in Table 2.
Fig. 3. Published curves versus FLAC sig3 model (a)
G/Gmax curves and (b) Damping curves.
Fig. 4. Calibration of UBCSAND model against
liquefaction case histories.
0
0.1
0.2
0.3
0.4
0 10 20 30 40
(N1)60cs
Cyclic Stress Ratio (CSR) / Cyclic Resistance Ratio (CRR)
Youd et al. (M=7.5)
Youd et al. (M=7.1)
Youd et al. (M=8.2)
UBCSand Model (N=15)
UBCSand Model (N=17)
UBCSand Model (N=25)
SPT Clean-Sand Base Curve for Magnitude 7.5 Earthquakes
(Youd et al. 2001)
Magnitude Scaling Factors (MSF) - (Idriss, 1997)
Fig. 5. Comparison of 1D site response analyses.
0.0
0.2
0.4
0.6
0.8
1.0
1.2
1.4
0.0 0.5 1.0 1.5 2.0 2.5 3.0 3.5 4.0
Period (s)
Spectra Acceleration (g)
SHAKE
DESRA
FLAC

Table 2. Structural properties used in the FLAC analyses
UX1500MSE UX1600MSE BX1120
Width w mm 1330 1330 4000
Thickness t mm 0.544 0.710 0.225
Density ρ kg/m3 950 950 900
Elastic Modulus E GPa 2.28 2.364 1.46
Tensile yield strength fy kN 102.6 129.6 17.1
Tensile ultimate strength fu kN 114 144 19
Vertical Spacing Sv m 0.5/1.0 0.5 0.5
Initial apparent friction coefficient at the interface f0 - 0.8 0.8 0.8/1.0 *
Minimum apparent friction coefficient at the interface f1 - 0.55 0.55 0.8
Transition confining pressure (if any) σ'co kPa 60 70 40
Tensile failure strain limit - % 11 11 15
FLAC InputSymbol UnitsProperties
* Initial apparent friction coefficient was taken as 0.8 between BX1120/BX1120 interface and 1.0 between BX1120 and soil.
The SierraSlope® in the FLAC analyses consists of 3
types of geogrid. The primary reinforcements are composed of Tensar Uniaxial Geogrids (UX1500MSE & UX1600MSE) extending from the slope facing 10 m into the soil mass (i.e. a ratio of length to effective wall height of about 0.71). Tensar Biaxial Geogrids (BX1120) have been used as secondary reinforcements and also act as the SierraSlope® facing.
Model construction The FLAC model was built in stages to provide a realistic representation of the construction conditions. The initial ground conditions and ground improvement zone were modeled to define the initial conditions. Following the establishment of the initial conditions, the SierraSlope® was built incrementally in lifts for each layer of geogrid installation. Finally, a time history of earthquake motion was applied to simulate the seismic loading condition. The FLAC model was constructed as large as practically possible to minimize the edge effects from the boundary of the model.
The static boundary conditions have been modeled as fixed in the horizontal direction for both the left and right sides of the model; the base is fixed in both the horizontal and vertical conditions. Free-field boundary conditions were assigned to the sides of the model during seismic analyses while the base was fixed in the vertical direction with the time history velocity record applied in the horizontal direction.
Results of FLAC analyses
Three spectrally-matched earthquake records with two horizontal components have been used as an input in the FLAC analyses. The average of the six earthquake time-history records has been used to evaluate the liquefaction assessment, residual displacements and the tensile forces in the geogrids under the 975-year design earthquake. A performance check was also completed using the 475-year records to ensure that the performance requirements were satisfied.
Liquefaction assessment The liquefaction assessment was evaluated using the FLAC analyses and was compared to the traditional approach where triggering of initial liquefaction is estimated based on the recommendations published by Youd et al. (2001). Liquefaction assessments are typically performed using an equivalent-linear 1D dynamic analysis
program such as SHAKE. The results of the SHAKE analyses provide the variation with depth of the cyclic stress ratio (CSR) which is compared to the cyclic resistance ratio (CRR) of the soil based on penetration test data (CPT or SPT).
The FLAC analyses indicate that the extent of liquefaction is less than that determined by the SHAKE analysis approach. This is particularly the case for the subduction earthquake where the simplified methodology appears to exaggerate the impact of the subduction event. It would appear that the parameters used to adjust the simplified method for the subduction event with greater numbers of cycles and longer duration are overly conservative, compared to the FLAC results.
The FLAC analyses also provide the time when initial liquefaction occurs. The timing of the initial liquefaction is important when evaluating the lateral displacements of the SierraSlope®. Code-based approaches may significantly overestimate the expected deformation since the combined post-seismic approach (liquefaction and/or post-seismic degradation plus inertial forces) assumes that liquefaction occurs before the onset of the strong motion. The lateral deformations will be significantly increased when the liquefaction has occurred at the beginning of the strong motion, compared to at some time after the strong motion part of the record has passed. Under these conditions the ground deformations from FLAC are generally lower than those obtained from the combined seismic analyses based on a softened soil and the Newmark approach. The difference is particularly pronounced for lower levels of earthquake shaking.
For the 975-year earthquake analyses with FLAC, the results indicate that liquefaction occurs at or shortly after the passage of the strong motion component.
External Stability The calculated lateral deformations from the FLAC analyses have been compared to the simplified approach detailed in the Applied Technology Council publication ATC-49. The simplified approach of estimating lateral deformations includes the use of limit equilibrium slope stability and Newmark (1965) deformation analyses.
Newmark considered that the lateral deformations are generated by the unbalanced sliding forces when the factor of safety of a slope is less than 1.0 under seismic conditions. The limit equilibrium slope stability analyses were used to estimate the yielding acceleration (the minimum acceleration required to produce instability of the slope) of the mobilized surface during the seismic event. The acceleration record was then integrated to obtain the permanent deformations.
The failure surfaces from both FLAC and limit equilibrium stability analyses are presented in Fig. 6. The average deformations from the FLAC analyses are 420 mm (lateral) and 175 mm (vertical) at the top of the front face of the reinforced SierraSlope®. The Newmark displacements are estimated to be about 590 mm along the failure surface. The differences in the deformations may result from the timing of the occurrence of the initial liquefaction and degradation of the soil parameters. The coincidence of liquefaction with the onset of strong motion during the 975-year earthquake shaking is likely the reason for the good agreement between the two analyses.

Fig. 6. Critical failure surfaces from (a) displacement
vectors from FLAC analyses and (b) limit equilibrium
slope stability analyses.
Internal Stability The maximum tensile forces in the geogrid elements induced by the seismic loading are summarized in Table 3. The average tensile force generated in the geogrid elements is well below the tensile yield strength. The yield strength of the geogrid is specified as being 90% of the ultimate strength with a strain limit of about 11%. The results in Table 3 indicate that the tensile forces in the geogrid elements are consistent with the level of deformation exhibited by the SierraSlope®.
Table 3. Summary of maximum tensile forces in geogrid.
1 UX1600MSE 22.2 - 41.1 30.7
2 UX1600MSE 27.2 - 36.9 30.9
3 UX1600MSE 22.5 - 33.8 28.3
4 UX1600MSE 22.5 - 30.7 25.4
5 UX1600MSE 20.5 - 29.1 23.9
6 UX1600MSE 19.5 - 27.4 22.8
7 UX1600MSE 18.5 - 25.7 21.0
8 UX1500MSE 14.5 - 19.3 15.9
9 UX1500MSE 14.7 - 18.3 15.6
10 UX1500MSE 14.2 - 19.0 16.1
11 UX1500MSE 13.5 - 17.2 15.5
12 UX1500MSE 11.9 - 16.2 13.6
13 UX1500MSE 11.2 - 23.2 14.1
14 UX1500MSE 10.3 - 22.3 14.1
15 BX1120 3.8 - 6.3 4.4
16 BX1120 2.4 - 5.8 3.2
17 BX1120 1.5 - 6.1 2.4
18 BX1120 0.6- 7.0 1.9
19 BX1120 0.1 - 16.5 2.9
17.1
Average
(kN/m)
Tensile yield strength
(kN/m)
129.6
102.6
Maximum Tensile
Forces (kN/m)Geogrid number Geogrid type
Design Considerations The SierraSlope® was designed in accordance with the AASHTO standard guidelines which are based on the Mononobe-Okabe (M-O) method. According to the AASHTO recommendations, it is acceptable to select a
horizontal seismic coefficient (kh) equal to one-half of the peak horizontal ground acceleration (PGA). The results of the FLAC analyses indicate that the maximum horizontal acceleration at a point equivalent to the centroid of the Rankine active wedge behind the SierraSlope® is in the range from 0.42*PGA to 0.56*PGA, which is consistent with the AASHTO guidelines. This may be because the deformations of the geogrid reinforced slope are such that the Mononobe-Okabe assumption of the development of the active pressure holds and allows a reduction of the seismic pressure on the back of the wall. This may not be the case for stiffer wall systems where adequate levels of deformation cannot be developed.
Construction
The reinforced soil slope supports the new eastbound Highway 1 lanes as part of the Cape Horn Interchange along the approach to the new Port Mann Bridge. Construction on the slope commenced on March 17
th,
2010 by the Kiewit Flatiron General Partnership (KFGP). The maximum vertical height of slope is 9 m at its eastern end where the slope terminates, and the new alignment transitions into the combined mineral fill/EPS approach embankment to the proposed bridge crossing. The design running length of the slope is 236 m, with a face area of approximately 2,000 m
2, and requiring 11,000 m
3 of
compacted granular backfill within the reinforced zone. The total volume of fill to be used in the widening of this area is roughly 50,000 m
3.
At the time of initial slope construction, a preload wall located to the left of Fig. 7 was in place. This preload wall preceded the SierraSlope® construction. As an added construction challenge, the preload wall is also sitting atop the new slope alignment over a distance of 25 m at the western end. KFGP contracting forces were intently focused on completing ground improvement just prior to slope placement, and more specifically; the commencement of bridge piling at the eastern extent.
Construction Challenges With construction settlements estimated to be 375 mm at the back of the reinforced zone and 175 mm at the toe, and long term post-construction settlements estimated to be up to 200mm of additional settlement, an inherently flexible wall/slope solution was required. With settlements estimated, but not definitively known until the end of construction, the system needed to be adaptable in the field as determined by KFGP. The general area of slope construction is indicated on Fig. 8 by the red line. The site is located immediately south and beneath the current highway 1 alignment.
Initial solutions focused on two stage MSE wall solutions comprised of wire and precast facing. This proved to be more costly in terms of crane accessibility, mobilization costs, and access along the southern property line, as well as overall time required for final completion.
The PMH1 team was not permitted day time closures during restricted hours (5 a.m. to 9 p.m.). These restricted hours would primarily impact daytime backfill haulage routes to site. During daytime hours, backfill was primarily trucked through the busy industrial traffic network at United Boulevard as indicated by the green arrow on Fig. 8 below.
(a)
(b)

On Fig. 8 below the general area of slope construction is shown by the red line.
Fig. 7. Preload wall and start of slope construction
Fig. 8. Red line indicates slope location
This unique slope design incorporates a vegetated green facing, requiring multiple consultations with Transportation Investment Corporation (TI Corp) to gain approval for use of the product. An added benefit to the product brought to PMH1 Project is that the vegetated slope facing provides a green solution for meeting the aesthetic “Tourway” classification of the project.
Foundation Preparation/Installation Prior to commencing construction of the reinforced soil slope ground improvements were conducted in the area. These ground improvements consisted of stone columns installed to elevation -17.0 m or a depth of approximately 20 m with the footprint of the installation extending roughly 5m in front of the toe of the slope and 15m beneath the slope throughout the length. The stone columns were installed at 3.0 m o/c spacing from east to west, employing a dry bottom-feed installation method. Extensive ground monitoring and mitigation measures such as sheet piling, were required in the areas near the existing Port Mann Bridge and surrounding infrastructure in order to prevent damage due to excessive lateral soil deformations and settlements during the stone column operations.
Slope Installation After ground improvement was complete the slope was ready for installation by KFPG. As seen on Fig. 9 the wall system is essentially comprised of a temporary black wire facing lined with a UV stabilized biaxial geogrid along with a turf reinforcement mat. Soil reinforcement is comprised of primary uniaxial and secondary biaxial geogrid.
Fig. 9. Wire facing with P300 turf reinforcement
Black welded-wire facing elements 3000 mm long by 508 mm high were easily placed upon a compact granular improved foundation. The cages from a constructability point of view are lightweight and easily man-handled on site. Wall alignment is achieved by simple survey methods consisting of offset stakes and string lines. KFPG survey forces were on site on a daily basis to monitor wall alignment and settlement of the flexible facing as construction proceeded upwards.
As the site is proximal to the Fraser River, the site/design is also subjected to the 1 in 200 year flood event. A P300 turf reinforcement mat (shown in green) was selected within the lower slope where flooding could occur.
Clean granular sandy gravel (Lehigh SGSB) was selected for use in the lower slope portion to facilitate excellent drainage. Above flood level a C125 erosion control blanket (brown color) is seen on Fig 9 above. This blanket selection will later serve to protect the growing medium from the effects of climate as the hydro seed begins to germinate. The topsoil pocket is also noted immediately behind the P300 in the lower left of Fig. 9.
Initial slope construction is illustrated on Fig. 10 where it extends along the southern property line. The installation of primary uniaxial geogrid, along with settlement gages is noted.
To facilitate drainage within the slope, a drainage trench filled with clear crushed rock and lined with non-woven filter fabric is noted just left of the settlement gage.
Above flood level the backfill is changed to the use of sand backfill which is not only cost effective, but also an easily accessible fill source commonly used in this region. Contracting forces for this slope installation consisted of a 3 to 4 man crew, along with the associated heavy equipment necessary for backfilling and compaction. At the time of this paper, the KFGP crews had switched into a

24-hour day and night shift as the backfill quantities required for this widening section are significant.
Fig. 10. Looking toward south property line.
Construction Advantages The prime advantage of slope technology is that it does not require extensive concrete footings or wall panels, typical of more conventional MSE systems. The contractor was able to commence slope installation immediately after granular foundation improvements were complete. An extensive lay down area, often required for concrete faced systems, was not required freeing up valuable lay down space for the priority focus of bridge construction.
With the existing preload wall already in place, the wire facing allowed KFPG to simply step the wall down at the western extent, to facilitate the later tie-in when the preload wall is removed. The simplicity of wire facing installation provides the contractor the ability to make field facing changes as dictated by the contractor’s critical time frame, as opposed to concrete production schedules.
The system also met the rigorous seismic requirements, coupled with highway loading requirements of 16 kPa, while providing a permanent, but deformation tolerant facing.
Green facing was an attractive alternative to conventional concrete facing, and will further enhance habitat restorative efforts on the project.
The use of HDPE geogrid materials are also cited in AASHTO and FHWA references as not aggressively affected by corrosion due to de-icing salts from roadways above, or brackish water during river flood events.
Conclusion
The non-linear displacement-based FLAC modeling provides an additional understanding of the seismic performance of the SierraSlope®. Based on a comparison of FLAC analyses performed for several SierraSlope® geometries, it would appear that the in-house design approach provides a design that is conservative with respect to the results from detailed soil-structure interaction analyses. This is considered to be the case since the geogrid reinforced slope provides a flexible response under earthquake loading that is consistent with
the assumptions employed in the code-based design approaches.
The FLAC analyses provide an indication of the time-history variations of pore pressure development and liquefaction triggering during seismic events. Forces in the geogrid can also be tracked in the analysis. The estimated forces in the geogrid did not exceed the yield strength of the reinforcements for any of the 975-year earthquake records. In addition, the results for the slope in question have shown that the global and internal stability of the SierraSlope® using the standard design approaches are considered to be conservative relative to the numerical modeling.
Acknowledgements The authors wish to acknowledge the contributions of Mr. Ryan Bonnett of Kiewit Flatiron Partnership for his contribution to the completion of this paper, Mr Don Bose of H5M for the overall design basis, Willy Liu and Ken Akins of Tensar International for their MSE design assistance and Transportation Investment Corporation for making it all possible.
References
ATC/MCEER 2006. Liquefaction Study Report and Design Examples, Companion Documents to the Recommended LRFD Guidelines for the Seismic Design of Highway Bridges, Applied Technology Council and the Multidisciplinary Center of Earthquake Engineering Research, State University of New York. Byrne, P.M. 2007. Dynamic analysis for modeling soil and soil-structure systems subjected to earthquake shaking. Short Course Note, June 4 to 5, University of British Columbia. EPRI 1993. Guidelines for determining design basis ground motions. Palo Alto, Calif: Electric Power Research Institute, Vol. 1 to 5, EPRI TR-102293. Itasca Consulting Group 2008. FLAC – Fast Lagrangian Analysis of Continua. Users Guide, Version 6.0, Minneapolis, USA. Newmark, N.M. 1965. Effects of earthquakes on dams and embankments. Geotechnique, Vol. 15, No. 2, pp. 139-160. Vucetic, M. and Dobry, R. 1991. Effect of soil plasticity on cyclic response. ASCE Journal of Geotechnical Engineering, Vol. 117, No. 1, pp. 89-107. Youd, T.L., Idriss, I.M., Andrus, D.R., Arango, I., Castro, G., Christian, T.J., Dobry, R., Finn, W.D.L., Harder, L.F. Jr., Hynes, E.M., Ishihara, K., Koester, J.P., Liao, S.S.C., Marcuson, W.F.III, Martin, G.R., Mitchell, J.K., Moriwaki, Y., Power, M.S., Robertson, P.K., Seed, R.B., and Stokoe, K.H.II. (2001). “Liquefaction Resistance of Soils: Summary Report from the 1996 NCEER and 1998 NCEER/NSF Workshops on Evaluation of Liquefaction Resistance of Soils.” ASCE, Journal of Geotechnical and Geo-Environmental Engineering, October, pp. 817-832.