design and analysis of penetrator probes for planetary...
TRANSCRIPT

Design and Analysis of PenetratorProbes for Planetary Science
Applications
Charlotte E. Lowey, Jeffrey A. Hoffman
August 2017 SSL 19-17

This page intentionally left blank.

Design and Analysis of PenetratorProbes for Planetary Science
Applications
Charlotte E. Lowey, Jeffrey A. Hoffman
August 2017 SSL 19-17
This work is based on the unaltered text of the thesis by Charlotte Loweysubmitted to the Department of Aeronautics and Astronautics in partial ful-fillment of the requirements for the degree of Master of Science in Aeronauticsand Astronautics at the Massachusetts Institute of Technology.
1

2

Design and Analysis of Penetrator Probes for Planetary
Science Applications
by
Charlotte Lowey
Submitted to the Department of Aeronautics & Astronauticson August 24, 2017, in partial fulfillment of the
requirements for the degree ofMaster of Science in Aeronautics & Astronautics
Abstract
Penetrator probes emplace by impact into a solid medium, carrying scientific in-strumentation to fulfil specified post-impact mission objectives. They have been usedsuccessfully for multiple terrestrial applications, but only flown once unsuccessfully asa planetary exploration vehicle, with many proposed penetrator missions over severaldecades being cancelled at various stages of development.
We examine past applications of penetrator probes alongside current Antarcticresearch instrumentation, setting out the context for design and analysis work carriedout on the Geodetic Seismic Ice Penetrator (GSIP). GSIP is a separable two-bodypenetrator designed for air-deployment from LC-130 aircraft into snow pack on theRoss Ice Shelf, using existing polar research aircraft as the deployment method. Themission objective is to measure seismic readings and ice shelf displacement for afull year in order to improve understanding of the dynamic effect of ocean forcingon ice shelf stability. GSIP also aims to improve upon current Antarctic researchinstrumentation by reducing the on-ice footprint and therefore reducing the risk toteam members, as well as reducing the deployment time and cost when compared todeployment by hand on the ground. Using an air-deployed sensor vehicle improvesease of instrumenting remote and crevassed areas to establish a wide network ofseismic sensors, in order to build up a large-scale overview of dynamic response acrossthe ice shelf.
The current design of the GSIP system is presented, including the need for thepenetrator to be aerodynamically stable with a low centre of gravity in order torapidly damp oscillations during the falling phase and maximise the probability ofemplacing at a vertical or near-vertical angle. This is required both to achieve stableseismic coupling with the snow pack and to fulfil the microseismometer positioningrequirements. A two-body design was selected due to the ability to separately optimisethe forebody design to emplace at least 100% of its length to achieve secure seismiccoupling and the afterbody design to decelerate rapidly upon impact to ensure theantennas are placed sufficiently high above the surface to remain uncovered after afull year of snow accumulation. This separable design improves GSIP’s robustness to
3
the wide possible range of impact medium properties which may be encountered.Due to a strong reliance of success on the properties of the impact medium, a MAT-
LAB simulation of snow penetration was developed and used to compare a range ofdesign variables. Although snow mechanics is a complex field requiring large amountsof simplification to succeed in solving specific practical problems, this simulation waspartially validated using data from drop testing into snow and shown to have lowerror values. The model was used to help refine the design for GSIP but also to aid inthe development of a miniaturised earthquake-monitoring soil penetrator, broaden-ing the range of impact medium variables which were considered by the penetrationsimulation.
Thesis Supervisor: Jeffrey A. HoffmanTitle: Professor of the Practice of Aeronautics & Astronautics
4
Acknowledgments
This material is based upon work supported by the National Science Foundation un-
der Grant No. (025384-00001): ‘Development of an air-droppable geodetic-seismic ice
penetrator for response studies of Antarctic ice shelves and icebergs to ocean forcings’.
Work on the soil penetrator probe was supported by funding from MIT Lincoln Lab-
oratory. The author gratefully thanks the sponsors for their generous support that
enabled this research.
Additional gratitude is due to Professor Jeffrey Hoffman and Dr. Pedro Elosegui
for their support and guidance throughout this project.
5

6

Contents
1 Introduction 15
1.1 Motivation . . . . . . . . . . . . . . . . . . . . . . . . . . . . . . . . . 16
2 Background 19
2.1 Definitions . . . . . . . . . . . . . . . . . . . . . . . . . . . . . . . . . 19
2.2 Past applications . . . . . . . . . . . . . . . . . . . . . . . . . . . . . 20
2.2.1 Mars-96 . . . . . . . . . . . . . . . . . . . . . . . . . . . . . . 20
2.2.2 New Millennium Deep Space 2/Mars Microprobes . . . . . . . 22
2.2.3 Earth penetrators and military surveillance applications . . . . 23
2.2.4 Ice penetrators . . . . . . . . . . . . . . . . . . . . . . . . . . 25
2.3 Mission success considerations . . . . . . . . . . . . . . . . . . . . . . 29
2.4 Current Antarctic research instrumentation . . . . . . . . . . . . . . . 36
2.4.1 Study of infragravity wave impact on Antarctica . . . . . . . . 39
3 Key mission features for Antarctic penetrator 43
3.1 Concept of operations . . . . . . . . . . . . . . . . . . . . . . . . . . 43
3.2 GSIP system-level requirements . . . . . . . . . . . . . . . . . . . . . 46
3.3 Subsystem overview . . . . . . . . . . . . . . . . . . . . . . . . . . . . 48
3.3.1 Structures . . . . . . . . . . . . . . . . . . . . . . . . . . . . . 48
3.3.2 Power . . . . . . . . . . . . . . . . . . . . . . . . . . . . . . . 55
3.3.3 Payload . . . . . . . . . . . . . . . . . . . . . . . . . . . . . . 59
3.3.4 Communications . . . . . . . . . . . . . . . . . . . . . . . . . 64
3.3.5 Thermal . . . . . . . . . . . . . . . . . . . . . . . . . . . . . . 68
7

3.3.6 Avionics . . . . . . . . . . . . . . . . . . . . . . . . . . . . . . 70
4 Penetration dynamics 73
4.1 Background . . . . . . . . . . . . . . . . . . . . . . . . . . . . . . . . 73
4.2 Simulation work . . . . . . . . . . . . . . . . . . . . . . . . . . . . . . 81
4.2.1 Simulation results . . . . . . . . . . . . . . . . . . . . . . . . . 83
4.3 Prototype/scale model drop testing . . . . . . . . . . . . . . . . . . . 99
4.3.1 Scale model drop testing results (February 2017) . . . . . . . . 100
5 Soil penetrator probe 107
5.1 Introduction . . . . . . . . . . . . . . . . . . . . . . . . . . . . . . . . 107
5.2 Requirements . . . . . . . . . . . . . . . . . . . . . . . . . . . . . . . 108
5.3 Power subsystem sizing . . . . . . . . . . . . . . . . . . . . . . . . . . 110
5.4 Communications subsystem . . . . . . . . . . . . . . . . . . . . . . . 114
5.5 Penetration dynamics . . . . . . . . . . . . . . . . . . . . . . . . . . . 117
5.5.1 Results plots from soil penetration simulation . . . . . . . . . 118
5.5.2 Relationships observed from model . . . . . . . . . . . . . . . 129
5.6 Mass estimate . . . . . . . . . . . . . . . . . . . . . . . . . . . . . . . 133
5.7 Conclusions . . . . . . . . . . . . . . . . . . . . . . . . . . . . . . . . 134
6 Discussion of current design and risk mitigation 139
7 Conclusions 145
7.1 Future work . . . . . . . . . . . . . . . . . . . . . . . . . . . . . . . . 150
8

List of Figures
2-1 Sandia Labs Ice Penetrating Sensor Vehicle design, and emplacement
into wider or narrower sea ice thicknesses. Image credit: Young (1974)2 26
2-2 ADIOS penetrator design. Image credit: Jones (2013)12 . . . . . . . . 27
2-3 Classification of ocean waves according to period, with relative ampli-
tude indicated by curve height. Image credit: Munk (1951)24 . . . . . 40
2-4 Vertical root-mean-square displacement amplitudes spanning the 50-
250 s period infragravity wave band and 12-30 s period swell band,
recorded by the RIS2 seismometer. Image credit: Bromirski (2010)25 41
3-1 Concept of Operations for GSIP . . . . . . . . . . . . . . . . . . . . . 44
3-2 Snow density measured at increasing depth in the snow pack, plotted
from data recorded during the 1957-1958 Ross Ice Shelf traverse28 . . 50
3-3 Relation of volumetric compression modulus and density in snow. Im-
age credit: Mellor (1974)29 . . . . . . . . . . . . . . . . . . . . . . . . 51
3-4 RMS error of GPS estimates over a 25-minute period, including 15
minutes of antenna motion from 0-900 seconds. Image credit: Elosegui
(2006)31 . . . . . . . . . . . . . . . . . . . . . . . . . . . . . . . . . . 60
3-5 GPS positioning error with and without simultaneous Iridium trans-
mission at 50 cm separation. Image credit: P. Elosegui, MIT Haystack
Observatory . . . . . . . . . . . . . . . . . . . . . . . . . . . . . . . . 65
4-1 Comparison of effects of using 0.1/0.2/0.3 friction coefficient in model
on predicted g-loading, over a range of impact velocities and snow
compressive pressure values . . . . . . . . . . . . . . . . . . . . . . . 85
9

4-2 Comparison of effects of using 0.1/0.2/0.3 friction coefficient in model
on predicted penetration depth, over a range of impact velocities and
snow compressive pressure values . . . . . . . . . . . . . . . . . . . . 86
4-3 Comparison of 16.76/33.52/50.28 cm nosecone taper length effect on
predicted g-loading, over a range of impact velocities and snow com-
pressive pressure values . . . . . . . . . . . . . . . . . . . . . . . . . . 88
4-4 Comparison of 16.76/33.52/50.28 cm nosecone taper length effect on
predicted penetration depth, over a range of impact velocities and snow
compressive pressure values . . . . . . . . . . . . . . . . . . . . . . . 89
4-5 Comparison of effect of various forebody geometries on predicted g-
loading, over a range of impact velocities and snow compressive pres-
sure values . . . . . . . . . . . . . . . . . . . . . . . . . . . . . . . . . 91
4-6 Comparison of effect of various forebody geometries on predicted pen-
etration depth, over a range of impact velocities and snow compressive
pressure values . . . . . . . . . . . . . . . . . . . . . . . . . . . . . . 92
4-7 Illustration of potential GSIP geometries, varying from 18 batteries per
layer for the narrowest design to 60 batteries per layer for the widest
design . . . . . . . . . . . . . . . . . . . . . . . . . . . . . . . . . . . 93
4-8 Comparison of 12/17.5/28 kg afterbody mass effect on predicted g-
loading, over a range of impact velocities and snow compressive pres-
sure values . . . . . . . . . . . . . . . . . . . . . . . . . . . . . . . . . 97
4-9 Comparison of 12/17.5/28 kg afterbody mass effect on predicted pen-
etration depth, over a range of impact velocities and snow compressive
pressure values . . . . . . . . . . . . . . . . . . . . . . . . . . . . . . 98
4-10 Snow density measured at regular intervals into the snow pile used for
February 2017 scale model testing . . . . . . . . . . . . . . . . . . . . 101
4-11 Relation of scale model mass to measured penetration depth into snow 102
4-12 Relation of scale model centre of gravity to measured emplacement
angle into snow . . . . . . . . . . . . . . . . . . . . . . . . . . . . . . 103
10

4-13 Comparison of predicted snow penetration for scale model to actual
measured penetration depth into snow . . . . . . . . . . . . . . . . . 104
4-14 Comparison of scale model mass effect on predicted penetration depth,
over a range of impact velocities and snow compressive pressure values 106
5-1 Achievable battery packing density within 10 x 10 cm penetrator con-
figurations . . . . . . . . . . . . . . . . . . . . . . . . . . . . . . . . . 113
5-2 Comparison of 5/10/15 cm taper length effect on g-loading, over a
range of impact velocities and soil compressive pressure values . . . . 119
5-3 Comparison of 5/10/15 cm taper length effect on penetration depth,
over a range of impact velocities and soil compressive pressure values 120
5-4 Comparison of straight, concave and convex taper shape on g-loading,
over a range of impact velocities and soil compressive pressure values 121
5-5 Comparison of straight, concave and convex taper shape on penetration
depth, over a range of impact velocities and soil compressive pressure
values . . . . . . . . . . . . . . . . . . . . . . . . . . . . . . . . . . . 122
5-6 Comparison of 3/5/7 kg mass effect on g-loading, over a range of impact
velocities and soil compressive pressure values . . . . . . . . . . . . . 123
5-7 Comparison of 3/5/7 kg mass effect on penetration depth, over a range
of impact velocities and soil compressive pressure values . . . . . . . . 124
5-8 Comparison of g-loading for straight cone-shaped taper and pentahe-
dral/ square-based-pyramid taper, over a range of impact velocities
and soil compressive pressure values . . . . . . . . . . . . . . . . . . . 125
5-9 Comparison of penetration depth for straight cone-shaped taper and
pentahedral/square-based-pyramid taper, over a range of impact ve-
locities and soil compressive pressure values . . . . . . . . . . . . . . 126
5-10 Comparison of effect of no braking disk vs. 5/10/15 cm wide braking
disks on g-loading, over a range of impact velocities and soil compres-
sive pressure values . . . . . . . . . . . . . . . . . . . . . . . . . . . . 127
11

5-11 Comparison of effect of no braking disk vs. 5/10/15 cm wide braking
disks on penetration depth, over a range of impact velocities and soil
compressive pressure values . . . . . . . . . . . . . . . . . . . . . . . 128
5-12 Illustration of conical and square nosecone shapes . . . . . . . . . . . 131
5-13 G-loading effects of braking disk shown with extended scale . . . . . . 132
5-14 Artist’s impression of Deep Space 2 deployment into the Martian sur-
face. Image credit: Lorenz (2011)1 . . . . . . . . . . . . . . . . . . . 137
12

List of Tables
3.1 GSIP mission objectives . . . . . . . . . . . . . . . . . . . . . . . . . 46
3.2 System requirements . . . . . . . . . . . . . . . . . . . . . . . . . . . 47
3.3 Structural requirements . . . . . . . . . . . . . . . . . . . . . . . . . 53
3.4 GSIP power budget . . . . . . . . . . . . . . . . . . . . . . . . . . . . 57
3.5 Power requirements . . . . . . . . . . . . . . . . . . . . . . . . . . . . 58
3.6 Payload requirements . . . . . . . . . . . . . . . . . . . . . . . . . . . 63
3.7 Communications requirements . . . . . . . . . . . . . . . . . . . . . . 67
3.8 GSIP thermal budget . . . . . . . . . . . . . . . . . . . . . . . . . . . 69
3.9 Thermal requirements . . . . . . . . . . . . . . . . . . . . . . . . . . 69
3.10 Avionics requirements . . . . . . . . . . . . . . . . . . . . . . . . . . . 71
5.1 Soil probe requirements . . . . . . . . . . . . . . . . . . . . . . . . . . 109
5.2 Soil probe power budget . . . . . . . . . . . . . . . . . . . . . . . . . 112
5.3 Estimated mass budget for soil penetrator components . . . . . . . . 133
13

14
Chapter 1
Introduction
Instrumented penetrator probes have several decades of established use for various
military and scientific applications on Earth, including earth-penetrating munitions,
surveillance and seismic sensors, and sea ice monitoring. Although penetrators have
been advocated as the subject of many space mission proposals over time, a lack of
flight heritage has led to the cancellation of almost all prospective missions at vari-
ous stages of development. Only two non-terrestrial penetrator designs (Mars-96 and
DS-2) were fully completed, but both missions were lost before reaching their tar-
get location and commencing post-impact operations. Due to a strong dependence
of success on the parameters of the emplacement medium, it is unlikely that the
three-sigma (99.7%) level of confidence often demanded in space mission design could
realistically be achieved for a single probe, although this is more achievable if network
missions are considered. Due to a lack of flight heritage, space penetrator missions
are especially vulnerable to descoping when budgetary constraints arise. This leads
to a feedback loop, where the cancellation or lack of funding of proposed missions
results in a continuing lack of successfully flown penetrators that would provide a
demonstration of the technology and encourage further development.
Due to the extensive heritage already demonstrated for Earth-based penetrators,
the aim of this work is to build on existing planetary science applications while es-
tablishing further technology demonstration in one of the most remote and extreme
15

operating environments found on Earth. Successful deployment across inaccessible
Antarctic regions will highlight the benefits and additional functionality supplied by
penetrator probes in comparison to existing instrumentation standards in the region.
This mission will provide evidence that the perceived technical challenges of pene-
trator probes are surmountable, as well as demonstrating feasible design solutions
worked out within the necessary constraints on power draw, mass and volume. It is
hoped that advancing evidence of penetrator mission success in this harsh environ-
ment will aid in the future development of penetrator probes for space missions, in
particular with potential applicability to future icy moon missions such as to Europa
or Enceladus.
This thesis sets out a detailed design overview of the Geodetic Seismic Ice Pen-
etrator (GSIP), a probe designed for air-dropped deployment into snow pack in the
Antarctic cryosphere. Although its name might imply that ice is the penetration
medium, the penetrator is designed to emplace within the layered snow pack on top
of the Antarctic ice sheet in the deployment region. GSIP will utilise phase-locked
GPS and three-axis seismometry in order to measure ice sheet flexure and movement
over time, with a network of probes deployed across a wide area in order to build
up a large-scale view of ice sheet dynamic response to ocean infragravity waves. A
second, higher-level design overview is also presented for an earthquake-monitoring
soil penetrator incorporating a GPS receiver and three-axis geophone, intended to
provide near real-time reporting of significant seismic events. Both impact simulation
models and data collected from drop tests into snow are used to analyse the perfor-
mance of the penetrator prototype designs and inform future development work on
the architecture.
1.1 Motivation
The objective of the GSIP project is to develop a penetrator prototype for deployment
and testing in Antarctica as an alternative to the current instrumentation methods
16

used to study ice sheet movement and flexure, in which probes are predominantly
deployed by teams sent out to bury the instruments by hand in the snowpack. The
limitations of this current practice include the expense and large amount of time re-
quired to have a team of people sent out to bury each probe as well as safety concerns
for team members operating in dynamic or crevassed regions. Another issue is that
of instrument deployment being limited to areas accessible either directly by ground
travel from a base or areas where aircraft landing is possible, and the difficulty of
establishing extensive networks of probes across a wide area given the combination
of the aforementioned constraints of cost, time, safety and accessibility.
The new approach taken for GSIP is to develop a reasonably priced probe that
can be manufactured in bulk and air-dropped in large numbers across Antarctica.
The benefits of such an approach include reducing deployment time and costs, mass-
producing probes to reduce production costs, improving safety and reducing the risk
to human life by removing the need to send teams out on foot, and improving the abil-
ity to instrument highly dynamic or previously inaccessible and remote areas. Highly
dynamic areas are the most difficult to access and instrument due to the prevalence
of crevasses and other unstable features, but due to the high speed of changes they
are also scientifically important for study by climate scientists.
The risks involved in this project are for the most part those inherent to the de-
velopment of any new technology, such as the time and cost involved in research and
design of the prototype. For any penetrator project, the properties of the emplace-
ment medium have a strong influence on the success or failure of the mission, and in
this case snow is one of the more poorly researched and potentially variable media in
terms of the penetration parameters, with an order of magnitude of uncertainty in
some properties that must be taken into account in the design choices. Various de-
sign revisions were also made in order to improve some early issues with aerodynamic
and impact stability of the probe, and further wind tunnel and drop testing will be
carried out to ensure the success of these improvements. A notable risk related to the
17
deployment location is that of operating new technology in hard-to-access areas. In
the case of functionality being lost for some prototypes it may be difficult to ascertain
the reason. This risk will be mitigated by deployment of early prototypes in some
areas close to McMurdo Station, where they may be monitored for a trial period and
recovered for later assessment and potential refinement of the penetrator design as
needed. This will reduce later mission risk by enabling a smaller-scale assessment of
the technology in its intended operating environment before a full-scale deployment
is carried out.
18

Chapter 2
Background
2.1 Definitions
The terms ‘penetrator’ and ‘penetrometer’ are used somewhat interchangeably in the
available literature1 and sometimes even within the same paper.2 However, Lorenz
distinguishes between penetrators as self-contained vehicles and penetrometers as
instruments that are merely one part of a larger vehicle, and this distinction is main-
tained here. We define a penetrator as a vehicle which uses the kinetic energy of its
own impact to emplace into a solid medium and carry out some function during post-
impact operations. This frequently involves emplacing some type of instrumentation
into a planetary surface in order to study parameters which are defined according to
the specific mission. As Lorenz notes, such a definition excludes self-hammering drills
(which do not emplace by the energy of their own impact) and inert impactors (which
do not carry out any post-impact function).1 A penetrometer is defined as a device
or instrument (which may be one part of a larger vehicle) used to measure some de-
fined parameter(s) of a substance or medium by means of penetration into its surface.
19
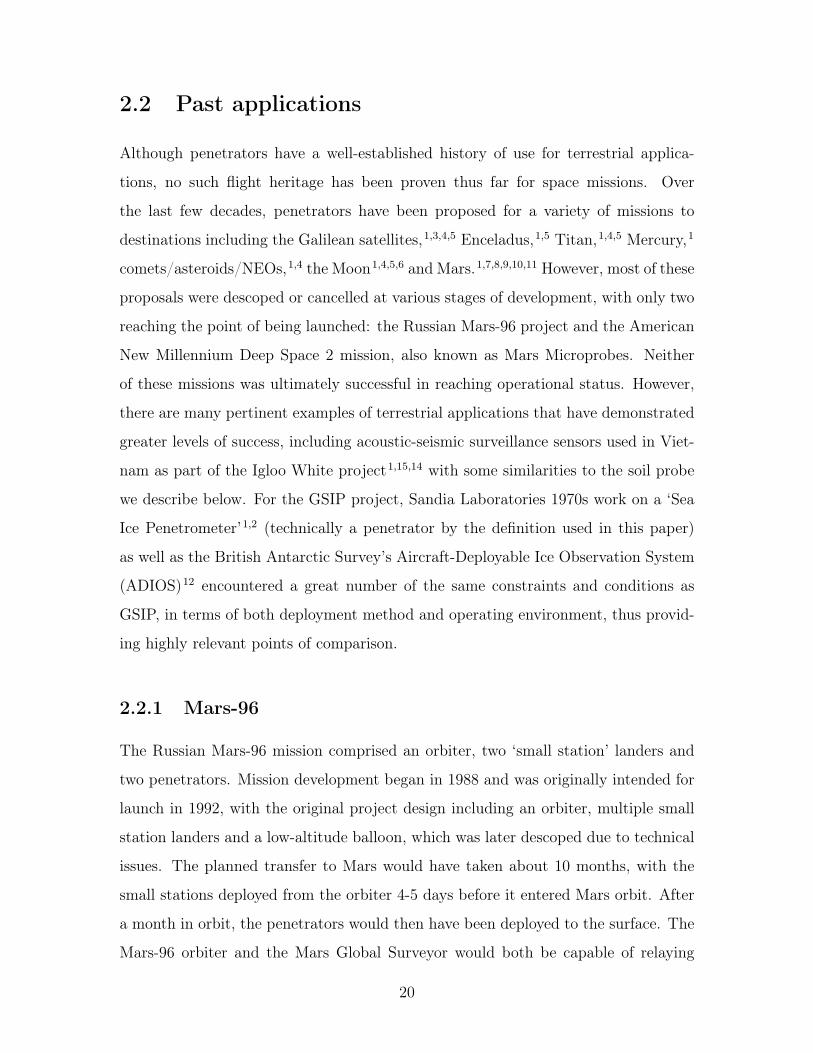
2.2 Past applications
Although penetrators have a well-established history of use for terrestrial applica-
tions, no such flight heritage has been proven thus far for space missions. Over
the last few decades, penetrators have been proposed for a variety of missions to
destinations including the Galilean satellites,1,3,4,5 Enceladus,1,5 Titan,1,4,5 Mercury,1
comets/asteroids/NEOs,1,4 the Moon1,4,5,6 and Mars.1,7,8,9,10,11 However, most of these
proposals were descoped or cancelled at various stages of development, with only two
reaching the point of being launched: the Russian Mars-96 project and the American
New Millennium Deep Space 2 mission, also known as Mars Microprobes. Neither
of these missions was ultimately successful in reaching operational status. However,
there are many pertinent examples of terrestrial applications that have demonstrated
greater levels of success, including acoustic-seismic surveillance sensors used in Viet-
nam as part of the Igloo White project1,15,14 with some similarities to the soil probe
we describe below. For the GSIP project, Sandia Laboratories 1970s work on a ‘Sea
Ice Penetrometer’1,2 (technically a penetrator by the definition used in this paper)
as well as the British Antarctic Survey’s Aircraft-Deployable Ice Observation System
(ADIOS)12 encountered a great number of the same constraints and conditions as
GSIP, in terms of both deployment method and operating environment, thus provid-
ing highly relevant points of comparison.
2.2.1 Mars-96
The Russian Mars-96 mission comprised an orbiter, two ‘small station’ landers and
two penetrators. Mission development began in 1988 and was originally intended for
launch in 1992, with the original project design including an orbiter, multiple small
station landers and a low-altitude balloon, which was later descoped due to technical
issues. The planned transfer to Mars would have taken about 10 months, with the
small stations deployed from the orbiter 4-5 days before it entered Mars orbit. After
a month in orbit, the penetrators would then have been deployed to the surface. The
Mars-96 orbiter and the Mars Global Surveyor would both be capable of relaying
20

the data from the small stations and the penetrators back to Earth. Both small sta-
tions and penetrator probes were designed with a lifetime of around one Earth year.1,8
The small stations were designed to investigate a range of scientific goals including
Martian atmospheric dynamics and structure, atmospheric boundary layer processes,
surface chemistry and geology, interior seismic activity, details of the planet’s mag-
netic field, and the presence of water and other volatiles. Although the landers were
designed within constraints of volume and data bandwidth as well as a power budget
of 400 mW and a total mass of 32 kg, each one carried atmospheric and meteoro-
logical sensors, a magnetometer, a seismometer, an alpha-proton x-ray spectrometer,
panoramic and descent phase cameras and an oxidant instrument.8
The penetrators were added to the Mars-96 mission in order to facilitate research
into the chemical and physical properties of Martian bedrock below the layer of sur-
face regolith, as well as studying the internal planetary structure. The objective of
more detailed investigation of the planet’s internal structure led to the requirement for
simultaneous operation of penetrator probes within the rock and surface stations with
co-ordinating instrumentation. Penetrators allowed the mission to reach below the
surface layer of dust and debris that comprised a mixture from many sources in order
to reach the bedrock layer and obtain relevant data for geological and exobiological
studies, as well as acquiring information on heat flow and seismic activity within the
planet. The probes used a separable two-body design, allowing the forebody to pene-
trate further into the rock while the afterbody remained at surface. Each penetrator
carried a TV camera, meteorological instruments, a magnetometer, thermoprobes,
seismometers, an accelerometer, and gamma, x-ray, neutron and alpha-proton spec-
trometers.7
The Mars-96 mission was launched on a Proton launch vehicle from Baikonur in
November 1996, with planned arrival at Mars and deployment of the small stations
in November 1997 and deployment of the penetrator probes in December 1997.8
21

However, due to a fourth stage launch vehicle failure, the mission was lost when the
spacecraft re-entered the atmosphere over South America and the payload was not
recovered.1,8
2.2.2 New Millennium Deep Space 2/Mars Microprobes
The American DS2 project consisted of two small penetrator probes of a separable
two-body design, carried by the Mars Polar Lander and deployed during atmospheric
entry.10,11 The probe design did not incorporate any parachute, rocket or airbags to
decelerate, relying instead on a frangible aeroshell to provide a heat shield throughout
entry before shattering upon impact. This mission design resulted in a requirement
for the forebody to withstand a peak deceleration of 30,000 G, and the afterbody to
withstand 80,000 G.9,10 The most severe constraints on the mission included these
g-loading requirements, the small size allocated for the microprobes within the Mars
Polar Lander, and the harsh thermal conditions of the operating environment, par-
ticularly for the forebody, which would not experience any solar heating due to its
emplacement below the surface.9
The DS-2 mission was designed primarily as a technology demonstration for the
penetrator concept itself, particularly the idea of a networked mission,9,11 as well
as to validate the single-stage entry system, low-temperature batteries, and micro-
electronics capable of withstanding the necessary g-loading.11 Due to the technology
demonstration aim and the mission design as a ‘piggyback’ payload on the Mars Polar
Lander, a size constraint of 35 cm diameter and 27.5 cm height for the aeroshell was
determined, leading to the design of miniaturised microprobes with a mass of only
3.6 kg.11 To achieve the secondary objective of collecting scientific data, the instru-
mentation included accelerometers to measure forces during atmospheric descent and
impact, meteorological sensors, temperature sensors, and an experiment to sample
Martian subsurface soil and determine whether water was present.9,10,11 The separa-
ble nature of the design would have allowed for the collection of data simultaneously
on the planetary surface and by instruments emplaced below it.9
22

The Mars Polar Lander and DS2 microprobes were successfully launched in Jan-
uary 1999, reaching Mars in December.11 Mission operations were to be performed au-
tonomously by the microprobes due to the inability to command them after launch,9
but no response was received by the Mars Global Surveyor during its overflights, and
no transmissions were ever detected. Suggested failure modes included battery de-
pletion, issues with the separation phase, or failure upon impact.1 The DS2 project
holds the distinction of being the only space-based penetrator mission so far to reach
its destination, although it never began operations as planned.
2.2.3 Earth penetrators and military surveillance applications
The origin of penetrators is inextricably connected with the military study of pene-
tration mechanics as related to gunnery and ballistics. During World War 2, the Ger-
mans developed armour-piercing bombs to penetrate steel battleships and concrete-
reinforced targets, and the British developed ‘earthquake bombs’ for use against tar-
gets such as dams, railway tunnels and facilities protected by concrete. More recent
weapons evolution has included runway-cratering armaments (such as the French
‘Durandal’ weapon) and penetrating munitions such as ‘Bunker Busters’ with the
capability to penetrate a specified range of depths of earth, reinforced concrete, or
subterranean levels. Such military developments focus on many similar areas as later
work carried out on planetary penetrator probes, emphasising the importance of cor-
rectly aligning the angle of impact and angle of attack, the difficulties of designing
the payload to survive impact loads, and the advantages gained by seismic coupling
to the penetration medium.1
One of the best-known military penetrator projects was the Igloo White pro-
gramme in Vietnam, which involved creating a network of ground sensors to remotely
surveil the Ho Chi Minh Trail (also known as the Truong Son Route), as the route
was crucial to the operations of communist forces, acting as both a supply line and
a base for the North Vietnamese.1,14 Between 1966 and 1971, $1.7 billion was spent
23
on establishing a network of 20,000 battery-powered sensors along the trail, each one
with a lifetime of a few weeks, helping to determine strike zones that could be tar-
geted by aircraft.14,15 A variety of sensors were used, including two kinds of acoustic
sensors derived from the sonobuoys used by the Navy to remotely detect submarines
(capable of detecting acoustic emissions from propellers up to three miles away).1
The Acoubuoy was deployed into the tree canopy, where its parachute caught in or-
der to hold it in the air, and the Spikebuoy was an acoustic penetrator around 1.7
m long, emplacing into the ground with only the antenna (disguised as vegetation)
left above ground in order to transmit.15 The most commonly used sensor was a seis-
mic penetrator – the Air-Delivered Seismic Intrusion Detector (ADSID), a smaller
0.8 m long penetrator that was similar in design to the Spikebuoy, seen as the most
durable and reliable of the sensors.14,15 Various claims were made and disputed about
the efficacy of the project as a whole; Rosenau cites USAF figures of 10,000 trucks
damaged or destroyed in 1966-67 before the deployment of the sensors, compared to
25,000 trucks destroyed and many thousands more damaged in 1970-71 with the aid
of the detectors.14 Correll cites USAF figures of 6,000 trucks destroyed or damaged
in the 1968-69 dry season, compared with 10,000 in 1969-70 and 20,000 in 1970-71.15
However, both sources refer to a 1971 Senate subcommittee study that suggested
that the Air Force figures should be discounted by around 30% according to input
from surveyed personnel, but this still represents an improvement in targeting over
earlier operations.14,15 Most of the sensors used for the Igloo White project were air-
deployed although some required hand placement by special forces, but unattended
ground sensors (UGS) that could be deployed from aircraft were seen as potentially
playing “an increasingly important role in future operations” by the military.14
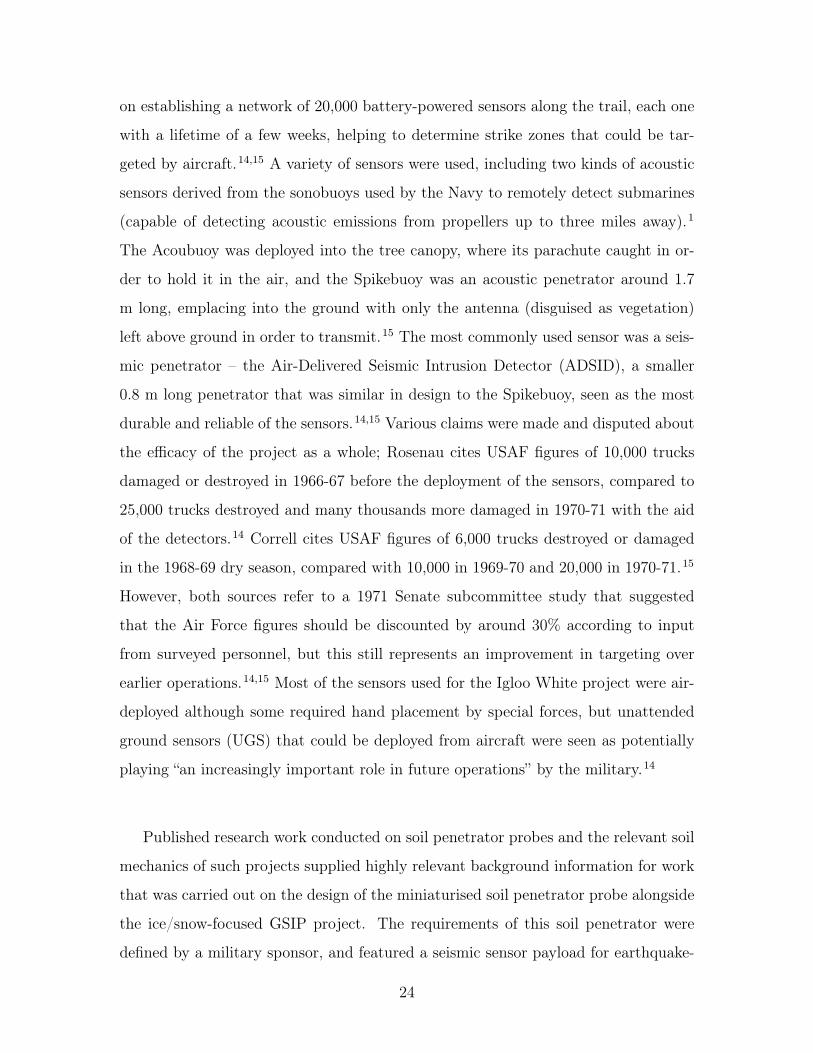
Published research work conducted on soil penetrator probes and the relevant soil
mechanics of such projects supplied highly relevant background information for work
that was carried out on the design of the miniaturised soil penetrator probe alongside
the ice/snow-focused GSIP project. The requirements of this soil penetrator were
defined by a military sponsor, and featured a seismic sensor payload for earthquake-
24
monitoring and remote data transmission in order to achieve near real-time alerts of
significant events. This highlights the many similarities with the Igloo White project,
as well as providing an example of the importance of such remote sensing devices for
military applications.
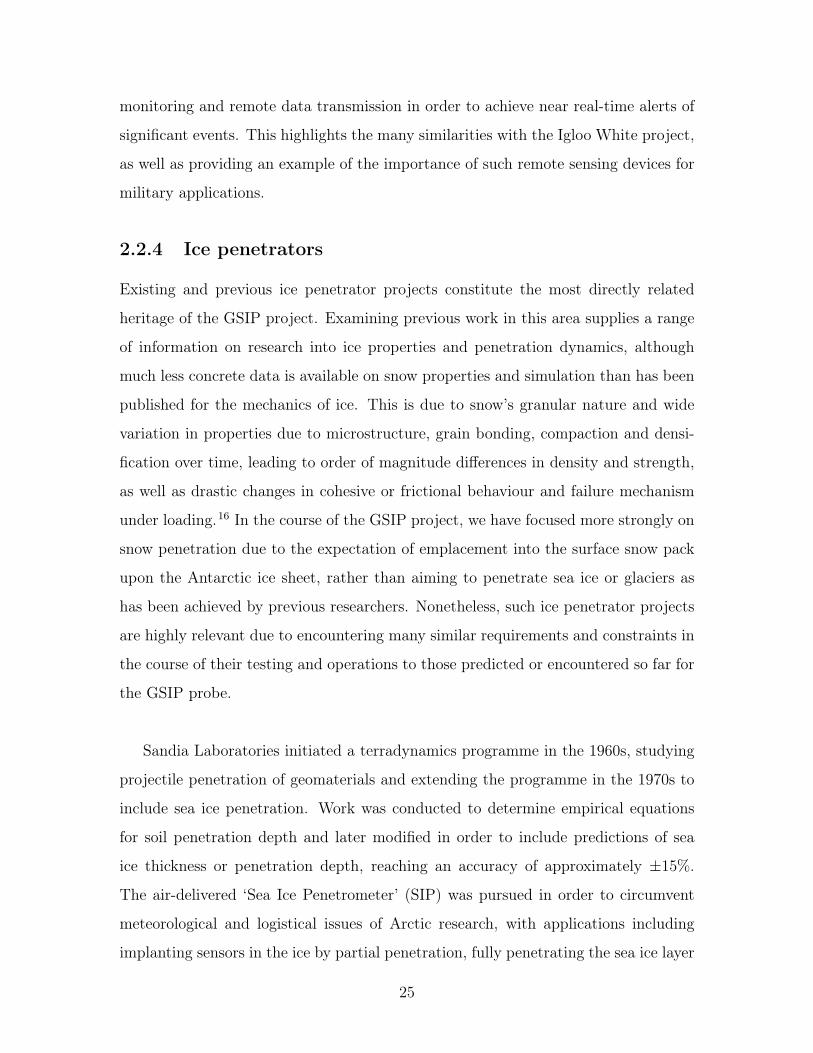
2.2.4 Ice penetrators
Existing and previous ice penetrator projects constitute the most directly related
heritage of the GSIP project. Examining previous work in this area supplies a range
of information on research into ice properties and penetration dynamics, although
much less concrete data is available on snow properties and simulation than has been
published for the mechanics of ice. This is due to snow’s granular nature and wide
variation in properties due to microstructure, grain bonding, compaction and densi-
fication over time, leading to order of magnitude differences in density and strength,
as well as drastic changes in cohesive or frictional behaviour and failure mechanism
under loading.16 In the course of the GSIP project, we have focused more strongly on
snow penetration due to the expectation of emplacement into the surface snow pack
upon the Antarctic ice sheet, rather than aiming to penetrate sea ice or glaciers as
has been achieved by previous researchers. Nonetheless, such ice penetrator projects
are highly relevant due to encountering many similar requirements and constraints in
the course of their testing and operations to those predicted or encountered so far for
the GSIP probe.
Sandia Laboratories initiated a terradynamics programme in the 1960s, studying
projectile penetration of geomaterials and extending the programme in the 1970s to
include sea ice penetration. Work was conducted to determine empirical equations
for soil penetration depth and later modified in order to include predictions of sea
ice thickness or penetration depth, reaching an accuracy of approximately ±15%.
The air-delivered ‘Sea Ice Penetrometer’ (SIP) was pursued in order to circumvent
meteorological and logistical issues of Arctic research, with applications including
implanting sensors in the ice by partial penetration, fully penetrating the sea ice layer
25
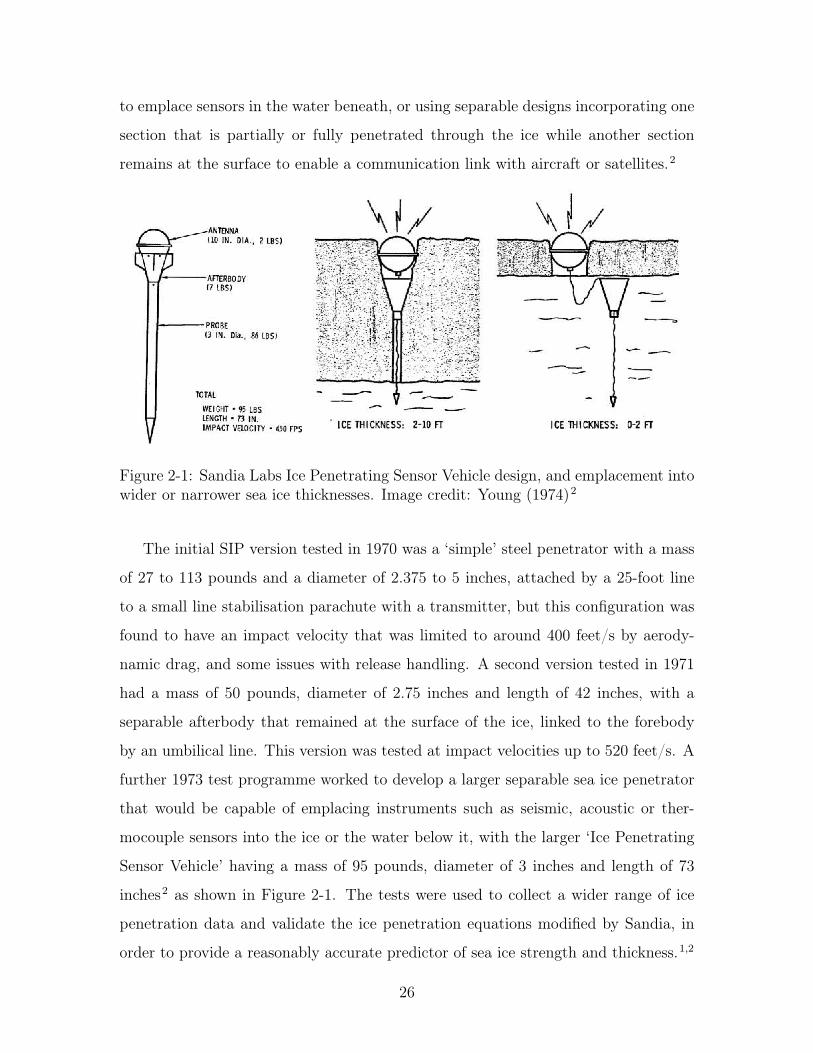
to emplace sensors in the water beneath, or using separable designs incorporating one
section that is partially or fully penetrated through the ice while another section
remains at the surface to enable a communication link with aircraft or satellites.2
Figure 2-1: Sandia Labs Ice Penetrating Sensor Vehicle design, and emplacement intowider or narrower sea ice thicknesses. Image credit: Young (1974)2
The initial SIP version tested in 1970 was a ‘simple’ steel penetrator with a mass
of 27 to 113 pounds and a diameter of 2.375 to 5 inches, attached by a 25-foot line
to a small line stabilisation parachute with a transmitter, but this configuration was
found to have an impact velocity that was limited to around 400 feet/s by aerody-
namic drag, and some issues with release handling. A second version tested in 1971
had a mass of 50 pounds, diameter of 2.75 inches and length of 42 inches, with a
separable afterbody that remained at the surface of the ice, linked to the forebody
by an umbilical line. This version was tested at impact velocities up to 520 feet/s. A
further 1973 test programme worked to develop a larger separable sea ice penetrator
that would be capable of emplacing instruments such as seismic, acoustic or ther-
mocouple sensors into the ice or the water below it, with the larger ‘Ice Penetrating
Sensor Vehicle’ having a mass of 95 pounds, diameter of 3 inches and length of 73
inches2 as shown in Figure 2-1. The tests were used to collect a wider range of ice
penetration data and validate the ice penetration equations modified by Sandia, in
order to provide a reasonably accurate predictor of sea ice strength and thickness.1,2
26
H
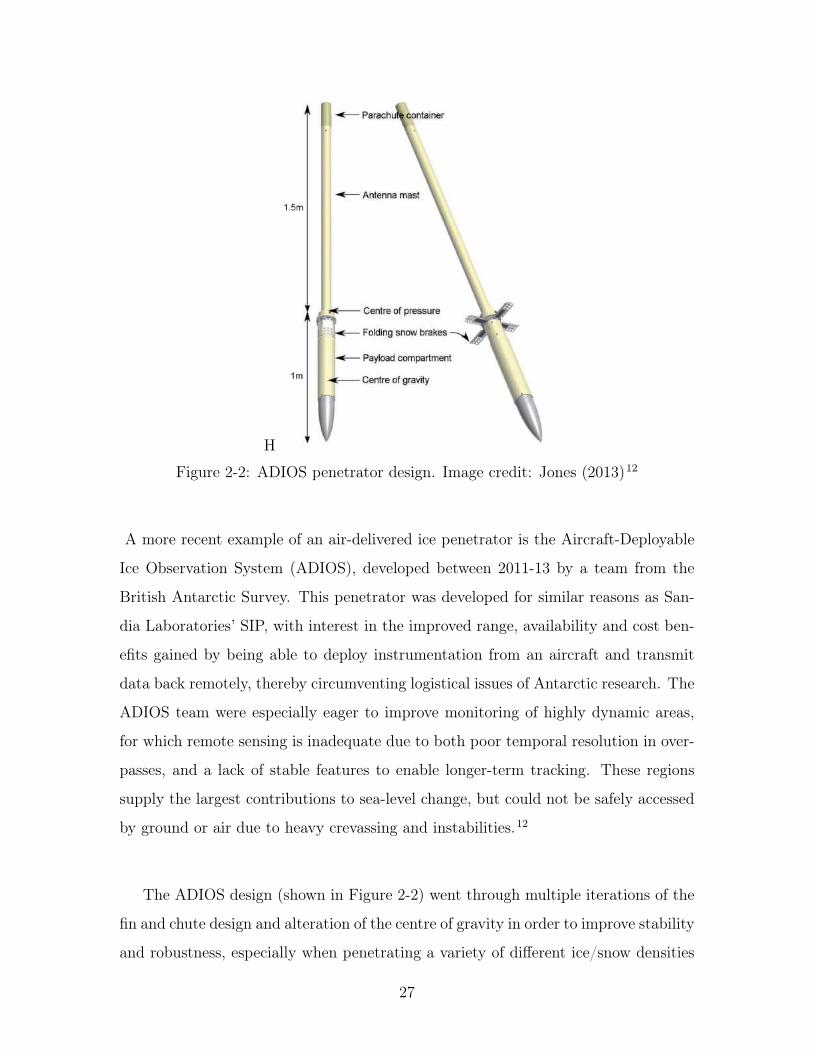
Figure 2-2: ADIOS penetrator design. Image credit: Jones (2013)12
A more recent example of an air-delivered ice penetrator is the Aircraft-Deployable
Ice Observation System (ADIOS), developed between 2011-13 by a team from the
British Antarctic Survey. This penetrator was developed for similar reasons as San-
dia Laboratories’ SIP, with interest in the improved range, availability and cost ben-
efits gained by being able to deploy instrumentation from an aircraft and transmit
data back remotely, thereby circumventing logistical issues of Antarctic research. The
ADIOS team were especially eager to improve monitoring of highly dynamic areas,
for which remote sensing is inadequate due to both poor temporal resolution in over-
passes, and a lack of stable features to enable longer-term tracking. These regions
supply the largest contributions to sea-level change, but could not be safely accessed
by ground or air due to heavy crevassing and instabilities.12
The ADIOS design (shown in Figure 2-2) went through multiple iterations of the
fin and chute design and alteration of the centre of gravity in order to improve stability
and robustness, especially when penetrating a variety of different ice/snow densities
27

and properties encountered across different glaciers and ice streams. The final version
consisted of a 1m long polypropylene payload compartment with a solid aluminium
nose cone (to aid in lowering the centre of gravity), attached to a narrower 1.5 m long
antenna mast at the back end. Deployable snow brakes were attached at the back
end of the payload compartment to ensure that the antenna would remain above the
ice in a range of densities. A parachute container was attached to the back end of the
antenna mast, containing a Disk Band Gap parachute selected to supply a stabilising
drag during the falling phase of deployment and prevent oscillations occurring about
the device’s centre of pressure. Due to expected impact shock varying between 90
and 900 G, polyethylene cushions and springs were included to protect the electronics
and battery from high deceleration levels.12
Testing was carried out during 2012-13, with 26 of 37 penetrators deployed on
Pine Island Glacier in West Antarctica and 5 of 6 penetrators deployed on Scar In-
let on the Larsen Ice Shelf surviving impact to begin operations: a success rate of
72%, with failures ascribed to units hitting crevasses after deployment. The bene-
fits of the ADIOS programme included its ability to use existing sonobuoy launch
tubes on aircraft for deployment rather than requiring any new deployment mecha-
nism to be implemented, the advantage of being able to safely instrument previously
inaccessible areas of the Antarctic or Arctic (due to remoteness or instability), im-
provements in range and payload capacity compared to using helicopters for access,
and improvements in safety and deployment time compared to in-person access by
ground. Although there were constraints on payload size due to the narrow body of
the payload compartment, the ADIOS team aimed to conduct further testing utilising
a range of other sensor payloads to demonstrate alternative capabilities and applica-
tions for the penetrator.12
28
2.3 Mission success considerations
For any penetrator mission to succeed in emplacing securely and achieving its objec-
tives post-impact, there is a strong dependence on the characteristics of the impacted
medium as well as on the environmental conditions at the time of deployment. In his
review of penetrator projects developed over the last few decades, Lorenz highlights
the usual practice of designing spacecraft missions to ‘three-sigma’ values of reliabil-
ity, or 99.7% likelihood of acceptable parameters, while also acknowledging that the
actual statistics of success achieved by planetary missions has been lower in practice.
However, it must be recognised that achieving such a high reliability rate for a pene-
trator mission is unlikely, with the success rate of penetrator missions more strongly
affected than other lander missions by many environmental factors. These include the
impact medium properties, the presence or absence of rocks in the immediate area
of impact, any slope angle encountered, and wind speed during deployment, as well
as more generally encountered issues such as impact shock tolerance, thermal envi-
ronment, and the performance of the communications system and other components.1
Such parameters were considered in the design of several previous penetrator stud-
ies, such as a 1977 NASA Ames report on a Mars penetrator mission design, which
considered data from the Viking lander on the distribution of rock sizes across the
Martian landscape to draw conclusions about the potential effect on successful pen-
etration of the surface.1,17 The study concluded that rocks that were significantly
smaller than the penetrator diameter would not affect penetration, and rocks that
were significantly larger would effectively act as the penetration medium. However,
rocks of a comparable width could divert the impact angle of the penetrator, or cause
it to ricochet sideways, and therefore presented a risk to mission success. If rocks 5
times smaller to 5 times larger than the penetrator diameter were taken to be the
range of concern, the probability of failure was concluded to be approximately 9%; if
rocks 10 times smaller to 10 times larger than the penetrator diameter were consid-
ered, this rose to 14%. This was considered to be a conservative estimate of failure,
29
as the penetrator diameter was only 9 cm, and a rock of 0.9 cm would be unlikely
to disrupt the penetration process. Separate calculations of the likelihood of striking
any rock larger than 1cm in diameter found a figure of 15.7%, and the odds of striking
a rock of 5 cm or larger were just over 11%, with these figures including larger rocks
that could be treated as semi-infinite targets unlikely to cause ricochet, instead acting
as the penetration medium.17
The possibility of a deployed penetrator impacting in a steeply sloped or crevassed
region is another issue that affects the probability of achieving a successful emplace-
ment. The seismometer developed by Imperial College London that will be used for
GSIP has a requirement for final emplacement to occur within 10° of vertical; the can-
celled Japanese Lunar-A mission had the same requirement of emplacement within
10° of vertical; therefore this is treated as a reasonable standard for such missions.1
However, data collected on the topography of Europa indicates that even crater
floors exceed a 10° slope over more than 10% of their area, and these are some of the
flattest regions. Areas of ridged plains typically sloped at a 10-25° angle with little
or no flat terrain occurring in such regions. Areas of ridged plains, matrix material
and crater floors were all found to consist of 30-50% slopes exceeding 10°, with only
regions of smooth dilational bands (caused by upwelling material) having a lower fig-
ure of around 15% by area consisting of slopes of 10° or higher, and such regions were
not a common landform on the Europan surface. In a more general terrain survey,
it was found that over 60% of some regions exhibited an angle of 10° or greater, and
the conclusion was drawn that “the Europan surface is, with rare exceptions, steeply
sloping” and that this would constrain any planned future missions.18
Aside from concerns about sloping terrain, there are other inhospitable topogra-
phies that may be commonly encountered, such as crevassing in Antarctic regions.
In the initial 2012-2013 Antarctic round of testing for ADIOS units, the 72% success
rate (i.e. 28% failure rate) for the 43 penetrators deployed was ascribed to the nature
30

of the terrain, with the conclusion drawn that “it is likely the majority of the failed
units hit a crevasse”.12 In comparing the uncertainty of deployment on other solar
system bodies where slope angle and rock distribution may be unknown or poorly
surveyed, as well as the unpredictability of deploying on Earth in highly dynamic
regions of Antarctica, it can be seen that risk mitigation strategies must be employed
that account for a 10% or higher probability of encountering environmental conditions
that exceed design requirements.
As well as accounting for the effect of sloping surfaces on penetration mechanics,
wind speed at the time of deployment must be taken into account in order to achieve
an impact angle within 10° of vertical. The angle of attack (penetrator velocity angle
compared to local vertical) and angle of incidence (penetrator body angle compared
to local vertical) must both be considered while examining the effect upon successful
penetration and emplacement into the impact medium. Manning adopted a more
conservative constraint of 5° upon the impact angle, and concluded that this was
achievable with a wind speed of 14 m/s or less for impact velocities between 135 and
160 m/s. If the impact speed could be increased by allowing for higher impact shock
load tolerances, higher wind speeds could be tolerated; for example, with an impact
velocity of 450 m/s, an acceptable impact angle could still be achieved in wind speeds
up to 40 m/s.17 After considering meteorological data collected by the Viking probes,
Lorenz found that the probability of wind speeds exceeding 14 m/s was only 5%.1
Impact velocities will be much lower for aircraft deployment of GSIP in Antarctica,
therefore the potential effect of wind speed on success rate must be considered. How-
ever, the annual mean wind speed at McMurdo Station is only 5.2 m/s, with winds
up to 5 m/s occurring 56.3% of the time, up to 10 m/s occurring 93.35% of the time,
and up to 15 m/s occurring 99.34% of the time.19 Although strong winds may de-
lay planned aircraft deployment of penetrators, the relatively predictable nature of
Antarctic winds when compared to past data on wind speed and direction means that
they can be factored into designing the deployment process, and after aerodynamic
testing is conducted on the finalised GSIP design, risks of emplacement failure due
31

to the effects of high winds on the penetrator impact can be mitigated.
An unavoidable but highly important factor in conducting a successful penetrator
mission is the robustness of the design to uncertainty regarding the properties of the
penetration medium. Even for Earth-based applications, there is often a wide range
in the potential properties of the medium, and for space-based missions this is even
more frequently the case due to very limited surveying and lack of on-the-ground data
for the terrain that will be encountered by the penetrator.
Young describes how one of the original applications for SIP was to measure the
thickness of sea ice it encountered, which clearly necessitated designing the penetra-
tor for successful penetration to be achieved in a range of potential ice thicknesses.
SIP was designed to penetrate up to 10 feet of sea ice successfully regardless of the
unknown material qualities of this ice “since a frozen sea has a network of refrozen
leads of virtually any ice thickness”, making it necessary for the sensor to emplace
correctly in very thin or very thick ice layers. Testing was conducted to ensure that
the antenna would remain within one foot of the surface even if it happened to land
in open water rather than onto sea ice.2 For the ADIOS project, instrumenting previ-
ously inaccessible and highly dynamic areas of Antarctica was the objective, meaning
that detailed data of the snow properties in such target areas would not be avail-
able. As the snow density, viscosity and other properties may fall within a wide range
of potential values, the probe had to be designed to impact with sufficient force to
emplace successfully even in areas of very dense snow, and incorporated several de-
sign features to help ensure that it would neither underpenetrate nor overpenetrate.12
For missions directed elsewhere in the solar system, it is widely acknowledged that
available data is insufficient to make reliable predictions about the properties of soil
or ice that may be encountered. Weiss examines the feasibility of a proposed network
of lunar micro-probes while commenting on the level of uncertainty in determining
where such probes would actually impact after deployment, as well as observing the
32

lack of current knowledge about lunar soil properties.6 Smrekar makes similar obser-
vations about the Martian terrain, describing the assumed dust and ice layers that
make up the impact medium that was expected to be encountered by the DS-2 mis-
sion while conceding that “the exact water and dust content of the deposits cannot
be accurately determined based on remote sensing data”. Smrekar also describes the
need for design robustness to the range of possible hardnesses of the impact medium,
while observing that the terrain materials could range widely from very fine-grained
dust to frozen ground with properties similar to solid rock and that the probe design
and testing must take this into account.11 Gowen details similar issues with design-
ing penetrators for Europan applications, with uncertainty about the target material
presenting a major design challenge as the impact medium “may vary from solid ice,
which has strength similar to concrete, and a loose snow with very little compressive
strength”, and this results in strong effects on the penetration depth and deceleration
forces on the probe.3
Designing a penetrator mission rather than using an alternative type of vehicle
introduces other constraints on probe design. The necessity of packaging the payload
within the penetrator shell leads to size constraints; the ADIOS team acknowledges
that the limited volume of their outer shell due to their selected deployment mech-
anism through a sonobuoy launch tube led to restrictions on their power subsystem
design and choice of payload.12 The nature of DS-2 as a ‘piggyback’ payload on an-
other mission meant that there was a strong incentive to minimise the penetrator
size,11 and this was recognised to create a restriction on the electronic components
that could be selected for the design.9
Another factor introduced by the choice of a penetrator as the delivery vehicle for
sensors is the need to withstand high shock loading upon impact, which can affect
the selection or packaging of power systems, payload sensors and other electronic
components. This is a common issue across penetrator missions regardless of the
type of impact medium, with the need for a payload resilient to rapid deceleration
33
in snow acknowledged by the ADIOS team,12 the requirement to withstand impact
forces for a lunar mission recognised by Weiss,6 a shock-absorbing system included in
the design of Mars-967 and the challenges of deceleration detailed for DS-2,9,11 and
the dramatic potential variation in possible impact shock loading characterised for a
Europa mission, depending on surface properties encountered.3
Due to the aforementioned need for robustness to a variety of potential impact
medium properties, many penetrator missions adopt a separable design, allowing for
the forebody to be refined with the aim of achieving emplacement even in a very
dense medium, while the afterbody remains at the surface and retains the ability to
transmit data out by ensuring that communications antennas remain above ground
level. Such a design has been selected for many different penetrator applications,
including SIP on Earth,2 and both Mars-967 and DS-29,10,11 on Mars. Electing to
use a gradual flare at the back end of the penetrator body to induce deceleration
during impact is another alternative, proposed for use in designs for lunar probes6
and Europa missions.3 Other designs have incorporated braking pads that can be
deployed to increase surface area and locked open shortly before impact, and these
have been successfully tested both in soil by the ADSID probes used during the Igloo
White project1 and in snow by the ADIOS penetrator.12
Penetrators are often proposed for network mission applications as this is another
way of compensating for the strong dependence on environmental conditions for suc-
cess. Gowen highlights the benefits of deploying a number of miniaturised probes,
creating redundancy so that a mission will not rely on a single point of failure, and
allowing for the creation of seismic networks or widely spaced chemical detection on
other solar system bodies.4 Weiss proposed the deployment of a network of lunar
probes to create a navigation network on the lunar surface, where radio-positioning
could be used as long as two of four beacons were successfully emplaced in the surface
and began functioning, allowing for a much lower success rate than would usually be
considered in space engineering.6 On Earth, the ADIOS and Igloo White projects
34

demonstrated success rates of around 72%12 and 85%17 respectively in probe deploy-
ment for their network missions, exceeding expectations for Igloo White’s ADSID
probes, which were deployed in groups of six with the necessity for three sensors to
work in order to provide coverage of the area.1 Lorenz discusses the need to deploy
multiple probes to achieve the 99.7% predicted success rate usually adopted for space
missions, and calculates that in the case of a 10-15% failure rate for each probe based
on unavoidable reliance on environmental conditions, three penetrators would have
to be deployed. Although this initially suggests a need for 200% redundancy in pen-
etrator vehicles, overhead figures are reduced for network missions where multiple
penetrators are required to function simultaneously. For example, for a seismic net-
work requiring four operational penetrators, eight vehicles would need to be deployed,
reducing the necessary redundancy level compared to a single-vehicle mission from
200% to 100%. If a network of meteorological sensors required twelve operational
penetrators, nineteen vehicles would need to be deployed, further reducing the redun-
dancy level to ∼ 58%.1
Although penetrators face some inevitable reliability challenges due to strong en-
vironmental coupling and deployment in potentially unpredictable impact media, de-
sign choices can be made which lessen the impact of factors such as rock distribution,
slopes, wind speed and penetration medium properties. Features such as separable
two-part vehicles, braking flares and deployable brakes have all been employed by
different penetrator missions in order to improve robustness and chances of mission
success. For applications where a network of sensors is required, the impact of the
reliability challenges faced by penetrators is lessened due to the reduced redundancy
overhead and the removal of the need for every single sensor to emplace and operate
successfully in order to complete the mission.
35

2.4 Current Antarctic research instrumentation
The cryosphere is defined as the part of the Earth’s climate system where water is
frozen solid (whether as snow or ice) for all or part of the year. The continental ice
sheets of Greenland and Antarctica comprise the largest area of the cryosphere, but it
also includes ice caps, ice streams and glaciers, and other areas of permafrost, ice and
snow on land. Floating shelf ice, icebergs, and frozen rivers, lakes and areas of the
ocean are other components of the cryosphere. The cryosphere affects global weather
and climate through interactions with the hydrosphere (the liquid water part of the
climate system) and atmosphere, impacting atmospheric and oceanic circulation and
playing a role in the regulation of Earth’s temperature by reflecting solar heat.20
Due to the fact that the cryosphere is particularly sensitive to shifts in climate,
polar regions are the object of studies for determining changes in the global climate.
Dynamic regions such as glaciers and ice streams are also studied in order to monitor
their contributions to sea level change over time. Cryology researchers have high-
lighted the need for further study to reduce the uncertainty in current ice sheet mass
balance estimates, to develop improved models of mass loss over time to better simu-
late likely future developments, and to improve current ice sheet observation systems
and sensors.21
The Instrumentation for Polar Glaciology and Geophysics Research (IPGGR)
workshop in 2014 was arranged with the objectives of assessing current polar instru-
ment capabilities and limitations, and identifying challenges and areas of potential
improvement. It also aimed to communicate the current state of specialised polar in-
strumentation and remote-sensing techniques across the field in order to better inform
research communities about technology that they might be unaware of at present but
that could be complementary to their goals.22
The IPGGR conference published a polar research instrumentation summary doc-
36

ument to be used as a reference by the community, divided up into ground-based
instrumentation, airborne instrumentation and platforms, and satellite-borne instru-
mentation. These groupings demonstrate the frequent use of remote sensing in polar
research due to the large areas under study and accessibility issues for much of the
polar regions.23 Common concerns such as the relationship between increased instru-
ment weight and increased power requirements were discussed, with the desirability
of transitioning to lighter but more expensive lithium batteries noted as a way of
reducing instrument size and weight and therefore logistical costs associated with de-
ployment.22 The need to supply sufficient power to operate through the polar winter
while aiming to reduce instrument size and weight as far as possible was a significant
design driver for the GSIP project, particularly given the logistical constraints on the
mission due to the nature of the aircraft deployment method.
Ground-based instruments that are incorporated into the GSIP project include
GPS sensors (available in millimetre-level to centimetre-level accuracy depending
on application) commonly used to track ice motion, ice shelf flexure and elevation
changes, and seismometers that are used for applications including the tracking of
iceberg calving; ice shelf fracturing; ice structure, thickness and temperature; the ef-
fect of tides on both ice shelves and ice sheets; and global seismology tracking. Other
ground sensors described by the IPGGR report include terrestrial laser scanning for
high-resolution mapping and surface or volumetric modelling; terrestrial radar in-
terferometry for tracking ice topography and motion; ground-penetrating radar for
measuring surface elevation, strain, temperature and ice thickness; spectral-induced
polarisation for subsurface mapping of ice vs permafrost content, chemistry and tem-
perature; time-lapse photography for long-term event tracking; and various ice and
rock coring drills.23
Airborne instrumentation includes various LIDAR (LIght Detection And Ranging)
sensors, using laser altimeters to map surface elevation and changes in the ice sheets
over time; several radar instruments to measure ice and snow thickness and layering,
37

as well as properties of the bed beneath the ice sheet; gravimetry to measure water
and ice depth, and bed geology; and magnetometry to measure bed geology. Airborne
platforms are specific integrated systems or missions utilising multiple instruments,
such as Lamont-Doherty Earth Observatory’s IcePod and NASA’s IceBridge missions,
both of which use the same C-130 or LC-130 (a C-130 variant with retractable skis)
planes from which GSIP will be designed to deploy. No air-deployed instrumentation
along the lines of ADIOS or GSIP was covered by the workshop, suggesting a gap
that may be filled by instrument development such as the current project. Other
examples of airborne platforms include the University of Texas’ aerogeophysical sur-
veys and the University of Kansas’ Center for Remote Sensing of Ice Sheets (CReSIS)
three-tier Unmanned Aircraft Systems (UAS) programme, divided up by range and
payload capacity.23
Satellite instrumentation includes NASA’s ICESat-2 (scheduled to launch in 2018)
which will use LIDAR to track the magnitude of ice sheet changes over time and map
sea ice thickness; ESA’s Cryosat-2 which uses a radar altimeter to measure thickness
variations in both floating sea ice and ice sheets; and NASA’s existing Earth Observ-
ing System (EOS) constellation which includes a wide variety of instrumentation to
measure atmospheric composition, meteorological data, radar, solar irradiance, wind
speed, rainfall, sea surface height and salinity, as well as earth imaging, gravimetry
and radiometry sensors. Other satellites have used synthetic aperture radar (SAR)
to track ice motion and topography, and magnetometers and gradiometers to map
structure and geology. In addition, commercial satellite imagery has been used for
high-resolution mapping and tracking of elevation, velocity and ice sheet changes over
time. Of note to GSIP, there is also interest in developing planetary seismometers
for the study of icy bodies, which might include hand deployments by astronauts,
robotic landers or hard impactors, as well as penetrators such as those described in
this work.23
38

2.4.1 Study of infragravity wave impact on Antarctica
One particular area of interest in cryological research is the effect of ocean infragrav-
ity waves on Antarctic ice shelves, which is the object of study for the GSIP project.
Ocean waves can be classified into various types depending on the wave period, but
the spectrum of waves is dominated by ordinary gravity waves (the type that are
visible to the naked eye and would be identified by the layman when envisioning the
term ‘waves’ as applied to the ocean) and ordinary tides. At the interface between two
media (in this case, between the ocean and the atmosphere), gravity and buoyancy
act towards restoring equilibrium in the fluid, resulting in the generation of gravity
waves. Ordinary wind-generated gravity waves are defined as those having a period
between 1 and 30 seconds. Infragravity waves are classified as those with a period
between 30 and 300 seconds, and they are generated by the interactions between
other waves with shorter periods. Tsunamis exhibit similar propagation properties
to infragravity waves and may have a similar or somewhat longer period than such
waves, though they are more notable for their much larger amplitude.24
Ocean infragravity waves generated along the North American Pacific coast have
been observed to propagate as far as Antarctica, where the impact on the Ross Ice
Shelf has been measured by seismic sensors. Compared to the standard ocean swell of
normal gravity waves, the frequency of infragravity waves couples much more strongly
with ice shelf natural frequencies, producing a much greater amplitude response. Pre-
vious studies have focused on the impact of ordinary gravity waves, but seismic data
collected from the Ross Ice Shelf has demonstrated that infragravity waves have a
much more substantial impact in mechanical terms. The induced flexure of floating
ice shelves such as the Ross Ice Shelf may contribute significantly to ice shelf breakup,
which in turn leads to faster glacier flow and therefore rises in sea level. In addition,
ordinary gravity waves are damped by drift ice (floating sea ice unattached to the
shoreline), therefore having only a seasonal impact on the ice shelf, whereas infragrav-
ity waves do not undergo significant damping and therefore have a more consistent
39

impact throughout each year.25
Figure 2-3: Classification of ocean waves according to period, with relative amplitudeindicated by curve height. Image credit: Munk (1951)24
Wave shoaling is the effect where as surface waves travel from deeper to shallower
water, they slow down and the wavelength is reduced, but the wave height increases
to compensate for the reduction in speed. As infragravity waves have significantly
longer wavelengths than ordinary gravity waves, the amplitude of infragravity waves
is increased much more by shoaling, creating a much stronger mechanical impact
on the ice shelf. This effect was measured by seismometers on the Ross Ice Shelf
between December 2005 and April 2006, where it was found that the root mean
square (rms) displacement amplitude averaged about 11mm for infragravity waves
and about 2mm for ordinary gravity waves, as shown in Figure 2-4. The contrast
was heightened during the Antarctic winter when the prevalence of drift ice was at a
40
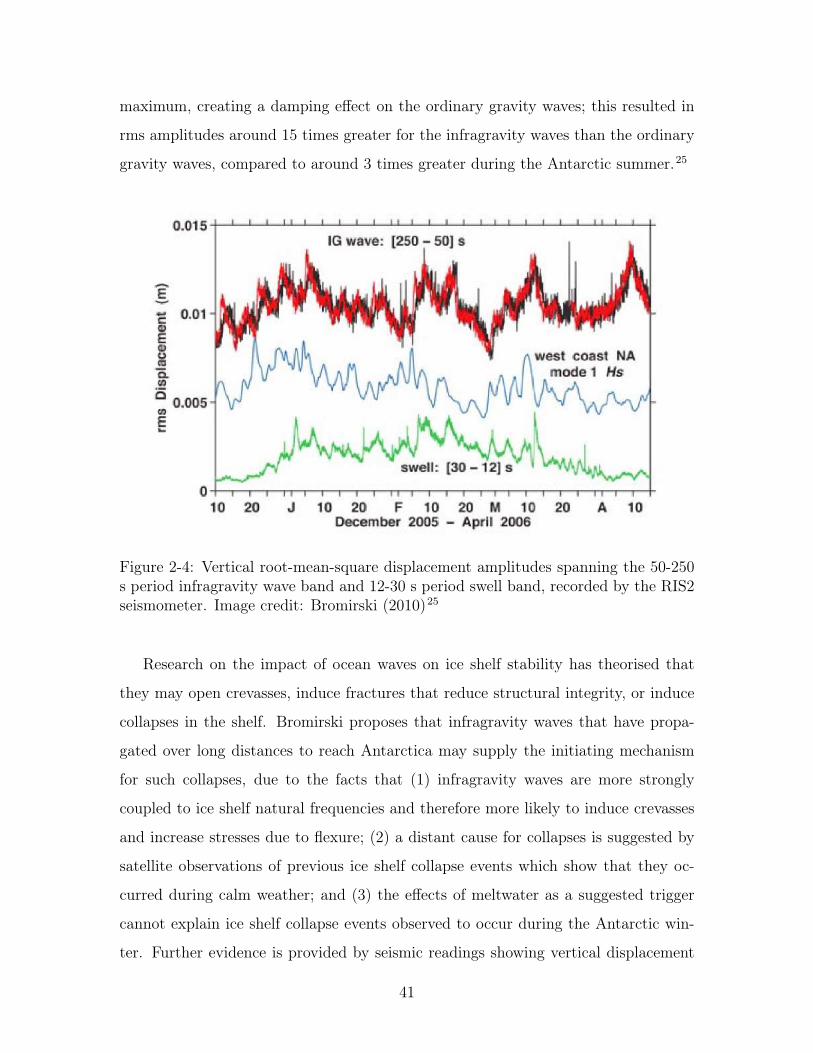
maximum, creating a damping effect on the ordinary gravity waves; this resulted in
rms amplitudes around 15 times greater for the infragravity waves than the ordinary
gravity waves, compared to around 3 times greater during the Antarctic summer.25
Figure 2-4: Vertical root-mean-square displacement amplitudes spanning the 50-250s period infragravity wave band and 12-30 s period swell band, recorded by the RIS2seismometer. Image credit: Bromirski (2010)25
Research on the impact of ocean waves on ice shelf stability has theorised that
they may open crevasses, induce fractures that reduce structural integrity, or induce
collapses in the shelf. Bromirski proposes that infragravity waves that have propa-
gated over long distances to reach Antarctica may supply the initiating mechanism
for such collapses, due to the facts that (1) infragravity waves are more strongly
coupled to ice shelf natural frequencies and therefore more likely to induce crevasses
and increase stresses due to flexure; (2) a distant cause for collapses is suggested by
satellite observations of previous ice shelf collapse events which show that they oc-
curred during calm weather; and (3) the effects of meltwater as a suggested trigger
cannot explain ice shelf collapse events observed to occur during the Antarctic win-
ter. Further evidence is provided by seismic readings showing vertical displacement
41

response to infragravity wave-induced flexure on the floating Ross Ice Shelf is over 60
dB higher than that measured at Scott Base and Palmer Station on the non-floating
ice sheet, and also by the occurrence of collapse events in 2008 coinciding with the pre-
dicted propagation of Pacific infragravity waves following a South American storm
event. This hypothesis provides the motivation for further investigation of seismic
and displacement observations in Antarctica in order to research the characteristics
of infragravity waves and their impact upon ice shelf breakup processes.25
42
Chapter 3
Key mission features for Antarctic
penetrator
3.1 Concept of operations
The objective of the GSIP project is to improve current instrumentation for the study
of infragravity wave impact on the Ross Ice Shelf, by designing and manufacturing
a geodetic seismic penetrator which can be deployed from an aircraft flying over the
Antarctic ice shelf. In the current Concept of Operations as shown in Figure 3-1, this
deployment aircraft is expected to be the LC-130 cargo plane, as these vehicles have
been operated by the New York Air National Guard 109th Airlift Wing in support of
the National Science Foundation’s Arctic and Antarctic operations since 1988.26
After deployment, the probe will fall in an aerodynamically stable configuration
designed to reduce oscillation, so that it will emplace at a vertical angle in the snow
pack and survive impact with full functionality. The forebody of the penetrator,
containing 3-axis seismometers, will emplace deeply enough into the snow to avoid
wind-induced vibrations and achieve a stable coupling for long-term measurements
of the ice sheet flexure and motion. The afterbody of the penetrator, containing the
GPS and Iridium antennas, will decelerate rapidly enough upon impact to ensure
that the antennas remain at least 65 cm above the surface of the snow in their
43

initial emplacement. This will allow for a mission lifetime of one year in which
seismic and GPS data is collected and transmitted back to the ground station via
the Iridium satellite network, before snow accumulation becomes a potential issue
affecting transmission success.28 The forebody and afterbody will remain connected
by an umbilical so that data and power connections are maintained across the system
throughout the mission lifetime. At the end of the unit’s intended lifetime of one
year, it will be retrieved if this can be feasibly achieved without high cost or risk, and
the performance will be analysed in order to refine the design for future iterations.
Figure 3-1: Concept of Operations for GSIP
There are many constraints and design drivers for the mission, some of which are
unique to the Antarctic environment when compared to other research settings, and
some of which are more closely tied to the constraints of penetrator probes as a type
of vehicle. The decision to develop an air-deployed penetrator probe aims to reduce
on-ice footprint while conducting seismic research in the Antarctic, which reduces
44
both environmental impact and risk to team members on the ground. However, this
operational choice creates demanding impact shock requirements on the overall sys-
tem as well as on individual components, as well as mass and volume limits due to
the feasibility of what can be deployed from an aircraft. Aerodynamic stability of the
design is another important consideration due to the angle requirements imposed by
the need to avoid ricochet upon impact, and the seismometers needing to be emplaced
within 10° of vertical in order to measure accurate data.
The need for remote data transmission accounts for much of the power draw re-
quired by GSIP, and the year-long mission duration results in sizing of the power
system as a significant design driver, with the mass and volume of batteries that are
required occupying the majority of the resulting design. The requirement for phase-
locked GPS to achieve the desired level of accuracy in positioning measurements also
leads to a sizeable proportion of the power requirements over time, due to the need for
high frequency GPS readings and continuous connectivity, rather than the lower fre-
quency, discrete measurements that are used for many common lower-accuracy GPS
applications.
The Antarctic environment brings its own challenges of extreme operating tem-
peratures, as well as strong winds that must be decoupled from the part of the vehicle
containing the seismometers in order to avoid inducing vibrations. GSIP must also
avoid radiating sufficient heat into the surrounding snow pack to begin melting the
nearby snow and therefore result in decoupling and a loss of accurate seismic data.
The Protocol on Environmental Protection to the Antarctic Treaty requires that a
fundamental consideration of all activity in the area must be that of limiting adverse
effects on the environment, ecosystem, or air and water quality,27 introducing the re-
quirement for GSIP to be a contained system that will not contaminate the Antarctic
environment in any way.
45
3.2 GSIP system-level requirements
In order to achieve full mission success for GSIP, both of the objectives shown in
Table 3.1 below must be successfully completed. These mission objectives summarise
the motivation for the GSIP project. At present there are only a limited number
of measurements from studies of the dynamic response of Antarctic ice shelves, and
there are many environmental and logistical challenges in collecting more detailed
observations. MO1 relates to the scientific requirements of the project, with the aim
of studying ocean forcing effects on the floating Ross Ice Shelf, which lies between
the Ross Sea and the continental ice sheet, and acts to hold back the ice sheet from
moving more rapidly into the ocean. The motivation for this research lies in gathering
a better understanding of the dynamic effect of ocean waves on ice-shelf stability, and
then relating the effect of ice-shelf stability on wider ice sheet stability and therefore
global sea level rise. MO2 relates to the aim of advancing the current state of polar
instrumentation by developing a new type of sensor vehicle, reducing on-ice footprint
and therefore on-ice risk to team members, and making use of existing polar research
aircraft for air-deployment.
Table 3.1: GSIP mission objectives
ID Mission objective
MO1To monitor the year-round seismic response of ice shelves to infragravitywaves to improve understanding of ocean impact on ice shelf stability, whichin turn affects ice sheet stability and global sea level rise.
MO2To advance the state of the art in polar instrumentation by demonstratingthe feasibility of obtaining continuous, high-resolution measurements usingan air-deployed penetrator probe.
The mission objectives shown in Table 3.1 may be broken down further to give
technical requirements, which may apply to the entire mission or system, or at a lower
level may apply only to specific subsystems or components of the penetrator. Such
requirements can be derived from the original mission objectives, or may flow down
from other higher-level requirements for GSIP. System-level requirements are listed
in Table 3.2 below along with the source and the specified method for verifying each
requirement.
46
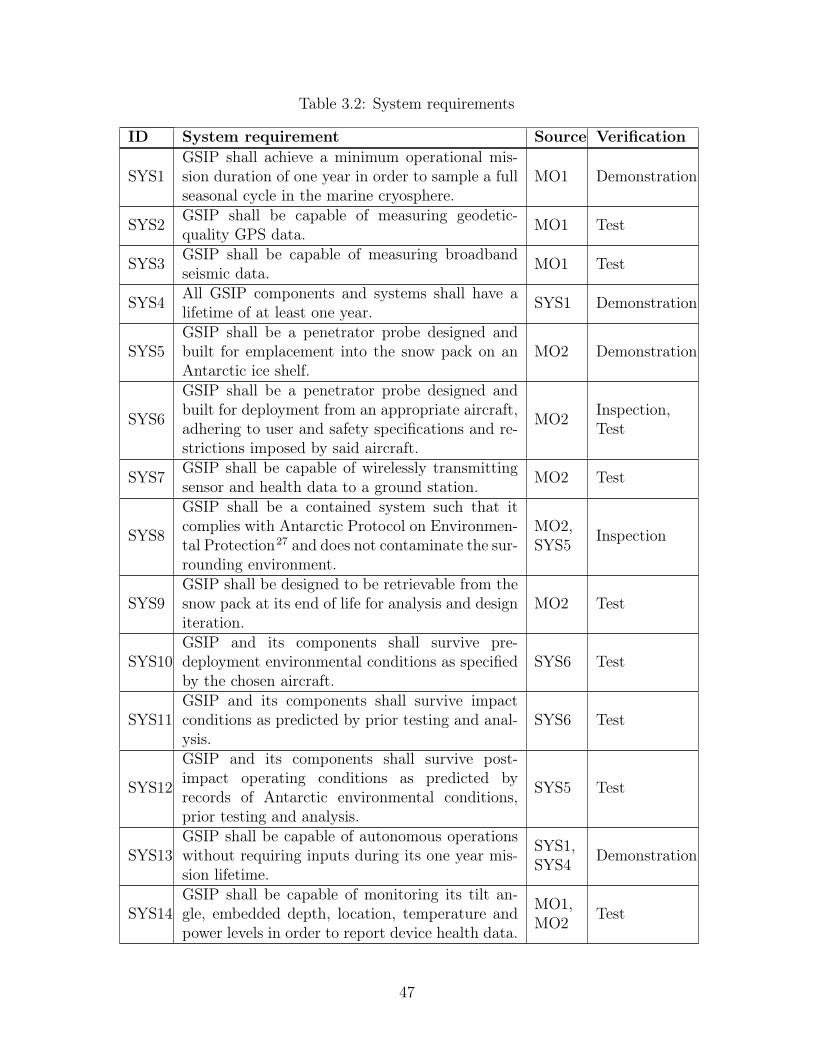
Table 3.2: System requirements
ID System requirement Source Verification
SYS1GSIP shall achieve a minimum operational mis-sion duration of one year in order to sample a fullseasonal cycle in the marine cryosphere.
MO1 Demonstration
SYS2 GSIP shall be capable of measuring geodetic-quality GPS data. MO1 Test
SYS3 GSIP shall be capable of measuring broadbandseismic data. MO1 Test
SYS4 All GSIP components and systems shall have alifetime of at least one year. SYS1 Demonstration
SYS5GSIP shall be a penetrator probe designed andbuilt for emplacement into the snow pack on anAntarctic ice shelf.
MO2 Demonstration
SYS6
GSIP shall be a penetrator probe designed andbuilt for deployment from an appropriate aircraft,adhering to user and safety specifications and re-strictions imposed by said aircraft.
MO2 Inspection,Test
SYS7 GSIP shall be capable of wirelessly transmittingsensor and health data to a ground station. MO2 Test
SYS8
GSIP shall be a contained system such that itcomplies with Antarctic Protocol on Environmen-tal Protection27 and does not contaminate the sur-rounding environment.
MO2,SYS5 Inspection
SYS9GSIP shall be designed to be retrievable from thesnow pack at its end of life for analysis and designiteration.
MO2 Test
SYS10GSIP and its components shall survive pre-deployment environmental conditions as specifiedby the chosen aircraft.
SYS6 Test
SYS11GSIP and its components shall survive impactconditions as predicted by prior testing and anal-ysis.
SYS6 Test
SYS12
GSIP and its components shall survive post-impact operating conditions as predicted byrecords of Antarctic environmental conditions,prior testing and analysis.
SYS5 Test
SYS13GSIP shall be capable of autonomous operationswithout requiring inputs during its one year mis-sion lifetime.
SYS1,SYS4 Demonstration
SYS14GSIP shall be capable of monitoring its tilt an-gle, embedded depth, location, temperature andpower levels in order to report device health data.
MO1,MO2 Test
47
Several of the system-level requirements described in Table 3.2 are driven by
the need to operate for an entire year in order to measure the year-round seismic
response, allowing the mission to fully capture fluctuations throughout the year due
to causes such as seasonal changes, levels of damping by drift ice, or variations in wave
amplitude affected by storms. Other requirements are driven by the additional aim of
using a penetrator probe for the mission rather than existing polar instrumentation, so
as to develop penetrators for Antarctic use and gain the logistical benefits of lowering
time and cost compared to deployment by hand, improving safety for team members
on the ground, and improving ease of accessing even remote or dynamic areas to
establish a wide network of seismic sensors. The choice of air deployment for the
probe brings in requirements related to the specifications of the aircraft, as well as
the need to survive predicted impact loads and transmit reports on the health status
of the penetrator to ensure that stable emplacement has occurred. Environmental
requirements for Antarctic operations must also be followed as laid out in the Protocol
on Environmental Protection to the Antarctic Treaty,27 and recovering the penetrator
at the end of operations if at all possible will help to avoid contaminating the region
as well as providing valuable data on the performance of GSIP for analysis and design
iteration.
3.3 Subsystem overview
3.3.1 Structures
The GSIP structural requirements (shown in Table 3.3 below) are driven by the need
to survive the impact loading experienced upon contact with the snow pack. The
outer structure of the penetrator must withstand the expected loads of up to 600 G
without buckling or significant deformation, and must protect the internal structure
and components of the system from experiencing g-loading beyond their specified lim-
its. Crushable shock-absorbing material will be incorporated into the design where
necessary to ensure that each component is sufficiently protected against impact shock
48

in excess of its specifications. Beyond ensuring impact survival, it is crucial to attain
an adequate emplacement depth to achieve stable seismic coupling with the snow pack
for long-term data collection. The penetrator must also embed far enough into the
snow to avoid wind-induced disturbances of the seismic data. However, the Iridium
and GPS antennas must be placed above the snowline for satellite communications
links to succeed. The 1957-1958 Ross Ice Shelf traverse recorded an average annual
snow accumulation on the shelf of 0.2 m water equivalent per unit area, and given the
lowest snow density measured at the surface of 0.310 g/cm³, average snow density of
0.365 g/cm³ and highest snow density of 0.426 g/cm³, this results in an accumula-
tion rate of 0.469 to 0.645 m/year, with an average accumulation of 0.548 m/year.28
These annual accumulation rates result in the requirement for the initial placement
of the antennas to be 0.65 m or higher above the surface of the snow to avoid the
communication equipment being covered up by snow before the end of the mission.
The aim of minimising wind-induced disturbances incentivises penetration of at
least 100% of the probe’s length to avoid exposure to air movement above the snow
level, whereas the need for data transmission and GPS positioning drive a require-
ment to position some part of the probe at least 0.65 m above the surface. The
conflicting nature of these requirements eventually led to the design decision that
GSIP will consist of a separable two-body design that allows the forebody of the
penetrator to emplace much deeper into the impact medium for seismic coupling,
while the connected afterbody remains at the surface and supports the antennas with
sufficient clearance above the snow for at least one year. This type of concept has
been adopted previously to improve mission robustness to unknown or widely vary-
ing impact medium properties for several penetrator missions, including the separable
two-body designs for the Mars-96 penetrators, Deep Space 2 Microprobes and Sandia
Sea Ice Penetrometer described in Chapter 2.
A variety of snow densities will be experienced on the Ross Ice Shelf, and the
density in a particular area will not be known with any certainty prior to deployment.
49
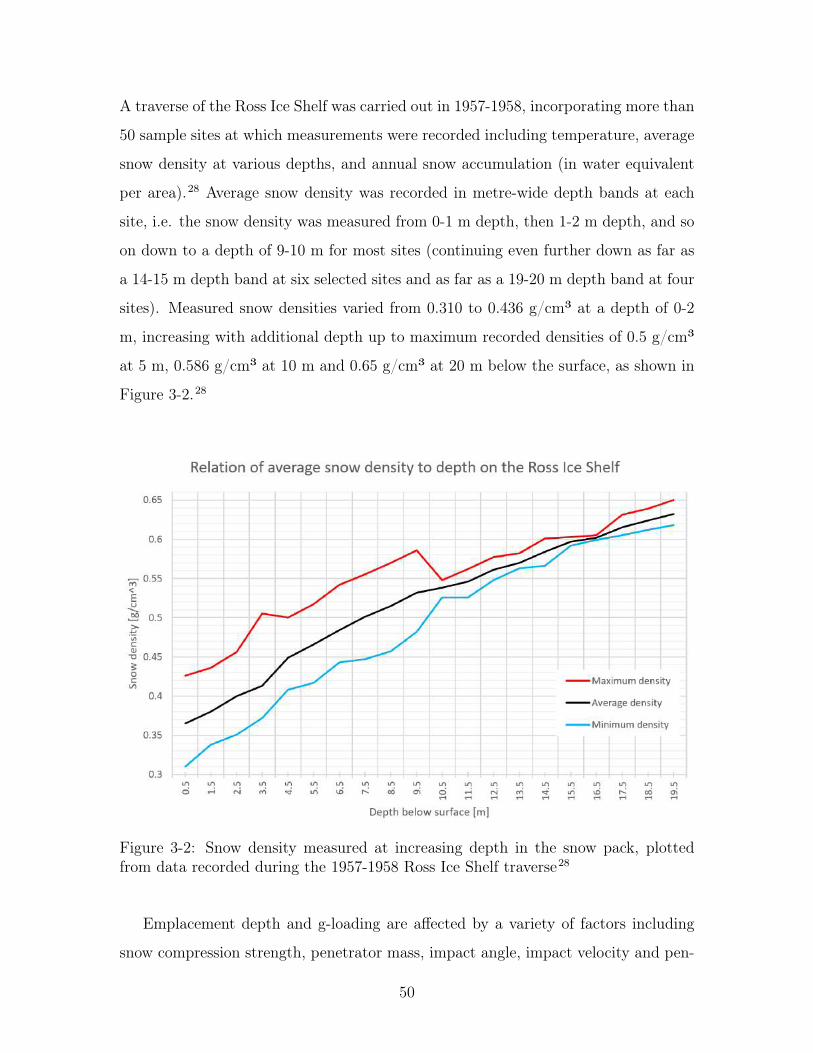
A traverse of the Ross Ice Shelf was carried out in 1957-1958, incorporating more than
50 sample sites at which measurements were recorded including temperature, average
snow density at various depths, and annual snow accumulation (in water equivalent
per area).28 Average snow density was recorded in metre-wide depth bands at each
site, i.e. the snow density was measured from 0-1 m depth, then 1-2 m depth, and so
on down to a depth of 9-10 m for most sites (continuing even further down as far as
a 14-15 m depth band at six selected sites and as far as a 19-20 m depth band at four
sites). Measured snow densities varied from 0.310 to 0.436 g/cm³ at a depth of 0-2
m, increasing with additional depth up to maximum recorded densities of 0.5 g/cm³
at 5 m, 0.586 g/cm³ at 10 m and 0.65 g/cm³ at 20 m below the surface, as shown in
Figure 3-2.28
Figure 3-2: Snow density measured at increasing depth in the snow pack, plottedfrom data recorded during the 1957-1958 Ross Ice Shelf traverse28
Emplacement depth and g-loading are affected by a variety of factors including
snow compression strength, penetrator mass, impact angle, impact velocity and pen-
50

etrator cross-sectional area. The snow compression strength can be approximated
from the snow density as shown in Figure 3-3 below, with the lowest snow density of
0.310 g/cm³ corresponding to a compression strength in the range of 0.3 to 1 kPa (or
0.003-0.01 bar in the imperial units used in the plot) and the highest snow density
of 0.65 g/cm³ corresponding to a compression strength of 60 to 90 kPa (or 0.6-0.9
bar).29
Figure 3-3: Relation of volumetric compression modulus and density in snow. Imagecredit: Mellor (1974)29
The penetrator mass is dictated by the batteries required to last the full mission
51

duration and the components that must be included to fulfil mission objectives, but
the cross-sectional area may be varied according to the structural configuration that
is chosen for the final design. The snow compression strength or density cannot be
controlled, but the penetrator can be designed to achieve a particular impact angle
and impact velocity range. Carrying out calculations of the penetrator deceleration
for a simulated vertical impact into snow using MATLAB (described in more detail
in Section 4.2), the snow compression strength acts as a pressure on the impacting
penetrator, multiplied by the cross-sectional area of the penetrator entering the snow
at a given moment to result in the decelerating force on the unit, in addition to the
friction acting between snow and penetrator. Based on this MATLAB simulation, the
target impact velocity range for GSIP will be between 20 and 40 m/s, to be updated
as necessary based on further testing and simulation work.
Separating the penetrator into a two-body design allows for the forebody to be
designed to emplace a minimum of one full length into the snow at the densest pre-
dicted snow conditions and at the minimum impact velocity (it will clearly emplace
further than this minimum at a lower snow density or at an impact velocity higher
than the minimum), while the afterbody can be designed to position the antennas
a minimum of 65 cm above the surface at the least dense predicted snow conditions
and the maximum impact velocity (the antennas may be placed higher than this min-
imum height if denser snow is encountered or a lower impact velocity occurs). The
forebody will contain the seismometers at the lower end of the structure next to the
nosecone to ensure stable seismic coupling with the snow pack, as well as containing
the batteries in order to make sure that the centre of mass of the penetrator is placed
as low as possible to improve aerodynamic and impact stability. Other components
will be distributed between the two bodies as a detailed thermal analysis determines
is appropriate to achieve specified operating temperature ranges for each part (see
Section 3.3.5 below on thermal requirements). The forebody will remain connected to
the afterbody at all times by an umbilical connection which will be stowed between
them prior to impact and deploy freely as emplacement into the snow occurs, includ-
52

ing an elastic snubber placed at the very end of the cable to absorb deceleration shock
if the full length of the umbilical connection is deployed before snow resistance brings
the forebody to a halt. This umbilical will provide a data and power link between
the two bodies throughout the mission, which will be capable of withstanding the
maximum g-loading requirement of 600 G. Based on MATLAB impact simulations,
the maximum g-loading experienced by the forebody is predicted to be 200 G or less,
and the maximum g-loading experienced by the afterbody is predicted to be 500 G
or less, therefore the overall requirement was set at 600 G.
The afterbody will be designed with a wider disk-like structure in order to decel-
erate rapidly upon contact with the snow, to ensure that the requirement for antenna
position is fulfilled. This shape will also be sized to provide a drag force during the
falling phase that will result in the penetrator’s terminal velocity equalling the desired
impact velocity, which should be in the range of 20-40 m/s as determined by running
MATLAB simulations of impact forces and deceleration. This drag disk will also be
designed so that the induced drag has an aerodynamically stabilising effect on the
penetrator in order to reduce any oscillations or horizontal velocity components that
occur during the falling phase, therefore helping to achieve the requirement to impact
within 10° of vertical to maximise the probability of successful emplacement into the
snow pack.
Table 3.3: Structural requirements
ID Structures requirement Source Verification
STR1
GSIP shall consist of a separable two-body de-sign to ensure adequate penetration depth of theforebody and adequate ground clearance for theafterbody.
SYS2,SYS3 Inspection
STR2The forebody structure shall contain the seis-mometers to ensure adequate coupling with thesnow pack for data collection.
SYS3 Inspection
53

ID Structures requirement Source Verification
STR3
The forebody structure shall be designed to em-place at least 100% of its length into the snow-pack, assuming impact occurs within 10° of verti-cal and at the desired minimum impact velocityof 20 m/s or higher.
SYS3,SYS5 Test
STR4
The afterbody structure shall be designed to em-place no further than 20% of its height into thesnowpack and position the GPS and Iridium an-tennas no less than 65 cm above the surface, aslong as impact occurs at the desired maximumimpact velocity of 40 m/s or lower.
SYS2,SYS7 Test
STR5
The afterbody structure shall be designed andsized with aerodynamic properties such that theinduced drag during the falling phase will givethe falling system a terminal velocity within thedesired impact velocity range of 20-40 m/s.
SYS6 Analysis,Test
STR6
The afterbody structure shall contain the GPSand Iridium antennas and ensure their placementa minimum of 65 cm above the snow line for trans-mission, to account for one year’s snow accumu-lation.
COM2,SYS1,SYS4
Test
STR7
The afterbody structure shall be designed andsized with aerodynamic properties such that theinduced drag during the falling phase has an aero-dynamically stabilising effect to reduce oscilla-tions within 10° and ensure that the penetratorimpacts within 10° of vertical.
STR3,PAY3
Analysis,Test
STR8
The two bodies shall maintain a structural, dataand power ‘umbilical’ linkage throughout all mis-sion phases, capable of withstanding loads up to600 G.
STR1,SYS11 Test
STR9
The umbilical linkage between bodies shall bestowed in between them while the two bodies areconnected and deploy freely once separation oc-curs, until stopped by snow resistance or by anelastic snubber placed at the end of the cable toabsorb deceleration shock.
STR1 Demonstration
STR10
Any components which are not rated to the pre-dicted levels of deceleration will be cushionedwith a shock-absorbing system to keep themwithin survivable loading levels.
SYS11 Test
54
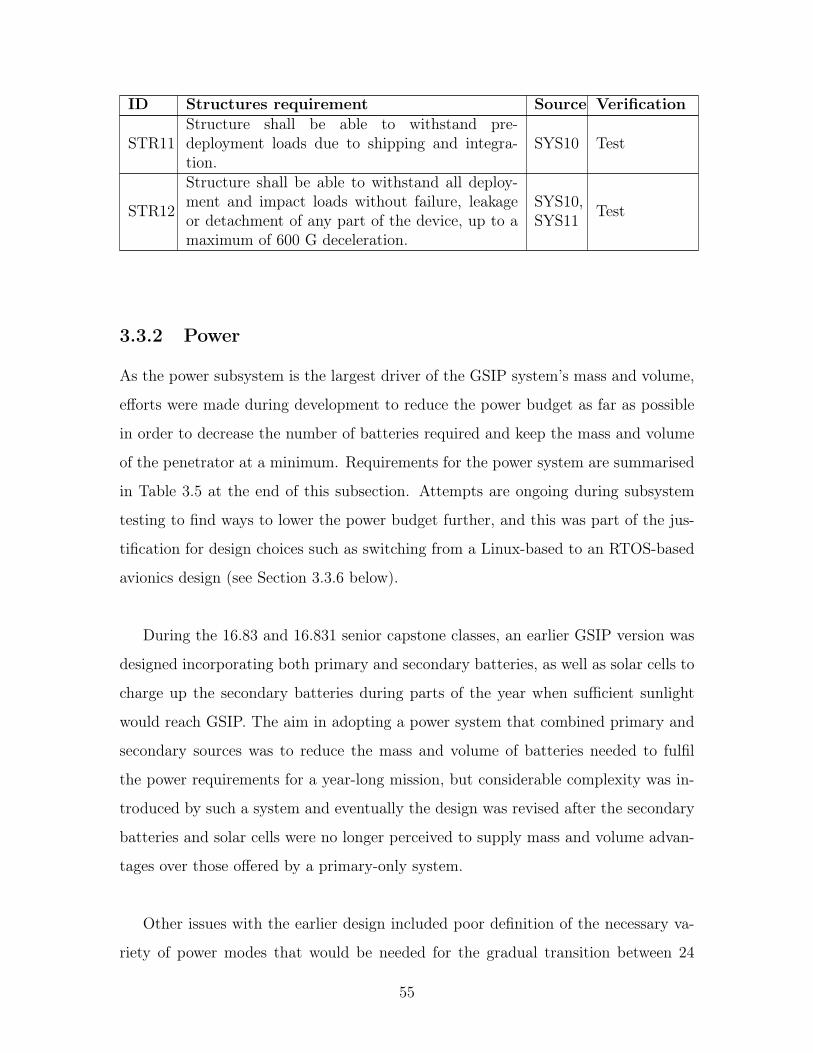
ID Structures requirement Source Verification
STR11Structure shall be able to withstand pre-deployment loads due to shipping and integra-tion.
SYS10 Test
STR12
Structure shall be able to withstand all deploy-ment and impact loads without failure, leakageor detachment of any part of the device, up to amaximum of 600 G deceleration.
SYS10,SYS11 Test
3.3.2 Power
As the power subsystem is the largest driver of the GSIP system’s mass and volume,
efforts were made during development to reduce the power budget as far as possible
in order to decrease the number of batteries required and keep the mass and volume
of the penetrator at a minimum. Requirements for the power system are summarised
in Table 3.5 at the end of this subsection. Attempts are ongoing during subsystem
testing to find ways to lower the power budget further, and this was part of the jus-
tification for design choices such as switching from a Linux-based to an RTOS-based
avionics design (see Section 3.3.6 below).
During the 16.83 and 16.831 senior capstone classes, an earlier GSIP version was
designed incorporating both primary and secondary batteries, as well as solar cells to
charge up the secondary batteries during parts of the year when sufficient sunlight
would reach GSIP. The aim in adopting a power system that combined primary and
secondary sources was to reduce the mass and volume of batteries needed to fulfil
the power requirements for a year-long mission, but considerable complexity was in-
troduced by such a system and eventually the design was revised after the secondary
batteries and solar cells were no longer perceived to supply mass and volume advan-
tages over those offered by a primary-only system.
Other issues with the earlier design included poor definition of the necessary va-
riety of power modes that would be needed for the gradual transition between 24
55
hours of daylight and 24 hours of darkness, which added significant complexity to
the power and avionics subsystem designs. There were also considerable risks to the
mission based on the likelihood of snow adhesion to the solar panels over time, as
well as the need to place the panels high on the back end of the penetrator to ensure
they were not buried by snow accumulation during the mission lifetime, which raised
the centre of mass of the system. In addition, the solar panels were not sufficiently
robust to survive the high levels of impact loading experienced upon contact with
the snow, and efforts to cushion them against the shock would have added even more
complexity to the structural design of the penetrator.
When the task of updating and simplifying the GSIP power subsystem was be-
gun, fuel cells were considered as an alternative to using a battery-based system.
Cells incorporating methanol or pellet-based fuels were examined, and state-of-the-
art fuel cell technology used in UAVs and other vehicles was considered, such as the
systems offered by Cella and HES. However, upon investigation, the lightweight sys-
tems suited to UAVs were not suitable for low-temperature applications. Although
EFOY sells systems that could operate at temperatures as low as -40°C, this option
was eventually ruled out over concerns regarding potential exhaust icing problems, a
lack of high enough shock resistance for air deployment, and the fact that the bulky
50 kg system would have added substantial mass and volume to the system rather
than helping to make it smaller.
The power budget from the senior capstone class predicted an average power draw
of 4.86 W,37 but this was reduced to 2.70 W in the updated and simplified design
as shown in Table 3.4, allowing for a reduction in the dimensions of the penetrator
even though the primary-only system required GSIP to contain enough batteries to
power one year’s operation. The current version of the penetrator is sized to contain
374 batteries to fulfil the system’s power needs for one year. Power draw testing
was carried out at MIT Haystack Observatory in order to determine realistic average
power draws over extended time periods. Multiple power management modes will
56

be used during operations to handle peak loads during Iridium transmission, average
loads during science operations, and safe modes in case of faults or unexpected events.
Power sources will also be supplied at the voltages required by different subsystem
components, including several different voltage levels as is determined to be necessary
in the final configuration.
Table 3.4: GSIP power budget
Subsystem Component
Averagepowerdraw[mW]
Based on?
ADCS BNO055 IMU 0.13 Non-continuous usage, class esti-mate of 1 min/day usage37
Comms Iridium transceiverand antenna 1000
Non-continuous usage of up to20 W for short periods; estimatefrom Haystack power draw test-ing
Payload GPS receiver 500 Continuous usage, estimate fromHaystack testing
Payload GPS antenna 125 Continuous usage, estimate fromHaystack testing
Payload ICL seismometers 360 360 mW for 3 axes38
Avionics 2 x PSoCs 200 Continuous usage, estimate fromHaystack testing
Avionics CompactFlash 8GBmemory card 250 Non-continuous usage, class esti-
mated average power draw37
Total 2435 Batteries needed: 312Batteries + 20% margin: 374
Although the Omnicel ER34615 batteries have an operating range of -55°C to
+85°C, the voltage supplied drops significantly at temperatures below 0°C.36 The
safest operating range for GSIP components was determined to be between -20°C
and +25°C (leading to the basis of the THE3 requirement, see Section 3.3.5 below),
except for the memory card which has a storage temperature range of -20°C to +85°C
but an operating temperature range of 0°C to +60°C and will therefore need to be
maintained at a slightly higher temperature while in use.35 The basis for the thermal
control system requirement was set to maintain all components including the batteries
57
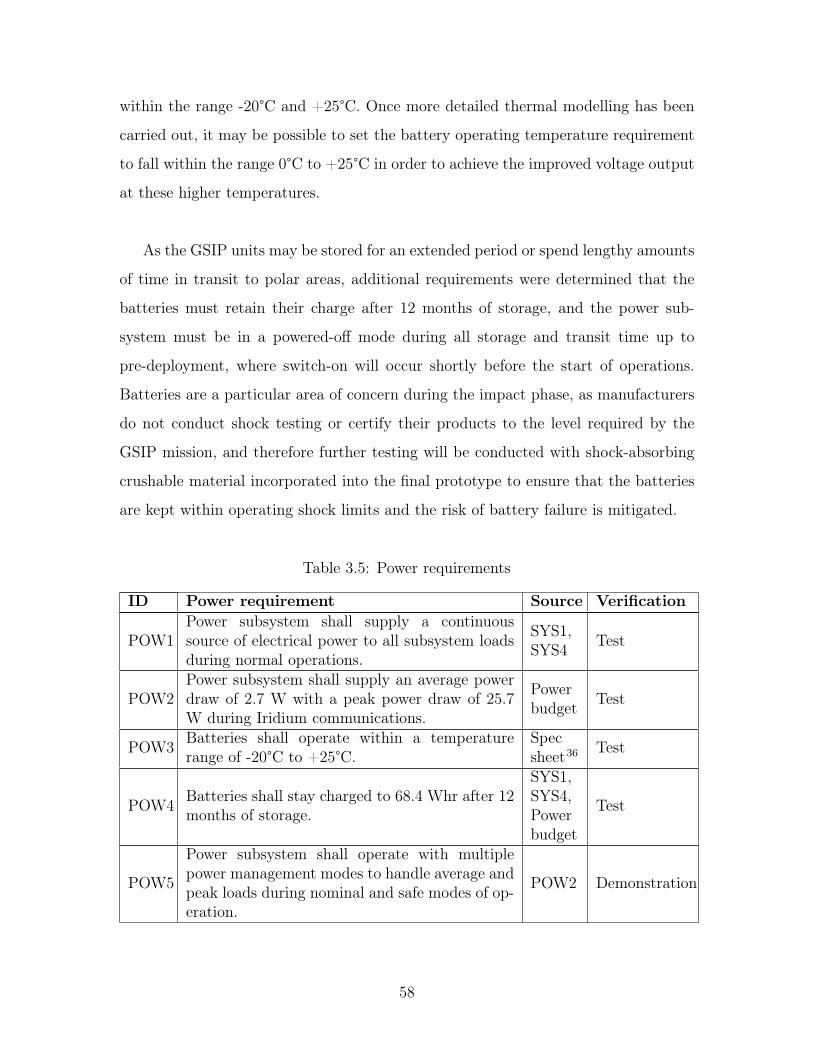
within the range -20°C and +25°C. Once more detailed thermal modelling has been
carried out, it may be possible to set the battery operating temperature requirement
to fall within the range 0°C to +25°C in order to achieve the improved voltage output
at these higher temperatures.
As the GSIP units may be stored for an extended period or spend lengthy amounts
of time in transit to polar areas, additional requirements were determined that the
batteries must retain their charge after 12 months of storage, and the power sub-
system must be in a powered-off mode during all storage and transit time up to
pre-deployment, where switch-on will occur shortly before the start of operations.
Batteries are a particular area of concern during the impact phase, as manufacturers
do not conduct shock testing or certify their products to the level required by the
GSIP mission, and therefore further testing will be conducted with shock-absorbing
crushable material incorporated into the final prototype to ensure that the batteries
are kept within operating shock limits and the risk of battery failure is mitigated.
Table 3.5: Power requirements
ID Power requirement Source Verification
POW1Power subsystem shall supply a continuoussource of electrical power to all subsystem loadsduring normal operations.
SYS1,SYS4 Test
POW2Power subsystem shall supply an average powerdraw of 2.7 W with a peak power draw of 25.7W during Iridium communications.
Powerbudget Test
POW3 Batteries shall operate within a temperaturerange of -20°C to +25°C.
Specsheet36 Test
POW4 Batteries shall stay charged to 68.4 Whr after 12months of storage.
SYS1,SYS4,Powerbudget
Test
POW5
Power subsystem shall operate with multiplepower management modes to handle average andpeak loads during nominal and safe modes of op-eration.
POW2 Demonstration
58
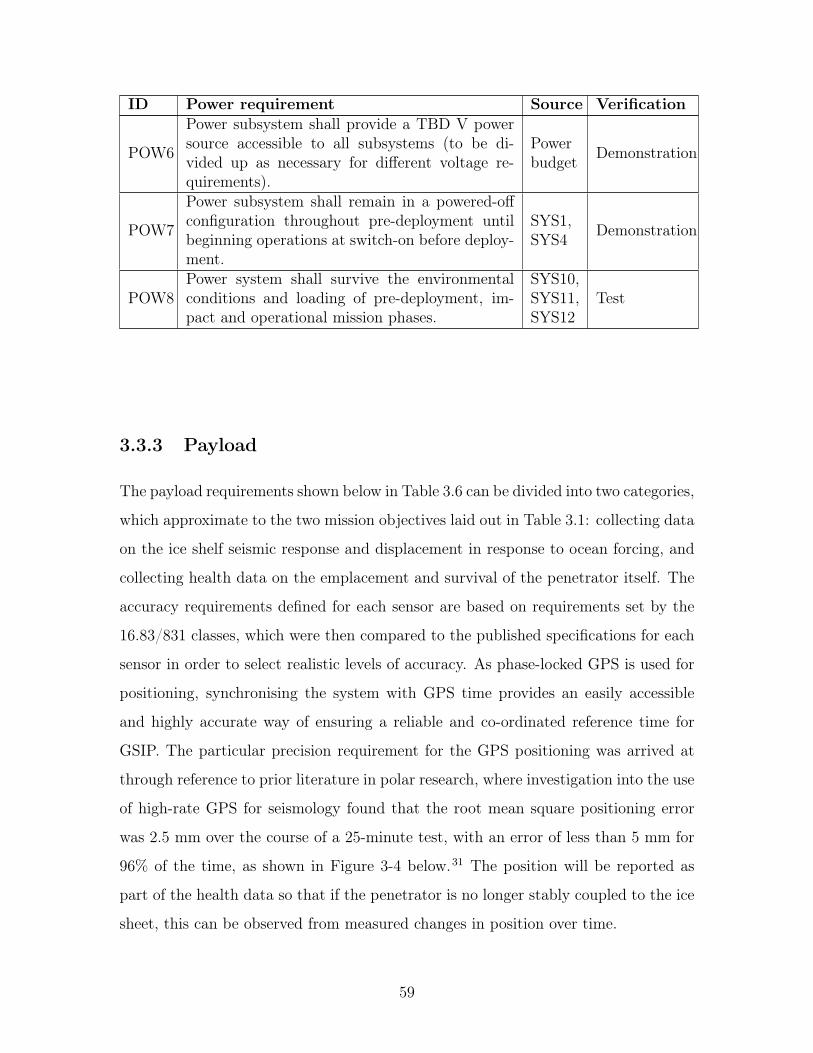
ID Power requirement Source Verification
POW6
Power subsystem shall provide a TBD V powersource accessible to all subsystems (to be di-vided up as necessary for different voltage re-quirements).
Powerbudget Demonstration
POW7
Power subsystem shall remain in a powered-offconfiguration throughout pre-deployment untilbeginning operations at switch-on before deploy-ment.
SYS1,SYS4 Demonstration
POW8Power system shall survive the environmentalconditions and loading of pre-deployment, im-pact and operational mission phases.
SYS10,SYS11,SYS12
Test
3.3.3 Payload
The payload requirements shown below in Table 3.6 can be divided into two categories,
which approximate to the two mission objectives laid out in Table 3.1: collecting data
on the ice shelf seismic response and displacement in response to ocean forcing, and
collecting health data on the emplacement and survival of the penetrator itself. The
accuracy requirements defined for each sensor are based on requirements set by the
16.83/831 classes, which were then compared to the published specifications for each
sensor in order to select realistic levels of accuracy. As phase-locked GPS is used for
positioning, synchronising the system with GPS time provides an easily accessible
and highly accurate way of ensuring a reliable and co-ordinated reference time for
GSIP. The particular precision requirement for the GPS positioning was arrived at
through reference to prior literature in polar research, where investigation into the use
of high-rate GPS for seismology found that the root mean square positioning error
was 2.5 mm over the course of a 25-minute test, with an error of less than 5 mm for
96% of the time, as shown in Figure 3-4 below.31 The position will be reported as
part of the health data so that if the penetrator is no longer stably coupled to the ice
sheet, this can be observed from measured changes in position over time.
59

Figure 3-4: RMS error of GPS estimates over a 25-minute period, including 15 minutesof antenna motion from 0-900 seconds. Image credit: Elosegui (2006)31
The 3-axis MEMS microseismometers were developed by Imperial College London
for the NASA InSight mission to Mars, currently scheduled for launch in 2018. The
InSight mission aim is to investigate Martian geology using a seismometer and heat
transfer probe. The primary mission instrument is SEIS, the Seismic Experiment for
Interior Structure, consisting of a 3-axis Short Period (SP) seismometer and a 3-axis
Very Broadband (VBB) seismometer.39 Although issues with the VBB seismome-
ter led to a delay in the InSight launch, the short period microseismometers were
finalised in 2015. Ongoing work on the microseismometers aims to lower the noise
floor from 0.4 ng/rtHz to 0.1 ng/rtHz - over one hundred times better than the PAY4
requirement set for a noise floor of 50 ng/rtHz or less,38 which was defined as the
standard to meet by the MIT Haystack Observatory’s aims for the development of
the GSIP instrument. Due to the development of SEIS for an interplanetary lander,
the instrument has been verified to have a shock tolerance of over 2000 G and an
operating temperature of 150-290 K (-123 to +17°C).38,39 However, as the focus for a
Mars mission was on certifying the instrument for low temperatures, it is likely that
the seismometers can be used at much higher temperatures. Previous testing on the
60

instrument has been carried out up to +25°C with no operational issues arising, but
further testing will be carried out at MIT Haystack Observatory if thermal analysis
suggests a need to operate the instrument above this temperature range.
Tilt angle will be measured as part of the health data in order to ensure that
the angle requirement for the seismometers has been met by the emplacement, but
also to aid in judging whether the penetrator has successfully emplaced into the snow
pack and coupled to the snow. If the penetrator impacts the snow at more than a
small angle away from the nominal vertical entry, the chances of ricochet or failed
emplacement are significantly increased. Measuring the tilt angle during and after
the impact into the snow pack will provide data on the emplacement process to draw
conclusions about the success of the penetrator’s emplacement. Including this infor-
mation in ongoing reported health data also assists in judging the long-term stability
of GSIP’s coupling to the ice pack, as well as helping to explain potential losses of
functionality in highly dynamic areas where crevassing or calving may occur after a
period of successful operations.
Depth travelled into the snow by the afterbody could be measured and reported
back to assess the success in emplacing the antennas at the desired height, and to cor-
relate with impact velocity, expected snow density and measured deceleration. The
vertical component of the GPS positioning would be compared to available topogra-
phy data from other missions to assess height compared to the snow pack, and the
accuracy requirement of 1 cm is based on GPS accuracy when used for seismology.31
However, as the GPS is located in the afterbody alone, the embedded depth of the
forebody cannot be assessed without changes to the current design. This could be an
area for future work, as depth data for the forebody would be useful to establish that
GSIP has emplaced securely into the snow, penetrating deep enough to stay in place
and achieve seismic coupling with the snow pack for data collection on the ice shelf.
Depth data for the afterbody is still useful data, as it may be compared to snowfall
accumulation to confirm that the antennas remain far enough above the snowline to
61
transmit throughout the year-long mission lifetime, or to provide a potential explana-
tion for a loss of transmission after some period of time if the antennas are positioned
too close to the surface of the snow pack.
Deceleration during impact will be measured to assess the level of g-loading expe-
rienced by the penetrator and its components, and to confirm that the defined impact
loading requirement is stringent enough to ensure the survival of each probe upon im-
pact. The requirement STR13 (see Table 3.3 in Section 3.3.1 above) is defined for
GSIP and all its subsystems to survive impact loading of 600 G, although this esti-
mate aims to encompass abrupt deceleration in the highest density snow that might
be encountered on the Ross Ice Shelf, so as to provide a conservative specification for
components. This interrelates with the requirement PAY10, where all sensors must
be selected to endure the predicted loads of each mission phase. During operations,
the actual impact loading experienced by each penetrator will be recorded and trans-
mitted back to the ground station, allowing for more accurate empirical data about
the snow pack properties to be collected.
Internal temperature of the system will be measured as part of the collected health
data to ensure that the thermal control system is fully functioning and that all sub-
systems and components are kept within their specified operating ranges. Reporting
this data will aid in confirming that all components are still fully functioning, or
variations in temperature may supply simple explanations for any unexpected fail-
ures that occur. Temperature may fluctuate somewhat throughout the year due to
external seasonal changes and variations in data transmission (and therefore power
draw). As well as protecting the system from extremely low internal temperatures
that may damage its operations, it is important to confirm that excessive amounts of
heat are not radiated into the snow pack, as this may melt the snow and affect the
seismic coupling of the penetrator.
Power draw and battery charge will be recorded and transmitted back as part
62
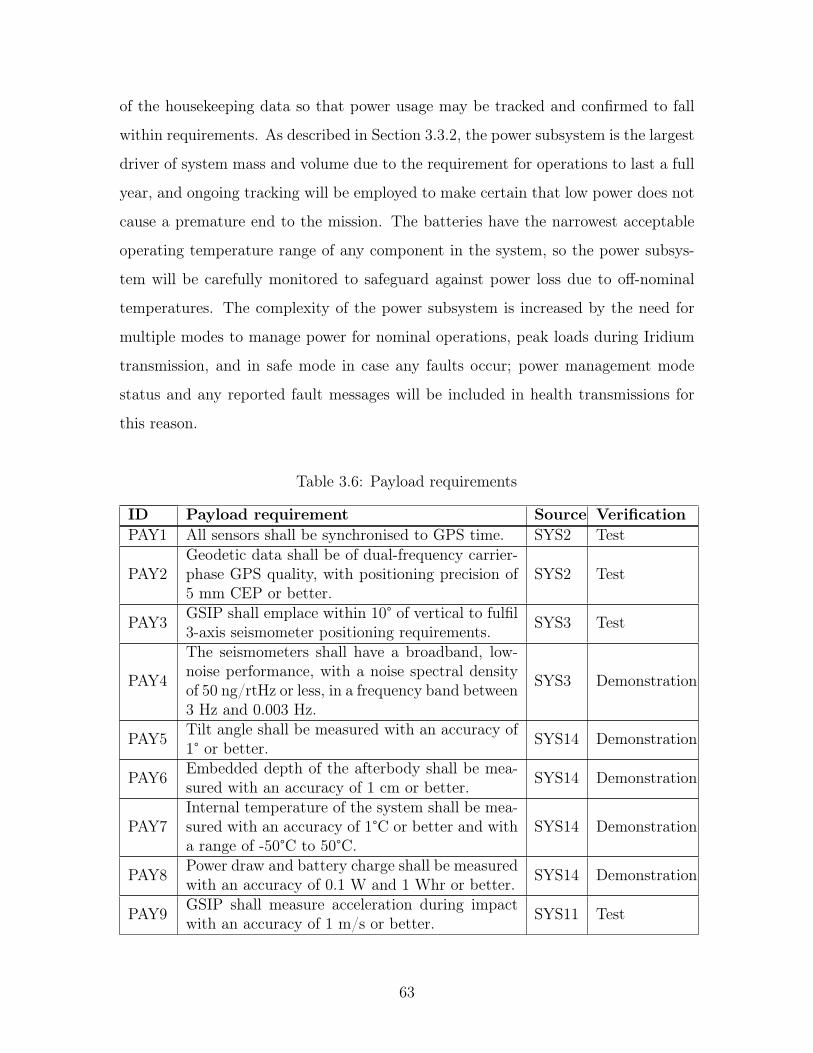
of the housekeeping data so that power usage may be tracked and confirmed to fall
within requirements. As described in Section 3.3.2, the power subsystem is the largest
driver of system mass and volume due to the requirement for operations to last a full
year, and ongoing tracking will be employed to make certain that low power does not
cause a premature end to the mission. The batteries have the narrowest acceptable
operating temperature range of any component in the system, so the power subsys-
tem will be carefully monitored to safeguard against power loss due to off-nominal
temperatures. The complexity of the power subsystem is increased by the need for
multiple modes to manage power for nominal operations, peak loads during Iridium
transmission, and in safe mode in case any faults occur; power management mode
status and any reported fault messages will be included in health transmissions for
this reason.
Table 3.6: Payload requirements
ID Payload requirement Source VerificationPAY1 All sensors shall be synchronised to GPS time. SYS2 Test
PAY2Geodetic data shall be of dual-frequency carrier-phase GPS quality, with positioning precision of5 mm CEP or better.
SYS2 Test
PAY3 GSIP shall emplace within 10° of vertical to fulfil3-axis seismometer positioning requirements. SYS3 Test
PAY4
The seismometers shall have a broadband, low-noise performance, with a noise spectral densityof 50 ng/rtHz or less, in a frequency band between3 Hz and 0.003 Hz.
SYS3 Demonstration
PAY5 Tilt angle shall be measured with an accuracy of1° or better. SYS14 Demonstration
PAY6 Embedded depth of the afterbody shall be mea-sured with an accuracy of 1 cm or better. SYS14 Demonstration
PAY7Internal temperature of the system shall be mea-sured with an accuracy of 1°C or better and witha range of -50°C to 50°C.
SYS14 Demonstration
PAY8 Power draw and battery charge shall be measuredwith an accuracy of 0.1 W and 1 Whr or better. SYS14 Demonstration
PAY9 GSIP shall measure acceleration during impactwith an accuracy of 1 m/s or better. SYS11 Test
63
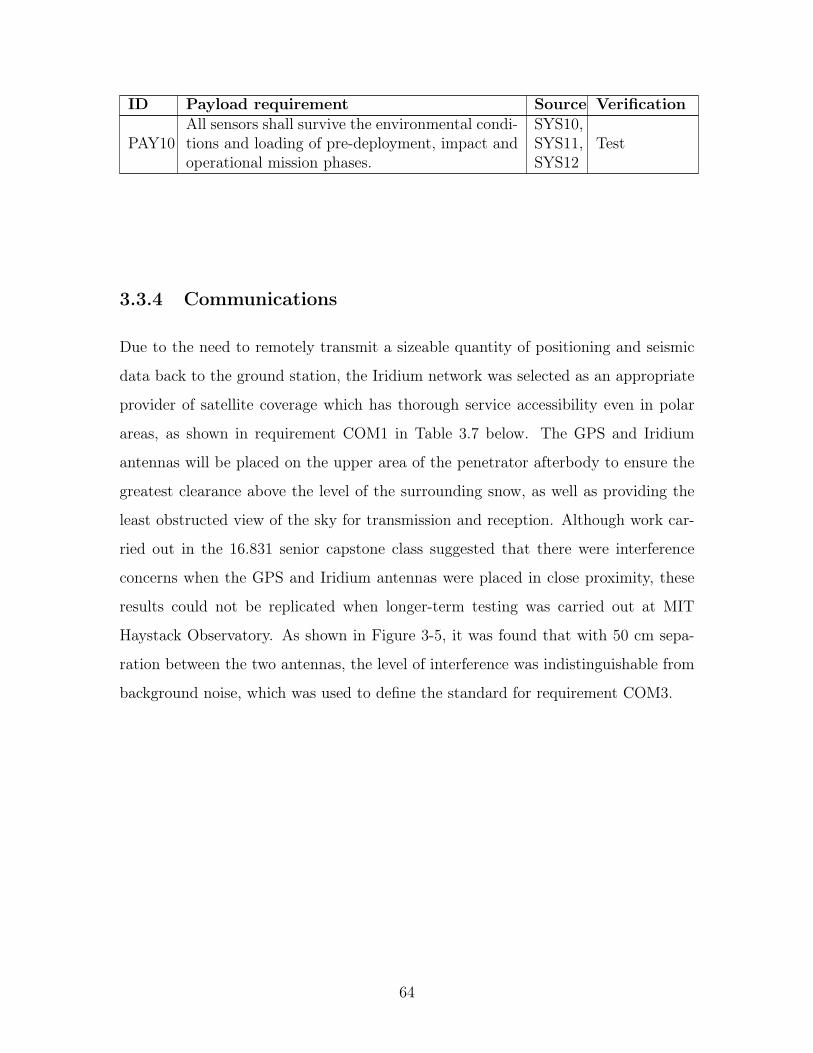
ID Payload requirement Source Verification
PAY10All sensors shall survive the environmental condi-tions and loading of pre-deployment, impact andoperational mission phases.
SYS10,SYS11,SYS12
Test
3.3.4 Communications
Due to the need to remotely transmit a sizeable quantity of positioning and seismic
data back to the ground station, the Iridium network was selected as an appropriate
provider of satellite coverage which has thorough service accessibility even in polar
areas, as shown in requirement COM1 in Table 3.7 below. The GPS and Iridium
antennas will be placed on the upper area of the penetrator afterbody to ensure the
greatest clearance above the level of the surrounding snow, as well as providing the
least obstructed view of the sky for transmission and reception. Although work car-
ried out in the 16.831 senior capstone class suggested that there were interference
concerns when the GPS and Iridium antennas were placed in close proximity, these
results could not be replicated when longer-term testing was carried out at MIT
Haystack Observatory. As shown in Figure 3-5, it was found that with 50 cm sepa-
ration between the two antennas, the level of interference was indistinguishable from
background noise, which was used to define the standard for requirement COM3.
64

Figure 3-5: GPS positioning error with and without simultaneous Iridium transmis-sion at 50 cm separation. Image credit: P. Elosegui, MIT Haystack Observatory
The communications subsystem accounts for the largest part of the GSIP power
budget, due to the amount of power needed to spend time transmitting out all the
science data collected as well as much smaller amounts of housekeeping data. Ex-
tensive testing of the communications design at MIT Haystack Observatory suggests
that although the average power draw for the subsystem is around 1 W, peak power
draw is as high as 20 W for short periods of time, and the predicted upper bound
for power draw was set at 24 W based on this testing. Specifications for the next-
generation Iridium NEXT network are not yet available, although the first satellites
have been launched in 2017. It is hoped that the improved bandwidth and higher
speeds of the new constellation and greater focus by Iridium on data transmission
65

(rather than voice coverage) will lead to faster data rates, potentially allowing for a
future reduction in the communications power budget for GSIP if transmission times
can be significantly shortened. This would allow for longer mission lifetimes for future
deployments, or for a redesigned future GSIP version that could be reduced in both
mass and volume.
The Iridium communications will use the RUDICS (Router Unstructured Digital
Internetworking Connectivity Solution) data service, which has a standard data rate
of 2.4 kbps.30 This was used to define a minimum acceptable standard as being half
the standard data rate, or 1.2 kbps, for transmitting data and/or commands to and
from the ground station. The communications system will also be inspected to ensure
full compliance with all relevant FCC and ITU regulations.
The communications components will need to survive the impact loading experi-
enced by GSIP, which will be taken into account by examining specifications when
selecting parts and then verified by further testing. Any components which are not
rated to the predicted levels of deceleration will be cushioned with a shock-absorbing
system to keep them within survivable loading levels. Operating temperature ranges
are likely to be a particular constraint for the communications subsystem, as both
the GPS and Iridium antennas will need to be placed on the outside of the penetrator
afterbody. According to their specifications, the Topcon PG-A1 GPS antenna has an
operating temperature of -40°C to +55°C,32 and the Iridium SAF5350-A antenna has
an operating temperature of -40°C to +85°C.44 Although the average low experienced
in the Antarctic winter is around -30°C, record lows of -50°C have been previously
recorded.34 However, it is expected that keeping these components powered will main-
tain them within their operating temperature ranges throughout the year. This will
be confirmed by more detailed thermal analysis to be carried out prior to finalising
the GSIP prototype.
66
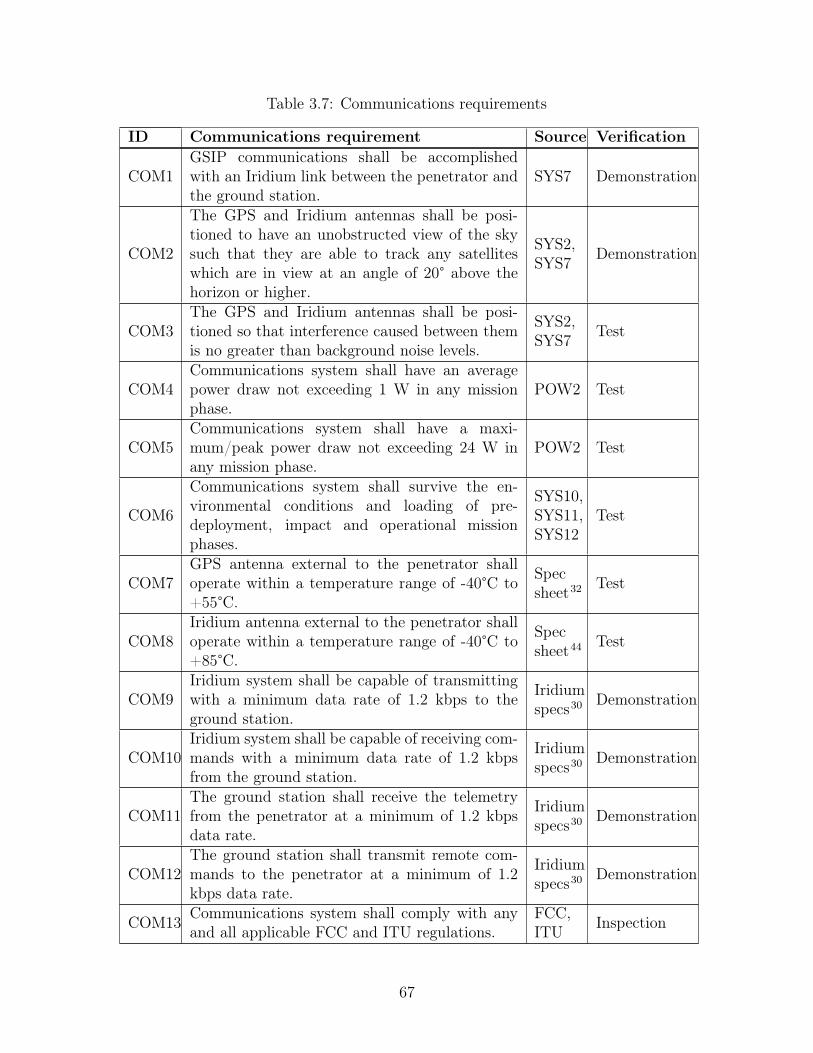
Table 3.7: Communications requirements
ID Communications requirement Source Verification
COM1GSIP communications shall be accomplishedwith an Iridium link between the penetrator andthe ground station.
SYS7 Demonstration
COM2
The GPS and Iridium antennas shall be posi-tioned to have an unobstructed view of the skysuch that they are able to track any satelliteswhich are in view at an angle of 20° above thehorizon or higher.
SYS2,SYS7 Demonstration
COM3The GPS and Iridium antennas shall be posi-tioned so that interference caused between themis no greater than background noise levels.
SYS2,SYS7 Test
COM4Communications system shall have an averagepower draw not exceeding 1 W in any missionphase.
POW2 Test
COM5Communications system shall have a maxi-mum/peak power draw not exceeding 24 W inany mission phase.
POW2 Test
COM6
Communications system shall survive the en-vironmental conditions and loading of pre-deployment, impact and operational missionphases.
SYS10,SYS11,SYS12
Test
COM7GPS antenna external to the penetrator shalloperate within a temperature range of -40°C to+55°C.
Specsheet32 Test
COM8Iridium antenna external to the penetrator shalloperate within a temperature range of -40°C to+85°C.
Specsheet44 Test
COM9Iridium system shall be capable of transmittingwith a minimum data rate of 1.2 kbps to theground station.
Iridiumspecs30 Demonstration
COM10Iridium system shall be capable of receiving com-mands with a minimum data rate of 1.2 kbpsfrom the ground station.
Iridiumspecs30 Demonstration
COM11The ground station shall receive the telemetryfrom the penetrator at a minimum of 1.2 kbpsdata rate.
Iridiumspecs30 Demonstration
COM12The ground station shall transmit remote com-mands to the penetrator at a minimum of 1.2kbps data rate.
Iridiumspecs30 Demonstration
COM13 Communications system shall comply with anyand all applicable FCC and ITU regulations.
FCC,ITU Inspection
67

3.3.5 Thermal
The thermal control system will rely on a thermal budget listing all components by
their required operating temperature ranges, such as the preliminary version shown
in Figure 3.8 below. Once these have been confirmed as appropriate or adjusted
after testing has been carried out, the subsystem will be responsible for monitoring
internal temperatures, maintaining all components within their required ranges, and
reporting back temperatures as part of the GSIP health data, as described by the
thermal requirements laid out in Table 3.9 below.
It is expected based on current data that the average internal temperature of
the GSIP system will stay within a range between -20°C and +25°C throughout the
mission, allowing for some variation in temperatures during different mission phases
and due to seasonal effects. The CompactFlash memory card will be maintained at a
temperature of at least 0°C, as it is the least resilient component to low temperatures
according to its datasheet.35 The ICL microseismometers will be tested at higher op-
erating temperatures if thermal simulations show there is a reasonable probability of
GSIP internal temperatures exceeding +25°C. The temperature of each GSIP unit at
switch-on prior to deployment should fall within the same range of -20°C and +25°C
to ensure every component is within its storage temperature range. The external
temperature on the Ross Ice Shelf falls within this range for the majority of the year,
with only periods of unusually low temperatures exceeding these limits;34 this means
that GSIP should be within its operational temperature limits if it is at the ambient
temperature prior to deployment, as air deployment will not be scheduled during pe-
riods of uncharacteristically low temperatures.
68

Table 3.8: GSIP thermal budget
ComponentMinimumtemperature[°C]
Maximumtemperature[°C]
ICL SEIS microseismometers39 -123 +25Omnicel ER34615 batteries36 -55 +85Cypress PSoC 5LP40 -40 +85ADXL 377 impact sensor41 -40 +85BNO055 tilt sensor42 -40 +85Septentrio AsteRx-m OEM GPS receiver43 -40 +85SAF5350-A Iridium antenna44 -40 +85Topcon PG-A1 GPS antenna32 -40 +55Iridium 9523 transceiver33 -30 +70CompactFlash 8 GB memory card (operating)35 0 +60CompactFlash 8 GB memory card (storage)35 -20 +85
Detailed thermal modelling will be carried out prior to construction of the GSIP
prototype in order to distribute internal components appropriately according to their
operating temperature ranges, although at this time no selected components require
a range that is significantly narrower than the average. However, if design updates
are made, this will be taken into account for new components. Another important
focus of this modelling will be to ensure that excessive heat radiation into the snow
pack does not occur in order to prevent decoupling and loss of accurate seismic data.
Table 3.9: Thermal requirements
ID Thermal requirement Source Verification
THE1Thermal control system shall maintain all sub-systems within their specified operational designtemperature range.
SYS4,SYS12 Test
THE2Thermal control system shall monitor and reporttemperatures as part of health data reported backto the ground station.
SYS14 Demonstration
THE3Internal components of the GSIP system shall op-erate within an average temperature range of -20°C to +25°C.
THE1,SYS12 Demonstration
THE4The CompactFlash memory card used for datastorage shall operate within a temperature rangeof 0°C to +25°C.
THE1,SYS12,Specsheet35
Demonstration
69

ID Thermal requirement Source Verification
THE5 GSIP shall be within operational temperaturelimits at switch-on to power on subsystems.
THE1,POW7 Test
THE6GSIP shall not externally radiate more than TBDW in any mission phase to avoid melting ice anddecoupling from the snow pack.
SYS3 Test
THE7Thermal control system shall have a maxi-mum/peak power draw not exceeding 1 W in anymission phase.
POW2,Powerbudget
Test
THE8
Electronic components shall be distributed be-tween the forebody and afterbody as determinedby detailed thermal modelling to remain withintheir specified operational design temperatureranges.
THE1,THE4 Analysis
THE9Thermal control system shall survive the environ-mental conditions and loading of pre-deployment,impact and operational mission phases.
SYS10,SYS11,SYS12
Test
3.3.6 Avionics
The need for each GSIP deployment to last a full year drives the requirements for
the avionics system, summarised below in Table 3.10. Each penetrator will need to
operate with a high degree of autonomy, configuring and operating the GPS and
seismic sensors to collect, timestamp and transmit out research data, as well as op-
erating a variety of health sensors to generate and send housekeeping data on the
current status of the penetrator back to the ground station. The system will also be
capable of accepting and executing remote commands as well as being designed to be
reprogrammable, in case of error, occurrence of unexpected events, or desired system
updates. To ensure that the mission is successfully fulfilled and lasts a minimum of
one full year, GSIP will need to track and report power and battery status including
any fault messages, and be capable of transitioning into a safe mode based on current
health status or ground commands.
The initial avionics design during the period of the 16.83/16.831 class was a Linux-
based design, but a self-imposed requirement for the project was the transition to a
70

real-time operating system (RTOS) design with the advantage of much lower power
requirements. An RTOS also allows for consistency of task timing and avoidance
of interruptions to the continuous data collection for the mission. The RTOS will
operate two PSoCs (Programmable System-on-Chip) in parallel, one devoted to data
collection and the other primarily devoted to communications tasks. RTOS task pri-
oritisation will help to ensure that high-priority events such as the data collection
required for the mission or the receipt of remote commands cannot be interrupted
by other lower-priority processes. For example, safeguarding the continuous mea-
surement of seismic and positioning data without interruption is crucial to mission
success, whereas if a scheduled data transmission cannot occur for some reason, the
data will be stored and transmitted at a later time.
Table 3.10: Avionics requirements
ID Avionics requirement Source Verification
AVI1Avionics system shall be capable of controllingautonomous data collection, processing, storageand transmission.
SYS13,SYS7 Demonstration
AVI2Avionics system shall support a timer/clock withtime resolution of 0.1 seconds or better, synchro-nised to GPS time.
PAY1 Demonstration
AVI3Housekeeping task shall generate telemetry pack-ets containing GSIP health information, includ-ing fault messages as appropriate.
SYS14,SYS7 Demonstration
AVI4 Software shall be able to configure and operatethe GPS payload.
SYS13,SYS2 Demonstration
AVI5 Software shall be able to configure and operatethe microseismometer payload.
SYS13,SYS3 Demonstration
AVI6 Software shall be reprogrammable. Self-imposed Demonstration
AVI7
Software shall operate full communication func-tionality with the ground station via Iridium asrequired to downlink all gathered health and pay-load telemetry.
COM1,SYS7 Test
AVI8Software shall operate full communication func-tionality with the ground station via Iridium asrequired to uplink remote commands.
COM1,AVI6 Test
71

ID Avionics requirement Source Verification
AVI9 Software shall fully operate all sensors and sub-systems including hardware drivers. SYS13 Demonstration
AVI10 Software shall monitor, manage and report bat-tery conditions. SYS14 Demonstration
AVI11 Software shall be capable of timestamping data.
SYS2,SYS3,PAY1,SYS14
Demonstration
AVI12
Software shall be capable of real-time operationon the flight processor, utilising 2 PSoCs in par-allel to fulfil science tasks and communicationsneeds.
Self-imposed Inspection
AVI13Software shall be able to initiate and manage asafe mode based on monitoring GSIP health andstatus and ground commands.
SYS13 Demonstration
AVI14
Software shall enforce proper timing and execu-tion of all bus tasks from software schedules orground commands with appropriate additionalchecks.
SYS13 Demonstration
AVI15Avionics system shall survive the environmentalconditions and loading of pre-deployment, impactand operational mission phases.
SYS10,SYS11,SYS12
Test
72

Chapter 4
Penetration dynamics
4.1 Background
Sandia National Laboratories’ terradynamics work in the 1960s led to the 1967 publi-
cation of C.W. Young’s penetration equations, which were empirically derived based
on an experimental database of soil penetration, with the aim of modelling deceler-
ation and predicting penetration depth into soil or rock. These equations have been
periodically updated in the intervening decades, with the most recent version pub-
lished in 1997. Newer versions have modified the equations to better fit the available
data for different impact media, refined calculations to include penetration of lay-
ered target media and penetrators with more complex geometries such as brakes or
separable designs, and expanded upon the original set of equations to include other
geomaterials such as ice and frozen soil, as well as concrete.45
The Young equations are not applicable to materials other than those listed, as
the system is derived from a database of experimental results with the equations de-
veloped to fit the results as closely as possible. This has led to the development of
two separate sets of equations: one for soil, rock or concrete penetration, and the
other for ice or frozen soil penetration. A factor called the index of penetrability or
‘S-number’ corresponds to the amount of resistance to penetration offered by different
materials; a material with an S-number of 1.0 would be twice as hard to penetrate
73

as one with an S-number of 2.0, and a penetrator would experience twice as high a
deceleration level upon penetrating the 1.0 material compared to the 2.0 material.45
The guidelines for estimating S-numbers for soil and ice were examined with the
aim of theoretically predicting what a reasonable S-number range for snow might be.
The S-number range for ice is relatively narrow, cited as typically falling between
4.25-4.75. Although the database for soil penetration is very extensive compared to
the available data for other materials, Young states that estimating an S-number for
soil is more difficult than for other materials, partly due to the varying mixture of silt,
clay, sand and other components that may make up the soil, the effect of moisture
content, the level of cementing or looseness of the soil, and the general variation in
soil microstructure that may be encountered in different samples. The most relevant
ranges specified in Young’s table of soil penetrability values were S-number values of
10-20 for moist to wet silt/clay or loose topsoil, 20-30 for soft, saturated clay, and
30-60 for marine clay sediments. However, it is also highlighted that for very soft
materials with S-numbers higher than 60, Young’s penetration equations are unlikely
to be applicable. In general, the applicability of the equations is not known when
they are applied to materials other than those used to develop the system of calcu-
lations, as the accuracy of the equations is very strongly tied to the accuracy of the
S-number used as an input. For soil, concrete, ice or frozen soil, the inaccuracy of the
equations is about 10%, but it is assumed that this increases for very hard or very
soft materials that would be classified at the outer edges of the range of applicability.45
Aside from the S-number, the inputs required by Young’s equations to calculate
penetration depth consist of a ‘nose performance coefficient’ N based on the nosecone
shape, penetrator mass m, penetrator cross-sectional area A and impact velocity V,
as shown below. Equation 4.1 is the penetration equation for soil, rock or concrete
targets with an impact velocity below 61 m/s, while Equation 4.2 is the equation for
ice or frozen soil targets in the same impact velocity range.
74
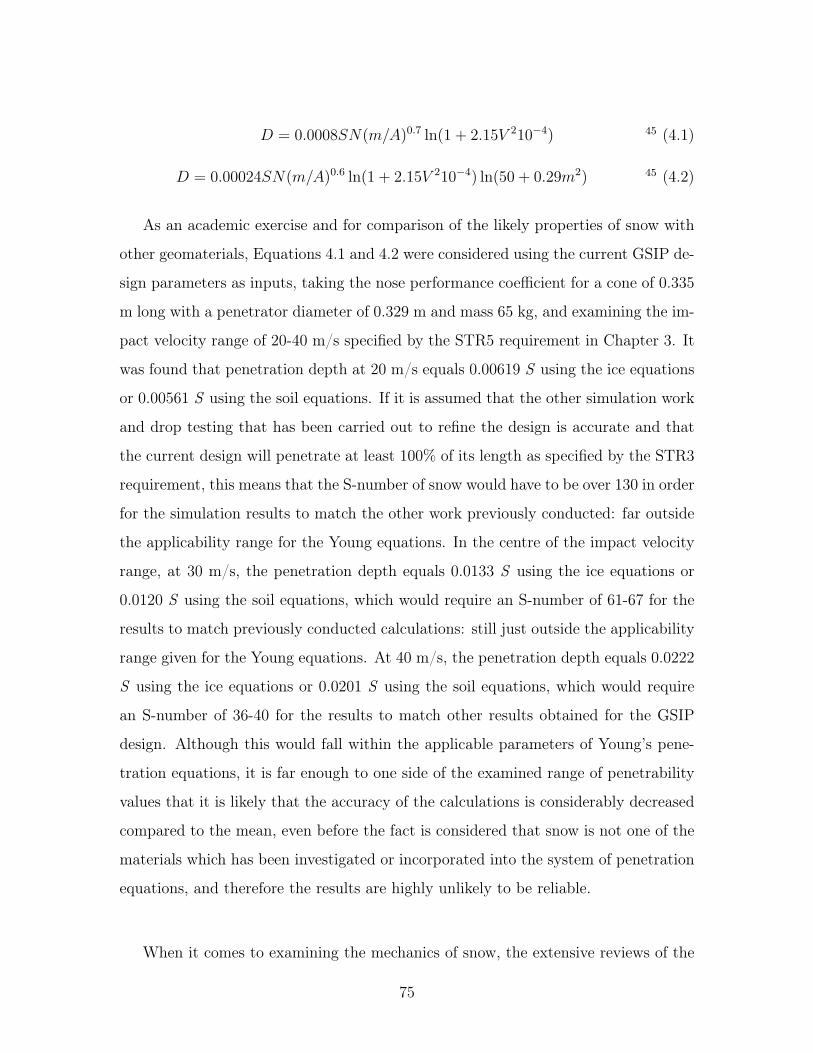
𝐷 = 0.0008𝑆𝑁(𝑚/𝐴)0.7 ln(1 + 2.15𝑉 210−4) 45 (4.1)
𝐷 = 0.00024𝑆𝑁(𝑚/𝐴)0.6 ln(1 + 2.15𝑉 210−4) ln(50 + 0.29𝑚2) 45 (4.2)
As an academic exercise and for comparison of the likely properties of snow with
other geomaterials, Equations 4.1 and 4.2 were considered using the current GSIP de-
sign parameters as inputs, taking the nose performance coefficient for a cone of 0.335
m long with a penetrator diameter of 0.329 m and mass 65 kg, and examining the im-
pact velocity range of 20-40 m/s specified by the STR5 requirement in Chapter 3. It
was found that penetration depth at 20 m/s equals 0.00619 S using the ice equations
or 0.00561 S using the soil equations. If it is assumed that the other simulation work
and drop testing that has been carried out to refine the design is accurate and that
the current design will penetrate at least 100% of its length as specified by the STR3
requirement, this means that the S-number of snow would have to be over 130 in order
for the simulation results to match the other work previously conducted: far outside
the applicability range for the Young equations. In the centre of the impact velocity
range, at 30 m/s, the penetration depth equals 0.0133 S using the ice equations or
0.0120 S using the soil equations, which would require an S-number of 61-67 for the
results to match previously conducted calculations: still just outside the applicability
range given for the Young equations. At 40 m/s, the penetration depth equals 0.0222
S using the ice equations or 0.0201 S using the soil equations, which would require
an S-number of 36-40 for the results to match other results obtained for the GSIP
design. Although this would fall within the applicable parameters of Young’s pene-
tration equations, it is far enough to one side of the examined range of penetrability
values that it is likely that the accuracy of the calculations is considerably decreased
compared to the mean, even before the fact is considered that snow is not one of the
materials which has been investigated or incorporated into the system of penetration
equations, and therefore the results are highly unlikely to be reliable.
When it comes to examining the mechanics of snow, the extensive reviews of the
75
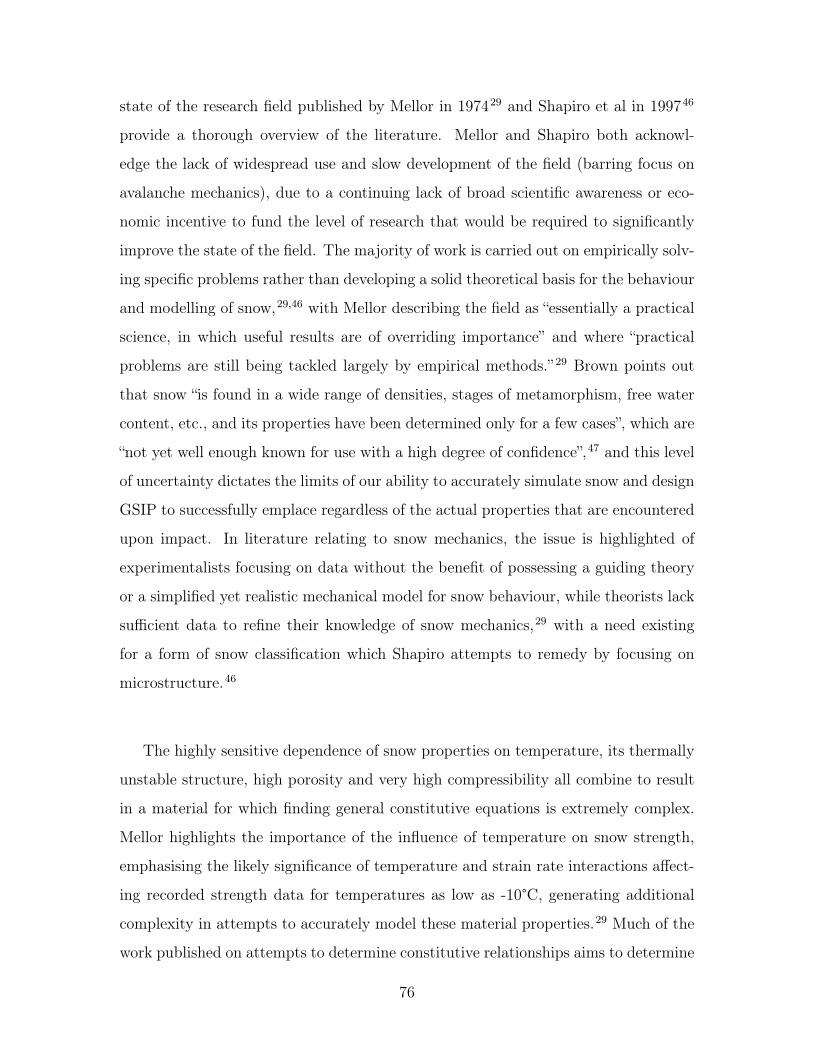
state of the research field published by Mellor in 197429 and Shapiro et al in 199746
provide a thorough overview of the literature. Mellor and Shapiro both acknowl-
edge the lack of widespread use and slow development of the field (barring focus on
avalanche mechanics), due to a continuing lack of broad scientific awareness or eco-
nomic incentive to fund the level of research that would be required to significantly
improve the state of the field. The majority of work is carried out on empirically solv-
ing specific problems rather than developing a solid theoretical basis for the behaviour
and modelling of snow,29,46 with Mellor describing the field as “essentially a practical
science, in which useful results are of overriding importance” and where “practical
problems are still being tackled largely by empirical methods.” 29 Brown points out
that snow “is found in a wide range of densities, stages of metamorphism, free water
content, etc., and its properties have been determined only for a few cases”, which are
“not yet well enough known for use with a high degree of confidence”,47 and this level
of uncertainty dictates the limits of our ability to accurately simulate snow and design
GSIP to successfully emplace regardless of the actual properties that are encountered
upon impact. In literature relating to snow mechanics, the issue is highlighted of
experimentalists focusing on data without the benefit of possessing a guiding theory
or a simplified yet realistic mechanical model for snow behaviour, while theorists lack
sufficient data to refine their knowledge of snow mechanics,29 with a need existing
for a form of snow classification which Shapiro attempts to remedy by focusing on
microstructure.46
The highly sensitive dependence of snow properties on temperature, its thermally
unstable structure, high porosity and very high compressibility all combine to result
in a material for which finding general constitutive equations is extremely complex.
Mellor highlights the importance of the influence of temperature on snow strength,
emphasising the likely significance of temperature and strain rate interactions affect-
ing recorded strength data for temperatures as low as -10°C, generating additional
complexity in attempts to accurately model these material properties.29 Much of the
work published on attempts to determine constitutive relationships aims to determine
76

numerical parameters for these equations in order to accurately describe the reaction
of snow under loading. Earlier research in this area focuses on macroscopic deforma-
tion processes, but more recent publications have studied deformational behaviour at
the microstructural level, recognising the importance of changes in bonding, sintering
and grain arrangement and the complex resulting effects on behaviour at the larger
scale.46
Attempting to define failure criteria for snow is similarly fraught, due to a lack
of coherent definition of ‘yield’ or ‘rupture’ states compared to many other materi-
als, and due to the occurrence of very different behaviour under compression when
compared to other granular materials or solids. For many applications of snow me-
chanics, it is not useful to designate this irreversible volumetric strain as the point of
‘failure’.47 The definition of failure itself is not consistent within mechanics, as it is
frequently used simply to denote the point during loading where material conditions
are no longer satisfactory for the specific application being considered, which may
consist of a large strain value, a high strain rate, material rupture, or a rapid decline
in load-bearing ability. Within snow mechanics, failure might consist of shear separa-
tion, tensile separation, increase in strain rate or volumetric collapse under loading,
depending on the particular problem under investigation. Without a clear and widely
applicable definition of failure, it becomes more difficult to precisely define the con-
cept of strength as a material property for snow.29
For low stress values, snow deformation may be modelled in a similar fashion to
other solids, but the mechanical properties dramatically change once significant, ir-
reversible volumetric strain begins to occur. The high irreversible compressibility of
snow is its most distinctive mechanical property compared to other materials, includ-
ing ice, with which it otherwise shares many similarities. For solid materials such
as metals, rock or concrete, volumetric strains under loading are usually small and
mostly reversible until conditions close to the point of material failure are experienced.
The irreversible compressive strain undergone by snow results in a need to include
77
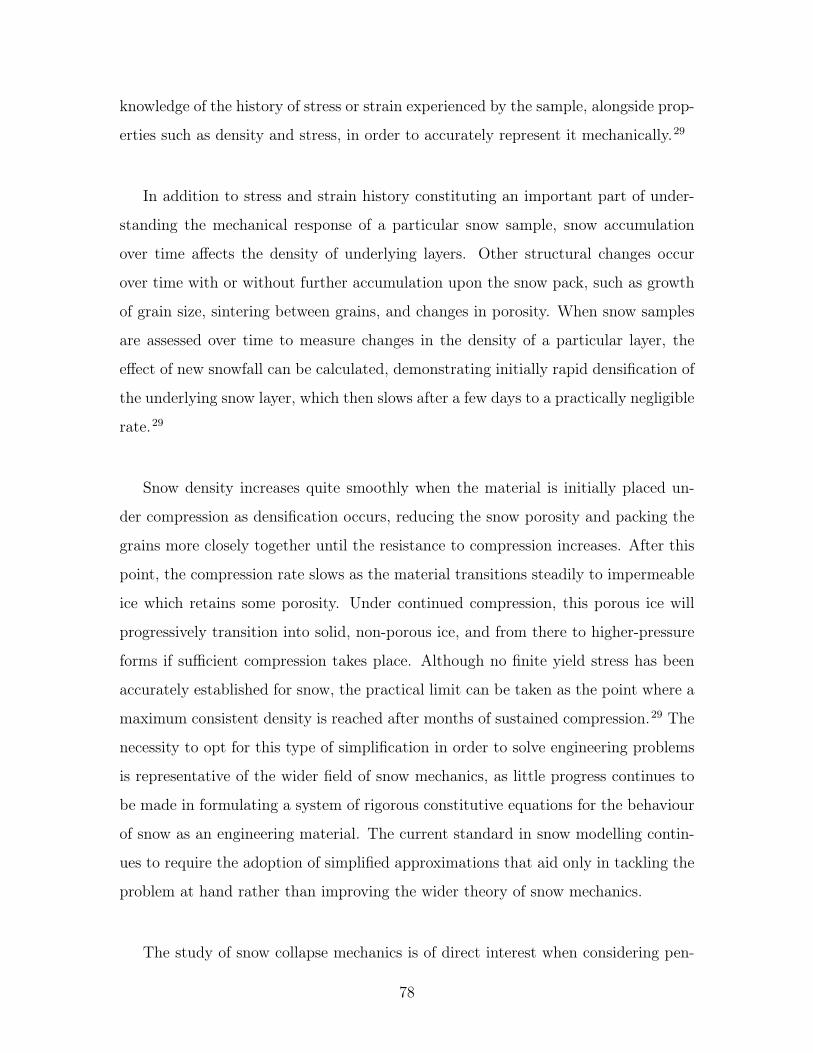
knowledge of the history of stress or strain experienced by the sample, alongside prop-
erties such as density and stress, in order to accurately represent it mechanically.29
In addition to stress and strain history constituting an important part of under-
standing the mechanical response of a particular snow sample, snow accumulation
over time affects the density of underlying layers. Other structural changes occur
over time with or without further accumulation upon the snow pack, such as growth
of grain size, sintering between grains, and changes in porosity. When snow samples
are assessed over time to measure changes in the density of a particular layer, the
effect of new snowfall can be calculated, demonstrating initially rapid densification of
the underlying snow layer, which then slows after a few days to a practically negligible
rate.29
Snow density increases quite smoothly when the material is initially placed un-
der compression as densification occurs, reducing the snow porosity and packing the
grains more closely together until the resistance to compression increases. After this
point, the compression rate slows as the material transitions steadily to impermeable
ice which retains some porosity. Under continued compression, this porous ice will
progressively transition into solid, non-porous ice, and from there to higher-pressure
forms if sufficient compression takes place. Although no finite yield stress has been
accurately established for snow, the practical limit can be taken as the point where a
maximum consistent density is reached after months of sustained compression.29 The
necessity to opt for this type of simplification in order to solve engineering problems
is representative of the wider field of snow mechanics, as little progress continues to
be made in formulating a system of rigorous constitutive equations for the behaviour
of snow as an engineering material. The current standard in snow modelling contin-
ues to require the adoption of simplified approximations that aid only in tackling the
problem at hand rather than improving the wider theory of snow mechanics.
The study of snow collapse mechanics is of direct interest when considering pen-
78

etration. The effect of applying a compressive load to the surface of a semi-infinite
snow volume leads to a series of consecutive but discontinuous collapse events, rather
than a steady strain rate over time.29 When penetration occurs, the kinetic energy is
expended in breaking bonding between snow grains, lateral snow displacement and
annular compaction that reduces porosity and increases density in the area immedi-
ately surrounding the penetrator. The width of this affected area of densified snow
has not been proved in previous investigations to linearly correlate to measured snow
strength, instead appearing to be a complex function related to snow density.29,46
The lack of a rigorous theoretical relation between the material properties leads to
researchers instead focusing on using empirical data to solve issues related to pene-
tration.
This focus on empirical data is nonetheless useful in determining correlations
between certain properties that allow for predictions to be made about the deploy-
ment of penetrators into the Antarctic snow pack. For example, if a linear relation-
ship between uniaxial compressive strength and Young’s modulus can be established
from snow sampling, then the Young’s modulus could be remotely surveyed over the
Ross Ice Shelf using acoustic instruments such as those already deployed in various
Antarctic research missions.29 This would allow for remote sensing predictions of snow
strength to be used to tune the emplacement of the penetrator more accurately than
is currently possible, by targeting a narrower range of expected snow properties to
achieve the desired penetration depth.
Mellor highlights that materials science failure theories tend to focus on the ef-
fect of flaws or structural defects on material strength,29 and this leads into Shapiro’s
more recent approach of considering the importance of bonding and microstructure in
determining material properties. Given the lack of general constitutive relationships
established for snow, Shapiro places emphasis on the practical applications of snow
mechanics, focusing on collecting additional data on snow behaviour under loading
and classifying snow types based on microstructural properties that affect its physical
79
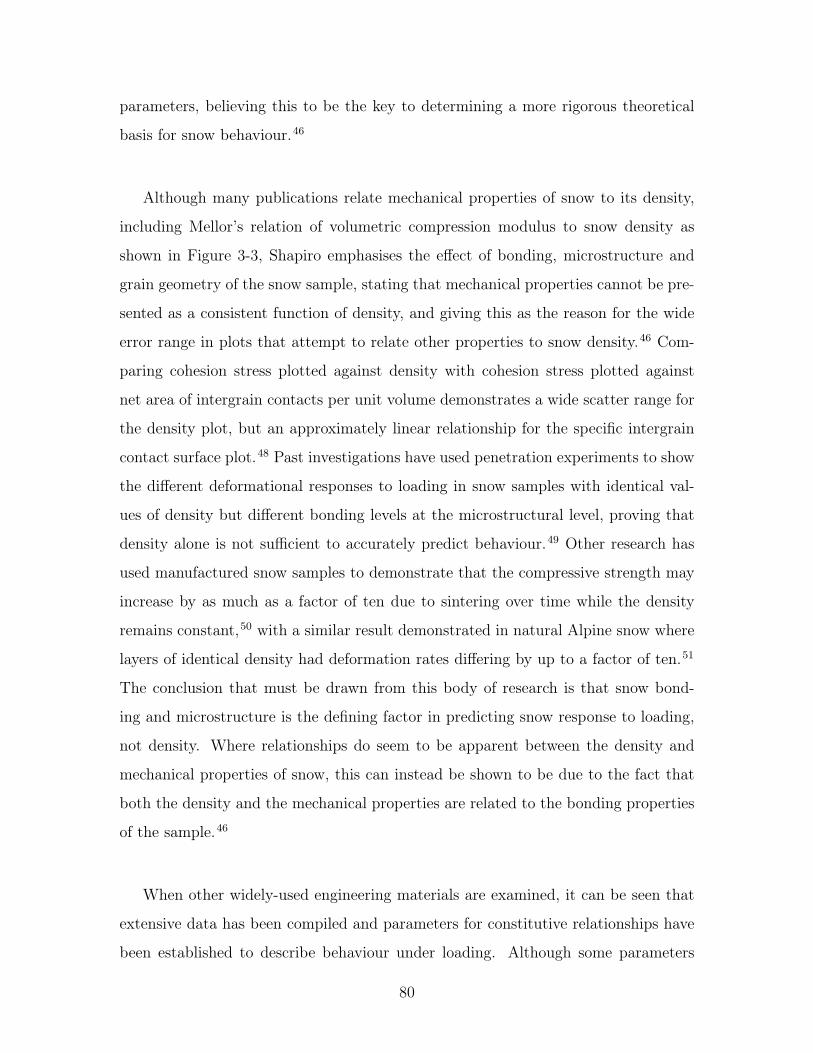
parameters, believing this to be the key to determining a more rigorous theoretical
basis for snow behaviour.46
Although many publications relate mechanical properties of snow to its density,
including Mellor’s relation of volumetric compression modulus to snow density as
shown in Figure 3-3, Shapiro emphasises the effect of bonding, microstructure and
grain geometry of the snow sample, stating that mechanical properties cannot be pre-
sented as a consistent function of density, and giving this as the reason for the wide
error range in plots that attempt to relate other properties to snow density.46 Com-
paring cohesion stress plotted against density with cohesion stress plotted against
net area of intergrain contacts per unit volume demonstrates a wide scatter range for
the density plot, but an approximately linear relationship for the specific intergrain
contact surface plot.48 Past investigations have used penetration experiments to show
the different deformational responses to loading in snow samples with identical val-
ues of density but different bonding levels at the microstructural level, proving that
density alone is not sufficient to accurately predict behaviour.49 Other research has
used manufactured snow samples to demonstrate that the compressive strength may
increase by as much as a factor of ten due to sintering over time while the density
remains constant,50 with a similar result demonstrated in natural Alpine snow where
layers of identical density had deformation rates differing by up to a factor of ten.51
The conclusion that must be drawn from this body of research is that snow bond-
ing and microstructure is the defining factor in predicting snow response to loading,
not density. Where relationships do seem to be apparent between the density and
mechanical properties of snow, this can instead be shown to be due to the fact that
both the density and the mechanical properties are related to the bonding properties
of the sample.46
When other widely-used engineering materials are examined, it can be seen that
extensive data has been compiled and parameters for constitutive relationships have
been established to describe behaviour under loading. Although some parameters
80
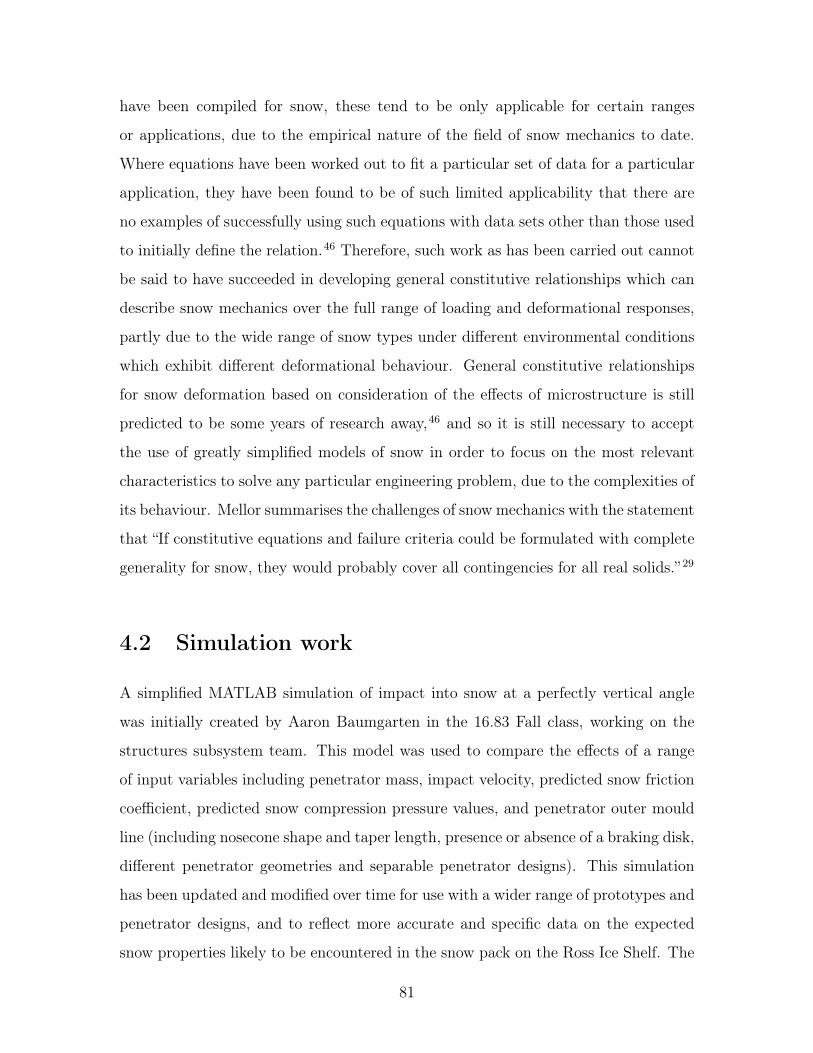
have been compiled for snow, these tend to be only applicable for certain ranges
or applications, due to the empirical nature of the field of snow mechanics to date.
Where equations have been worked out to fit a particular set of data for a particular
application, they have been found to be of such limited applicability that there are
no examples of successfully using such equations with data sets other than those used
to initially define the relation.46 Therefore, such work as has been carried out cannot
be said to have succeeded in developing general constitutive relationships which can
describe snow mechanics over the full range of loading and deformational responses,
partly due to the wide range of snow types under different environmental conditions
which exhibit different deformational behaviour. General constitutive relationships
for snow deformation based on consideration of the effects of microstructure is still
predicted to be some years of research away,46 and so it is still necessary to accept
the use of greatly simplified models of snow in order to focus on the most relevant
characteristics to solve any particular engineering problem, due to the complexities of
its behaviour. Mellor summarises the challenges of snow mechanics with the statement
that “If constitutive equations and failure criteria could be formulated with complete
generality for snow, they would probably cover all contingencies for all real solids.” 29
4.2 Simulation work
A simplified MATLAB simulation of impact into snow at a perfectly vertical angle
was initially created by Aaron Baumgarten in the 16.83 Fall class, working on the
structures subsystem team. This model was used to compare the effects of a range
of input variables including penetrator mass, impact velocity, predicted snow friction
coefficient, predicted snow compression pressure values, and penetrator outer mould
line (including nosecone shape and taper length, presence or absence of a braking disk,
different penetrator geometries and separable penetrator designs). This simulation
has been updated and modified over time for use with a wider range of prototypes and
penetrator designs, and to reflect more accurate and specific data on the expected
snow properties likely to be encountered in the snow pack on the Ross Ice Shelf. The
81

MATLAB model has also been updated to allow for the simulation of soil penetration
as well as snow penetration, and further details of this work on modelling soil impact
are described in Chapter 5.
The simulation utilises the forward Euler method to simulate impact into the
snow pack, a first-order numerical method for approximating the solution of ordinary
differential equations. This is an explicit method which uses known initial values with
temporal discretisation, integrating each term of the general equations over discrete
time steps to predict the future state of the system. The fact that the procedure is
first-order results in an error which is dependent on the selected time step size; error
at any given time is proportional to the step size, while error per step is proportional
to the square of the step size. The necessary simplification of the snow mechanics
involved results in the adoption of a constant compaction model which is usually
used to model elastic compaction. This is used rather than modelling the plastic
compaction which is actually occurring throughout the impact, which would tradi-
tionally be assumed to be occurring at a non-constant rate for a standard engineering
material. This allows for the assumption of a constant pressure exerted by the snow
pack against the penetrator body as penetration occurs.
Snow compression strength on the Ross Ice Shelf was predicted to be in the range
of 1-90 kPa, based on the data shown in Figures 3-2 and 3-3 and discussed in Section
3.3.1. Background literature was used to find quoted values for a snow kinetic fric-
tion coefficient “at moderate speeds” of between 0.1 and 0.3 for steel acting against
snow;29 although GSIP is designed with an outer shell made of Al-6061, it was as-
sumed that the friction values for steel would be a closer match than those specified
for other types of materials such as wood, beeswax, or various polymers. At “low
sliding speeds”, this was reduced to approximately 0.12-0.13 for steel, again with no
value given for aluminium.29 A moderate impact speed was assumed for the process
of GSIP penetration and therefore the centre of the specified steel friction range was
used, with a kinetic friction coefficient of 0.2 assumed for the simulation of snow pen-
82

etration, although calculations were also run using other friction values to compare
the effect on outcome. If further testing in snow gathers empirical data on friction
values that differ significantly from those used in the simulation, this model may eas-
ily be updated and rerun at a later date to incorporate more accurate information on
frictional properties between snow and aluminium.
Anderson calculates the force 𝐹𝑅 of the impact medium’s resistance to penetration
as shown in Equation 4.3, where 𝜎 is its compressive strength, 𝜇𝑓 is its dimensionless
friction coefficient, 𝐴𝑥 is the cross-sectional area of the penetrator and 𝐴𝑠 is the
penetrator’s side surface area in contact with the impact medium at a given time.52
𝐹𝑅 = 𝜎(𝐴𝑥 + 𝜇𝑓𝐴𝑠)52 (4.3)
In the GSIP MATLAB simulation, the outer mould line of the penetrator is mod-
elled incorporating the nosecone shape and taper length, the outer dimensions of the
penetrator itself, and the presence or absence of a braking disk or separable afterbody
as desired. Equation 4.3 is used to calculate the snow resistance to penetration, and
for every time step where the penetrator velocity is still greater than zero, the force
of the newest part of the penetrator is added to the existing force of the penetrator
that has already entered the snow to create a new cumulative total. This is used
to generate a sensitivity analysis with 2 degrees of freedom, plotting g-loading and
penetration depth results against snow compression strength ranging up to 100 kPa
and impact velocity in a range from 0-50 m/s.
4.2.1 Simulation results
Plots were generated to illustrate the effect of different variables on the g-loading
experienced by the penetrator upon impact into the snow, and on the penetration
depth achieved at a range of impact velocities. These variables included applying dif-
ferent friction coefficients to the model, changing nosecone length, designing different
penetrator geometries of various diameters, and assuming different mass values for
83

the afterbody based on the use of various materials for the outer shell. Figures of
these plots are included in the following pages and are followed by a brief analysis of
the relations shown.
84

Figure 4-1: Comparison of effects of using 0.1/0.2/0.3 friction coefficient in model onpredicted g-loading, over a range of impact velocities and snow compressive pressurevalues
85

Figure 4-2: Comparison of effects of using 0.1/0.2/0.3 friction coefficient in model onpredicted penetration depth, over a range of impact velocities and snow compressivepressure values
86

In Figures 4-1 and 4-2, the effects of using different snow friction coefficients
as one of the model inputs were examined. Figure 4-1 shows a comparison of snow
friction coefficients of 0.1, 0.2 and 0.3, comparing the full range of values given for the
friction of steel against snow at moderate speeds, with the effect on g-loading shown
on the left plot and the outer mould line of the penetrator forebody shown on the
right. These plots illustrate that higher g-loading is predicted when a lower friction
coefficient is used, with the effect most noticeable at impact velocities below 10 m/s,
but with variation in snow resistance having a much greater effect. There appears
to be little variation in g-loading at different impact velocities above 10 m/s. It is
possible that this prediction represents an anomaly in the simulation, as using a lower
friction coefficient results in deeper penetration, with the penetrator decelerating over
a larger distance, which would usually be expected to result in lower g-loading. The
effect is only visible at low impact velocities and high snow compressive pressure
values, so this potential anomaly is currently unexplained and should be investigated
in future work, especially if it is determined that using a lower friction coefficient
would improve the accuracy of the simulation. The overall level of g-loading remains
low, with the highest values experienced at a 0.1 friction coefficient still below 15 G.
Figure 4-2 shows a comparison of the effect of snow friction coefficients on predictions
of penetration depth, shown on the left plot. As would be expected, the penetrator
emplaces more deeply when a lower friction coefficient is applied to the simulation.
At the highest snow strength of 100 kPa and at 30 m/s impact velocity, GSIP is
predicted to emplace at a depth of approximately 2.5 m with a friction coefficient of
0.1, 1.8 m with a coefficient of 0.2, and 1.5 m with a coefficient of 0.3.
87

Figure 4-3: Comparison of 16.76/33.52/50.28 cm nosecone taper length effect onpredicted g-loading, over a range of impact velocities and snow compressive pressurevalues
88

Figure 4-4: Comparison of 16.76/33.52/50.28 cm nosecone taper length effect onpredicted penetration depth, over a range of impact velocities and snow compressivepressure values
89

In Figures 4-3 and 4-4, the effects of selecting nosecones of different taper lengths
were examined. Figure 4-3 compares nosecone lengths of 16.76 cm, 33.52 cm and 50.28
cm, with the predictions of g-loading shown on the left plot and outer mould line of
the penetrator forebody shown on the right, illustrating the variation in shape. These
plots demonstrate that a shorter nosecone results in higher g-loading experienced by
the penetrator, although the effect is again the most pronounced at impact velocities
below 10 m/s. G-loading levels remain around 15 G or lower regardless of which
of the taper lengths is considered. Figure 4-4 shows a comparison of the effects of
nosecone taper length on predicted penetration depth, shown on the left plot. This
illustrates that a shorter nosecone is predicted to emplace more deeply than a longer
nosecone – for example, at a lower snow strength of 10 kPa and an impact velocity of
20 m/s, the penetrator with the shorter nosecone is predicted to penetrate to a depth
of approximately 6.5 m, while the penetrator with the longer nosecone is predicted
to penetrate to a depth of around 5.5 m.
90
Fig
ure
4-5:
Com
pari
son
ofeff
ect
ofva
riou
sfo
rebo
dyge
omet
ries
onpr
edic
ted
g-lo
adin
g,ov
era
rang
eof
impa
ctve
loci
ties
and
snow
com
pres
sive
pres
sure
valu
es
91

Fig
ure
4-6:
Com
pari
son
ofeff
ectof
vari
ousfo
rebo
dyge
omet
ries
onpr
edic
ted
pene
trat
ion
dept
h,ov
era
rang
eof
impa
ctve
loci
ties
and
snow
com
pres
sive
pres
sure
valu
es
92

Figure 4-7: Illustration of potential GSIP geometries, varying from 18 batteries perlayer for the narrowest design to 60 batteries per layer for the widest design
Different penetrator geometries were considered for GSIP, with the overall volume
driven by the need to contain a sufficient quantity of batteries to power the penetrator
for a full year (374 including margin, according to the power budget shown in Table
3.4). An illustration of these potential geometries is included in Figure 4-7, showing
the outer shell and with the greyed-out area reserved for wiring. Different designs
which were considered varied from a much narrower and longer forebody which would
only contain 18 batteries per layer, to wider but shorter versions containing 30 or 36
93

batteries per layer, to the widest and shortest design containing 60 batteries per layer.
Eventually the design with 60 batteries per layer was adopted, allowing for the cen-
tre of gravity of the penetrator to be lowered as far as possible in order to improve
stability upon impact into the snow pack, reducing the likelihood of the penetrator
emplacing at a considerable angle or failing to emplace at all.
In Figures 4-5 and 4-6, the effect of these different penetrator geometries upon
penetration was examined. Figure 4-5 shows a comparison of g-loading experienced
by the narrow penetrator (18 batteries per layer, 19.2 cm outer diameter, 1.90 m
long), the wide penetrator (30 batteries per layer, 24.8 cm outer diameter, 1.28 m
long), the wider penetrator (36 batteries per layer, 26.1 cm outer diameter, 1.15 m
long) and the widest penetrator (60 batteries per layer, 32.9 cm outer diameter, 0.809
m long). It can be seen from these plots that a wider penetrator results in higher
g-loading on the structure, with the highest level of g-loading (experienced at the
highest snow compressive strength of 100 kPa) for the narrow penetrator reaching
around 5 G, for the wide penetrator reaching around 7 G, for the wider penetrator
reaching around 8 G, and for the widest penetrator reaching a maximum of around
15 G. Figure 4-6 shows the penetration depth predicted for each different penetra-
tor geometry, demonstrating that as expected, a wider penetrator design will travel
less deeply into the snow. At a low snow compressive strength of 10 kPa and an
impact velocity of 20 m/s, the plot shows the prediction that the narrow penetrator
would travel around 10 m into the snow pack, the wide and wider penetrator would
both travel around 8-9 m into the snow pack, and the widest penetrator would travel
around 5 m deep.
Aside from considering different forebody geometries, it will also be important to
compare the penetration achieved by forebody and afterbody in order to determine
an optimal design length for the umbilical connection between the two, based on
the disparity in depth reached. The afterbody must also be designed to ensure that
requirement STR4 is met, keeping the antennas at an appropriate height above the
94
surface of the snow pack for successful transmission to occur throughout the mission
life. Further aerodynamic testing will be carried out to refine the afterbody design
to ensure it fulfils the STR5 requirement, possessing the necessary drag properties
to ensure that the terminal velocity of the system falls within the desired impact
velocity range of 20-40 m/s. However, preliminary calculations suggest that a diam-
eter of 0.9 m and a drag coefficient of 1.17 should achieve an impact velocity around
40 m/s, assuming a total system mass of 90 kg. Given the estimated forebody mass
of approximately 65 kg, this leaves around 25 kg for the afterbody in the mass budget.
The need for robustness to a wide range of snow compressive strengths that may
be encountered on the Ross Ice Shelf motivated the decision to design a separable pen-
etrator probe. The order-of-magnitude level of uncertainty about the snow properties
that may occur in the deployment area and the impossibility of measuring said prop-
erties prior to deployment drove the choice to separate the components with different
needs into two halves of the penetrator, allowing for the prioritisation of achieving
sufficient depth with the forebody for stable long-term seismic coupling while focusing
on decelerating the afterbody much more rapidly in order to place the antennas suf-
ficiently high above the surface that a full year of snow accumulation would not pose
an obstacle to transmitting out the collected data via the Iridium satellite network.
The widespread adoption of separable designs for various penetrator applications can
be seen in the background literature described in Chapter 2, with many previous pen-
etrator missions selecting such a design in order to improve robustness and flexibility
in the face of unknown impact media properties.
Assuming a bowl-shaped afterbody that is curved on the underside to avoid creat-
ing turbulence during the falling phase, an initial outline for the design was sketched
with a 0.9 m diameter and 0.6 m height, in order to place the antennas mounted on
the upper surface approximately 65 cm above the lowest point of the afterbody. This
design will be updated based on further aerodynamic and drop testing in order to
ensure that the antennas are positioned high enough depending on how far into the
95

snow the afterbody is expected to travel before stopping. This outline was used as
input for the outer mould line in the MATLAB impact simulation, and three different
materials were considered. Using the same Al-6061 alloy as the forebody, the after-
body mass is estimated at 28 kg: slightly higher than the 25 kg that was selected as
an initial mass target. If a significantly lighter afterbody is desirable, using carbon
fibre with a density of 1.6 g/cm³ results in a mass estimate of 17.5 kg, or using ABS
with a density of 1.07 g/cm³ results in a mass estimate of 12 kg.
Figures 4-8 and 4-9 show the effects of the different masses on predicted penetra-
tion occurring with the preliminary design for the afterbody geometry. Figure 4-8
shows the effect of the 12, 17.5 or 28 kg mass on g-loading, and it can be seen from
these plots that a heavier afterbody design results in lower g-loading. At 100 kPa
snow compressive strength and 30 m/s impact velocity, the 28 kg design is predicted
to experience around 170 G, the 17.5 kg design is predicted to experience around 230
G, and the 12 kg design is predicted to experience loading of around 280 G. Figure
4-9 shows the effect of the different masses on predicted penetration depth, and it can
be seen from the results that a lighter afterbody is predicted to penetrate less deeply
into the snow pack. This may be a useful correlation to consider when iterating the
design to ensure that the antennas are placed sufficiently high above the snow, as
reducing the mass of the afterbody will help to ensure that it travels less far into
the snow before stopping. For example, at a low snow compressive strength of 10
kPa and an impact velocity of 30 m/s, the 28 kg afterbody is predicted to penetrate
approximately 1.7 m into the snow, while the 17.5 kg afterbody is predicted to reach
around 1.2 m depth and the 12 kg afterbody is only predicted to penetrate around
0.85 m. These are significant penetration depths compared to the STR4 requirement
to position the GPS and Iridium antennas at least 65 cm above the surface, and so it
may be necessary to increase the afterbody diameter to decelerate more quickly upon
snow impact (while incorporating mesh or other structural components that allow for
the desired drag coefficient to be retained), or to incorporate other braking elements
such as disks or deployable snow brakes to increase the cross-sectional area impacting
the snow.
96

Figure 4-8: Comparison of 12/17.5/28 kg afterbody mass effect on predicted g-loading, over a range of impact velocities and snow compressive pressure values
97
Figure 4-9: Comparison of 12/17.5/28 kg afterbody mass effect on predicted pene-tration depth, over a range of impact velocities and snow compressive pressure values
98

4.3 Prototype/scale model drop testing
Drop testing was carried out at various points in the development of the GSIP pro-
totype, using different versions of the design as it was updated and refined over time.
These tests included work carried out by the 16.831 class with an earlier monolithic
penetrator design, dropping an ABS scale model into snow on the MIT campus in
February 2016, and dropping a full-scale aluminium prototype into snow at Sunday
River in Maine in April 2016. More recent testing was conducted at MIT Haystack
Observatory in early 2017 using the same full-scale aluminium prototype, and further
scale model testing (of the forebody only) was carried out on the MIT campus in
February 2017.
There were various issues with the testing methodology used in the 2016 drop tests
carried out by the class, leading to the collection of both some useful information and
some questionable results. G-loading data was recorded up to a maximum of 70 G,
suggesting that the requirements written for the GSIP project should be more than
adequately conservative to ensure that all components will survive impact. A lack of
consistency in how the angle of the final emplacement into the snow was measured
meant that accurate results were not collected on how the angle of the penetrator
changed between the falling and impact phases, as well as how it continued to change
during deceleration. However, high-speed video was recorded of some of the drop
tests and examination of this data highlighted significant problems with the perfor-
mance of the initial monolithic penetrator design, including a lack of aerodynamic
stability during the falling phase. In addition to this, it became rapidly obvious from
testing into snow that the high centre of gravity in the earlier GSIP design resulted
in the momentum of the penetrator carrying it over sideways if impact occurred at a
relatively small angle from vertical. This resulted in much higher emplacement angles
which are outside the PAY3 requirement, defined by the need for the seismometers
to be positioned within ±10° of vertical.
99
Previous research on penetration dynamics into planetary surfaces has examined
this issue, concluding that “the greatest deflection occurs while part of the penetrator
remains outside the target”, but also highlighting the effects of nonzero penetrator
angle of attack on attempted emplacement, where the long axis of the penetrator
is not in parallel with its velocity vector.52,53 Although studies in lunar soil found
that some successful penetrator emplacements could occur even at angles as high as
50°, the results of drop testing into snow showed that the same conclusion cannot
be drawn for snow penetrators. Although ricochet does not occur as would be much
more common in impact media with higher compressive strength values, the com-
bination of lower impact velocity speeds for GSIP and the much higher irreversible
compressibility of snow result in a large number of attempted emplacements where
the penetrator ends up in a near-horizontal position close to the surface of the snow
pack, where it fails to achieve any useful level of seismic coupling to the penetration
medium.
The necessity of lowering the centre of gravity in the penetrator design as part
of the mitigation strategy for the emplacement angle issue was one of the motivating
factors for the redesign which led to the adoption of a separable two-body design. The
design of the nosecone was also increased in sharpness compared to the original outer
mould line which had a more rounded tip to the cone, with the aim of establishing
more rapid stability in the snow emplacement during the initial impact, reducing mo-
bility within the snow and thereby improving the probability of emplacement success.
The separable design also allows for prioritisation during the design decisions made
affecting the afterbody geometry in order to emphasise aerodynamic stability and the
induction of sufficient drag to achieve the desired impact velocity range.
4.3.1 Scale model drop testing results (February 2017)
After sufficient snowfall occurred on the MIT campus in February 2017, drop testing
was carried out using a 35 cm long scale model of the forebody (a simple cylindrical
shape with conical nosecone). The snow was loosely piled up in order to create a
100
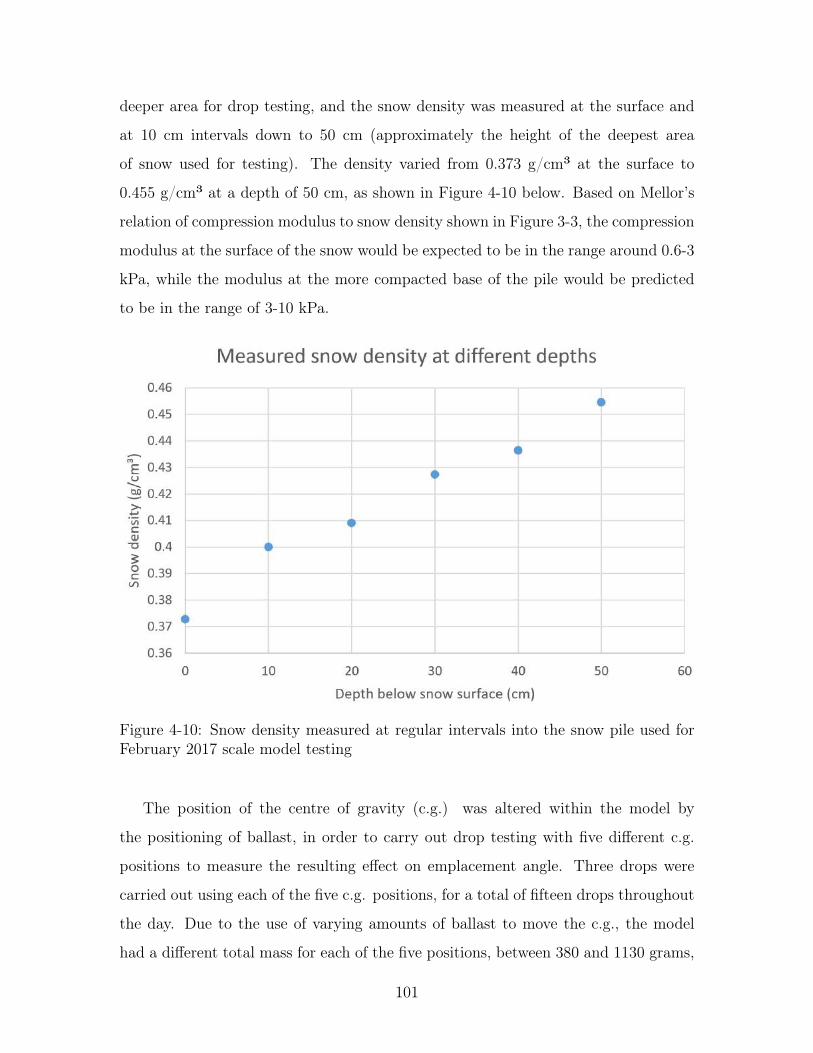
deeper area for drop testing, and the snow density was measured at the surface and
at 10 cm intervals down to 50 cm (approximately the height of the deepest area
of snow used for testing). The density varied from 0.373 g/cm³ at the surface to
0.455 g/cm³ at a depth of 50 cm, as shown in Figure 4-10 below. Based on Mellor’s
relation of compression modulus to snow density shown in Figure 3-3, the compression
modulus at the surface of the snow would be expected to be in the range around 0.6-3
kPa, while the modulus at the more compacted base of the pile would be predicted
to be in the range of 3-10 kPa.
Figure 4-10: Snow density measured at regular intervals into the snow pile used forFebruary 2017 scale model testing
The position of the centre of gravity (c.g.) was altered within the model by
the positioning of ballast, in order to carry out drop testing with five different c.g.
positions to measure the resulting effect on emplacement angle. Three drops were
carried out using each of the five c.g. positions, for a total of fifteen drops throughout
the day. Due to the use of varying amounts of ballast to move the c.g., the model
had a different total mass for each of the five positions, between 380 and 1130 grams,
101

which was recorded as part of the data collected. As would be expected from the
penetration, it can be seen from the results in Figure 4-11 below that the heaviest
models travelled furthest into the snow while the lighter models stopped at a shallower
emplacement depth.
Figure 4-11: Relation of scale model mass to measured penetration depth into snow
The effect of the different c.g. positions on final emplacement angle was investi-
gated, although as the scale model was only dropped from a low height into the snow
pile, a very low impact velocity of around 3-5 m/s was recorded and this was expected
to further exacerbate issues of emplacement occurring at significantly off-vertical an-
gles. Although the results showed some scatter and were not tightly clustered, a
general correlation between lower c.g. and improved impact angles can be seen from
the results in Figure 4-12 below. A possible explanation for the higher than expected
angles for the lowest c.g. is that this was the model which incorporated the least
amount of ballast, weighing only 380 grams total, and therefore penetrated the least
far into the snow (as can be seen by comparison to Figure 4-11 above). As previ-
ous research showed that the most amount of deflection occurred while part of the
penetrator is still exposed above the impact medium, it is reasonable to conclude
102
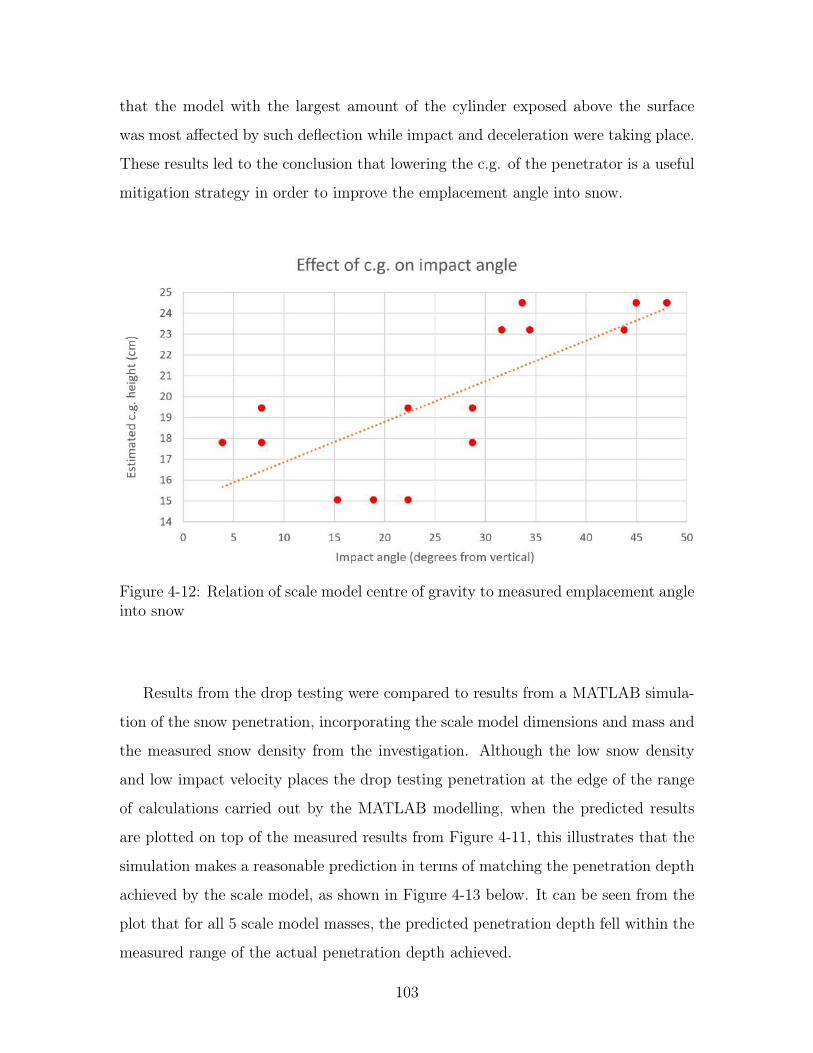
that the model with the largest amount of the cylinder exposed above the surface
was most affected by such deflection while impact and deceleration were taking place.
These results led to the conclusion that lowering the c.g. of the penetrator is a useful
mitigation strategy in order to improve the emplacement angle into snow.
Figure 4-12: Relation of scale model centre of gravity to measured emplacement angleinto snow
Results from the drop testing were compared to results from a MATLAB simula-
tion of the snow penetration, incorporating the scale model dimensions and mass and
the measured snow density from the investigation. Although the low snow density
and low impact velocity places the drop testing penetration at the edge of the range
of calculations carried out by the MATLAB modelling, when the predicted results
are plotted on top of the measured results from Figure 4-11, this illustrates that the
simulation makes a reasonable prediction in terms of matching the penetration depth
achieved by the scale model, as shown in Figure 4-13 below. It can be seen from the
plot that for all 5 scale model masses, the predicted penetration depth fell within the
measured range of the actual penetration depth achieved.
103
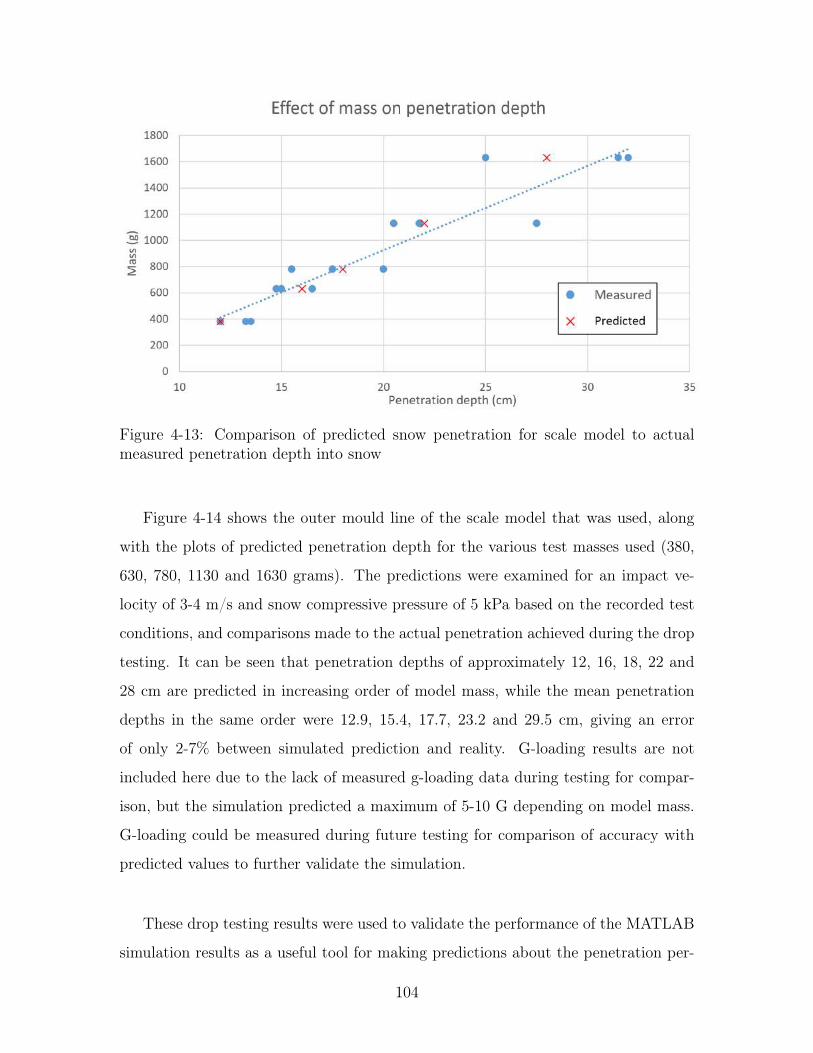
Figure 4-13: Comparison of predicted snow penetration for scale model to actualmeasured penetration depth into snow
Figure 4-14 shows the outer mould line of the scale model that was used, along
with the plots of predicted penetration depth for the various test masses used (380,
630, 780, 1130 and 1630 grams). The predictions were examined for an impact ve-
locity of 3-4 m/s and snow compressive pressure of 5 kPa based on the recorded test
conditions, and comparisons made to the actual penetration achieved during the drop
testing. It can be seen that penetration depths of approximately 12, 16, 18, 22 and
28 cm are predicted in increasing order of model mass, while the mean penetration
depths in the same order were 12.9, 15.4, 17.7, 23.2 and 29.5 cm, giving an error
of only 2-7% between simulated prediction and reality. G-loading results are not
included here due to the lack of measured g-loading data during testing for compar-
ison, but the simulation predicted a maximum of 5-10 G depending on model mass.
G-loading could be measured during future testing for comparison of accuracy with
predicted values to further validate the simulation.
These drop testing results were used to validate the performance of the MATLAB
simulation results as a useful tool for making predictions about the penetration per-
104

formance of various prototype designs. Further testing will be compared to simulation
results in order to discern if the error rate remains similarly low across a range of im-
pact velocities and snow compressive pressure values. Simulated predictions will also
be compared to future testing of design updates in order to ensure that the desired
properties are being achieved in the chosen design for the GSIP project.
105

Figure 4-14: Comparison of scale model mass effect on predicted penetration depth,over a range of impact velocities and snow compressive pressure values
106

Chapter 5
Soil penetrator probe
5.1 Introduction
The primary focus of this thesis so far has been on the design and development of an
Antarctic penetrator probe, which has been named the Geodetic Seismic Ice Penetra-
tor. The 16.83 and 16.831 senior capstone Space Systems Engineering classes in Fall
2015 and Spring 2016 were tasked with developing an initial design and prototype
for this Antarctic penetrator, which was then continued as the subject of the masters
research project described here. In the case of the GSIP Antarctic penetrator, the
function of the probe involves the use of GPS and seismometer instrumentation to
measure ice sheet movement and flexure over time, with more specific requirements
defined by the PI, Dr. Pedro Elosegui of the MIT Haystack Observatory.
Alongside the class and their work on creating an Antarctic penetrator proto-
type, during the first year of this project, MIT Lincoln Laboratory sponsored the
development of an “earthquake monitoring penetrator”, with requirements for a soil
penetrator with a much more constrained volume than the Antarctic prototype. The
soil penetrator would be capable of measuring significant seismic events and report-
ing them in near real-time. Much of the work carried out alongside the 16.83/16.831
classes (and subsequently during masters research) for the design of the Antarctic
penetrator was deemed to be applicable to the smaller soil penetrator. Study and
107

design work on the earthquake monitoring penetrator was carried out with the aim of
utilising relevant work from the GSIP project wherever possible, and with particular
focus on the penetration dynamics, communications requirements and power system
sizing. The soil probe project was primarily based on the earlier monolithic GSIP de-
sign, although later work carried out on the more recent two-body penetrator design
has been incorporated where appropriate.
5.2 Requirements
Requirements for the soil penetrator were defined by the sponsor at MIT Lincoln
Laboratory as described in Table 5.1 below. Similarly to GSIP, the aim is to develop
a probe for air deployment, although in this case from a higher level of 30,000 feet
rather than a lower overflight in the case of the Antarctic probe. The soil probe
will need to fall in an aerodynamically stable configuration as GSIP does, to ensure
that impact occurs at a vertical or near-vertical angle to the ground to maximise
the probability of successful emplacement and avoid ricochet. Unlike GSIP’s passive
falling phase, the soil probe project aims to incorporate simple control surfaces so
that active control may be used to direct the probe towards a targeted location.
Due to the inflexible sizing constraint set out by the SOIL3 requirement, volume
rather than power will be the main design driver for the soil probe. The mission
lifetime is set at a minimum of 10 days by the SOIL2 requirement, but the achievable
lifetime will ultimately derive from the size of the power system that can be fitted
within the constrained volume of the penetrator. However, as the soil probe only
requires a daily location report rather than the phase-locked GPS required by GSIP,
the system will have a lower power draw.
In terms of environmental considerations, the soil probe will be subject to much
less extreme temperatures, and it is not expected that a thermal control system will
be required. As well as not experiencing the very low temperatures of the Antarctic
108

snow pack, the concern about melting surrounding snow and decoupling seismically
is no longer a potential issue when emplaced in soil. However, the impact into soil
rather than snow will lead to much higher g-loading being experienced by the soil
probe, and therefore some components may need to be specifically selected based on
high shock-loading specifications.
Requirement SOIL5 is included as it is part of the ultimate aim of the design
project, but fell beyond the scope of the work carried out here. Given the available
timeframe devoted to the design of the soil penetrator and the mechanical engineering
background of the author, the study and design undertaken here focused on penetrator
functionality from the moment of impact onwards. Future work on this project could
be carried out in the areas of targeted deployment from altitude, aerodynamic effects
and GNC requirements.
Table 5.1: Soil probe requirements
ID Requirement
SOIL1
The penetrator shall record and transmit a full seismic record of any sig-nificant seismic events and report them in near real-time. The penetratorwill also transmit a daily report of health status including location, time,sensor health readings and energy usage.
SOIL2
The penetrator shall be capable of powering a GPS receiver, 3-axis geo-phone and iridium satellite communications link for an extended periodusing primary batteries. An extended period is defined as a minimum of10 days with the aim of prolonging probe lifetime higher if possible upto 100 days.
SOIL3The penetrator shall fit within a packing envelope of approximately 30 x10 x 10 cm volume, with the caveat that the design may unfold or deployin some fashion to an unconstrained volume after it is dropped.
SOIL4
The penetrator will retain structural integrity and full instrument func-tion after impact at terminal velocity into soil of the provided specifi-cation: a penetration resistance curve between 2-6 MPa at depths of0-30 cm deep, as measured by a soil penetration resistance test. Thepenetrator will emplace between 15 and 30 cm into the soil, althoughthis emplacement may be tunable to a known soil type in some fash-ion, as long as such tuning is applicable to the full range of possible soilresistance set out by the specification.
109
ID Requirement
SOIL5
The penetrator will include a guidance, navigation and control (GNC)payload and simple control surfaces to control descent of the probe to atargeted location of 100 m Circular Error Probable (CEP) when deployedfrom an altitude of 30,000 feet. 100 m CEP is defined as 50% probabilitythat the probe will land within a 100 m radius of the intended target.
5.3 Power subsystem sizing
The most limiting factor in designing the power system is the SOIL3 requirement, as
the penetrator is required to fit within the volume constraint of a packing envelope
of approximately 30 x 10 x 10 cm. It was initially considered that the power needs
of the system could be supplied by a combination of batteries plus harvested energy.
However after considering the preliminary version of GSIP which would have used a
mixture of primary and secondary batteries alongside solar cells for charging, it was
evident that the additional complexity and volume/mass required by secondary bat-
teries and solar cells plus associated hardware was not feasible for the miniaturised
system proposed here, and thus a system using primary batteries alone was selected
to fulfil the SOIL2 requirement of powering all the desired systems.
The GSIP power budget was used as the initial basis for estimation of power re-
quirements for the soil penetrator. The GSIP average power draw shown in Table 3.4
in Section 3.3.2 is 2.435 W. The only component that can be completely discounted
from this power budget when considering the soil probe is the microseismometers, as
the soil probe will instead use 3 geophones, which require no input power. The IMU
sensor is still included in the budget as this information may still be sent as part of
the health data package. Use of the GPS receiver and antenna will be considerably
reduced due to the lack of requirement for phase-locked GPS, therefore removing the
need for continuous use of the GPS components.
110
The GSIP budget accounts for 11 hours per day of Iridium transmission due to the
need to transmit a full 24-hour record of GPS position and seismic activity each day.
The requirements for the soil penetrator only specify a daily reporting of location
and near real-time reporting of a full record of any significant seismic event. If it is
assumed that the GPS receivers are only used for 1 hour each day in order to achieve
daily reporting of the location as mentioned in the SOIL1 requirement, this will re-
duce the payload average power draw as location measurements will be recorded for
a lesser proportion of the day. As less data is collected, the Iridium transceiver will
need to transmit for less time each day and therefore its average power draw will
be lower. However, the system still draws power while not transmitting so although
the average power draw is reduced, even when the transmission time is reduced by a
factor of five, the power draw drops by a much lower factor of less than two.
A specific requirement for geophone sensitivity or what constitutes a “significant”
seismic event was not supplied in any more detail than that given by requirement
SOIL1. However, the US Geological Survey estimates that there are 500,000 de-
tectable earthquakes globally each year, of which 100,000 are strong enough to be felt
by humans. Taking southern California as an example of a seismically active area,
there are approximately 10,000 earthquakes per year in this region. Several hundred
of these are at least 3.0 magnitude on the Richter scale, which is around the strength
at which humans begin to detect the tremors. Just 15-20 of these earthquakes are at
4.0 magnitude or higher.54 From this information it was concluded that a reasonable
estimate of the occurrence of seismic activity significant enough to be recorded and
reported would be taken to be 1 hour per day. This should be sufficient in order to
find an order-of-magnitude estimate for the feasibility of the power system sizing, and
more detailed calculations can be carried out if a more specific value is supplied in
future.
111

It was assumed that the CompactFlash memory was still accessed throughout the
day for data storage in order to retain a full seismic record. Avionics hardware power
draw is shown with the assumption that a full seismic record retained on-board the
soil penetrator may be desired as part of the payload requirements. If such a record
is not required, power draw may be further reduced in order to increase operational
lifetime. As seen in Table 5.2 below, these estimates result in a reduced average power
draw of 1.173 W for the soil penetrator.
Table 5.2: Soil probe power budget
Subsystem Component
Averagepowerdraw[mW]
Based on?
ADCS BNO055 IMU 0.13 Non-continuous usage, class esti-mate of 1 min/day usage37
Comms Iridium transceiverand antenna 696
Non-continuous usage of up to20 W for short periods; estimatefrom Haystack power draw test-ing
Payload GPS receiver 21 1 hr/day usage, estimate fromHaystack power draw testing
Payload GPS antenna 6 1 hr/day usage, estimate fromHaystack power draw testing
Avionics 2 x PSoCs 200 Continuous usage, estimate fromHaystack testing
Avionics CompactFlash 8GBmemory card 250 Non-continuous usage, class esti-
mated average power draw37
Total 1173
Batteries needed:5 (10 days), 42 (100 days)Batteries with 20% margin:6 (10 days), 50 (100 days)
The power subsystem team from the 16.83 senior capstone class working on the
GSIP project selected the OmniCel ER34615 as the best candidate to use for the pri-
mary batteries due to it having both the highest energy density (0.0013 Whr/mm3 or
1308 Whr/L) and also highest specific energy (684 Whr/kg) of all 35 primary battery
candidates compared in an initial trade study (Section 6.6.1, 16.83 report55). As the
112

volume requirement for the soil penetrator is expected to be the limiting factor in
designing the power system, this highly energy-dense battery was deemed to be an
equally fitting candidate for use here.
The OmniCel ER34615 specifications sheet gives a nominal capacity of 19 Ah
and rated voltage of 3.6 V, giving a total capacity per battery of 68.4 Whr.36 The
minimum capacity required to fulfil requirement SOIL2 and power the penetrator
systems for at least 10 days at 1.173 W is 281.52 Whr, requiring only 5 batteries at
the given capacity. To power the penetrator for 100 days would require 42 batteries
to be housed within the structure.
The Omnicel datasheet gives the battery’s dimensions as 32.9 mm diameter and
61.5 mm height.36 Within the 10 x 10 cm cross-section of the packing envelope, this
allows for 7 batteries per layer within a circular penetrator design or 9 batteries per
layer in a square penetrator design as shown in Figure 5-1 below, with a total width
of 9.87 cm for 3 adjacent batteries. This would only leave 1.3 mm available width
for the outer structure, although requirement SOIL3 only states the packing envelope
“approximately” so additional allowable margin in the dimensions would need to be
devoted to this structure.
Figure 5-1: Achievable battery packing density within 10 x 10 cm penetrator config-urations
113
With a height of 61.5 mm, it would be possible to fit a maximum of 4 layers of
batteries into the packing envelope, occupying 24.6 cm of the allowed 30 cm length,
although this would be unlikely to allow enough volume for other subsystems to fit
within the structure. However this results in the designation of 36 batteries as the
absolute maximum quantity that could be fitted within the required volume, which
would supply over 87 days of power at the estimated average power draw. From
these calculations, it can be seen that the power requirements for the penetrator are
feasible even within the volume constraints, as the minimum requirement to power
the system for 10 days can be fulfilled using less than 20% of the limited available
volume.
5.4 Communications subsystem
The GSIP design incorporates a Topcon PG-A1 GPS antenna and a SAF5350-A Irid-
ium antenna to fulfil the communications requirements of the mission. One antenna
cannot be multiplexed for both GPS and Iridium due to the difference in frequencies
and the requirement for a passive GPS antenna but an active Iridium antenna, so
two separate antennas are required.
However, the GPS antenna is 141.6 x 141.6 mm square and 52.7 mm high, and the
Iridium antenna has a diameter of 76 mm and height of 157 mm, making these com-
ponents unsuitably large for the soil penetrator volume envelope. The GPS antenna
could not be fitted within the envelope in any orientation, and although the Iridium
antenna could fit, it would take up a very large proportion of the available volume
and thus it was concluded that it was not an optimal candidate for the hardware
selection. For GSIP, volume was not prioritised as a constraint and therefore many
other available systems are in fact smaller than these pieces of hardware.
In researching alternative antennas, the Antcom Mini Quadrifilar Helical Stub
Antenna series was examined, with passive and active products available for L1/L2
114

GPS/GLONASS and Iridium, particularly focused on handheld and mobile applica-
tions. This antenna series (HL1L2IRA-XSM-4-3 for the active antenna and HL1L2IRP-
XSM-4-3 for the passive antenna) would be well-suited to the requirements of the soil
penetrator due to its much smaller dimensions: 20.32 mm in diameter with a height
of 81.28 mm.56 The 2.032 cm antenna diameter means that both antennas can easily
be mounted side-by-side within the 10 x 10 cm cross-section of the penetrator.
Another consideration for the communications system design is that although
there is no specific requirement for ground clearance for the antennas (i.e. there is
no additional distance above ground level required), they will need to be no lower
than ground level. As requirement SOIL4 defines underpenetration as < 15 cm and
overpenetration as > 30 cm, this must be taken into account in the placement of
the communications antennas within the system. If the antennas are placed within
the back end of the 30 cm length of the packing envelope, the penetrator should
not penetrate further than approximately 22 cm, and so the penetration requirement
will have to be re-examined. Alternatively, the antennas could be mounted on the
back end of a 30 cm-long penetrator, in which case requirement SOIL3 (specifying
the packing envelope) will have to be re-examined, as the penetrator would then be
approximately 38 cm in length once the antennas are included.
The need for transmission of a daily health status report is included in require-
ment SOIL1. Specified parameters for inclusion were location, time, sensor health
readings and energy usage. It may also be useful to incorporate parameters such as
tilt readings from the IMU, voltage and current of the power system, and system
temperature if an appropriate sensor to record this is included. If the RTOS (Real-
Time Operating System) is developed for the system to include different modes (for
example, a pre-drop mode incorporating GNC versus a post-drop seismic-measuring
mode of operation) then housekeeping information such as present mode could also
be included in the health report.
115

The communications subsystem teams in 16.83/831 specified a daily transmis-
sion of 78 bytes of health data, to include current, voltage and temperature of the
power system, penetrator orientation, sensor status and communication system sta-
tus. When testing was carried out with sample health data generated, this amount
increased to 173-176 bytes of data. The GPS is specified to generate 100 bytes of
data per reading, and the IMU is specified to generate 24 bytes per reading, and only
one sample reading will be required per daily health update (Table 3.6.1, 16.83 design
document55). Either total quantity is such a small amount of data for transmission
that the size is essentially negligible compared to the payload data, and would remain
so even if it was increased by multiple orders of magnitude, so the health status report
will not place a constraint on the system. The RUDICS (Router-based Unrestricted
Digital Interworking Connectivity Solution) data service was retained as the selected
service for data transmission as in the GSIP mission design, with a standard data rate
of 2.4 kbps (300 bytes/second), allowing for approximately 2 MB of data transfer in
two hours of transmission time per day, or 1 MB of data if the minimum acceptable
data rate of 1.2 kbps as defined for the GSIP requirements is assumed.30
Estimating the amount of data generated by the three geophones was less straight-
forward. The USGS states that “Most earthquake waves have a frequency of less than
20 Hz” 54 and the World Personal Seismometer Map (WPSMap) states that “Most
tectonic local/regional earthquakes have a frequency lower than 5 Hz. Volcanic earth-
quakes can have frequencies up to 15 Hz.” 57 The GS-11D geophones used for testing
in the 16.83/831 classes and at MIT Haystack Observatory were incorporated into
the preliminary design of the soil probe, but are only available up to a maximum
natural frequency of 14 ± 0.75 Hz,58 so if higher sampling rates are desired then a
different geophone model will have to be used. The seismometer selected for GSIP
was specified to generate 12 bytes of data per reading, so if this is taken as an initial
estimate of the data generated by each geophone, each one will generate 591 kilo-
bytes per hour of seismic activity, for a total of 1.73 megabytes per hour for all three
geophones. The need to transmit for 2 hours each day was based on this estimate,
116

giving a total data transmission capacity of 2.06 MB per day. The data will also be
stored on the 8 GB CompactFlash card; generating 1 hour of seismic data per day
for 100 days results in the need to store 173 MB of data, and 1 hour of GPS data per
day for 100 days results in 3.43 MB of data to be stored.
5.5 Penetration dynamics
The effects of an assortment of variables on the penetration dynamics of the probe
were considered using the impact simulation model written in MATLAB that was
described in Chapter 4. Initial work towards creating this model was carried out by
Aaron Baumgarten of the structures subsystem team during the 16.83 Fall class, and
it was then updated and modified in order to apply the model to a wider range of
prototypes and to simulate soil penetration conditions as well as snow penetration
conditions. The MATLAB model involved creating a forward Euler simulation of soil
impact, with the assumption that the soil compacts elastically over the impact time
(in order to assume a constant compaction, rather than the non-constant compaction
given by a plastic deformation model) at a specific constant pressure as ground pen-
etration occurs. This pressure was given by the penetration resistance curve of the
soil, defined as 2-6 MPa by requirement SOIL4. An estimated friction coefficient of
0.25 was also included, based on values from background literature.59
The Euler method is the simplest explicit method of numerical integration to
find approximate solutions for ordinary differential equations, using a specified initial
value for the state of the system to calculate values at a later time. It is a first-order
procedure, meaning that the error at any given time is correlated with the step size
and the error per step is correlated with the step size squared. In this instance,
the outer mold line of the penetrator is modelled depending on the nosecone shape,
the length of the nosecone taper and the general outer dimensions of the penetrator
probe, and as long as the velocity is still greater than zero, the force of the most
recent part of the penetrator to enter the soil is continuously added to the existing
117
force of the penetrator that is already below ground level. A sensitivity analysis with
2 degrees of freedom was generated, illustrating the variation in g-loading and depth
of penetration under the effect of changes in impact velocity (from 0-100 m/s) and
soil penetration resistance (from 2-6 MPa).
5.5.1 Results plots from soil penetration simulation
Plots were generated to demonstrate the correlation of nosecone taper length, nosecone
curvature shape, total penetrator mass, conic vs. square-shaped nosecones, and brak-
ing disks of various sizes with g-loading experienced by the penetrator upon impact
and required impact velocity to achieve the depth of penetration specified by the
SOIL4 requirement. These are included in the following pages and are followed by a
brief analysis of the relations shown.
118

Figure 5-2: Comparison of 5/10/15 cm taper length effect on g-loading, over a rangeof impact velocities and soil compressive pressure values
119
Figure 5-3: Comparison of 5/10/15 cm taper length effect on penetration depth, overa range of impact velocities and soil compressive pressure values
120

Figure 5-4: Comparison of straight, concave and convex taper shape on g-loading,over a range of impact velocities and soil compressive pressure values
121

Figure 5-5: Comparison of straight, concave and convex taper shape on penetrationdepth, over a range of impact velocities and soil compressive pressure values
122

Figure 5-6: Comparison of 3/5/7 kg mass effect on g-loading, over a range of impactvelocities and soil compressive pressure values
123
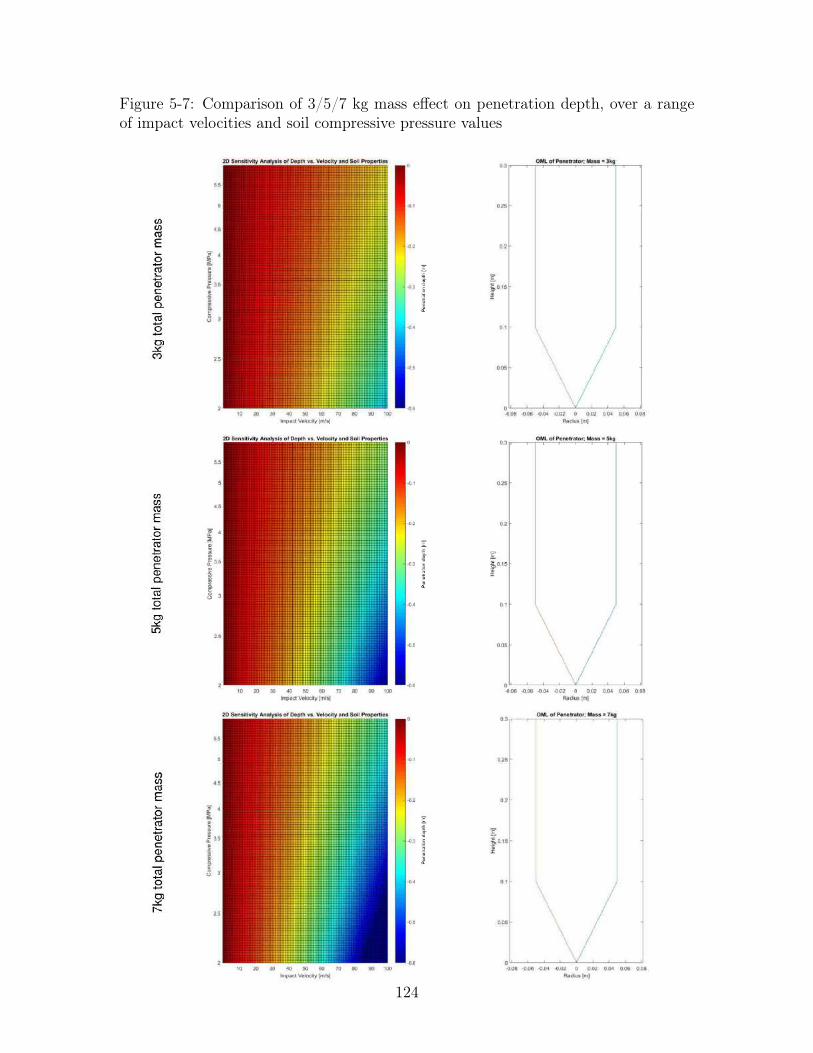
Figure 5-7: Comparison of 3/5/7 kg mass effect on penetration depth, over a rangeof impact velocities and soil compressive pressure values
124

Figure 5-8: Comparison of g-loading for straight cone-shaped taper and pentahedral/square-based-pyramid taper, over a range of impact velocities and soil compressivepressure values
125

Figure 5-9: Comparison of penetration depth for straight cone-shaped taper andpentahedral/square-based-pyramid taper, over a range of impact velocities and soilcompressive pressure values
126

Fig
ure
5-10
:C
ompa
riso
nof
effec
tof
nobr
akin
gdi
skvs
.5/
10/1
5cm
wid
ebr
akin
gdi
sks
ong-
load
ing,
over
ara
nge
ofim
pact
velo
citi
esan
dso
ilco
mpr
essi
vepr
essu
reva
lues
127

Fig
ure
5-11
:C
ompa
riso
nof
effec
tof
nobr
akin
gdi
skvs
.5/
10/1
5cm
wid
ebr
akin
gdi
sks
onpe
netr
atio
nde
pth,
over
ara
nge
ofim
pact
velo
citi
esan
dso
ilco
mpr
essi
vepr
essu
reva
lues
128
5.5.2 Relationships observed from model
In Figures 5-2 and 5-3, the effects of the nosecone taper length were examined. Figure
5-2 shows a comparison of 5 cm, 10 cm and 15 cm tapered nosecone lengths, with the
effect on g-loading shown on the left plot and the outer mold line of the penetrator
shown on the right. It can be seen from these plots that a shorter taper length re-
sults in higher g-loading on the penetrator, although the largest effect is due to the
variation in soil resistance, with loading upon impact varying from around 300 G at
2 MPa up to over 800 G at 6 MPa. It can also be seen that the g-loading becomes
constant above an impact velocity of around 20 m/s for the shortest 5 cm taper and
above an impact velocity of around 35 m/s for the longest 15 cm taper. Figure 5-3
shows a comparison of the 5 cm, 10 cm and 15 cm tapered nosecone lengths with the
required impact velocity to penetrate to the desired depth of 0.15-0.3 m. From this
figure, it can be seen that the required impact velocity is higher for a shorter 5 cm
taper (35-65 m/s to penetrate to the desired depth range at 2 MPa) and lower for a
longer 15 cm taper (25-55 m/s to penetrate to the desired depth range at 2 MPa),
although the range of acceptable impact velocities to achieve the required depth is
similar in both cases.
In Figures 5-4 and 5-5, the effects of different nosecone shapes were examined, as
it was considered that changing the nosecone shape could be a potential way of tun-
ing the penetrator probe to different known soil resistance values. Figure 5-4 shows a
comparison of a straight conic nosecone with a concave (inward-curving) nosecone and
a convex (outward-curving) nosecone and the effect this shape change has on the g-
loading experienced by the penetrator. Again, the g-loading is shown in the left-hand
plot while the outer mold lines of the penetrator with the different nosecone shapes
are shown on the right. It can be seen from these plots that the concave nosecone
increases the g-loading above that experienced by the straight nosecone, whereas the
convex nosecone decreases the g-loading, although the effects are most pronounced at
lower impact velocities and for most velocities the g-loading is still in the 300-800 G
129

range depending on the soil resistance. The g-loading becomes constant for any soil
resistance above approximately 25 m/s for the concave nosecone and 35 m/s for the
convex nosecone. Figure 5-5 shows the effects of nosecone shape on required impact
velocity, with the concave nosecone demonstrated to decrease the required impact
velocity (25-60 m/s to penetrate to the desired depth range at 2 MPa) and the con-
vex nosecone demonstrated to increase the required impact velocity (30-65 m/s to
penetrate to the desired depth range at 2 MPa), with the range of acceptable impact
velocities to achieve the required depth again being similar in both cases.
Figures 5-6 and 5-7 demonstrate the effect of different penetrator masses, which
along with nosecone shape could potentially be used to tune the penetrator to differ-
ent known soil resistance values, assuming that it is possible to add or remove ballast
from the penetrator, which will be heavily dependent on whether there is available
volume in the design. Figure 5-6 shows a comparison of 3 kg, 5 kg and 7 kg total mass
for the penetrator, with the effect on g-loading shown in the left-hand plot. It can
be seen from these plots that greater mass decreases the g-loading on the penetrator
while lower mass increases it, with the 3 kg penetrator experiencing loads of 550 G
at 2 MPa soil resistance while the 7 kg penetrator only experiences around 200 G.
Figure 5-7 shows the effect of penetrator mass on required impact velocity, with a
greater mass requiring a lower impact velocity (25-55 m/s at 2 MPa to achieve the
desired depth range) and the lower mass requiring a higher impact velocity (35-85
m/s at 2 MPa). In this case, it can be seen that the greater mass also significantly
decreases the range of acceptable impact velocities to achieve the required 0.15-0.3 m
penetration depth.
Figures 5-8 and 5-9 show a comparison of g-loading and required impact velocity
for a straight cone-shaped nosecone against a pentahedral/square-based pyramid-
shaped nosecone (as illustrated in Figure 5-12 below). The cone shape was considered
to be the default tip shape based on its adoption for the Antarctic penetrator design,
but the square alternative was also considered for the soil penetrator design in order
130
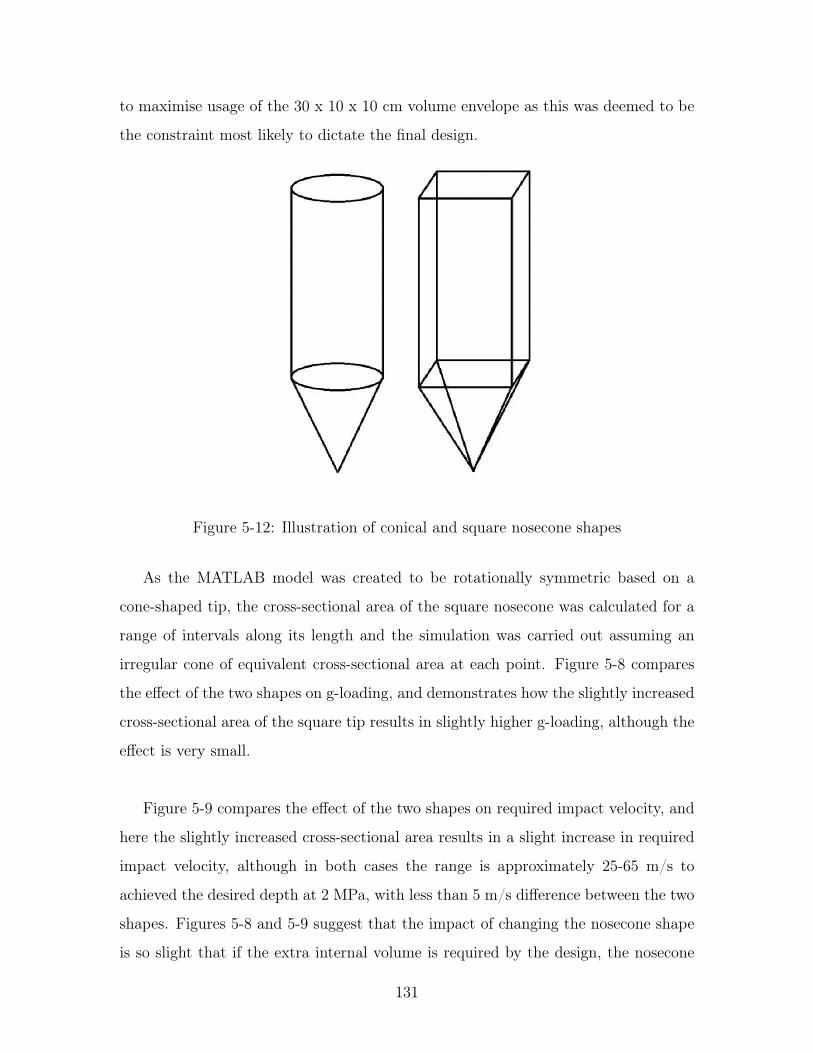
to maximise usage of the 30 x 10 x 10 cm volume envelope as this was deemed to be
the constraint most likely to dictate the final design.
Figure 5-12: Illustration of conical and square nosecone shapes
As the MATLAB model was created to be rotationally symmetric based on a
cone-shaped tip, the cross-sectional area of the square nosecone was calculated for a
range of intervals along its length and the simulation was carried out assuming an
irregular cone of equivalent cross-sectional area at each point. Figure 5-8 compares
the effect of the two shapes on g-loading, and demonstrates how the slightly increased
cross-sectional area of the square tip results in slightly higher g-loading, although the
effect is very small.
Figure 5-9 compares the effect of the two shapes on required impact velocity, and
here the slightly increased cross-sectional area results in a slight increase in required
impact velocity, although in both cases the range is approximately 25-65 m/s to
achieved the desired depth at 2 MPa, with less than 5 m/s difference between the two
shapes. Figures 5-8 and 5-9 suggest that the impact of changing the nosecone shape
is so slight that if the extra internal volume is required by the design, the nosecone
131

should be made square instead to maximise this allowed volume.
Figures 5-10 and 5-11 compare g-loading and required impact velocity for no
braking disk and for a circular braking disk extending 5, 10 and 15 cm width radially
out from the 10 cm diameter penetrator body. Figure 5-10 shows the huge increase
in g-loading induced by the presence of a braking disk of any size, with g-loading
well over 800 G for all scenarios where the braking disk impacts the ground. As the
standard g-loading scale used to compare all plots only extended 0-800 G, making
it hard to characterise the exact maximum g-loading experienced, Figure 5-13 is
included below to illustrate this in more detail. As can be seen from the plot on the
left-hand side, at the highest soil penetration resistance values and impact velocities,
g-loading exceeds 7000 G, and even at the lowest penetration resistance values the
g-loading exceeds 2000 G.
Figure 5-13: G-loading effects of braking disk shown with extended scale
Figure 5-11 illustrates the effectiveness of the braking disks in helping to reduce
or prevent overpenetration, with the range of required impact velocities at 2 MPa
132

to achieve the desired penetration depth increasing from 30-65 m/s with no braking
disk up to 30-90 m/s for a 15 cm braking disk. However, given the huge increase
in g-loading demonstrated by Figure 5-10 when braking disks are incorporated into
the design, it may not be feasible to select hardware for the other subsystems of the
penetrator that can withstand such high loads, let alone design a braking disk that
would be effective and not be immediately destroyed upon impact without having
a braking effect. The braking disk would also require work to develop a deployable
design so that it would still fit within the envelope specified by the requirement SOIL3.
5.6 Mass estimate
Table 5.3: Estimated mass budget for soil penetrator components
Subsystem Component Mass [g]
Structures Al-6061 shell 1218 (based on estimated shellvolume of 450cm³)
Structures Wiring 300 (based on 750g estimate forlarger penetrator)
Structures Internal mounting struc-tures
500 (estimate based on internalmounts for larger penetrator)
Power OmniCel ER34615 batter-ies36 100 (per battery, 5-36 used)
Payload BNO055 IMU42 5Payload GS-11D geophones58 111 (per geophone, 3 used)Communications Iridium 9523 transceiver33 32Communications Antcom Iridium antenna56 20Communications Antcom GPS antenna56 20Communications GPS antenna receiver43 27Avionics Cypress PSoC 5LP40 250 (per PSoC, 2 used)
Avionics CompactFlash 8GB mem-ory card35 10
Total 3465 (for only 5 batteries)
Although no mass constraint is specified by the soil penetrator requirements, many of
the components used were already researched for the current GSIP design or by 16.83
and 16.831 classes for the preliminary design, making it relatively simple to estimate
a mass budget for the soil penetrator. Using available datasheets and the 16.83 and
133

16.831 design documents, the mass budget shown above in Table 5.3 was created. The
estimated mass of the shell is based on an Al-6061 T6 alloy, selected for GSIP for its
strength-to-weight ratio,55 and the volume of material used was based on a cylinder
of 30 cm length and 0.5 cm thickness in order to arrive at a first-order estimate. This
mass estimate also does not include the GNC payload or control surfaces specified by
the SOIL5 requirement, which should be included if further work is carried out on
the penetrator design.
The estimates shown in Table 5.3 result in a mass of 3.465kg including only 5
batteries, the minimum needed to fulfil the power requirements of the system. If 14
batteries are included (2 cylindrical layers within the penetrator), the mass increases
to 4.365 kg, with the ability to supply power for 34 days. If the maximum number
of 36 batteries was included, this would increase the mass to 6.565 kg. However
the volume required to house this amount of batteries would not leave space for all
other subsystem components within the packing envelope, and therefore this mass is
included only to present an upper bound on what the final mass of the system should
be.
5.7 Conclusions
Looking back at the requirements, it appears that requirements SOIL3 (volume) and
SOIL4 (soil penetration to a specified depth) will be the main constraints in defin-
ing a system design. Requirement SOIL1 (record and transmit seismic record and
health status) can be fulfilled relatively easily with the selected geophones and com-
munications system hardware. Requirement SOIL2 (power for 10-100 days) results
in achievable power requirements for the penetrator, and the sizing of the power sub-
system fits within a relatively small proportion of the available volume envelope of 30
x 10 x 10 cm specified by SOIL3. Most of the payload requirements can be fulfilled
using components of a relatively small size, but mounting these within the structure
and connecting them appropriately must be done with priority placed on achieving
134

the specified dimensions.
Fulfilling the SOIL4 requirement and achieving the desired soil penetration depth
will require carrying out soil penetration tests with a prototype in order to validate
the simulation model. Tunability for different known values of soil resistance may be
carried out using the relationships observed from this model. Increasing the length of
the nosecone taper will decrease the required impact velocity and also decrease the g-
loading experienced upon impact. A more concave nosecone will decrease the required
impact velocity but increase the g-loading, while a more convex nosecone will have
the opposite effect. An increase in penetrator mass (for instance by adding ballast)
will decrease the required impact velocity while also decreasing the g-loading. Using
a square body shape rather than circular will slightly increase the required impact
velocity and g-loading due to the larger cross-sectional area, but this allows use of the
full 100 cm² of the packing envelope rather than only 78.54 cm² for a circular pene-
trator body, which may be useful in fulfilling SOIL3 and fitting all necessary systems
within the envelope. Finally, incorporating a braking disk into the design allows for
penetration to the desired depth to be achieved using a wider range of impact veloc-
ities, but results in a huge increase in g-loading once the braking disk impacts the soil.
The MATLAB simulation predicts g-loading upon impact to be in the range of
200-800 G, varying according to soil penetration resistance, total penetrator mass and
impact velocity. If a braking disk is incorporated into the design, this increases to
2000-7000 G. These figures should be validated through drop testing in order to ar-
rive at accurate g-loading figures so that component compliance can be investigated.
Although mechanical shock ratings of 2000 G are quoted for the CompactFlash card
and the IMU, the geophones are only rated to 100 G and many of the components
are not rated for any specified level of mechanical shock. This is a particular concern
with the batteries and power system, so further testing should be carried out to try
to determine safe ranges of g-loading for these and other components, as well as po-
tentially selecting alternative hardware with a higher shock rating for the final design.
135
The design of the communications system must be carefully considered, due to the
conflict between the SOIL3 and SOIL4 requirements as mentioned above in Section
5.4. If the antennas are placed within the 30 cm length of the packing envelope,
the penetration depth requirement must be reduced, or if the penetration depth is
achieved, the packing envelope must be increased. If neither requirement may be up-
dated, one alternative that could be examined is a separable penetrator design such
as that used by the GSIP project. However, for the afterbody to brake more rapidly
than the forebody in order to remain at the surface, a deployable mechanism that fits
within the packing envelope would have to be developed.
A separable design could include a forebody section of the penetrator (containing
the batteries, power system and most of the payload requirements) and an afterbody
section consisting of a breakaway braking disk with the antennas mounted on top,
linked by an umbilical wire that would supply a power and data connection between
the two. Such a design would be similar in concept to GSIP and also to the New
Millennium Deep Space 2 mission sent to Mars in 19991,11 (shown below). Figure
5-14 illustrates the general design concept, showing a narrower penetrating forebody,
a durable umbilical wire and a wider aftbody section that remains at the surface.
The separability of this design would allow for greater variation in the soil penetra-
tion depth of the forebody, as the antennas and braking disk would remain at surface
level regardless, thereby reducing the uncertainty inherent in the need to tune the
penetrator for different expected soil resistance values. A separable probe would also
mean that the forebody of the penetrator would not experience the drastic increase
in g-loading that occurs when a braking disk is added to the design (as shown in
Figure 5-13), although the antennas and braking disk would still have to be designed
to withstand such an impact. A crucial detail in this design is the umbilical connec-
tion between the two halves, as if this link failed, the penetrator would be rendered
effectively useless due to the inability to transmit its collected data.
136

Figure 5-14: Artist’s impression of Deep Space 2 deployment into the Martian surface.Image credit: Lorenz (2011)1
A shell thickness of 0.5 cm was assumed for the initial design iteration and is in-
cluded in the mass estimate above. This was calculated to be a reasonable thickness of
the shell to avoid significant deformation of the outer mold line, based on the use of an
Al-6061 T6 alloy as selected for the GSIP design and based on the g-loading estimates
of 300-800 G predicted by the MATLAB simulation. These preliminary calculations
were based on beam-loading and hemispherical-loading estimates in order to arrive
at stress estimates within an order of magnitude of accuracy. Once a nosecone shape
or range of shapes is selected, further work must be carried out to take into account
the conical nosecone (or pentahedral shape if such a design is adopted), as well as
the convexity or concavity selected for the final design and the length of the taper.
The conical shape should also be investigated to ensure it does not act as a stress
concentrator in any fashion. The g-loading estimates also assume no off-nominal soil
137

impacts, for example at the non-optimal angles seen in GSIP drop-testing into snow
and discussed in Chapter 4. An entry envelope of acceptable angles could be inves-
tigated in concert with further work on the GNC system and aerodynamic design of
the penetrator.
An additional concern is the lack of specification of acceptable g-loading levels
for many of the selected components. Although the separable design could mitigate
this issue to some extent, further testing should be carried out, particularly on the
batteries, as the power system is likely to be an area of concern when it comes to shock
testing. One possibility that could be examined during future work is adding some
form of cushioning or crushable material within the penetrator, perhaps within the
nosecone itself. This would help to ameliorate the g-loading effects on the internal
components, especially as there are materials available that can be customised to
crush once specified levels of g-loading are exceeded, thereby providing a buffer against
mechanical shock values in excess of design levels. Further work must be carried out
to validate the soil simulation model used here and provide empirically-obtained g-
loading values for comparison, and then the choice of appropriate components can
be validated through impact testing or replaced as required by the soil penetrator
design.
138

Chapter 6
Discussion of current design and risk
mitigation
Although the MATLAB simulation developed for predicting snow penetration has
provided a useful reference to make comparisons during the design process, as well as
demonstrating reasonable accuracy at lower impact velocities and in less dense snow,
further testing is needed to validate the model more thoroughly and assess whether
the error remains consistently low across the full range of impact velocities and snow
properties that may be encountered during deployment. In future testing, the pene-
trator models used should be fitted with accelerometers to measure g-loading during
impact and deceleration in order to compare values to the range predicted by the
MATLAB simulation, so that this part of the simulation may also be validated if the
results are found to be accurate, or allow for updates to be made to the modelling if
a large error value is found.
Drop testing as the design is iterated will allow for the collection of more extensive
data on snow penetration depth and angle in order to better judge the probability of
success prior to remote deployment of the GSIP system, as well as allowing for the
gradual expansion of the range of test conditions. For example, gathering data on
tests carried out from increasing drop heights or with an initial velocity to try to reach
the designed terminal velocity will provide a closer analogue to eventual Antarctic
139

deployment conditions from the LC-130. Recording impact g-loading after deploy-
ment from the aircraft at the expected altitude will also aid in verifying whether the
STR12 requirement for g-loading tolerance of 600 G is sufficiently conservative for the
mission design. Shock testing of the selected components will also be necessary to
ensure full compliance with the g-loading requirements and make sure that full func-
tionality of the device will be retained after impact. Measuring the penetration of
the forebody and afterbody into a wider variety of snow densities (or an appropriate
simulant, if similar compressive properties can be replicated) will aid in verifying the
STR3 and STR4 requirements of emplacing the forebody sufficiently deep into the
snow while decelerating the afterbody rapidly enough to position the antennas high
enough above the snow to avoid being covered by the annual snowfall accumulation.
Aerodynamic testing of the preliminary afterbody design must also be carried out
to assess its drag properties and whether the design objective is achieved of reach-
ing a terminal velocity within the desired impact velocity range. Integrated testing
will be conducted once forebody and afterbody prototypes can be connected, both to
check that no unpredictable emergent behaviour occurs from the interaction of the
two bodies and to ensure that the aerodynamic design functions as intended during
the falling phase of GSIP deployment from the aircraft. It will also be important to
test the connection of the two bodies during flight to make sure that they do not sep-
arate upon initial deployment from the aircraft, although the design should function
as intended even if this does occur.
Avionics design work has been carried out at MIT Haystack Observatory, moving
from an earlier Linux-based design with an Arietta multi-chip board, to using an
RTOS on two PSoCs. Part of the motivation for this avionics design decision was
an initial power budget estimate that suggested an average power draw for the PSoC
of 40 mW compared to an average power draw for the Arietta board of around 400
mW. Due to the power subsystem sizing driving the mass and volume of the entire
GSIP design due to the year-long mission duration using primary batteries, there was
140
a strong motivation throughout the design process to minimise the power draw as far
as possible.
However, power draw testing carried out for both the RTOS and Linux-based sys-
tems over a longer period of time determined that the average draw for the PSoC is
approximately 100 mW, whereas the power draw for the Arietta board is around 270
mW. Due to the need to incorporate two PSoCs into the design for the continuous
data collection required by GSIP, the total power draw for the RTOS avionics design
is 200 mW (as shown in the current power budget in Table 3.4). As a result, the
benefit of using the RTOS is only a factor of 0.35 rather than a factor of 10 as orig-
inally calculated. Linux-based systems are more widely used by the Antarctic and
seismic research communities and have therefore established a lot of heritage in sim-
ilar operating environments that may provide an advantage to the project, whereas
using an RTOS requires debugging of many unique issues and standards to achieve
GSIP’s scientific objectives. The Arietta board also has extensive heritage in polar re-
search applications, with long-term use demonstrated at -40°C without thermal issues.
Longer-term power draw testing will be carried out at MIT Haystack Observatory in
order to determine whether the additional complexity and debugging required to use
the RTOS avionics design is worthwhile, when the reduction in average power draw
compared to the Linux design currently appears to be much less than was originally
believed.
Development of the avionics software is ongoing and will incorporate the neces-
sary data inputs and outputs as these are established from the sensors. No issues
are expected from the standard instrumentation that measures the health data for
GSIP, but the format and processing required for the seismic data collected by the
SEIS instrument will be established through communications with Imperial College
London and through integrated testing once a finalised sensor has been received from
the team developing the microseismometers for the InSight mission. Present avionics
design is based on datasheets from the SEIS team and will be updated as necessary
141
as the GSIP prototype progresses, as well as being taken into account in calculations
of the communications budget once updated estimates of data output are available.
The current communications subsystem design (including estimated average daily
transmission time and power draw) is based on long-term power draw testing at MIT
Haystack Observatory and therefore these figures are not expected to change signifi-
cantly unless the design undergoes notable alterations. Interference testing also estab-
lished that no problems are expected from placing the GPS and Iridium antennas in
close proximity, and so this will not constitute a constraint on the structural design of
the system. However, the introduction of the Iridium NEXT service may provide suf-
ficient motivation for the design to be updated, with faster data speeds and increased
bandwidth advertised for the new service, which may allow for reduced daily trans-
mission time and therefore a potential significant decrease in average power draw. At
the present time, Iridium have not released information on the exact improvements
that Iridium NEXT will bring and so it cannot be stated with any certainty whether
or not these changes will necessitate updates to the communications subsystem, but
this will be re-examined as more details of the new specifications are published.
The most notable change made to the GSIP structural design over time was the
decision to move from a monolithic penetrator to a two-body separable design in
order to improve robustness to the wide range of snow properties that may be en-
countered upon deployment to the Ross Ice Shelf. The evidence from earlier rounds
of drop testing showed that emplacement angle was predominantly occurring outside
the ±10° range specified in the PAY3 requirement, and this supplied the motivation to
examine several different geometries for the forebody design. After examining layouts
incorporating 18, 30, 36 or 60 batteries per cylindrical layer, further drop testing was
carried out to examine the effect of c.g. position on impact angle and the design was
updated to select the widest geometry with the lowest c.g. in order to aid in achieving
an emplacement angle closer to vertical. If further lowering of the c.g. is required
after more drop testing is carried out to ascertain the emplacement performance of
142

the updated design, the nosecone of the penetrator could be made solid or filled with
ballast, though this will of course increase the total mass of GSIP.
FEM analysis of the present design was carried out using SolidWorks CAD soft-
ware, applying impact loading to the penetrator forebody at both the nominal vertical
angle and off-nominal angles to assess deflection. With the current outer shell wall
thickness of 6 mm, loading of up to 1000 G could be applied at a range of angles
without resulting in deflection or deformation of over 1 mm, which was designated
as the desirable maximum in order to avoid damage to the internal mounting of the
GSIP components. However with the aim of reducing c.g. in order to improve em-
placement angle into the snow pack, it may be desirable to carry out further work
using structural analysis to reduce the amount of material in the outer shell without
compromising the performance under loading. If there is any significant update to
the power budget, this could also result in a need to update the structural design due
to the extent in which the overall mass and volume of the GSIP unit is driven by the
power requirements for the year-long mission.
As the large volume of batteries drives the overall GSIP design, updates to battery
technology will continue to be monitored as the project goes forward in order to check
for notable improvement in energy density, as well as high tolerance to g-loading. Fu-
ture testing will be carried out on the tolerance of the Omnicel ER34615 batteries to
high impact shock, in order to determine their performance and assess the amount
of impact cushioning that may be required as part of the structural design. Thermal
performance of the selected batteries will be assessed based on deployment to polar
areas, with 2 short-term GPS sensors using the same batteries currently deployed on
icebergs in Greenland by MIT Haystack Observatory as part of a different research
project. The power draw of the batteries will be measured during their 10-day de-
ployment and compared to predicted performance, with the results of this analysis
expected to be useful in verifying the feasibility or necessary updates required for the
GSIP power subsystem design.
143
Thermal modelling will be carried out of both the forebody and afterbody of
the GSIP design, incorporating the thermal requirements and operating temperature
ranges for all components. It will also be crucial to ensure that heat radiation into the
snow pack is appropriately managed, in order to avoid melting the snow immediately
around the penetrator and destroying the stable seismic coupling necessary to fulfil
the scientific objectives of the mission. Although a preliminary attempt at thermal
modelling was carried out during the 16.83 senior capstone class, this thermal de-
sign was not satisfactorily finished as well as making many assumptions about both
the Antarctic environment and the functioning of the unit, therefore further work is
needed on this area of the GSIP prototype.
There are obvious risks in deploying a new sensor to a remote region with environ-
mentally extreme conditions such as the Ross Ice Shelf, with the possibility of failure
in an inaccessible area which could mean high difficulty in discovering the cause of
failure or recovering the penetrator for assessment. However, such risks will be miti-
gated by extensive testing of prototypes prior to deployment, but also by conducting
more limited tests in polar areas prior to carrying out a full one-year deployment
on the Ross Ice Shelf. Limited deployment of a final prototype will be carried out
in Greenland in spring 2019 and recovered for analysis and potential minor design
updates, before GSIP is deployed to the Ross Ice Shelf six months later in late 2019.
Even for the first Antarctic deployment, it is envisioned that some units may be de-
ployed into the snow pack near McMurdo Station for ease of access and recovery in
order to iterate the design as needed.
144

Chapter 7
Conclusions
Penetrator probes have established several decades of heritage in terrestrial appli-
cations, but although they have been proposed for many planetary science missions
elsewhere in the Solar System, almost all past penetrator missions for space-based
applications have been cancelled at various stages of development or testing. How-
ever, developing an air-deployed penetrator probe for use on the Ross Ice Shelf in
Antarctica is seen as a useful step in establishing penetrator heritage in an environ-
ment incorporating extreme temperatures and high g-loading upon impact. It is also
hoped that developing a penetrator unit which is robust to a wide range of impact
medium properties (due to the strong dependence of success on the impact medium
encountered as well as the lack of advance knowledge about the exact properties of the
snow pack in the deployment area) will aid in future design work on potential space
applications, such as the icy moon missions proposed for destinations such as Europa
and Enceladus.3,4,5 Another benefit of penetrators compared to other planetary sci-
ence vehicles includes easier compliance with planetary protection requirements than
other equipment such as rovers, due to the contained nature of the vehicle, avoiding
contamination in both the protected Antarctic environment and on other planetary
bodies. Small-scale penetrators have also been proposed as add-ons to other missions
in order to gain space flight heritage for the technology,1,4,5 and there is the poten-
tial to replace ballast with useful hardware such as miniaturised penetrators. For
example, NASA’s Mars Balance Mass Challenge requested proposals for useful re-
145

placements to the 300 kg of tungsten ballast ejected before and after the atmospheric
entry phase of a Mars mission,60 which small-scale penetrator probes could replace
while providing additional scientific benefits to the mission.
In comparison to other current state-of-the-art polar research instrumentation,
GSIP provides the advantages of reducing on-ice footprint in Antarctica (thereby
reducing risk to team members); lowering deployment time and cost in comparison
to deployment by hand; improving the ease of instrumenting remote and/or highly
dynamic areas which are difficult to access over land in order to establish a wide
network of geodetic seismic sensors; and using existing polar research aircraft for de-
ployment rather than requiring new logistical resources. The risk of deploying new
technology to remote and hard-to-access areas will be mitigated by limited earlier
deployments, such as the current deployment of GPS sensors on icebergs in Green-
land which will supply useful data on the performance of the GPS components and
the selected batteries in an extremely low temperature environment. Prior to a full
deployment across the Ross Ice Shelf, a limited deployment of the final prototype will
be carried out in Greenland in spring 2019 to assess performance, before deploying
units near McMurdo Station on the Ross Ice Shelf in a convenient location for access
by ground and recovery of the units for performance analysis and so that any neces-
sary design updates may be made.
Penetrators demonstrate a strong reliance of mission success on the qualities of
the impact medium. Due to the unknown properties of the Antarctic snow pack in the
remote area of intended deployment, the probability of GSIP mission success is always
likely to be lower than the ‘3-sigma’ or 99.7% odds of success which are usually speci-
fied for space missions. Environmental considerations which may affect emplacement
include factors such as rock distribution, the presence or absence of features such as
slopes or crevassing, and wind speed at the time of deployment. However, robustness
to this uncertainty can be improved with features such as separable two-body de-
signs, braking disks, braking flares, or other deployable braking mechanisms designed
146

to increase the cross-sectional area of the penetrator without significantly affecting
its aerodynamic properties during the falling phase, and these features are commonly
seen across the designs for previous penetrators due to the benefits they supply, for
both terrestrial and space-based applications. Many penetrator designs are also pro-
posed specifically for network missions in order to increase the odds of success due to
the removal of the necessity for 100% of the units to achieve successful emplacement
and post-impact functionality, and in the case of GSIP the mission requires a network
of sensors by design, in order to create a wide network of units across the Ross Ice
Shelf to build up an overview of the movement, flexure and deformation of the ice
shelf in response to ocean forcing throughout the year.
The ability to deploy GSIP from LC-130 cargo planes allows for the mission to
take advantage of an existing transportation resource in polar research, especially as
there is no necessity for GSIP to be deployed to particular locations upon the ice
shelf and so deployments can be incorporated as is convenient to other operations or
transport flights travelling across the region. Further aerodynamic testing will ensure
that the stability of the unit during the falling phase and the low c.g. placement
is designed to minimise oscillations and improve the probability of emplacing at a
vertical or near-vertical angle. The choice of a separable two-body design allows the
forebody and afterbody designs to be independently optimised to respectively achieve
deep emplacement for seismic coupling and shallow emplacement to position the an-
tennas sufficiently high above the snow surface to ensure successful transmission for
the year-long mission lifetime. The reduction of the on-ice footprint by team members
and the use of a self-contained penetrator unit which is recoverable at the mission
end also minimises the chances of environmental contamination as required by the
Antarctic Treaty Protocol on Environmental Protection.27
Existing research on snow mechanics recognises the limitations of the field and its
lack of defined constitutive equations, requiring considerable simplification to achieve
practical results for specific applications. However, the MATLAB simulation of snow
147

impact that was created during work on the project was validated at low impact
velocities and known snow densities. Further testing is required to collect g-loading
data and to validate the simulation results at higher impact velocities closer to the
actual range that will be targeted during deployment from the LC-130. The initial
design of the afterbody is predicted to penetrate considerably deeper than specified
by the STR4 requirement for emplacement of the antennas above the surface, and so
further work will be required to potentially increase the afterbody diameter or add
deployable braking mechanisms, while retaining similar aerodynamic properties and
validating the design drag coefficient and terminal velocity range for impact.
Using drop testing to validate the MATLAB simulation allowed conclusions to be
drawn about the effect of a range of design variables on g-loading and penetration
depth. Figures 4-3 and 4-4 predicted that increasing the nosecone taper length would
result in decreased g-loading and decreased penetration depth. Figures 4-5 and 4-6
showed the prediction that increasing the penetrator width would result in increased
g-loading and decreased penetration depth. Focusing on the afterbody, Figures 4-
8 and 4-9 predicted that increasing the mass would result in increased penetration
depth but decreased g-loading. Drop testing data also showed that increasing the
forebody mass resulted in increased penetration depth (shown in Figure 4-11) and
that the predicted penetration depth from the MATLAB simulation fell within a 2-
7% error range of the actual measured values (compared in Figure 4-13). Recorded
results from the drop testing also showed that lowering the c.g. position reduced the
emplacement angle into the snow, resulting in final positioning that was closer to
vertical. These results helped to show that structural redesign to lower the c.g. will
be an effective aid in helping to achieve the PAY3 requirement of emplacing within
±10° of vertical.
In addition to the simulations carried out on snow penetration, work on the soil
probe design is described in Chapter 5, establishing additional effects of the pene-
trator geometry. Figures 5-4 and 5-5 show that a more concave nosecone increases
148

g-loading while increasing penetration depth (or decreasing the required impact veloc-
ity to reach a specified depth), and a more convex nosecone decreases g-loading while
decreasing penetration depth (or increasing required impact velocity to reach the
same specified depth). Comparing square and cylindrical penetrator cross-sections of
the same diameter in Figures 5-8 and 5-9 shows that as expected, the slight increase
in cross-sectional area of the square cross-section results in both increased g-loading
and decreased penetration depth. The effect of adding braking disks to the design
is examined in Figures 5-10 and 5-11, showing a drastically wider range of possible
impact velocities can then be used to reach the desired penetration depth, but also
a huge increase in g-loading. At the highest soil compressive pressure values and
highest impact velocity values, a soil penetrator without a braking disk is predicted
to experience loading of around 800-900 G, while a unit with a braking disk may
experience loading as high as 7000 G.
In summary, the present GSIP design is a separable two-body penetrator, designed
for robustness in achieving penetration in snow of unknown properties on the Ross
Ice Shelf. It will be deployed from an LC-130 cargo plane, making use of an existing
polar research transportation resource, and is intended to impact the snow pack on
the Ross Ice Shelf and separate, with the forebody emplacing at least 100% of its
depth into the snow to ensure stable seismic coupling and the afterbody remaining
at the surface so that the GPS and Iridium antennas are placed sufficiently high that
they will not be covered by one year of snow accumulation. These two bodies will be
connected by an umbilical that supplies a power and data link between the two halves.
The penetrator will also be designed to be aerodynamically stable so that oscillations
during the falling phase are rapidly damped, to maximise the probability that the
probe will emplace at a vertical or near-vertical angle into the snow, as is required
by specifications of the microseismometers being used. The scientific objective of
the mission is to improve understanding of the effect of ocean forcing on ice shelf
dynamics and stability, which will require continuous GPS and seismic data to be
recorded for a full year, driving the power requirements for the system due to the
149

need to remotely transmit out the data that is collected. These power requirements
drive the volume and mass of GSIP as a whole, and so if they are significantly updated
then it is expected that the structural design may also undergo notable alterations.
7.1 Future work
As discussed in Chapter 6, there are many areas of the GSIP design which will be
tested and refined further prior to deployment in Antarctica. More drop testing will
be carried out in order to validate the g-loading predictions of the MATLAB model, as
well as assessing the error across a wider range of impact velocities and snow densities
in order to better model the full range of properties that may be encountered upon
deployment to the Ross Ice Shelf and testing the penetrator at its intended impact
velocity range. This drop testing will also be used to judge the success of lowering the
c.g. position in order to mitigate the issues of emplacing at angles that are too large
compared to the PAY3 requirement defined by the microseismometer specifications.
Shock testing of the components must also be carried out to verify that they meet
the requirements of the mission, with particular attention given to the batteries due
to a lack of available shock tolerance specifications.
Aerodynamic testing of the afterbody will be carried out to assess whether it pos-
sesses the desired drag coefficient that it was designed to have. Testing will also verify
whether the afterbody aerodynamic characteristics succeed in giving the penetrator
a terminal velocity within the intended impact velocity range of 20-40 m/s.
Thermal modelling must also be conducted for the GSIP design in order to safe-
guard all components against operating outside of their specified temperature ranges.
Radiation of heat from the penetrator must also be managed carefully in order to
ensure that the snow pack immediately adjacent to the unit is not melted, as this
would result in the loss of seismic coupling necessary for long-term data collection.
150
Battery performance data collected during the deployment of GPS sensors in
Greenland will be used to analyse whether the current power subsystem design is
likely to perform as designed, both in terms of power draw and performance at ex-
tremely low temperatures. Developments in battery technology are also being moni-
tored for any notable advances that may allow for improvements in the overall GSIP
design and reduction of mass and volume. Although the communications power draw
is based on long-term testing and results obtained by MIT Haystack Observatory,
introduction of the new Iridium NEXT satellite service is expected to offer improve-
ments in available data speeds and bandwidth, which may allow for more efficient
communication and a reduction in power draw. Specifications for the new service are
not yet available but this will be monitored going forward in order to determine any
potential effect on the GSIP design.
Ongoing power draw data collected for both RTOS and Linux-based avionics sys-
tem designs will also be used to assess the benefits and drawbacks of using each system
and consider whether the reduced power draw offered by the RTOS design is worth
the additional complexity that this design brings compared to the Linux system. The
microseismometer data input will be incorporated into the avionics design once fur-
ther specifications are received from Imperial College London and a functioning unit
is received for integration into the prototype and testing.
151

152

Bibliography
[1] Lorenz, Ralph D. “Planetary penetrators: Their origins, history and future”,Advances in Space Research 48.3 (2011): 403-431.
[2] Young, C. “Penetration of sea ice by air-dropped projectiles”, Engineering in theOcean Environment, Ocean’74-IEEE International Conference on. IEEE, 1974.
[3] Gowen, R. A., et al. “Penetrators for in situ subsurface investigations of Europa”,Advances in Space Research 48.4 (2011): 725-742.
[4] Gowen, R.A., et al. “Kinetic penetrators for exploration of solar system bodies”,Fifth International Planetary Probes Workshop (IPPW-5), Bordeaux, France.2007.
[5] Collinson, Glyn, and UK Penetrator Consortium. “Planetary penetrators: thevanguard for the future exploration of the solar system”, Journal of the BritishInterplanetary Society 61 (2008): 198-202.
[6] Weiss, P., and K. L. Yung. “Feasibility study of a lunar landing area navigationnetwork deployed by impacting micro-probes”, Planetary and Space Science 58.6(2010): 893-903.
[7] Surkov, Yu A., and R. S. Kremnev. “Mars-96 mission: Mars exploration with theuse of penetrators”, Planetary and Space Science 46.11-12 (1998): 1689-1696.
[8] Linkin, V., et al. “A sophisticated lander for scientific exploration of Mars: sci-entific objectives and implementation of the Mars-96 Small Station”, Planetaryand Space Science 46.6-7 (1998): 717-737.
[9] Blue, Randel C. “Mars microprobe project instrumentation package”, Acta As-tronautica 45.4 (1999): 585-595.
[10] Arakaki, Genji, and Savcrio D’Agostino. “New Millennium DS-2 electronic pack-aging smaller, faster with ‘managed’ risk”, 1998 IEEE Aerospace Conference.Vol. 1. IEEE, 1998.
[11] Smrekar, Suzanne, et al. “Deep Space 2: the Mars microprobe mission”, Journalof Geophysical Research: Planets 104.E11 (1999): 27013-27030.
153

[12] Jones, David H., and G. Hilmar Gudmundsson. “Aircraft-Deployable Ice Ob-servation System (ADIOS) for instrumenting inaccessible glaciers”, Journal ofGlaciology 59.218 (2013): 1129-1134.
[13] Pike, W. T., et al. “A self-levelling nano-g silicon seismometer”, SENSORS, 2014IEEE. IEEE, 2014.
[14] Rosenau, William. “Special Operations Forces and Elusive Enemy Ground Tar-gets: Lessons from Vietnam and the Persian Gulf War”, Rand Corporation, 2001.
[15] Correll, John T., and John T. McNaughton. “Igloo White”, Air Force Magazine87.11 (2004): 58.
[16] McCallum, Adrian Bruce. “Cone penetration testing in polar snow”, Doctoraldissertation, University of Cambridge, 2012.
[17] Manning, Larry A. “Mars surface penetrator: System description”, NASA-TM-73243, NASA Ames Research Center, 1977.
[18] Schenk, Paul M. “Slope characteristics of Europa: constraints for landers andradar sounding”, Geophysical Research Letters 36.15 (2009).
[19] Chenoli, Sheeba Nettukandy, John Turner, and Azizan Abu Samah. “A clima-tology of strong wind events at McMurdo station, Antarctica”, InternationalJournal of Climatology 33.12 (2013): 2667-2681.
[20] US Department of Commerce, National Oceanic and Atmospheric Admin-istration. “What is the cryosphere?” NOAA’s National Ocean Service.http://oceanservice.noaa.gov/facts/cryosphere.html Electronically published on01 November 2011. Accessed on 04 July 2017.
[21] Steffen, K., et al. “Rapid changes in glaciers and ice sheets and their impacts onsea level”, Abrupt Climate Change: A Report by the US Climate Change ScienceProgram and the Subcommittee on Global Change Research (2008): 60-142.
[22] Brunt, Kelly, Joseph MacGregor, et al. “Instrumentation for polar glaciologyand geophysics research (IPGGR): workshop report”, Instrumentation for PolarGlaciology and Geophysics Research Workshop (IPGGR), Linthicum Heights,MD, USA. 2014. https://neptune.gsfc.nasa.gov/csb/index.php?section=285
[23] Brunt, Kelly, Joseph MacGregor, et al. “A summary of current instrumentationfor polar glaciology and geophysics research (IPGGR)”, Instrumentation for Po-lar Glaciology and Geophysics Research Workshop (IPGGR), Linthicum Heights,MD, USA. 2014. https://neptune.gsfc.nasa.gov/csb/index.php?section=285
[24] Munk, Walter H. “Origin and generation of waves”, SIO-REF-51-57, Scripps In-stitution of Oceanography, University of California, La Jolla, California, 1951.
154

[25] Bromirski, Peter D., Olga V. Sergienko, and Douglas R. MacAyeal. “Transoceanicinfragravity waves impacting Antarctic ice shelves”, Geophysical Research Letters37.2 (2010).
[26] “Fact Sheet: About the 109th Airlift Wing”, Air National Guard,109th Airlift Wing. http://www.109aw.ang.af.mil/About/Fact-Sheets/Display/Article/449364/about-the-109th-airlift-wing/ Electronicallypublished on 10 June 2008. Accessed on 10 July 2017.
[27] Parties, Antarctic Treaty Consultative. “Protocol on Environmen-tal Protection to the Antarctic Treaty”, (1960). Available online at:http://www.ats.aq/e/ep.htm
[28] Crary, A. P., et al. “Glaciological studies of the Ross Ice Shelf, Antarctica,1957-1960”, International Geophysical Year Glaciological Report Number 6, IGYWorld Data Center A: Glaciology, American Geographical Society, May 1962.
[29] Mellor, Malcolm. “A review of basic snow mechanics”, US Army Cold RegionsResearch and Engineering Laboratory, 1974.
[30] Iridium RUDICS technical specifications and features, Irid-ium Communications Inc, VA, USA. Available online at:https://www.iridium.com/services/details/rudics
[31] Elosegui, P., et al. “Accuracy of high-rate GPS for seismology”, Geophysical Re-search Letters 33.11 (2006).
[32] Topcon PG-A1 antenna specifications sheet, Hayes Instru-ment Company, Shelbyville, TN, USA. Available online at:https://www.hayesinstrument.com/GPS_Topcon_PG-A1_Antenna.html
[33] Iridium Core 9523 transceiver module specifications sheet, Irid-ium Communications Inc, VA, USA. Available online at:https://www.iridium.com/products/details/iridium-core-9523-
[34] Meteo climate stats, Station McMurdo. Available online at: http://meteo-climat-bzh.dyndns.org/index.php?page=statiid=35
[35] Kingston CompactFlash 8 GB memory card data sheet,Kingston Technology Corporation, CA, USA. Available online at:http://www.kingston.com/datasheets/CF_us.pdf
[36] Technical Specification: Model ER34615 Lithium Thionyl Chloride Battery,Omnicel Batteries, PA, USA. Available online at: http://omnicel.com/spec/er-34615.pdf
[37] “Seismic Penetrating AntarctiC Explorer: Final Report”, 16.831 - Space SystemsDevelopment class, Spring 2016, MIT AeroAstro.
155

[38] Pike, W. T., et al. “A Silicon Seismic Package (SSP) for Planetary Geophysics”Poster, 47th Lunar and Planetary Science Conference, Houston, TX, USA, 2016.
[39] Lognonne, P., et al. "Science goals of SEIS, the InSight seismometer package."46th Lunar and Planetary Science Conference, Houston, TX, USA. Vol. 46. 2015.
[40] Cypress PSoC 5LP Datasheet, Cypress Semiconductor Corporation, CA, USA.Available online at: http://www.cypress.com/documentation/datasheets/psoc-5lp-cy8c58lp-family-datasheet-programmable-system-chip-psoc
[41] ADXL 377 datasheet, Analog Devices Inc, MA, USA. Available on-line at: http://www.analog.com/media/en/technical-documentation/data-sheets/ADXL377.pdf
[42] BNO055 datasheet: intelligent 9-axis absolute orientation sensor, BoschSensortec, Reutlingen, Germany. Available online at: https://cdn-shop.adafruit.com/datasheets/BST_BNO055_DS000_12.pdf
[43] Septentrio AsteRx-m datasheet: Compact low-power dual fre-quency GNSS receiver. Septentrio, Leuven, Belgium. Available on-line at: https://cloud.septentrio.com/public.php?service=files&t=ee0760d93c37208024fcfae4004 a9ea8download
[44] Mast Mount Antenna Model SAF5350-A datasheet, NALResearch Corporation, VA, USA. Available online at:http://www.nalresearch.com/files/Antennas/Iridium%20Antennas/Product%20Information%20Model%20SAF5350-A.pdf
[45] Young, C. W. “Penetration equations”, No. SAND–97-2426, Sandia National Lab-oratories, Albuquerque, NM, USA, 1997.
[46] Shapiro, Lewis H., et al. “Snow mechanics: review of the state of knowledgeand applications”, No. CRREL-97-3. Cold Regions Research and EngineeringLaboratory, Hanover, NH, USA, 1997.
[47] Brown, R. L., et al. “A failure criterion for snow”, Journal of Geophysical Research78.23 (1973): 4950-4958.
[48] Voitkovsky, K. F., et al. “Creep-induced changes in structure and density ofsnow”, The International Symposium on Snow Mechanics, Grindelwald, Switzer-land, 1974. IAHS-AISH Publication 114, 171-179.
[49] Yosida, Z. “Physical properties of snow”, p485-527 from Ice and Snow: Properties,Processes and Applications, MIT Press, Cambridge, MA, USA, 1963.
[50] Fukue, M. “Mechanical performance of snow under loading”, Tokai UniversityPress, Tokyo, Japan, 1979.
156

[51] Armstrong, Richard L. “An analysis of compressive strain in adjacenttemperature-gradient and equi-temperature layers in a natural snow cover”, Jour-nal of Glaciology 26.94 (1980): 283-289.
[52] Anderson, William W., et al. “Emplacement of penetrators into planetary sur-faces”, Journal of Geophysical Research: Planets 101.E9 (1996): 21137-21149.
[53] Suzuki, K., et al. “Analytical model of penetration dynamics into lunar soil withlateral loading”, The 4th Workshop on Astrodynamics and Flight Mechanics, In-stitute for Space and Astronautical Sciences, Sagamihara, Japan, August 1994.
[54] US Geological Survey: Earthquake Facts. http://earthquake.usgs.gov/learn/facts.php Accessed on 30 July 2017.
[55] “Space Penetrating AntarctiC Explorer: Design Document”, 16.83 - Space Sys-tems Engineering class, Fall 2015, MIT AeroAstro.
[56] AntCom datasheet: L1/L2 GPS/GLONASS + Iridium/Inmarsat An-tennas datasheet, Antcom Corporation, CA, USA. Available online at:http://www.antcom.com/documents/catalogs/Page/HL1L2IRA-XSM-4-3_Mini_Quadrifilar_Helix_Stub_L1_L1L2GPS_Glonass_Iridium_Inmarsat_Antennas.pdf
[57] WPSMap – World Personal Seismometer Maphttp://www.wpsmap.com/menu/seismometer.php Accessed on 30 July 2017.
[58] GS-11D Geophone Specifications, Geospace Technologies Corporation, TX, USA.Available online at: http://www.geospace.com/geophones-gs-11d/
[59] U.S. Navy. “Foundations and earth structures design manual 7.02”, Departmentof the Navy, Navy Facilities Engineering Command, Alexandria, VA (1982).
[60] “NASA’s Balance Mass Challenge: Using “Dead Weight” onMars Spacecraft to Advance Science and Technology”, NASA.https://www.nasa.gov/solve/marsbalancechallenge Electronically publishedon 20 September 2014. Accessed on 10 August 2017.
157