descriptor.: *ohio - eric · descriptor.: identifiers. abstract. document resume. ud 023 835....
TRANSCRIPT

ED 249 325
TITLE
INSTITUTIONSPONS AGENCYPUB DATENOTEPUB TYPE
EDRS PRICEDESCRIPTOR.:
IDENTIFIERS
ABSTRACT
DOCUMENT RESUME
UD 023 835
Chapter One n Ohio: Education Consolidation andImprovement Act, 18th Annual Evaluation Report,Fiscal 1983.Ohio State Dept. of Education, Columbus.Department of Education, Washington, DC,Jun 8433p.Reports - Descriptive (141)
MF01/PCO2 Plus Postage.Achievement Gains; Basic Skills; *CompensatoryEducation; Elementary Secondary Education; FederalAid; Parent Participation; Program Costs; *ProgramEffectiveness; Reading Programs; RemedialMathematics; *Remedial Programs; Special Education;Staff Development; *State Programs; State Schools;*Student Participation*Education Consolidation Improvement Act Chapter 1;
*Ohio
This report summarizes recent compensatory education
program activities in Ohio, which were funded through Chapter 1 of
the Education Consolidation and Improvement Act. It presents and
discusses statistics for the 1982-83 school year, participationtrends, instructional impact, expenditure and staffing patterns,inservice training, parent involvement, and five-year trends. Thefirst part of the report describes basic Chapter 1 services.Participants in basic programs are said to have included students atevery grade level, but a majority were in Grades 1-3. The
standardized test scores reported document gains in basic skills(reading and mathematics) for most participants. Expenditure patterns
show that reading programs absorbed the largest share of funding, and
teachers' salaries constituted the greatest single expense. Parents'advisory role is said to have significantly increased theeffectiveness of Chapter 1 in improving student achievement. Theremainder of the report describes Chapter 1 services provided for the
children of migratory agricultural workers, and those handicapped,
neglected, and delinquent children being educated in Statc, agency
schools. Finally, major services provided by the Ohio Department of
Education to local school districts and to State agency schools are
outlined. (KR)
************************************************************************ Reproductions supplied by EDRS are the best that can be made *
* from the original document.*
***********************************************************************
I r


STAVE BOARD OF EDUCATION
Richard C. Glowacki,President. Toledo
Wayne F. Shaffer,Vice President. Bryan
Jean F. Bender, AkronWallace E. Blake, ZanesvillePaul Brieknet, WilloughbyJack C. Hunter, YoungstownVirginia E. Jacobs, LimaRobert H. Johnson, SpringfieldMary R. Lindner, CincinnatiWilliam E. Moon, WoodsfieklSue Ann Norton, WestervillePaul F. Pfeiffer, MassillonEdwin C. Price, Jr., CincinnatiChester A. Roush, KetteringAnthony J. Russo, Mayfield VillageLucy Russo, ClevelandSteven Scheeler, Cleveland HeightsPatricia Smith, WorthingtonSally R. Southard, OxfordJo Thatcher, PortsmouthKaren' L.. Worley, Elyria
Chapter One in Ohio
Education Consolidation and Improvement Act18th Annual Evaluation Report
Fiscal 1983
Chapter One Helps Children 1
Basic Programs 2
Student Participation 3
Instructional Area 5
Impact of Reading Instruction 6
Impact of Mathematics Instruction 7
Expenditure Patterns 8
Staff Positions 10
inservice Education 11
Parent Involvement 12
Parent Advisory Councils 13
Summary of Successes 14
Special ProgramsMigrant Children 16
Handicapped Children 20
Neglected and Delinquent Children 24
State Leadership 28
Five-Year Financial and Human Impact Summary 29
OHIO DEPARTMENT OF EDUCATION Franklin B. Walter, State Superintendent (if Public Instruction 0 R. A. Horn. Assistant
Superintendent of Public Instruction 933 High Street. Worthington. Ohio 43085.

k,
3431*1044M1
-71
A
V
sl
.10 A
Chapter One Helps ChildrenThis 18th annual report provides a summary of recent
activities provided in Ohio through Chapter 1 of the Educa-tion Consolidation and Improvement Act and its predecessor.Title 1 of the Elementary and Secondary Education Act.Information presented includes statistics for fiscal 1983 ( the1982-83 school year and the summer that followed), partici-pation trends, instructional impact, expenditure and staffing
patterns, parent involvment, KO five-year trends.Chapter 1 authorizes a federally funded compensatory pro-
gram for several groups of educationally disadv'antaged chil-dren. The legislation directs that priority educational needs ofthese children he identified and programs designed to provideappropriate supplemental instruction.
Basic provisions of Chapter I are funded on the premisethat areas with high concentrations of low-income familiesalso have high concentr3tions of children who areeducationally disadvantaged. Public school districts areallOcated funds to provide supplemental instruction for suchstudents.
Special provisions of Chapter 1 recognize a federal respon-sibility to improve the educational opportunities available tothe children of migratory agricultural workers.The legislation
'7C.
channels funds through state departments of education fordistribution to school districts where influxes of migrantchildren occur.
Special provisions of Chapter I also recogniie the need forsupplemental instruction to help handicapped, neglected, anddelinquent children who attend school in state-operatedfacilities.
Pages 2 to 15 in this report explain the basic Chapter 1services provided through Ohio's public school districts.Statistics for the current year and five-year trends clearlyindicate that this program helps children become successfullearners,
Pages 16 to 27 describe the special Chapter 1 services
provided for the children of migratory agricultural workersand those handicapped, neglected, and delinquent childrenbeing educated in state agency schools. Here also the statisticsindicate the beneficial human impact of the supplementalservices provided through federal aid to education.
Chapter I in Ohio is administered by the Ohio Departmentof Education's Division of Federal Assistance and Division ofSpecial Education. A description of the state's leadership roleis on page 28.

90L ecO c",R
c.;4,3'oLe8
OSO'ORD
L6'2. lE :99 EC't371.99$
('b
69 t06.6
Rez'vezci
EcO'ZV9'
Ve C/EC'S.3 $
C?,t/Z69.U.
9l
Z,q9 9S7,
99E'Z t V 09$
sampuadxg spund spund
le;01 JaAaJno luanno _ ___ . . _ _. _ _ .
samppuadx3 i amin ialciago :spuaii reaA-anrj
lur*\r VI I I .1.11L1q.)
JO N%otiol
41111N s:1111111, 1111,1Tio1Ll .11.!y '.11?:1 10011:1's
ii1111111) 1111.1k) VIII \\ plt qq!Ll I! t6 ljct. 11)01111., 03
1op,1.111 sJoI1711s11.110.i
p1 poips opi N11111 t)) sl J.1 ti) iittlptItll FIR 111i)i .10( .111,11011ri 4.1
3U11\ ()Iik 1-1011 put! \O
1 TUtl1 .1k11 oiwal 1NI1? .111. \Mil 'ioquoidos Nuibq vito 010 ,1.11 i
10y01.1() ut .u13.1q 4.,14 \\ .117.11 [T!.111 .14t
11 Pa \old& ..)111)tu .1({1 Wu) Juitir.Nu
r '/),) pun/ J.Ildrq.)
b9c'Pt,.; 09
ooe'L Pe 09
OW: tiVZ.C.9
9 l6.609.V9
1,61.clq? LL
C86
e:96t
1961
096
6 /6t JeaA
jeus!A
£961
2961
1961
096
62.6
pAgoav iueio naA leos!A
UO111..11111 JO ;111!I 0111 tot N Lin d,),11
tiiinothl IOU Intl '0.411 Z:8(, 1 1111 ).11
111.1.11,1d 3.11141 Itlirq17 [1.1tiV1.1.1111 pit? IA turai
.1111 1r.LII 31'A 000.000.00t- S; 1110)
s-11 .110 Joi
101 sP111111 `1111'."? ILIP.1!)
.1111 u! Imsoj
lumbuqop i i M13111,11110.1 qlounitriut u .to poti luiptod
-,10 Jot p zi'ut%!3:1.).1 souitim
uo p,w7q Q!ituirj tnIM 1:11/1qp 341 Ut iiUlOL.,1 U.-1.11(1.10s
Oriono 3.14 u..up(Ito it) INUMU
.11.0 110 illOpU.1(1,11) tip1111J0j r uo 11,14.17q
11!..usql lotnrs q3r,,,101tiofmloiir 041
66
96
96
96
-96
spuism llb lo luaured
Bu!ledp!I led sloPisql
sun' 1,;,11,1
10211.1 i. )11111, i 4) It)
()09 1011101 "tN(,1
1'1)111 -'11"0"1"111. Lill -)1 d \ spi,111 I ,1 1Lir ) 11 N1111,11 11
4.1 0 [II .171 11111 III( ILI I \1.117,)\
SUIEJSOM
a

Student ParticipationMost Chapter 1 activii.ce-NirC5hio are
conducted during the regular term, and
over half art." directed toward servingchildren in grades one through three.The 605 school districts providingChapter 1 instruction during the regularterm served 119,640 students. The 9districts haN ing summer term instructionserved 824 students. Of these students,429 participated both terms.
The grade level with the most par-ticipants was grade one with 26,653 stu-
dents. Grade two ranked second with23,599. Grades three and four followedwith 18,485 and 14,99N respectively.
Ver few school districts provide Chapter 1 services at the
secondary le% el. On a combined basis, only 6 percent of allparticipants in fiscal 1983 were in grades seven or above. The
lower percentages of older students do not mean that there are
no educationally disadvantaged secondary students. Instead,it indicates that priorities have been established in line withlocal needs assessment and current levels of funding.
1983 Chapter 1 Students
GradeRanges
Regular Term Summer Term Either or Both Terms
Participants Percent Participants Percent Participants Percent
Prekindergarten 2.778 2ou
-11^-2,778 20/0
Kindergarten 6.063 5 16.064 5
Grades 1-3 68.684 58 169 2100 68.737 57
Grades 4-6 36,183 30 127 15 36.238 30
Grades 7-9 5.013 4 304 37 5.207 5
Grades 10.12 919 1 223 27 1.011 1
Totals 119,640 100% 824 100% 120,035 100%
On the average. nearly 134,000 chil-dren were in Chapter 1 or Title I classesduring each of the last five years.Regular terns students are usuallypros ided mer 31) minutes of extra dailyinstruction for 33 weeks, Summer termstudents t%picall% study under teacherguidance for over an hour a da% forseen or eight \%eeks.
Note that the emerging trend is tosere students during the regular termonly. rather than during both terms orthe summer onk.
Five-Year Trends: Chapter 1/Title I Students
FiscalYear
Regular TermOnly
Summer TermOnly
Both Terms Total
1979 120 81%
._.......3 53: 5 91?
._......__,
130 266
1980 142 562 1.901 1 092 146 155
1981 i 43 0 /5 8:3 081 144 629
1982 125 986 552 .188 1;:)(; 9;1-;
1983 119 211 395 1 20 03)
6

liriate school studenv vi ho meet the selection criteria and
who reside in qualified attendance areas are included in theplanning for basic Chapter I programs and are provided withappropriate services. In fiscal 1983, a total of 5,516 private
school students received Chapter 1 instruction.
1983 Private School Students
Grade Ranges Participants Percent
Kind -grade 3 3.261 59%
Grades 4-6 1.820 33
Grades 7-12 435 8
Totals 5,516 100%
During each of the past five years. an average of 5,900
private school students participated.
4
Five Year Trends:Private School Students
Fiscal Year Participants
1979 4.693
1980 6,412
1981 6,866
1982 6,163
1983 5,517
-E/410k..1
;
Local school districts receive extra Chapter 1 funds to help
students who reside in homes for neglected or delinquentchildren. In fiscal 1983, a total of 2.964 such students were
served. Of these, 364 participated both terms.
1983 Neglected or Delinquent Students
Regular Term Summer TermGrade Ranges ,
Participants Percent i Participants; Percen
Kind. -grade 3 , 310 12% 63 9%
Grades 4-6 380 14 109 16
Grades 7-12 1,939 74 527 75
Totals 2,629 100% 699 100%
The trend in delivery of Chapter 1 services for neglected or
delinquent students is moving from summer only to regular
term or both. In fiscal 1983, over 88 percent of the studentsparticipated during the regular term and 12 percent received
extra help both terms.
Five-Year Trends: Neglected or Delinquent Students
FiscalYear
RegularTerm
SummerTerm
Either orBoth Terms
1979 1,635 671 2.106
1980 2,242 772 2.666
1981 2.024 583 2,396
1982 2.346 545 2.615
1983 2,629 669 2,964
7
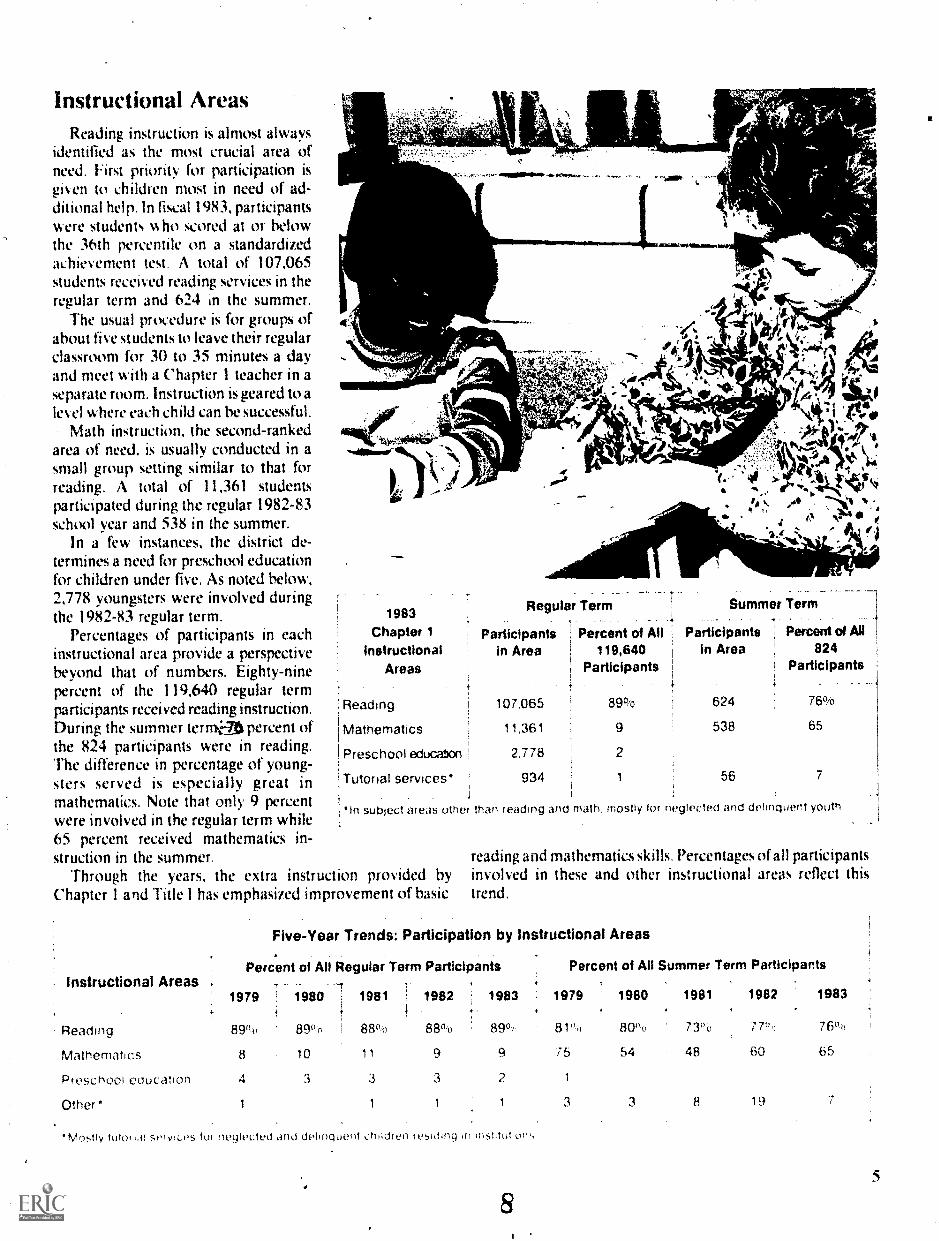
Instructional AreasReading instruction is almost always
identified as the most crucial area ofneed. First priority for participation isgiven to children most in need of ad-ditional help. In fiscal 1983, participantswere students who scored at or belowthe 36th percentile on a standardizedachievement test. A total of 107,065students received reading services in theregular term and 624 in the summer.
The usual procedure is for groups ofabout five students to leave their regularclassroom for 30 to 3S minutes a dayand meet with a Chapter I teacher in aseparate room. Instruction is geared to alevel where each child can he successful.
Math instruction, the second-rankedarea of need, is usually conducted in asmall group setting similar to that forreading. A total of 11,361 studentsparticipated during the regular 1982-83school year and 538 in the summer.
In a few instances, the district de-termines a need for preschool educationfor children under five. As noted below,2,778 youngsters were involved during Regular Term Summer Termthe 1982-83 regular term. 1983 .. .,
Percentages of participants in each Chapter 1 Participants 1 Percent of All 1 Participants Percent of All
instructional area provide a perspective Instructional in Area 1 119,640 I in Area 824
beyond that of numbers. Eighty-nine Areas Participants I Participants
119,640 tpercent of the regular termparticipants received reading instruction.During the summer tern*At percent ofthe 824 participants were in reading.The difference in percentage of young-sters served is especially great in
Reading 107,065 89% 624 76%
Mathematics 11,361 9 538 65
Preschool educatoon 2,778 2
Tutorial services* I 934 1 56 7
imathematics. Note that only 9 percent "In subject areas other than reading and math, mostly for neglected and delinquent youthwere involved in the regular term while65 percent received mathematics in-struction in the summer. reading and mathematics skills. Percentages of all participants
Through the years, the extra instruction provided by involved in these and other instructional areas reflect thisChapter 1 and Title I has emphasized improvement of basic trend.
Five-Year Trends: Participation by Instructional Areas
instructional Areas ,
Percent of All Regular Term Participants--T
Percent of All Summer Term Participants
1979 1980 ! 1981 1982 1983 1979 1980 1981 1982 1983
Reading 89"'D 89% 880A) 880,0 89'1,, 81"11 80°u 7306 77",, 7600
Mathematics 8 10 11 9 9 75 54 48 60 65
Preschool edLic !ion 4 3 3 3 2 1
Other* 1 1 1 1 3 3 8 19
Mosily %OW 1.0 S0lviLr'S for neglectec dlinquent children residing in intilittitrum,

Impact of Reading InstructionTo aluate the effectiveness and impact of Chapter I
reading instruction. each local school uses standardi/ed tests to
check students' skills in the tall and again in the spring.
Differences in test scores are reported in normal curveequix alert N('F ) units.
The NCI'. sx stem of reporting measures academic gains
xx hich can be attributed to extra instruction provided by('hapter 1. To interpret the data. the reader should understand
the follow ing:This ealuation model is designed for students in grades two
and abox e. Younger children are tested near the datesinstruction begins and ends, but NCE gains below grade two
lie not included in this report.
8cores -re reported for only those students who take both
the pretest and posttest. Test scores are converted to NCEs
and composited to the state level.
With only regular classroom instruction, children areexpected to maintain their own position relative to ether
children in the class that is, make no NCE gains.
!With extra ('hapter 1 instruction, children are expected to
achieve (and make NCE gains) at a faster rate thanclassmates xx ho have only regular instruction. A gain of 7
NCEs is considered significant. As the graph below indicates.
second graders' in Ohio who. received Chapter 1 reading
instruction in 1983 were 6 units above this rate. This gain is
especially significant since Over 22 percent of all participants
w ere enrolled at this grade level. Average gain for all students
w as 10 NCI-.s.
1983 Gains in Reading
13 10 7 7 7 6
NCE NCE NCE NCE NCE NCE
Grade Grade Grade Grade Grade Grade
2 3 4 5 6 7-12
,surfs ,r1..00.1 Arr. Inc ,r sanrprinq group which gerif.xrrittNi 1F, 414
,4 )4 fur i,rf Ir1( Jr rI gr;rries atx/ve who plrlI('ipalecl Curing tier,
!r)Iiipir 1411- .41)(1 tor whom pretest itnc1 pr)sttest scofte vvere avariaoit
te
e0
lirmergalf
'I
This extra .thstructiQn annually nelps over IN).()(X) youngsters
improve their basie reading skills. Stated anoth:r way, about
nine of ten participants make gains in reading.
During the past five years, average gain, in reading haveconsistently been at or above the 7 N.s considered sig-nificant. These gains are especially impressixe in light of
Ohio's policy of limiting participation to children xx ho scored
at or below the 33rd percentile on a standardised test iii 1982
and earlier and at or below the 3th percentile in 1983.
FiscalYear
Five-Year Trends: Gains in Reading
Avere,ge NCE Gain by Grade Level
2 3 4 5 6 712
1979 13 13 12 11 9
1980 15 11 9 9
1981 12 10 8 8
1982 10 8 7 8 8
1983 13 10
9
Average forAll Levels
9 1?
8 11
3 10
1, 10

Impact of Mathematics InstructionResults on standardized tests are also used to evaluate the
effectiveness of Chapter 1 mathematics instruction. The sys-tem for reporting.is the, same as that used for reading.
As 1983 gains in mathematics arc stuCiied, keep in mindthat there were only 11,361 regular term participants in thisarea compared with 107,065 in reading.
Note that the average NCI:, gains of second, third, andfourth graders were more than double the number (7)considered significant. The average gain for all studentscombined was 16 NCF.s.
1983 Gains in Mathematics
1rt,
20 21 16 ; 13 13 9
WINCE NCE NCE NCEi iNCE. NCE
Grade Grade Grade Grade Grade Grade2 3 4 5 6 7.12
Gains reported are for a sampling group which generated 2,487 sets of testscores for children in grades two and above who patcipated dunng theregular term and for whom pretest and posttest Scores were available
a F
I
During the past five years. about one of every tenparticipants received extra math instruction. Gains tend to runhigher than those for reading. Also, because of the smallnumbers of studeLls involved in mathematics gains tend tofluctuate more than in reading.
Five-Year Trends: Gains in Mathematics
Fiscal Average NCE Gain by Grade Level
year 2 3 4 5 6 7.12
Average forAll Levels
1979 22 18 26 22 23 10 22
1980 15 15 16 14 14 11 15
1981 19 15 6 11 7 15 10
1982 16 8 6 7 7 7 8
1983 20 21 16 13 13 9 16
1
10
-..14111.

S
Expenditure PatternsPeople trying to understand the size and scope of Chapter I
want to know w hen and how the money is spent.In Ohio nearly all expenditures are made during thetegular
school sear. Less than two-tenths of one percent is used during
the summer months.The money is used for extra instruction, especially in the
area of reading. When expenditures within the
instructional areas are viewed 'as percentages. the importance
placed on regular term instruction and reading is obvious.Expenditures during the summer term are more diversified
with noticeabk percentages increases in mathematics and in
the "other" category, which includes tutoring provided tOrneglected and delinquent children who reside in institutions.
il`
o ---"111101,_
1983 'Thapter 1Instructional Areas
Regular Term
Expenditures Percent
Summer Term
----Expenditures Percent
Fiscal Year
Expenditures Percent
Reading $70,232,969 8600 $96,805 78°'o $70,329,774 86%
Mathematics 7,246,938 9 24,070 20 7,271.008 9
Preschool education 3,051,979 4 3.051,979 4
Other* 1.397,274 1 2,673 2 1.399,947
Totals 381,929,160 100% $123,548 100% $82,052,708 100%
"Supportive services and tutoring to neglected and delinquent Children residing in institutions
The trend in Ohio. not only for thelast fix e sears but for the preciousthirteen. has been to concentrate ex-IN:minutes on the improvement of reading
Secondar% emphasis has consis-tendy been on the imprmement of mathNhiiiN. The onl% other area oath sig-turi1/4:ant expenditures is preschooleducation.
Five Year Trends: Expenditures by Instructional Areas
Instructional Areas 1979 1980 1981 1982
Reading 840T 850o 8300 850,,
Mathematics 9 10 10 10
Preschool education 6 5 5 4
Other" 2 1
1963
86%
9
4
s
4
_J
'Supportive Sef VI(VS and iutor my for neglected and delinquent children residing in institutions
11
A-
4

1983 Chapter 1Function Areas
Regular Term Summer Term Fiscal Year
Expenditures Percent Expenditures 1Percent Expenditures } Percent
SX.111eS All(111111qt. bentftits Si 8.0E-12 3%3 9"-.) ', S115.495 93 ,. $78 1 :.868 95-..:.,
InStruCtiorillArid t.t.iionlent ;' 2;'4 !);:' 3 4.409 4 7 229 041 3
!.;:,pporiRe 1 642 21', 3 ',t-i4 3 1 ti45 :99 9g
Totals $81.929,160 100 °o $123,548 100°) $82,052,708 1000,0
\ .iist) t`C b\ theii use toihenetits. instr uction.il mato i.ils. supplies.
equipment. mid ,uppoi sei ices As indiLated here and onIII )\1/41I1,,, p.it!L , 1110st ttt 01C 111011e1 Is L'I11r111\
I%'.1 }WIN ,111d wil. LhIc tll 111th LlIthirC11 Inth.ill lot11-1C1101s kilIC pLit:C111 Is llsCti lift
ckoll pmcnt
Five-Year Trends: Expenditures by Function Areas
Function Areas
nry,! tf Inge: t14,1101t$
1979 1980 1981 1982 1983
94 92 93 95" 95
i t '
Instrucliorml,tmo equipment 3 4 3 2 3
SuPOortve servct.s 3 4 4 3 2
4
p.:&rniar
PEci PPITEANS
12
Another way to look at expendituresis by average cost per student receivingextra instruction during the regular term.surrimer term, or both.
In fiscal 1983. the 119.640 children inregular term activities were served at anaverage cost Of $685 each or about$4.15 a day. In a typical seven-weeksummer session, the average cost foreach of 824 students was $ I:Ws or about$4.28 a day,
Average Participant Expenditures
Fiscal Regular SumMer BothYear Term Term Terms
e
1979 $536, $ 83 $619
1960 595 132 727
1981 642' 116 15E5
1982 657 : 128 ,785
1983 685 150 835
9

Staff PositionsNinety-five percent of all Chapter 1
expenditures in 1983 were for salariesand related costs. Who received thesesalaries and 'vhat services did theyprovide to students'? An overview ofstaff positions provides a general answer.
A total of 3,069 teachers, some ofwhom worked as tutors, were employedduring the regular term and 58 workedduring the summer. The average regular
term teacher met with seven groups offour or five children daily. In the summer.the typical teacher met with two or threegroups of six to eight children.
Chapter 1 teachers are sometimes assisted by aides. In1983. a total of 650 aides assisted Chapter 1 teachers during
the regular term. In the summer, no aides were employed.During the regular term, 93 percent of the full-time
equivalent positions were filled by teachers, tutors, and aides
who worked directly with children. In the summer, 97 per-
1983 Chapter 1Staff Positions
Teachers/tutors
Teachers aides
Coordinators, supedirectors
Secretaries
Other supportive
Totals
visors,
Regular Term
Full- j Part-Time r Time
Full-Time Full-Equivalenti Time
Summer Term
Part- Full-TimeTime Equivalent
2,372 697 2,708 30 28 41
476 i 174 561
42 291 102 1 1 2
37 172 75
37 220 64
2,964 i 'i,554 3,510 31 29 43
_ J
cent of the positions were filled by teachers and tutors.The effectiveness of Chapter 1 depends on concentrated,
direct instruction of children. Between 1979-1983 the average
regular term Title I teacher met with 37 to 44 children per day
with four to six per class. During the summer, when morning
only sessions are typical, the average teacher met with 12 to 19
children per day with seven to nine per class.
Five-Year Trends: Chapter 1/Tftle I Staff Positions
Regular Term
Staff Positions 1979 , 1980 1981 , 1982 1983
Teacher /tutors(full-time equivalent) 3,449 3,679 3,382 3,016 2,708
Participants 126.729 144,254 143,756 126,374 119,640
Average pupil-teacherper day ratio 37- 1 39-1 43 -1 42-1 44-1
Average pupil-teacher classsize ratio 4-1 5-1 5-1 6-1 5-1
10
;A
5
f T1979
664
9,449
4-1
7-1
,4111C._
7:4111141.'r.1
Summer Term
1630 1981 1982 1983
274 125 58 43
3,593 1.554 940 824
13-1 j 12-1 16-1 19.1
7-1 8-1 9-1 7.1
**Provo.
13

Inservice EducationThe teachers, aides, and others who arc responsible for
helping Chapter 1 participants become succesful learners needto renew or upgrade their skills periodically. For this reason,even though many Chapter 1 teachers have masters degreesand numerous years of successful teaching experience, inserviceeducation is considered an important Chapter 1 activity.
In 1983 a total of $328,320 was used to provide inserviceeducation for 3,159 of the persons who held Chapter 1 staffpositions. An additional 1,050 other staff members whoworked with Chapter 1 participants also had the opportunityto improve their skills and understanding through theseinservice activities.
In some instances, inservice is provided by the local distnct.In many counties and multicounty areas, districts worktogether to provide more comprehensive inservice education.
1983inservice Participants
Chapter 1Staff
Teachers 2.313
Teacher aides 538
School administrators 218
Curriculum specialists 13
Others 77
Totals 3,159I
OtherStaff
542
52
198
32
226
1,050
jimmordwa..-
04
aMilairge-
1 4

Parent InvolvementThe major goal of all parent involvement related to
Chapter 1 is improved student achievement. As would beetpected. types of involvement are varied. A very im-portant t pc. parent advisory council membership, is
discussed separately on the following page.Parents of all Chapter 1 participants are also encouraged
to MCC( NN tilt Chapter I teachers to discuss the progress and
learning problems of their children. Classroom teachers
arc sometimes in ited to participate in the same conference
k) 0 R' a more coin-din:lied approach to helping the child.
11an parents visit their child*. Chapter 1 class; help make
1983 Types of Involvement
Individual conferences with
Parents*
Chapter 1 staff members 80,702
Classroom visits by parents 25.804
Group meetingsin addition to council meetings) 20,722
Home visits byChapter 1 staff members 8,313
An estimated total of 68.795 parents of Chapter 1 students wereinvolved one or more times in the listed activities
ti"
dot
-44rp.... ,
12
1.4;11111111114..11111114......
.41041Pir
-44 "I-4"
-4,
instructional' games for use at school or at home; attendmeetings Nith guest speakers: or help out as %olunteer tutors,
stor% tellers, or monitors.Teachers in some districts visit homes to encourage parent
involvement and to gain a better understanding of the needs of
individual children.One noticeable change in parent involvement in the last
two years has been a shift in emphasis away from home visits.
The numbers of parents involved in the other categorieslisted below have tended to decline in proportion to the de-
clining number of student participants.
Five-Year Trends: Other Parent Involvement. -
Fiscal ; individual Classroom
Year i Conferences Visits
1979 91,857 31,641
1980
1981
1982
1983
rS
94,018
91,239
87,963
80,702
33,808
33,739
29,394
25,804
-C-
GroupMeetings
' HomeVisits
32,058 13,131
28,948 14,798
24,900 14.715
21,165 9,840
20,722 8,313
15

Parent Advisory CouncilsChapter 1 regulations require school districts to convene an
annual public meeting for the purpose of explaining activitiesand programs to the parents of participating children. Districtsmay provide reasonable support for add,,ional parent activities.
Chapter 1 legislation dropped the restrictive requirementsof its predecessor, Title I, for formal school and districtcouncils. However, most districts in Ohio continued schoolcouncils as locally designed organizations. District councilswere kept in many districts, but without rigid requirements.Thus, members and school administrators were able tomodify their procedures to better suit local needs.
Involvement of parents in an advisory role significantlyincreased the tiTectiveness of Chapter 1. Typical activities ofschool comcil members included working on committees,observing in classrooms, organizing activities for other parents,and working as volunteers.
At the district level, council members were likely to discussand recommend ways to improve the district's Chapter 1activities as they relate to the needs of children, help arrangeone or more districtwide or countywide meetings for parentsof all Chapter 1 participants, or assist with exchanges ofinformation through newsletters or tours of several Chapter 1classrooms.
During fiscal 1983, a total of 2,309 advisory councilmeetings were held at the school level. Membership was arecord-high 30,118. Another 952 meetings were held at thedistrict level, where membership totaled 4,469. In addition to
1983Council Membership
Parents of public
SchoolCouncils
DistrictCouncils
school participants 27,932 3,792
Parents of private schoolparticipants 704 168
Parents of eligiblebut unserved children 793 180
Community representatives.other interested persons 689 329
Totals 30,118 4,469
=_AF 1111
UP._Amnia
local school and district meetings, council members wereencouraged to organize and attend county or multidistrictmeetings.
School council membership has increased gradually duringthe past five years. Reasons for the increase include dedicatedefforts by Chapter 1 teachers and school principals to reachparents and convince them of the importance of councilactivities in relation to their children's academic achievements.
As expected, in the absence of a mandate, district councilmembership declined in 1983. Parents, especially those inlarge city school districts or in sprawling rural districts, preferto be involved at the school which their children attend.
16
Five-Year Trends: Council Membership
FiscalYear
SchoolCouncils
1979 22,950
1980 25,217
1981 26,177
1982 26,238
1983 30,118
DistrictCouncils
10,176
9.144
8.172
7,528
4,469
.i
13

Chapter 1 helps children! Evaluation data gathered inlocal school districts and compiled at the state levelclearly indicate that thousands of children are helpedeach year.
The following list provides supportiveevidence and a
summary of Chapter 1 operations during fiscal 1983 (the1982- 83 school year and the summer which followed).
Of Ohio's 615 school districts, 606 or 99 percentconducted Chapter 1 programs.
Local school districts spent $82,052,708 of Chapter 1funds, plus $14,096.578 of other funds, to provide thisextra instruction for 120.035 educationally disadvan-taged children.
Most Chapter 1 activities were in the regular schoolterm, during which over 99 percent of the participantsreceived instruction and nearly all expenditures weremade.
Ninety-four percent of thestudents receiving Chapter 1instruction were in grade six or below. The greatestconcentration of pupils, 57 percent, was in grades one
through three.
'Highest priority for Chapter 1 services is given toreading. Eighty-nine percent of all regular termparticipants and 76 percent of all summer termparticipants received instruction in this area.
Chapter 1 Basic Program:"
Chapter 1 participants are making significant achieve-ment gains. Students receiving extra instruction inreading gained an average of 10 NCEs (the normalcurve equivalent unit of measure especially de-signed to measure Chapter 1 progress). Studentsreceiving mathematics instruction gained an aver-age of 16 NCEs. (A gain of 7 or above is consideredsignificant).
Eighty-six percent of all expenditures for the year weredirected toward reading instruction. Next in moneyexpended were mathematics and preschool education,with nine and four percent respectively.
Ninety-five percent of all expenditures for the yearwere for staff salaries and related fringe benefits.
School districts hired 2,708 teachers or certified tutors,on a .full -time equivalent basis, to instruct Chapter 1participants during the regular term. During the summerterm, districts hired 43 teachers or tutors on a full-timeequivalent basis.
Parent advisory councils, even though they were nolonger required by law, were an integral part ofChapter 1. A total of 4,469 parents served on districtcouncils and 30,118 (a record high) were on buildingcouncils.
i
14
A
1k
17
a
ref

Summary of Successes
Several reasons for the success of Chapter 1, and itspredecessor Title 1, are apparent:
'Provision of concentrated instructional services forselected educationally disadvantaged children.
Emphasis on needs assessment and diagnostic-prescriptive instruction.
'Concentration on improvement of basic reading andmath skills.
Coordination with classroom instruction.
Reliance on school principals as instructional leaders.
*Support by local boards of education with additionalfunds for Chapter 1 /Title I purposes.
;Meaningful involvement of parents in advisory roles.
This program is working in Ohio, but much more mustbe done if the instructional needs of eligible children areto be met in the future. Several courses of action byschool administrators are recommended:
*Continue to use available funds prudently.
Encourage teachers, principals, and parents to worktogether to plan and carry out Chapter 1 instructionalactivities.
Urge teachers to continue developing personalizedinstructional plans for each child in a Chapter 1 class.
Seek ways to motivate more children to improve theirreading skills.
Continue to involve parents in meaningful advisoryroles.
Convince legislators and the public through effectivepublications, audiovisual presentations, and speakingengagements that Chapter 1 helps children.
Concerned parents, educators, and other communityleaders must also convince the President, members ofCongress, and other government officials that:
Chapter 1 helps thousands of children annually toimprove their reading and math skills and to besuccessful in school.
Much remains to be done to help thousands ofadditional educationally disadvantaged children eachschool year.
Children who aren't helped to master basic academicskills are more likely to end up on unemployment andwelfare rolls in the future and cost more in tax dollarsinstead of less.
*Local school districts and states cannot solve educa-tional problems alone.Federa/ aid for areas of specialneed is essential.
5 h
A
*A.
s5

Special Programs for Migrant ChildrenEducational programs for children of migratory agri-
cultural workers are currently funded through special provisions
in Chapter 1 of the Education Consolidation and Imrovement
Act.Annual grant awards to the state are based on a count of
school-age children and the number of days they are in Ohio.
Recruiters locate families as they move from state to state and
community to community, register the children and have
information about them sent to the national Migrant Student
Record Transfer System, and tell parents about the educational
services provided through Chapter 1.The table below reports the number of children counted for
the past five years and the grant awards.
Ohio Child Count and Funds
Fiscal YearChildren
Ages 0.21Grant Award
1979 5,695 $1,488,656
1980 5,615 1,712,154
1981 5,400 1.712.154
1982 5,474 1,712,154
1983 5,796 1,455,331
Three crops (pickles, tomatoes, and sugar beets) and truck
farming attract workers and their families to Ohio. School
districts, primarily in northwestern and western parts of the
state, which anticipate influxes of migrant students apply to
the Ohio Department of Educationor funds. Allocations and
16
budgets are based on the number of students expected and the
services to be provided. If enrollments run higher or lower,
adjustments are made.The number of students who enroll each year fluctuates
with labor demands and weather conditions.
Fiscal Year
1979
1980
1981
1982
1983
Districts and Participants
Districts
28
29
26
26
27
Participants
3,872
3,203
2,860
3,240
3,190
A few migrant families arrive in Ohio in time for spring
plowing. The greatest influx is during the months of July and
August. Many families stay until the first frost in lateSeptember or early October. Seasonal enrollment for the last
five years illustrates these trends.
Enrollment by Seasons of the Year
T. 1981 1982 1983
i 128 78 , 119
I 1,905 2.017 2,059
I 1.429 1,257 1,785
Se icon 1979 1980
Sprtig 82 133
Summer 2,259 2,382
Fall 1,899 1,622
19

(her t`,0 percent ol the migrant xoungsters receivingChapter I instruction are usually enrolled in grades onethrough six. About 20 percent are typically in preschool orkindergarten. The remainder are in grades seven throughtweixe.
Chapter 1 /Title I Enrollment by Grade Ranges
Fiscal Year PreK-K 1.3 4-6 7-12
1979 22"0 36% 26% 16%
1980 23 36 25 16
1981 19 35 27 19
1982 23 34 24 19
1983 20 34 30 16
Instructional emphasis is on helping younger childrendevelop English language skills. Oral language. in particular.is stressed because many of the children are predominatelySpanish speaking. Improvement of reading and math skills isalso emphasized. The typical student often receives instructionin more than one subject area. especially during the spring andsummer.
Elementary Instructional Areas
Subject AreasPercent of 1983 Enrollment
Spring Summer , Fall
Oral language 52% 44% 83%
Reading 52 99 83
Mathematics 28 97 68
At the secondary level during the spring and falt:'migrantstudents have the same course choices as local students.Chapter 1 migrant funds are used primarily to provideteachers for pullout classes or tutoring, as needed. During thesummer, both academic and vocational subjects are offered.Several school districts schedule summer evening classes sothat older students can both work and attend school.
Secondary Instuctional Areas
Subject AreasPercent of 1983 Enrollment
Spring ; Summer Fall
Tutoring/pullout classes 100% 100%
English/ESL 30%
Mathematics 18
Vocational 15
Other subjects 59-
2017

About 84 percent of the funds for migrant education artypically used for staff salaries and fringe benefits. Because (
the nature of migrant education, supportive services arenecessary. During the summer months.'pupil transportation,food, and health services are provided. Other supportiveservices include student recruitment and transmission ofhealth and educational information to the Migrant StudentRecord Transfer System.
Expenditures by Function Areas
Function Areas t 1979
Salaries, fringe benefits
instructional materials,supplies, equipment
85%
3
Supportive services 12
Parent involvement is required bylaw. Types of involvement includeconferences with teachers, attendanceat open house events, recruitmentassistance, and school advisory council
roles.
18
Parent involvement
Types of InVolvement Term 1979 1980 1981 1982 1983
Spring 4-4
I 5
Individual conference Summer 96 172 147 223 250
Fall 114 138 149 123 129
Summer 789 1,018 965 746 673
Open house attendance Fall 14 80 55 67 88
Spring 12 14 10 6
Recruitment assistance Summer 25 40 103 110 57
Fall 34 22 20 5 32
Spring 2 13 7 t 2
Advisory council membership Summer 113 138 155 135 63
Fall 70 103 96 23 15
ITAN[" -"I
21

I S
r
AN6114L
MP"1
iT
IMP
Chapter 1 for Migrant Children: Summary of Successes
Fiscal 1983 highlights and successes of migrant edu-cation in Ohio include the following:
About 90 percent of the 3,190 participants wereinterstate travelers, most with home base addresses inTexas or Florida. The parents of about 10 percent wereformer migrants who have permanently settled in Ohiowithin the last five years. Less than one percent werefrom families who traveled within the state to obtainagricultural employment.
During the summer months when regular schoolswere not in session, districts operated special migrantschools. In the spring and fall, both elementary andsecondary migrant children spent most of the day inregular classrooms. Those who needed extra assistancewere "pulled out" for supplemental instruction whichwas tutorial in nature.
.Emphasis was on instruction which helps youngerstudents improve their basic skills in oral language,reading, and mathematics. The subjects most frequentlystudied by older students were English, mathematics,and science.
Eight districts enrolling over 150 migrant studentsduring the summer were Eastwood, Elmwood, Findlay,Fremont, Lakota, Old Fort, Pike-Delta-York, andWoodmore.Six districtsGenoa, Gibsonburg, Leipsic,Napoleon, Toledo and Willardserved 100 or morestudents in the fall.
.Two districts provided year-round programs, with 34students enrolled in Fremont and 39 in Toledo.
Forty- nine high school students earned one-half ormore units of credit which were transferred to the highschool of their choice in Texas or Florida, or whereverthey plan to graduate. Information about hours ofinstruction was transferred for all high school students.
The state migrant education center provided consultantservices, developed instructional and recruitmentmaterials, and distributed media resources.
Additional materials will be available to migrant studentsnext year, thanks in large measure to 546 instructionalkits donated by National Geographics. Distribution willbe through the state migrant education center.
State-sponsored workshops were held for variousgroups including administrators, teachers, transferrecord clerks, recruiters, and nurses. The most com-prehensive inservice effort was a one-week English-as- a-second language workshop for teachers.
*Ohio's terminal for the national Migrant Student RecordTransfer System continued to send and receiveinformation about migrant children living in Ohio.
22 19

Ett,""---r
A4,
4
aka
4
dt
4
41,*
s.
Special Programs for Handicapped Children
Another of the three special sections of Chapter I provides
supplementary funds to meet important educational needs of
handicapped children in state-operated and state-supported
schools. In Ohio, during each of the past five years, an average
of 5.900 children have been helped through this source of
federal aid to education.A trend toward fewer participants reflects declining
Programs, Participants, and Funds
Fiscal Year Programs1 Participants Grant Award
1979 100 6,915 $6.788,169
1980 102 6.731 7,331.154
1981 99 5.885 6,993,862
1982 104 4,766 7,019,161
1983 109 5.128 6.825.058
20
populations in residential institutions and provision of more
services through local schools. The grant awards have been
stable enough for school officials to keep pace with inflation-
related costs and to provide more effective services to the
youngsters selected for Chapter 1 activities.
In fiscal 1983. the Ohio Department of Mental Retardation
and Developmental Disabilities provided Chapter 1 services
to 4,469 youngsters. Participants were enrolled in two types of
special- purpose schools:Eighty-six schools for mentally retarded and developmen-tally disabled children. (These schools are operated by
county boards of mental retardation and developmentaldisabilities under the auspices of the state agency.)
Ten schools for mentally retarded and developmentally dis-abled children residing in state developmental centers.The Ohio Department of Mental Health provided Chapter
1 services in 13 schools within psychiatric hospitals. A total of
369 emotionally disturbed students benefited.
23

The Ohio Department of Educationoperates two residential schools forhandicapped children ---the Ohio StateSchool for the Blind and the OhioSchool for the Deaf. In fiscal 1983, theseschoels provided Chapter 1 services to290 students.
Eighty-five percent of the handicappedchildren in Ohio who received Chapter1 services were enrolled in county-operated schools. The others attendedschool on the premises of the statefacility where they permanently ortemporarily lived.
Chapter 1 /Title I Participants by Type of School
1979 1981 1982 7 1983-4
Type of School 1980_
County Boards of Mental Retardationand Developmental Disabilities 5.647 5.637 5.072 4,103 4,336
Mental Retardation and Develop-mental Disabilities Centers 450 431 269 144 133
Mental Health Hospitals and Centers 332 282 236 272 369
Ohio School for the Deaf 345 249 187 175 174
Ohio State School for the Blind 141 132 121 72 116
Totals 6,915 6,731 5,885 4,766 , 5,128
Special Chapter 1 funds for handicapped children areused to provide educational services that supplement thoseprovided by state and other federal funds. An assessmentof instructional needs frequently leads to a provision ofservices for children who are under or above the tradi-
Fiscal
Year
1979 23°c Age 5 or under
1980 26% Age 5 or under
1981 f 270o Age 5 or under
1982 29% Age 5 or under
1983 2900 Age 5 of under
1
tional school ages of six through seventeen. Informationabout age ranges has not been reported consistently in thelast five years, but the data indicate that a trend towardproviding more services for those under age five or under isemerging.
Participants by Age Ranges
64-il Ages 6-18
1 69% Ages 6-17
g6% Ages 6-17
28% Ages 6-12
26% Ages 6-12
43°/a Ages 13-21
I45 % Ages 13-21
1 **
sc
24
13"t) Ages 19-21
15% Ages 18-21
17% Ages 18-21
fb
ee 0 Se.
Y.,f j.
-
al
21
Ninety-eight percent of all funds made vvailable in fiscal
1483 through state agency provisions of Chapter I for.
handicapped children were used for instructional salaries,fringe benefits. or contracted personal services.
Expenditures by Function Areas
Function Areas 1979 1980 1981
Salaries. fringe benefits.contracted personalservices 99% 99% gd%
Instructional materials,supplies, equipment.supportive services 1 1 1
Administration ; 1
Eitirnated I -1 mostly in salaries for 1979-1980,
1982
98%
1
1
1983
98%
1
1I
soA.I
VI
8
I.a*.
ii
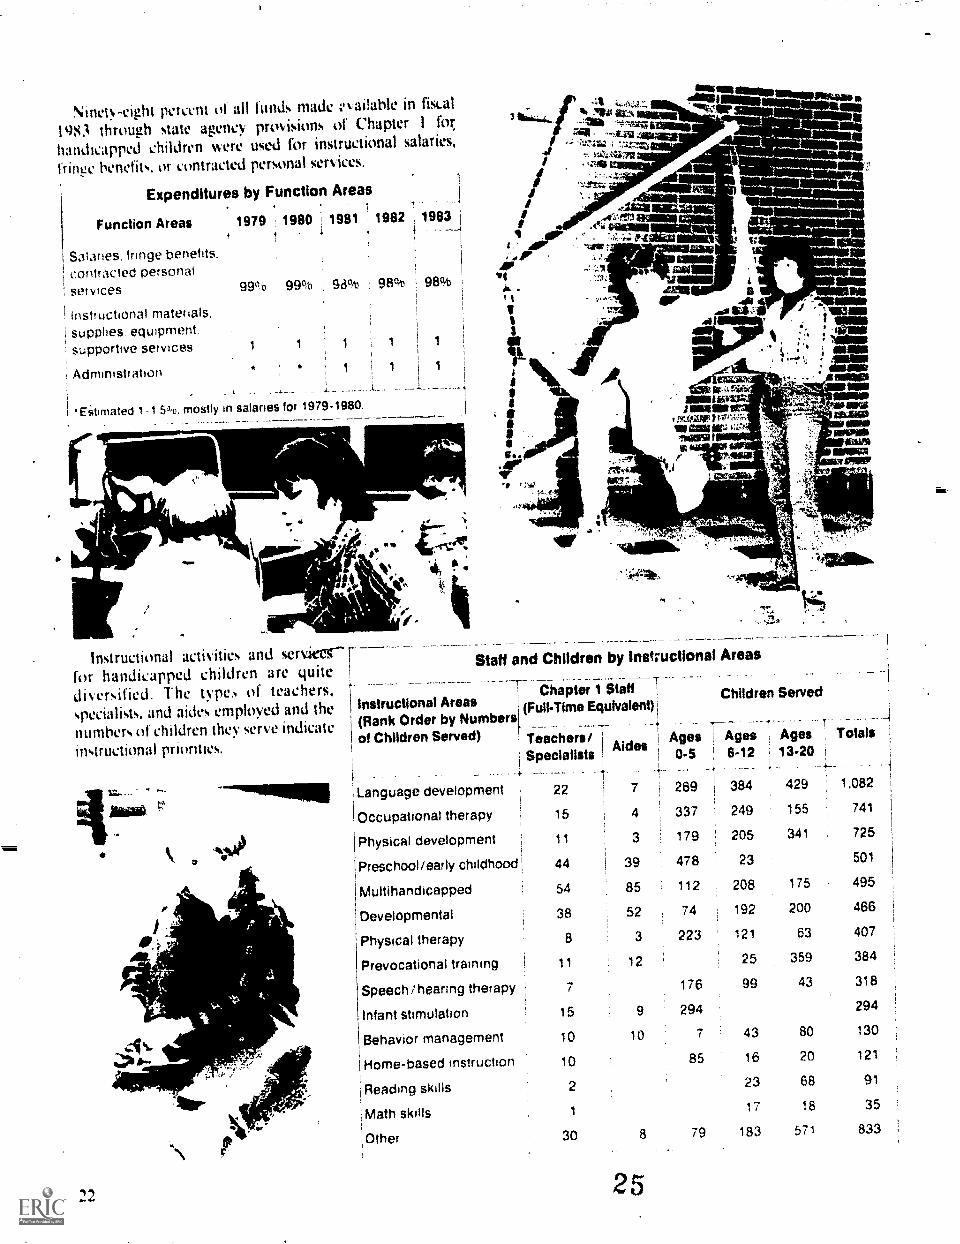
Instructional activities and so-vial--for handicapped children are quitediversified. The type. of teachers,specialists, and aides employed and thenumbers of children they serve indicate
instructional priorities.
-1%-
"
lir
fr
t
q
*ITAti°444144.4'14.424 WT.%ealatlibilarkaii.....= out--nami "vws moo
4-ain -4.41'04'21.2
NNWAMMO.
a
tit=
4
1;
Mum
it MK111111s/MEM
fatozieftgr,*4iwiteWar.1141663
,
-4401116;.
I ;
_ WNW
WM*MPS
MAWMOM
Aw=mrta.,210NM=
Staff and Children by Instructional Areas
instructional Areas(Rank Order by Numbersof Children Served)
--- .
Chapter 1 Staff T
(Full-T(me Equivalent)1
Teachers/Specialists
Aid" Ages0-5
Children Served
Ages T. Toi ges , tals, 13-20 1
7 Ages' 6-12
Language development 22 7 269 384 429 1,082
Occupational therapy 15 4 337 249 155 741
Physical development 11 3 179 205 341 725
Preschool/early childhood 44 39 478 23 501
Multihandicapped 54 85 112 208 175 495
Developmental 38 52 74 192 200 466
Physical therapy 8 3 223 121 63 407
Prevocational training 11 12 25 359 384
Speech! hearing therapy 7 176 99 43 318
Infant stimulation 15 9 294 294
Behavior management 10 10 7 43 80 130
Home-based instruction 10 85 16 20 121
Reading skills 2 23 68 91
Math skills 1 17 18 35
Other 30 8 79 183 571 833
25

Another way to look at the impact of Chapter 1 funding forhandicapped children is through the services provided withineach of the types of schools.
The schools operated by county boards served the mostchildren and, as would be expected, their Chapter 1 serviceswere the most diversified. In fiscal 1983, services forpreschoolers and classes for school-age multihandicappedchildren were typical priorities.
State institutions for the mentally retarded and devel-opmentally disabled frequently used Chapter 1 funds toemploy additional teachers and aides for developmental andprevocational classes.
At the schools for hospitalized emotionally disturbedchildren, Chapter 1 instruction was directed towardimprovement of reading and math skills and towardprevocational and career awareness orentation.
Students at the Ohio School for the Deaf were providedwork-study classes and occupational therapy.
Chapter 1 at the Ohio State School for the Blind includedmobility training and improvement of daily living skills.
Because of the severity of handicaps and diversity ofChapter 1 services, statistics compiled at the state levelmust be generalized. As the table oelow indicates, from 76to 85 percent of the students in all age ranges successfullyachieved over one-half of their short-term objectives.
Student Progress With Short-Term Objectives
Degree of ImprovementAgeeb_s
Ages6 -12
Ages13,21 Totals
-Marked improvement
(80-100% achieved) 510/o 33% 33% 1 39%
Improvement(50-79% achieved) 43 43 40
Little or no improvement(49% or less achieved) 15 24 24 21
Chapter 1 for Handicapped: Summary of Successes
Students with severe handicaps are successfullyachieving realistic short-term objectives. Teachers andother evaluators, using both subjective and objectivecriteria, report that fiscal 1983 Chapter 1 funds helpedseven or eight of every ten students reach over half ofthe objectives set for them.
Typical achievements were such taken-for-grantedskills as sitting without support, toilet training, self-feeding, making intelligible sounds, and communicatingwith teachers and parents.
Parents are involved in decisions related to placement
of the child and types of instructional services to beprovided. In some instances, home trainers or teachershelp parents learn ways to cope with the child'sdeficiencies and to reinforce skills learned at school.
Chapter 1 funds are also used to provide workshopsand other types of inservice training designed to increaseteacher and parent effectiveness under very challengingcircumstances.
In summary, severely handicapped children have aright to appropriate educational services and Chapter 1is one piece of legislation Mich addrinses this need.
itt
"MINN IIMIN
26
(*.Plikr
:!- -;- *
23

'"'w
Special Programs for Neglected andDelinquent Children
Separate provisions of Chapter 1 also provide funds forimproved educational opportunities for i1511, and ddinquent-
--thildrerrwhuattebdtUte agenc-Yiaiiiols. TheOhio Department
of Youth Services, the Ohio Department of Rehabilitationand Corrections, and the Ohio Veterans' Children's. Homereceive funds and conduct Chapter 1 programs.
During fiscal 1983, the Ohio Department of YouthServices used Chapter 1 funds to help 1,171 delinquentyoungsters in nine schools. Emphasis was placed on additionalbasic skills instruction in the areas of reading and mathe-matics. Supportive services included language development.
The Ohio Department of Rehabilitation and Correctionsprovided supplemental reading and math instruction to 488sixteen...,through twenty-year olds serving terms at LebanonCorrectional Institution, Mansfield Reformatory, anddheOhio Reformatory for Women at Marysville.
ThP0hio Veterans' Children's Home in Xenia provided143 residents with extra reading and inath instruction.
24
,
Supportive activities inchIded psychiatric services, tutorial
assistance, and language development.During each of the last five years, over one million dollars
has been used to provide extra instruction to an average of1,723 neglected and delinquent children.'nearly all of whomwere wards of the state or the courts.
Programs, Participants, and Funds
Fiscal Year Program Participants Grant Award
1979 14 2,231 $1,205,061
1980 13 1,369 1,370,301
1981 13 1,340 1,224,522
1982 13 1,873 1,244,168
1983 13 1,802 1,006,212
27

The number of participants served each year tends to varyin line with the number of children committed to agency care.
Chapter 1 /Title I Participants by State Agency
Agency 1979 1980 1981 1982 1983
abrOhio Department ofYouth Services 1,713 746 694 1,0E5 1,171 ---aa.14Fr
Ohio Department of Rehabil-itation and Corrections 438 545 552 641 488
Ohio Veterans' Children'sHome so 78 94 167 143
Totals 2,231 1,369 1,340 1,873 1,802
Over 90 percent of all expenditures regularly go forinstructional salaries, personal service contracts, and fringebenefits. The remainder goes for instructional resources andsupportive services.
Expenditures by Function Areas
Function
Salaries, fringepersonal servic
Instructional msupplies, equipsupportive sere
Administration
*Estimated 1-2%,
,reas 1979 1980 1981 1982 1983
benefits,i contracts 97% 94% 93% 94% 95%
.terials,meat,ices 3 6 5 2 1
* * 2 4 4
mostly in salaries for 1979-1980.
Expenditures can also be categorized by instructional areas.During each of the past five years, over 50 percent of allavailable funds were used to improve reading skills. Another35 to 43 percent of the expenditures were for mathematicsinstruction.
Expenditures by Instructional Areas
Instructional Areas 1979 1980 1981 1982 1983
Reading 54% 51% 61% 55% 49%
Mathematics 43 43 35 40 35
Other* 3 6 4 5 16
*Includes tutorial services and language development.
4 28
a5
6
25

Seventy-three percent of the 1,802
participants in fiscal 1983 received extra
instruction in reading. To evaluateacademic progress, standardized tests
were used to check students' skills when
they began instruction and again when
instruction ended. During 1983, theextra reading instruction enabled 55percent of these students to gain onemonth or more for each month ofinstruction.
MIL
26
Academic Progress in ReadingPer Ten Months of instruction *
Degree of Improvement
Marked improvement
1979 I 1980t --t
1981 1982 1983
(15 months or more gain) 65% 700,. I 730/0 49%) 46%
Improvement(10-14 months gain) 10 8 8 6 9
Some improvement(5-9 months gain) 10 7 7 B
Little or no gain(4 months or less gain) 15 15 12 39 37
Number of students 1,425 1,050 1,004 i 1.340 1,309_ _
*Based on standardized test scores and prorated as necessary.
JP
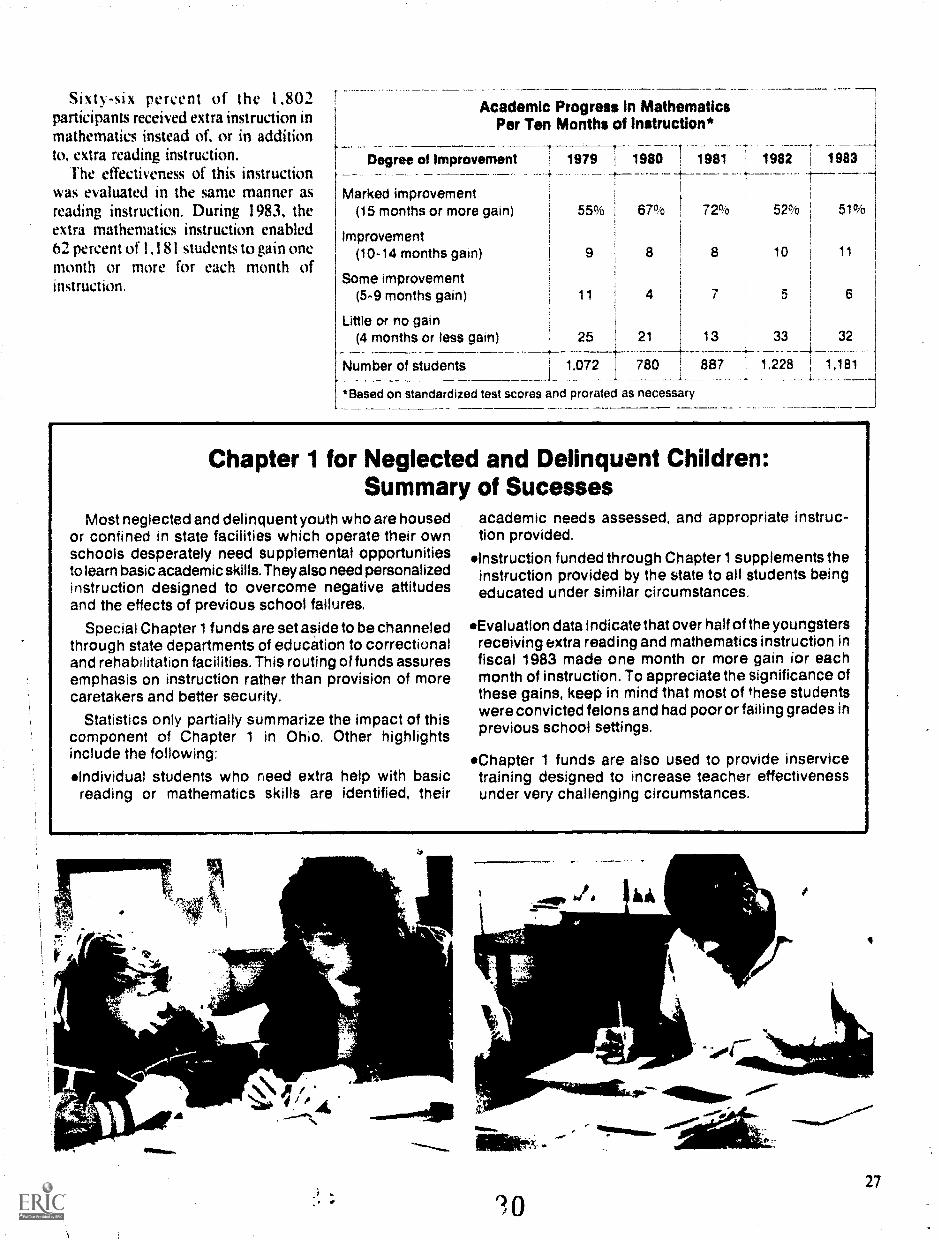
Sixty-six percent of the 1.802participants received extra instruction inmathematics instead of, or in additionto, extra reading instruction.
The effectiveness of this instructionwas evaluated in the same manner asreading instruction. During 1983, theextra mathematics instruction enabled62 percent of 1,181 students to gain onemonth or more for each month ofinstruction.
Academic Progress in MathematicsPer Ten Months of instruction*
1979 1980 1981 I 1982 1 1983Degree of Improvement
Marked improvement(15 months or more gain) 55% 67% 72% 52° 51%
Improvement(10-14 months gain) 9 8 8 10 11
Some improvement(5-9 months gain) 11 4 7 5 6
Little or no gain(4 months or less gain) 25 21 13 33 I 32
Number of students 1,072 780 887 1.228 ; 1,181-L-
'Based on standardized test scores and prorated as necessary
Chapter 1 for Neglected and Delinquent Children:Summary of Sucesses
Most neglected and delinquent youth who are housedor confined in state facilities which operate their ownschools desperately need supplemental opportunitiesto learn basic academic skills. They also need personalizedinstruction designed to overcome negative attitudesand the effects of previous school failures.
Special Chapter 1 funds are set aside to be channeledthrough state departments of education to correctionaland rehabilitation facilities. This routing of funds assuresemphasis on instruction rather than provision of morecaretakers and better security.
Statistics only partially summarize the impact of thiscomponent of Chapter 1 in Ohio. Other highlightsinclude the following:"Individual students who need extra help with basicreading or mathematics skills are identified, their
academic needs assessed, and appropriate instruc-tion provided.
"Instruction funded through Chapter 1 supplements theinstruction provided by the state to all students beingeducated under similar circumstances.
'Evaluation data indicate that over half of the youngstersreceiving extra reading and mathematics instruction infiscal 1983 made one month or more gain for eachmonth of instruction. To appreciate the significance ofthese gains, keep in mind that most of these studentswere convicted felons and had poor or failing grades inprevious school settings.
'Chapter 1 funds are also used to provide inservicetraining designed to increase teacher effectivenessunder very challenging circumstances.
SM
.111111
'/A
"0
4111110".
41111rilliktt:
I
27

State LeadershipAll Chapter 1 funds are channeled
through state departments of education.The Division of Federal Assistance,
which was created within the OhioDepartment of Education in 1965, ad-ministers Chapter 1 programs. The oneexception is that the Division of SpecialEducation administers the componentwhich provides funds to state agencyschools for the handicapped.
Through the years, a staff of 15 to 18
experienced school administrators andeducational consultants has helped localschool districts and state agencies toelsure the delivery of concentrated andeffective instructional services to children.
Major services provided by the OhioDepartment of Education to local schooldistricts and to state agency schoolseligible for funds are as follows:
Assistance in the planning anddevelopment of project proposals.
Review of project proposals received
from applicant agencies.
Assistance with revision of proposals
to meet federal guidelines.
Approval of project proposals.
'Assistance with project implemen-tation, staff development, parent involve-
ment, evaluation, fiscal account-ing, reporting, and dissemination ofinformation.
Determination of allocations, dis-
bursements of funds, and preparation
11111P
Ofror
of statistical and financial reports to
state and federal agencies.The principal means by which division
staff members provide information aboutthe various programs are (1) officeconferences; (2) field services; (3)meetings with local staff and parentadvisory councils; (4) state and regionalworkshops and meetings; and (5) pub-lications, audiovisual presentations, and
speaking engagements.During fiscal 1983, numerous
conferences and workshops weresponsored by the Division of FederalAssistance. Major events included astatewide conference for program ad-ministrators and Chapter 1 teachers; ameeting for new Chapter 1 coordinators;several meetings for federal programdirectors from large districts; and variousmeetings for migrant educationcoordinators, teachers, aides, and sup-port personnel.
Guidelines for Chapter 1 require thestate educational agency to disseminatepertinent information. The DivisionofFederal Assistance distributes printedinformation about guidelines, applicationprocedures, and promising educationalpractices.
State publications for fiscal 1983included the final edition of Title I inOhio and The Clipboard, a periodicreport about the various programsadministered by the Division of Federal
Assistance.
Franklin S. WalterSuperintendent of Public Instruction
R. A. Horn, Assistant Superintendentof Public Instruction
State leadership objectives are directed toward ensuring the delivery of concentrated Arno Cox, Assistant Dire t. for,
and effective instructional services to children.Division of Federal Assistance
2831
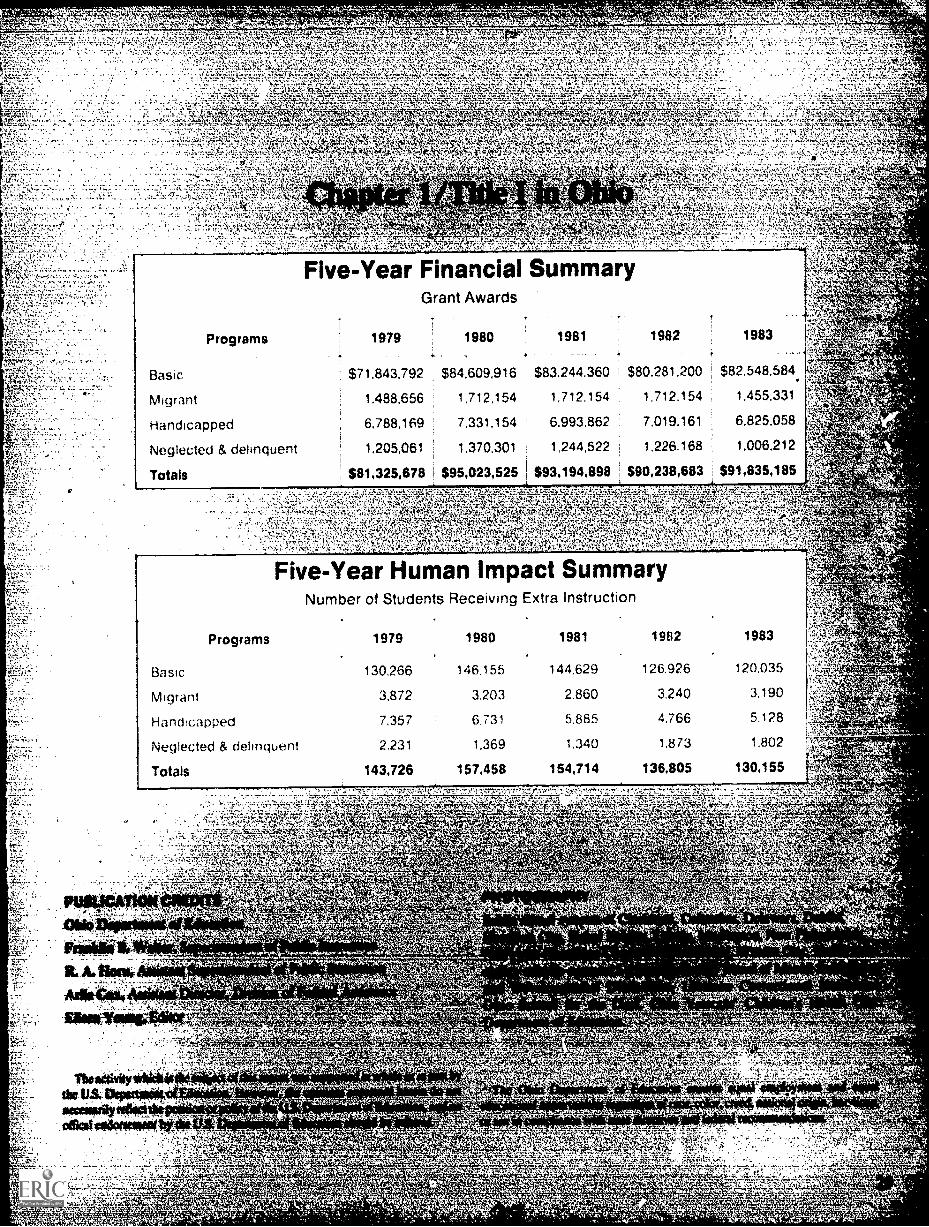
Migrant 1.488.656
Handicapped 6,788,169
Neglected & delinquent 1,205,061
Totals ; $81,325,678
$84,609,916
1,712,154
7,331,154
1.370.301
1 $95,023,525
1,712.154 1,712,154 1,455,331
6,993,862 6,825,058
1,244,522 1,006,212
$93,194,698 1 $90,238,683 $91,835,185
Five-Year Human Impact SummaryNumber of Students Receiving Extra Instruction
Handicapped
Neglected & delinquent
Totals
146,155
3,203
6.31
1,369
157,458
-71
"gerritr.titatOSzytt-kk
Vttk-'41 -1,,ct =3,k'31
n'et W44ein
A.Pk.e
11;26-It At.4,-7,ArizAV'
-1%4?
titar4sillrflrOi141,..Vf-47tisVFIPtvt
;74 etA.P.Z. rkiit; "
Iks.
7, i'.., 7,4;4,4 -e,-)rat 1..,!.:`,%.!..te.t.:% 4.,,,,,7, el, t,,,, ..7.,,,,,,,1_. ,.\``ffl.iztriliziw:s.,*%Atocvm4=zin-ifati:$me..,--itiiTAITEM'414.40,;-..., , , $ , I tt. i. -,,,-
''''''rtgiTif4i.11-4",4* ',*t'an7,ft.'gRAai.feit.:,"tif'11fe kl.i',.'-P- i \ 1 j '''' 51
.;-
FA.
4
. *A443t4tifiTit4Ati4r41**4)4.*'?-02fAV

CC
au
,..n.u:!7 ittSr,- .044.#4
,..4(14,4*-emirrNod *60 OWE*wit viil**0100110W
mei goo 11041NOV PM