descriptives of childhood obesity risk factors · of childhood obesity risk factors specific to the...
TRANSCRIPT

The Childhood Obesity Surveillance Initiative (COSI) in the Republic of Ireland:
Descriptives of childhood obesity risk factors

Childhood Obesity Surveillance Initiative Ireland
The Childhood Obesity Surveillance Initiative (COSI) in the Republic of Ireland: Descriptives of childhood obesity risk factorsDr Mirjam Heinen, Dr Celine Murrin, Professor Leslie Daly, Dr John O’Brien, Dr Patricia Heavey, Ms Michelle O’Brien, Ms Helena Scully, Ms Lisa-Marie Mulhern, Ms Adrienne Lynam, Dr Nazih Eldin, and Professor Cecily Kelleher
The research for this report was undertaken by the National Nutrition Surveillance Centre (NNSC), School of Public Health, Physiotherapy and Sports Science, Woodview House, Belfield, University College Dublin, Dublin 4
Report commissioned by the Health Service Executive (HSE)
July 2016
This Report should be cited as:
Heinen MM, Murrin C, Daly L, O’Brien J, Heavey P, O’Brien M, Scully H, Mulhern LM, Lynam A, Eldin N, Kelleher CC (2016). The Childhood Obesity Surveillance Initiative (COSI) in the Republic of Ireland: Descriptives of childhood obesity risk factors. Dublin: Health Service Executive
Copyright: Health Service Executive

Childhood Obesity Surveillance Initiative Ireland Childhood Obesity Surveillance Initiative Ireland

Childhood Obesity Surveillance Initiative Ireland
ForewordThe Childhood Obesity Surveillance Initiative (COSI) in the Republic Of Ireland: Descriptives of childhood obesity predictors
In 2014, the HSE published The Childhood Obesity Surveillance Initiative (COSI) in the Republic of Ireland: Findings from 2008, 2010 and 2012. In that report, prepared by the National Nutrition Surveillance Centre (NNSC) in University College Dublin, the first indications that obesity rates had remained stable amongst Irish nine year olds and that the incidence had reduced across the three waves of research amongst Irish seven year olds emerged. However, this reduction was not experienced by all seven year old children. In the cohort of children attending DEIS (Delivering Equality of Opportunity in Schools) designated schools, no improvement in overweight and obesity rates was observed over time.
This report, The Childhood Obesity Surveillance Initiative (COSI) in the Republic of Ireland: Descriptives of childhood obesity predictors, details the findings from the analysis of the Family Questionnaire carried out in 2010 and 2012. The Family Questionnaire was designed to collect data on possible predictors of childhood obesity – child’s diet, physical activity pattern, their family’s socioeconomic characteristics and co-morbidities. The analysis includes a comparison between those attending DEIS schools and other schools.
While the possible risk factors contributing to childhood obesity were similar across both groups of children, some significant differences were observed between children attending DEIS designated schools compared with other schools. Although the numbers for comparison were rather small, the findings provide some insight and contextualisation to the general COSI survey results, where no improvement in the rates of overweight and obesity amongst children attending DEIS schools was observed.
Parents of children attending DEIS designated schools reported that:
their children were less likely to be a member of a sports club or visit a sports club regularly;
spent more time watching television;
were more likely to live near their school; and
walked or cycled to school more often.
In terms of diet, parents of children attending DEIS designated schools reported that their children:
were less likely to have been breastfed;
consumed chocolate, crisps and biscuits more frequently;
ate fruit and vegetables less often; and
ate breakfast less often.
In families of children attending DEIS designated schools, parents reported that they were:
less likely to have attained a bachelor degree or higher;
less likely to live in detached houses or bungalows; and
more likely to live in rented accommodation.

Childhood Obesity Surveillance Initiative Ireland Childhood Obesity Surveillance Initiative Ireland
Healthy Ireland, a Framework for Improved Health and Wellbeing 2013 – 2025 seeks a whole of government and whole of society involvement to proactively improve the health and wellbeing of the population. Reducing health inequalities is one of Healthy Ireland’s goals.
We know that disadvantaged communities have a higher incidence of obesity than their more affluent peers and this applies to both adults and children. The results of this research provide a description of childhood obesity risk factors specific to the Republic of Ireland, and will strengthen the rationale for future investment in programmes across government and society as a whole to target disadvantage in a bid to reduce health inequalities.
I would like to thank the NNSC, who were commissioned to carry out this research and especially the parents of children who took part in the COSI and who completed the family questionnaire, which gave us this invaluable insight into their lifestyle and challenges they face in seeking the best health and wellbeing for their children.
Dr Stephanie O’Keeffe National Director of Health and Wellbeing Health Service Executive
July 2016

Childhood Obesity Surveillance Initiative Ireland
Contents
Executive Summary 6
Introduction 9
Study Design 12
Methods 13
Results
Response rates 16
Results on birth cohorts 17
Results on type of school 33
Conclusion 59
References 60
Acknowledgements 63
Appendices
Appendix 1: Missing values for each question in the Family Questionnaire 66
Appendix 2: Characteristics of third class children who attended third class during the third round of data collection in 2010 72
Appendix 3: Example of the Family Questionnaire used in the third round of data collection in 2012 77

Childhood Obesity Surveillance Initiative Ireland Childhood Obesity Surveillance Initiative Ireland
Executive SummaryThe prevalence of obesity in children has been rising rapidly, leading to many serious health consequences worldwide. It is important in trying to combat childhood obesity, to investigate factors that might contribute to this epidemic. These factors include amongst others, diet, physical activity, family’s socioeconomic characteristics, birth weight and breastfeeding.
In 2008, the World Health Organisation (WHO) Regional Office for Europe issued recommendations and guidelines for regular collection of data on weight, height, and waist and hip circumference in children worldwide in order to monitor prevalence trends of growth, overweight and obesity. Furthermore, data collection on possible risk factors contributing to childhood obesity was also encouraged. The Department of Health and the Health Service Executive commissioned the National Nutrition Surveillance Centre, based at the School of Public Health, Physiotherapy and Population Science in University College Dublin, to carry out this surveillance work in the Republic of Ireland. This Irish survey is affiliated with the WHO European Childhood Obesity Surveillance Initiative, which was set up in 2006 by the WHO Regional Office for Europe, with an initial 13 Member States participating.
In two previous reports, the data on anthropometric measurements of this Irish surveillance work, collected over three time points in primary schoolchildren, was described. The current report presents findings of possible risk factors contributing to childhood obesity. These were collected during the second data collection round in 2010 for first class and third class children and during the third round of data collection in 2012 for first class children only. This data was collected through the Family Questionnaire completed by the parents of the children who had been measured. First, we investigated whether there were differences between both first class cohorts. Secondly, we investigated whether there were differences between children who attended the Department of Education and Skills designated disadvantaged schools (the so called DEIS schools) and children in other schools.
Key findings Of the parents whose children attended first class and were measured in 2010 (n=2018), 85.1%
gave consent to complete the Family Questionnaire; in 2012, 68.2% of 1929 parents did likewise. In 2010, 1008 parents (response rate: 58.7%) returned the questionnaire for their first class child and 1012 (77.0%) were returned in 2012. Of all first class children for whom a completed questionnaires was received, 136 children attended a DEIS school.
Of the parents whose children attended third class and were measured in 2010 (n=2007), 85.1% gave consent to complete the Family Questionnaire. Of these, 969 parents (response rate: 56.7%) returned the completed questionnaire for their third class child. Of the third class children for whom a questionnaires was completed, 62 children attended a DEIS school.
First class children were approximately 7 years of age and third class children were 9 years. For both first class and third class children, 57% of the questionnaires were completed for girls and 43% for boys. The average birth weight was approximately 3500 grams, although the birth weights of first class children in DEIS schools were significantly lower (mean: 3235 g; F=6.61, p=0.0111) than of children in other schools. Parents reported that approximately 55-60% of the children had ever been breastfed with one-third being breastfed for two months or less and up to 40% was breastfed for six months or more.
Over 75% of children were brought to school by motorised vehicles. Significantly more first class children in DEIS schools walked or cycled to school (c2=18.5, p=0.0494); however no difference was observed for third class children. In addition, significantly more DEIS schoolchildren lived closer to school than children attending other schools (first class: c2=23.6, p=0.0002; third class: c2=14.1, p=0.0015). Significantly more parents of first class children in DEIS schools considered routes to school to be safe than parents whose children attended other schools (47.9% vs 27.4%; c2=20.4, p=0.0022).
Over 80% of the children in other schools were members of at least one sports club, whereas significantly less DEIS schoolchildren were members (first class: 70.5%, c2=16.5, p=0.0001; third class: 77.0%, c2=6.2, p<0.0001). Also, DEIS schoolchildren visited sports clubs less frequently than children in other schools (first class: c2=15.0, p=0.0179; third class: c2=12.1, p=0.0047).

Childhood Obesity Surveillance Initiative Ireland
Parents reported that over one-third of the children played outdoors for two hours or more daily during the week in 2010 and less than one-third in 2012, which was statistically significantly different (c2=43.4, p=0.0013). First class children who attended DEIS schools in 2010 spent more time playing outdoors per day than children in other schools (week: c2=28.4, p=0.0014; weekend: c2=36.5, p=0.0002). Regarding playing computer games, over half in 2010 and almost half in 2012 did not play computer games during the week. A small but significant difference was observed between 2010 and 2012 (c2=33.7, p=0.0064) with more children spending time on a computer and for a longer duration in 2012 than in 2010. Moreover, first class or third class children who attended DEIS schools in 2010 spent significantly more time during the week playing computer games than children in other schools (first class: c2=104.7, p=0.0067; third class: c2=17.9, p=0.0244). One-third of the children watched television on a daily basis for two hours or more during the week. However, DEIS schoolchildren spent significantly more time watching television during the week and at weekends than children in other schools (week: p<0.0001; weekend: p<0.05). It must be borne in mind that the questionnaires were completed during autumn-winter, which is likely to have influenced the responses to these questions.
Regarding diet, parents reported that most children had breakfast on a daily basis in both rounds of data collection. Furthermore, two-thirds of the children ate fruit and only half of them ate vegetables on a daily basis. DEIS schoolchildren ate vegetables significantly less frequently than children in other schools (first class: c2=23.1, p=0.0048; third class: c2=9.0, p=0.0005). Less first class children in DEIS schools had breakfast on a daily basis (c2=5.5, p=0.0260) and third class children in DEIS schools ate fruit significantly less frequently (c2=6.2, p=0.0031). The majority of children consumed sugar-sweetened soft drinks and diet soft drinks “sometimes or never”. Significant differences between 2010 and 2012 were observed for consumption of sugar-sweetened soft drinks (c2=26.1, p=0.0095) and diet soft drinks (c2=19.1, p=0.0057), with children consuming these products less frequently in 2012 than in 2010. Foods such as pizza, biscuits, chocolate and crisps were eaten “sometimes or never” by the majority of children. A minority of children ate these types of products on a “daily basis” or on “most days” with less than 10% eating products such as pizza, 25% biscuits, 20% chocolate and only 10% crisps. DEIS schoolchildren consumed products such as chocolate and crisps significantly more often (chocolate: c2=19.9 [p=0.0015] for first class and c2=12.9 [p=0.0013] for third class; crisps: c2=11.3 [p=0.0473] for first class and c2=17.7 [p<0.0001] for third class) than children in other schools. Third class children in DEIS schools consumed products such as biscuits more often (c2=15.0, p=0.0078).
A diagnosis of hypertension, diabetes mellitus or having high cholesterol levels in the previous 12 months was reported by less than 10% of participating households. In both rounds of data collection, approximately 60% of mothers reported a bachelor degree or higher as their highest attained education level; for fathers this was approximately 50%. For parents of children in DEIS schools, these numbers were significantly lower (first class: p<0.01; third class: p<0.05). The majority of the fathers were non-government employed or self-employed and one-third of the mothers were homemakers. A minority were unemployed but able to work: approximately 3% of mothers and 9-10% of fathers in both rounds. The majority (>60%) of families lived in detached houses or bungalows, with families of children in DEIS schools being less likely to live in a detached house (first class: c2=22.8, p=0.0020; third class: c2=6.0, p=0.0532). In addition, over 80% of the families with children in other schools owned the accommodation they lived in, while significantly less families with children in DEIS schools were owner-occupiers (first class: 56.9%, c2=42.8, p=0.0001; third class: 50.3%, c2=83.4, p<0.0001).
To conclude, it seems that children became a little less physically active in 2012 than in 2010, while their diet slightly improved over time. A different pattern, however, was observed among children in DEIS schools, with several possible risk factors more pronounced in this group than in children attending other schools.

Childhood Obesity Surveillance Initiative Ireland Childhood Obesity Surveillance Initiative Ireland
IntroductionThe prevalence of obesity in children has been rising rapidly. The World Health Organisation (WHO) estimated that in 2010, 43 million children aged 0-5 years were overweight or obese, reflecting a global prevalence of 6.7%. In 1990, this figure was 4.2% and according to current trends, is estimated to increase to 9.1% in 2020 [1]. For Ireland, the National Taskforce on Obesity (2005) [2], reported that over 300,000 children were estimated to be overweight and obese and this was projected to increase annually by 10,000.
The increased rates in obesity have led to many serious health consequences globally. For the Republic of Ireland (ROI), the direct and indirect costs of overweight and obesity in 2009 were estimated at €1.13 billion [3]. There is an alarming emergence of pre-diabetes, type 2 diabetes, hypertension and sleep apnoea in children where previously these conditions were seen predominantly in older populations [4-7]. Obesity also affects children’s psychological well-being and inter-personal relations [8]. In the long-term, overweight and obesity status track into adulthood [9] and are associated with an increased risk of developing chronic diseases as well as an increased risk of mortality [10-17]. Furthermore, observational study data has linked obesity in pregnancy with both adverse maternal and child outcomes [18, 19].
It is clear from the above that it is important to combat the childhood obesity epidemic and strategic objectives are key to doing so: optimising diet and increasing physical activity. Several studies have been conducted on these topics, showing both positive and negative predictors of childhood obesity. Missing breakfast always or sometimes is associated with higher obesity prevalence in 5-year-old children in the Millennium Cohort study [20] and higher overweight or obesity prevalence in children aged 5-11 years in a French cross-sectional study [21]. Studies on sugar-sweetened beverages show a positive association with obesity risk, including a US cohort study of children in kindergarten [22], a Spanish case-control study in children and adolescents aged 6-18 years [23] and a Greek case-control study in children aged 7-15 years [24]. An Australian cohort study showed that the intake of meat at 18 months was a significant predictor of body mass index (BMI) and waist circumference at 8 years [25] and a German cross-sectional study showed that high intakes of meat and sausages was associated with obesity in children and adolescents aged 3-17 years [26]. Evidence for protective food items have also been found, including higher fruit intake in a US cohort study of children in kindergarten [22], higher vegetables intake in an Australian cross-sectional survey among 12-year-old boys [27] and a higher intake of cereals in two Australian cohort studies of 8-year-old children [25, 28].
Regarding physical inactivity, several studies showed that sedentary behaviour was associated with higher overweight and obesity levels, including a prospective cohort study in children aged 9-15 years [29], the Millennium Cohort study of 5-year-olds [20], a Greek cross-sectional study in children aged 10-12 years [30] and a French cross-sectional study in children aged 5-11 years [21]. The prospective Irish Growing Up in Ireland (GUI) study showed that high levels of sedentary behaviour was implicated in the risk of overweight and obesity in 9-year-old boys but not in girls [31]. One of the sedentary activities is watching television, which has been linked with higher obesity levels in several studies including the 1958 British birth cohort study in 11-year-old girls [32], an Australian cohort in 8-year-old children [28], a Spanish case-control study in children and adolescents aged 6-18 years [23], a Greek case-control study in children aged 7-15 years [24] and an Australian cross-sectional survey among 12-year-old boys [27]. On the other hand, being physically active has been proved to be a protective factor against childhood obesity in an Australian cohort of 8-year-olds [28], the 1958 British birth cohort among 11-year-olds [32], a Spanish case-control study among children and adolescents aged 6-18 years [23], a Greek case-control study in children aged 7-15 years [24] and an Australian cross-sectional survey among 12-year-olds [27]. The Irish GUI study showed that low levels of physical activity was increasing the risk of overweight and obesity in 9-year-old boys [31].

Childhood Obesity Surveillance Initiative Ireland
Next to optimising diet and increasing physical activity levels, other factors might also be associated with obesity. Birth weight has been shown to be a positive predictor of overweight or obesity in several studies, including two Australian cohort studies of 8-year-olds [25, 28], the Millennium Cohort study among 5-year-olds [20], a US cohort study of 5-year-olds [33], and a German cross-sectional study of children aged 5-7 years [34]. Moreover, among Irish overweight and obese children in the Lifeways Cross-Generation Cohort Study, Murrin et al (2013) observed that a child’s overweight or obesity level was associated with a high (≥4 kg) infant birth weight [35]. Another positive predictor is low socio-economic status (SES). An Australian cohort study of children aged 7-12 years showed that low SES status predicted obesity risk and this trend became stronger as children entered adolescence [36]. The Millennium Cohort study showed that 5-year-old children from families with low income or low educational attainment were more likely to be obese regardless of ethnicity [20]. Two cross-sectional studies showed that low SES was associated with obesity in French children aged 5-11 years [21] and in German children aged 5-7 years [34]. Analysis of 9-year-olds in the GUI cohort study, showed that one parent families, lower maternal education and lower household class increased the odds of childhood obesity [37]. On the other hand, a protective effect of a longer duration of breastfeeding has been observed in some studies, including in a Greek case-control study of children aged 7-15 years [24] and the GUI study among 9-year-olds [38].
The growing problem of obesity in children is not unique to Ireland and in 2008 the WHO Regional Office for Europe has issued recommendations and guidelines for regular collection of data on weight, height, and waist and hip circumference in children worldwide [39]. Furthermore, data collection on possible predictors of childhood obesity was also encouraged. In 2008, the Department of Health and the Health Service Executive (HSE) commissioned the National Nutrition Surveillance Centre (NNSC) based at the School of Public Health, Physiotherapy and Population Science in University College Dublin (UCD) to carry out this surveillance work in ROI.
In a recent report, the data on anthropometric measurements of this Irish surveillance work collected over three time points (2008, 2010 and 2012) was described. In summary, the prevalences of overweight and obesity in 7-year-old boys during the first, second and third rounds of data collection were 18.3%, 16.2% and 14.4%, respectively and 26.4%, 25.7% and 21.4% in girls [40]. The prevalences of overweight and obesity in 9-year-old boys during the data collection rounds in 2010 and 2012 were 19.7% and 20.0%, respectively. For girls, these percentages were 23.2% and 22.0%, respectively. This Irish survey is affiliated with the WHO European Childhood Obesity Surveillance Initiative (COSI), which was set up in 2006 by the WHO Regional Office for Europe and an initial 13 Member States.
Aims and objectivesThe Irish part of the COSI study mentioned above has not only collected anthropometric data, but also data on possible predictors of childhood obesity; these include dietary factors, physical activity/inactivity patterns of the child, family’s socioeconomic characteristics and co-morbidities.
The aim of the current report was to describe the possible predictors of childhood obesity in primary schoolchildren who attended first and third class in ROI.

Childhood Obesity Surveillance Initiative Ireland Childhood Obesity Surveillance Initiative Ireland
Study designThe European COSI is a collaborative study with principal investigators from all participating European countries co-operating in relation to survey content, methodology and timing using the WHO European COSI protocol. The Irish surveillance system is based on this protocol and the Irish representative is Dr Nazih Eldin, HSE lead on obesity. Strict adherence to this protocol was required for inclusion in the European database and this procedure was achieved with the current study.
Two previous reports describe the study design in detail and results on anthropometric findings [40, 41]. In summary, the first round of data collection was conducted in 2008 during which 163 primary schools participated and anthropometric measurements were conducted among first class pupils. The same 163 schools were contacted again for the second and third rounds of data collection in 2010 and 2012, respectively. One of the goals of the subsequent rounds was to follow up the children measured in 2008. Therefore, in the second round of data collection (Round 2 in 2010) not only first class was included, but also third class and in the third round of data collection (Round 3 in 2012), first, third and fifth class were included. For all rounds, only one class from each grade was selected per school. Information on childhood obesity predictors was collected only during Rounds 2 and 3 and not during the first round in 2008. Therefore, from here on in, this report will merely focus on Rounds 2 (in 2010) and 3 (in 2012).
SubjectsOriginally, the children in first, third and fifth classes were chosen because these classes include children within the age ranges 5-12 years. These age groups precede puberty [42] and at these ages the identification of obesity is of value to predict the condition in adulthood [43].

Childhood Obesity Surveillance Initiative Ireland
Methods
Ethical ConsiderationsOn both occasions (2010 and 2012), ethical approval was obtained from the Research Ethics Committee, Human Research Sub Committee, UCD.
Consent for the survey was obtained on two separate levels: at school and at parent level. Prior to data collection in 2010, an initial letter and a consent form were sent to principals in which the objectives of the study were explained. After a school had agreed to participate, all parents from the sampled classes in these participating schools were subsequently given a letter explaining the survey. Two informed consent forms were also given to parents: one for the anthropometric measurements and one for completing the Family Questionnaire on several predictors of childhood obesity. Parents could choose which part they wanted their child to participate in: the anthropometric measurements only or for both the anthropometric measurements and the questionnaire. Parents were fully informed about all study procedures and their informed consent was obtained on a voluntary basis prior to the child’s enrolment to the study. The exact same procedure was followed for Round 3 (in 2012).
To ensure confidentiality for all collected and archived data, unique identification (ID) numbers were assigned to each child and each register refers only to these numbers. The research team alone has access to the full list of ID numbers and corresponding names of the children sampled, which is held separately from the survey data. The original hardcopy records are anonymised and stored in locked cabinets in UCD and used only for reference if required. These hardcopy records will be destroyed after seven years.
All information and consent forms for parents/guardians were approved by the Irish National Adult Literacy Agency (NALA).They were also available in Irish and this translation was conducted by a professional translator.
Family QuestionnaireData on the child’s diet, physical activity pattern, family’s socioeconomic characteristics and co-morbidities were obtained via the Family Questionnaire. These data enable the NNSC to investigate possible associations between these factors and childhood obesity in ROI. This questionnaire was completed by one of the parents or together with their child. The Family Questionnaire was also approved by NALA.
During Round 2 in 2010, all parents from the sampled classes, i.e. first and third class, were asked if they would like to complete the Family Questionnaire as part of the study. During Round 3 in 2012, only parents of the first class cohort were asked to complete this Family Questionnaire, since data on the third and fifth class cohorts were already measured in 2010 when these children attended first and third class, respectively.
After obtaining consent from the parents for completing the Family Questionnaire, the questionnaire was sent to the parents’ home address, together with a return envelope to UCD. Round 2 took place in autumn 2010 and Round 3 took place during autumn-winter period in 2012 and the beginning of 2013. During Round 2 (in 2010), no reminders were sent for the questionnaires. During the Round 3 (in 2012), reminders were sent within approximately 1-2 months after sending out the first questionnaire. After being returned to UCD, data from the questionnaires were entered in Microsoft Excel by data clerks.
Information regarding the following items were collected (see Appendix 3 for an example of the questionnaire used in Round 3 in 2012): physical activity/inactivity data, dietary data, family’s co-morbidities, socio-economic factors and other factors such as birth weight, amount of sleep and data on breastfeeding.

Childhood Obesity Surveillance Initiative Ireland Childhood Obesity Surveillance Initiative Ireland
Data AnalysisThe dataset used for the current analysis on predictors of childhood obesity included children with informed consent, complete information on age, sex and anthropometric data and with a completed Family Questionnaire. The ‘svyset’ procedure in STATA (Intercooled STATA, version 13) was used to adjust for the multi-stage stratified cluster-sampling procedure. No adjustment for confounding variables was carried out. Cross-sectional data (i.e. data collected at one point in time) on first class children in primary schools were collected in two different birth cohorts, once in children who attended first class in 2010 and once in children who attended first class in 2012. This gave us the opportunity to compare the collected data between these two birth cohorts. Third class children were measured only once in 2010 and therefore no comparison between birth cohorts could be done for this age group. Stratified analyses were carried out by disadvantaged schools and tested whether there was a difference between children who attended these disadvantaged schools and children in other schools. The School Support Programme under the DEIS (Delivering Equality of Opportunity in Schools) action plan for educational inclusion, run by the Department of Education and Skills have identified disadvantaged schools as those schools that are at a social or economic disadvantage, which prevents students from deriving appropriate benefit from education in school. The definition of these disadvantaged schools is based upon the “educational disadvantage” in the Education Act (1998) as: “…the impediments to education arising from social or economic disadvantage which prevent students from deriving appropriate benefit from education in schools” [44]. The identification of disadvantaged schools for DEIS was based on the following variables: unemployed parents, Local Authority accommodation, lone parenthood, Travellers, free book grants and large families (i.e. ≥4 siblings) [45]. To test for differences between the two birth cohorts (measured in 2010 and 2012, respectively) or between DEIS schools and other schools, Pearson’s chi-squared tests (c2) were performed on categorical data and Wald tests on continuous data. All p-values in this report were based on two-sided tests and considered statistically significant if p-value<0.05. This means that a result is only statistically significant if the probability of its occurrence purely by chance is less than 5%. Throughout this report, no corrections were done for multiple testing.

Childhood Obesity Surveillance Initiative Ireland
Results
Response rates
FIRST CLASS
Of the parents whose children attended first class and were measured during Round 2 in 2010 (n=2018), 1718 gave consent to complete the Family Questionnaire (response rate: 85.1%); during Round 3 (in 2012), 1315 (of 1929; response rate: 68.2%) parents did likewise. In 2010, 1008 (response rate: 58.7%) parents returned the questionnaire for their first class child and 1012 (77.0%) were returned in 2012. Of all first class children for whom a questionnaires was completed, 136 children attended a DEIS school (41.2% in 2010 and 58.8% in 2012).
THIRD CLASS
Of the parents whose children attended third class and were measured during Round 2 in 2010 (n=2007), 1708 gave consent to complete the Family Questionnaire (response rate: 85.1%). Of these, 969 parents (response rate: 56.7%) returned the completed questionnaire for their third class child. Of the third class children for whom a questionnaires was completed, 62 children attended a DEIS school.
Results on birth cohorts
DESCRIPTIVES
In this section only the results of the 7-year-olds are presented, showing the differences between the 7-year-old children who attended first class in 2010 and the ones who attended first class in 2012. The overall results on the 9-year-olds are presented in Appendix 2.
The mean age of first class children included in the analyses was 7.0 years during Round 2 (in 2010; 95% confidence interval [95% CI]: 6.9-7.0 y) and 7.1 years during Round 3 (in 2012; 95% CI: 7.0-7.1 y). Even though mean age was very similar over the two rounds, still a significant difference was observed between the two birth cohorts (F=10.68, p=0.0014).
Figure 1 presents the gender distribution of first class children.

Childhood Obesity Surveillance Initiative Ireland Childhood Obesity Surveillance Initiative Ireland
Figure 1
Gender distribution of first class children in 2010 (n=1008) and 2012 (n=1012).
60
80
100
40
20
0
% o
f typ
es o
f gen
der
DATA COLLECTION ROUND
R2 (2010) R3 (2012)
Boys
Girls56.2
43.8 43.8
56.2
The percentages of boys and girls were similar between both data collection rounds.
The amount of sleep children got was also very similar over the two rounds; in 2010 this was approximately 633.4 minutes (10 h and 33 min; range=7-14.5 h; n=997) and in 2012 this was 631.2 minutes (10 h and 31 min; range: 7.5-14 h; n=1002).
BIRTH WEIGHT AND BREASTFEEDING
Figure 2 presents the mean birth weight.
Figure 2
Mean birth weight (in grams) of first class children in 2010 (n=974) and 2012 (n=968).
34783494
3000
3100
3200
3300
3400
3500
3600
R2 (2010) R3 (2012)
Bir
th w
eigh
t in
gram
s
DATA COLLECTION ROUND
There was no difference between the birth weight in 2010 and 2012.
During Round 3 (in 2012), an additional question was asked whether the child was born full term. Of the examined children (n=1001), 92.4% were born full term, 7.1% were not and for 0.6% the parents did not know. A reason for the latter was that the majority of these children were adopted and this information was unknown to the adoptive parents.

Childhood Obesity Surveillance Initiative Ireland
Figure 3 presents data on the percentages of children being breastfed as reported by the parents.
Figure 3
Distribution of children who had ever been breastfed and attended first class in 2010 (n=1003) and 2012 (n=996).
% o
f bei
ng b
reas
tfed
60
80
100
40
20
0
DATA COLLECTION ROUND
R2 (2010) R3 (2012)
YES
NO44.6
55.4 55.8
44.3
Again, similar percentages of children from both birth cohorts had ever been breastfed. Figure 4 presents the duration of breastfeeding (n=587 in 2010 and n=571 in 2012).
Figure 4
Duration of breastfeeding (in months) in first class children in 2010 (n=587) and 2012 (n=571).
0
10
20
30
40
50
R2 (2010) R3 (2012)
% o
f dur
atio
n of
bre
astf
eedi
ng
<1-2 months
3-5 months
6 months
DATA COLLECTION ROUND
40.4
24.9
34.7
39.8
23.6
36.6
The duration of children being breastfed was similar for Rounds 2 and 3, with over one-third being breastfed for two months or less and up to 40% being breastfed for six months or over.
Childhood Obesity Surveillance Initiative Ireland Childhood Obesity Surveillance Initiative Ireland
PHYSICAL ACTIVITY/INACTIVITY PATTERNS
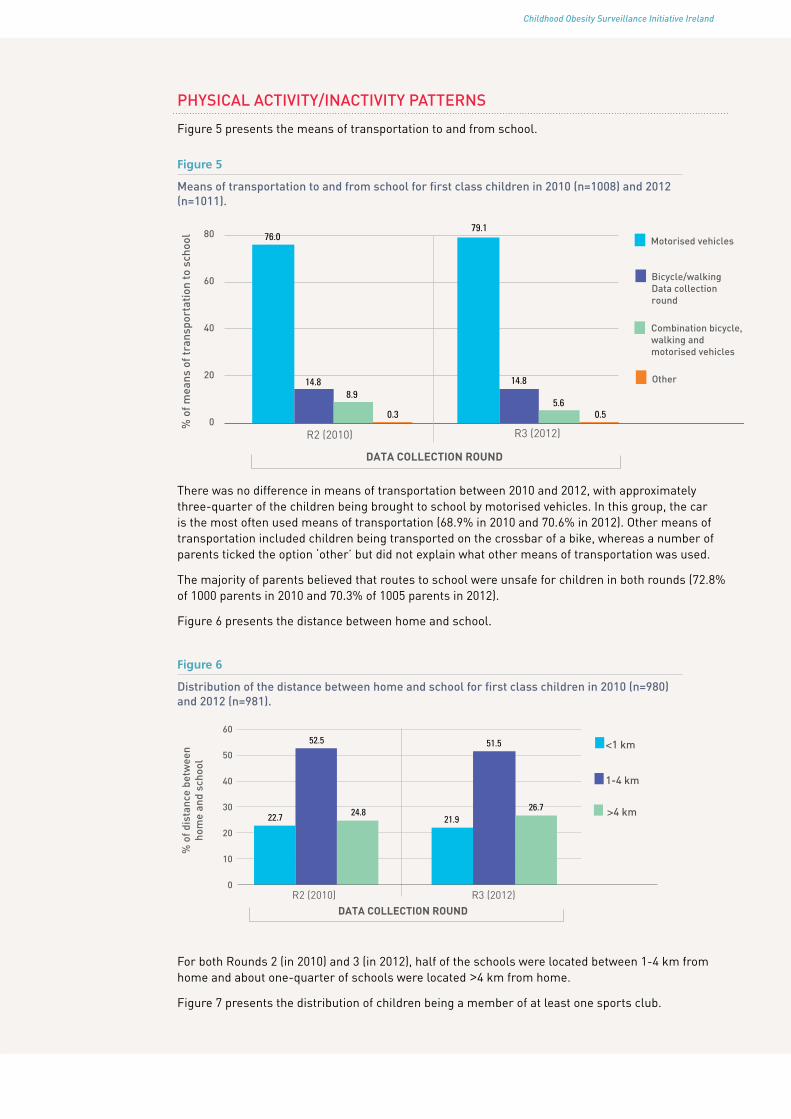
Figure 5 presents the means of transportation to and from school.
Figure 5
Means of transportation to and from school for first class children in 2010 (n=1008) and 2012 (n=1011).
0
20
40
60
80
R2 (2010) R3 (2012)
% o
f mea
ns o
f tra
nspo
rtat
ion
to s
choo
l
DATA COLLECTION ROUND
Motorised vehicles
Bicycle/walking Data collection round
Combination bicycle, walking and motorised vehicles
Other
79.1
5.6
76.0
14.8
0.3
8.914.8
0.5
There was no difference in means of transportation between 2010 and 2012, with approximately three-quarter of the children being brought to school by motorised vehicles. In this group, the car is the most often used means of transportation (68.9% in 2010 and 70.6% in 2012). Other means of transportation included children being transported on the crossbar of a bike, whereas a number of parents ticked the option ‘other’ but did not explain what other means of transportation was used.
The majority of parents believed that routes to school were unsafe for children in both rounds (72.8% of 1000 parents in 2010 and 70.3% of 1005 parents in 2012).
Figure 6 presents the distance between home and school.
Figure 6
Distribution of the distance between home and school for first class children in 2010 (n=980) and 2012 (n=981).
0
10
20
30
40
50
60
R2 (2010) R3 (2012)
% o
f dis
tanc
e be
twee
n ho
me
and
scho
ol
<1 km
1-4 km
>4 km
DATA COLLECTION ROUND
22.7 24.821.9
51.5
26.7
52.5
For both Rounds 2 (in 2010) and 3 (in 2012), half of the schools were located between 1-4 km from home and about one-quarter of schools were located >4 km from home.
Figure 7 presents the distribution of children being a member of at least one sports club.

Childhood Obesity Surveillance Initiative Ireland
Figure 7
Distribution of first class children being a member of at least one sports club in 2010 (n=1004) and 2012 (n=1006).
% o
f bei
ng a
mem
ber
of a
spo
rts
club
60
80
100
40
20
0
DATA COLLECTION ROUND
R2 (2010) R3 (2012)
YES
NO15.3
84.7 84.4
15.6
Approximately 84% of children were members of at least one sports club in both 2010 and 2012. Figure 8 presents the number of visits to sports clubs per week for children who were members (n=866 in 2010 and n=829 in 2012).
Figure 8
Number of visits to sports clubs per week by first class children in 2010 (n=866) and 2012 (n=829).
0
10
20
30
40
% o
f no.
of v
isit
s to
sp
orts
clu
b pe
r w
eek 1 day
2 days
3 days
>3 days
DATA COLLECTION ROUND
R2 (2010) R3 (2012)
28.0
36.8
22.1
13.0
26.3
39.2
22.0
12.5
For both Rounds 2 (in 2010) and 3 (in 2012), about one-quarter of the children visited sports clubs once a week, just below 40% visited sports clubs twice a week and the remainder visited clubs three days or more.
The average time that children spent playing outdoors on weekdays or at the weekend is presented in figure 9.

Childhood Obesity Surveillance Initiative Ireland Childhood Obesity Surveillance Initiative Ireland
Figure 9
Average outdoor playtime spent per day during the week and at weekends by first class children in 2010 and 2012. See Appendix 1 for number of missing values for each category.
0
10
20
30
40
50
60
R2 (2010) R3 (2012) R2 (2010) R3 (2012)
Playing outdoors during the week Playing outdoors at weekends
% o
f tim
e sp
ent o
n ac
tivi
ty
TIME SPENT PLAYING OUTDOORS, PER DATA COLLECTION ROUND
None at all <1 h/day 1 h/day 2 h/day 3 h/day
1.7
19.7
39.5
28.5
10.6
4.2
24.9
43.8
20.4
6.73.5
0.0 1.3
6.9
14.9
34.4
42.5
11.7
32.8
51.9
A small but significant difference was observed between 2010 and 2012 for playing outdoors during the week (c2=42.0, p=0.0023) and at weekends (c2=36.1, p=0.0010), with less children spending two hours or more per day playing outdoors in 2012 than in 2010. The questionnaires were completed in winter by the parents, which is likely to have influenced the response to outdoor play. Some answered these questions separately for both seasons. In these incidences, the answers concerning the winter season were used.
The average time that children spent on homework during the week and at weekends is presented in figure 10.
Figure 10
Average time spent per day on homework by first class children during the week and at weekends in 2010 and 2012. See Appendix 1 for number of missing values for each category.
Doing homework during the week Doing homework at weekends
TIME SPENT ON HOMEWORK, PER DATA COLLECTION ROUND
0
10
20
30
40
50
60
R2 (2010) R3 (2012) R2 (2010) R3 (2012)
% o
f tim
e sp
ent o
n ac
tivi
ty
None at all <1 h/day 1 h/day 2 h/day 3 h/day
35.6
0.8
51.2
11.6
0.9 0.0
34.5
53.5
11.1
0.8
15.9
48.2
27.0
6.92.1
17.8
48.2
25.0
7.9
1.1
Approximately half of the children spent one hour per day on homework during the week in both 2010 and 2012. As expected, less homework was done at the weekend with approximately half of the children spending <1 hour a day doing homework in both 2010 and 2012.
The average time that children spent playing computer games on weekdays and at the weekend is presented in figure 11.

Childhood Obesity Surveillance Initiative Ireland
Figure 11
Average time spent playing computer games per day by first class children during the week and at weekends in 2010 and 2012. See Appendix 1 for number of missing values for each category.
Playing computer games during the week Playing computer games at weekends
TIME SPENT PLAYING COMPUTER GAMES, PER DATA COLLECTION ROUND
0
10
20
30
40
50
60
R2 (2010) R3 (2012) R2 (2010) R3 (2012)
% o
f tim
e sp
ent o
n ac
tivi
ty
None at all <1 h/day 1 h/day 2 h/day 3 h/day
56.3
34.5
7.4
1.3 0.6
46.0
38.5
12.1
2.8 0.6
30.7
42.6
17.3
7.9
1.5
23.4
35.8
22.3
15.8
2.7
Almost all of the participating households (n=1004 in 2010 and n=1006 in 2012) had a computer in the house: 94.2% in 2010 and 96.0% in 2012 (data not shown). Regarding playing computer games, over half in 2010 and almost half in 2012 did not play computer games during the week, while over one-third spent less than one hour daily on a computer. For the weekend, this percentage was lower with about one third not playing games in 2010 and about one quarter in 2012. A small but significant difference was observed between 2010 and 2012 for both weekdays (c2=29.9, p=0.0198) and at the weekend (c2=50.4, p=0.0001) with more children spending time on a computer and for a longer duration in 2012 than in 2010.
The average time that children spent watching television on weekdays and at the weekend is presented in figure 12.
Figure 12
Average time spent per day watching television by first class children during the week and at weekends in 2010 and 2012. See Appendix 1 for number of missing values for each category.
Watching television during the week Watching television at weekends
TIME SPENT WATCHING TELEVISION, PER DATA COLLECTION ROUND
0
10
20
30
40
50
60
R2 (2010) R3 (2012) R2 (2010) R3 (2012)
% o
f tim
e sp
ent o
n ac
tivi
ty
None at all <1 h/day 1 h/day 2 h/day 3 h/day
6.6
26.4
32.8 31.0
3.2
27.0
5.2
38.7
25.1
4.01.3
5.3
16.0
46.9
30.5
1.0
8.314.2
52.9
23.6
No differences were observed between Rounds 2 (in 2010) and 3 (in 2012) for watching television during the week, with one-third of the children watching <1 hour of television per day, one-third watched one hour per day and one-third two hours or more. Children were watching more television at the weekend, with half of the children watching two hours per day and one-third three hours or more, but no differences were observed between 2010 and 2012.

Childhood Obesity Surveillance Initiative Ireland Childhood Obesity Surveillance Initiative Ireland
DIET
The parents reported that most children had breakfast daily (94.9% in 2010 and 93.4% in 2012) and very few children had never breakfast (0.0% in 2010 and 0.1% in 2012; data not shown). Data on dietary items was collected by asking parents the question: “Over a usual week, how often does your child have the following kinds of foods or drinks?”. The parents were able to choose from the following answer options: “Every day”, “Most days (4-6 days)”, “Some days (1-3 days)” and “Never”. Several parents did not tick a box, but commented that a certain type food or drink was only consumed sometimes (e.g. once a month). These instances were recoded into the category “Never” and this category has been renamed “Sometimes or never”.
Figure 13 presents how many times per week children consumed fresh fruit, vegetables and 100% fruit juices.
Figure 13
Number of days per week that first class children consumed fresh fruit, vegetables and 100% fruit juices in 2010 and 2012. See Appendix 1 for number of missing values for each category.
0
10
20
30
40
50
60
70
Fresh fruit Vegetables 100% Fruit juice
% o
f no.
of d
ays
that
cer
tain
fo
od it
em is
con
sum
ed
CONSUMPTION OF FRUITS, VEGETABLES AND FRUIT JUICE, PER DATA COLLECTION ROUND
Every day Most days Some days Sometimes/never
R2 (2010) R3 (2012) R2 (2010) R3 (2012) R2 (2010) R3 (2012)
63.0
19.514.3
3.3
63.6
19.913.0
48.450.8
27.6
17.8
6.2
23.6
43.2
15.6 17.722.8
17.7
39.0
2.5
30.3
14.3
4.53.5
About two-thirds of the children ate fresh fruit daily, while only half ate vegetables daily in both 2010 and 2012. About 60% of the children consumed 100% fruit juices “some days” of the week or less in both Rounds 2 (in 2010) and 3 (in 2012).
Figure 14 presents how many times per week children consumed sugar-sweetened soft drinks and diet soft drinks.
Figure 14
Number of days per week that first class children consumed sugar-sweetened soft drinks and diet soft drinks in 2010 and 2012. See Appendix 1 for number of missing values for each category.
Every day Most days Some days Sometimes/never
0
20
40
60
80
R2 (2010) R3 (2012) R2 (2010) R3 (2012)
Sugar-sweetened soft drinks Diet soft drinks
% o
f no.
of d
ays
that
cer
tain
be
vera
ge it
em is
con
sum
ed
CONSUMPTION OF SOFT DRINKS AND DIET SOFT DRINKS, PER DATA COLLECTION ROUND
77.0
19.9
2.60.6
68.9
27.0
2.51.7
50.440.5
6.52.6
40.646.1
8.64.8
Childhood Obesity Surveillance Initiative Ireland
Parents reported that most children consumed sugar-sweetened soft drinks or diet soft drinks “sometimes or never”. Significant differences between 2010 and 2012 were observed for consumption of sugar-sweetened soft drinks (c2=23.4, p=0.0176) and diet soft drinks (c2=20.4, p=0.0042), with children consuming these products less frequently in 2012 than in 2010.
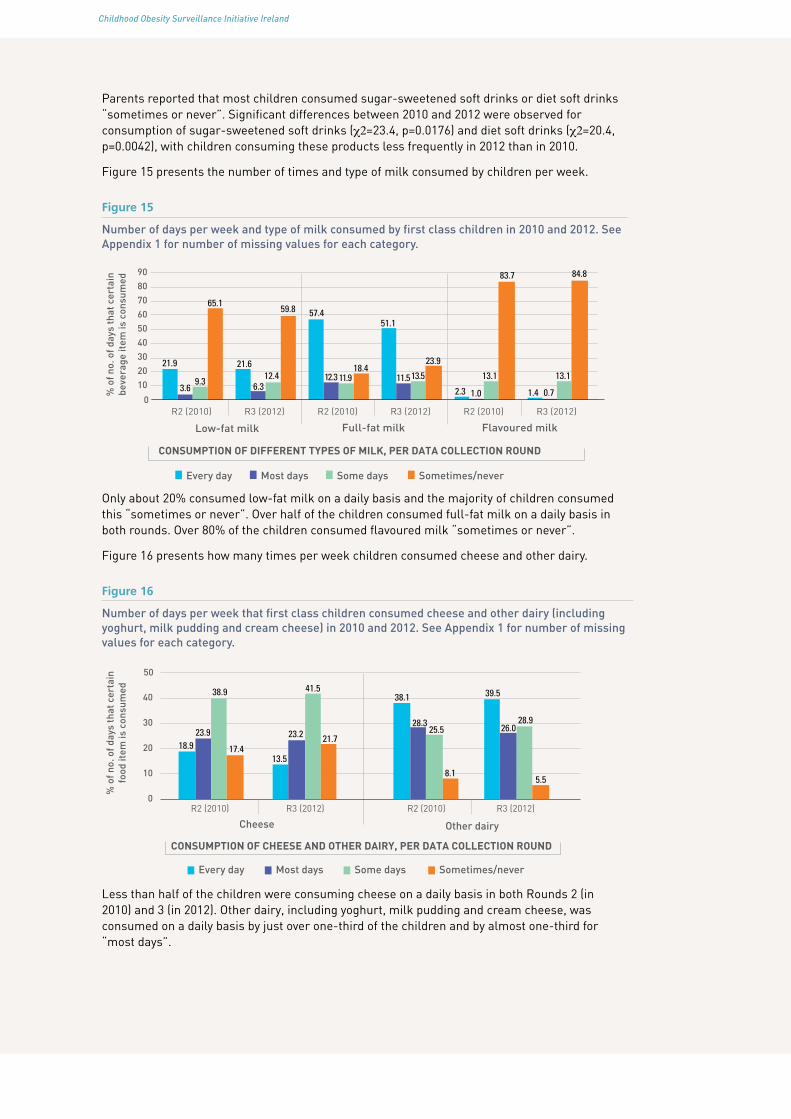
Figure 15 presents the number of times and type of milk consumed by children per week.
Figure 15
Number of days per week and type of milk consumed by first class children in 2010 and 2012. See Appendix 1 for number of missing values for each category.
10
20
30
40
50
60
70
80
90
Low-fat milk Full-fat milk Flavoured milk
CONSUMPTION OF DIFFERENT TYPES OF MILK, PER DATA COLLECTION ROUND
0
% o
f no.
of d
ays
that
cer
tain
be
vera
ge it
em is
con
sum
ed
Every day Most days Some days Sometimes/never
R2 (2010) R3 (2012) R2 (2010) R3 (2012) R2 (2010) R3 (2012)
21.9
9.3
65.1
21.612.4
59.8 57.4
18.4
51.1
23.9
83.7 84.8
2.3 1.0
13.1
1.4 0.7
13.16.3
12.3 11.9 11.513.53.6
Only about 20% consumed low-fat milk on a daily basis and the majority of children consumed this “sometimes or never”. Over half of the children consumed full-fat milk on a daily basis in both rounds. Over 80% of the children consumed flavoured milk “sometimes or never”.
Figure 16 presents how many times per week children consumed cheese and other dairy.
Figure 16
Number of days per week that first class children consumed cheese and other dairy (including yoghurt, milk pudding and cream cheese) in 2010 and 2012. See Appendix 1 for number of missing values for each category.
0
10
20
30
40
50
R2 (2010) R3 (2012) R2 (2010) R3 (2012)
Cheese Other dairy
% o
f no.
of d
ays
that
cer
tain
fo
od it
em is
con
sum
ed
CONSUMPTION OF CHEESE AND OTHER DAIRY, PER DATA COLLECTION ROUND
Every day Most days Some days Sometimes/never
18.923.9
38.9
17.413.5
23.2
41.5
21.7
38.1
28.325.5
8.1
39.5
26.028.9
5.5
Less than half of the children were consuming cheese on a daily basis in both Rounds 2 (in 2010) and 3 (in 2012). Other dairy, including yoghurt, milk pudding and cream cheese, was consumed on a daily basis by just over one-third of the children and by almost one-third for “most days”.

Childhood Obesity Surveillance Initiative Ireland Childhood Obesity Surveillance Initiative Ireland
Figure 17 presents how many times per week children consumed fish and meat.
Figure 17
Number of days per week that first class children consumed fish and meat in 2010 and 2012. See Appendix 1 for number of missing values for each category.
R2 (2010) R3 (2012) R2 (2010) R3 (2012) 0
10
20
30
40
50
60
70
80
Meat Fish
% o
f no.
of d
ays
that
cer
tain
fo
od it
em is
con
sum
ed
CONSUMPTION OF MEAT AND FISH, PER DATA COLLECTION ROUND
Every day Most days Some days Sometimes/never
36.3
47.8
13.7
2.2
11.7
48.5
37.7
2.1 0.95.8
79.0
14.3
1.56.8
76.8
14.9
Meat was consumed by just over one-third of the children on a daily basis and about half consumed meat “most days” in both rounds. Fish was consumed on “some days” by approximately three-quarters of the children.
Figure 18 presents how many times per week children consumed foods such as chocolate and biscuits.
Figure 18
Number of days per week that first class children consumed foods such as biscuits, cake, doughnuts or pie and foods such as chocolate in 2010 and 2012. See Appendix 1 for number of missing values for each category.
20
Chocolate etc Biscuits etc
R2 (2010) R3 (2012) R2 (2010) R3 (2012) 0
10
20
30
40
50
60
70
% o
f no.
of d
ays
that
cer
tain
fo
od it
em is
con
sum
ed
CONSUMPTION OF FOOD SUCH AS COCOLATE AND BISCUITS PER DATA COLLECTION ROUND
Every day Most days Some days Sometimes/never
3.4
18.0
75.3
3.3 4.0
15.6
76.5
4.0 6.3
20.0
66.1
7.5 5.8
18.8
67.8
7.6
The majority of children in both rounds consumed products such as chocolate on “some days” and approximately 20% ate these products on “most days” or daily. Biscuits, cake, doughnuts or pie was consumed on a daily basis by approximately 6% of the children, about 20% on “most days” and for over 65% on “some days” in both Rounds 2 (in 2010) and 3 (in 2012).
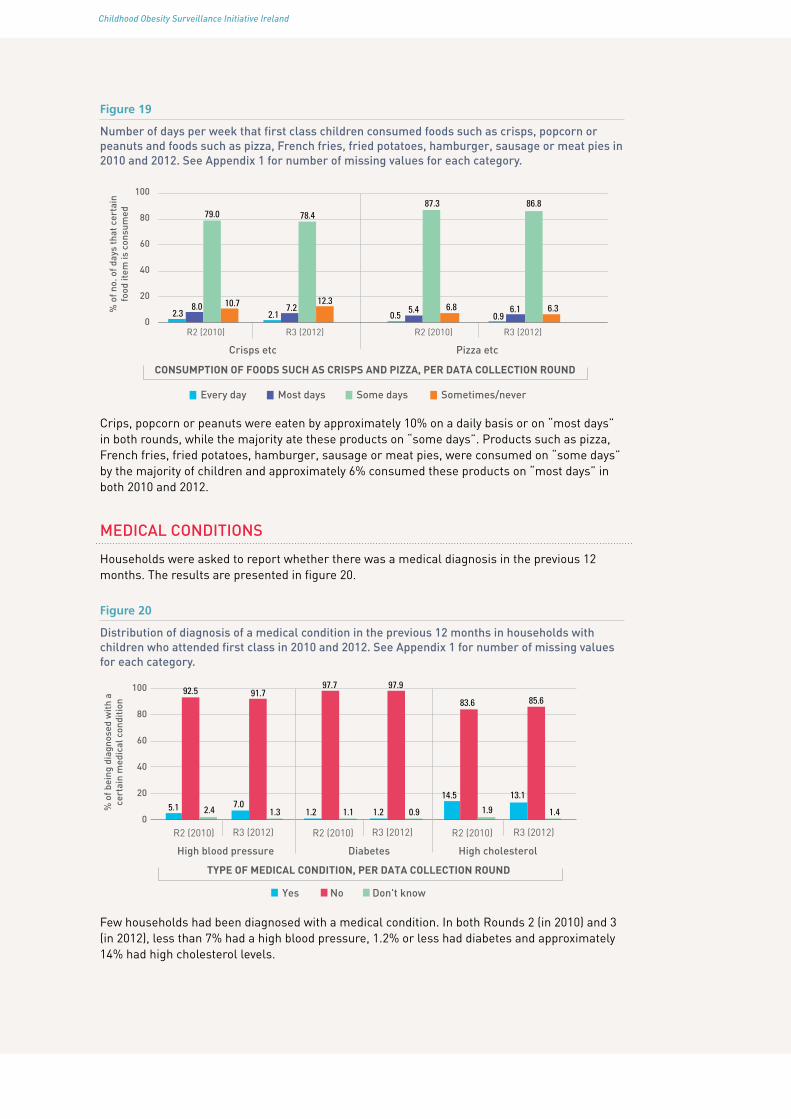
Figure 19 presents how many times per week children consumed foods such as crisps and pizza.
Childhood Obesity Surveillance Initiative Ireland
Figure 19
Number of days per week that first class children consumed foods such as crisps, popcorn or peanuts and foods such as pizza, French fries, fried potatoes, hamburger, sausage or meat pies in 2010 and 2012. See Appendix 1 for number of missing values for each category.
0
20
40
60
80
100
Crisps etc Pizza etc
R2 (2010) R3 (2012) R2 (2010) R3 (2012)
% o
f no.
of d
ays
that
cer
tain
fo
od it
em is
con
sum
ed
CONSUMPTION OF FOODS SUCH AS CRISPS AND PIZZA, PER DATA COLLECTION ROUND
Every day Most days Some days Sometimes/never
2.38.0
79.0
10.72.1
7.2
78.4
12.3
0.5 0.96.1
86.8
6.35.4
87.3
6.8
Crips, popcorn or peanuts were eaten by approximately 10% on a daily basis or on “most days” in both rounds, while the majority ate these products on “some days”. Products such as pizza, French fries, fried potatoes, hamburger, sausage or meat pies, were consumed on “some days” by the majority of children and approximately 6% consumed these products on “most days” in both 2010 and 2012.
MEDICAL CONDITIONS
Households were asked to report whether there was a medical diagnosis in the previous 12 months. The results are presented in figure 20.
Figure 20
Distribution of diagnosis of a medical condition in the previous 12 months in households with children who attended first class in 2010 and 2012. See Appendix 1 for number of missing values for each category.
0
20
40
60
80
100
High blood pressure Diabetes High cholesterol
% o
f bei
ng d
iagn
osed
wit
h a
cert
ain
med
ical
con
diti
on
TYPE OF MEDICAL CONDITION, PER DATA COLLECTION ROUND
Yes No Don't know
R2 (2010) R3 (2012) R2 (2010) R3 (2012) R2 (2010) R3 (2012)
5.1 7.01.2 1.1 1.2 0.9
14.5 13.1
85.6
1.4
83.6
1.9
91.797.7 97.9
1.3
92.5
2.4
Few households had been diagnosed with a medical condition. In both Rounds 2 (in 2010) and 3 (in 2012), less than 7% had a high blood pressure, 1.2% or less had diabetes and approximately 14% had high cholesterol levels.

Childhood Obesity Surveillance Initiative Ireland Childhood Obesity Surveillance Initiative Ireland
SOCIAL, ECONOMIC AND HOUSING
The median number of adults (aged 18 years or older) was two persons in both rounds (range is 1-7 adults in 2010 and 1-10 in 2012) and the median number of persons aged less than 18 was three persons for both rounds (range is 1-6 persons aged less than 18 in 2010 and 1-8 in 2012).
The highest attained education level by parents is presented in figure 21.
Figure 21
Distribution of highest attained education level by parents of participating first class children in 2010 (936 fathers and 978 mothers) and 2012 (939 fathers and 991 mothers).
0
10
20
30
40
50
R2 (2010) R3 (2012) R2 (2010) R3 (2012)
Mothers Fathers
% o
f hig
hest
att
aine
d ed
ucat
ion
leve
l
HIGHEST ATTAINED EDUCATION LEVEL BY PARENTS, PER DATA COLLECTION ROUND
Primary school Secondary school Postgraduate/BSc MSc or higher
2.3
37.5
47.5
12.8
37.1
46.9
15.3
0.75.4
46.0
33.7
15.0
3.0
49.0
34.7
13.3
Almost half of the fathers and just over one-third of the mothers have finished secondary school. More mothers than fathers reported they had attained a bachelor degree or a “master’s degree or higher”: approximately 60% of mothers and approximately 50% of fathers in both rounds. There were many missing values for this question among the fathers, as some parents may be separated. In these cases, it was mainly the mother who completed the questionnaire.
Figures 22 and 23 present the main type of employment done by the father or the mother, respectively in the previous 12 months.
Figure 22
Distribution of the father’s main type of employment done in the previous 12 months for participating first class children in 2010 (n=946) and 2012 (n=944).
0
10
20
30
40
50
Government employed
Non-government employed
Self-employed
Homemaker Other
% o
f em
ploy
men
t typ
e
EMPLOYMENT TYPE, PER DATA COLLECTION ROUND
R2 (2010) R3 (2012)
15.8 14.3
41.6 40.7
28.4 29.8
2.0 2.3
12.3 13.0

Childhood Obesity Surveillance Initiative Ireland
Figure 23
Distribution of mother’s main type of employment done in the previous 12 months for participating first class children in 2010 (n=998) and 2012 (n=991).
R2 (2010) R3 (2012)
0
10
20
30
40
Government employed
Non-government employed
Self-employed
Homemaker Other
% o
f em
ploy
men
t typ
e
EMPLOYMENT TYPE, PER DATA COLLECTION ROUND
23.4 23.8 26.2 26.0
10.1 9.0
32.7 33.7
7.7 7.4
There were no differences between 2010 and 2012 for type of employment done by both fathers and mothers. The majority of the fathers were non-government employed or self-employed. Again, there were many missing values in this question for the fathers, for the same reason as mentioned above for education levels. For the mothers, one-third were homemakers, one-quarter government employed (i.e. Civil Service) and another one-quarter non-government employed. A minority were “unemployed but able to work”: approximately 3% of mothers and 9-10% of fathers for both rounds. One reason for the lower figures of unemployed mothers might be that these mothers answered that their main type of employment is homemaker. Only five mothers ticked both “unemployed but able to work” and a “homemaker”; these five cases were recoded to homemaker. The “other” category included parents who were students, unemployed or retired.
Figure 24 presents the type of housing that the family lived in.
Figure 24
Distribution of type of housing that family of participating first class children lived in for 2010 (n=1004) and 2012 (n=1008).
0
10
20
30
40
50
60
70
House/bungalow - detached
House/bungalow - semi-detached
Other
% o
f typ
e of
hou
sing
TYPE OF HOUSING, PER DATA COLLECTION ROUND
61.1 62.0
37.6 36.4
1.3 1.6
R2 (2010) R3 (2012)
The majority (>60%) lived in a detached house or bungalow and just over one-third lived in a semi-detached house or bungalow.
Figure 25 presents whether the accommodation that the family lived in was either owned or rented by them.

Childhood Obesity Surveillance Initiative Ireland Childhood Obesity Surveillance Initiative Ireland
Figure 25
Percentages of accommodation owned or rented by families of participating first class children in 2010 (n=1005) and 2012 (n=1008).
0
10
20
30
40
50
60
70
80
90
Owned Rented Other
% o
f acc
omod
atio
n be
ing
owne
d or
ren
ted
WHETHER ACCOMMODATION IS OWNED OR RENTED BY FAMILY, PER DATA COLLECTION ROUND
80.5 81.8
18.6 17.2
0.9 1.1
R2 (2010) R3 (2012)
Approximately 80% of the families owned their accommodation, while about 15-20% rented.

Childhood Obesity Surveillance Initiative Ireland
Results on type of school
DESCRIPTIVESThe mean age of first class children did not differ between the type of schools (overall mean, 7.0 y; 95% CI, 7.0-7.1 y). The mean age of third class children did significantly differ (F=6.94, p=0.0095), with a mean age of 9.0 years (95% CI, 8.9-9.0 y) for DEIS schoolchildren and a mean age of 9.2 years (95% CI, 9.0-9.3 y) for children in other schools. Figure 26 presents the gender distribution of children in DEIS or other schools.
Figure 26
Gender distribution of children.
A: Children from first class DEIS (n=136) or other (n=1884) schools in 2010 and 2012.
60
80
100
40
20
0
% o
f typ
es o
f gen
der
Girls
Boys
Disadvantaged schools Other schools
30.9
69.142.4
57.6
B: Children from third class DEIS (n=62) or other (n=907) schools in 2010.
60
80
100
40
20
0
DATA COLLECTION ROUND
% o
f typ
es o
f gen
der
Girls
Boys
Disadvantaged schools Other schools
24.6
75.442.6
57.4
The percentages of boys was higher in DEIS schools than in other schools for first class (panel A; 69.1% vs 42.4%; c2=28.3, p=0.0588) and third class (panel B; 75.4% vs 42.6%; c2=19.3, p=0.0556) children.
The amount of sleep children got did not differ between children in DEIS schools and other schools for both first (10 hrs. and 32 minutes) and third (10 hrs. and 11 minutes) class.

Childhood Obesity Surveillance Initiative Ireland Childhood Obesity Surveillance Initiative Ireland
BIRTH WEIGHT AND BREASTFEEDINGFigure 27 presents the children’s mean birth weight.
Figure 27
Children’s mean birth weight (in grams).
A: Children from first class DEIS (n=132) or other (n=1810) schools in 2010 and 2012.
3235
3500
3000
3100
3200
3300
3400
3500
3600
Disadvantaged schools Other schools
Bir
th w
eigh
t in
gram
s
B: Children from third class DEIS (n=56) or other (n=873) schools in 2010.
3467 3481
3000
3100
3200
3300
3400
3500
3600
Disadvantaged schools Other schools
Bir
th w
eigh
t in
gram
s
TYPE OF SCHOOL
Children from first class DEIS schools had a significantly lower birth weight than children in other schools (panel A; F=6.61, p=0.0111). For third class children no difference was observed (panel B).
In 2012, an additional question was included whether the child was born full term. For first class children, 87.6% who attended DEIS schools were born full term and 92.6% children in other schools. These percentages were not statistically significantly different.

Childhood Obesity Surveillance Initiative Ireland
Figure 28 presents the percentages of children who were ever breastfed as reported by parents.
Figure 28
Distribution of children who were ever breastfed.
A: Children from first class DEIS (n=136) or other (n=1863) schools in 2010 and 2012.
% o
f tbe
ing
brea
stfe
d
NO
YES
Disadvantaged schools Other schools
53.2
46.8 56.1
43.960
80
100
40
20
0
B: Children from third class DEIS (n=61) or other (n=904) schools in 2010.
60
80
100
40
20
0
TYPE OF SCHOOL
% o
f tbe
ing
brea
stfe
d
NO
YES
Disadvantaged schools Other schools
38.7
61.3 57.5
42.5
Less children from first class DEIS schools have ever been breastfed compared to children in other schools, although this difference was not statistically significant (panel A; 46.8% vs 56.1%, respectively; c2=3.44, p=0.0825). No difference was observed for third class children (panel B).

Childhood Obesity Surveillance Initiative Ireland Childhood Obesity Surveillance Initiative Ireland
Figure 29 presents the duration of breastfeeding.
Figure 29
Duration of breastfeeding (in months) in children.
A: Children from first class DEIS (n=57) or other (n=1101) schools in 2010 and 2012.
0
10
20
30
40
50
60 <1-2 MONTHS
3-5 MONTHS
>6 MONTHS
% o
f dur
atio
n of
bre
astf
eedi
ng
TYPE OF SCHOOL
Disadvantaged schools Other schools
58.8
9.0
32.2 34.6
24.9
40.5
B: Children from third class DEIS (n=33) or other (n=535) schools in 2010.
0
10
20
30
40
50
60
% o
f dur
atio
n of
bre
astf
eedi
ng
TYPE OF SCHOOL
Disadvantaged schools Other schools
58.2
20.0 21.8
37.4
25.9
36.8
It seems that DEIS schoolchildren were breastfed for a shorter period of time than children in other schools but this was not statistically significant for either first class (c2=13.9, p=0.0802) or third class (c2=5.2, p=0.2485) children.

Childhood Obesity Surveillance Initiative Ireland
PHYSICAL ACTIVITY/INACTIVITY PATTERNS
Figure 30 presents means of transportation to and from school.
Figure 30
Children’s means of transportation to and from school.
A: Children from first class DEIS (n=136) or other (n=1883) schools in 2010 and 2012.
0
10
20
30
40
50
60
70
80
63.9
78.2
14.0
7.3
0.4
29.3
6.9
0.0
Other schoolsDisadvantaged schools
% o
f mea
ns o
f tra
nspo
rt to
sch
ool
B: Children from third class DEIS (n=62) or other (n=907) schools in 2010.
0
10
20
30
40
50
60
70
8071.8
76.9
14.5
8.3
0.3
19.6
8.6
0.0
Other schoolsDisadvantaged schools
% o
f mea
ns o
f tra
nspo
rt to
sch
ool
Motorised vehicles Bicycle/walkingOtherCombination bicycle, walking and motorised vehicles
TYPE OF SCHOOL
There was a significant difference in means of transportation to school between first class children in DEIS schools and other schools (panel A; c2=18.5, p=0.0494). Compared to children in other schools, DEIS schoolchildren cycled or walked to school more often (14.0% vs 29.3%, respectively) and motorised vehicles were used less (78.2% vs 63.9%, respectively). No difference was observed for third class children (panel B).
More parents of first class children in DEIS schools believed that routes to school were unsafe for children compared to parents of children who attended other schools (47.9% vs 27.4%; c2=20.4, p=0.0022). For third class children, no significant difference was observed between parents considering routes to school to be safe for children who attended DEIS (35.6%) and other (29.7%) schools.

Childhood Obesity Surveillance Initiative Ireland Childhood Obesity Surveillance Initiative Ireland
Figure 31 presents the distance between home and school.
Figure 31
Distribution of the distance between children’s home and school.
A: Children from first class DEIS (n=130) or other (n=1831) schools in 2010 and 2012.
0
10
20
30
40
50
60
41.1
21.3
52.4
26.3
45.4
13.5
% o
f dis
tanc
e be
twee
n ho
me
and
scho
ol
Other schoolsDisadvantaged schools
B: Children from third class DEIS (n=57) or other (n=881) schools in 2010.
0
10
20
30
40
50
60
44.8
24.3
51.2
24.6
50.9
4.3
< 1 km 1-4 km > 4 km
Other schoolsDisadvantaged schools
% o
f dis
tanc
e be
twee
n ho
me
and
scho
ol
TYPE OF SCHOOL
Children in DEIS schools lived closer to school than children in other schools for both first class (panel A; ≤4 km: 86.5% vs 73.7%; c2=23.6, p=0.0002) and third class (panel B; ≤4 km: 95.7% vs 75.7%; c2=14.1, p=0.0015) children.

Childhood Obesity Surveillance Initiative Ireland
Figure 32 presents the distribution of children who were members of at least one sports club.
Figure 32
Distribution of children being a member of at least one sports club.
A: Children from first class DEIS (n=136) or other (n=1874) schools in 2010 and 2012.
0
20
40
60
80
10014.7
85.3
% o
f bei
ng a
mem
ber
of a
spo
rts
club
Other schoolsDisadvantaged schools
NO
YES
29.5
70.5
B: Children from third class DEIS (n=62) or other (n=901) schools in 2010.
0
20
40
60
80
100
23.0 11.0
77.089.0
Other schoolsDisadvantaged schools
% o
f bei
ng a
mem
ber
of a
spo
rts
club NO
YES
Children in DEIS schools were less likely to be a member of at least one sports club than children in other schools for both first (panel A; 70.5% vs 85.3%; c2=16.5, p=0.0001) and third (panel B; 77.0% vs 89.0%; c2=6.2, p<0.0001) class.

Childhood Obesity Surveillance Initiative Ireland Childhood Obesity Surveillance Initiative Ireland
Figure 33 presents the number of visits to sports clubs per week.
Figure 33
Children’s number of visits to sports clubs per week.
A: Children from first class DEIS (n=92) or other (n=1603) schools in 2010 and 2012.
0
10
20
30
40
41.8
26.5
38.4
21.8
13.2
27.5 28.1
2.6
Other schoolsDisadvantaged schools% o
f no.
of v
isit
s to
spo
rts
club
per
wee
k
B: Children from third class DEIS (n=46) or other (n=817) schools in 2010.
0
10
20
30
4040.4
18.5
32.1
26.023.5
31.3
17.2
11.2
1 day 2 days > 3 days3 days
Other schoolsDisadvantaged schools % o
f no.
of v
isit
s to
spo
rts
club
per
wee
k
TYPE OF SCHOOL
Children in DEIS schools visited sports clubs less frequently than children in other schools for both first class (c2=15.0, p=0.0179) and third class (c2=12.1, p=0.0047) children.
Figure 34 presents the average time that children spent playing outdoors as reported by parents. Since we observed a significant difference between first class children in 2010 and in 2012 (see previous Results section on the two birth cohorts data), the distribution is presented separately for 2010 (panel A) and 2012 (panel B). Panel C presents the distribution for third class children in 2010.

Childhood Obesity Surveillance Initiative Ireland
Figure 34
Average time spent per day playing outdoors by children during the week and at weekends. See Appendix 1 for number of missing values for each category.
A: Children from first class DEIS or other schools in 2010.
0
10
20
30
40
50
60
70
80
0.0
10.8
27.5
44.4
17.3
1.8
20.3
40.3
0.04.7 5.7
14.8
74.9
0.0 3.5
12.0
34.0
50.5
27.5
10.2
Disadvantaged schools
Playing outdoors during the week Playing outdoors at weekend
Other schools Disadvantaged schools Other schools
% o
f tim
e sp
ent o
n ac
tivi
ty
B: Children from first class DEIS or other schools in 2012.
0
10
20
30
40
50
60
70
80
Playing outdoors during the week Playing outdoors at weekend
10.8 9.8
33.936.6
9.04.0
25.5
44.2
3.3
11.15.0
10.9
69.7
1.26.7
15.3
35.441.4
19.7
6.6
Disadvantaged schools Other schools Disadvantaged schools Other schools
% o
f tim
e sp
ent o
n ac
tivi
ty
C: Children from third class DEIS or other schools in 2010.
0
10
20
30
40
50
60
70
80
Playing outdoors during the week Playing outdoors at weekend
0.0
20.123.5
32.7
23.6
2.2
16.7
44.5
0.0 1.2
20.0
41.937.0
0.5 3.3
10.7
27.9
57.6
28.7
8.0
Disadvantaged schools Other schools Disadvantaged schools Other schools
% o
f tim
e sp
ent o
n ac
tivi
ty
None at all < 1h/day 2h/day ≥3h/day1h/day
TIME SPENT PLAYING OUTDOORS, PER TYPE OF SCHOOL
No significant differences were observed for playing outdoors during the week and at weekends for children who attended either first (panel A) or third (panel C) class in 2010. For first class children in 2012, a significant difference was observed for playing outdoors both on weekdays and at the weekend (panel B; week: c2=28.4, p=0.0014; weekend: c2=36.5, p=0.0002), with DEIS schoolchildren spending more time per day playing outdoors than children in other schools.

Childhood Obesity Surveillance Initiative Ireland Childhood Obesity Surveillance Initiative Ireland
Figure 35 presents the average time reported by parents that children spent on homework on weekdays and at the weekend.
Figure 35
Average time spent per day on homework by children during the week and at weekends. See Appendix 1 for number of missing values for each category.
A: Children from first class DEIS or other schools in 2010 and 2012.
0
10
20
30
40
50
60
70
2.5
46.642.0
5.83.1
0.3
34.4
52.9
29.8
45.3
21.9
1.2 1.8
16.1
48.4
26.2
7.71.6
11.6
0.7
Disadvantaged schools
Doing homework during the week Doing homework at weekends
Other schools Disadvantaged schools Other schools
% o
f tim
e sp
ent o
n ac
tivi
ty
B: Children from third class DEIS or other school in 2010.
0
10
20
30
40
50
60
70
1.1 1.7
63.6
27.8
5.80.6
21.7
48.5
16.4
40.0 39.5
1.9 1.2
18.8
36.7
29.5
9.25.9
27.5
1.7
Disadvantaged schools
TIME SPENT ON HOMEWORK, PER TYPE OF SCHOOL
Doing homework during the week Doing homework at weekends
Other schools Disadvantaged schools Other schools
% o
f tim
e sp
ent o
n ac
tivi
ty
None at all < 1h/day 2h/day ≥3h/day1h/day
Children from first class DEIS schools spent less time on homework during the week and at weekends (panel A; week: c2=25.8, p=0.0092; weekend: c2=16.7, p=0.0016). For third class children a different pattern emerged with more children in DEIS schools spending about 1 h/day on homework during the week compared to children attending other schools (panel B; 63.6% vs 48.5%; c2=14.7, p=0.0241). No differences were however, observed for children spending over 1 h/day on homework during the week and no significant differences were observed for doing homework at the weekend.
Figure 36 presents the average time spent playing computer games. Since we observed a significant difference between first class children in 2010 and in 2012 (see previous Results section on both birth cohorts data), the distribution is presented separately for 2010 (panel A) and 2012 (panel B). Panel C presents the distribution for third class children in 2010.

Childhood Obesity Surveillance Initiative Ireland
Figure 36
Average time spent per day playing computer games by children during the week and at weekends. See Appendix 1 for number of missing values for each category.
A: Children from first class DEIS or other schools in 2010.
0
10
20
30
40
50
60
50.7
19.2
30.1
0.0 0.0
56.7
35.5
5.9
35.6
28.7
13.4
21.8
0.5
30.3
43.5
17.6
7.01.61.4 0.6
Disadvantaged schools Other schools Disadvantaged schools Other schools
% o
f tim
e sp
ent o
n ac
tivi
ty
Playing computer games during the week Playing computer games at weekend
B: Children from first class DEIS or other schools in 2012.
0
10
20
30
40
50
6052.9
29.0
11.5
5.80.8
45.7
38.8
12.2
20.023.2
34.6
14.8
7.4
23.6
36.3
21.8
15.8
2.52.7 0.6
Disadvantaged schools Other schools Disadvantaged schools Other schools
% o
f tim
e sp
ent o
n ac
tivi
ty
Playing computer games during the week Playing computer games at weekend
C: Children from third class DEIS or other schools in 2010.
0
10
20
30
40
50
60
35.830.6
27.2
6.4
0.0
39.1
48.5
10.5
22.0
33.6
16.719.7
8.1
20.6
41.7
22.0
12.9
2.91.9 0.0
Disadvantaged schools Other schools Disadvantaged schools Other schools
% o
f tim
e sp
ent o
n ac
tivi
ty
Playing computer games during the week Playing computer games at weekend
None at all < 1h/day 2h/day ≥3h/day1h/day
TIME SPENT PLAYING COMPUTER GAMES, PER TYPE OF SCHOOL
First class children from DEIS schools were significantly less likely to have a computer at home than children who attended other schools (83.5% vs 95.7%, respectively; c2=30.6, p<0.0001).

Childhood Obesity Surveillance Initiative Ireland Childhood Obesity Surveillance Initiative Ireland
For third class children, no differences were observed between children in DEIS schools and other schools (97.2% vs 95.5% that had a computer at home, respectively). Regarding playing computer games, children from first class DEIS schools in 2010 spent more time on a computer daily than children in other schools for both weekdays and at the weekend (panel A; week: c2=104.7, p=0.0067; weekend: c2=41.3, p=0.0022). No significant differences were observed for first class children in 2012 (panel B). For third class children, significantly more time was spent weekdays on a computer by DEIS schoolchildren compared to children in other schools (panel C; c2=17.9, p=0.0244). No differences were observed for the weekend.
Figure 37 presents the average time that children spent watching television on weekdays and at the weekend.
Figure 37
Average time spent per day watching television by children during the week and at weekends. See Appendix 1 for number of missing values for each category.
A: Children from first class DEIS or other schools in 2010 and 2012.
0
10
20
30
40
50
60
70
0.3
17.121.3
50.7
10.66.2
27.2
36.4
2.5 1.2
14.0
35.8
46.6
1.17.1
15.2
50.6
26.127.0
3.2
Disadvantaged schools Other schools Disadvantaged schools Other schools
% o
f tim
e sp
ent o
n ac
tivi
ty
Watching television during the week Watching television at weekends
B: Children from third class DEIS or other schools in 2010.
0.6
9.2
25.229.3
35.7
4.6
27.8
34.9
0.06.4
2.3
30.6
60.7
0.35.3
13.9
49.5
31.128.0
4.7
Disadvantaged schools Other schools Disadvantaged schools Other schools
% o
f tim
e sp
ent o
n ac
tivi
ty
0
10
20
30
40
50
60
70
Watching television during the week Watching television at weekends
None at all < 1h/day 2h/day ≥3h/day1h/day
TIME SPENT WATCHING TELEVISION, PER TYPE OF SCHOOL
Children from first class DEIS schools spent more time watching television than children in other schools on both weekdays and at the weekend (panel A; week: c2=49.1, p<0.0001; weekend: c2=26.0, p=0.0046). Similar patterns were observed for third class children (panel B; week: c2=76.7, p<0.0001; weekend: c2=19.8, p=0.0441).
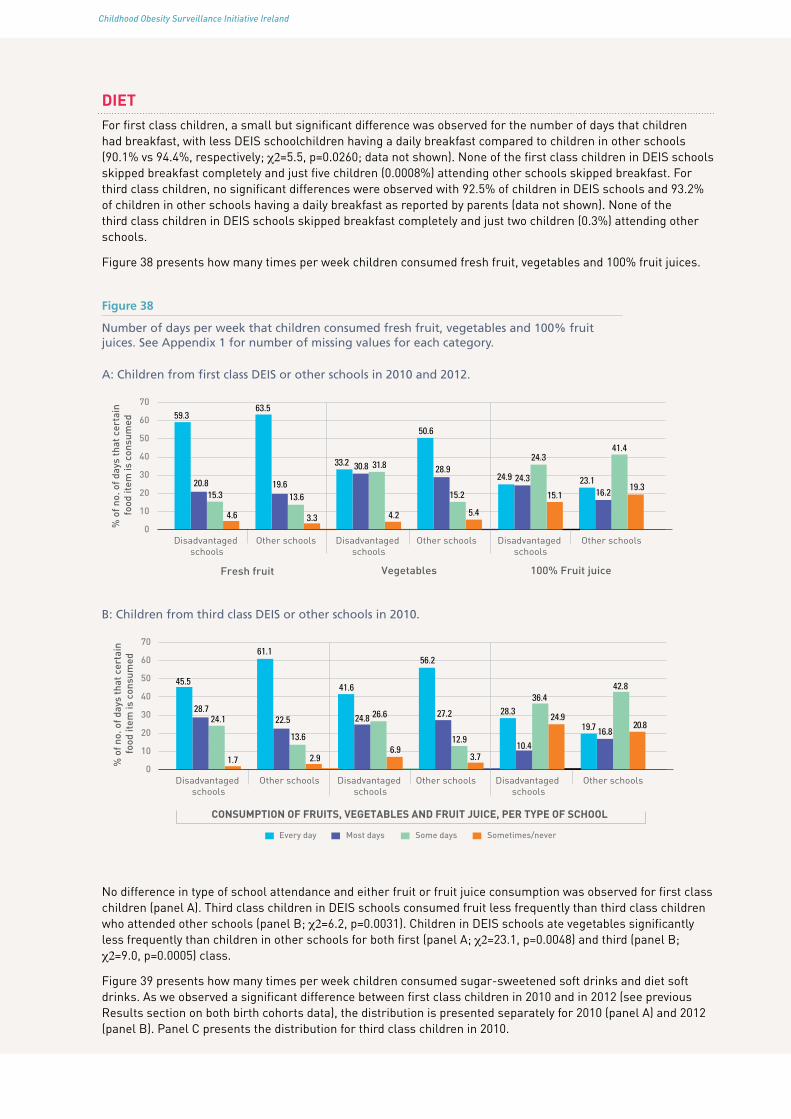
Childhood Obesity Surveillance Initiative Ireland
DIETFor first class children, a small but significant difference was observed for the number of days that children had breakfast, with less DEIS schoolchildren having a daily breakfast compared to children in other schools (90.1% vs 94.4%, respectively; c2=5.5, p=0.0260; data not shown). None of the first class children in DEIS schools skipped breakfast completely and just five children (0.0008%) attending other schools skipped breakfast. For third class children, no significant differences were observed with 92.5% of children in DEIS schools and 93.2% of children in other schools having a daily breakfast as reported by parents (data not shown). None of the third class children in DEIS schools skipped breakfast completely and just two children (0.3%) attending other schools.
Figure 38 presents how many times per week children consumed fresh fruit, vegetables and 100% fruit juices.
Figure 38
Number of days per week that children consumed fresh fruit, vegetables and 100% fruit juices. See Appendix 1 for number of missing values for each category.
A: Children from first class DEIS or other schools in 2010 and 2012.
0
10
20
30
40
50
60
7059.3
20.815.3
4.6
63.5
19.6
33.2
4.2
13.6
3.3
50.6
28.9
15.2
5.4
24.9
15.1
24.3
24.3 23.116.2
41.4
19.3
30.8 31.8
Disadvantaged schools
Other schools Disadvantaged schools
Other schools Disadvantaged schools
Other schools
% o
f no.
of d
ays
that
cer
tain
fo
od it
em is
con
sum
ed
Fresh fruit Vegetables 100% Fruit juice
B: Children from third class DEIS or other schools in 2010.
0
10
20
30
40
50
60
70
% o
f no.
of d
ays
that
cer
tain
fo
od it
em is
con
sum
ed
45.5
28.724.1
1.7
61.1
22.5
41.6
6.913.6
2.9
56.2
27.2
12.9
3.7
28.324.9
36.4
10.4
19.7 16.8
42.8
20.824.8 26.6
Disadvantaged schools
Other schools Disadvantaged schools
Other schools Disadvantaged schools
Other schools
Every day Most days Sometimes/neverSome days
CONSUMPTION OF FRUITS, VEGETABLES AND FRUIT JUICE, PER TYPE OF SCHOOL
No difference in type of school attendance and either fruit or fruit juice consumption was observed for first class children (panel A). Third class children in DEIS schools consumed fruit less frequently than third class children who attended other schools (panel B; c2=6.2, p=0.0031). Children in DEIS schools ate vegetables significantly less frequently than children in other schools for both first (panel A; c2=23.1, p=0.0048) and third (panel B; c2=9.0, p=0.0005) class.
Figure 39 presents how many times per week children consumed sugar-sweetened soft drinks and diet soft drinks. As we observed a significant difference between first class children in 2010 and in 2012 (see previous Results section on both birth cohorts data), the distribution is presented separately for 2010 (panel A) and 2012 (panel B). Panel C presents the distribution for third class children in 2010.

Childhood Obesity Surveillance Initiative Ireland Childhood Obesity Surveillance Initiative Ireland
Figure 39
Number of days per week that children consumed sugar-sweetened soft drinks and diet soft drinks. See Appendix 1 for number of missing values for each category.
A: Children from first class DEIS or other schools in 2010.
0
10
20
30
40
50
60
70
80
4.310.7
54.1
30.9
4.88.4
0.5
61.6
45.641.2
1.7 2.6
26.3
69.3
0.5
37.5
Disadvantaged schools
Other schools Disadvantaged schools
Other schools
% o
f no.
of d
ays
that
cer
tain
be
vera
ge it
em is
con
sum
ed
Sugar sweetened soft drinks Diet soft drinks
A: Children from first class DEIS or other schools in 2012.
0
10
20
30
40
50
60
70
80
% o
f no.
of d
ays
that
cer
tain
be
vera
ge it
em is
con
sum
ed
1.6
19.2
36.243.1
2.66.0
2.4
71.6
40.7
50.7
0.5 2.6
19.8
77.2
2.4
23.7
Disadvantaged schools
Other schools Disadvantaged schools
Other schools
Sugar sweetened soft drinks Diet soft drinks
C: Children from third class DEIS or other schools in 2010.
0
10
20
30
40
50
60
70
80
% o
f no.
of d
ays
that
cer
tain
be
vera
ge it
em is
con
sum
ed
2.4
15.3
57.4
25.0
2.97.1
1.7
34.0
55.1
34.9
0.9 3.2
34.6
61.4
1.1
63.1
Disadvantaged schools
Sugar sweetened soft drinks Diet soft drinks
Other schools Disadvantaged schools
Other schools
CONSUMPTION OF SOFT DRINKS AND DIET SOFT DRINKS, PER TYPE OF SCHOOL
Every day Most days Some days Sometimes/never
There were no significant differences observed between type of school attendance and the consumption of either sugar-sweetened soft drinks or diet soft drinks. Although it seems that children from third class DEIS schools consumed diet soft drinks more frequently than children in other schools (panel C); however, this was a non-significant difference (c2=16.4, p=0.0884).

Childhood Obesity Surveillance Initiative Ireland
Figure 40 presents number of times and type of milk that children consumed per week.
Figure 40
Number of days per week and type of milk consumed by children. See Appendix 1 for number of missing values for each category.
A: Children from first class DEIS or other schools in 2010 and 2012.
% o
f num
ber
of d
ays
that
cer
tain
be
vera
ge it
em is
con
sum
ed
12.618.4
Low-fat milk Full-fat milk Flavoured milk
54.8
14.34.5
10.4
62.9
22.116.9 15.1 16.6
51.4
11.612.521.3
54.5
1.3
18.8
79.4
0.6 0.8
12.8
84.5
1.910
20
30
40
50
60
70
80
90
0 Disadvantaged
schoolsOther Schools Disadvantaged
schoolsOther Schools Disadvantaged
schoolsOther Schools
B: Children from third class DEIS or other schools in 2010.
% o
f num
ber
of d
ays
that
cer
tain
be
vera
ge it
em is
con
sum
ed
1.2
14.6
Low-fat milk Full-fat milk Flavoured milk
73.2
10.93.8
8.7
62.1
25.420.7
4.513.8
61.0
10.110.4
22.7
56.9
6.2
17.2
76.0
0.6 1.0
13.9
83.6
1.510
20
30
40
50
60
70
80
90
0
Every day Most days Some days Sometimes/never
CONSUMPTION OF DIFFERENT TYPES OF MILK, PER DATA COLLECTION ROUND
Disadvantagedschools
Other Schools Disadvantagedschools
Other Schools Disadvantagedschools
Other Schools
No significant differences were observed between number of times that milk was consumed by first class children in DEIS schools and other schools (panel A). For third class children, a significant difference was observed for full-fat milk (panel B; c2=7.9, p=0.0430). Children in DEIS schools consumed full-fat milk more often than children in other schools.

Childhood Obesity Surveillance Initiative Ireland Childhood Obesity Surveillance Initiative Ireland
Figure 41 presents how many times per week consumed cheese and other dairy.
Figure 41
Number of days per week that children consumed cheese and other dairy (including yoghurt, milk pudding and cream cheese). See Appendix 1 for number of missing values for each category.
A: Children from first class DEIS or other schools in 2010 and 2012.
3530
4045
25201510
50
Disadvantagedschools
20.3
37.4
Other Schools
Cheese Other dairy
18.723.6
Disadvantagedschools
Other Schools
23.7
40.8
19.515.9
23.3 23.6
14.4
38.8
27.4 27.3
6.5
38.8
% o
f no.
of d
ays
that
cer
tain
fo
od it
em is
con
sum
ed
B: Children from third class DEIS or other schools in 2010.
3530
4045
25201510
50
20.4
26.2
34.8
18.6 22.1
42.1
15.0 16.6
36.8
12.1
34.530.1
33.5
6.1
30.2
% o
f no.
of d
ays
that
cer
tain
fo
od it
em is
con
sum
ed
CONSUMPTION OF CHEESE AND OTHER DIARY, PER TYPE OF SCHOOL
Every day Most days Some days Sometimes/never
Disadvantagedschools
Other Schools
Cheese Other dairy
Disadvantagedschools
Other Schools
20.7
No significant differences were observed for the number of days that DEIS schoolchildren ate cheese or other dairy compared to children in other schools for both first (panel A) and third (panel B) class.

Childhood Obesity Surveillance Initiative Ireland
Figure 42 presents how many times per week children consumed fish and meat.
Figure 42
Number of days per week that children consumed fish and meat. See Appendix 1 for number of missing values for each category.
A: Children from first class DEIS or other schools in 2010 and 2012.
70
60
80
50
40
30
20
10
0
46.3
16.4
3.9
33.4
48.2
12.5
2.0
37.2
12.7
66.7
20.0
0.65.9
78.6
14.3
1.2
Disadvantagedschools
Other Schools
Meat Fish
Disadvantagedschools
Other Schools
% o
f no.
of d
ays
that
cer
tain
fo
od it
em is
con
sum
ed
B: Children from third class DEIS or other schools in 2010.
70
60
80
50
40
30
20
10
0
41.1
15.0
0.0
43.949.0
10.1
1.9
39.0
6.4
75.8
17.3
0.67.5
75.0
17.1
0.4
CONSUMPTION OF MEAT AND FISH, PER TYPE OF SCHOOL
Every day Most days Some days Sometimes/never
Disadvantagedschools
Other Schools
Meat Fish
Disadvantagedschools
Other Schools
% o
f no.
of d
ays
that
cer
tain
fo
od it
em is
con
sum
ed
No differences in frequencies of meat consumption were observed between children in DEIS schools and other schools for both first (panel A) and third (panel B) class. For fish, a significant different pattern was observed, with children from first class DEIS schools eating fish less frequently than children in other schools (panel A; c2=11.4, p=0.0041), but no differences were observed for third class children (panel B).

Childhood Obesity Surveillance Initiative Ireland Childhood Obesity Surveillance Initiative Ireland
Figure 43 presents how many times per week children consumed foods such as chocolate and biscuits.
Figure 43
Number of days per week that children consumed foods such as biscuits cake, doughnuts or pie and foods such as chocolate. See Appendix 1 for number of missing values for each category.
A: Children from first class DEIS or other schools in 2010 and 2012.
20.3
67.0
1.5
11.316.6
76.4
3.73.3
28.7
60.5
6.34.5
18.9
67.3
7.66.2
70
60
80
50
40
30
20
10
0% o
f no.
of d
ays
that
cer
tain
fo
od it
em is
con
sum
ed
Disadvantagedschools
Other Schools
Chocolate etc. Biscuits etc.
Disadvantagedschools
Other Schools
B: Children from third class DEIS or other schools in 2010.
27.0
58.6
1.1
13.2 16.3
75.9
3.54.3
16.4
63.8
2.3
17.6 22.6
64.4
8.05.0
70
60
80
50
40
30
20
10
0% o
f no.
of d
ays
that
cer
tain
fo
od it
em is
con
sum
ed
Disadvantagedschools
Other Schools
Chocolate etc. Biscuits etc.
Disadvantagedschools
Other Schools
CONSUMPTION OF FOODS SUCH AS CHOCOLATE AND BISCUITS, PER TYPE OF SCHOOL
Every day Most days Some days Sometimes/never
Products such as chocolate were consumed significantly more frequently by children in DEIS schools than children in other schools for both first (panel A; c2=19.9, p=0.0015) and third (panel B; c2=12.9, p=0.0013) class. More children from third class DEIS schools consumed products such as biscuits daily while less children consumed these “sometimes or never” than children in other schools (panel B; c2=15.0, p=0.0078). There was no significant difference between number of times that first class children consumed biscuits and type of school attendance (panel A).

Childhood Obesity Surveillance Initiative Ireland
Figure 44 presents how many times per week children consumed foods such as crisps and pizza.
Figure 44
Number of days per week that children consumed foods such as crisps, popcorn or peanuts and foods such as pizza, French fries, fried potatoes, hamburger, sausage or meat pies. See Appendix 1 for number of missing values for each category.
A: Children from first class DEIS or other schools in 2010 and 2012.
7060
9080
100
5040302010
0
14.8
75.5
6.13.6 7.2
78.9
11.82.1 3.5
89.8
5.80.9
5.9
86.9
6.60.7%
of n
o. o
f day
s th
at c
erta
in
food
item
is c
onsu
med
Disadvantagedschools
Other Schools
Crisps etc. Pizza etc.
Disadvantagedschools
Other Schools
B: Children from third class DEIS or other schools in 2010.
7060
9080
100
5040302010
0
19.7
66.5
1.1
12.77.9
77.0
10.64.6 2.8
88.0
8.01.1
5.6
87.8
5.70.9
% o
f no.
of d
ays
that
cer
tain
fo
od it
em is
con
sum
ed
Disadvantagedschools
Other Schools
Crisps etc. Pizza etc.
Disadvantagedschools
Other Schools
CONSUMPTION OF FOODS SUCH AS CRISPS OR PIZZA, PER TYPE OF SCHOOL
Every day Most days Some days Sometimes/never
Crisps, popcorn or peanuts were consumed significantly more frequently by children in DEIS schools than children in other schools for both first (panel A; c2=11.3, p=0.0473) and third (panel B; c2=17.7, p<0.0001) class. There was no difference in number of times that children consumed products such as pizza, French fries, fried potatoes, hamburger, sausage or meat pies between the ones who attended DEIS schools and other schools.

Childhood Obesity Surveillance Initiative Ireland Childhood Obesity Surveillance Initiative Ireland
MEDICAL CONDITIONSFigure 45 represent households with a diagnosis of a medical condition in the previous 12 months.
Figure 45
Distribution of diagnosis of a medical condition in the previous 12 months in households. See Appendix 1 for number of missing values for each category.
A: Children from first class DEIS or other schools in 2010 and 2012.
% o
f bei
ng d
iagn
osed
wit
h a
cert
ain
med
ical
con
diti
on
Disadvantagedschools
Other Schools Disadvantagedschools
Other Schools Disadvantagedschools
Other Schools
High blood pressure Diabetes High cholesterol
8.7
90.7
0.65.9
92.2
1.9 1.2
95.8
3.0 1.2
97.9
0.9
83.7
3.313.0
84.6
1.6
13.9
0
20
40
60
80
100
B: Children from third class DEIS or other schools in 2010.
% o
f bei
ng d
iagn
osed
wit
h a
cert
ain
med
ical
con
diti
on
2.3
96.0
1.77.2
91.5
1.3 1.1
98.3
0.6 2.0
97.6
0.4
88.6
0.610.9
80.6
1.5
17.9
0
20
40
60
80
100
TYPE OF MEDICAL CONDITION, PER TYPE OF SCHOOL
Yes No Don't know
Disadvantagedschools
Other Schools Disadvantagedschools
Other Schools Disadvantagedschools
Other Schools
High blood pressure Diabetes High cholesterol
In both groups, few households were diagnosed with a medical condition. No significant differences were observed between certain medical conditions and type of school attendance for both first class (panel A) and third class (panel B) children.
SOCIAL, ECONOMIC AND HOUSINGFor first class children, the number of adults and children living in a household did not differ between children who attended DEIS schools and other schools. For both type of households, the median number of adults (aged 18 years or older) was two persons (range is 1-7 for children in DEIS schools and 1-10 for children in other schools). The median number of persons aged less than 18 in the households was three persons (range is 1-6 for children in DEIS schools and 1-8 for children in other schools). For third class children on the other hand, a significant difference was observed for both the number of adults (F=7.53, p=0.0070) and the number of children (F=11.95, p=0.0008) between households, although the actual differences were very small. For third class children in DEIS schools, the median number of adults was two persons (range: 1-5) and the median number of persons aged less than 18 years was three (range: 1-9). For third class children in other schools, the median number of adults was also two persons (range: 1-8) and the median number of persons aged less than 18 years was three (range: 1-7).

Childhood Obesity Surveillance Initiative Ireland
Figure 46 presents the highest education level attained by parents.
Figure 46
Distribution of highest attained education level by parents.
A: Parents of children from first class DEIS (119 fathers and 135 mothers) or other (1756 fathers and 1834 mothers) schools in 2010 and 2012.
% o
f hig
hest
att
aine
ded
ucat
ion
leve
l 57.1
27.7
4.810.4
36.2
48.2
14.5
1.1
76.7
13.85.14.4
45.9
35.2
14.6
4.2
70
60
80
50
40
30
20
10
0Disadvantaged
schoolsOther Schools
Mothers Fathers
Disadvantagedschools
Other Schools
B: Parents of children from third class DEIS (52 fathers and 62 mothers) or other (858 fathers and 893 mothers) schools in 2010.
% o
f hig
hest
att
aine
ded
ucat
ion
leve
l 58.0
13.9
1.76.3
39.346.0
12.7
2.0
70.6
24.3
2.52.5
50.5
34.4
13.7
1.4
70
60
80
50
40
30
20
10
0Disadvantaged
schoolsOther Schools
Mothers Fathers
Disadvantagedschools
Other Schools
HIGHEST ATTAINED EDUCATION LEVEL BY PARENTS, PER TYPE OF SCHOOL
Primary school Secondary school Postgraduate/BSc MSc or higher
Significantly less parents of children in DEIS schools had attained a bachelor’s degree or higher than parents of children in other schools for both children in first (c2=80.5, p<0.0001 for mothers and c2=34.2, p=0.0012 for fathers) and third (c2=13.3, p=0.0350 for mother and c2=8.3, p=0.0319 for fathers) class.

Childhood Obesity Surveillance Initiative Ireland Childhood Obesity Surveillance Initiative Ireland
Figures 47 and 48 present the main type of employment done by the father or the mother, respectively over the previous 12 months.
Figure 47
Distribution of main type of employment done by fathers in previous 12 months.
A: Fathers of children from first class DEIS (n=119) or other (n=1771) schools in 2010 and 2012.
30
40
20
10
0
% o
f em
ploy
men
t typ
e
16.3 15.0
Governmentemployed
35.5
41.4
Non-governmentemployed
21.6
29.5
Self-employed
3.8 2.1
Homemaker
22.8
12.1
Other
B: Fathers of children from third class DEIS (n=50) or other (n=858) schools in 2010.
30
40
20
10
0Government
employedNon-government
employedSelf-employed Homemaker Other
% o
f em
ploy
men
t typ
e
28.8
14.1
29.4
40.6
19.8
34.4
6.2
1.2
15.8
9.8
EMPLOYMENT TYPE, PER TYPE OF SCHOOL
Disadvantaged schools Other schools

Childhood Obesity Surveillance Initiative Ireland
Figure 48
Distribution of main type of employment done by mothers in previous 12 months.
A: Mothers of children from first class DEIS (n=135) or other (n=1854) schools in 2010 and 2012.
30
40
20
10
0
% o
f em
ploy
men
t typ
e
12.3
24.228.0 26.0
8.4 9.6
39.2
32.8
12.07.3
Governmentemployed
Non-governmentemployed
Self-employed Homemaker Other
B: Mothers of children from third class DEIS (n=60) or other (n=897) schools in 2010.
30
40
20
10
0
% o
f em
ploy
men
t typ
e
26.2 25.1
20.7
26.8
6.7
10.9
36.6
31.4
9.75.9
EMPLOYMENT TYPE, PER TYPE OF SCHOOL
Disadvantaged schools Other schools
Governmentemployed
Non-governmentemployed
Self-employed Homemaker Other
There were no differences between children’s type of school attendance and the type of work done by the fathers for both first class (figure 47, panel A) and third class (figure 47, panel B) children. For the type of work done by mothers, a significant difference was observed, with mothers of first class children in DEIS schools working less in government-type jobs than children in other schools (figure 48, panel A; c2=10.0, p=0.0467). No differences were observed for type of work done by mothers of third class children (figure 48, panel B).

Childhood Obesity Surveillance Initiative Ireland Childhood Obesity Surveillance Initiative Ireland
Figure 49 presents the type of housing that the family lived in.
Figure 49
Distribution of type of housing that families lived in.
A: Families of children from first class DEIS (n=135) or other (n=1877) schools in 2010 and 2012
70
60
80
50
40
30
20
10
0
% o
f typ
e of
hou
sing
39.4
62.7 59.1
35.9
1.5 1.4
House/bungalowdetached
OtherHouse/bungalowsemi-detached
B: Families of children from third class DEIS (n=62) or other (n=906) schools in 2010
70
60
80
50
40
30
20
10
0
% o
f typ
e of
hou
sing
50.7
67.6
45.9
30.8
3.41.6
House/bungalowdetached
OtherHouse/bungalowsemi-detached
TYPE OF HOUSING, PER TYPE OF SCHOOL
Disadvantaged schools Other schools
Families of children in DEIS schools were more likely to live in semi-detached houses or bungalows than families of children who attended other schools for both first (panel A; c2=22.8, p=0.0020) and third (panel B; c2=6.0, p=0.0532) class.
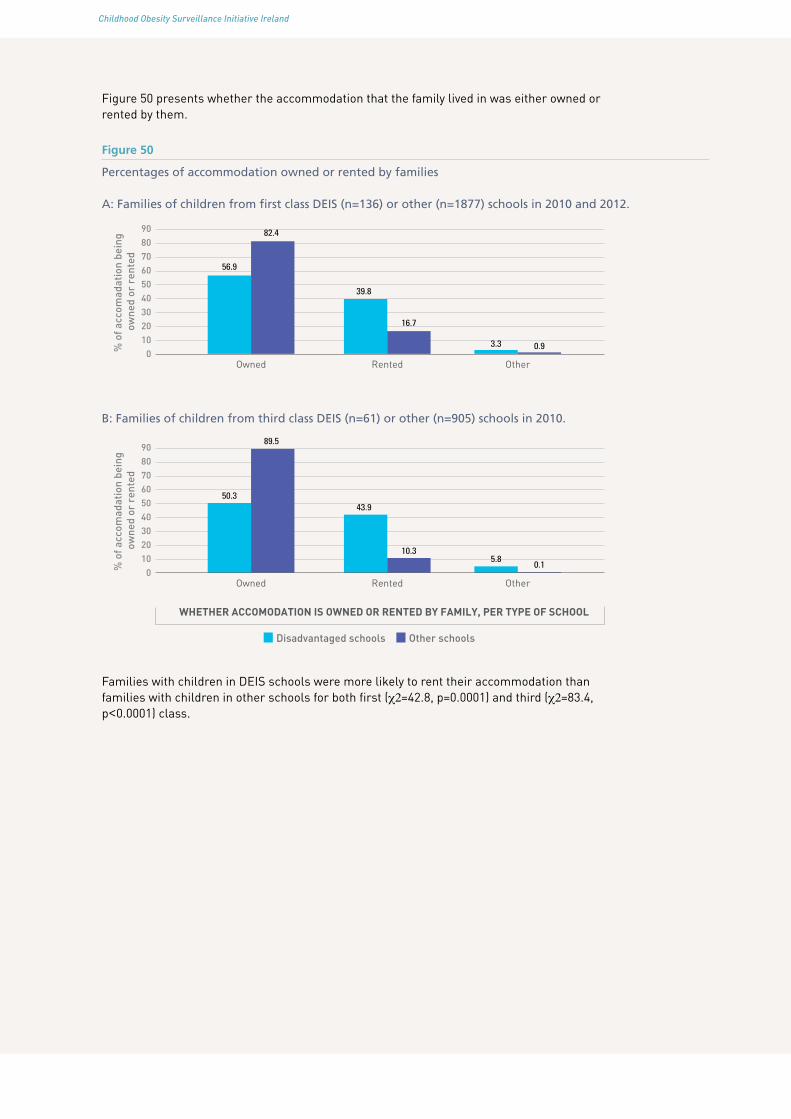
Childhood Obesity Surveillance Initiative Ireland
Figure 50 presents whether the accommodation that the family lived in was either owned or rented by them.
Figure 50
Percentages of accommodation owned or rented by families
A: Families of children from first class DEIS (n=136) or other (n=1877) schools in 2010 and 2012.
7060
9080
5040302010
0% o
f acc
omad
atio
n be
ing
owne
d or
ren
ted
56.9
82.4
39.8
16.7
3.3 0.9
Owned OtherRented
B: Families of children from third class DEIS (n=61) or other (n=905) schools in 2010.
7060
9080
5040302010
0% o
f acc
omad
atio
n be
ing
owne
d or
ren
ted
50.3
89.5
43.9
10.35.8
0.1
Owned OtherRented
WHETHER ACCOMODATION IS OWNED OR RENTED BY FAMILY, PER TYPE OF SCHOOL
Disadvantaged schools Other schools
Families with children in DEIS schools were more likely to rent their accommodation than families with children in other schools for both first (c2=42.8, p=0.0001) and third (c2=83.4, p<0.0001) class.

Childhood Obesity Surveillance Initiative Ireland Childhood Obesity Surveillance Initiative Ireland
ConclusionThe possible risk factors contributing to childhood obesity were very similar in both birth cohorts. Some significant differences were observed between children who attended first class in 2010 and 2012. Fewer children spent 2 hours or more per day playing outdoors in 2012 than in 2010 and more children spent time on a computer and for a longer duration in 2012 than in 2010. Moreover, children consumed less sugar-sweetened soft drinks and diet soft drinks in 2012 than in 2010.
Not surprisingly, more significant differences were observed between children who attended DEIS schools and children who attended other schools. Children from first class DEIS schools had a lower birth weight, walked or cycled to school more often, went less often by motorised vehicles and spent less time on homework than children in other schools. Children who attended either first or third class in DEIS schools lived closer to school, were less likely to be a member of a sports club, visited sports clubs less often and spent more time watching television than children in other schools. Children from first class DEIS schools in 2012 played more outdoors, which was not observed for children attending DEIS schools in 2010. These children (2010) spent more time playing games during the week than children in other schools. No such difference was observed for children attending DEIS schools in 2012. First class children in DEIS schools were less likely to have a computer at home and their parents were more likely to consider routes to school to be safe.
Regarding diet, DEIS schoolchildren ate vegetables less frequently and consumed products such as chocolate and crisps more often than children in other schools. Furthermore, first class children in DEIS schools ate breakfast and fish less often than children in other schools. Third class children in DEIS schools consumed fruit less often and full-fat milk and products such as biscuits more often.
The mothers whose first class children attended DEIS schools were less likely to have a government-type of employment than mothers of children in other schools. Moreover, less parents of DEIS schoolchildren attained a bachelor degree or higher than parents of children in other schools. Finally, families with children who attended DEIS schools were less likely to live in detached houses or bungalows and were more likely to rent their accommodation than families with children in other schools.
The following must be borne in mind when interpreting the results on the comparisons carried out between children in DEIS schools and children in other schools. Although there were considerable numbers of DEIS schools included in the study, the numbers for comparison were rather small, especially when looking at third class children. Therefore, caution should be taken in interpreting these results.
To conclude, children became a little less physically active in 2012 than in 2010, while their diet improved slightly over time. A different pattern, however, was observed among children in DEIS schools, with several possible risk factors more pronounced in this group than children who attended other schools.

Childhood Obesity Surveillance Initiative Ireland
References
1. de Onis M, Blossner M, and Borghi E. Global prevalence and trends of overweight and obesity among preschool children. Am J Clin Nutr, 2010;92(5):1257-64.
2. National Taskforce on Obesity. Obesity - The Policy Challenges - The Report of the National Taskforce on Obesity., 2005, Department of Health and Children.
3. SafeFood. The cost of overweight and obesity on the Island of Ireland - Executive Summary, 2012.
4. Cali AM and Caprio S. Prediabetes and type 2 diabetes in youth: an emerging epidemic disease? Curr Opin Endocrinol Diabetes Obes, 2008;15(2):123-7.
5. Marcus CL. Sleep-disordered breathing in children. Am J Respir Crit Care Med, 2001;164(1):16-30.
6. Pinhas-Hamiel O and Zeitler P. The global spread of type 2 diabetes mellitus in children and adolescents. J Pediatr, 2005;146(5):693-700.
7. Verhulst SL, Van Gaal L, De Backer W, and Desager K. The prevalence, anatomical correlates and treatment of sleep-disordered breathing in obese children and adolescents. Sleep Med Rev, 2008;12(5):339-46.
8. Griffiths LJ, Parsons TJ, and Hill AJ. Self-esteem and quality of life in obese children and adolescents: a systematic review. Int J Pediatr Obes, 2010;5(4):282-304.
9. Singh AS, Mulder C, Twisk JW, van Mechelen W, and Chinapaw MJ. Tracking of childhood overweight into adulthood: a systematic review of the literature. Obes Rev, 2008;9(5):474-88.
10. Obesity and overweight fact sheet. The World Health Organization. March 2013 27th May 2013]; Available from: http://www.who.int/mediacentre/factsheets/fs311/en/index.html.
11. Flegal KM, Kit BK, Orpana H, and Graubard BI. Association of all-cause mortality with overweight and obesity using standard body mass index categories: a systematic review and meta-analysis. JAMA, 2013;309(1):71-82.
12. Kernan WN, Inzucchi SE, Sawan C, Macko RF, and Furie KL. Obesity: a stubbornly obvious target for stroke prevention. Stroke, 2013;44(1):278-86.
13. Owen CG, Whincup PH, Orfei L, et al. Is body mass index before middle age related to coronary heart disease risk in later life? Evidence from observational studies. Int J Obes (Lond), 2009;33(8):866-77.
14. Verbeeten KC, Elks CE, Daneman D, and Ong KK. Association between childhood obesity and subsequent Type 1 diabetes: a systematic review and meta-analysis. Diabet Med, 2011;28(1):10-8.
15. Li S, Chen W, Srinivasan SR, et al. Childhood cardiovascular risk factors and carotid vascular changes in adulthood: the Bogalusa Heart Study. JAMA, 2003;290(17):2271-6.
16. Srinivasan SR, Bao W, Wattigney WA, and Berenson GS. Adolescent overweight is associated with adult overweight and related multiple cardiovascular risk factors: the Bogalusa Heart Study. Metabolism, 1996;45(2):235-40.
17. Baker JL, Olsen LW, and Sorensen TI. Childhood body-mass index and the risk of coronary heart disease in adulthood. N Engl J Med, 2007;357(23):2329-37.
18. Satpathy HK, Fleming A, Frey D, Barsoom M, Satpathy C, and Khandalavala J. Maternal obesity and pregnancy. Postgrad Med, 2008;120(3):E01-9.
19. Sebire NJ, Jolly M, Harris JP, et al. Maternal obesity and pregnancy outcome: a study of 287,213 pregnancies in London. Int J Obes Relat Metab Disord, 2001;25(8):1175-82.

Childhood Obesity Surveillance Initiative Ireland Childhood Obesity Surveillance Initiative Ireland
20. Brophy S, Cooksey R, Gravenor MB, et al. Risk factors for childhood obesity at age 5: analysis of the millennium cohort study. BMC Public Health, 2009;9:467.
21. Thibault H, Carriere C, Langevin C, Kossi Deti E, Barberger-Gateau P, and Maurice S. Prevalence and factors associated with overweight and obesity in French primary-school children. Public Health Nutr, 2013;16(2):193-201.
22. Flores G and Lin H. Factors predicting overweight in US kindergartners. Am J Clin Nutr, 2013;97(6):1178-87.
23. Ochoa MC, Moreno-Aliaga MJ, Martinez-Gonzalez MA, Martinez JA, Marti A, and Members G. Predictor factors for childhood obesity in a Spanish case-control study. Nutrition, 2007;23(5):379-84.
24. Papandreou D, Malindretos P, and Rousso I. Risk factors for childhood obesity in a Greek paediatric population. Public Health Nutr, 2010;13(10):1535-9.
25. Garden FL, Marks GB, Almqvist C, Simpson JM, and Webb KL. Infant and early childhood dietary predictors of overweight at age 8 years in the CAPS population. Eur J Clin Nutr, 2011;65(4):454-62.
26. Kleiser C, Schaffrath Rosario A, Mensink GB, Prinz-Langenohl R, and Kurth BM. Potential determinants of obesity among children and adolescents in Germany: results from the cross-sectional KiGGS Study. BMC Public Health, 2009;9:46.
27. Burke V, Beilin LJ, Durkin K, Stritzke WG, Houghton S, and Cameron CA. Television, computer use, physical activity, diet and fatness in Australian adolescents. Int J Pediatr Obes, 2006;1(4):248-55.
28. Burke V, Beilin LJ, Simmer K, et al. Predictors of body mass index and associations with cardiovascular risk factors in Australian children: a prospective cohort study. Int J Obes (Lond), 2005;29(1):15-23.
29. Mitchell JA, Pate RR, Beets MW, and Nader PR. Time spent in sedentary behavior and changes in childhood BMI: a longitudinal study from ages 9 to 15 years. Int J Obes (Lond), 2013;37(1):54-60.
30. Lagiou A and Parava M. Correlates of childhood obesity in Athens, Greece. Public Health Nutr, 2008;11(9):940-5.
31. Layte R and McCrory C. Growing Up in Ireland. National Longitudinal Study of Children. Overweight and obesity among 9-year-olds, 2011: Dublin.
32. Parsons TJ, Power C, and Manor O. Physical activity, television viewing and body mass index: a cross-sectional analysis from childhood to adulthood in the 1958 British cohort. Int J Obes (Lond), 2005;29(10):1212-21.
33. Winter JD, Langenberg P, and Krugman SD. Newborn adiposity by body mass index predicts childhood overweight. Clin Pediatr (Phila), 2010;49(9):866-70.
34. Danielzik S, Czerwinski-Mast M, Langnase K, Dilba B, and Muller MJ. Parental overweight, socioeconomic status and high birth weight are the major determinants of overweight and obesity in 5-7 y-old children: baseline data of the Kiel Obesity Prevention Study (KOPS). Int J Obes Relat Metab Disord, 2004;28(11):1494-502.
35. Murrin C, Shrivastava A, Kelleher CC, and Lifeways Cross-generation Cohort Study Steering G. Maternal macronutrient intake during pregnancy and 5 years postpartum and associations with child weight status aged five. Eur J Clin Nutr, 2013;67(6):670-9.
36. O’Dea JA, Dibley MJ, and Rankin NM. Low sleep and low socioeconomic status predict high body mass index: a 4-year longitudinal study of Australian schoolchildren. Pediatr Obes, 2012;7(4):295-303.
37. Keane E, Layte R, Harrington J, Kearney PM, and Perry IJ. Measured parental weight status and familial socio-economic status correlates with childhood overweight and obesity at age 9. PLoS One, 2012;7(8):e43503.

Childhood Obesity Surveillance Initiative Ireland
38. McCrory C and Layte R. Breastfeeding and risk of overweight and obesity at nine-years of age. Soc Sci Med, 2012;75(2):323-30.
39. Wijnhoven T and Branca F. WHO European Childhood Obesity Surveillance Initiative. Protocol, Version January 2008, 2008: Copenhagen.
40. Heinen MM, Murrin C, Daly L, et al. The Childhood Obesity Surveillance Initiative (COSI) in the Republic of Ireland: Findings from 2008, 2010 and 2012: Dublin.
41. Heavey P, McGloin A, Kilroe J, Daly L, O’ Mahony D, and Kelleher C. Childhood Obesity Surveillance Initiative in Ireland. Main Report, 2009, Health Service Executive and Department of Health and Children: Dublin.
42. Lehingue Y. The European Childhood Obesity Group (ECOG) project: the European collaborative study on the prevalence of obesity in children. Am J Clin Nutr, 1999;70(1):166S-8S.
43. Janssen I, Katzmarzyk PT, Srinivasan SR, et al. Utility of childhood BMI in the prediction of adulthood disease: comparison of national and international references. Obes Res, 2005;13(6):1106-15.
44. DEIS: Delivering Equality of Opportunity in Schools. 29th May 2013]; Available from: http://www.education.ie/en/Schools-Colleges/Services/DEIS-Delivering-Equality-of-Opportunity-in-Schools-/FAQs.html.
45. Archer P and Sofroniou N. The assessment of levels of disadvantage in primary schools for DEIS, 2008, Educational Research Centre: Dublin.

Childhood Obesity Surveillance Initiative Ireland Childhood Obesity Surveillance Initiative Ireland
AcknowledgementsWe are indebted to the children who participated in this study and to their parents who consented for their child to take part and completed the Family Questionnaires. Further, we wish to thank all the principals and teachers involved in this study.
Below, a table presents all those who have worked on the several rounds of the WHO COSI study and their specific role(s).
Role Name Institution Place
Principal Investigator
Nazih Eldin (Rounds 2, 3) Health Promotion Department, Health Service Executive
Navan, County Meath
Cecily Kelleher National Nutritional Surveillance Centre, University College Dublin
Dublin
Ursula O’Dwyer (Round 1) Department of Health Dublin
Project manager
Patricia Heavey (Rounds 1, 2) National Nutritional Surveillance Centre, University College Dublin
Dublin
Mirjam Heinen (Round 3)
Data clerks Adeline Gruel (Round 2) National Nutritional Surveillance Centre, University College Dublin
Dublin
Orla McMahon (Round 2)
Lisa-Marie Mulhern (Round 3)
Michelle O’Brien (Rounds 2, 3)
Helena Scully (Round 3)

Childhood Obesity Surveillance Initiative Ireland
Role Name Institution Place
Data collectors
Rounds 1 and 2:
Cathy Cronin
National Nutritional Surveillance Centre, University College Dublin
Dublin
Round 1:
Aimi Baker, Louise Basquille, Orla Brady, Melissa Byrne, Maria Carr, Mona Connolly, Grainne Corrigan, Karen Cronin, Elaine Cunniffe, Thais Ferguson, Michelle Gray, Sinead Hopkins, Ingrid Hutchinson, Heather Jordan, Soniya Kaluskar, Jean Kennedy, Aine McConnon, Fiona McVeigh, Aine O’Connor, Katrina O’Hagan, Mary Clare O’Hara, Gillian O’Loughlin, Heidi O’Neill, Sarah Jane O’Sullivan, Darina Quigley, Nicola Taylor, Claire Toher, Nuala Tully, Olive Tully
Round 2:
Siobhan Boyle, Lorraine Carrabine, Gillian Dawson, Sinead Duffy, Sinead Duignan, Clare Kelly, Laura Kennedy, Louise Mahony, Elaine McCarthy, Orla McMahon, Amy Mullee, Sinead O’Brien, Tonya O’Neill, Eilis Sutton
Rounds 2 and 3:
Sinead Duignan, Orla McMahon
Round 3:
Kate Ainscough, Niamh Carey, Joyce Earlie, Ciara Farrell, Mary Freeman, Lorraine Mc Gowan, Nadine McQuillan, Karen Menton, Suzanne Murphy, Claire Murray, Ciara Nolan, Michelle O’Brien, Helena Scully, Deborah Sherlock, Ann-Marie Tierney

Childhood Obesity Surveillance Initiative Ireland Childhood Obesity Surveillance Initiative Ireland
Role Name Institution Place
Chairperson steering group committee
Catherine Hayes (Round 1) Specialist in Public Health Medicine, Health Service Executive
Dublin
Steering group committee members
Jean Kilroe (Round 1)Aileen McGloin (Round 1)
National Nutritional Surveillance Centre, University College Dublin
Dublin
Adrienne Lynam Health Promotion Department, Health Service Executive
Galway
Marita Glacken (Round 1) Specialist in Public Health Medicine, Health Service Executive
Galway
Regina Reynolds (Round 1) Public Health Nursing, Health Service Executive
Dublin
Maria Lordon-Dunphy (Round 1) National Health Promotional Development manager, Health Service Executive
Dublin
Data manager Patricia Heavey (Round 2) National Nutritional Surveillance Centre, University College Dublin
Dublin
John O’Brien (Round 3)
Deidre O’Mahony (Round 1)
Statistical advisor
Leslie Daly School of Public Health, Physiotherapy and Population Science, University College Dublin
Dublin
Research advisor
Celine Murrin National Nutritional Surveillance Centre, University College Dublin
Dublin

Childhood Obesity Surveillance Initiative Ireland
Appendices
APPENDIX 1: MISSING VALUES FOR EACH OF THE QUESTIONS IN THE FAMILY QUESTIONNAIRE
Table I. Missing values for each question in the Family Questionnaire, stratified by rounds
Data collection round
Round 2 (2010) Round 3 (2012)
9-year-olds 7-year-olds 7-year-olds
n 969 1008 1012
Missing Values
Birth weight 40 34 44Full term* N/A N/A 11Breastfeeding 4 5 16
Yes/noDuration (only for those children who were breastfed)
4 1 4
Transportation to school 0 0 1Safe routes 7 8 7Distance home-school 31 28 31Sport club 6 4 6
Being a memberNo of visits/week (only for those children who were a sports member)
4 3 6
Sleep 7 11 10Computer at home 10 4 6Playing outdoors 11 6 8
WeekWeekend 45 32 31
Homework 11 3 3WeekWeekend 48 41 23
Playing computer games 24 16 14WeekWeekend 28 33 24
Watching TV 3 6 8WeekWeekend 17 18 17
Breakfast 1 4 6Fresh fruit 12 18 25Vegetables 14 13 7100% Fruit juice 15 22 18Sugar-sweetened soft drinks 31 23 21Diet soft drinks 25 24 20Low-fat milk 31 28 27Full-fat milk 13 19 15Flavoured milk 24 27 21Cheese 10 13 9

Childhood Obesity Surveillance Initiative Ireland Childhood Obesity Surveillance Initiative Ireland
Data collection round
Round 2 (2010) Round 3 (2012)
9-year-olds 7-year-olds 7-year-olds
n 969 1008 1012
Missing Values
Other dairy 9 10Meat 4 7 5Fish 5 13 9Crisps etc 5 10 7Chocolate etc 3 7 6Biscuits etc 7 12 12Pizza etc 3 6 4Hypertension 4 20 17Diabetes 4 20 15High cholesterol 4 19 14People aged ≥18 y 9 22 24People aged <18 y 7 22 23Education 14 30 21
MotherFather 59 72 73
Work 12 10 21MotherFather 61 62 68
Housing 1 4 4Owned/rented 3 3 4
*Full term data only available for the 3rd round of data collection in 2012.

Childhood Obesity Surveillance Initiative Ireland
Table II. Missing values for each question in the Family Questionnaire for 7-year-olds, stratified by type of school
DEIS schools* Other schools
n 136 1884
Missing values:
Birth weight 4 74Full term** 0 11Breastfeeding 0 21
Yes/noDuration (only for those children who were breastfed) 0 5
Transportation to school 0 1Safe routes 0 15Distance home-school 6 53Sport club 0 10
Being a memberNo of visits/week (only for those children who were a sports member)
2 7
Sleep 2 19Computer at home 2 8Playing outdoors 1 13
WeekWeekend 6 57
Homework 1 5WeekWeekend 5 59
Playing computer games 2 28WeekWeekend 3 54
Watching TV 3 11WeekWeekend 3 32
Breakfast 3 7Fresh fruit 6 37Vegetables 1 19100% Fruit juice 6 34Sugar-sweetened soft drinks 5 39Diet soft drinks 3 41Low-fat milk 6 49Full-fat milk 1 33Flavoured milk 5 43Cheese 1 21Other dairy 3 16Meat 1 11Fish 1 21Crisps etc 1 16Chocolate etc 1 12Biscuits etc 3 21Pizza etc 1 9Hypertension 0 37Diabetes 0 35High cholesterol 0 33People aged ≥18 y 0 46People aged <18 y 3 42

Childhood Obesity Surveillance Initiative Ireland Childhood Obesity Surveillance Initiative Ireland
DEIS schools* Other schools
n 136 1884
Missing values:
Education 1 50MotherFather 17 128
Work 1 30MotherFather 17 113
Housing 1 7Owned/rented 0 7
*DEIS: Delivering Equality of Opportunity in Schools **Full term data only available for the 3rd round of data collection in 2012.

Childhood Obesity Surveillance Initiative Ireland
Table III. Missing values for each question in the Family Questionnaire for 9-year-olds, stratified by type of school
DEIS schools* Other schools
n 62 907Missing values:Sex 0 0Birth weight 6 34Breastfeeding
Yes/no 1 3Duration (only for those children who were breastfed) 1 3
Transportation to school 0 0Safe routes 0 7Distance home-school 5 26Sport club
Being a member 0 6No of visits/week (only for those children who were a sports member)
0 4
Sleep 1 6Computer at home 0 10Playing outdoors
Week 0 11Weekend 4 41
Homework 1 10WeekWeekend 4 44
Playing computer games Week 1 23Weekend 1 27
Watching TV 0 3WeekWeekend 1 16
Breakfast 0 1Fresh fruit 0 12Vegetables 1 13100% Fruit juice 1 14Sugar-sweetened soft drinks 2 29Diet soft drinks 1 24Low-fat milk 2 29Full-fat milk 0 13Flavoured milk 4 20Cheese 2 8Other dairy 0 4Meat 1 4Fish 1 4Crisps etc 1 4Chocolate etc 0 3Biscuits etc 3 4Pizza etc 0 3Hypertension 0 4Diabetes 0 4High cholesterol 0 4People aged ≥18 y 1 8People aged <18 y 0 7
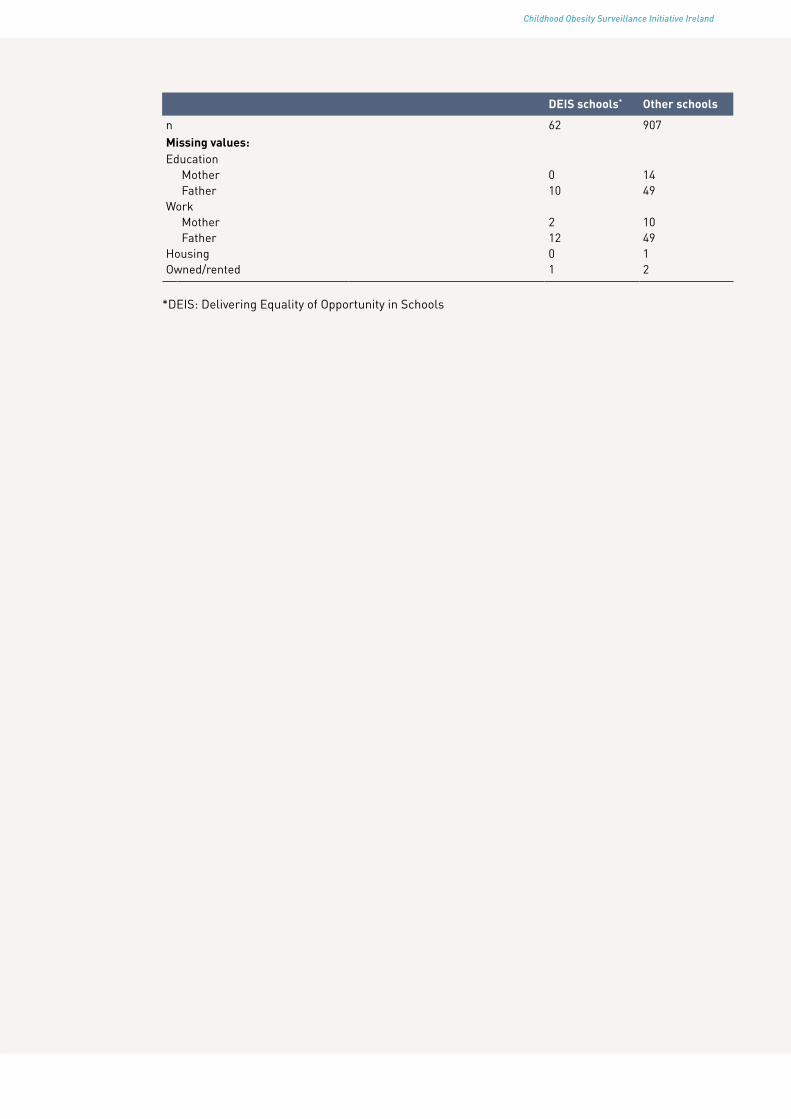
Childhood Obesity Surveillance Initiative Ireland Childhood Obesity Surveillance Initiative Ireland
DEIS schools* Other schools
n 62 907Missing values:Education
Mother 0 14Father 10 49
WorkMother 2 10Father 12 49
Housing 0 1Owned/rented 1 2
*DEIS: Delivering Equality of Opportunity in Schools

Childhood Obesity Surveillance Initiative Ireland
APPENDIX 2: CHARACTERISTICS OF CHILDREN WHO ATTENDED THIRD CLASS DURING THE THIRD ROUND OF DATA COLLECTION IN 2010
Table I. Descriptives of third class children in 2010 (n=969)
% Mean (95% CI)
Descriptives
Boys 44.2Age (years) 9.0 (8.9-9.0)Sleep (minutes) 611 (607-615)
Birth weight and breastfeedingBirth weight (grams) 3481 (3415-3546)Ever breastfed 57.7Duration (months) of those children who were breastfed (n=572)
<1-2 38.43-5 25.6≥6 36.0
Medical conditionsHypertension 6.9
YesNo 91.7Don’t know 1.4
Diabetes 1.9YesNo 97.7Don’t know 0.4
High cholesterol 17.6YesNo 81.0Don’t know 1.4

Childhood Obesity Surveillance Initiative Ireland Childhood Obesity Surveillance Initiative Ireland
Table II. Physical activity/inactivity patterns of third class children in 2010 (n=969)
%
Transportation to schoolMotorised vehicle 76.7Bicycle/walking 14.8Combination bicycle, walking and motorised vehicle 8.3Other 0.3
Parents that considered routes to school to be safe 29.9Distance home-school (km) 25.3
<11-4 51.1>4 23.6
Being a member of a sport club 88.4No of visits/week of those children who were members of at least one sports club (n=867)
1 19.42 32.13 25.6>3 22.9
Having a computer at home 95.6
Week WeekendPlaying outdoors (hours/day)
None 2.1 0.5<1 16.9 3.21 43.5 11.12 28.9 28.6≥3 8.7 56.6
Homework None 0.6 18.7<1 20.8 36.81 49.3 30.02 27.5 8.9≥3 1.9 5.7
Playing computer games None 38.9 20.7<1 47.6 41.31 11.3 21.72 2.2 13.2≥3 0 3.1
Watching TVNone 4.4 0.3<1 26.9 5.31 34.4 13.32 28.0 48.6≥3 6.2 32.5

Childhood Obesity Surveillance Initiative Ireland
Table III Diet of third class children in 2010 (n=969)
%
Breakfast Every day 93.1Most days 3.9Some days 2.8Never/sometimes 0.3
Fresh fruit Every day 60.3Most days 22.8Some days 14.1Never/sometimes 2.8
Vegetables Every day 55.5Most days 27.1Some days 13.6Never/sometimes 3.9
100% Fruit juice Every day 20.1Most days 16.5Some days 42.5Never/sometimes 21.0
Sugar-sweetened soft drinks Every day 2.9Most days 7.5Some days 55.2Never/sometimes 34.5
Diet soft drinks Every day 0.9Most days 3.1Some days 36.0Never/sometimes 60.0
Low-fat milk Every day 24.7Most days 3.7Some days 9.0Never/sometimes 62.6
Full-fat milk Every day 57.1Most days 10.6Some days 10.1Never/sometimes 22.2
Flavoured milk Every day 1.4Most days 1.3Some days 14.1Never/sometimes 83.2
Cheese Every day 15.2Most days 22.1Some days 41.7Never/sometimes 21.0
Other dairy Every day 30.4Most days 29.5Some days 33.7Never/sometimes 6.4
Meat Every day 39.2Most days 48.6Some days 10.4Never/sometimes 1.8

Childhood Obesity Surveillance Initiative Ireland Childhood Obesity Surveillance Initiative Ireland
%
Fish Every day 0.4Most days 7.4Some days 75.1Never/sometimes 17.1
Crisps etc Every day 5.0Most days 8.5Some days 76.4Never/sometimes 10.1
Chocolate etc Every day 4.8Most days 16.8Some days 75.1Never/sometimes 3.4
Biscuits etc Every day 5.6Most days 22.3Some days 64.4Never/sometimes 7.7
Pizza etc Every day 0.9Most days 5.4Some days 87.8Never/sometimes 5.8

Childhood Obesity Surveillance Initiative Ireland
Table IV. Social and economic factors and housing of third class children in 2010 (n=969)
% Median (range)
People aged ≥18 y 2 (1-8)People aged <18 y 3 (1-9)Housing
House/bungalow - detached 66.8House/bungalow – semi-detached 31.5Other 1.7
Owned/rentedOwned 87.7Rented 11.9Other 0.4
Mother: Father:Education
Primary school 2.2 1.4Secondary school 40.2 51.4Postgraduate/BSc 45.4 34.0MSc or higher 12.2 13.2
WorkGovernment employed 25.2 14.7Non-government employed 26.5 40.1Self-employed 10.7 33.8Homemaker 31.6 1.4Other 6.0 10.0

Childhood Obesity Surveillance Initiative Ireland Childhood Obesity Surveillance Initiative Ireland
APPENDIX 3: EXAMPLE OF THE FAMILY QUESTIONNAIRE USED IN THE THIRD ROUND OF DATA COLLECTION IN 2012
ID nr
THE CHILDHOOD GROWTH STUDYFamily Survey

Childhood Obesity Surveillance Initiative Ireland
Please note: In this survey, ‘your child’ refers to the child who is currently in first class and was asked to take part in the WHO childhood Growth Study. Please give information only for this child when filling in the survey.
1. What is your child’s date of birth?
Day/Month /Year
/
/
2. What is the sex of your child? Boy Girl
3. How much did your child weigh when they were born?
g OR lbs
4. Was your child born at full term (in general after 37 weeks of pregnancy)?
Yes
No
Don’t know
5. Where do you live?
6. What is the name of your child’s school?
7. What is the address of your child’s school:
8. In which class is your child now?
9. How does your child usually get to and from school? Please tick one box for “Going to school” and one box for “Coming from school”.
Going to school Coming from school
They usually take the school bus
They usually take the school bus
They usually go by public transport
They usually go by public transport
They are usually brought by car
They are usually brought by car
They usually ride a bicycle
They usually ride a bicycle
They usually walk
They usually walk
Other (please state):
Other (please state):
10. In your opinion, are the routes to and from school safe for your child to walk or ride a bicycle?
Yes
No
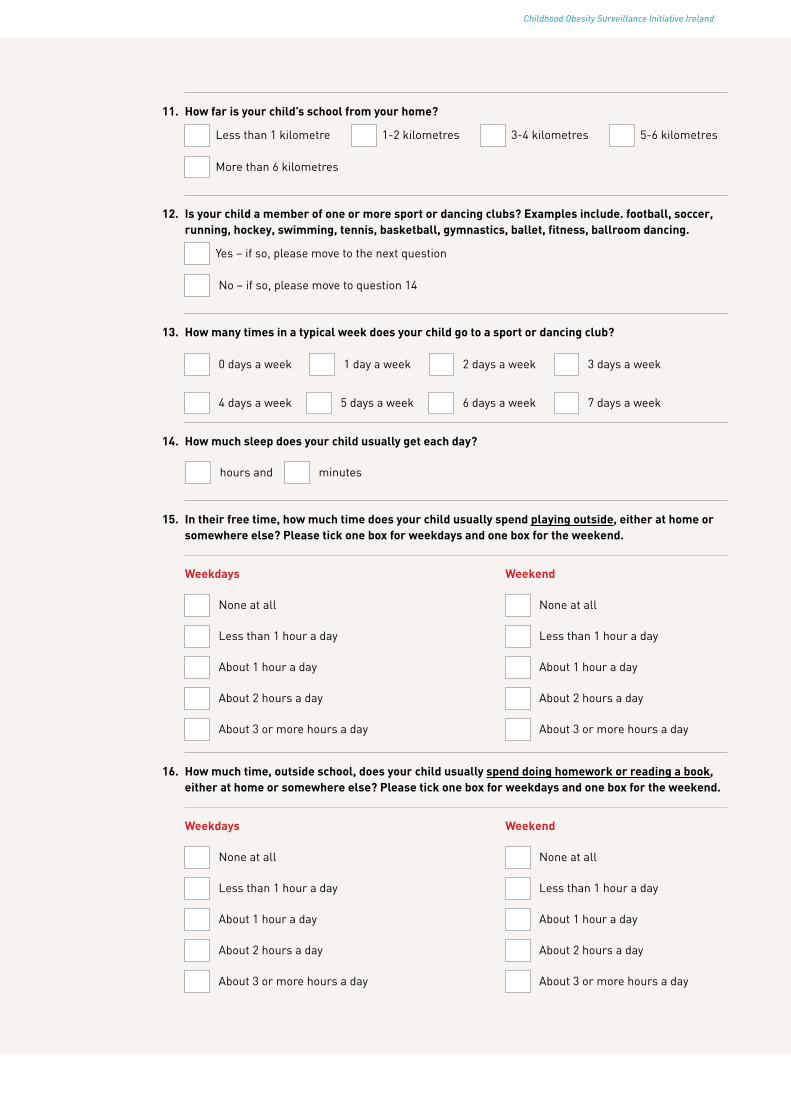
Childhood Obesity Surveillance Initiative Ireland Childhood Obesity Surveillance Initiative Ireland
11. How far is your child’s school from your home?
Less than 1 kilometre
1-2 kilometres
3-4 kilometres
5-6 kilometres
More than 6 kilometres
12. Is your child a member of one or more sport or dancing clubs? Examples include. football, soccer, running, hockey, swimming, tennis, basketball, gymnastics, ballet, fitness, ballroom dancing.
Yes – if so, please move to the next question
No – if so, please move to question 14
13. How many times in a typical week does your child go to a sport or dancing club?
0 days a week
1 day a week
2 days a week
3 days a week
4 days a week
5 days a week
6 days a week
7 days a week
14. How much sleep does your child usually get each day?
hours and
minutes
15. In their free time, how much time does your child usually spend playing outside, either at home or somewhere else? Please tick one box for weekdays and one box for the weekend.
Weekdays Weekend
None at all
None at all
Less than 1 hour a day
Less than 1 hour a day
About 1 hour a day
About 1 hour a day
About 2 hours a day
About 2 hours a day
About 3 or more hours a day
About 3 or more hours a day
16. How much time, outside school, does your child usually spend doing homework or reading a book, either at home or somewhere else? Please tick one box for weekdays and one box for the weekend.
Weekdays Weekend
None at all
None at all
Less than 1 hour a day
Less than 1 hour a day
About 1 hour a day
About 1 hour a day
About 2 hours a day
About 2 hours a day
About 3 or more hours a day
About 3 or more hours a day

Childhood Obesity Surveillance Initiative Ireland
17. Do you have a computer at home? Yes
No
18. How much time does your child usually spend using a computer for playing games (apart from any homework), either at home or somewhere else? Please tick one box for weekdays and one box for the weekend.
None at all
None at all
Less than 1 hour a day
Less than 1 hour a day
About 1 hour a day
About 1 hour a day
About 2 hours a day
About 2 hours a day
About 3 or more hours a day
About 3 or more hours a day
19. How much time does your child usually spend watching television (including videos), either at home or somewhere else? Please tick one box for weekdays and one box for the weekend.
Weekdays Weekend
None at all
None at all
Less than 1 hour a day
Less than 1 hour a day
About 1 hour a day
About 1 hour a day
About 2 hours a day
About 2 hours a day
About 3 or more hours a day
About 3 or more hours a day
20. Over a usual week, how often does your child have breakfast?
Every day
Most days (4-6 days)
Some days (1-3 days)
Never
21. Over a usual week, how often does your child have the following kinds of foods or drinks? Please tick one box for each line.
Every day Most days (4-6 days)
Some days (1-3 days)
Never
Fresh fruit
Vegetables (excluding potatoes)
100% Fruit juice (not concentrate)
Soft drinks containing sugar
Diet or “light” soft drinks

Childhood Obesity Surveillance Initiative Ireland Childhood Obesity Surveillance Initiative Ireland
Every day Most days (4-6 days)
Some days (1-3 days)
Never
Low fat or semi-skimmed milk
Full-fat milk
Flavoured milk
Cheese
Yoghurt, milk pudding, cream cheese, quark or other dairy products
Meat
Fish
Foods such as crisps, popcorn or peanuts
Foods such as chocolate
Foods such as biscuits, cake, doughnuts or pie
Foods like pizza, French fries, fried potatoes hamburger, sausage or meat pies
22. Was your child ever breastfed?
Yes – if so, please move to the next question
No – if so, please move to question 23
23. For how long was your child breastfed in their first year of life?
Less than 1 month
About 4 months
About 1 month
About 5 months
About 2 months
About 6 months
About 3 months
More than 6 months
24. During the past 12 months, has a doctor or other health worker told you or anyone else in your household that one of you has high blood pressure (hypertension)?
Yes
No
Don’t know
25. During the past 12 months, has a doctor or other health worker told you or anyone else in your household that one of you has diabetes?
Yes
No
Don’t know

Childhood Obesity Surveillance Initiative Ireland
26. During the past 12 months, has a doctor or other health worker told you or anyone else in your household that one of you has a high cholesterol level?
Yes
No
Don’t know
27. How many people aged 18 years or olderlive in your household?
28. How many people younger than 18 live in your household?
29. What is the highest level of education that you or your partner or spouse have completed? Please select one answer only for each of you.
Mother Father
Primary school
Primary school
Secondary school
Secondary school
Undergraduate or Bachelor degree
Undergraduate or Bachelor degree
Masters degree or higher
Masters degree or higher
30. Which of the following best describes your (or your partner’s or spouse’s) main work over the last 12 months? Please select one answer only for each of you.
Mother Father
Government employed
Government employed
Non-government employed
Non-government employed
Self-employed
Self-employed
Student
Student
Homemaker
Homemaker
Unemployed, able to work
Unemployed, able to work
Unemployed, not able to work
Unemployed, not able to work
Retired
Retired

Childhood Obesity Surveillance Initiative Ireland Childhood Obesity Surveillance Initiative Ireland
31. In what type of housing are you currently living?
House or bungalow - detached
House - semi-detached or terraced
Apartment
Shared house
Shared apartment
Other (please state) ……………………………………………………….…………………………..
32. Is this accommodation…….
Owned by you
Rented by you
Other (please state) ……………………………………………………….…………………………..
Date of completing this form Day Month Year
/
/
Signed:........................................................
***********END OF SURVEY***********THANK YOU VERY MUCH FOR FILLING IN THIS SURVEY.
PLEASE POST IT BACK TO US IN THE FREEPOST ENVELOP
