des moines - colliers international...des moines q3 2016 | multifamily recent sales source:...
TRANSCRIPT

Accelerating success.
Research & Forecast Report
DES MOINESQ3 2016 | Multifamily
RECENT SALES
Source: AXIOMetrics. RCA, CoStar
Market Survey Results and ForecastsSequential Month Annual
4Q15 1Q16 2Q16 3Q16 Sep-16 2014 2015 2016F 2017F 2018F 2019F 2020F
Effective Rent Per Unit $930 $932 $951 $963 $934 $922 $925 $951 $982 $1,017 $1,050 $1,078
Per Sq. Ft $1.01 $1.01 $1.03 $1.04 $1.01 $1.00 $1.00 $1.03 $1.06 $1.10 $1.13 $1.16
Effective Rent Growth - Annually 0.1% 1.0% 2.9% 4.1% 3.5% 1.6% 0.3% 2.8% 3.3% 3.5% 3.3% 2.6%
Effective Rent Growth - Quarterly 0.6% 0.2% 2.1% 1.2%
Occupancy Rate 94.2% 94.9% 96.2% 95.9% 95.6% 95.1% 94.8% 95.7% 96.0% 96.2% 95.9% 95.2%
Occupancy Change - Annually -1.1% 0.5% 0.9% 0.6% 0.2% -0.1% -0.3% 0.9% 0.4% 0.1% -0.3% -0.7%
Occupancy Change - Quarterly -1.2% 0.8% 1.3% -0.2%
Economic Concessions Concession Value $-14.51 $-10.56 $-3.77 $-5.62 $-9.39 $-12.61 $-13.11
As a % of Asking Rent -1.6% -1.1% -0.4% -0.6% -1.0% -1.4% -1.5%
Date Property Name Address City Units Year Built Price in $ $/Units
Sep-16 Park Forest 2101 E Virginia Des Moines 144 1979 6,550,000 45,486
Sep-16 Watermark at Jordan Creek 6455 Galleria Dr West Des Moines 176 2014 26,500,000 150,568
Aug-16 University Mills 2124 W 27th St Cedar Falls 121 2001 16,400,000 135,537
Apr-16 The Flats 3000 University Ave West Des Moines 331 1973 / 2016 9,985,000 30,166
Mar-16 The Grove Ames/Copper Beech Ames 1407 S Grand Ave Ames 425 2011 48,934,995 115,141
Mar-16 Hillcrest Park 9614 University Ave Cedar Falls 132 2001 18,250,000 138,258
Nov-15 Metro Lofts 100 2nd Ave Des Moines 111 2010 3,500,000 31,532
Nov-15 South Duff Community Park 416-528 Billy Sunday Rd Ames 209 2004 21,300,000 101,914
Nov-15 Ashbrooke Apts 317 NE Delaware Ave Ankeny 196 1990 12,400,000 63,265
Oct-15 Triple Crown 1103 Greenway Ct Altoona 76 1982 4,109,000 54,066
Oct-15 Hillcrest 7201 SE 5th St Des Moines 90 1977 4,250,000 47,222
COLLIERS INTERNATIONAL MULTIFAMILY ADVISORY GROUP P. 2www.ColliersMultifamilyEast.com
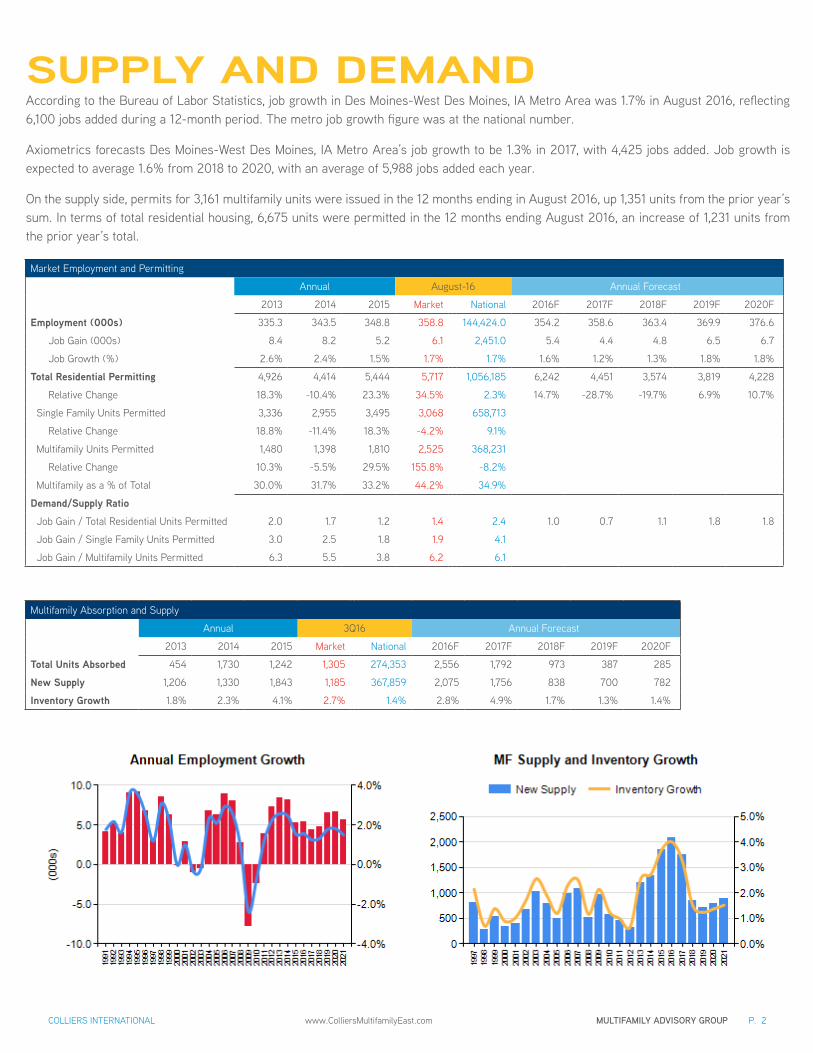
SUPPLY AND DEMANDAccording to the Bureau of Labor Statistics, job growth in Des Moines-West Des Moines, IA Metro Area was 1.7% in August 2016, reflecting 6,100 jobs added during a 12-month period. The metro job growth figure was at the national number.
Axiometrics forecasts Des Moines-West Des Moines, IA Metro Area’s job growth to be 1.3% in 2017, with 4,425 jobs added. Job growth is expected to average 1.6% from 2018 to 2020, with an average of 5,988 jobs added each year.
On the supply side, permits for 3,161 multifamily units were issued in the 12 months ending in August 2016, up 1,351 units from the prior year’s sum. In terms of total residential housing, 6,675 units were permitted in the 12 months ending August 2016, an increase of 1,231 units from the prior year’s total.
Multifamily Absorption and Supply
Annual 3Q16 Annual Forecast
2013 2014 2015 Market National 2016F 2017F 2018F 2019F 2020F
Total Units Absorbed 454 1,730 1,242 1,305 274,353 2,556 1,792 973 387 285
New Supply 1,206 1,330 1,843 1,185 367,859 2,075 1,756 838 700 782
Inventory Growth 1.8% 2.3% 4.1% 2.7% 1.4% 2.8% 4.9% 1.7% 1.3% 1.4%
Market Employment and Permitting
Annual August-16 Annual Forecast
2013 2014 2015 Market National 2016F 2017F 2018F 2019F 2020F
Employment (000s) 335.3 343.5 348.8 358.8 144,424.0 354.2 358.6 363.4 369.9 376.6
Job Gain (000s) 8.4 8.2 5.2 6.1 2,451.0 5.4 4.4 4.8 6.5 6.7
Job Growth (%) 2.6% 2.4% 1.5% 1.7% 1.7% 1.6% 1.2% 1.3% 1.8% 1.8%
Total Residential Permitting 4,926 4,414 5,444 5,717 1,056,185 6,242 4,451 3,574 3,819 4,228
Relative Change 18.3% -10.4% 23.3% 34.5% 2.3% 14.7% -28.7% -19.7% 6.9% 10.7%
Single Family Units Permitted 3,336 2,955 3,495 3,068 658,713
Relative Change 18.8% -11.4% 18.3% -4.2% 9.1%
Multifamily Units Permitted 1,480 1,398 1,810 2,525 368,231
Relative Change 10.3% -5.5% 29.5% 155.8% -8.2%
Multifamily as a % of Total 30.0% 31.7% 33.2% 44.2% 34.9%
Demand/Supply Ratio Job Gain / Total Residential Units Permitted 2.0 1.7 1.2 1.4 2.4 1.0 0.7 1.1 1.8 1.8
Job Gain / Single Family Units Permitted 3.0 2.5 1.8 1.9 4.1
Job Gain / Multifamily Units Permitted 6.3 5.5 3.8 6.2 6.1
COLLIERS INTERNATIONAL MULTIFAMILY ADVISORY GROUP P. 3www.ColliersMultifamilyEast.com
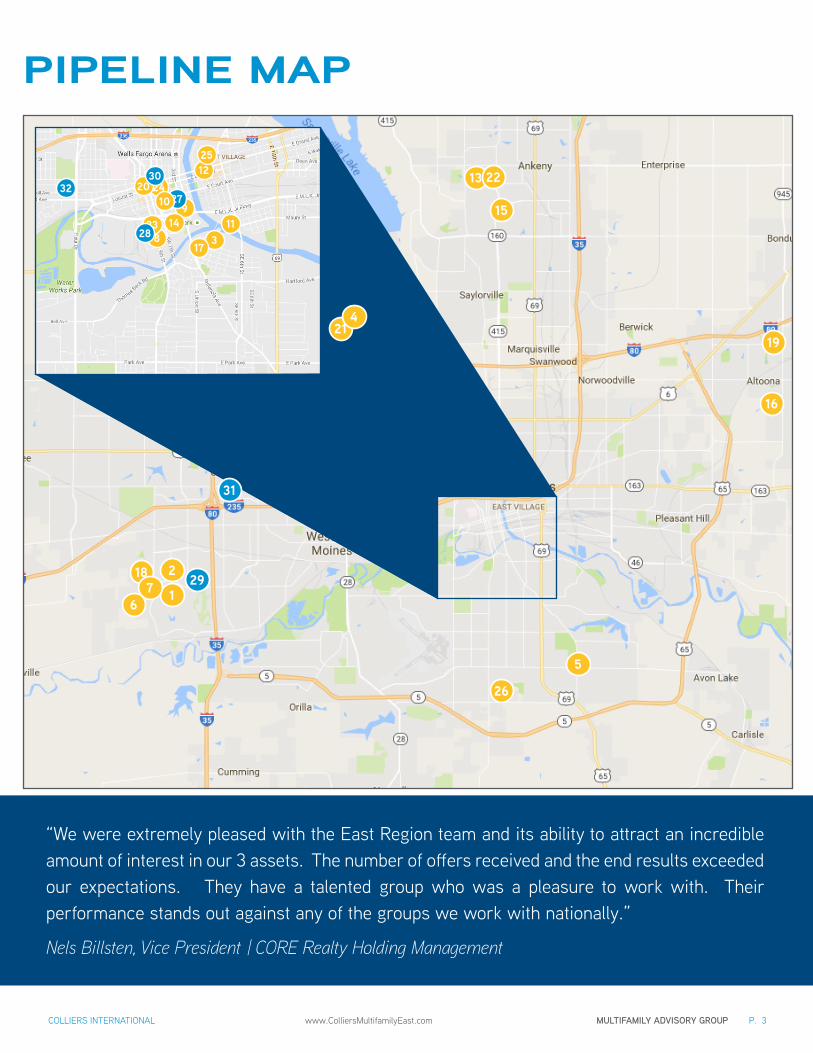
PIPELINE MAP
“We were extremely pleased with the East Region team and its ability to attract an incredible amount of interest in our 3 assets. The number of offers received and the end results exceeded our expectations. They have a talented group who was a pleasure to work with. Their performance stands out against any of the groups we work with nationally.”
Nels Billsten, Vice President | CORE Realty Holding Management
16
21
16
13 22
187
2
4
19
5
15
26
29
1138
23
12
17
914
24
25
20
28
27
30
1032
31

COLLIERS INTERNATIONAL MULTIFAMILY ADVISORY GROUP P. 4www.ColliersMultifamilyEast.com
PIPELINE DETAIL# Name Status Owner Address Market Units1 Aspire Apartments Phase II Under Construction Signature Commercial RE
Ghroup6950 Stagecoach Dr Dallas County 176
2 BelleMeade Apartments Phase II Under Construction The Richdale Group 204 S 64th St Dallas County 1683 Bici Flats Under Construction Ralph Gilotti 1405 SE 1st St McKinley School-Columbus 1544 Cadence Apartments Under Construction Hubbell Realty Company 6320 Merle Hay Rd Outer West Des Moines/
Urbandale195
5 Carman Estates Under Construction Jerry's Homes Inc 2314 E Porter Ave Easter Lake Area 966 Cascades at Jordan Creek - Phase
IIUnder Construction Perry Reid Properties 8350 Cascade Ave Dallas County 201
7 The Cove at Kettlestone Under Construction Caliber 1272 SE Bishop Dr Dallas County 1318 Cityville on 9th Street - Phase II Under Construction Hubbell Realty Company 520 SW 9th St Downtown Des Moines 2289 Confluence On 3rd Under Construction Roers Investments 103 SW 3rd St Downtown Des Moines 21110 Fourth and Court Apartments Under Construction Vine Ronald 420 Court Ave Downtown Des Moines 8211 Eagle View Lofts Under Construction Hansen Real Estate Services 511 Shaw St East Village 12012 East Village Apartments Under Construction Tim Rypma 219 E Grand Ave East Village 9813 Fieldstream Apartments Phase II Under Construction Edward Rose & Sons 3289-3305 NW
Brookstone LnOuter Ankeny/Saylorville 168
14 Harbach Lofts Under Construction Harbach Building Llc 300 SW 5th St Downtown Des Moines 10315 Havenwood Under Construction Redwood Living 1250 SW State St Outer Ankeny/Saylorville 10616 Ironwood - Phase II Under Construction Haverkamp Properties 2570 1st Ave S Outer SE Des Moines N 14717 Jackson Crossing Under Construction Neighborhood Development
Corporation100-150 Jackson Ave McKinley School-Columbus 172
18 Jordan West Apartments Under Construction Commercial Investment Properties
360 Bridgewood Dr Dallas County 180
19 Linden Oaks Under Construction Redwood Living 400 Adventureland Dr Outer SE Des Moines N 9820 R&T Lofts Under Construction TWG Development 715 Locust St Downtown Des Moines 16221 Residences at 62W Under Construction R&R Realty Marketing Group 6000 NW 62nd Ave Outer West Des Moines/
Urbandale0
22 The Cove at Prairie Trail Phase II Under Construction Caliber 1918 SE Lesina Ln Outer Ankeny/Saylorville 8623 The Edge at Gray's Landing Under Construction Sherman Associates, Inc. 406 SW 9th St Downtown Des Moines 9024 The Equitable Lofts Under Construction Foutch Brothers 604 Locust St Downtown Des Moines 14625 The Verve Under Construction Principal Mutl Life Ins Co 700 E 4th St East Village 12326 Fort Des Moines Under Construction Blackbird Investments 6700 Chaffee Rd Outer SE Des Moines S 14227 Fourth and Court Proposed City of Des Moines 4th And Court
AvenuesDowntown Des Moines 200
28 The Nexus at Gray's Landing Proposed Sherman Associates, Inc. 415 SW 11th St Downtown Des Moines 14229 Village of Ponderosa Proposed Evercore Companies LLC Bluestem Circle &
CrescenOuter West Des Moines/Urbandale
500
30 619 Grand Ave Proposed Nelson Construction Services 619 Grand Ave Downtown Des Moines 17531 Waveland Park Proposed Hubbell Realty Company 1818 48th St Waveland Park 7232 2301 Ingersoll Ave Proposed Roers Investments 2301 Ingersoll Ave Woodland Heights 162
Total Units 4,834
Source: CoStar

COLLIERS INTERNATIONAL MULTIFAMILY ADVISORY GROUP P. 5www.ColliersMultifamilyEast.com
WHO WE AREOne of the largest and most
experienced teams of multifamily
specialists in the industry
Units sold since 2011
30,000MORE THAN
Group gross transaction value in since 2011
$2.0B
Dedicated Multifamily Professionals & Advisors
50MORE THAN
Expansive geographic footprint
20COVERING OVER
STATES
WE CAN HELPAs an investor in multifamily properties, you need a firm that provides experience, broad reach and the ability to market an asset no matter how challenging the economic environment. You need a team that specializes in your market you need The East Region Multifamily Advisory Group.
Colliers International has one of the largest and most experienced teams in the industry, strategically located in key markets throughout North America. Our combination of market dominance, expertise, and singular focus, make us uniquely successful in helping our clients achieve their disposition objectives.
How are we able to bring together the skills and tools necessary to complete challenging assignments? Our East Region Multifamily Advisory Group is connected by purpose and focus. Our team is dedicated to sharing information on market opportunities, capital sources and buyers/sellers to achieve the best results for our clients.

COLLIERS INTERNATIONAL MULTIFAMILY ADVISORY GROUP P. 6www.ColliersMultifamilyEast.com
www.ColliersMultifamilyEast.com
To learn more, scan this with a QR code reader or visit:
AT YOUR SERVICE
Gabe TovarASSOCIATE | EAST REGION
[email protected] +1 816 556 1161
Will MathewsPRINCIPAL | EAST REGION
INSTITUTIONAL CLIENT GROUP
[email protected] +1 404 877 9285
Brooks ColquittASSOCIATE | EAST REGION
[email protected] +1 404 978 2337
Craig BrownASSOCIATE | EAST REGION
[email protected] +1 404 978 2336
Bob Galamba, CCIM, SIOR
SENIOR VICE PRESIDENT | EAST REGION
[email protected] +1 816 556 1152