des lacs flood control - north dakota
TRANSCRIPT

DES LACS RIVERFLOOD CONTROL STUDYBURKE, WARD, MOUNTRAIL, RENVILLE COUNTIES
NORTH DAKOTA
PRELIMINARY ENGINEERING REPORTSWC PROJECT NO. 1772NORTH DAKOTA STATE WATER COMMISSIONAPRIL, 1984
i\,ilt
MOUNTBAIL COUNTY
BURKE COUNTY
MINOT
UNITED STATES
CANADA
RENVILLE COUNTY
WARD COUNTY

PRELII4INARY ENGTNEERTNG REPORT
DES LACS FJ\ÆR BASIN STUDY
SWC PROJECT #L772
APRTL, t9g4
NORTH DÃKOT"A STATE VIATER COMII{ISSION900 EAST BOIIITEVARD
BTSMARCK, NORTH DAKOTA 58505
PREPARED BY:
WATER ENGIIÏEER
DALE L. Þfa
HYDROLOGY AND ITWESTTGATIONS ENGINEER
D¿$ID A.. -8.DIRECTOR. OF ENGINEERING
VERNON FAHY,STATts
SUMMARY
In May, 1983 the North Dakota State blater Commission entered into
an agreement v¡ith the lrlard county Water Resource District to develop a
hydrologic model and evaluate flooding problems in the Des Lacs River
Basin. A hydrologic computer model was used to estimate discharges on
the tributaries and at selected points on the river.
Eight potential d.am sites were investigated for their potential to
reduce flooding in the basin. It should, be pointed out that this report
is not proposing that these dams be constructed at this Èime. If the
lrlater Resource District. desires to pursue any particular dam or Èype of
dam, a more detailed investigation would be reguired,.
The dams studied both individually and coll-ectively do not provide
a large degree of flood. protection. The study shows that several dams
would be required to reduce the flood peaks significantly. The follow-
ing results pertain to the placement of dam sites.
1. Dams placed north of the Des Lacs Refuge would have litÈIedownstream effect d.ue to the combined capacity of the refuge
reservoirs.
2. Dams placed. in the middle portion of the basin provide the
greatest fl-ood, red,uction. This is due to timing of flow from
the tribuÈaries being fairly cl-ose to the timing of the Des
Lacs River.
3. In the l-ower portion of the basin, the peak flows from Tasker,
Lloyd.s, and Larson Coulees were slightly ahead of the main
stem peak. This would lessen the flood reduction benefit ofdam sites.

In addition, it appears that dams eonstructed in the upper aseas of
the triþutaries may be more sosÈ ef,fecÈive than tlre larger daqrs Located
on the do¡¿rrsÈream end of the tributaries. For .exam¡lle' upstrean and,
downstream dar¡rs were studied on f'laùen Coul,eer in Èhe Carpj.o area. A
da¡q siite on the uPstream end of Ëhe cou]-ee re{uced the 100-year fLood
peak at FOxlpIm by ?tr with a cosù of ,a¡rBroximately $305rO00. The
doqnstrea:n d"anr reduced the peak by t2*, but the cost increased to $1'3
niltrion. t¡erall, the results of, the studli provide an esÈírnate of the
costs and benefits that could be expected from dams of, various sizes and
locations
A review Ìras rnade of, the i:npact of drainage in the basin. Although,
the gtudy showed that drainage could resul-t in an increase in peak
fLows" it j-s unlikely thaÈ siqnif,icanÈ increasas have occuffed as a
result of drainage.

TABLE OF CONTENTS
Page
INTRODUCT]ON.. II
II. DESCRIPTION OF THE BASINA. Location and SizeB. Topography and Geology.C. Climate.D. Flooding Probl-ems
III. EXISTING V,TATER PROJECTSNorthgate Dam..Des Lacs National füildlife Refuge Dams.Burlington Dam No. IBurlington Dam No. 2
IV. EXISTTNG STR.EA-M GAGE DATA
STUDY APPROACH.A. GeneralB. ¡4odel Development for Existing Conditions....C. Mode1 Development for Tributary Dam Analysis.
VI . STUDY RESULTSA. Model Results for Existing ConditionsB. Model Results for Tributary DamsC. Impacts of Drainage...D. Souris River Flooding fmpacts
TABLES
ABcD
2222
4
55577
8
V 1313I316
VTI. CONCLUSIONS... 33
19l92L3031
24
25
27
L21516l923
Table l-
Table 2
Table 3
Table 4Tab1e 5Table 6Tabl-e 7Table 8
Table 9
Table 10
Table l-l-
Des Lacs Ri-ver Basin Stream Gage DischargeFrequencies...
Des Lacs River at FoxholmStream Gage Data Summary.
Des Lacs River at FoxholmVolume of Frequencies.
Drainage Areas of Tributaries and. Des Lacs River.l-979 Peak Discharge Times.Des Lacs River Frequencies...Statistics Summary of Potential Dam Sites.Peak Ðischarges on Des Lacs River at Foxholmwith Individual Tributary Dams.
Peak Discharges on Des Lacs River at Souris RiverConfluence with Individual Tributary Dams.
Cost vs Flow Reduction, Tributary DamsSO-Year Flood.
Peak Flow Þy Frequencies with Multiple DamProj ects.
9
11
2A

Figrure IFigure 2Fig:ure 3
Figure 4Figure 5
Figure 6.Figrre 7
FIGURES
General Location l,lap of t'he Des Lacs River Basin.Existing lilater ProJects. .....Hydrograph of 1969, L97O, and l-979 RecordedFloods on Èhe Des Lacs River at Foxholm
Watershed LocationSHydrograph of 1979 Recorded Flood vs 5O-Year
À4ode1ed Flows.Potentlal- Dam Site LocaÈions. !...Hydrograph of 5O-Year Flow: Existing vs Pl-anThree Dams, Des Lacs River at Foxholn.. - -
APPENDICES
.A.. InvestJ-g-ation Agreenent
B. Area-CapaciÈy Curves for Potential Dam Sites
C. Preliminary Cost Estimate for Potential- Dams
D. Individual- Dam Loeation MaPs
36
IOL4
20'))
29

I. INTRODUCTTON
The Des Lacs River has a history of flood problems. The lower Des
Lacs River has several steep coulees that enter the river from the west
and cause extensive agricultural floodíng. In addition, minor urban
flooding is experienced. There has been considerable speculation as to
Èhe measures that can be taken to decrease the flooding in the basin.
On May 6, l-983, the North Dakota State $Iater Commission entered
into an agreement with the Vüard CounÈy V'later Resource Board. The pur-
pose of this agreement was to develop a hydrologic computer model of the
Des Lacs River Basin. This modet would be capable of analyzing the
general flooding problems in the basin as well as evaluating potential
water projects. A copy of the agreement is included. in Appendix A.
The dams evaluated in this study were selected to provide a general
analysis of different projects in terms of size, type, and. Iocation.
The basin has the potential for the construction of several other d.ams
in addition to those included in this report.
-] -

II. DESCRTPTTON OF THE BASIN
A. Location and Size
The Des Lacs River, a tribuÈary of the Souris River, has a totaldrainage area of Lr042 square miles. The head.waters of the river are insouthern Saskatchewan. The Basin includes portions of Burke, Renville,Mountrail and lfard counties in North Dakota. Figure 1 is a general
Iocation map of the Des Lacs River Basin.
B. Geology and Topoqraphv
Ground moraine "pothole areas" and the broad river va11ey is char-acteristic of the Ðes Lacs River Basin. The soil consists mainly ofwell-d.rained loams and clay loams which are gently undulating. The
southwest drainage d.ivide follows a band. of dead-ice moraines, wíth the
basin having surficial glacial d.eposits which contain a broad pattern ofmeltwater channels.
Generallyr the upper reaches of the tribuÈary strearns have the
major concentration of pothoJ-es. Many poÈhole areas are considered as
non-contributing due to their lack of an outl-et. The downstream seg-
ments of the tributaries have steep, well defined channels. This causes
flooding to occur extremely fast from both rapid snowmelt and summer
thunderstorms.
C. Climate
The Des Lacs River Basin climate is characterized by extreme varia-tions in temperature, variable rainfall and moderate snowfalt. Record.s
of the National- Vùeather Service show thaÈ temperatures have varied from
-2-

cAx^DAutattEo lf^lEl
FLAXÎON' ,--,
l -lÞzÐoooEt
F2toooG
¡
ts,too!lIGf!
NMa
MOUHTNAI 1Y
DES LACS RIVER BASIN
AURELIA
General Location MapFigure 1
o
XHOLM
.î't
lfltloT
-3-

the lows in -5Oor to highs in llOor range. Annual- mean temperature is39oF. Annua1 precipitation averages 15.5 inches. The mean precipita-
tion ranges from a minimum of 0.4 in February to a maximum of 3.4 inJune. The average annual snowfall is 33 inches.V
D. Fl-ood.ing Problems
Almost every year the Des La,cs River overflows its banks Èo some
extent. Most floods are small and short in d.uration-! Severe floodshave occurred in spring of L949, 1969, L97O, L975, L976, and 1979.
I'lood.ing can also occur in the area of blocked. culverts or storm drainsduring periods of severe rainfall because of steep va1ley watts.V
Only a few studies have been completed on flood problems in the
basin. The Federal Huergency Management Agency has completed Flood.
fnsurance Studies for the CiÈies of Burlington, Donnybrook, Carpio, and
the unincorporated areas of Vtard County. The U.S. Army Corps of Engineers
have studied the lower Des Lacs River from Foxholm to the mouth inconjunction with Burlington Dam invesÈigations.
IJ U.S. Army Corps of Engineers, Flood Control Lake Darling,Design Memorandum No. 3.
2/ North Dakota State üIater Commission, 1983 State trfater PIan.!/ Federal tnergency l4anagement Agency, Flood Insurance Study of
Ward County.
-4-
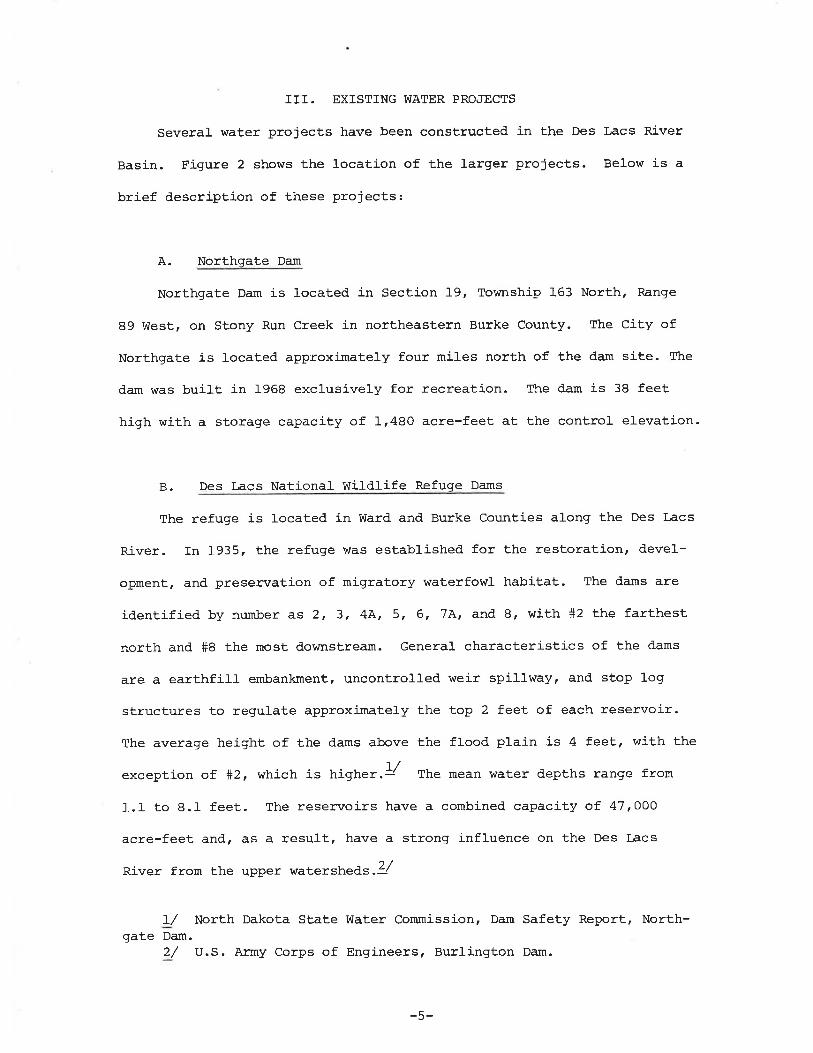
III. EXISTING VüATER PROJECTS
Several water projects have been construcÈed in Èhe Des Lacs River
Basin. Figure 2 shows the location of the larger projects. Below is a
brief description of these projects:
A. Northgate Dam
Northgate Dam is located in Section 19, Township 163 North' Range
89 V'Iest, on SÈony Run Creek in norÈheastern Burke County. The City of
Northgate is located approxi:nately four miles north of the dam site. The
dam was built. in 1968 exclusiveJ-y for recreation. The dam is 38 feet
hiqh with a storage capacity of 11480 acre-feet at the conÈroI elevation.
B. Des Lacs National Witdlife Refuqe Dams
The refuge is Iocated in lriard and Burke Counties along the Des Lacs
River. In 1935, the refuge was established for the restoration, devel-
opmentf and preservaÈion of migratory waterfowl habitat. The dams are
identified by number as 2, 3, 4A, 5, 6, 74, and 8' with #2 the farthest
north and #8 the most downstream. General characteristics of the dams
are a earthfill- embanlsnent, uncontrolled weir spillway, and stop log
structures to regulate approximately the top 2 feet of each reservoir.
The average height of the dams above the flood plain is 4 feet' with the
exception of #2, which is higher.V The mean water depths ïange from
l-.1 to 8.1 feet. The reservoirs have a combined, capacity of 4'7,OOO
acre-feet and, as a result, have a strong influence on the Des I-a'cs
River from the upper watershed.s.Z
t/gate Dan.
2/
North Dakota State I¡'Iater Commission, Dam Safety Report, North-
U.S. Army Corps of Engineers, Burlington Dam.
-5-

a
t,{
--9
iiiit
-]
\hÐ
I
I
I
I
I
I
i
I
l
I
I
I
t,_
Þ
\
¡lr¡
I
DES LACS RIVER BASIìl
Northgate DamDes Lacs NVIR Dam #2Des Lacs NVIR Dam #3Des Lacs NVüR Dam #4aDes Lacs NbIR Dan #5Des Lacs NbfR Dam #6Des Lacs NWR Dam #74Des Lacs NWR Dam #8Burlington Dam #2Burlington Dam #f
ìF
I
t
I23456789
l_0
'j- !- -'i*j t
Existing Water projectsFigure 2
-6-

C. Burlington Dam No. 1
Burlington Dam No. I is located on the Des Lacs River about two
miles northwest of Burlington, along the north side of U.S. Highway 2
and 52. The dam built in 1936 was initial-ly constructed for irrigating
lands in the Burlington ProjecÈ area. The dam is 2I feet high and
has maximum pool storage of 567 acre-feet.V
D. Burlinqton Dam No. 2
Burlington Dam No. 2 is located on the Des Lacs River about 3.5
miles northwest of Burlington, along the north sid,e of U.S. Highway 2
and 52. The dam built in 1938 \^ras constructed to provide add.itional
\^rater for irrigation. This was to supplement Burlington Dam No. l's
water supply d.uring a drought year. Tbday, irrigation is minimal with
it being used for its recreational value. The dam is 24 feet above the
streambed and has a maxímum pool storage of 487 acre-feet-U
L/4 U.S. Army Corps of Engineers,U.S. Army Corps of Engineers,
Burlington Dam No. IBurlington Dam No. 2
-7-

TV. EXISTTNG STREAM GAGING DATA
ExisÈing strean gaging daÈa in the Des Lacs River Basin is cur-
rently collected at only one station - the Des l-acs River at Foxholm-
This continuous gage has approxirnately 40 years of record (1905-06'
1946-present). Two crest stage stations were operated on tributaries
from 1957 -L973. The crest stage stations only provided peak flows for
each year of record. The U.S. Fish and Vüildlife Service records lake
elevations on the refuge pools. These records are prJ:narily collected
during 1ow flow periods. The staff gages are nonnally overtopped during
flood. periods.
Table 1 presenÈs Log-Pearson Type III flow frequencies for the Des
Lacs River at Foxholm and the two tributary gages. The highest recorded
flood peak on the Des Lacs River at Foxholm was 4260 cubLc feet per
second on Aprit 19, 1979. The 1979 flood was caused by a rapid snow-
melt.
Figure 3 is a hydrograph pJ-ot of the three high floods on the Des
Lacs River at Foxholm, 1969 | I97O, and L979. The day of peak was
centered on the same day for each year. The three hydrographs all show
a rather high initial peak discharge and a Iower extend.ed. flow resulting
from releases from the u.s. Fish and wildlife service Refuges.
Table 2 lists the annual peak discharge, the 30-day high volume and
the annual volume of flow on the Des la.cs River at Foxholm. The highest
volume year \^ias 1976 with over 107r000 acre-feet flowing past Foxholm.
A freguency analysis of the 30-day high vol1¡ne flood for the Des Lacs
River at Foxholm is shown in Table 3.
-8-

TABTE 1 - DES LA,CS RT\TER BASTNSTREAM GÃGE PEAK DTSCHARGE FREQUENCIES
Frequency
Strean Gage
Des lJacs River at Foxhol-m(5I Years - Drainage area:944 sq- mi.)
Des lJacs River TributAry nearDonnybrook(Drainage Ar.ea: 3.8 sq. mi.Record: 18 years)
Fuller Coulee at Foxholm(Drainage Area: 12.8 sq. mi.Record: 19 Years)
25-Year SO-Year("fÐ '(.fÐ
1O-Year-GrÐ 100-Year(cfs)
5,2OO2r 000 3r100 4,1OO
].75 250 300
250 400
*
500 *
*Insufficient r'ecord length to estimate.
-9-

IHoI
qErn
c¡aIEì{.
îr,b32.8ts3fl
IËeEçI(J 14øñt-lct
qE
DES LRCS R I VER RT FOXHOLIIREC0RDED |-IYOR0GRRPHS ¡ t 969 1,970 1.979
0.0 2.o l.D 6.0 8.0 10.0 l2.o l{.0 16.0 18.0 ?Í).o 72.0 2l.o 26,0 28.0 311.0
IIIIE TN DRYSFigure 3
IHl-'¡-l HP'l,\I
ì-J)
\ LI\I\-
lt\
J
\I¡
t\II
II/r^ì¡
/
\\I
\\
\
rr 1970x - 1979
c¡act

TABLE 2 - DES LACS RT\ÆR AT FOXHOLMSTREAIVT GAGE DATA SUMMARY
Year
I9051906I939L946l-947L948l-9491950r95IL9521953l-9541955r956L95719581959I9601961L962196319641965L966l-967L9687969]-970T97Tr972r973L974r975L916L977L978L97919801981L9A21983
Peak Discharge(cf s)
100350
I,22Ol_13640505
2 tOOO1, 0101,9 00
850775205900696r50430105
I,O2O2550
93435540625053085
2,4603 ,660
1931,030
529650
2,6'70l, 550
42700
4,260230580100350
30-Dav Hiqh Volume(acre-feet)
I Year Vo1ume(acre-feet)
3,3006,7OO
1,2003, 600
2, OOO8,700
13, 6002r,50017r 3oo26,4OO11,8008r8003, 300
Il_, 500r0,1001,7004 tTOO1, 0o0
18, 200400500
6, r003, 4005,4OO3,3004, 300
90030,80033, 300
3, 20019r 800
3, 70017, 10044 | 60049r 800
7001,500
38r 0002,4OO4,600
11,80010,500
2,5OO11,60020, 30029,OOO34, o0o45,600l-6,7OO15, 90012, 30029,7OO31,100
3, 9005, 1401,700
2I,7OO600900
8, 7oo5,900
12, 300g r4oo5,7002, OOO
52, 80063,0008, 000
60, 90014, 50047,gOO89,000
107, l_002,LOO
10,l_0060, 800
9,4OO6,4OO
19, 50023,9OO
-11-

FrequencY
TABLE 3 - DES LACS RIVER AT FOKIOLMVolume of Freguencies
30-Day Volume(acre-feet)
r8, 300
29,600
48, 000
64,4OO
83, 000
5
10
25
50
100
year
year
year
year
year
-L2-

V. STUDY APPROACH
A- General
A numerical model using the Corps of Engineers Computer Program
HEC-I, Flood Hydrograph Package was used to d,evelop flow hydrographs inthe Des Lacs River Basin. A hydrograph is a representation of the
distribution of flow with respect to time. The HEc-1 model has several
options available for hyd.rograph development, loss rate computation and,
routing procedures. this study utilized the Synder Unit hydrograph, the
SCS Curve Nu¡nber Loss Rate and, the Muskingum routing method.s.
B. Mod.el Development for Existing Conditions
the Des Lacs River Basin was divided into over 30 separate sub-
basins. Figure 4 shows the subbasins included j-n the model. Table 4
lists the subbasins and the drainage area of each subbasin and the Des
Lacs River at selected, locations. Hydrographs were d.eveloped for each
of the subbasins and at several poinÈs along the Des Lacs River.
The Muskingun routing method. was used to sj¡nulate flood-fIo\^r move-
ments from one river reach to the next. Reach travel times were esti-mated based on information provided by the National Vüeather Service on
flow movements. Table 5 shows the time of the peak discharge at loca-tions along the Des Lacs and Souris River. This information, during the
1979 spring flood also correlates to information available on the 1969
Des Lacs River flood.
-13-

@
. Fa \l¡-r \
,ô.a,-("ó""
@(i
@> )
t.li
a¿
o:\
@ì/
Utrfa)
Ec)CA
!úH
HtÉÞ(nHz
*zortft
pr{ØQPJOortOoPJFiEl-J(/)Èo 5ttprots:o ÈoÞÈOJär¡ôoofiPJ D)
Èl-ts-ø tr¡Fì rt
PJP.oÞHìI
-¡/slif
w4f.' "o'tr,"ouvt r
€prrford fJ
ts. ul(aifÉoFl p,o,Þ5o
p,ctH.oÞat
ItsÈI "."r*."úl:r,
Ii
- ' ¡'sl.- '!¡s'- "r'! '
s/aìio
oil-"/åÀ'/¡
q-tt
ltqø ^¡.ru,...1T*,'-eùN t y
lu-.^^tu¿,-,r'ûfíj¡f''íirnoc
- '-p'
(5¡¡'':-l,f\I
4-.i.":Ú4'-;r
,8t"
c

I234
567I
No
o10.
57.7I23.8
54.3
TABLE4-DRATNAGEAREASOF TRIBUTARIES AND DES LACS RIVER
Drainage Areasq. Mi.Watershed
Northgate & CanadaNorthgate DamStony RunUnnamed V'iatershed2L, 22-162-88
Nine Mile CornerThompson LakeShockley SlougrhStony CreekDan #2Ankenbauer CouleeNiobe CouleeDam #3 KenmareTaskers CouleeDam #44Dam #6Dam #74Baden CouleeDam #8Mott CouleeSpencer CouleeBerg CouleeBowman-Shipton CouleeDonneybrookAureliaCarl- FeldnerFlaten CouleeCarpioJoh¡son CouleeOleaas Coul-eeHanson Coul-eeArnold CouleeBlacks CouleeKarl-sen-Fuller CouleeFoxholmLonetree Trib. DamLonetree Trib.Lower Lonetree CouleeTasker CouleeLloyds e Kandolph CouleesLarsons CouleeConfluence with Souris River
50. 560.342.657.L55.4
23.343.9
42.3
76.4
21-.7
14.L42. O
9.8L2.O
38.048.220.3
6.97.7
l-O.723.O30.020.4
649.4649.4663 .5705.5715.3727.3727 .3765.3813.5833 .8833.8852.5870.9880.5903.192L.L943.8943 .8
Drainage AreaDes Lacs River
Sq. Mi.
57 .8181.6235.9
286.4346.7
501.850r.8525.L569. 0569. 0611. 3611.3627 .7
I3
11.
L2.
14.15.16.17.
18.19.20.
2L.22.23.24.25.26.
27.28.¿9-30.3l-.32-
18.18.
o))18.))
7466U
7
969.L992.I
l-o22.LLO42.5LO42.5
-15-

TABLE 5 - 1979 PEAK DISCHARGE TIMES
Time of PeakLocation
Des Lacs River at Donnybrook
Des Lacs River at Carpio
Des Lacs River at Foxholm
Ðes Lacs River Peak aÈ Minot
April 18,
April 19,
April 19,
April 20,
l-979 - 8:00 P.M.
1979 - 1:00 A.M.
L979 - 8:00 A.M.
L979 (Early A.M.)
(+2 hrs. )
(t2 hrs. )
The Des Lacs River at Foxholm stream gage was the primary stationused to calibrate the computer model. A log-Pearson Type III statisticalanalysis of the stream gage d.ata provid.ed flows for the 10, 25, 50 and
100-year flood peak discharges (See Table 1). The model results were
compared. wiÈh the gage data and small adjustments to model inputs were
made to reproduce log-Pearson peak d.ischarges.
Once the hydrologic model was calibrated, there were 55 reference
points in the Des Lacs River Basin at which specific information hras
available. The available information at each point inctudes contrib-uting drainage area, peak discharge, volume of runoff and the discharge
flood hydrograph.
C. I"lodel- Development For Tributary Dam Analysis
After the model was d.eveloped for existing conditions, several
potential dam projects were added to the model. This provid.ed flowhydrographs with and without the dams at locations below each dam site.
The dam sites were selected Èo provide an areal distribution of the
projects as weII as a variety of sizes. This provided for a comparison
of costs and. flood benefits for different tlpes of dams. It was not the
-16-

intent to include enough dams to control- a particular size flood. The
different tlpes of dams studied provided an indication of the more
feasible dam locations, and Èhe flood reductions that could, be antic-ipated with various projects.
A1l- dams were consid.ered as dry dams for flood contror purposes.
The dams would conÈai-n r^rater only d.uring flood period,s.
The dams includêd in this analysis were located on tributaries tothe Des Lacs River and not on the main stem. I,lain stem dams would.
require detailed design and were considered beyond. the scope of thisstudy. The general criteria for locating the dams were:
l-) No farmsteads could be inundated. by the reservoir pool area.
2) No county or farm to market road could be closed..
3) A dam 30 feet or higher must have the capability to contain a1OO-year snowmelt flood without passing water through theemergency spillway. Dams less than 30 feet high must containthe 5O-year flood.
For dam safety purposes, dams located above a ciÈy or farmsteads
were designed. more conservatively. These dams were designed with flatterside slopes and rock riprap \^Ias incl-uded for the entj-re upstream face ofthe dam. These dams would also be required to pass a probable maximum
precipitation frood without overtopping. A grassed emergency spirrwaywas used to pass the rarge floods. Detailed design studies would be
required. before a high hazard d.am could be constructed.
For dams l-ess than 30 feet high, minimal riprap was included in the
cost estimate. rn addition, corrugated metal pipes and, sid.e sJ-opes of3:1 upstream and 2:l- downstream were used.
Land costs r^/ere considered separately. The land for the d.am,
emergency spil1way, and. sed.iment pool areas were assumed. to be purchased.
-I7 -

at a cost of $500 per acre. Fl-ood easements r¡¡ere assumed to be suitable
for an area of I.5 times the flooded area at the emergency spillway pooJ-
elevation. Flood easements were estimated at $300 per acre.
-r8-

VI. STUDY RESULTS
A. Model Results For Existinq Conditions
The initial step in the model development was to calibrate the HEC-
I model. The 1979 flood was the mosÈ recent and largest record.ed floodand, therefore was used as the base flood for calibration. A statisticalanalysis of records on the Des Lacs River at Foxholm determined that the
1979 flood was a SO-year event. Figure 5 compares the 1979 recorded
flood with the 5O-year modeled flood. The second, step in the exísting
conditions mod.el was to modify the precipiiatíon volunes to correspond.
with the 10, 25,50 and.100-year peak flows for the Des Lacs River atFoxhoIm.
After the model was cal-ibrated to the Foxholm strean gage, peak
discharges h¡ere determined for other points along the Des Tacs River.
Table 6 shows d.ifferent frequency discharges for the Des Lacs River at
the United States,/Canadian border, at Donnybrook, Carpio, Foxholm and atthe confluence with the Souris River.
TABLE 6 - DES I.ACS RIVER FREQUENCIES
Des Lacs RiverLocation
Peak Discharge FreguencyIO-Year 25-Year 5O-Year 100-Year
Near Canad.ian Border
Donnybrook
Carpio
Foxholm
(cf s)
200
680
Lt32O
2, 000
2,5OO
(cf s)
300
l, ogo
2, O5O
3, I00
3, 900
(cf s)
400
1,490
2,760
4,2OO
5,25O
(cf s)
500
l_,850
3 t42O
5,2OO
6,500Souris River Confluence
-19-

DES LRCS RIVER RT FOXHOLM1929 RECORDEO VS 50 YERR I,|ODELEO FL[]I,{Sct
a
Bo¡,ì¡
C¡aIC'rË
cnb:2.8t-. ¡1,
ftt(9EeãE(r)ñl-lo
IN)oI
c¡IIc¡
aac,
10,0 Lz.ÍlTIHE IN DRT5
Figure 5
J - I
\ H4\f,
\
I
\
\
\
! - 1979tr-50 YR
0.0 2-O {.0 6.0 8.0 ll.0 16.0 19.0 æ.o 22.o

The refuge pools, although not constructed or operated for flood
control, do provide flood benefits to the lower Des Lacs River. The
upstream coulees in the Des Lacs River are not as sÈeep as the lower
basin coulees and, therefore, a double peak (the 2nd being smaller than
the first) would naturally occur. The coml¡ined. refuge pools have a
Iarge storagie capacity and, this results in a greater separation of the
peaks and a significant decrease in the magnitude of the second peak.
B. Modet Results For Tributary Darns
Eight dams were included in the final analysis. The locations of
these dams are shoh¡n on Figure 6. Several other dams were studied but
were not included due to a variety of reasons. Since Èhe lower Des Lacs
River peak results from the coulees below the Fish and Wildlife Refuges,
dams north of the refuges had little d,ownstream benefit. In add'ition'
the tributaries in the lower Des Lacs River basin (namely Tasker, Lloyds
and Larson Coulees) were slightly ahead of the main-stem peak. There-
fore, less reduction in flood flows from these areas was noted than from
tributaries in the rniddl-e watershed areas. The eight dams shown in this
study are all located on coulees and tributaries between Donnybrook and
the lonetree-Berthold area.
Surunary sEatisÈics on each site are shown in Table 7. Area-capacity
curves, individual site Iocation maps and. cost estimates for each dam
are shown in Append.ices A, B, and C' resPectively-
The impact on peak discharges on the Des Lacs River at Foxholm and
at the Souris River confluence is shown in Tables 8 and 9, respectively.
These tables show that Lolì/er Flaten Dam has the largest flood-flow
reduction. However, Èhe cost of this project is also very high-
-2I-

Þ2e()l¡lJ¿I¡lG
zfoC)
PIOPiOÜD DAI 3ITE¡
1. Aurelie2. Feldner5. Hartland4. tlppcr Flaten5. Louer Flaten6. Arnold7. Lonet¡ee Trib.8. Lover Lonetree
E COUÌaTYaAUNELIA
It-----2
F3 4
5
BCRII|OLD ¡
--lr-ãiãÉi3
I6
7
zI Rlvfn
E
aDt8 L^Ct
Potential Dam Site LocationsFigure 6
-22-

TABLE 7 - STATfSTTCS SUMMARY OFPOTENTIAL DAM STTES
LocationS-T-R
V'Iard Co.
DrainageArea
DamHeight
Top ofDam Elev.
Emergencyspi1lv/ay
Elev.Pipe
Size & Type
Storage atEmergency
Acreage atEmergencySpillway
(acres)Spillwayacre-feetName . rni. ) feet feet ( feet (inches
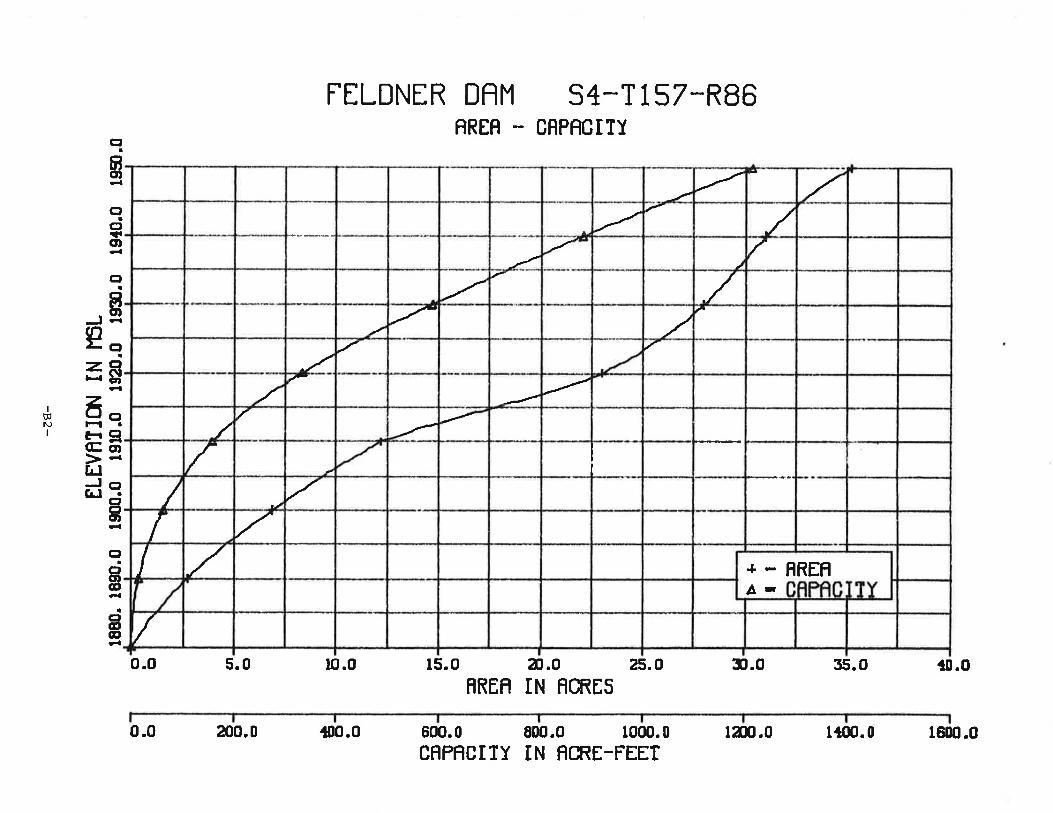
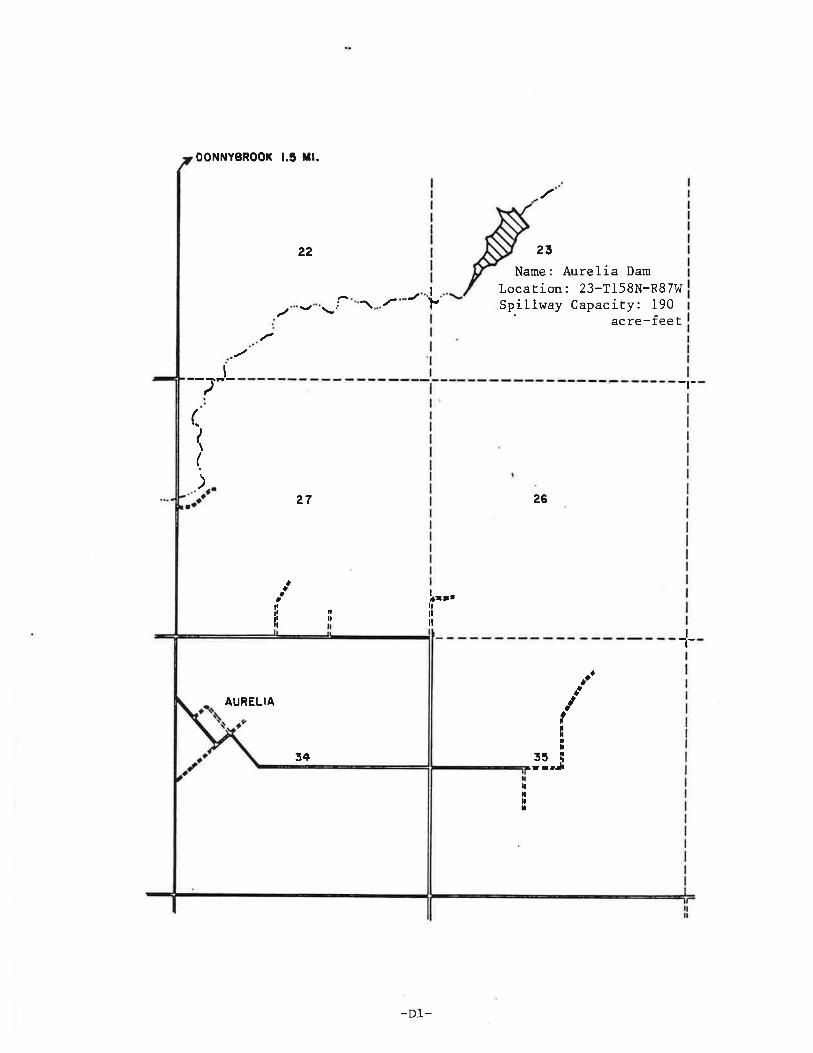
Aurelia NVt23 -158-87 3.5 34 I,832.O It821.O 24" RCP
Feldner svü 4-157-86 4-7 42 L,922.O L,9I7.O 24" RCP
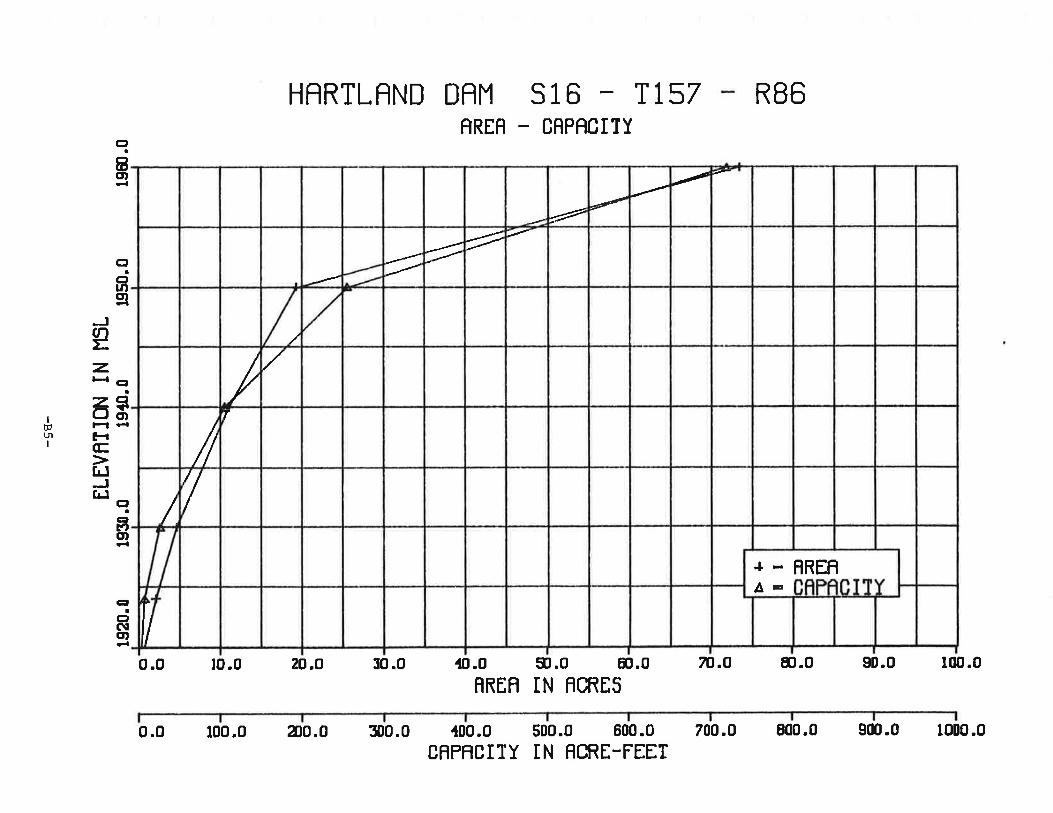
Hartland NEr6-157-86 6.9 44 Lt962.O I,951.O 24" RCP
UpperI
Flaten sEl-5-157-86 l-3.5 55 1,g35.o L,929.O 24" RCP
Lower Flaten SI/t]2-157-86 20.3 83 l-,816.o 1,810.o 24" RCP
Arnold NVr 1-156-86 18.r 65 1,915.0 1,91-0.0 30" RCP
Lonetree Trib. sw34-156-86 6.9 15 2tO76.O 2,072.0 30" CMP
190
280
930
L,77 5
1,3r0
460
13 -2
19.8
58.2
61.0
7r.5
1r1.6
Dam $Land
580 57
DamLand
DamLand
DamLand
Dam $Land
Cost
ç L24,4OO6,700
$ 131,100
$ 129,5OO9,500
$ r39,0oo
ç 284,76526,9OO
$ 3Ir,665
291, 00027 t2OO
27O,2OO34, 000
$ 304, 200
NJtI
$ 318,200
Dam çL,327,898I*:nd 28,7OO
$l, 356,598
Dam $Land
32,IOO50r 5oo
$ 82,600
796,80092, 500
Dam $Land
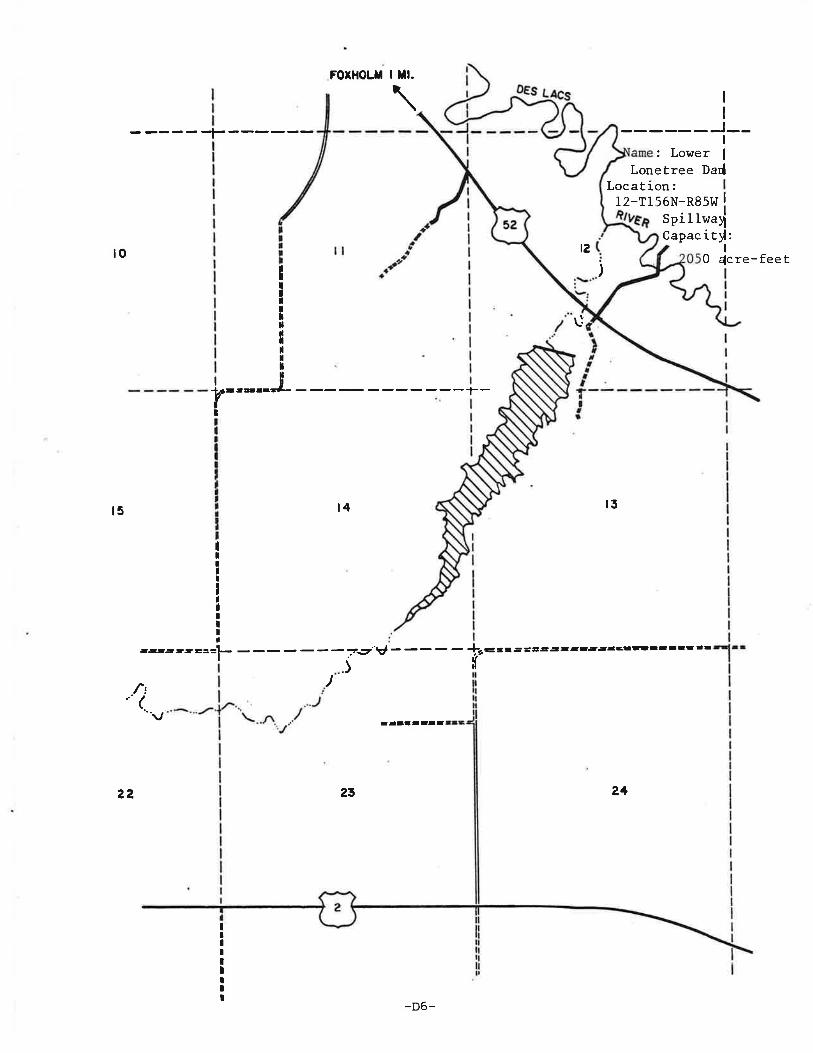
Lower Lonetree SVüI2-I56-84 25.3 70 r,722.O L,7r6.o 30" RCP 2, O5O 85
$ 889,3oo
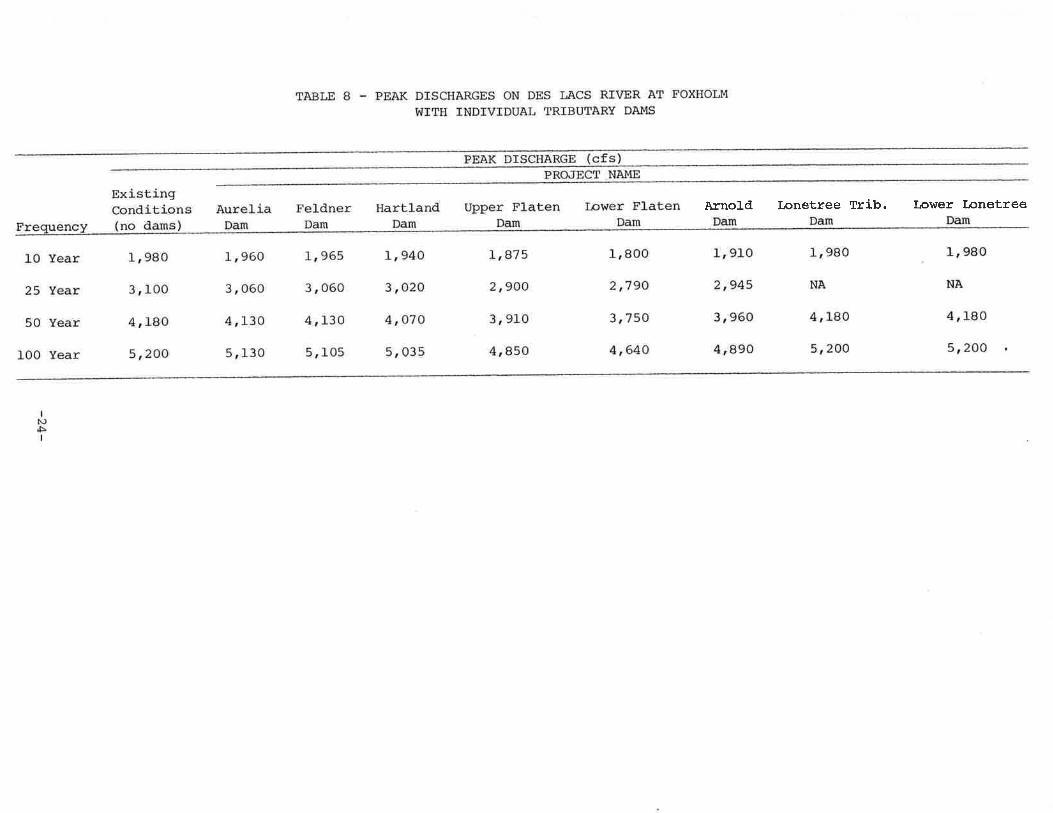
TABLE 8 - PEAK DISC'HARGES ON DES LACS RTVER AT FOXIIOI.,M!üTTH INDTVIDUAT TRIBUTARY ÐA¡4S
ExlstingCondltions Hêrtland Upper Flaten I¡r¡¡er Flaten
DamArno]-d Lonetree trrib. Lo$ter Lonetree
10 Year
25 Year
50 Year
100 Year
1,980
3'100
4,180
5 r2AO
AurellaDaJn
Lr960
3r060
4r130
5r130
FeLdnerDam
L,965
3r060
4r13O
5r105
l,940
3, 020
4,07Q
5r 035
1,875
2,9OO
3r 910
4,850
1r800
2 t79O
3r750
4t64A
1,gLo
2,t945
3r960
4r890
1r 980
NA
4, L8o
5,2oo
1,980
NA
4r18O
5, 200
If\JÈI

TABLE 9 - PEAK DISCHARGES ON DES I,ACS RTVER ATSOURTS RI\¡ER CONFLUEI{CE WITH
INDIVIDUAL TRIBUTARÏ DAMS
ExistingConditions Feldner Iiartland UPPer F1aten I-ohrer FlateR
DamArnold Lonetree 'Trlb. Lower Lonetree
l0 Year
25 Year
50 Year
1OO Year
2,5O5
3r880
5 1235
6r48O
AureliaDam
2'r49O
3 r855
5,l_95
6,43O
2,49A
3,840
5,175
6r395
2,465
3r805
5, i25
6,335
2,4L0
3,725
5, O2O
6t2r5
2i34O
3, 6l-0
4,87O
6, 03o
2,4L5
3,705
41964
6tL25
2,480
3,83O
5,165
6,385
2t4O5
3r695
4 r 950
6,100
no
IN)urI

In order to relate the cost of each project with flow reductíon, a
comparison was d.eveloped between Èhe cost of each project and the flow
reduction achieved by each individual project (Table l0). Based on this
comparison, Uppeï Fl-aten and Arno1d Dams n-lr" an" lowest cost per unit
of flow reduction on the Des Lacs River. This technique does not replace
the need of a more d.etailed benefiÈ-cost analysis. If it. is d.esired. to
pursue any one of the projects, a d.etailed analysis should be made to
determine the benefits on the Des Lacs and. Souris Rivers.
Three plans were analyzed to determine the cumulative effect of
multiple projects. Pl-an 1 consisted of Arnold and. Upper F1aÈen Dams.
Plan 2 added the LoneÈree Tributary dam to Plan I, and. Plan 3 added
Feldner Dam to Plan 2. The cumulative impact of these plans are in
Tabl-e fl-. Figure 7 is a comparison of the SO-year hyd.rograph for the
Des Lacs River at Foxholm with and without the Plan 3 dams.
The results show a rather low reduction in overall flooding on the
Des Lacs River due to one to four d,ams. The reason is due to the large
number of small coulees that influence the flooding on the Des Lacs
River. At the Souris River confluence, the Des lacs River has a con-
tributing drainage area of 900 square miles. Plan 3 with four dams,
only controls 43.2 square miles, or 4.8t of the total watershed. The
decrease in peak discharge for Plan 3 ranges from 9t for the lO-year tol-3% for the 100-year flood. Irlhile this indicates that certain coulees
have a greater influence on flooding Èhan others, the results also show
that several dams would be required to decrease floodinq by 25-50t.
-26-

TABTE 10 - COST VS FÜCTÍ REDUCTIONTRTBUTARY DA}4S
SO-YEAR FLCOD
Pf,oject Cost $ FoxholmProiect Nane
Aurelia Dam
Feldner Dam
Hartland Dart
Upper Flaten Dam
Lower Flat,en Dam
Arno]-d DaÍl
Lonetree tributaryDan
Lo\À¡er Lonetree Da¡!
Souris River Mouth
3.3
2.3
2.9
1.5
3.7
1.1
L.2
3.1
$ 13L,O00
139,000
312, O0O
3 L8, 000
1 r 356, 600
304, O00
83 r 000
889, O0O
2.6
2.6
2.8
r.23. t_
r.4
-¿t-

TABT,E 11 - PEAK FLO!ú Ev FREQUENCTES Vt TIl}4ULTIPLE DAM PROJECTS
DES LACS RIVER AT FOXHOL}{ DES LACS AT SOUBIS RIVER CONFLUENEE
Number
ExistÍng
Plan 1(Arnold & FlatenDam)
Plan 2(Pl-an I plusLonetree Trib.oan)
Plan 3(Ptan 2 plusFeldner Dam)
fs0
I¡982 3, 094 4,!82 5r 193
1r808 2,755 3r 688 4 1544
1,808 2 ¡75,5 31 698 4r544
1r 8O3 2,73O 3, 633 4,567
2
2,5A4 3r879 5 t234
2t324 3r541 4,,736
2r3O2 3, 501 4,666
2 t287 3 1467 4,607
eaï
6,478
5,936
5,74r
5,659I
t\)@I

DES LRCS R I VER RT FOXHOLII50 YERR FLO,.I ! EX I SI I NG VS PLRN 3 DRHS
IN)\oI
CT'
b3=8¡-¡ lll
?Ërf1
qIGI3
t¡lc.Ð
Ee,HRt-lc¡
c,aIct
C¡aa
10.0 Lz.OTII1E TN DRTS
Figure 7
J a
r J LL-t
\\ ¡.*-
I/\
If¿
\
i\/
A - EXISTINGE¡ - J4ITH DRMS
0.0 2.o {.0 6.0 8.0 Ir.0 16.0 18.0 æ.o z2.g

C. I¡qpacts of Drainaqe
The Des Lacs River is characterized by a main peak flow from the
steep coulee areas and a rather long sustained recession flow from the
upper watershed areas. The lower portions of these coulees have very
few natural wetlands or potholes and, therefore, drainage is not a
factor. However, the upper portions of these coulees are relaÈive]y
flat cropland areas with a large concentration of potholes. Agricul-
tural drainage has been active in these areas. In recent. years Èhere
has been increased concern regarding downstream flooding impacts as a
result of the agricultural drainage- Drainage can influence peak dis-
charges and flood, volumes by changing vetocity, decreasing the channel
lengths, increasing the contributing drainage area' and by reducing the
upstrecrm storage.
To test the impacts of drainage, several changes \^/ere made to the
i-nput parameters of the calibrated hydrology nodel. One or more of the
fotlowing changes were made:
l) Reduce the time of concentrations;(Due to higher stream flow velocities)
2) Increase the drainage areas;
3) Decreased the nrrrnber of depressions.
The results showed increase in the peak flows and volumes from the
individual watersheds. However, the impact on flows in the Des Lacs
River was dependent on the timing of the tributary and main stem peaks.
For example, a l-0 to 158 increase in peak discharges on a tributary
resulted in only a L-2t increase in the Des River peak discharges.
Collectively, a 7 to 15å increase on all the tributaries resulted in a
7% increase at Foxholm and 4-6* increase at the Des Lacs River con-
fluence with the Souris River.
-3 0-

Therefore, it appears that a substantial amount of drainage would
have to occur in the upper tributaries to significantly increase Èhe
peak discharges on the Des Lacs River. The volume of flow can be in-creased more significantly than the peak discharge.
D. Souris River Floodinq Tmpacts
A brief review was made on the impact of Des Lacs River tributarydams on Souris River flows at Minot. The Souris River aÈ Minot usually
has two peaks that occur one to three weeks apart. The first peak
results from the Des Lacs River and, Souris River coulees upstream from
Minot. The second and. largest peak results from rel-eases from Lake
Darling Dam. The tributary dams in the Des Lacs River basin would.
decrease Souris River flood.ing during the first peak. Although un1ike1y,
the dams could. decrease flooding durinq the second peak if the peaks
were only a fe\nr days apart. It is more likely that the Des Lacs River
tributary dams woul-d slightly increase Souris River flooding during the
second peak. Without the dams, the Des Lacs River \^rater woul-d, be past
l4inot before the second peak. Vüith the dams, however, d.ischarges may
stilL be occurring as the second peak reached Minot.
There have been two primary proposals for controlling Souris River
flooding. The Burlington Dam project would. includ.e a large dam on the
Souris Ri-ver and a Des Lacs River diversion tunnel and control struc-ture. Therefore, both Souris and. Des Lacs River flows would be con-
trol-l-ed- The tributary dams studied in this report would be above the
Des Lacs River diversion bypass and would not affect the Souris River
fl-ows. The Burlington Dam project has considerable opposition and it isnot likely to be constructed in the near future.
-31-

Efforts are eur:rently beíng directed at an enlargement of, thè fl_ood
storage capacitlt in l,ake Darling Dalr. This project wotrl-d control about
a 35-yanr f'leod on the Souris nÍ¡¡e¡ but rrould not controL the Des lå,cs
Rirrer. TriJcutarl' dans j.n the Ees Lacs Fllver Basin ¡'¡ould provide lj-rnitedbenefits to the Ssuris RLver with the :raising of Lake Þarling Ðiim. The
timing of the De,s r.acs and souris, R:ive-r fLows rooul-d be ¿n importan¡
sonsideration.
-32-

VII. CONCLUSTONS
The model d,eveloped for the Des Lacs River basin does represent the
existing conditions and can be used as an effective tool to analyze
flooding in the basin. Based on results of this model, the following
general conclusions can be d.rawn.
1. The peak discharges along the lower Des Lacs River are the
result of flows from the steep coulee areas located primarily
between the towns of Donnybrook and Des Lacs. Dam projects
constructed in these areas would be the most effective in
controlling flooding.
2. The Des Lacs River above the Fish and ü7i1d1ife Refuges normally
peaks l-ater and at a lower discharge than the lower coulee
flows.
3. Several tributary d.ams would be necessary to control flooding
on the Des r,acs River.
4. Dams constructed in the upper areas of the tribuÈaries may be
more cost effective than dams constructed, in Èhe downstream
areas. As one example, upstream and downstream dams were
studied, on Flaten Coulee in the Carpio area. The dam site
l-ocated approximately four miles upstream of the confluence
reduced the 100-year flood peak on the Des Lacs River at
Foxholm by 72, with an estimated cost of $305,000. The d.own-
stream dam, located near Èhe confluence of Flaten Coulee,
reduced the Foxholm peak by I2z but the cost increased to $1.3
million.5. It is unlikely that drainage has significantly increased. peak
d.ischarges in the lower Des Lacs River.
-33-

APPENDÏX A
InvesÈigation Agreement

May 6' 1983StüC ProjecL #L772
AGREEMENT
Investigation of the Des LacsRiver Watershed,
T. PARTIES
THIS AGREEMENT is between the NorÈh Dakota State lrlater Commission'
hereinafÈer referred to as the Conrnission, acting through the State
Engineer, Vernon Fahy; and the Ward County Water Resource Board, here-
inafter referred to as the Board,, acting through its Chairman, Arden
Haner.
II. PROJECT, LOCATTON A}üD PURPOSE
The Board wishes to evaluate the flooding potential along the Des
Lac Rj-ver and develop a hydrologic model of the watershed. The model
wiII be a \^rater management tool that can be used to evaluate the effects
of future projects in the Des Lacs River Basin.
Approximately three potential dam sites will be located and evaluated
according to their flow reduction capacity. A very preliminary design
wilt be d.one for these sites based on a field measured profile and
information from topographic maps. This design will not result in a set
of plans for construction but rather is intend.ed to provide general cost
and hydrology information.
The project area will consist of the watershed of the Des Lacs
River above its conftuence with the Souris River-
Fie1d surveys will be done to gather information necessary for the
development of the hydrologic nodel. FIow rates will be determined' at
the mouth of the Des Lacs RiVer and at other selected' points on the
main stem.
-t-

1IT. PRELTMTNARY INVESTIGATTON
The Parties agree Èhat further information is necessary in order to
evaluate the flooding problems in the project area and' develop a hydrol-
ogic model. Therefore, the Commission shall conduct an investígation
consisting of the following:
1. Do necessary field work to set up the model. This will con-
sist of cross-sections at hydrologically important locations
and the measurement of structures that will affect the hydrol-
ogy of the Project area.
2. Sel_ect approximately three potential dam sites that would
ternporarily retain flood \^¡aters. A profile along the poten-
tial aligilnent of the sites will be taken in the field.
3. Do a preliminary design of the proposed. dams based on the
measured profile and information from topographic maps.
4. Devel_op and calibrate a hydrologic model of the project area.
5. Determine the flow rates for the f0' 25, 50 and l-OO-year
events at the mouth of the Des Lacs River and at selected
points of importance along the main stem. These flow rates
will- reflect present conditions"
6. Develop preliminary cost estimates of any proposed retention
d.ams based on the preliminary design-
7. prepare a Preli-minary Engineering Report that would describe
the present hydrologic conditions, evaluate potential projects,
present preliminary project designs and their estimated costs.
If the Board decided to proceed furÈher wiÈh any potential project
identified in this preliminary investigation, more detailed information
and a more detailed study would. be needed to develop plans for construction
-2-

This is beyond the scope of this investigation and would have to do done
under a seParate agreement.
ÏV. DEPOSTT - REFUND
The Board shall deposit a total of $2,200 with the Commission to
partially defray the costs of Èhe investigation. Upon receipt of a
request from the Board to terminate proceeding further with the pre-
liminary investigation or upon a breach of this agreement by any of the
parties, the Commission shall provid.e the Board with a statement of allexpenses incurred. in the investigatj-on and shalt refund to the Board any
unexpended. funds.
V. RTGHTS OF ENTRY
The Board agrees to obtain written permission from any affected,
landowners for field investigations by the Conunission which are required
for the preliminary investigation. The Commission shall inform the
Board of the locations where surveys are needed.
VI. TNDEMNTFICATION
The Board hereby accepts responsibility for and holds Èhe Commission
harmless from aI1 claims for d.amages to publj-c or private property,
rights or persons arising out of the project and the travel to and. from
the project area by the Board or any of it.s subcontracÈors, agents, or
employees. In the event such a suit is initiated or judgement entered
against the Commission, the Board will indemnify the Commission for any
settlement arrived at or judgenrent satisfied.. No indernnification willbe required. of the Board for claims resulting from negligent acts of the
Commission.
-3-

VII. CIIAÑGES TO TIIE AGREEMEì{IT
Changes to any eontractual provisions herein will not be effective
or bindingr unless such changes are made ín writinq' signed by both
parties. and attached hereÈo.
óL.).{1.e
Chairoan State Engineer
/r t- t3-y3
I
I
-4-
APPENDTX B
Area-Capacity C'ürves ForPotential Dam Sites

RURELIR DfiM S23_T158-RBZRRER CRPRCITY
cta
EI@
c¡Ict{.æ
Jú'l o=.,'2.8Fa -¡
âËqäEJCL¡
ItdFI
aact
@
ctactct
@
0.0 +.o 8.0 ?ß.o 2+.O 2E.OLz.O 16.0RRER TN NCfrES
//tt + - RRER
¿ - CflFÊCITY
//
/
_/ -/
¿/
500.0 ,fÍ10.0
CRPRCTTY TN RCRE-FEET0.0 lm.0 200.0 500.0 600.0 7ü).0
aaflot
FELDNER DRM S4-T 1 5Z-R86RRER CRPRCTTY
10.0
ItúN)I
aIc¡Í.ot
(Ða
Br9E'- Ct
=B'=(Jsl-l .Fls|f¡.: ol>dt¡.ld3
ctgt
aac¡(tt
@
IC'@@
0.0 5.0 15.0 æ.oRREN TN RCRE5
25.0 Il.0 35.0 ill.0/
+ - RRER¡lr
I/'
/If
/,/
6(n.0 600.0 1000.0CRPRETTY TN RCRE-FEEI
0,0 200.0 l{to.0 lãn.o 1t00.0 16110.0

UPPER FLRTEN COULEE DflM S15 -TT57 -R86ÊRER CRPRCTTYq
Bo)
aIc¡tl.o¡
c¡Ig
r9glLO
=dz.Clst-l ¡t-. Clc6Þ¡t!¡Jauo-
c,ot
c,acto)ó
G'a
C'@@
ItúUJI
0.0 10.0 20.o x0.0 ß.o gr.0 æ.0RRER TN NCRES
7Cl.O tl.o 9l¡.0 [fn.o
I
I
^
+ - RRER/I/
7 -1
1000.0 1ã0.0 lgl0.0 1750.0CRPRCTTY TN RCRE-FEEÏ
0.0 250.0 g¡0.0 750.0 ?m.o z?5o.o 25m.0

LOI^IER FLRTEN COULEE DRM S 12'-T 152_RB6RRER CRPRCTÏYq
oc{9
c¡¡IoJ(nË.
=l-lz.oilqSFL¡ -_Jb¡
ItÚÈI
c,ac,olt\
0.0 10.0 20.o 30.0 ß.o gl,0 æ.0RRER TN RCRES
7O.O æ,0 90.0 1ül .o
Eâ+ - RRER
¡
,I/
/
=
I 7,t
/
1000.0 Lão.o 1gl0,0 L76lJ.oSRPRCTIY tN RCRE-FEET
0 .0 ão .o 500.0 7lo "o m.o 22fi.o 2500.0
C'a
ao)
HRRTLRND DfiM 51 6 TL57flRER CRPRCIÏY
R86
n.o æ.0 90.0 100.0
Ilú('lI
aa
C'¡no)
J(nEz.He
I
=3fJ o)l-r(EtL¡Jf!¡ q
c,Þs)
G'ac,o¡o)
0.0 10.0 20.o 10.0 70.o sl.o flJ.oRRER tN RCRES
E
^
+ - RRER
,/
/
fI I=
=
--t-
-
4/-4=
{00.0 500.0 600.0CRPRCITY TN RCRE-FEET
0 .0 100.0 Ðo.o $0.0 700.0 800.0 900.0 1000.0

It¡olI
ai
tlg,
ct¡c¡gt
ct¡I-g)
-¡ .<g
aQ
-å=E=LJsl-t .tí8rJ- @Þ.<t!¡Jerué-
¡\@
ctact
aþ@
octttt@
RRNOLD COULEE DRM 51RRER CRPRCIlY
0.0 10.0 20.o I0.0 $.o fl.o dl.oRRER TN RCRES
T1s6 R86
7fJ.o æ.0 gll.0 lf[¡ .0
t^
+ - RRER
/r "///
I-1¿
EI¡0.0 1fD0 .0 Læo .o 1,m.0CRPRCTTY TN RCRE-FEET
0.0 æ/o.o $o.o d¡0.0 lm.o 1Em.0 2000.0

LONETREE TR I BUTRRY DRIIRRER CRPÊCIÏY
s24-T 156-RB6
ItÉ\¡I
cta
Rctñ¡
c¡¡!t.¡\c¡.\¡
J(l-l c¡=",.zàr-¡ ñlz.aFqäHJL¡
cta
alc¡o¡
c,a
@tnct(\¡
0.0 50.0 1f¡[¡.0 æg.o 25f¡.0 3fll.0150.0NRER TN NCRES
Iï
RRER{r
¿lr
//
II
500.0 750.0 1000.0CRPRCTTY TN RCRE-FEEÏ
0.0 250.0 1250.0 1500.0

LO'{ER LONETREE COULEE DRI1 S 12-T 1 56_R85RRER CRPRCTTY
c,a
tßt\
Itd@I
C'a
rJ)ctJ>g-Q
=úz.CJo¡-l IÊi8I¡- (o>¡dL¡JaL¡;
t\.O
C'a
r¡).ô30
au)lttto
0.0 10.0 20.9 30.0 10.0 50.0 60.0NREN tN NCRES
7g.o a¡.0 90.0 100.0 110.0
'tRRER+-
¡!r
/,r
/
1200-0 ¡500.0 1800.0 2100.0 2+æ.o zloo.g 5q¡0.0 351¡0.0CRPRCTTY TN RCRE-FEET
0.0 5fI¡.0 600.0 g)0.0

APPENDIX C
Preliminary Cost EstimateFor Potential Dams

TÀALE 12 - PRSLI!4TNÀRI COST ESTIüAÎE
Uppe.r Lowef,
Clearlng e Grubblng2,V7o/A(Jre
SÈ.rippinq e spreêdlng Topsoil59.26/ct
ExcavåtionsL.e7/c1
Enbånkmen,È91. OOICY
Tlater for Conrpactlon54"?2,/M GaL.
Pipe r24'r RCP 75/W*r30" RcP 95,/LF*r* 24í C!,tP 40.60/LF
Co¡rcrete285/CY
Reinf,orcinq Steel$. soll,B
Rock Riprap25lcv
Rock Ritr)rap trílter BeddingL.2/Cv
Seeding259.77 /Acre
Drawdôwn 16r DIP32.5A/\E
Su'btotal30* contingency'Adrr¡inise¡ation tEngineering
Totå1Land
zlç 5,42Q 2.5/S 6.77s 31$ 8,130 3/S 8n130
2,444/ç 635 2,300./ç 59g 4,060/ç 1'056 L7,4]9/ç 4,529
5,600/S LO,472 3,6A0/ç 6,882 5,600/$ LA,472 L6,32O/ç 30,518
44,92A/ç 44.92Q 43,.3L6/ç43,316 IOO,060,/S100.060 çt46,99O/s646,99O
764/S 3,606 74O/ç 3.493 r,7O0/ç 8,024 ro,999/i 51,873
*2OO/S 15,00O *25O/ç 18,750 *330,/$ 2:4,73O *515,/$ 38, 625
34.5/ç e,833 47/S ]-3.395 73/ç 20,8A5 L06/5,30,21O
3,450/ç !,725 4t7AAt/Ê 2,350 7,3OO/S 3,650 10,600,/5 5,300
60/S 1,500 60/ç tr,500 lt34o/ç 3,3,50o 6,200/9155,0OO
2a/ç 24o zo/i 24O 670/1 8,040 3.100,1S 37.200
5/ç L,299 5,/ç 7,299 L5,/$ 3,897 201ç 5,195
I
I 28,699l24,4OO
6,7OO
05299,650
g 29,85O129,5O0
9,500
$ 67,301291,00021,2QO
052o2
311
I 306,438L,321 ,899
2f3.7OO100
-c1-

TABLE 12 - PRELIMINARY COST ESTIMÀTE (CONT.)
Item/unit cos!
clearing e Gr'úbbing2,71O/Acte
Stripping & spreadinq ToPsoils0.26lcY
ExcavationçL .87 / cv
Embanlmentss I . 00,/cY
water for compaction54.72/t'L GaL-
Pipe r24" RCP 75/LPri30" RcP 95lLFùr* 24F CMP 40.60/r_r.
Concrete2e5/cY
Reinforcing steels.50,/LB
Fock Riprap25/cv
Rock Riprap Filter Bedding12/cv
Seed ing259 .77 / ^cre
Drawdown 16" DIP32 -6o/LF
subÈotal30È contingency'Adminístration tEngineering
TotalIandÎoTAL COSÎ
r/s 2,71o vç 2.7IO 6/S 16,260
6,O47/S r,572 6,94O/$ 1,84O 1,142/S 297 14,64r/S 3,807
e,28O/S L7,354 s,o4o/ç 9,425 2,27o/S 4,245 13,600/ç 25,432
97,068/S 97,06A r]-7,27O/Srr7,27O r0,309./s10,309 377.130/$377,13O
r,650/S 7,7a8 I,994/ç 9,4r2 175/ç 826 6,Atr/s 30,260
* 245/ç L8,375 '* 360/ç 34.200 ir*85/$ 5,451 tr425/S 40t375
s8ls 16, s30 77.5/ç 22,088 90/s 25,650
s,800/s 2,900 7.750/ç 3,875 9r000,/S 4r500
r,640/ç 4r,0oo 80/s 2,000 40,/S 1,000 2,660/S 66,500
e2o/ç 9,840 30/ç 360 Ls/ç 180 I,330,/S r5,960
rc/ç 2,598 Lo/$ 2,59A s/ç L,29e 20/ s 5, r.9s
25/S 1,31s 40/ç 2,LO4 20/ç t,os2 35/ç 1,84r
tlartlandouantltv/cost
65,7 15284 ,7 65
26,9OOs311,665
ÀrnoLdOuantitv,/cost
tonetree TrIbQuantity/cost
7,44L32,10050, 500
s82,600
Lo$rer LoneÈleeouantitv/CosÈ
183,890796, 800
92,5OOs889, 3oO
ç219,050 ç2O7 ,8A2 524,659 S612,910
62,3LA27O,2OO
34,000s304,200
t*t IncludeÊ cost for 24" cMP and $2'000 for an lnlet structure.
-c2-

APPENDIX D
Individual Dam Location Maps
AURELIA
54
ooNNYBROO|( ¡.3 rr.
22
27
aaaalrrlilh
-r..i \'-l23
Name: Aurelia DamLocation : 23-TI58N-R87I^ISp.illway Capacity: I90
acre-feet
--2J-(.¿\(.
)
J-I
26
rlI
L.t.ttIrl
55¡¡
.ttIa'It¡¡J
¡IttI
-Dl-

33 IName: FelLocation: 6vrSpillway capacity:/ 280 AF
...-...)
Name: Hartland. DamLocation: 16-Tl57N-R86WSpillway Capacity : 580
l6
ta=
----rræ-======ll
II
I--t-- - +---L
I)
(9t o
t5
I.n. / -'
I
/
)
t7
)
\ J + ¿
22
(-: Upper Flaten Damtion: l5-T157N-R86Vü
zo
¡¡¡IIII¡I¡III¡II¡¡!¡¡
(
42¡\¡IIIafIII
tT
IIIIllII¡¡IIIIIItI
-D2-V2il. TO HARTLAIIO
Spillway Capacity: 930 AF

I
2
I(
t2
S
t3
)
Name: LoweFlaten Dam
Location:'i
I
I
I
III
Iirht" t4
t_I
I
-D3-

CARPIO 5 MI.
aa
þz'-aa
-_e=
llttrlll-:-ærr=àa-
tì.,
="r.-"nn
Name: Arnold DamLocation : l-T156N-R86I\ISpillway Capacity: 1306 acre-fee
2
IUÞI í'--^
IIII
J
a--E
to
)(
(
,2I
,¡ItaI
__J_---¡-III /
BERTHOLO 2 MI.
-E---=A==== ==== ===-=:=======:

o
2e
33
J
4
tÍI
Itl
--t=---tt--E!-l
Name: Lonetree TrLocation: 34-Tl56N-R86I^ISpiIlway Capacity: 460 ?3å?=--
\--r -
3
2t
54
bu]- ?.taÊy
-
a-
/
-D5-
.-=.ll
FoxHoLm lfl.\ I
l
-J--I: Lol^rer ILonetree Dad
Location:
Iy'¡
IIIII¡IaIIIII
f=tt-r===tl- -I
I2_TL
21
56N-R85r^r !
spi l rwailCapac itj:
t? I0 elcre-feetr0
¡5
z2
IIItIIllIIIIt
)
¡l
.-.-å
l4 r3
.)--.--
t = = = = = 3 t -æ t t3!t_t M !'
I)1:'(
IIIIIIIII
23
r¡l¡lllt
-D6-

IIITIIIIIIIIIIIIITI