derivative securities fall 2011 lecture 2: forward markets
TRANSCRIPT

Derivative Securities Fall 2011 Lecture 2: Forward & Futures Markets
Sources:
Instructor’s notes, J.C. Hull , Chapters 2, 3 CME Group (www.cme.com) Energy Information Administration (www.eia.gov) Yahoo!Finance Bloomberg (www.bloomberg.com)

Contract for Forward Delivery (commodity, stocks, currencies)
• Example: Forward contract for N=1,000,000 shares of stock XYZ to be delivered in T=1 year, at price of K dollars per share
A (long) B (short)
shares
cash
• Short must hedge by buying the stock at the starting date 1. borrow to buy the stock (t=0) 2. collect dividends, if any (0<t<T) 3. exchange stock for stipulated price (t=T) 4. return loan + interest (t=T)
(at time T)
0 :for e'`fair valu
:shortfor sprofit/los
:collectsshort
:paysshort
,...,1 , dividends
interest loan ; share)(per loan value
rateinterest , at time pricestock
,0
1
0
0
1
0
1
1
0
00
T
rTN
i
i
rT
rTTTrN
i
i
rTTTrN
i
i
TTrN
i
i
rT
i
rT
t
FedSeK
eSedKK
eSedK
edK
eS
Nid
eSS
rtS
i
i
i
i
d d d d
K
rTeS0
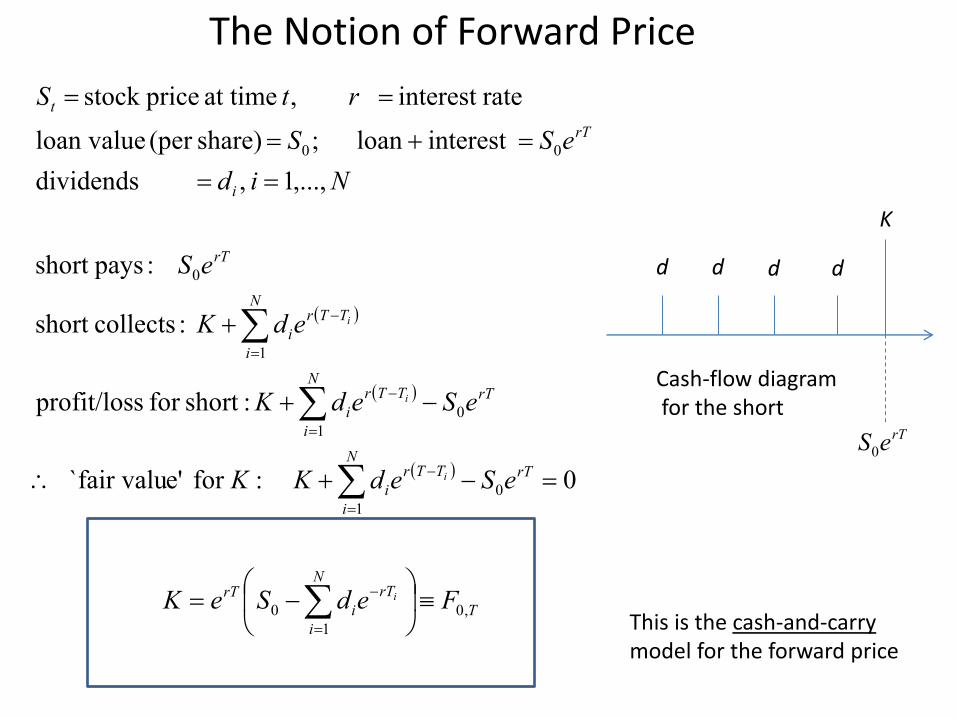
The Notion of Forward Price
Cash-flow diagram for the short
This is the cash-and-carry model for the forward price
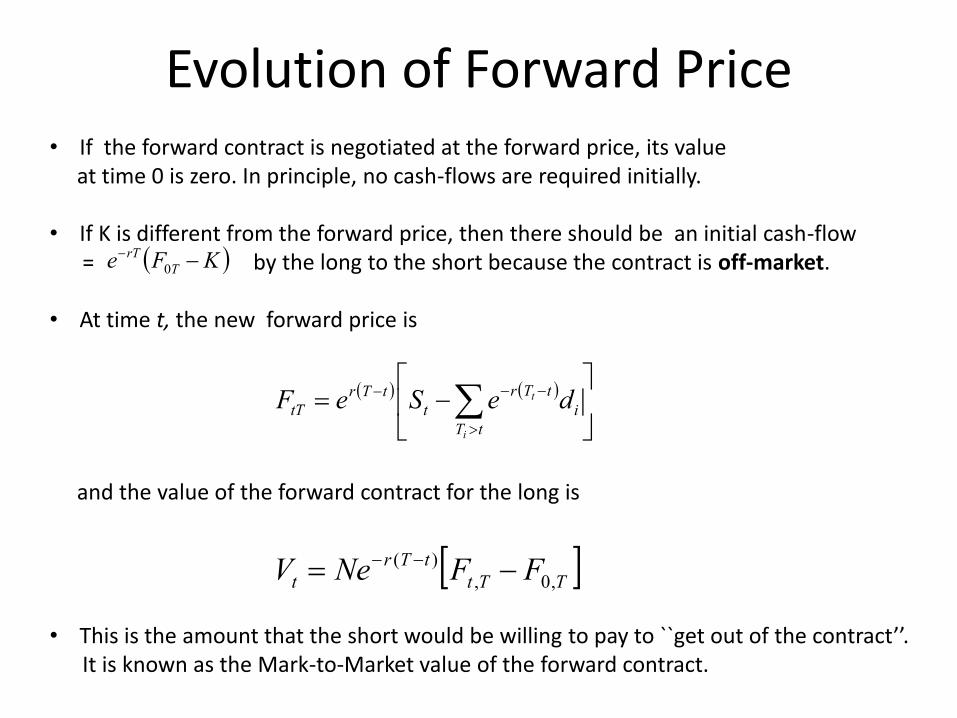
Evolution of Forward Price • If the forward contract is negotiated at the forward price, its value at time 0 is zero. In principle, no cash-flows are required initially. • If K is different from the forward price, then there should be an initial cash-flow = by the long to the short because the contract is off-market. • At time t, the new forward price is
and the value of the forward contract for the long is • This is the amount that the short would be willing to pay to ``get out of the contract’’. It is known as the Mark-to-Market value of the forward contract.
KFe T
rT
0
i
tT
tTr
t
tTr
tT deSeFi
t
TTt
tTr
t FFNeV ,0,
)(
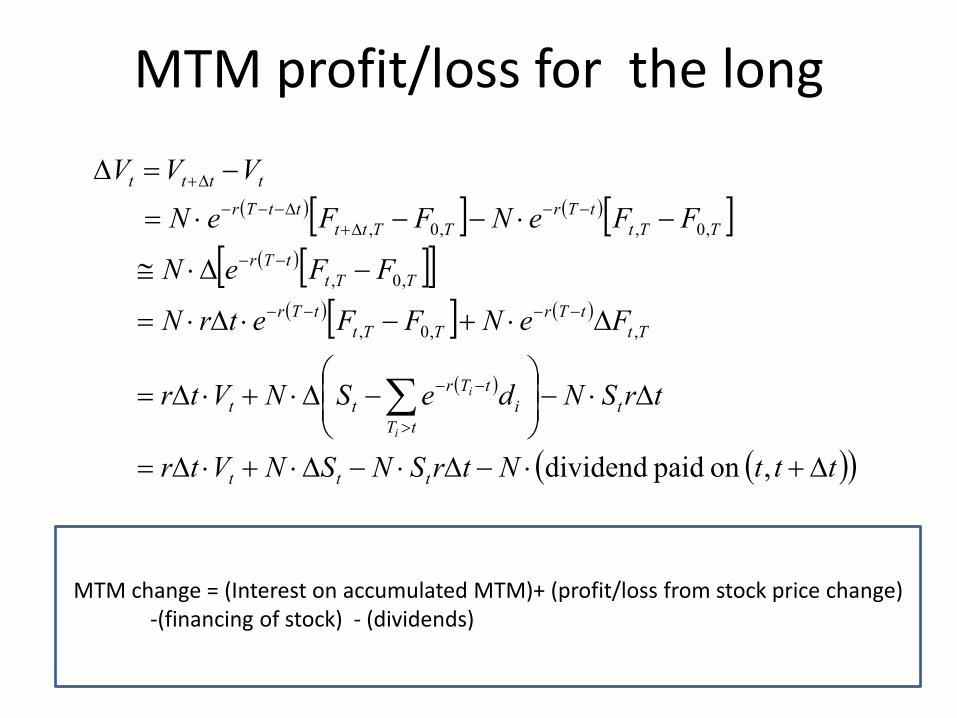
MTM profit/loss for the long
tttNtrSNSNVtr
trSNdeSNVtr
FeNFFetrN
FFeN
FFeNFFeN
VVV
ttt
t
tT
i
tTr
tt
Tt
tTr
TTt
tTr
TTt
tTr
TTt
tTr
TTtt
ttTr
tttt
i
i
,on paid dividend
,,0,
,0,
,0,,0,
MTM change = (Interest on accumulated MTM)+ (profit/loss from stock price change) -(financing of stock) - (dividends)

Total Return Swap
A (long) B (short)
Total return on stock or investment
interest
(at time T)
• Consider stock XYZ. The total return corresponds to the appreciation and dividends over the period of interest (including dividend reinvestment) • Hedge: borrow money to buy the stock, collect dividends, reinvest them, sell stock, pay loan. • A TRS is essentially a forward transaction in which the Long finances the asset purchase by the Short. Usually TRS are cash-settled, which makes sense.
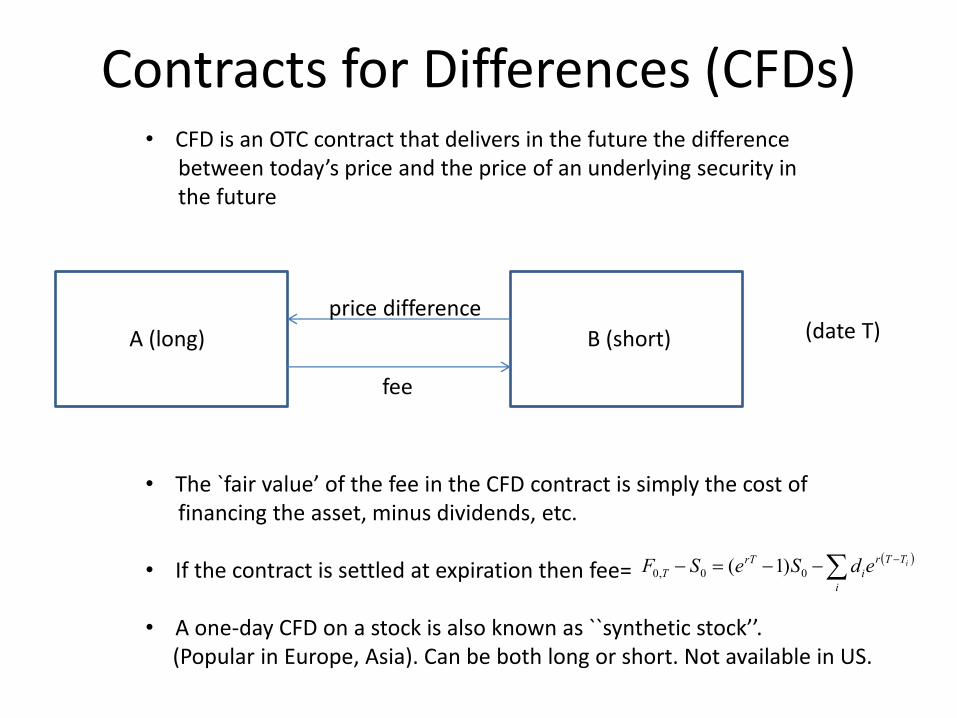
Contracts for Differences (CFDs) • CFD is an OTC contract that delivers in the future the difference between today’s price and the price of an underlying security in the future • The `fair value’ of the fee in the CFD contract is simply the cost of financing the asset, minus dividends, etc. • If the contract is settled at expiration then fee=
• A one-day CFD on a stock is also known as ``synthetic stock’’. (Popular in Europe, Asia). Can be both long or short. Not available in US.
A (long) B (short)
price difference
fee
i
TTr
i
rT
TiedSeSF 00,0 )1(
(date T)
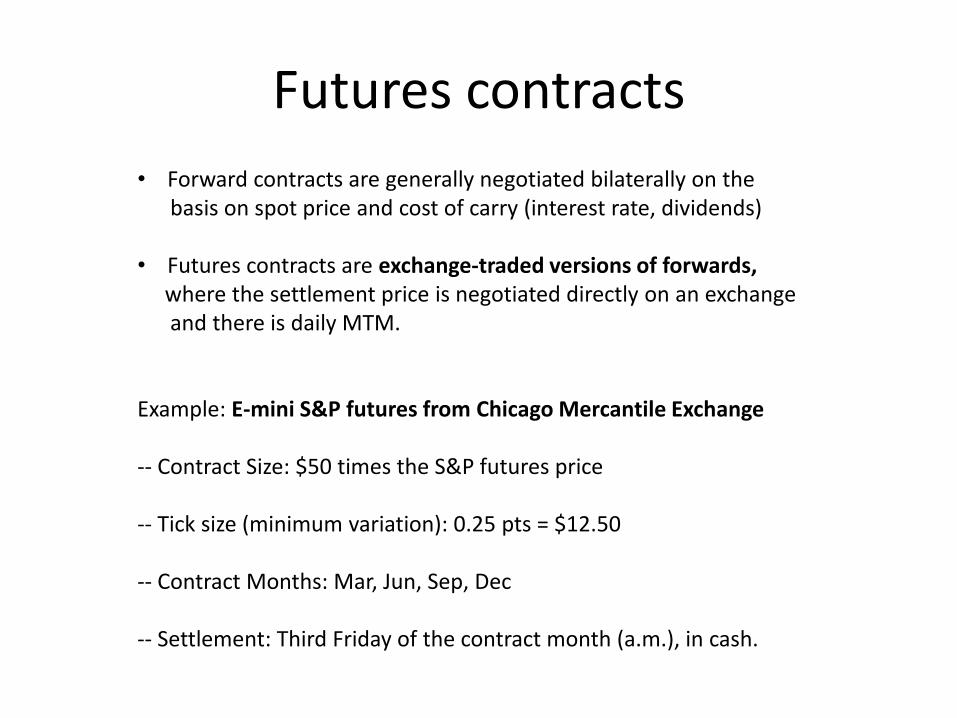
Futures contracts
• Forward contracts are generally negotiated bilaterally on the basis on spot price and cost of carry (interest rate, dividends) • Futures contracts are exchange-traded versions of forwards, where the settlement price is negotiated directly on an exchange and there is daily MTM. Example: E-mini S&P futures from Chicago Mercantile Exchange -- Contract Size: $50 times the S&P futures price -- Tick size (minimum variation): 0.25 pts = $12.50 -- Contract Months: Mar, Jun, Sep, Dec -- Settlement: Third Friday of the contract month (a.m.), in cash.

Schematic structure of a futures exchange
Long Traders
Short traders
Exchange
• In futures exchanges, the traders face the credit risk of the clearinghouse instead of the risk of individual counterparties. The CH collects margin and marks-to-market daily its member accounts.

CME E-mini S&P 500 contract (daily quotes)

E-mini S&P intraday chart
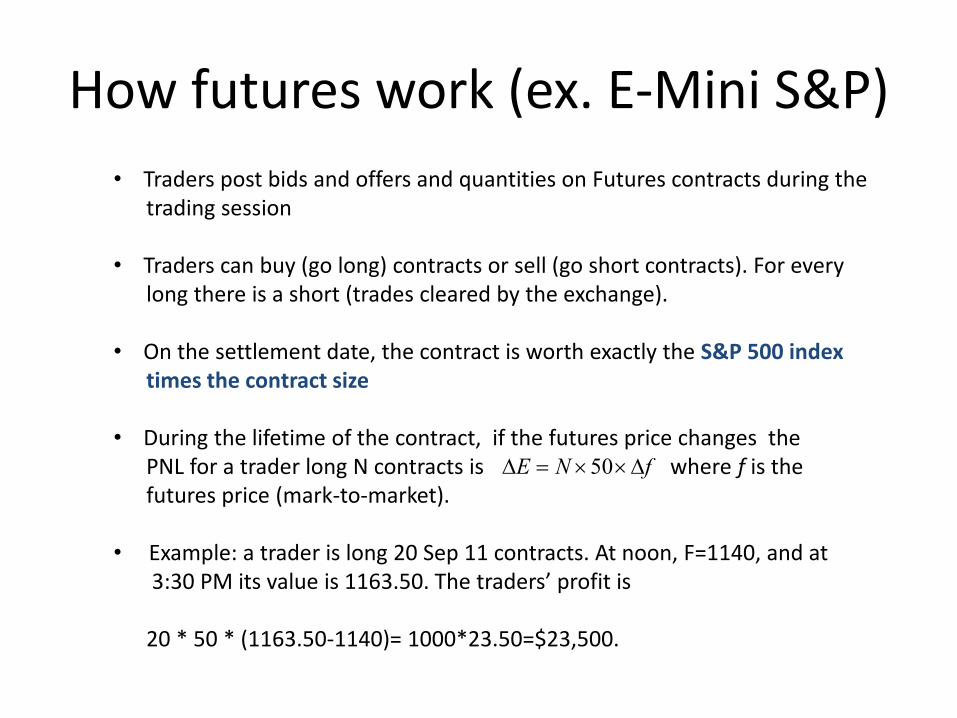
How futures work (ex. E-Mini S&P)
• Traders post bids and offers and quantities on Futures contracts during the trading session • Traders can buy (go long) contracts or sell (go short contracts). For every long there is a short (trades cleared by the exchange). • On the settlement date, the contract is worth exactly the S&P 500 index times the contract size • During the lifetime of the contract, if the futures price changes the PNL for a trader long N contracts is where f is the futures price (mark-to-market). • Example: a trader is long 20 Sep 11 contracts. At noon, F=1140, and at 3:30 PM its value is 1163.50. The traders’ profit is 20 * 50 * (1163.50-1140)= 1000*23.50=$23,500.
fNE 50
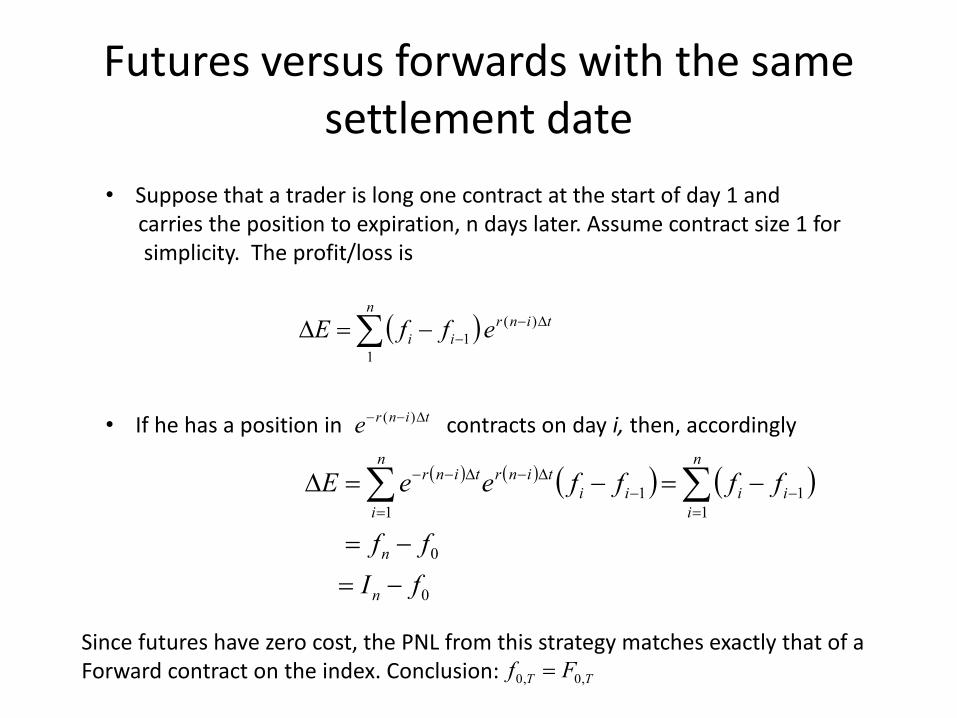
Futures versus forwards with the same settlement date
• Suppose that a trader is long one contract at the start of day 1 and carries the position to expiration, n days later. Assume contract size 1 for simplicity. The profit/loss is • If he has a position in contracts on day i, then, accordingly
tinrn
ii effE
)(
1
1
0
0
1
11
1
fI
ff
ffffeeE
n
n
n
i
iiii
tinrn
i
tinr
tinre )(
Since futures have zero cost, the PNL from this strategy matches exactly that of a Forward contract on the index. Conclusion: TT Ff ,0,0

Equivalence of Futures and Forwards
• The argument of the previous slide shows that if the funding rates are constant, then index futures satisfy • The same argument applies if interest rates can be ``locked in’’ in the future, i.e. if the interest rates for date i is • In particular, the futures markets provide an interesting relation between the spot price of the underlying index, the funding rate and the dividend flows pro vided by holding the index (cash & carry arbitrage). • They can be used to gain exposure to the underlying index or to arbitrage the carry costs.
TT Ff ,0,0
ir

Continuous Dividends • Equity indexes have a very frequent flow of small dividend payments
• Currencies have a ``dividend’’ corresponding to the foreign interest rate
• In these cases, it is convenient to model the dividends as a continuous dividend yield q: the dividend paid over one day is modeled as • A one-day investment in the basket underlying an equity index has total PnL (including financing for one day)
trItqII
tqI
Capital gain/loss Dividend income Financing cost
i
m
i
it SwI
1

Forward price and continuous dividends
• Invest in units of the underlying basket of stocks at time t, financing daily, and assuming zero initial equity. The PnL for any given day is Hence
)( tTqe
)(
)()(
t
tTrqtTr
t
t
tTrqtTrqtTq
t
ttt
tTq
tt
IeetrE
IeeetrE
trItqIIetrEE
0
)(
0
)(
)(
)(
IeIEEeE
IeeEe
IeetrEEe
IeetrEE
Trq
TT
rT
T
t
tTrqrT
t
rt
t
tTrqrT
tt
rt
t
tTrqtTr
tt
Final equity
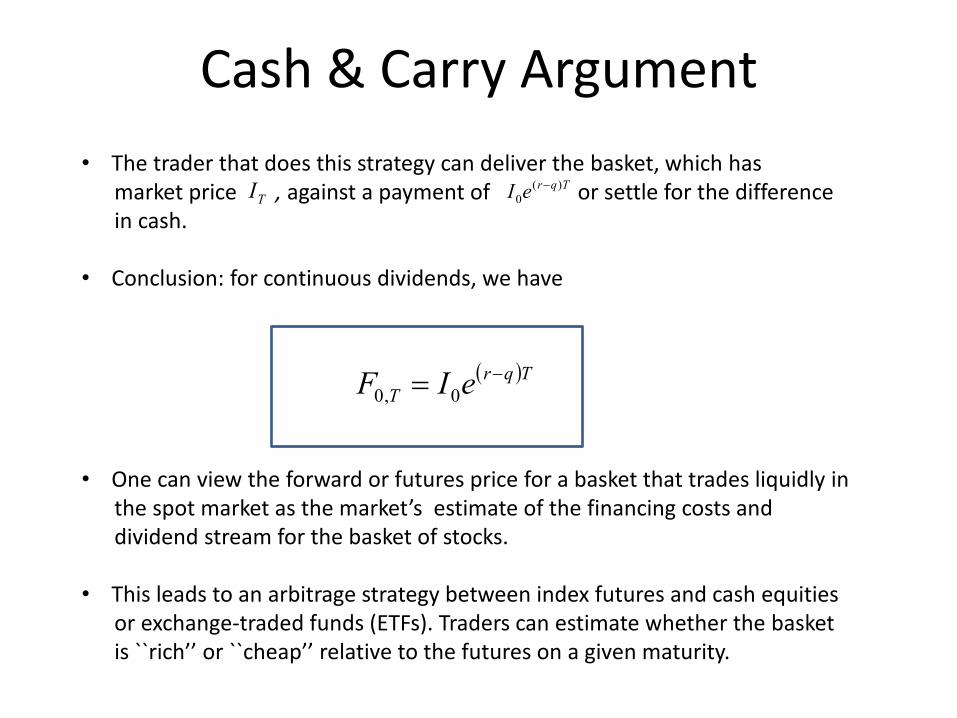
Cash & Carry Argument
• The trader that does this strategy can deliver the basket, which has market price , against a payment of or settle for the difference in cash. • Conclusion: for continuous dividends, we have
• One can view the forward or futures price for a basket that trades liquidly in the spot market as the market’s estimate of the financing costs and dividend stream for the basket of stocks. • This leads to an arbitrage strategy between index futures and cash equities or exchange-traded funds (ETFs). Traders can estimate whether the basket is ``rich’’ or ``cheap’’ relative to the futures on a given maturity.
TqreI )(
0
TqrT eIF 0,0
TI

Example • On Sep 13 2011, at 11:40 am, the December E Mini contract is trading at 1161.00. The index value is 1165.88. There are 68 trading days before settlement. Therefore • The dividend yield for the SPY ETF listed in Yahoo!Finance is 1.99%. If we take this as the reference yield, the E-mini futures is expensive and an arbitrage trade could be possible. (Must take into acct also bid/ask and other transaction costs. The ``profit’’ would be 1.99-1.67=0.32% (annualized). PNL for 68 days = 0.086 % or 8.6 basis points. (Not much…. ) • Futures are in line with the basket.
yield) dividend (implied %674.112.0554.1
Funds) (Fed %12.0
%554.10155442.088.1165
00.1161ln
68
252
q
r
qr

Currency Forwards & Futures • Currency trading (FX) can be viewed as investing in foreign overnight deposits and hence earn interest (which is like a continuous dividend) as well as currency appreciation depreciation • Usually, term rates are quoted in simply compounded terms.
• Example: Spot USD/BRL (Brazilian Real)=1.7135 (Bloomberg) Brazil 1 year rate= 10.94%, US 1 year rate =0.09%
ratespot ;
1
1,0
S
TR
TRSSeF
f
dTrr
Tfd
8999.10.526524
1
0.526524
902199.0583601.01094.01
0009.01
7135.1
1
/
1,0
/
1,0
USDBRL
BRLUSD
F
F
Rates are interbank rates (LIBOR, etc)

Currency Forward Curves • Quoting vs. the dollar, for simplicity (USD=domestic currency)
• If Rf>Rd then the forward is lower than the spot (downward sloping) Associated with positive carry
• If Rf<Rd then the forward is lower than the spot (upward sloping) Associated with negative carry
T
F
Spot
Foreign interest rate > Domestic Interest rate: Forward is cheaper than spot
CME FX Futures (Example EUR/USD)
• Contract size: USD 125,000
• Month listings: Six months in the March quarterly cycle (Mar, Jun, Sep, Dec) • Minimum price increment = $ 0.0001 per contract ($12.50/contract) • Last trade: 9:16 AM (CT), second business day before the 3rd Wednesday of the contract month (usually Monday)

Dec 2011 Euro-Globex Futures
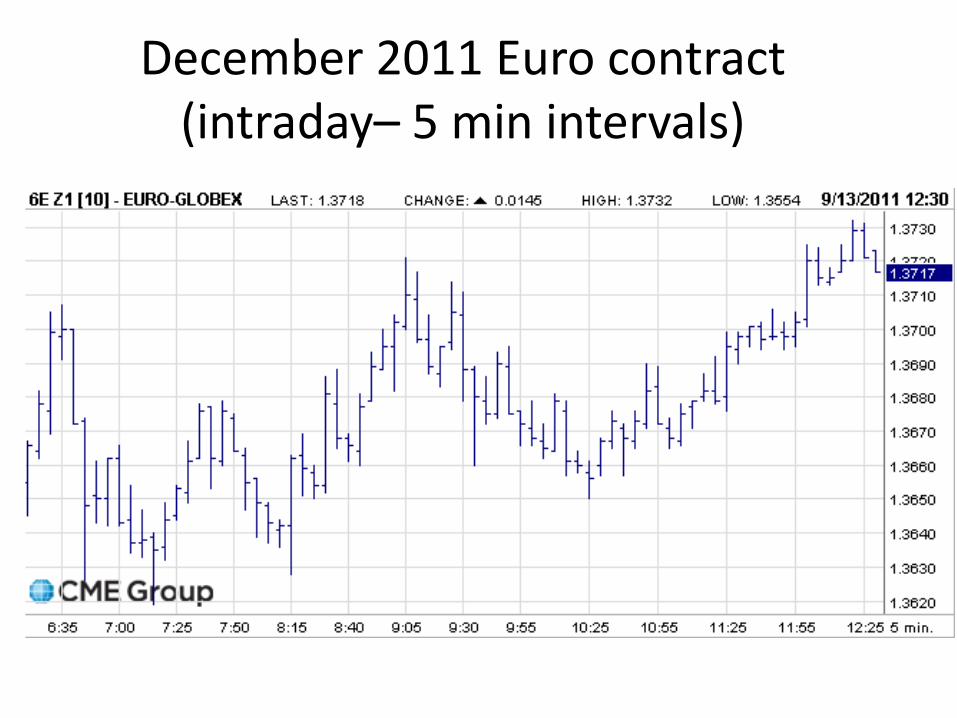
December 2011 Euro contract (intraday– 5 min intervals)
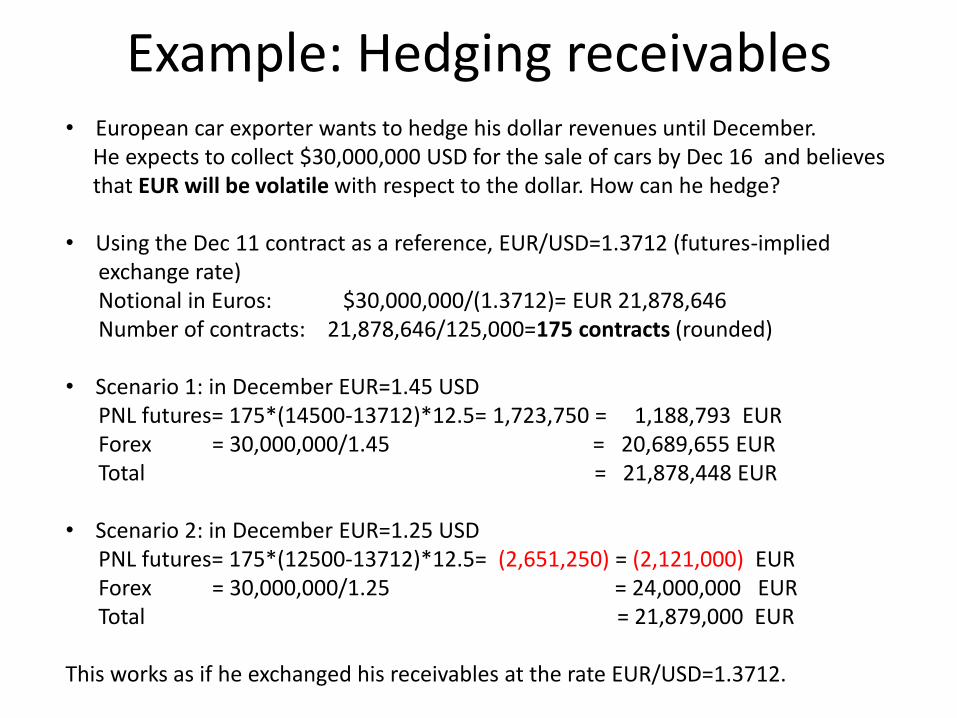
Example: Hedging receivables • European car exporter wants to hedge his dollar revenues until December. He expects to collect $30,000,000 USD for the sale of cars by Dec 16 and believes that EUR will be volatile with respect to the dollar. How can he hedge? • Using the Dec 11 contract as a reference, EUR/USD=1.3712 (futures-implied exchange rate) Notional in Euros: $30,000,000/(1.3712)= EUR 21,878,646 Number of contracts: 21,878,646/125,000=175 contracts (rounded) • Scenario 1: in December EUR=1.45 USD PNL futures= 175*(14500-13712)*12.5= 1,723,750 = 1,188,793 EUR Forex = 30,000,000/1.45 = 20,689,655 EUR Total = 21,878,448 EUR • Scenario 2: in December EUR=1.25 USD PNL futures= 175*(12500-13712)*12.5= (2,651,250) = (2,121,000) EUR Forex = 30,000,000/1.25 = 24,000,000 EUR Total = 21,879,000 EUR This works as if he exchanged his receivables at the rate EUR/USD=1.3712.

Eurodollar Futures (Interest Rates)
• Underlying instrument: Eurodollar time deposit with 3 months maturity Notional Amount $ 1,000,000 • Eurodollar deposits are bank deposits which are outside the jurisdiction of the Fed (not FDIC insured) offered by major international banks. • Price quote = 100-3mLIBOR on a 360 day year. 1bp move in 3mLIBOR corresponds to $25 move in the contract • Tick size: 0.0025%= $6.25 per contract for nearest month; 0.0050% per contract for all other months ($12.50/contract) • Contract months: Mar, Jun, Sep, Dec extending for 10 years, plus first 4 months • Settlement price = 100 – 3m LIBOR
• Last trading = 11AM London time, of the second trading day before the third Wednesday of the month
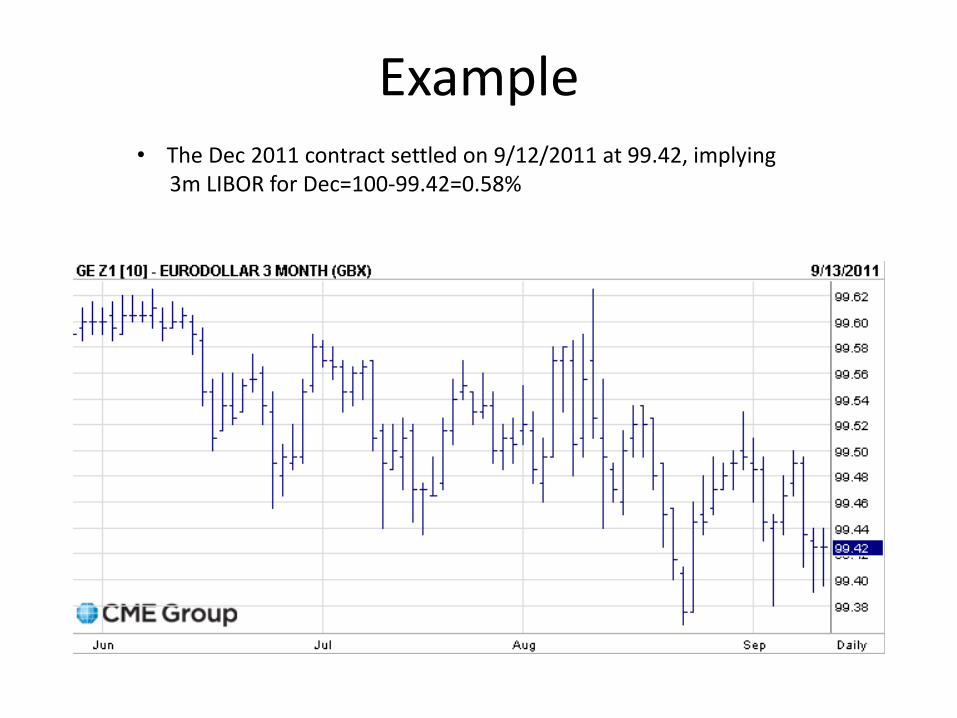
Example • The Dec 2011 contract settled on 9/12/2011 at 99.42, implying 3m LIBOR for Dec=100-99.42=0.58%

Forward rate agreements
• A Forward Rate Agreement is an OTC contract to enter into a term loan in the future at a pre-established interest rate • ED Futures can be used to hedge positions in FRAs and to determine the ``fair value’’ of a FRA
T0: trade date T1: settlement date T2: maturity date

Cash & carry with interest rate futures
• The cost calculation of the cash & carry trade that we described for indices and currencies is modified for ED futures because the financing is correlated with the settlement LIBOR rate, so we must take into account the impact on the cash and carry strategy as rates change • PNL is the forward value of all intermediate cash-flows from futures position
0 1 2 n
011 fff 2f 3f ................................ 4f

Reinvesting the cash-flows at the going rate that day
0 1 2 n
011 fff 2f 3f ................................ 4f
• Each cash-flow is invested at the LIBOR term rate at the end of the trading period
• The question is how this change in the reinvestment rate affect the final outcome.
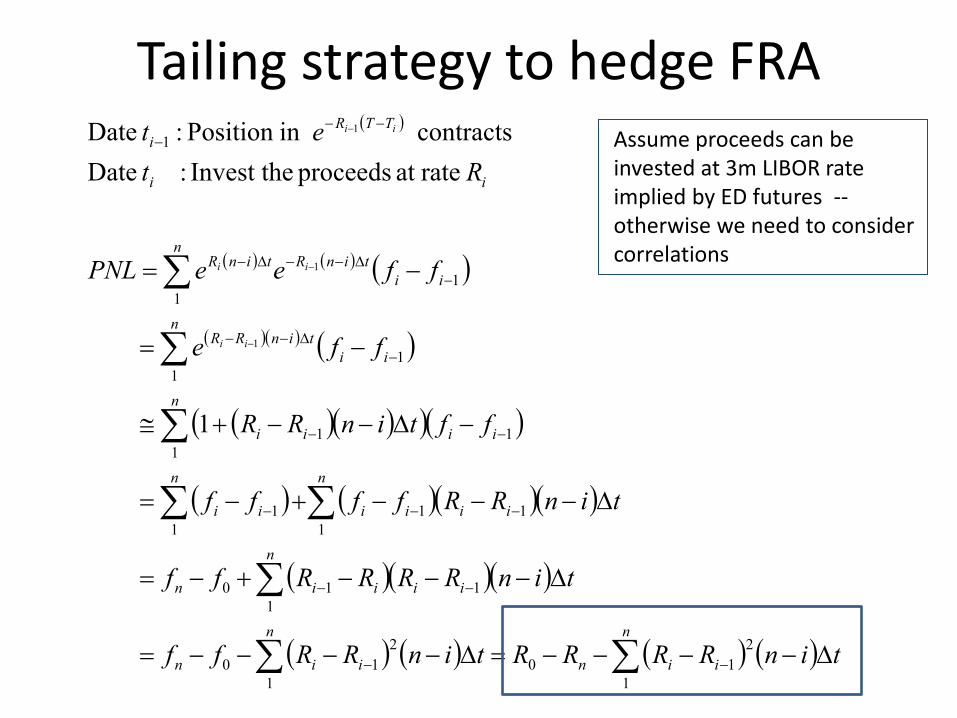
Tailing strategy to hedge FRA
n
iin
n
iin
n
iiiin
n
iiii
n
ii
ii
n
ii
ii
ntinRR
ii
ntinRtinR
ii
TTR
i
tinRRRRtinRRff
tinRRRRff
tinRRffff
fftinRR
ffe
ffeePNL
Rt
et
ii
ii
ii
1
2
10
1
2
10
1
110
1
11
1
1
1
1
1
1
1
1
1
1
1
rateat proceeds Invest the : Date
contracts in Position : Date
1
1
1
Assume proceeds can be invested at 3m LIBOR rate implied by ED futures -- otherwise we need to consider correlations
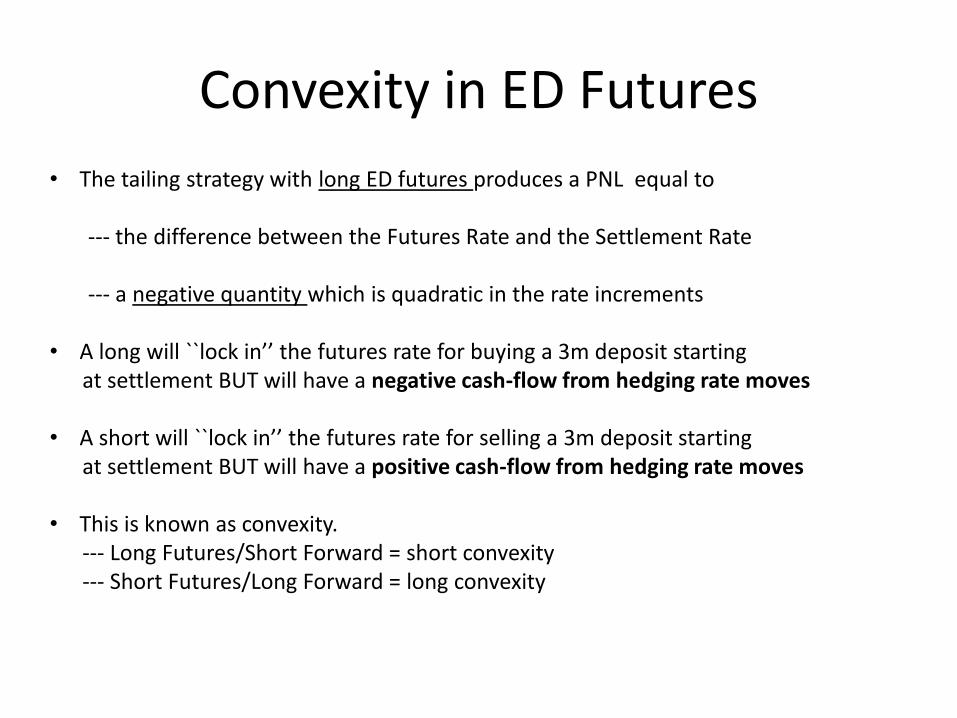
Convexity in ED Futures
• The tailing strategy with long ED futures produces a PNL equal to --- the difference between the Futures Rate and the Settlement Rate --- a negative quantity which is quadratic in the rate increments • A long will ``lock in’’ the futures rate for buying a 3m deposit starting at settlement BUT will have a negative cash-flow from hedging rate moves • A short will ``lock in’’ the futures rate for selling a 3m deposit starting at settlement BUT will have a positive cash-flow from hedging rate moves • This is known as convexity. --- Long Futures/Short Forward = short convexity --- Short Futures/Long Forward = long convexity

FRAs and Convexity Adjustment to Futures
• The previous argument shows that the rate the long ``locks in’’ should be lower (cheaper) than the futures implied rate to compensate for negative convexity: • How much cheaper? We approximate the error term by its ``expected value’’, as follows:
FuturesForward RR
22
0
2
1
2
1
2
1
2
1
22
1
2
1
2
1
)(
T
dttTtTT
tinttinRR
tRRERR
Tn
i
i
n
i
n
i
ii
iiii

Forward Rates Implied by ED Futures
22
2
1TRR futuresforward
• In practice, the constant in front of the variance may be modified to account for imperfect correlations between the funding rate and the futures-implied LIBOR rate. • The dependence is quadratic in time, which means that the adjustment is negligible for short maturities and increases with maturity • In the US, ED futures are often used to estimate Forward rates for periods < 5 years, taking into account convexity adjustments. • This is useful for building interest swap curves, forward rate curves, for OTC trading
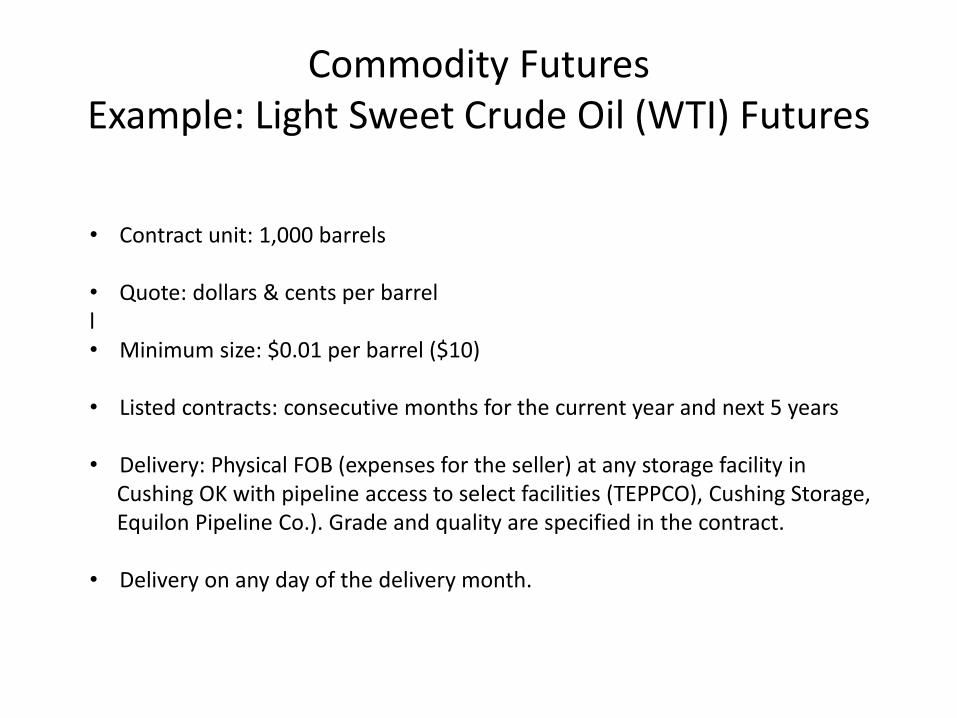
Commodity Futures Example: Light Sweet Crude Oil (WTI) Futures
• Contract unit: 1,000 barrels • Quote: dollars & cents per barrel l • Minimum size: $0.01 per barrel ($10)
• Listed contracts: consecutive months for the current year and next 5 years • Delivery: Physical FOB (expenses for the seller) at any storage facility in Cushing OK with pipeline access to select facilities (TEPPCO), Cushing Storage, Equilon Pipeline Co.). Grade and quality are specified in the contract. • Delivery on any day of the delivery month.
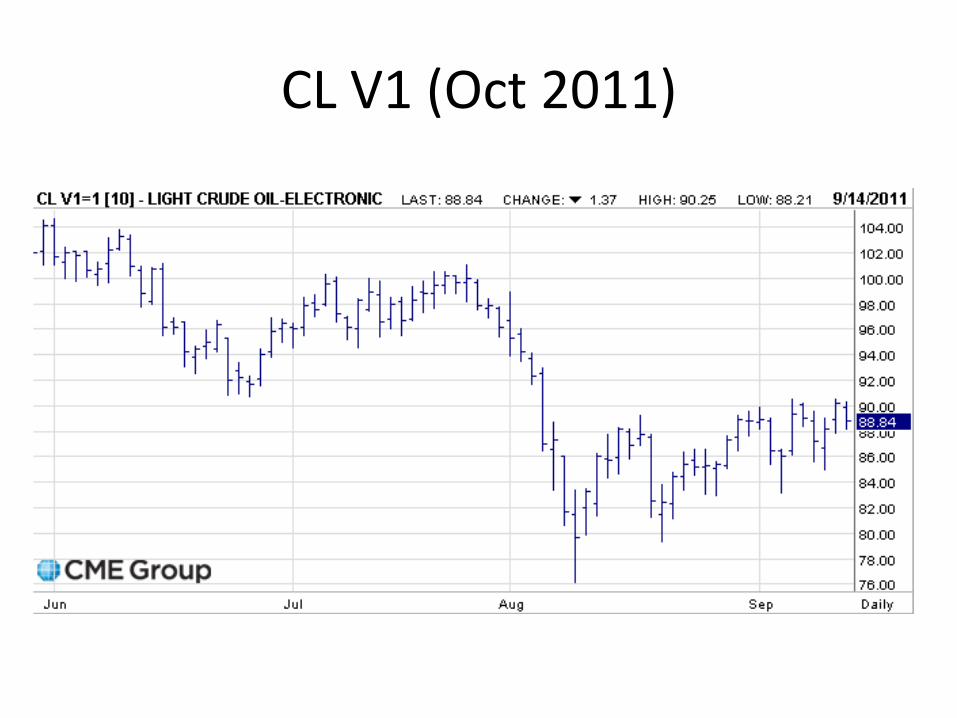
CL V1 (Oct 2011)

CL X1 (Nov 11)

CL M2 (June 2012)
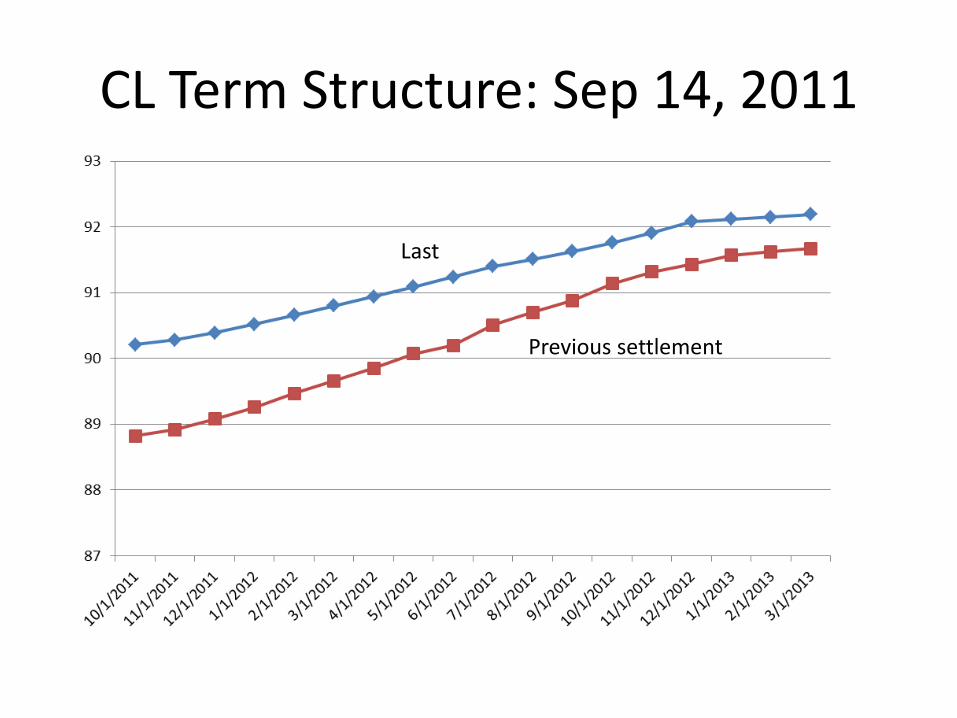
CL Term Structure: Sep 14, 2011
Last
Previous settlement

Theoretical Pricing • No basis between futures and forwards, since commodity is not correlated to funding rate • Cash & carry costs include transportation and storage and ``convenience’’
of having oil to be able to deliver it and replace it later
• The shape of the forward curve depends on the supply/demand of oil on the ground and forecasts thereof.
Tqr
T eSF
S
r
q
)(
0,0
0
'``spot'
rate term
costs) (storage - ation)(transport - yield) ce(convenien
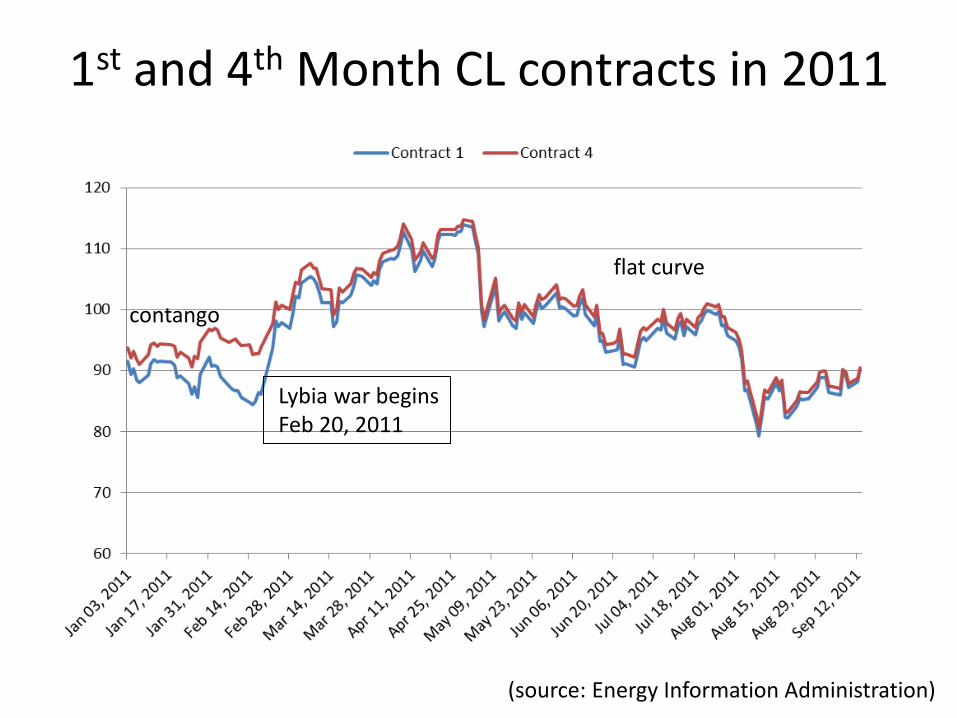
1st and 4th Month CL contracts in 2011
contango
(source: Energy Information Administration)
Lybia war begins Feb 20, 2011
flat curve

CL1 and CL4 around the Kuweit war (1990)
contango
backwardation
Irak invades Kuweit August 20, 1990
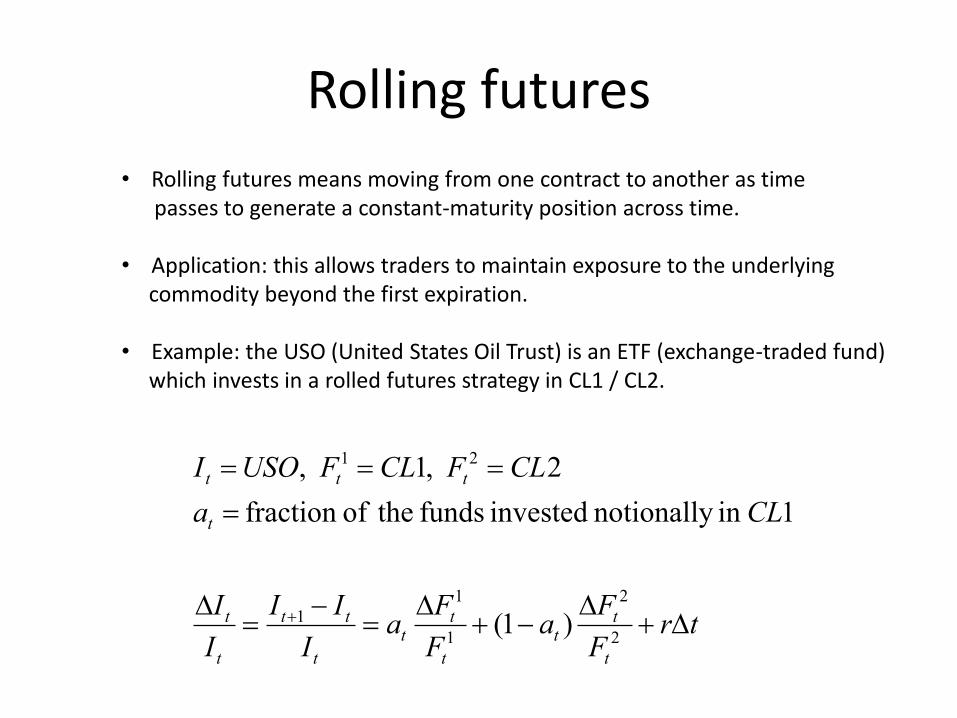
Rolling futures
• Rolling futures means moving from one contract to another as time passes to generate a constant-maturity position across time. • Application: this allows traders to maintain exposure to the underlying commodity beyond the first expiration. • Example: the USO (United States Oil Trust) is an ETF (exchange-traded fund) which invests in a rolled futures strategy in CL1 / CL2.
trF
Fa
F
Fa
I
II
I
I
CLa
CLFCLFUSOI
t
tt
t
tt
t
tt
t
t
t
ttt
2
2
1
1
1
21
)1(
1in notionally invested funds theoffraction
2 ,1 ,
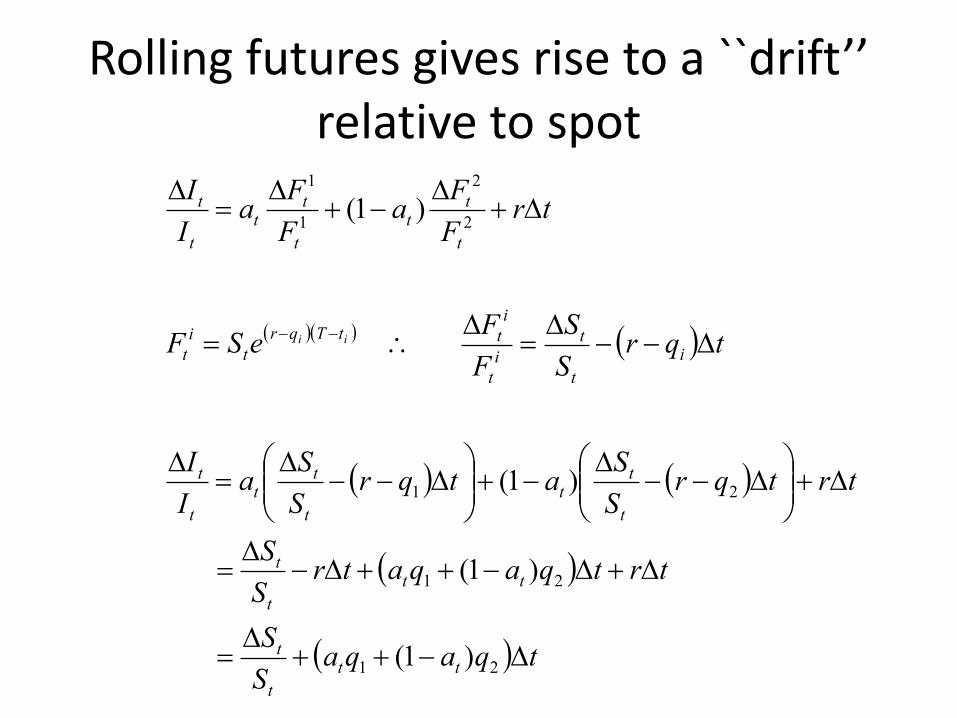
Rolling futures gives rise to a ``drift’’ relative to spot
tqaqaS
S
trtqaqatrS
S
trtqrS
Satqr
S
Sa
I
I
tqrS
S
F
FeSF
trF
Fa
F
Fa
I
I
tt
t
t
tt
t
t
t
tt
t
tt
t
t
i
t
t
i
t
i
ttTqr
t
i
t
t
tt
t
tt
t
t
ii
21
21
21
2
2
1
1
)1(
)1(
)1(
)1(

Slope, drift and the performance of rolled strategies
• If q < 0 – i.e., low convenience yield, high storage costs, contango situation the rolled future strategy under-performs the commodity • If q>0 -- i.e. high convenience yield, storage costs are low compared to the demand for crude, the rolled strategy outperforms crude • Conclusion: rolled futures funds like USO should underperform the commodity in times when there is contango (upward sloping futures curve)

USO Fund vs Spot WTI

Implied r-q from ratio between CL4 and CL1
backwardation
Super- contango
contango