depression and anxiety symptoms in type 2 diabetes ...€¦ · stephanie rose whitworth . bachelor...
TRANSCRIPT

Depression and Anxiety Symptoms in Type 2
Diabetes Mellitus: A Matter of Time?
Stephanie Rose Whitworth
Bachelor of Arts (Psychology), First Class Hons
This thesis is presented in total fulfillment of the requirements for the degree of Doctor
of Philosophy and in partial fulfillment of the requirements for the degree of Master of
Psychology (Clinical) of the University of Western Australia
School of Psychological Science
2017


Thesis Declaration
I, Stephanie Rose Whitworth, certify that:
This thesis has been substantially accomplished during enrolment in the degree.
This thesis does not contain material which has been accepted for the award of any other degree or diploma in my name, in any university or other tertiary institution.
No part of this work will, in the future, be used in a submission in my name, for any other degree or diploma in any university or other tertiary institution without the prior approval of The University of Western Australia and where applicable, any partner institution responsible for the joint-award of this degree.
This thesis does not contain any material previously published or written by another person, except where due reference has been made in the text.
The work(s) are not in any way a violation or infringement of any copyright, trademark, patent, or other rights whatsoever of any person.
The research involving human data reported in this thesis was assessed and approved by The University of Western Australia Human Research Ethics Committee Approval # RA/4/1/5798 and the South Metropolitan Area Health Service Ethics Committee Approval # 07/397.
Written patient consent has been received and archived for the research involving patient data reported in this thesis.
The work described in this thesis was funded by the National Health and Medical Research Council Project Grant 513781 and APP1042231.
This thesis contains published work and/or work prepared for publication, some of which has been co-authored.
Signature:
Date: 24th April 2017

Abstract
Depression is the most widely studied psychological comorbidity for individuals
with type 2 diabetes mellitus (T2DM) and confers significant burden to both the
individual and healthcare system. Depression is implicated both in the risk of developing
diabetes, and also as a risk factor for difficulties with diabetes self-management and
glycaemic control. While research in this area is limited, evidence also suggests that
anxiety frequently presents in this population and may affect disease outcomes.
However, while T2DM is a chronic condition, the interrelationships between mood and
diabetes management over time and implications for intervention remain to be clarified.
The overarching aim of this thesis was to delineate the longitudinal
developmental pathways by which Major Depressive Disorder and Generalized Anxiety
Disorder, separately and combined, impact on diabetes self-management, glycaemic
control, and chronic health complications. This thesis adopted novel measures of
lifetime depression and anxiety disorders to ascertain the association between long-
standing psychological issues and diabetes-related outcomes. This thesis also aimed to
clarify what qualifies as clinically meaningful psychological symptomatology in
diabetes research. Thus, investigation of the associations between the severity of
depression and anxiety symptoms over time, and implications for health-related
outcomes, is a prominent theme of this thesis.
Study 1 (Chapter 2) explored the cross-sectional associations between a lifetime
history of major depression and generalized anxiety disorder, and engagement in
diabetes management and control. In a large cohort study of individuals with clinically

diagnosed T2DM, mediation models revealed a lifetime history of both disorders to be
strong predictors of adverse outcome. Lifetime depression, by increasing the severity of
current depression symptoms, emerged as an indirect predictor of current smoking,
higher body mass index, less frequent blood glucose self-monitoring and worse
glycaemic control. The most important finding was that, when co-occurring, a history of
both depression and anxiety were indirectly related to the poorest disease management.
This published study suggests that the chronicity and overlap of depression and anxiety
symptoms may be of particular clinical relevance in diabetes.
Chapters 4 and 5 investigated the development and course of depression and
anxiety symptoms in the same sample. Missingness emerged as a problem for
interpretation of the longitudinal depression data. To address this, longitudinal missing
data modeling was applied, and is presented in detail in Chapter 3. The identified model
that best incorporated missingness in Chapter 3 was then adapted and used in Chapter 4.
Study 2 (Chapter 4) investigated the developmental course of depression
symptoms over a 5-year period, and explored inter-relationships between depression
symptoms and indices of diabetes management over time. Two sub-groups of
individuals were identified who displayed a pattern of cycling and persistent depression
symptoms, which cycled above and below cut-offs for clinically relevant depression but
did not fully remit. Persistent-depression group members were more likely to be female,
have higher body mass index, and a lifetime history of major depression. Persistent
depression symptoms were not associated with the degree of change in BMI, blood-
glucose self-monitoring, or HbA1c. This published study indicated that taking a broader
developmental perspective to the assessment of depression, might better capture the
underlying persistence in these symptoms; something not typically screened for in
diabetes care.
Study 3 (Chapter 5) extended these findings by examining the course of
generalized anxiety symptoms over a 4-year period. Similarly, a sub-group of
individuals were identified who experienced elevated, but gradually improving anxiety
symptoms. Risk factors for membership to the elevated-anxiety group included lifetime
anxiety and depression, more macrovascular complications, insulin use and
hyperglycaemia. Supporting the results of Study 1, the most noteworthy finding was that
there was a substantial overlap between depression and anxiety symptoms
longitudinally. Two-thirds of those in the elevated anxiety group were also found to
experience persistent depression symptoms, and this group displayed a more severe
pattern of anxiety. This study highlighted the clinical importance of considering the
development of, and interaction between, symptoms of both depression and anxiety in
this population.
Chapter 6 concludes this thesis with a discussion of the key themes emerging
from these studies, clinical implications, and future directions for psychosocial type 2
diabetes research. Taken together, the results indicate that screening for lifetime and
current depression and anxiety symptoms in diabetes may facilitate more targeted
psychological management and improved health outcomes.


Dedication
I dedicate this thesis to my Dad, the true storyteller. I took your advice and
remembered to breathe. I know these words would make you proud.

xi
Table of Contents Thesis Declaration .............................................................................................. iii
Abstract ................................................................................................................ v
List of Tables .................................................................................................... xvi
List of Figures ................................................................................................. xviii
List of Abbreviations ....................................................................................... xix
Acknowledgements ........................................................................................... xxi
Authorship Declaration: Co-Authored Publications .................................. xxiv
Chapter 1: General Introduction ....................................................................... 1
Adult T2DM: prevalence and healthcare implications ............................. 1
Depression in T2DM ................................................................................. 4
Anxiety in T2DM ...................................................................................... 6
Depression, anxiety and diabetes: developmental considerations ............ 9
Depression, anxiety and diabetes: a bidirectional relationship ............... 10
The course of depression and anxiety in T2DM ..................................... 12
Depression, anxiety and diabetes management over time ...................... 13
Limitations of current developmental perspectives ................................ 14
Summary and contents of chapters ......................................................... 17
Chapter 2: Lifetime Depression and Anxiety Increase Prevalent
Psychological Symptoms and Worsen Glycemic Control in Type 2
Diabetes .................................................................................................. 21
Preface ................................................................................................................ 21
xii
Abstract ......................................................................................................... 22
Introduction ................................................................................................... 24
Materials and Methods .................................................................................. 26
Study participants .................................................................................... 26
Study procedures ..................................................................................... 27
Assessment of depression and anxiety .................................................... 27
Statistical analysis ................................................................................... 30
Results ........................................................................................................... 32
Overall prevalence of depression and anxiety ......................................... 32
Impact of lifetime depression and/or anxiety on current mood symptoms
..................................................................................................... 33
Impact of lifetime depression and/or anxiety on diabetes behaviours and
control .......................................................................................... 37
Discussion ..................................................................................................... 40
Chapter 3: Dealing with Missing Data in Longitudinal Analysis ................. 45
Preface ................................................................................................................ 45
Types of missing data .............................................................................. 46
Data collection and study procedures ...................................................... 47
Missing Values Analysis ............................................................................... 47
Item-level missing values analysis .......................................................... 48
Scale-level missing values analysis ......................................................... 48
Longitudinal methods for modeling missing data ................................... 49
xiii
Application of NMAR modeling approaches to PHQ-9 data ....................... 52
Statistical analyses .................................................................................. 52
Results ..................................................................................................... 53
Discussion ..................................................................................................... 61
Longitudinal modeling approaches to missingness: strengths and
difficulties ................................................................................... 61
Methodological implications ................................................................... 62
Chapter 4: Depression Symptoms Are Persistent In Type 2 Diabetes: Risk
Factors And Outcomes Of 5-Year Depression Trajectories Using
Latent Class Growth Analysis. ............................................................ 65
Preface ................................................................................................................ 65
Abstract ......................................................................................................... 66
Introduction ................................................................................................... 68
Subjects and methods .................................................................................... 69
Study sample ........................................................................................... 69
Study procedures ..................................................................................... 69
Depression assessment ............................................................................ 70
Statistical analysis ................................................................................... 71
Results ........................................................................................................... 73
Depression trajectories ............................................................................ 74
Baseline characteristics associated with depression groups.................... 78
Associations between depression group and diabetes management ....... 81

xiv
Discussion ..................................................................................................... 83
Chapter 5: Anxiety in Type 2 Diabetes: Risk Factors and Outcomes of 4-
Year Anxiety Symptom Trajectories Using Latent Growth Mixture
Modeling. ................................................................................................ 89
Preface ................................................................................................................ 89
Abstract ......................................................................................................... 91
Introduction ................................................................................................... 93
Research Design and Methods ...................................................................... 95
Study sample ........................................................................................... 95
Study procedures ..................................................................................... 95
Mood assessment ..................................................................................... 96
Statistical analysis ................................................................................... 97
Results ........................................................................................................... 99
Anxiety trajectories ............................................................................... 100
Baseline predictors of anxiety groups ................................................... 103
Outcomes of anxiety groups .................................................................. 106
Overlap between anxiety and depression groups .................................. 106
Conclusions ................................................................................................. 109
Chapter 6: General Discussion ....................................................................... 115
Preface .............................................................................................................. 115
Overview of study findings ................................................................... 115
Understanding the course of depression and anxiety in T2DM ............ 117

xv
The depression-anxiety comorbidity in T2DM: implications for
conceptualization and measurement ......................................... 119
Implications for the strength of developmental interrelationships between
mood and T2DM ....................................................................... 121
Clinical implications ............................................................................. 124
Future directions.................................................................................... 130
Concluding statements .......................................................................... 134
References ........................................................................................................ 137
Appendix A: Table A1 ........................................................................................ 0
Appendix B: Table B1 ......................................................................................... 2
Appendix C: Table C1 ........................................................................................ 3
Appendix D: ROC Curve Analysis .................................................................... 4
Appendix E: Conference Presentations ............................................................ 8
xvi
List of Tables Table 1. Demographic, clinical and mood characteristics by lifetime history of
depression and anxiety (N = 1335) .......................................................................... 35
Table 2. Indirect mediation models testing the direct (path c’) and indirect (path ab)
effect of lifetime depression and anxiety on diabetes management/control, via the
severity of current mood symptoms. Data are presented as regression coefficients
(B; 95% confidence interval) ................................................................................... 38
Table 3. LCGA fit statistics for PHQ-9 quadratic missing at random (MAR) model with
1-4 classes................................................................................................................. 55
Table 4. LCGA fit statistics for PHQ-9 quadratic pattern mixture model (PMM) with 2-4
classes ....................................................................................................................... 56
Table 5. LCGA fit statistics for PHQ-9 quadratic Roy-pattern mixture model (Roy-
PMM) with 2-4 classes ............................................................................................. 57
Table 6. LCGA fit statistics for PHQ-9 quadratic MAR, PMM and Roy-PMM 3-class
preferred models ....................................................................................................... 59
Table 7. Single growth curve model building for PHQ-9 severity scores (N = 1201)..... 75
Table 8. LCGA fit statistics for the PHQ9 latent class quadratic growth model (N =
1201) ......................................................................................................................... 76
Table 9. Baseline characteristics among 1,201 people with Type 2 DM, stratified by
depression group. Data are presented as proportions, means±standard deviations, or
medians [interquartile range].................................................................................... 79
xvii
Table 10. Individual models of BMI, HbA1c and SMBG as longitudinal correlates of
persistent-depression group and lifetime MDD ....................................................... 82
Table 11. LGMM fit statistics for GADS unconditional latent linear growth model (N =
1091) ...................................................................................................................... 102
Table 12. Bivariate logistic regression models examining baseline predictors of anxiety
group membership among 1,091 people with type 2 diabetes ............................... 104
Table A1. Non-significant indirect mediation models testing the direct (path c’) and
indirect (path ab) effect of lifetime anxiety on diabetes management/control, via the
severity of current mood symptoms. Data are presented as regression coefficients
(B; 95% confidence interval) ..................................................................................... 0
Table B1. Single growth curve model building for BMI, HbA1c, and self-monitoring of
blood glucose at Year 0, 2 and 4 ................................................................................ 2
Table C1. Single growth curve model building for GADS severity scores (N = 1091) .... 3
Table D1. ROC Curve Analysis to determine the optimal GADS clinical cut-off score .. 6

xviii
List of Figures
Figure 1. Representation of the overlap in prevalence of current (a) and lifetime (b)
MDD and GAD. ....................................................................................................... 34
Figure 2. Mean, estimated PHQ-9 total scores for the preferred 3-class quadratic LCGA
models for a) MAR, b) PMM, and c) Roy-PMM models. ....................................... 60
Figure 3. Estimated mean PHQ-9 total scores for the 3-group quadratic LCGA
trajectories over 5 years, including recommended chronic disease (PHQ-9 >10) and
diabetes (PHQ-9 >12) cut-offs for clinically significant depression. ....................... 77
Figure 4. Mean estimated anxiety scores (GADS total scores) for 2-class LGMM over 4
years, including clinical cut-off (GADS ≥ 15). ...................................................... 101
Figure 5. Mean estimated GADS total scores in the total available sample (N=1086) for
overlapping anxiety and depression groups over 4 years. ...................................... 108
Figure D1. ROC curve produced to identify the optimal clinical cut-off on the GADS,
against the SCID-RV. ................................................................................................. 7

xix
List of Abbreviations
BLDS Brief Lifetime Depression Scale
BMI Body Mass Index
CBT Cognitive Behaviour Therapy
CES-D Centre for Epidemiologic Studies Depression Scale
DSM-IV Diagnostic and Statistical Manual of Mental Disorders; 4th Edition
DSM-V Diagnostic and Statistical Manual of Mental Disorders; 5th Edition
FDS2 Fremantle Diabetes Study-Phase II
GAD Generalized Anxiety Disorder
GAD-7 Generalized Anxiety Disorder 7-Item Scale
GADS Generalized Anxiety Disorder Scale
GAD-LT Generalized Anxiety Disorder – Lifetime Scale
GGMM General Growth Mixture Model
GP General Practitioner
HADS Hospital Anxiety and Depression Scale
HbA1c Glycated Haemoglobin
HPA-axis Hypothalamic-Pituitary-Adrenal Axis
LCGA Latent Class Growth Analysis

xx
L-GAD Lifetime Generalized Anxiety Disorder
L-MDD Lifetime Major Depressive Disorder
MAR Missing at Random
MBCT Mindfulness Based Cognitive Therapy
MCAR Missing Completely at Random
MDD Major Depressive Disorder
NMAR Not Missing at Random
PHQ-9 Patient Health Questionnaire-9 Item Version
PMM Pattern Mixture Modeling
SCID-RV Structured Clinical Interview for DSM-IV-Research Version
SNS Sympathetic Nervous System
SMBG Self-Monitoring of Blood Glucose
SM Selection Modeling
SPSS Statistical Package for the Social Sciences
T2DM Type 2 Diabetes Mellitus
xxi
Acknowledgements
“I get by with a little help from my friends”
- The Beatles
There are numerous people who have contributed to seeing this thesis through to
fruition. I have come out the other end of the thesis tunnel thanks to you all.
First and foremost, I would like to extend an immense thank you to my research
supervisors, who supported this fledgling researcher to get off the ground. To my
primary supervisor, Romola Bucks. You have mentored, championed, and challenged
me throughout this entire journey. I am the researcher I am today, because of your
unwavering support. Thank you for always offering a rope when I fell down the rabbit
hole. Here’s to many more cups of tea and big ideas.
To my co-supervisors, David Bruce and Sergio Starkstein. David, thank you for sharing
your wealth of knowledge with me, and for your patience as I have navigated the world
of Medicine. Your ongoing support, time, word cutting, and polite reception of an
increasing number of emails, has been so appreciated. Sergio, thank you for sharing your
wisdom in the field of Psychiatry, and for encouraging and supporting me throughout
the process of my interview study. I have enjoyed our conversations to the backdrop of
classical music. To Timothy Skinner, an honorary supervisor. Thank you for asking the
challenging questions, and for your hours of time and direction. Your passion for health
psychology is infectious.
This research was supported by an Australian Government Research Training Program
(RTP) Scholarship, and a UWA University Postgraduate Award, Top-Up Scholarship
and Completion Scholarship. I would like to thank the Graduate Research School and
School of Psychological Science, for funding my travel to present and network at
international conferences.

xxii
I would like to extend an enormous thank you to the Fremantle Diabetes Study team.
Your years of dedicated work have enabled me to write this thesis. To Wendy Davis:
thank you for your invaluable statistics advice, support of my data expeditions, and for
your insight and conversation. To Timothy Davis, thank you for welcoming me into the
fold, and for your helpful feedback along the way. It has been a privilege to learn from
you both. Finally, to the participants of the FDS. This research was only possible
because you generously donated your time, and your stories.
I would like to also extend thanks to the clinical supervisors who have guided my
development as a therapist, and as a scientist. Special thanks to Neil McLean, Carmela
Pestell, Susannah Flack, and Adele Summers, for inspiring my learning and encouraging
me to lean into the discomfort. To Elli Roeder, thank you for seeing this through with
me.
There are a number of friends I am truly grateful to know. To my psychology friend
family; Olivia Carter, Jessica Tearne, Alice Gummery, and Alicia Wilson. To have met
women as wonderful, insightful, validating and passionate as you, has made this degree
infinitely worth it. To Michelle O’Keeffe, thank you for always reminding me there was
an end in sight. To my postgraduate comrades: your company and support over the past
5 years has been invaluable. Special thanks to Kevin Mo and Jason Choi, and to my
Sanders family, Jacqueline Stump, Steph Wade, Jessica Moncrieff-Boyd, Louise Delane,
Alice Mason, and Shenooka Nanthakumar. A resounding thank you to my office mates,
Sarah George, Shraddha Kashyap and Briony Swire: every conversation, laugh and hot
toddy, has kept me going.
To my girls. You know who you are. Thank you for providing me with food and wine,
and multiple shoulders to lean on. I am so grateful to you all. Tegan Miller, thank you
for the nights on the couch when they were all I could manage. Sheridan Coleman, thank
you for being there to push me across the finish line.

xxiii
Finally, to my family. I will forever be grateful for the unwavering support you all
provide. Mum, I could not have done this without you. James, thank you for always
having my back. Janny and Pop, thank you for teaching me to touch type - this thesis has
been written much faster thanks to you. Finally, to my Dad. Thank you for the pride and
confidence you had in my success. I wish you could be here to see this.

xxiv
Authorship Declaration: Co-Authored Publications
This thesis contains work that has been published and prepared for publication. Details of the work:
Whitworth, S., Bruce, D. G., Starkstein, S. E., Davis, W. A., Davis, T. M. E., &
Bucks, R. S. (2016). Lifetime depression and anxiety increase prevalent psychological
symptoms and worsen glycemic control in type 2 diabetes: the Fremantle Diabetes
Study Phase II. Diabetes Research and Clinical Practice, I22; I90-7.
Location in thesis: Chapter 2
Student contribution to work:
The student conceived and designed this study in collaboration with all co-
supervisors. The student analyzed the data, interpreted findings, and prepared and
revised the manuscript.
Details of the work:
Whitworth, S., Bruce, D. G., Starkstein, S. E., Davis, W. A., Davis, T. M. E.,
Skinner, T.C., & Bucks, R. S. (2017). Depression symptoms are persistent in type 2
diabetes: risk factors and outcomes of 5-year depression trajectories using latent
class growth analysis. Diabetic Medicine, 34; 1108-15.
Location in thesis: Chapter 4
Student contribution to work:
xxv
The student conceived and designed this study in collaboration with all co-
supervisors. The student analyzed the data, interpreted findings, and prepared and
revised the manuscript.
Details of the work:
Whitworth, S., Bruce, D. G., Starkstein, S. E., Davis, W. A., Davis, T. M.
E., Skinner, T.C., & Bucks, R. S. Anxiety in type 2 diabetes: risk factors
and outcomes of 4-year anxiety symptom trajectories using latent growth
mixture modeling. Prepared for publication to Diabetes Care, April 2017.
Location in thesis: Chapter 5
Student contribution to work:
The student conceived and designed this study in collaboration with all co-
supervisors. The student analyzed the data, interpreted findings, and prepared and
revised the manuscript.
Student signature:
Date: 24th April 2017

xxvi
On behalf of all co-authors, I, Romola S. Bucks certify that the student statements
regarding their contributing to each of the works listed above are correct.
Coordinating Supervisor signature:
Date: 24th April 2017
1 Chapter 1: General Introduction
Depression and Anxiety Symptoms in Type 2 Diabetes Mellitus:
A Matter of Time?
Over the past 30 years, the epidemic of obesity has increased exponentially
worldwide. Alongside this epidemic, the prevalence of type 2 diabetes mellitus (T2DM)
had dramatically increased and become the focus of significant study. While
traditionally viewed as a condition of developed countries, T2DM has now become a
global health crisis threatening the individual health and national economies of both
developed and developing nations (F. B. Hu, 2011).
Adult T2DM: prevalence and healthcare implications
In 2015, the International Diabetes Federation estimated that approximately 8.8%
of adults worldwide between the ages of 20 and 79, or 415 million people, were
diagnosed with diabetes (Ogurtsova et al., 2017). By 2040, these estimates are expected
to increase to 642 million people, or 1 in 10 adults (Ogurtsova et al., 2017).
Economically, Australia has the highest spending on healthcare per person with diabetes
(USD $7,652-$14,498), and the global health expenditures associated with T2DM are
estimated to reach $USD 802 billion by 2040 (Ogurtsova et al., 2017). All reported
statistics are conservative and may underestimate the true healthcare burden of diabetes,
as between 28-80% of those with T2DM may remain undiagnosed (International
Diabetes Federation Clinical Guidelines Task Force, 2012) and subsequently untreated.
T2DM is a chronic metabolic disorder associated with higher than normal blood
glucose levels, termed hyperglycaemia, caused by deficits in insulin secretion and action
(American Diabetes Association, 2006; DeFronzo et al., 2015). This disorder results in
Depression and Anxiety in T2DM 2
dysregulation of carbohydrate, lipid and protein metabolism, and accounts for up to 90%
of reported diabetes cases (American Diabetes Association, 2006). T2DM is
traditionally diagnosed based on a combination of biochemical tests, including glycated
haemoglobin (HbA1c) levels. HbA1c levels ≥ 6.5% (48 mmol/mol) indicate probable
hyperglycaemia, and HbA1c levels can be used alone to diagnose T2DM, if two
measurements are elevated in an asymptomatic individual. Diagnosis is frequently
confirmed by an elevated random plasma glucose test (≥11.1 mmol/L) and fasting
plasma glucose levels (≥7.0 mmol/L after 8 hours fasting) (American Diabetes
Association, 2015; World Health Organization, 2011). Common symptoms of
hyperglycaemia include thirst, polydipsia, polyuria/frequent urination, and fatigue
(American Diabetes Association, 2006). While the cause of T2DM-related insulin-
resistance is unknown, several biobehavioural risk factors have been implicated
including higher body mass index (BMI), physical inactivity, poor diet, smoking, and a
genetic predisposition (Chen, Magliano, & Zimmet, 2012; Grøntved & Hu, 2011; F. B.
Hu, 2011).
In order to prevent the long-term health complications associated with T2DM,
engagement in daily self-management is required by the individual to maintain optimal
glycemic control. National and international recommendations suggest that individuals
should aim to achieve an HbA1c target of ≤7% (53 mmol/mol), with this value ranging
from 6-8% (42-64 mmol/mol) depending on the individual (Cheung et al., 2009;
Inzucchi et al., 2012). A weight loss of 5-10%, in addition to increasing physical activity
and moderating food intake, are also advised and have shown substantial benefit for
Depression and Anxiety in T2DM 3
improving HbA1c (Inzucchi et al., 2012). Thus, the burden of disease is high, as an
individual is required regularly to self-monitor their blood glucose levels (SMBG;
commonly through fingerpicking), adhere to diet and exercise recommendations, take
oral glucose lowering medications as prescribed, and attend regular healthcare
appointments (Bijl, Poelgeest‐Eeltink, & Shortridge-Baggett, 1999). For some, but not
all individuals, insulin treatment is also needed as their condition progresses (American
Diabetes Association, 2006). Critically, when these behaviours are not undertaken,
poorly controlled diabetes is associated with a host of adverse, long-term health
outcomes. These include macrovascular complications such as cardiovascular disease
and stroke; microvascular complications including retinopathy and peripheral
neuropathy; foot ulcers, amputations, and mortality (Bruce, Davis, Starkstein, & Davis,
2005; de Groot, Anderson, Freedland, Clouse, & Lustman, 2001). The presence of
diabetes complications confer even higher economic and individual costs (Simon et al.,
2005).
Evidently, the successful management of diabetes is essential. Research over the
past two decades has focused on ascertaining key predictors of poorer health behaviours
and outcomes, and it is now widely recognized that mental health plays a crucial role
(Young-Hyman et al., 2016). There are a broad spectrum of mental health problems
present for individuals with diabetes, and an examination of all was beyond the scope of
this thesis. Given their prevalence, overlap and detrimental impact, the symptoms of two
primary psychological disorders were considered in depth: major depressive disorder
(MDD) and generalized anxiety disorder (GAD).
Depression and Anxiety in T2DM 4
Depression in T2DM
Assessment of depression in T2DM. MDD is most commonly identified as the
experience of low mood (e.g. feeling sad) and/or a loss of interest or pleasure, persisting
more days than not for at least two weeks. Using DSM-IV1 criteria, the diagnosis of
MDD is made if one of these symptoms are present, in addition to any of the following
for a total of five: a significant increase or decrease in appetite or weight, insomnia or
hypersomnia, psychomotor agitation or retardation, loss of energy, feelings of
worthlessness or inappropriate guilt, difficulty with thinking or concentration, and
suicidal ideation or intent (DSM-IV-TR; American Psychiatric Association, 2000). A
significant impairment in social, occupational or other areas of functioning are required
to warrant diagnosis. A diagnosis of minor depression, a milder form of depression, is
made if between two-to-four symptoms are present, one of which is low mood or
anhedonia.
While the gold-standard recommendation for identifying depression is through a
clinical diagnostic interview such as the Structured Clinical Interview for DSM-IV
Disorders (SCID-IV; First, Spitzer, Gibbon, & Williams, 2002), the utility of this time-
consuming method is limited in primary care and research settings. A number of brief
self-report instruments have been developed to screen for the presence of depression,
including the Patient Health Questionnaire (Kroenke & Spitzer, 2002), Hospital Anxiety
and Depression Scale (HADS; Zigmond & Snaith, 1983), and Center for Epidemiologic
1 Note: there are no changes in the diagnosis of MDD between DSM-IV and DSM-5

Depression and Anxiety in T2DM 5
Studies – Depression Scale (CES-D; Radloff, 1977). Each scale typically provides: a
total score that is the sum of all items, with higher scores indicating more severe
depression symptoms (termed continuous depression severity); and a validated cut-point
above which scores are termed clinically meaningful and suggest probable depression
(elevated depressive symptoms) (Kroenke & Spitzer, 2002). The PHQ-9 is also
structured to suggest the presence of a MDD diagnosis (depression), by mapping
symptoms against diagnostic criteria.
Prevalence and impact of depression in T2DM. As the most studied
psychological comorbidity in T2DM, it is widely recognized that depression confers
additional burden for both the individual and the healthcare system. Rates of depression
are high, with clinically significant depression estimated to be twice as prevalent in
people with diabetes as in the general population (Egede, Zheng, & Simpson, 2002).
More recent meta-analytic evidence suggests these estimates may be closer to a 15%-
23% increased risk of depression (Hasan, Clavarino, Mamun, Doi, & Kairuz, 2013;
Mezuk, Eaton, Albrecht, & Golden, 2008), with up to 70% of this population
experiencing some depressive symptoms (Gonzalez, Safren, et al., 2008).
At an individual level, the presence of depression or elevated depressive
symptoms is associated with less engagement in all self-care behaviours, treatment non-
adherence, and risk of all micro-and-macrovascular complications (Ciechanowski,
Katon, Russo, & Hirsch, 2003; de Groot et al., 2001; Gonzalez et al., 2007; Gonzalez,
Peyrot, et al., 2008). Further, despite disagreement regarding the strength of this
association, a breadth of literature has demonstrated a significant but small-to-medium
Depression and Anxiety in T2DM 6
effect of depression on hyperglycaemia (Fisher et al., 2008; Gois, Dias, Raposo, do
Carmo, & Barbosa, 2012; Lustman, Anderson, et al., 2000). Unsurprisingly, depression
in diabetes therefore incurs significantly higher healthcare costs and resource use (Egede
et al., 2002; Simon et al., 2005), with costs highest for those with more severe
depressive symptoms (Ciechanowski, Katon, & Russo, 2000). Of greatest clinical
concern, the comorbidity of depression in diabetes substantially increases the risk of
mortality (Bruce et al., 2005; Katon et al., 2005).
Anxiety in T2DM
Assessment of anxiety in diabetes. A number of anxiety disorders present
frequently in individuals with a chronic medical illness, including panic disorder, post-
traumatic stress disorder, social phobia, and generalized anxiety disorder. All anxiety
disorders share key features of anxious cognitions, physiological symptoms, and
behavioural difficulties (Smith et al., 2013). Of these disorders, generalized anxiety
disorder (GAD) is the most common to present in primary care (Tylee & Walters, 2006).
GAD is manifested by persistent worry and/or anxiety about a number of areas of life,
which is difficult to control. In addition to these cardinal symptoms, a diagnosis of GAD
is made if an individual also experiences three or more of the following symptoms, more
days than not for at least six months: restlessness/feeling on edge, fatigue, difficulty
concentrating, irritability, muscle tension, and sleep disturbance (DSM-IV-TR;
American Psychiatric Association, 2000). A diagnosis is confirmed if these symptoms
have a significant impact on an individuals’ daily functioning.
Depression and Anxiety in T2DM 7
Similar to MDD, a number of self-report measures screen for anxiety, including
providing a total score of anxiety severity (termed continuous anxiety severity), a
clinical cut-point above which scores indicate likely detection of GAD (elevated anxiety
symptoms), and a probable diagnosis of GAD (anxiety). Validated instruments include
the Generalized Anxiety Disorder-7 (GAD-7; Spitzer, Kroenke, Williams, & Lowe,
2006), the Generalized Anxiety Disorder Scale (GADS; Starkstein et al., 2014), and the
Hospital Anxiety and Depression Scale (HADS; Zigmond & Snaith, 1983).
Prevalence and impact of anxiety in T2DM. Overall, substantively less is
known about anxiety than depression in diabetes. This is of concern as a recent meta-
analysis found that, across 12 studies including 12,626 individuals, diabetes led to a 20%
increase in the prevalence of anxiety disorders and 48% increase in anxiety symptoms
(Smith et al., 2013). Prevalence estimates for sub-threshold anxiety (anxiety symptoms
which fall below a clinical cut-off), or for elevated anxiety symptoms, are routinely
higher than those for GAD diagnosis (Grigsby, Anderson, Freedland, Clouse, &
Lustman, 2002; Smith et al., 2013).
Studies of the association between anxiety and diabetes management/control are
variable. First, elevated anxiety has been shown to be associated with increased insulin
use, uncertainty about glycemic control, more diabetes complications, and more painful
diabetic peripheral neuropathy (Collins, Corcoran, & Perry, 2009; Gore et al., 2005), but
may not impact on adherence to medical recommendations (DiMatteo, Lepper, &
Croghan, 2000). Second, there is a lack of agreement in the literature regarding the
impact of anxiety on glycemic control. Some studies have found a significant
Depression and Anxiety in T2DM 8
relationship (Anderson et al., 2002; Balhara & Sagar, 2011), while others have not
(Fisher et al., 2008; Gois et al., 2012). Given the limited investigation of anxiety in
diabetes, the broader burden of GAD on the healthcare system is also unclear. However,
general population studies have demonstrated that GAD is associated with higher
primary and specialist care use, higher medical costs (Bereza, Machado, & Einarson,
2009) and greater disability (Porensky et al., 2009).
Taken together, there is strong evidence that depression is a detrimental
comorbidity for individuals with diabetes, and that anxiety may affect outcomes to a
lesser degree. However, MDD and GAD are also highly comorbid disorders in the
general population (Merikangas et al., 2003), resulting in even higher healthcare costs
(Boulanger, Zhao, Bao, & Russell, 2009), more chronic psychopathology, and lower
remission rates in both disorders over time (Merikangas et al., 2003; Penninx et al.,
2011; Schoevers, Deeg, van Tilburg, & Beekman, 2005). This comorbidity may be more
prevalent in diabetes than the general population (Deschênes, Burns, & Schmitz, 2015),
affecting up to 17.2% of individuals (Collins et al., 2009). One study identified a small
group of individuals who experienced a high overlap in depression and anxiety
symptoms, which the authors termed major anxious depression (Starkstein et al., 2014).
These individuals had poorer glycemic control and higher rates of insulin use than those
with subclinical or no mood symptoms. While it can be posited that diabetes
management and control may be even worse for these individuals, a paucity of research
exists in this area. To further complicate the picture, assessment of the individual impact
of either MDD or GAD often does not control for the other, confounding the
Depression and Anxiety in T2DM 9
relationships observed (Collins et al., 2009; Fisher et al., 2008). Thus, a key aim of
Chapter 2 of this thesis is to clarify the separable and combined effect of MDD and
GAD in T2DM, in order to facilitate more appropriate and targeted intervention.
In addition to the impact of depression and anxiety in this population, recent
research has focused on another concomitant psychological construct in T2DM, termed
diabetes-specific emotional distress (diabetes distress; Fisher et al., 2010). Diabetes
distress refers to the worries, concerns and fears of the individual living with diabetes,
and reflects a broader affective experience to that captured by depression and anxiety
symptom measures (Fisher, Gonzalez, & Polonsky, 2014). Diabetes distress has been
found to be a significant predictor of diabetes self-care and glycaemic control (Fisher et
al., 2010; Gonzalez, Safren, et al., 2008) and to be associated with symptoms of
depression (Ehrmann, Kulzer, Haak, & Hermanns, 2015). There exists debate in the field
regarding whether the prevalence of depression, in particular, and the association
between depression and health-related outcomes, may in part be explained by elevated
levels of diabetes distress (Fisher et al., 2010; Snoek, Bremmer, & Hermanns, 2015).
However, it was beyond the scope of this thesis to include a thorough assessment of
diabetes distress, and the well-established psychiatric constructs of depression and
anxiety will be the primary focus. A more detailed discussion of this debate is provided
in Chapter 6.
Depression, anxiety and diabetes: developmental considerations
International recommendations now emphasize the need for improved screening,
monitoring, and treatment of psychological distress in diabetes in order to improve
Depression and Anxiety in T2DM 10
biopsychosocial outcomes (American Diabetes Association, 2017; International
Diabetes Federation Clinical Guidelines Task Force, 2012). While psychological
treatments, including Cognitive Behavioural Therapy (CBT), have demonstrated
efficacy in improving depression in diabetes (Lustman, Griffith, Freedland, Kissel, &
Clouse, 1998), and may translate to better self-care and glycemic control when
combined with adherence training (Safren et al., 2014), detection rates of mood
disorders are low (Petrak, Baumeister, Skinner, Brown, & Holt, 2015). Moreover, many
of these recommendations are based on findings from cross-sectional studies, yet T2DM
and mood disorders are dynamic processes that change over the life course (DeFronzo et
al., 2015; Merikangas et al., 2003). A number of developmental factors that may
contribute to improvements in screening and treatment processes warrant consideration.
These include: 1) the bidirectional association between mood and T2DM; 2) the
longitudinal course of depression and anxiety in T2DM; and 3) the complex
interrelationships between changes in mood and T2DM management over time. Each
topic is outlined, in detail, below.
Depression, anxiety and diabetes: a bidirectional relationship
The aforementioned relationships between depression, anxiety and T2DM are
now known to be bidirectional. First, depression and to a lesser extent anxiety, can
increase the risk of developing diabetes (Edwards & Mezuk, 2012; Engum, 2007; Knol
et al., 2006; Mezuk et al., 2008). Depression may contribute through its association with
poorer self-care, smoking, obesity, sedentary behaviour (Katon, 2003), and difficulty
collaborating with healthcare professionals (Ciechanowski, Katon, Russo, & Walker,
Depression and Anxiety in T2DM 11
2001). Through shared inflammatory pathways, depression and anxiety can also lead to
increased production of pro-inflammatory cytokines, hypothalamic-pituitary axis (HPA)
and sympathetic nervous system (SNS) activation, and biological changes due to long-
term antidepressant use: all risk factors for maladaptive immune and endocrine changes
(Barnard, Peveler, & Holt, 2013; Black, 2003; Kiecolt-Glaser & Glaser, 2002). Second,
T2DM can lead to the development of depression and anxiety symptoms due to the
psychosocial burden of managing a chronic condition, including long-term insulin use,
fear of hypoglycemia, and the development or worsening in health complications
(Collins et al., 2009; Culpepper, 2009; Trento et al., 2015). Underlying vascular,
inflammatory and neurohormonal changes associated with diabetes may also play a role
in the risk of depression and anxiety (Bruce et al., 2006; Culpepper, 2009). Finally,
common factors associated with depression and diabetes, including obesity, inactivity,
inflammation, and low socio-economic status, may cumulatively contribute to the risk of
both conditions (Everson, Maty, Lynch, & Kaplan, 2002; Tabák, Akbaraly, Batty, &
Kivimäki, 2014).
Despite this substantial body of research, the impact of the directionality of these
associations on long-term mood and disease management has received little attention.
One method of delineating this is to examine the effect of lifetime mood problems on
later psychological and health-related outcomes. Evidence suggests that experiencing a
past or lifetime episode of depression (lifetime major depressive disorder; L-MDD) is
associated with less engagement in self-management behaviour, non-attendance at
healthcare appointments and risk of treatment dropout, and with a higher incidence and
Depression and Anxiety in T2DM 12
recurrence of depressive symptoms, minor and major depression (Bruce, Davis, Hunter,
et al., 2016; Bruce, Davis, Cetrullo, Starkstein, & Davis, 2013; Marcus, Wing, Guare,
Blair, & Jawad, 1992; Naranjo, Fisher, Areán, Hessler, & Mullan, 2011; Nefs, Pouwer,
Denollet, & Pop, 2012; Wagner, Tennen, & Osborn, 2010). However, most available
studies are limited in generalizability due to the recruitment of women without current
MDD only (Wagner et al., 2010), overweight individuals self-selecting to a weight-loss
group (Marcus et al., 1992), or by excluding individuals with MDD at baseline (Naranjo
et al., 2011). Of clinical relevance, the separable impact of lifetime generalized anxiety
disorder (L-GAD) on later outcomes, and the likely exacerbating effect of comorbid L-
MDD+L-GAD on adverse psychological and physical health, has not been investigated.
The primary aim of Chapter 2 (Study 1) of this thesis is to elucidate the impact of L-
MDD and L-GAD in a representative sample of individuals with T2DM and address
implications for intervention.
The course of depression and anxiety in T2DM
Supporting the use of a life-course developmental perspective, a large number of
studies have demonstrated that MDD is recurrent and chronic in diabetes. A depression
diagnosis has been shown to be persistent for up to one third of patients (Nefs et al.,
2012; Peyrot & Rubin, 1999), with high rates of recurrence in pre-post follow-up periods
ranging from 6 months to 5 years (Katon et al., 2009; Lustman, Griffith, Freedland, &
Clouse, 1997; Peyrot & Rubin, 1999). Rates of symptomatic persistence are even higher
when considering the experience of elevated depressive symptoms (Fisher et al., 2008).
More recently, a study by Schmitz and colleagues (2013) found separate classes of
Depression and Anxiety in T2DM 13
individuals who changed differentially in their depression diagnoses over time. While
the majority of their sample were not depressed over 3 years (67%), a sub-set showed a
pattern of increasing major depression (6%), improved depression (7%), or increasing
prevalence of major and minor depression (20%; Schmitz et al., 2013). The course of
continuous depression severity, rather than depression diagnosis, over time remains to be
examined.
Unsurprisingly, there is a dearth of research regarding the course of GAD in
T2DM. General population studies lack agreement based on the time frame and age
group adopted, with some studies suggesting that GAD is persistent with a pattern of
relapse and remission over time (Keller, 2002; Schoevers et al., 2005), while others have
found GAD to decline steadily over 14 years in middle adulthood (Ramsawh, Raffa,
Edelen, Rende, & Keller, 2009), or to show the greatest initial decrease within 2 years of
diagnosis (Yonkers, Bruce, Dyck, & Keller, 2003). Only one study has investigated the
course of GAD over more than 2 time points in diabetes, finding an episodic pattern
whereby 27% of those who met criteria at baseline continued to do so at the second
wave, and only 19% did so at the third (Fisher et al., 2008).
Depression, anxiety and diabetes management over time
Few studies have examined the relationship between the course of
depression/anxiety, and change in diabetes management and outcomes. Available
evidence suggests that diabetes-related risk factors for persistence in elevated depression
symptoms include insulin use, higher BMI, and diabetes-specific distress (Skinner et al.,
2010; Trento et al., 2015). Poorer glycemic control has also been shown to predict

Depression and Anxiety in T2DM 14
persistent depression in some (Fisher et al., 2008), but not other (Fisher et al., 2010;
Skinner et al., 2010) studies. Long-standing diabetes complications, or the development
of new complications, may also produce worsening in depression over time (Fisher et
al., 2008; Katon et al., 2009), in turn increasing cardiovascular risk (Windle & Windle,
2013) and poorer self-care (Gonzalez, Safren, et al., 2008). For anxiety, similar patterns
emerge, with more diabetes complications, higher BMI, and smoking linked to elevated
anxiety over time (Fisher et al., 2008; Trento et al., 2015), while HbA1c was not (Fisher
et al., 2008).
Limitations of current developmental perspectives
Mood and diabetes exhibit bidirectional associations that appear to influence the
progression of each over time. These associations may have significant implications for
the timing and nature of interventions aiming to improve both psychological and
diabetes outcomes. However, the available literature has been limited by a number of
methodological issues that hinder our understanding of these relationships, including: 1)
issues of study design; 2) problems with the assessment of depression and anxiety; and
3) suboptimal statistical methods of studying change. These issues are each discussed, in
turn, below.
Study design. Briefly, all examined studies have been primarily incidence or
prevalence designs with data assessed at just two time points (Gonzalez, Safren, et al.,
2008; Trento et al., 2015), biased by Type 1 diabetes samples (Katon et al., 2009), or
have examined only one direction in these interrelationships (Fisher et al., 2008;
Gonzalez, Safren, et al., 2008; Skinner et al., 2010; Trento et al., 2015). For example, the

Depression and Anxiety in T2DM 15
majority of studies have investigated diabetes-related factors as a predictor of
persistence or change in mood symptoms (Fisher et al., 2008; Katon et al., 2009), but not
the reverse. Taken together, this has not allowed for a comprehensive examination of the
longer-term, naturalistic course of depression and anxiety in diabetes, or for delineating
the developmental associations between changes in mood and changes in diabetes
management.
Assessment of MDD and GAD. Existing longitudinal studies have
conceptualized mood based on clinical diagnosis or as scoring above a clinical cut-point
on self-reported mood scales (Fisher et al., 2008; Schmitz et al., 2013). However, the
experience of subthreshold depression, with symptoms that may be less severe than
these cut-points but still clinically meaningful, has been linked to greater psychosocial
dysfunction, impaired health-related quality of life, and risk of later depressive episodes
(Kennedy, Abbott, & Paykel, 2004; Sadek & Bona, 2000; Schmitz et al., 2014; Wells,
Burnam, Rogers, Hays, & Camp, 1992). Subthreshold depression and anxiety symptoms
may often remain elevated and unremitting, and fluctuate in severity over time (Keller,
2002; Merikangas et al., 2003). Researchers have thus argued for consideration of mood
as a continuous construct better to capture this heterogeneity (Fisher, Gonzalez, &
Polonsky, 2014; Gonzalez, Fisher, & Polonsky, 2011), but the use of continuous mood
scores is infrequent, especially in longitudinal studies.
The strength of the associations between mood and diabetes management also
differ based on the assessment method adopted. Gonzalez and colleagues (Gonzalez et
al., 2007) found continuous depression severity to be a better predictor than a diagnosis
Depression and Anxiety in T2DM 16
of MDD of non-adherence to diet and exercise recommendations, while MDD diagnosis
more strongly predicted less frequent SMBG. Another study found elevated depressive
symptoms, albeit above a clinical cut-point, to be more closely related to HbA1c than
MDD diagnosis (Fisher et al., 2008). Differential associations based on the method of
anxiety assessment are unclear.
Furthermore, the course of continuous depression and anxiety severity over time,
and associations with T2DM, have not been examined. This may provide a more concise
and detailed picture of the gradual symptomatic change in these disorders, and improve
identification of those with subthreshold but potentially meaningful symptoms.
Exploration of the overlap in symptoms of depression and anxiety over time may also be
revealing. These are the primary aims of Chapters 4 and 5 of this thesis.
Statistical methods of studying change. The previously mentioned traditional
approaches of studying change aim to investigate relationships among variables. In
doing so, they provide an estimate of change for the entire sample (B. O. Muthén &
Muthén, 2000). For mood disorders that are heterogeneous in the general population,
this “one size fits all” approach is unlikely to accurately represent symptomatic change
over time for the individual (Nagin & Odgers, 2010). Instead, latent class growth
modeling (LCGA) and latent growth mixture modeling (LGMM) approaches have risen
in popularity as a method to address this issue. These approaches aim to determine both
the individual’s trajectory of change (interindividual change), and whether there exist
broader patterns of similarities in change for groups of individuals (intraindividual
change; (Jung & Wickrama, 2008). Predictors and outcomes of identified trajectories

Depression and Anxiety in T2DM 17
can also be examined (B. O. Muthén & Muthén, 2000). These approaches have been
used to study trajectories of alcohol dependence (B. O. Muthén & Muthén, 2000),
depression and anxiety symptoms following spinal cord injury (Bonanno, Kennedy,
Galatzer-Levy, Lude, & Elfström, 2012) and in musculoskeletal pain (Rzewuska,
Mallen, Strauss, Belcher, & Peat, 2015), and one study has investigated trajectories of
change in depression diagnoses over time in diabetes (Schmitz et al., 2013).
Existing methodologies may also lead to biased results due to how missing data
are handled. Traditional, longitudinal analyses exclude individuals with missing data at
any one time point (Enders & Bandalos, 2001). These methods likely bias estimates and
do not allow inclusion of those who may intermittently drop out and then return
throughout a study (Enders, 2010). LCGA and LGMM methods allow for missingness to
be modeled as part of each analysis, maximizing the number of participants included and
providing a more accurate change estimate. Chapter 3 provides a comprehensive
description of how missing values analysis was conducted for the longitudinal LCGA
analyses reported in this thesis.
Summary and contents of chapters
T2DM is a highly prevalent and chronic condition that causes significant cost to
the individual and economy. A large body of research has indicated that depression, and
to a lesser extent anxiety, increase the risk of poorer psychosocial and health-related
outcomes in this population. However, the developmental pathways by which depression
and anxiety symptoms may, either separately or combined, develop and affect diabetes-
related outcomes remain unclear.

Depression and Anxiety in T2DM 18
The primary aim of this thesis was to investigate and clarify the strength of these
associations and implications for intervention in a representative community sample of
individuals with T2DM. In particular, this thesis examined the complex
interrelationships between lifetime MDD and GAD, current depression and anxiety
symptoms, and diabetes management by adopting a longitudinal, trajectory perspective.
To do this, Study 1 (Chapter 2) first involved a cross-sectional examination to
delineate the separate and combined impact of lifetime MDD and lifetime GAD on
continuous depression and anxiety symptoms and health outcomes. It was hypothesized
that individuals with a lifetime history of MDD, GAD, or both, would experience more
severe current mood symptoms and have worse health-related outcomes than those with
no history of either disorder. This study was published in the journal Diabetes Research
and Clinical Practice (2016); I22; 190-197.
Prior to determining trajectories of continuous depression and anxiety symptoms,
missing values analyses were performed in order to examine any bias in estimates that
may be due to missing data. Chapter 3 presents a detailed analysis of missingness in
longitudinal data, and provides the rationale for analyses performed in Chapter 4.
Importantly, the developmental trajectories of depression and anxiety diagnoses
appear to differ both in the general population and in T2DM (Fisher et al., 2008;
Merikangas et al., 2003), and may affect diabetes outcomes differentially. Thus, before
examining the impact of the overlap in these disorders over time, it was first necessary
to understand the naturalistic course of depression and anxiety symptom trajectories
separately. Chapter 4 (Study 2) used the findings from the missing values analysis in
Depression and Anxiety in T2DM 19
Chapter 3 in a latent class growth model, to examine the course of depression symptoms
over 5 years in T2DM. Associations of these trajectories with corresponding
longitudinal changes in HbA1c, BMI, and SMBG, were explored. It was hypothesized
that separable groups of individuals would be identified who experienced a similar
pattern of depression symptom severity over time, and that those experiencing ongoing
threshold or subthreshold depression would be at greater risk of adverse long-term
health outcomes. This chapter has been accepted for publication in Diabetic Medicine as
of April 2017.
The final, investigative chapter (Chapter 5, Study 3) developed the findings from
Chapter 4 and used latent growth mixture modeling to determine trajectories of anxiety
symptoms over 4 years in the same sample. HbA1c, BMI, SMBG, and health
complications were investigated as predictors and outcomes of these trajectories. The
proportion of overlap between depression trajectories determined from Chapter 4 (Study
2), and the identified anxiety symptom trajectories, was then examined. As in Chapter 4,
it was hypothesized that separate groups of individuals would be identified who
experienced similar trajectories of anxiety symptoms over time, and that individuals
with overlapping anxiety and depression trajectories would display worse psychological
and health-related outcomes. This Chapter has been prepared as a manuscript for
submission to Diabetes Care.
The final chapter of this thesis, Chapter 6, provides a comprehensive discussion
of the findings, strengths, limitations and clinical implications.

Depression and Anxiety in T2DM 20
Each Chapter has been formatted according to the journal in which the Study was
published, or for which it was prepared for publication. Thus, specific formatting may
differ between Chapters.
Depression and Anxiety in T2DM 21
Chapter 2: Lifetime Depression and Anxiety Increase Prevalent Psychological
Symptoms and Worsen Glycemic Control in Type 2 Diabetes
Preface
Depression and anxiety are highly comorbid in type 2 diabetes, yet the interplay
between a lifetime history of major depression, generalized anxiety disorder, and
diabetes management and glycaemic control remain unclear. Importantly, the separate
and combined influence of a history of GAD in this population has not previously been
investigated. Chapter 2 presents a cross-sectional examination, using indirect mediation
models, of the risk associated with both historical and current MDD and GAD in
diabetes.
This chapter was published in the journal Diabetes Research and Clinical
Practice: Whitworth, S.R., Bruce, D.G., Starkstein, S.E., Davis, W.A., Davis, T.M.E.,
Bucks, R.S. (2016). Lifetime depression and anxiety increase prevalent psychological
symptoms and worsen glycemic control in type 2 diabetes: the Fremantle Diabetes
Study Phase II. Diabetes Research and Clinical Practice; I22; I90-7. It is presented
below, as published, but formatted for consistency with the rest of the thesis.
Depression and Anxiety in T2DM 22
Abstract
Aims: To determine the contribution of lifetime major depressive disorder (L-MDD)
and lifetime generalized anxiety disorder (L-GAD) to current psychological symptom
severity, health behaviour and glycaemic control in type 2 diabetes.
Methods: 1,285 community-dwelling people with type 2 diabetes (Fremantle Diabetes
Study Phase-II; FDS2) completed the PHQ-9 and Brief Life-time Depression Scale
(BLDS) to assess current and past MDD. The Generalized Anxiety Disorder Scale
(GADS) and the Generalized Anxiety Disorder Scale-Lifetime (GAD-LT), designed for
FDS2, assessed current and past anxiety. Data were analysed using analysis of
covariance and multiple mediation models, controlling for age, gender, marital status,
and diabetes duration.
Results: L-MDD and L-GAD were independently associated with more severe current
depression (both P<0.001) and anxiety (both P<0.001) symptoms. Mediation models
revealed that, through increasing the severity of current depressive symptoms, L-MDD
was associated with higher HbA1c and body mass index (BMI), greater likelihood of
current smoking, and reduced self-monitoring of blood glucose (SMBG) (indirect
regression path ab, all P<0.001). In combination, L-MDD+L-GAD additionally elevated
the risk of higher HbA1c and worse diabetes management, by increasing the severity of
current depressive symptoms (indirect regression path ab, all P<0.001).
Conclusions: Lifetime depression and anxiety increase risk of more severe
psychological symptoms, hyperglycaemia, and difficulties with health behaviour in type

Depression and Anxiety in T2DM 23
2 diabetes. Early screening for these disorders at diabetes diagnosis may be warranted to
maximize long-term health outcomes.

Depression and Anxiety in T2DM 24
Introduction
Clinical depression and anxiety symptoms are highly prevalent in people with
type 2 diabetes (de Groot et al., 2001), and are associated with suboptimal self-
management behaviour, poor glycaemic control, obesity (Katon et al., 2004), chronic
complications and mortality (de Groot et al., 2001; Gonzalez, Peyrot, et al., 2008). This
relationship is known to be bidirectional, whereby depression and anxiety can increase
the risk of diabetes onset, or develop as a consequence of diabetes disease burden and
management (Bruce et al., 2013; Renn, Feliciano, & Segal, 2011; Trento et al., 2014,
2015). For individuals already diagnosed with diabetes, better prediction of those at
elevated risk of developing or worsening depression and anxiety is required to enable
earlier identification and treatment. A history of depression (lifetime major depressive
disorder; L-MDD) has been associated with an increased risk of current major
depression diagnosis, reduced rates of SMBG (Wagner et al., 2010) and risk of diabetes
complications (Bruce et al., 2013). Furthermore, one study of obese people with diabetes
found L-MDD to be associated with greater severity of current depressive symptoms and
increased treatment attrition (Marcus et al., 1992). Screening for L-MDD may therefore
provide a valuable opportunity for identifying those at risk of experiencing more severe
psychological symptoms and worse health outcomes, particularly if these individuals do
not present with current symptoms.
The impact of lifetime anxiety has not been investigated previously in this
population. Anxiety affects up to 40% of people with diabetes, with 14% experiencing
current generalized anxiety disorder (GAD; Grigsby et al., 2002). Moreover, depression
Depression and Anxiety in T2DM 25
and anxiety symptoms occur together in up to 17.2% of patients (Collins et al., 2009),
and this comorbidity is associated with greater resistance to psychological treatment
(Fisher et al., 2008), reduced rates of remission in both disorders over time (Schoevers et
al., 2005) and significantly more diabetes complications (Collins et al., 2009). In a
recent, large, community-based study, we identified a group of individuals experiencing
severe depression and anxiety symptoms who exhibited higher HbA1c levels and a
greater requirement for insulin (Starkstein et al., 2014). Given that anxiety symptoms are
seldom assessed in studies of diabetes, investigation of the impact of lifetime anxiety,
and of comorbid lifetime depression and anxiety, on diabetes and its sequelae is needed.
The present prospective cohort study investigated the impact of lifetime major
depressive disorder (L-MDD) and lifetime generalized anxiety disorder (L-GAD), on
current depression and anxiety symptom severity and diabetes control in 1,285
individuals with type 2 diabetes. The aims of the present study were to determine
whether (i) L-MDD and/or L-GAD are associated with more severe depression and
anxiety symptoms in type 2 diabetes, (ii) L-MDD and/or L-GAD predict risk of worse
health behaviour and diabetes control, and (iii) comorbid L-MDD+L-GAD increase risk
of more severe mood symptoms and inappropriate diabetes control, than experiencing
either disorder alone. It was hypothesised that the effect of L-MDD and/or L-GAD on
health behaviour and diabetes control may occur indirectly by increasing the severity of
current depression and anxiety symptoms which, in turn, impact on diabetes health
behaviours.
Depression and Anxiety in T2DM 26
Materials and Methods
Study participants
The Fremantle Diabetes Study Phase II (FDS2) is a longitudinal study of known
diabetes, conducted in a postcode-defined, geographical area surrounding the city of
Fremantle in the state of Western Australia (Davis, Bruce, & Davis, 2013). Recruitment,
study procedures, classification of diabetes type and sample characteristics are reported
elsewhere (Davis et al., 2013). Briefly, residents (n=1732) identified as having diabetes
were recruited to FDS2 between 2008 and 2011. Patients were excluded if they did not
have clinically diagnosed type 2 diabetes, or were under 18 years, leaving a final sample
of n = 1549. FDS2 was approved by the Human Research Ethics Committee of the
South Metropolitan Area Health Service, and participants gave written, informed
consent.
The FDS2 has a number of strengths. This study is based on a large, well-
characterized community-based cohort. The FDS2 covers a region which captures varied
socio-economic backgrounds and multi-ethnic communities, including migrants and
Indigenous persons (Davis et al., 2015, 2013). This study also involved a comprehensive
clinical assessment and diagnosis of T2DM using a clinical algorithm, which was
validated using the Western Australian Data Linkage System (Davis et al., 2013).
Further the FDS2 both utilized, and developed, validated instruments for measuring
depression and anxiety. Limitations of the FDS include recognized bias associated with

Depression and Anxiety in T2DM 27
observational studies, such as recruitment and survivor bias (Davis et al., 2013), and the
use of self-reported measures of mood rather than clinical diagnostic interviews2.
Study procedures
At study entry, participants completed a comprehensive interview, questionnaire,
and clinical examination. Clinical examination included standard fasting biochemical
tests such as fasting serum glucose and HbA1c, and body mass index (BMI)
measurement (kg/m2). The questionnaire included demographic information, details of
diabetes and other illnesses, diabetes duration, current blood glucose-lowering treatment
(diet/exercise, oral hypoglycemic agents with or without insulin) and antidepressant use.
Behavioural factors associated with diabetes management, including smoking status,
alcohol consumption (number of standard alcohol drinks consumed per day), and
SMBG, were self-reported at interview.
Assessment of depression and anxiety
The Patient Health Questionnaire-9 item version (PHQ-9; Kroenke & Spitzer,
2002) was used to assess current depressive symptoms and severity, and the likely
presence of major depressive disorder. A PHQ-9 diagnosis of probable major depression
has good agreement with structured interview diagnoses (Spitzer, Kroenke, & Williams,
1999), and is validated for use in diabetes (van Steenbergen-Weijenburg et al., 2010).
Each symptom is scored positively if endorsed as “more than half the days” or “nearly
every day”, with probable major depression defined as experiencing 5 or more positive
2 This paragraph was added to this Chapter on examiner request, and was not included in the published manuscript.
Depression and Anxiety in T2DM 28
depressive symptoms over the past two weeks, with a least one being either loss of
interest or feeling depressed (Spitzer et al., 1999). Total scores range from 0-27, with
higher scores indicative of more severe depressive symptoms. Symptom severity was
categorized as no symptoms (0-4), mild (5-9), moderate (10-14), moderately severe (15-
19) and severe depression (20+; Spitzer, Kroenke, & Williams, 1999).
The Brief Life-Time Depression Scale (BLDS; Bruce et al., 2013) was used to
assess the lifetime prevalence of major depressive disorder. This measure was modeled
on the PHQ-9, and includes similar items, general format and language, but asks
participants to rate whether they have ever experienced any of the nine symptoms of
depression listed in the DSM-IV for a period of 2 weeks or more. Information on
functional impairment, when the symptoms were first experienced (age and year),
duration of episode, and any treatment sought was also collected. Lifetime diagnosis of
major depression was classified using DSM-IV criteria as outlined above. Further detail
on the development and use of the BLDS is reported elsewhere (Bruce, Davis, Hunter, et
al., 2016; Bruce et al., 2013), and this measure has been validated against the Structured
Clinical Interview for DSM-IV (SCID) Affective Disorders Module in type 2 diabetes
with sensitivity = 92.5% and specificity = 100% (Bruce et al., 2013).
Current anxiety symptoms and severity were assessed using the Generalized
Anxiety Disorder Scale (GADS; Starkstein et al., 2014), developed in FDS2 to map
directly onto the nine DSM-IV criteria for GAD. Based on PHQ-9 formatting, GADS
items were rated as “not at all present”, “present several days”, “present more than half
of the days”, and “present nearly every day”, with an item scored positively if endorsed

Depression and Anxiety in T2DM 29
as “more than half the days” or “nearly every day”. To be comparable to the DSM-IV
criteria for GAD, the time criterion was the past 6 months. Probable GAD was classified
if individuals scored positively for excessive worry and difficulty controlling their
worries, in addition to 3 or more positive anxiety symptoms. Information on functional
impairment, as well as possible drug or medical illness causes for anxiety, was collected.
This measure has high diagnostic concordance with the Structured Clinical Interview for
DSM-IV-Research Version (SCID-RV)-Anxiety disorders Module (kappa=0.88;
Starkstein et al., 2014), and high internal consistency (Cronbach’s α =0.89). Total scores
range from 0-24, with higher scores indicative of more severe anxiety symptoms.
For the study of lifetime anxiety, a specific questionnaire (the Generalized
Anxiety Disorder – Lifetime Scale (GAD-LT) was devised by one of the authors (SES)
with experience in developing psychiatric instruments to rate the severity of anxiety.
This measure was developed for FDS2 to map onto the GADS, and the time criterion
was set to one month to reflect DSM-IV lifetime criteria as assessed in the SCID-RV.
Participants are asked to rate whether they have experienced a period in their lives,
lasting for more than one month, during which they worried excessively or were anxious
about several things, or found it difficult to control their worries. If either symptom is
endorsed, the participant is asked to indicate if they experienced additional symptoms
during that period, namely feeling restless, tense, tired, difficulty concentrating, felt
irritable, or had difficulty sleeping. Data on functional impairment, when the symptoms
were first experienced (year), duration of the episode, and treatment sought were
collected. Lifetime diagnosis of GAD was classified using DSM-IV criteria as outlined
Depression and Anxiety in T2DM 30
above. This measure was validated in a convenience sample of 24 FDS2 participants
against the SCID-RV-Anxiety Disorders Module. Kappa statistics showed high
diagnostic concordance (kappa = 0.91). Eight of the 24 patients received a diagnosis of
lifetime GAD based on the SCID compared to 9 on the GAD-LT. Test-retest reliability
was assessed in another 24 participants who completed the GAD-LT twice, 9±6 days
apart. The intra-class correlation (ICC for total score = 0.96) was excellent.
For individuals who met L-MDD and L-GAD criteria, the time period rated,
episode duration, and number of past episodes was compared with the PHQ-9 and
GADS to ensure no overlap between current and past diagnoses. Individuals were
classified as having either pure MDD or pure GAD only, by excluding those with the
other disorder.
Statistical analysis
Statistical analyses were performed using IBM SPSS Statistics Version 21.
Approximately 7% of data were missing at random (Little’s MCAR χ2(15)=27.86,
P=0.02) and expectation maximization was used to impute missing values. The
expectation maximization method was chosen due to the small number of missing data
in the sample, and because this method produces unbiased estimates for data that are not
missing completely at random (MCAR) (SPSS Inc, 1989)3. Data are presented as
proportions, mean±SD or median [inter-quartile range, IQR] for non-normal variables.
Differences between demographic and clinical variables in individuals with and without
3 This sentence was added to this Chapter on examiner request, and was not included in the published manuscript.
Depression and Anxiety in T2DM 31
L-MDD and/or L-GAD were assessed using χ2 or independent-samples Student’s t-tests,
or Mann-Whitney U or Kruskall-Wallis tests for non-parametric data. Any variable for
which there was a significant between-group difference was then included as a covariate
in ANCOVA models that examined the independent and combined contribution of L-
MDD and L-GAD to current severity of depression and anxiety symptoms.
Indirect mediation models (Hayes, 2013) were then developed to investigate the
relationship between L-MDD/L-GAD and HbA1c, BMI, smoking status and SMBG (see
figure in Table 2). Given the expected association between lifetime history and more
severe current mood symptoms, we tested whether the relationship between L-MDD/L-
GAD and diabetes management may occur indirectly, i.e. whether L-MDD/L-GAD is
associated with more severe current depression or anxiety symptoms (path a) which in
turn predicts worse diabetes management and control (path b). This is known as the
mediation or indirect effect (path ab). We then investigated whether lifetime history
directly predicted any outcome of interest (the direct effect or path c’), after accounting
for the effect of current mood symptoms. The total effect (path c) reflects the overall
strength of the relationship between lifetime history and diabetes management/control,
and can be separated into the direct and indirect effect. Bootstrapped bias-corrected 95%
confidence intervals (CI) using 5,000 bootstrap samples (Hayes & Preacher, 2014) were
calculated, and the indirect effects were significant if these confidence intervals did not
span zero. Effects are presented as a regression coefficient (B). Given conservative
estimates and reduced Type 1 error inflation produced by bootstrapping confidence
intervals, our large sample size (Hayes & Scharkow, 2013) and the exploratory nature of
Depression and Anxiety in T2DM 32
this study, no adjustments were made for multiple comparisons (Rothman, 1990). A
two-tailed alpha of 0.05 was used throughout.
Results
The 1,549 adults with type 2 diabetes were aged 65.7 (±11.5) years at baseline
and 55.6 (±12.2) years at diabetes diagnosis, 52.0% were men, and 22.6% were insulin-
treated. Their median diabetes duration was 9.0 [3.0-15.9] years and median HbA1c
levels were 6.8 [6.2-7.7]% (51 [44-61] mmol/mol), with an absolute range of 4.0-17.2%
(20-164 mmol/mol). Ninety-three percent (1447) of the sample completed the PHQ-9
and 1426 (92.1%) completed the GADS (1416; 91.4% completed both), while 87%
(1341) completed the BLDS and 1454 (94.0%) completed the GAD-LT (1335; 86.2%
completed both). All four scales were completed by 1,285 (83.0%). The 264 non-
completers were more likely to be Aboriginal (24.6% vs. 3.1%, p<.001), prescribed
insulin (12.2% vs. 4.3%, p<.001), and less likely to have received education beyond
primary school (80.9% vs. 87.8%, p=.004). There were no between group differences in
age (65.5±12.9 years vs. 65.8±11.2, p=.83), disease duration (10 [3.0-17.0] vs 8.3[2.5-
15.7] years, p=.09), or gender (47.4% vs. 51.1%, p=.27).
Overall prevalence of depression and anxiety
Mild-severe depressive symptoms were reported by 34.2% of the sample and
15.7% were taking antidepressant medication at baseline. A graphic representation of the
prevalence and overlap in current and lifetime depression and anxiety diagnoses is
shown in Figure 1.
Depression and Anxiety in T2DM 33
Impact of lifetime depression and/or anxiety on current mood symptoms
Table 1 shows demographic and clinical characteristics of the FDS2 cohort by
lifetime depression and/or anxiety status. People with L-MDD only or L-MDD+L-GAD
had higher BMI, were younger, and were more likely to be female, unmarried, to smoke
and be on antidepressants, than those with no history of that disorder or combination of
disorders. L-GAD was associated with increased antidepressant use only, but did not
independently impact on clinical characteristics.
After controlling for age, gender, and marital status, ANCOVA models revealed
that L-MDD and L-GAD alone were each independently and strongly associated with
more severe current depression (L-MDD: F(1,1291)=297.21, P<0.001, partial ŋ2=0.19;
LGAD: F(1,1385)=267.31, P<0.001, partial ŋ2=0.16) and anxiety symptoms (L-MDD:
F(1,1285)=305.32, P<0.001, partial ŋ2=0.20; L-GAD: F(1,1385)=371.66, P<0.001,
partial ŋ2=0.21). In combination, comorbid L-MDD+L-GAD further elevated the
severity of anxiety (F(1,1390)=329.89, P<0.001, partial ŋ2=0.19) and depression
symptoms (F(1,1396)=222.26, P<0.001, partial ŋ2=0.14), relative to having either
disorder alone, or no history (all P<0.001).

Depression and Anxiety in T2DM 34
Figure 1. Representation of the overlap in prevalence of current (a) and lifetime (b)
MDD and GAD.

Depression and Anxiety in T2DM 35
Table 1.
Demographic, clinical and mood characteristics by lifetime history of depression and anxiety (N = 1335)
L-MDD only L-GAD only L-MDD+LGAD Characteristic
Yes No p-value
Yes No p-value
Yes No p-value
Demographic, clinical and self-management characteristics (N = 1335)
Number (%) 174 (17.6) 816 (82.4) 68 (7.7) 816 (92.3) 277 (25.3) 816 (74.7) Age at assessment (years)
62.2±11.3 67.3±10.9 <0.001 66.9±9.8 67.4±11.0 0.35 61.5±10.6 66.7±11.2 <0.001
Age at diabetes diagnosis (years)
52.7±11.7 57.0±16.0 <0.001 57.1±11.8 57.1±11.7 0.87 52.3±11.4 56.4±12.0 <0.001
Sex (% women) 57.6 42.8 <0.001 44.6 42.2 0.65 56.3 45.7 <0.001 Non-fluent in English (%)
8.2 11.3 0.69 9.2 10.9 0.52 6.5 11.1 <0.05
Education (% beyond primary level)
87.7 87.2 0.35 89.1 87.6 0.88 89.7 86.6 0.18
Married/partner (%) 56.1 67.7 <.05 70.8 67.3 0.59 56.3 65.7 <0.05 Diabetes duration (years)
10.8 [3.1-16.0]
9.0 [3.0-16.0]
0.61 9.0 [1.0-15.4]
9.0 [3.0-15.9]
0.46 7.0 [2.0-15.2]
9.0 [3.0-6.1]
0.06
Alcohol use (standard drinks/day)
0.1 [0.0-0.8]
0.1 [0.0-1.5]
0.05 0.1 [0.0-1.2]
0.1 [0.0-1.5]
0.27 0.1 [0.0-0.8]
0.1 [0.0-1.2]
0.17
Self-monitoring of blood glucose (%)
81.4 86.5 0.08 86.2 87.1 0.97 79.3 85.7 <0.001
HbA1c % (mmol/mol) 7.0 (53) 6.8 (51) 0.15 6.6 (49) 6.8 (51) 0.30 6.8 (51) 6.8 (51) 0.80 Current smoker (%) 15.5 7.1 <0.001 2.9 7.4 0.17 16.2 8.3 <0.001 BMI (kg/m2) 32.6±6.4 30.8±5.9 <0.001 30.6±5.5 30.8±5.9 0.93 32.1±6.6 31.1±6.1 <0.05 Taking antidepressants (%)
28.3 7.9 <0.001 19.1 7.0 <0.001 33.2 10.0 <0.001

Depression and Anxiety in T2DM 36
L-MDD only L-GAD only L-MDD+LGAD Characteristic
Yes No p-value
Yes No p-value
Yes No p-value
Current mood (N = 1285)* Number (%) 170 (17.6) 796 (82.4) 65 (7.5) 796 (92.5) 254 (24.2) 796 (75.8) PHQ-9 total score 4.0
[2.0-8.0] 1.0
[0.0-3.0] <0.001 3.0
[1.0-5.0] 1.0
[0.0-3.0] <0.001 8.0
[4.0-13.0] 2.0
[0.0-4.0] <0.001
GADS total score 6.0 [4.0-9.0]
3.0 [1.0-5.0]
<0.001 7.0 [4.0-10.0]
3.0 [1.0-5.0]
<0.001 10.0 [6.3-16.0]
3.0 [1.0-6.0]
<0.001
Note. HbA1c = glycated hemoglobin; PHQ-9 = Patient Health Questionnaire-9 item version; GADS = Generalized Anxiety Disorder Scale; L-MDD = lifetime major depressive disorder; L-GAD = lifetime generalized anxiety disorder; L-MDD+L-GAD = comorbid lifetime major depression and generalized anxiety disorders; data presented are unadjusted for multiple comparisons. *Of the 1335 participants who completed both the L-MDD and L-GAD questionnaires, 1285 also completed both the PHQ-9 and GADS.
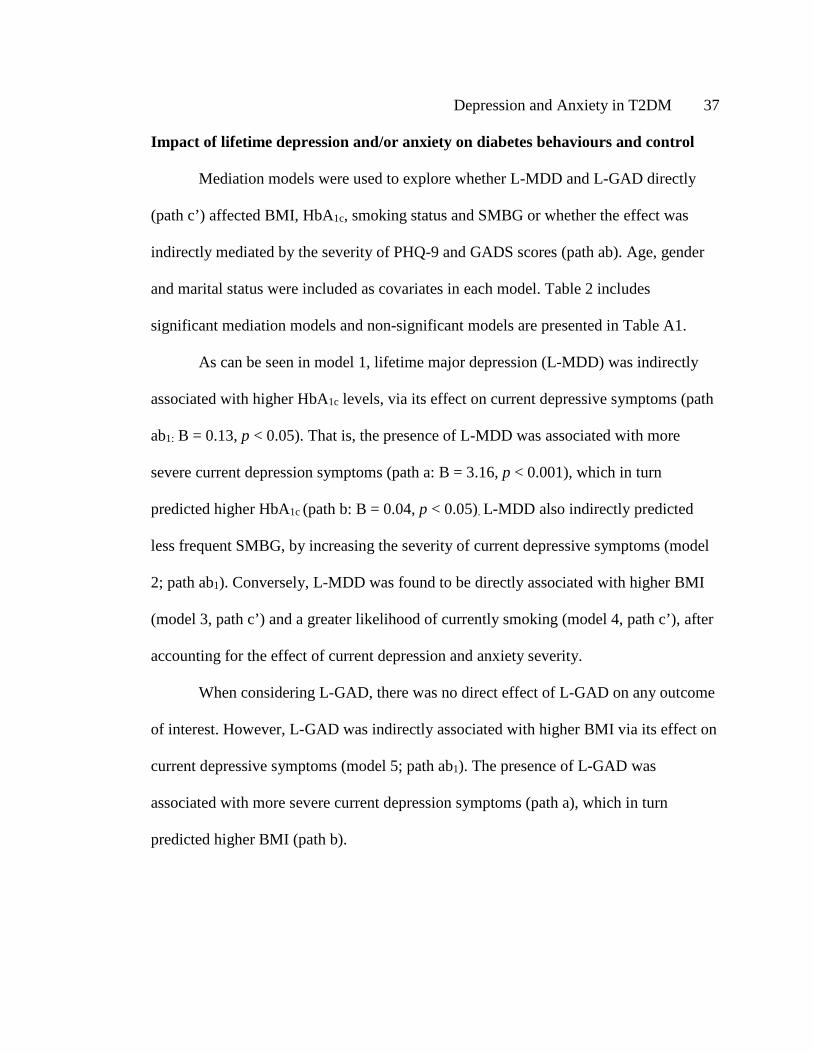
Depression and Anxiety in T2DM 37
Impact of lifetime depression and/or anxiety on diabetes behaviours and control
Mediation models were used to explore whether L-MDD and L-GAD directly
(path c’) affected BMI, HbA1c, smoking status and SMBG or whether the effect was
indirectly mediated by the severity of PHQ-9 and GADS scores (path ab). Age, gender
and marital status were included as covariates in each model. Table 2 includes
significant mediation models and non-significant models are presented in Table A1.
As can be seen in model 1, lifetime major depression (L-MDD) was indirectly
associated with higher HbA1c levels, via its effect on current depressive symptoms (path
ab1: B = 0.13, p < 0.05). That is, the presence of L-MDD was associated with more
severe current depression symptoms (path a: B = 3.16, p < 0.001), which in turn
predicted higher HbA1c (path b: B = 0.04, p < 0.05). L-MDD also indirectly predicted
less frequent SMBG, by increasing the severity of current depressive symptoms (model
2; path ab1). Conversely, L-MDD was found to be directly associated with higher BMI
(model 3, path c’) and a greater likelihood of currently smoking (model 4, path c’), after
accounting for the effect of current depression and anxiety severity.
When considering L-GAD, there was no direct effect of L-GAD on any outcome
of interest. However, L-GAD was indirectly associated with higher BMI via its effect on
current depressive symptoms (model 5; path ab1). The presence of L-GAD was
associated with more severe current depression symptoms (path a), which in turn
predicted higher BMI (path b).
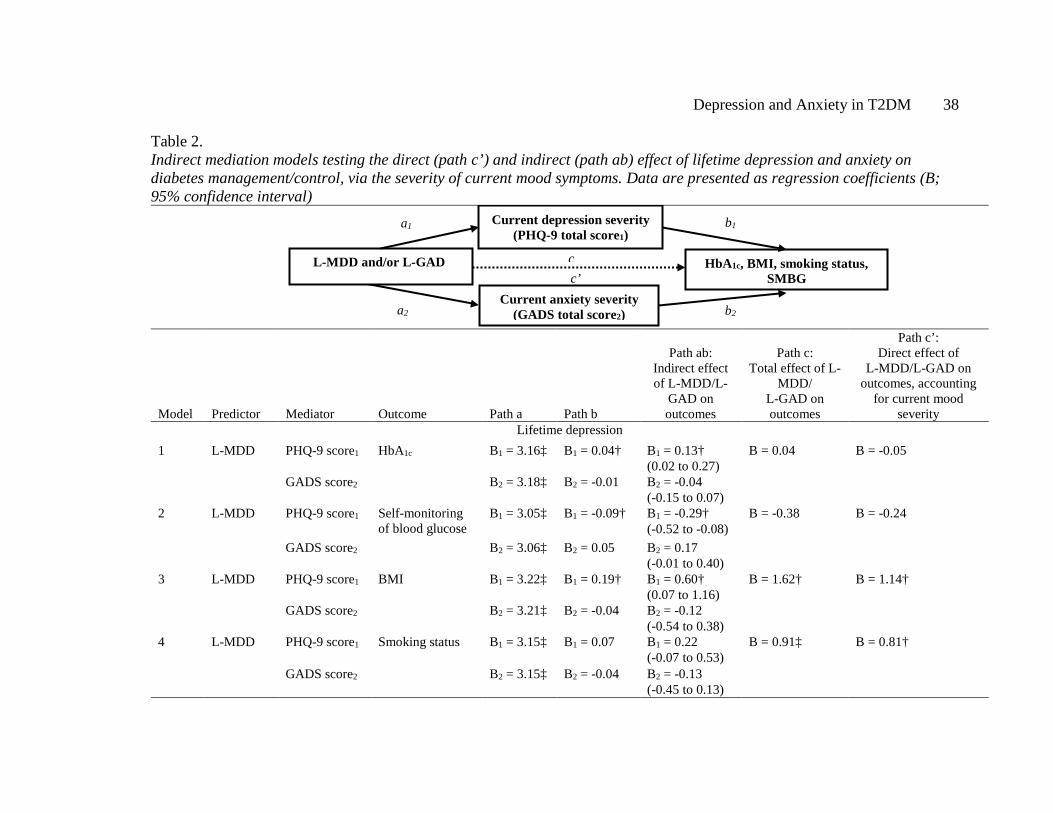
Depression and Anxiety in T2DM 38
Table 2. Indirect mediation models testing the direct (path c’) and indirect (path ab) effect of lifetime depression and anxiety on diabetes management/control, via the severity of current mood symptoms. Data are presented as regression coefficients (B; 95% confidence interval)
Model Predictor Mediator Outcome Path a Path b
Path ab: Indirect effect of L-MDD/L-
GAD on outcomes
Path c: Total effect of L-
MDD/ L-GAD on outcomes
Path c’: Direct effect of
L-MDD/L-GAD on outcomes, accounting
for current mood severity
Lifetime depression 1
L-MDD PHQ-9 score1 HbA1c B1 = 3.16‡ B1 = 0.04† B1 = 0.13† (0.02 to 0.27)
B = 0.04 B = -0.05
GADS score2 B2 = 3.18‡ B2 = -0.01 B2 = -0.04 (-0.15 to 0.07)
2 L-MDD PHQ-9 score1 Self-monitoring of blood glucose
B1 = 3.05‡ B1 = -0.09† B1 = -0.29† (-0.52 to -0.08)
B = -0.38 B = -0.24
GADS score2 B2 = 3.06‡ B2 = 0.05 B2 = 0.17 (-0.01 to 0.40)
3 L-MDD PHQ-9 score1 BMI B1 = 3.22‡ B1 = 0.19† B1 = 0.60† (0.07 to 1.16)
B = 1.62† B = 1.14†
GADS score2 B2 = 3.21‡ B2 = -0.04 B2 = -0.12 (-0.54 to 0.38)
4 L-MDD PHQ-9 score1
Smoking status B1 = 3.15‡ B1 = 0.07 B1 = 0.22 (-0.07 to 0.53)
B = 0.91‡ B = 0.81†
GADS score2 B2 = 3.15‡ B2 = -0.04 B2 = -0.13 (-0.45 to 0.13)
b2
c c
a2
a1 b1
c’
Current depression severity (PHQ-9 total score1)
L-MDD and/or L-GAD HbA1c, BMI, smoking status, SMBG
Current anxiety severity (GADS total score2)
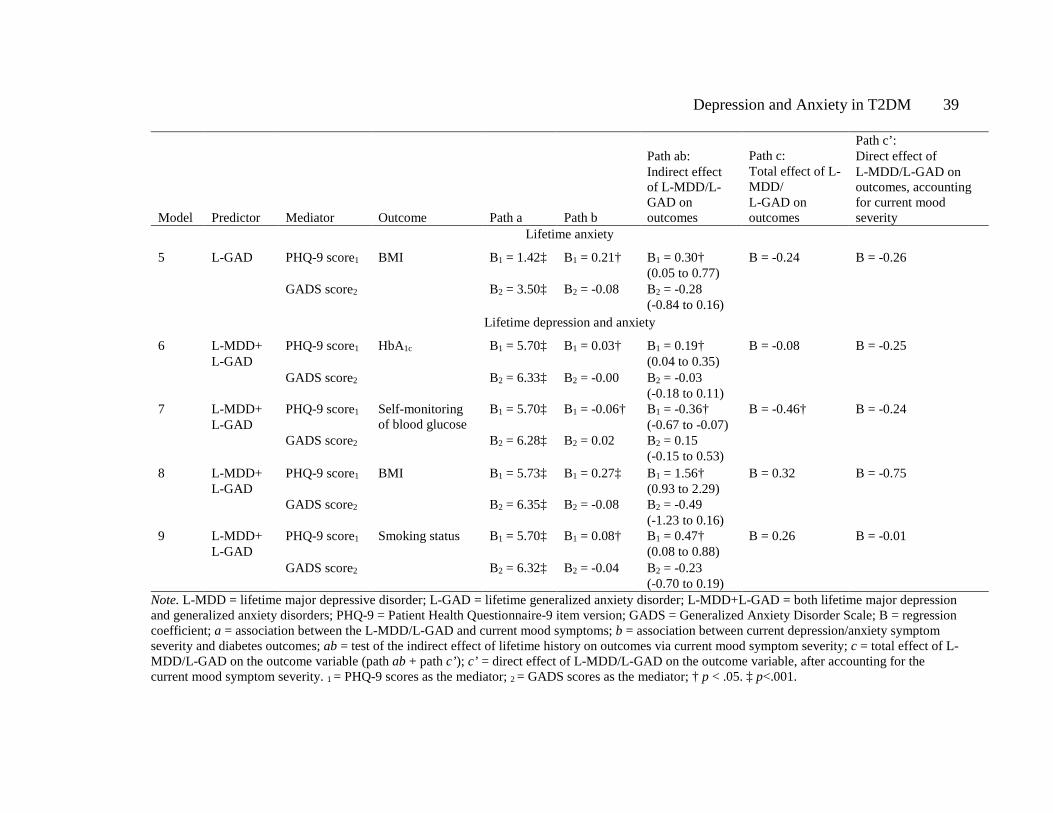
Depression and Anxiety in T2DM 39
Model Predictor Mediator Outcome Path a Path b
Path ab: Indirect effect of L-MDD/L-GAD on outcomes
Path c: Total effect of L-MDD/ L-GAD on outcomes
Path c’: Direct effect of L-MDD/L-GAD on outcomes, accounting for current mood severity
Lifetime anxiety
5 L-GAD PHQ-9 score1 BMI B1 = 1.42‡ B1 = 0.21† B1 = 0.30† (0.05 to 0.77)
B = -0.24 B = -0.26
GADS score2 B2 = 3.50‡ B2 = -0.08 B2 = -0.28 (-0.84 to 0.16)
Lifetime depression and anxiety
6 L-MDD+ L-GAD
PHQ-9 score1 HbA1c B1 = 5.70‡ B1 = 0.03† B1 = 0.19† (0.04 to 0.35)
B = -0.08 B = -0.25
GADS score2 B2 = 6.33‡ B2 = -0.00 B2 = -0.03 (-0.18 to 0.11)
7 L-MDD+ L-GAD
PHQ-9 score1 Self-monitoring of blood glucose
B1 = 5.70‡ B1 = -0.06† B1 = -0.36† (-0.67 to -0.07)
B = -0.46† B = -0.24
GADS score2 B2 = 6.28‡ B2 = 0.02 B2 = 0.15 (-0.15 to 0.53)
8 L-MDD+ L-GAD
PHQ-9 score1 BMI B1 = 5.73‡ B1 = 0.27‡ B1 = 1.56† (0.93 to 2.29)
B = 0.32 B = -0.75
GADS score2 B2 = 6.35‡ B2 = -0.08 B2 = -0.49 (-1.23 to 0.16)
9 L-MDD+ L-GAD
PHQ-9 score1 Smoking status B1 = 5.70‡ B1 = 0.08† B1 = 0.47† (0.08 to 0.88)
B = 0.26 B = -0.01
GADS score2 B2 = 6.32‡ B2 = -0.04 B2 = -0.23 (-0.70 to 0.19)
Note. L-MDD = lifetime major depressive disorder; L-GAD = lifetime generalized anxiety disorder; L-MDD+L-GAD = both lifetime major depression and generalized anxiety disorders; PHQ-9 = Patient Health Questionnaire-9 item version; GADS = Generalized Anxiety Disorder Scale; B = regression coefficient; a = association between the L-MDD/L-GAD and current mood symptoms; b = association between current depression/anxiety symptom severity and diabetes outcomes; ab = test of the indirect effect of lifetime history on outcomes via current mood symptom severity; c = total effect of L-MDD/L-GAD on the outcome variable (path ab + path c’); c’ = direct effect of L-MDD/L-GAD on the outcome variable, after accounting for the current mood symptom severity. 1 = PHQ-9 scores as the mediator; 2 = GADS scores as the mediator; † p < .05. ‡ p<.001.
Depression and Anxiety in T2DM 40
Finally, comorbid L-MDD+L-GAD were indirectly associated with all of the
outcomes of interest (models 6-9, significant path ab1). L-MDD+L-GAD were
significantly associated with higher HbA1c, BMI, smoking and less frequent SMBG, by
increased severity of current depression symptoms. Of note, current anxiety symptom
severity was not a significant mediator in any model.
Discussion
The results of the present large, community-based prospective study show that
lifetime depression and anxiety are significant risk factors for adverse psychological
outcomes, poorer health behaviour and worse glycaemic control in type 2 diabetes. As
previously demonstrated (Marcus et al., 1992), L-MDD was associated with more severe
current depressive symptoms but, for the first time, this finding was replicated for people
with L-GAD. L-GAD was present in approximately one quarter of our sample and was
significantly associated with more severe anxiety and depressive symptoms. Notably, L-
MDD had a marked impact on diabetes management. L-MDD alone was directly
associated with greater likelihood of current smoking and a higher BMI, and indirectly
associated with higher HbA1c and reduced SMBG. L-GAD alone was indirectly related
to higher BMI only through increased severity of current depression. These findings
indicate that the presence of a history of major depression in particular, is an important
early indicator of individuals at elevated risk of later psychological symptomatology and
worse diabetes management and glycaemic control.
These findings partially support those of Wagner and colleagues (Wagner et al.,
2010) who reported a direct association between L-MDD and higher HbA1c levels for
women without current depression. The present study found this relationship to be fully
explained by the severity of current depressive symptoms, as was the effect of L-MDD

Depression and Anxiety in T2DM 41
on SMBG. This suggests that, when present, current mood problems may play an equal
or greater role than lifetime depression in influencing glycaemic control. Instead, L-
MDD directly impacted on BMI and smoking status, which may be explained in part by
the chronicity of behaviours associated with smoking and overweight. Major depression
is a known risk factor for smoking and higher BMI, which tend to be more long-standing
issues and can increase the risk of developing diabetes (Katon, 2003). Importantly, all
assessed outcomes and behaviours in this study have been linked to increased risk of
adverse health outcomes and micro- and macrovascular complications (Bruce et al.,
2013; E. H. B. Lin, Katon, Michael Von, Rutter, & et al., 2004).
There has been no previous investigation of the overlap in lifetime depression
and anxiety in type 2 diabetes. Of considerable clinical importance is our finding that the
combination of L-MDD+L-GAD confers additional risk for more severe psychological
symptoms, higher BMI, worse glycaemic control, and increased likelihood of smoking,
than either disorder in isolation. These individuals were more likely to be women,
younger in age, and unmarried. This finding extends our previous study (Starkstein et
al., 2014) in which higher overlap in MDD and GAD was associated with the worst
outcomes. When presenting together, MDD and GAD are associated with reduced
remission in both disorders over time (Schoevers et al., 2005) and are recurrent
conditions in individuals with diabetes (Fisher et al., 2008). We suggest, therefore, that
there is screening for L-MDD and L-GAD at diabetes diagnosis, particularly in younger,
unmarried women, to identify individuals requiring earlier primary care or specialist
intervention, and/or more regular symptom monitoring. This is especially relevant when
individuals may not present with elevated mood symptoms within the first year
following diabetes diagnosis (Skinner et al., 2010). Identification of whether individuals
Depression and Anxiety in T2DM 42
developed depression/anxiety prior to or following diabetes onset, may also help inform
the most appropriate intervention (Bruce et al., 2013). Finally, routine monitoring of
depression symptoms in diabetes, especially for more at-risk individuals, provides
another important avenue for faster identification of worsening of symptoms and more
targeted treatment to improve long-term psychiatric and health outcomes.
The present study had some limitations. First, mediation analysis requires a
temporal relationship between the independent variable, mediator, and outcome4. As this
study was cross-sectional, conclusions regarding the direction of the relationship
between psychological symptoms and diabetes control and behavior are thus tentative.
Longitudinal follow-up of this cohort is ongoing, and will allow for stronger evidence
regarding the causal nature of these relationships. Second, assessment of depression and
anxiety disorders using gold standard structured clinical interviews was beyond the
scope of the present study. This methodology is not often feasible in large, community
based studies, and self-report measures of mood symptoms are frequently used to screen
for depression and anxiety (T. Roy, Lloyd, Pouwer, Holt, & Sartorius, 2012)5. We used
the PHQ-9, a valid and reliable instrument for assessing depression symptoms and
potential diagnosis (Kroenke & Spitzer, 2002; Spitzer et al., 1999), and the GADS,
which was designed to map directly on to DSM-IV criteria for GAD (Starkstein et al.,
2014), with both measures demonstrating high concordance with diagnostic interview
(Spitzer et al., 1999; Starkstein et al., 2014). The Generalized Anxiety Disorder 7-item
scale (GAD-7) was not used in the present study as it was not available when the study
4This sentence was added to this Chapter on examiner request, and was not included in the published manuscript. 5This sentence was added to this Chapter on examiner request, and was not included in the published manuscript.
Depression and Anxiety in T2DM 43
was designed. As previously reported, we believe the GADS is an improvement on the
GAD-7 as it assesses all DSM-IV/5 criteria for GAD over the past 6 months, while the
GAD-7 assesses a partial list of symptoms over the past 2 weeks (Starkstein et al.,
2014). Without partialling out the effect of the other disorder, the prevalence of current
MDD (5.7%), GAD (6.5%), L-MDD (29.2%) and L-GAD (23.0%) in the present study
were also equivalent to, or less than, those seen in other studies (Gonzalez, Peyrot, et al.,
2008; Grigsby et al., 2002; Starkstein et al., 2014) suggesting no issues with over-
diagnosis. However, symptoms of depression and anxiety assessed by the PHQ-9 and
GADS such as loss of energy, poor appetite, and overeating can be confounded with the
symptoms of poorly managed diabetes (T. Roy et al., 2012); thus it is possible that these
self-report measures may overestimate the prevalence of psychological symptoms in this
population. This is a common issue faced when assessing mood symptoms in chronically
ill populations, and while measures often separate items into cognitive or somatic
categories to address this problem, it is generally agreed that adopting an inclusive
approach and measuring all mood symptoms is preferred6.
Third, multiple comparisons performed when running the indirect mediation
models may inflate type 1 error. However, this is more likely to occur for multi-
categorical rather than binary (Yes/No) predictor variables (Hayes & Preacher, 2014).
Further, we applied 95% bias-corrected bootstrapped confidence intervals which is
recommended practice for providing conservative estimates with a reduced risk of error
(Hayes, 2013). Finally, we did not assess diabetes-related distress, which has also been
shown to impact on diabetes management (Fisher et al., 2008, 2010; Gonzalez, Peyrot,
6These two sentences were added to this Chapter on examiner request, and were not included in the published manuscript.
Depression and Anxiety in T2DM 44
et al., 2008). Elevated levels of distress may account for some of the relationship
between depression, anxiety and diabetes management and control in the present study.
In conclusion, a history of anxiety, depression or both significantly increases the
risk of the later symptomatic experience of these disorders and adverse glycaemic
control and behavioural management. The most important clinical implication of our
data is the need to consider the impact of both lifetime depression and anxiety on how
individuals with type 2 diabetes present currently, and the potential implications for
long-term health. We suggest that, through earlier identification and treatment of long-
standing depression and anxiety, the later risk of more severe psychological
symptomatology, worse glycemic control, and associated risk for health complications,
may be reduced.

Depression and Anxiety in T2DM 45
Chapter 3: Dealing with Missing Data in Longitudinal Analysis
Preface
Chapter 2 of this thesis outlined the contribution of lifetime MDD and GAD to
psychological symptom severity and diabetes management, in a cross-sectional design.
The next Chapter (Study 2) extends these findings by considering the course and pattern
of depression symptoms longitudinally in this population. As a preliminary step in data
analysis for Study 2, a number of methodological considerations were taken into account
to ensure the accuracy of analyses and to account for discrepancies in how data were
collected. Of particular interest, a primary problem in conducting longitudinal studies is
missing data (Enders, 2010; H. Lin, McCulloch, & Rosenheck, 2004), which can
frequently occur when individuals are followed up over multiple assessment points for a
number of years. This Chapter outlines common types of missing values observed in
longitudinal datasets, and the application of three longitudinal modeling techniques to
addressing these issues in the FDS2 depression data: missing at random; pattern-
mixture; and, selection-modeling (Enders, 2010; B. O. Muthén, Asparouhov, Hunter, &
Leuchter, 2011).
Depression and Anxiety in T2DM 46
Types of missing data
Three types of missing data are widely recognized in the literature. Firstly, data
can be missing due to another variable in the dataset (missing at random; MAR),
missingness can be completely unrelated to the data (missing completely at random;
MCAR), or missingness can be related to the variable of interest itself (not missing at
random; NMAR, Enders, 2010). Taking depression as an example, males, or those with
less English fluency, may be less likely to complete a self-report measure of their
symptoms (e.g. on the Patient Health Questionnaire-9; PHQ-9, Kroenke & Spitzer,
2002) leading to the data being MAR. Alternatively, the variable of interest itself, in this
case depression, may impact on completion of the PHQ-9 at later time points: for
example those who are more depressed may be more likely to drop-out of a study, or fail
to complete the PHQ-9 without support (e.g. at home, compared to with a researcher
when attending an appointment; NMAR). Within these types of missing data, missing
values can also be systematic or intermittent in nature. There may be a systematic
pattern to individuals’ who drop-out of the study (e.g. those who are more depressed
drop out earlier), or individuals may come and go throughout a study and have missing
data at some time points but continue to participate (termed intermittent missingness; H.
Lin et al., 2004). The type of missing data will determine how missingness is accounted
for in further analyses, and the context in which results are interpreted.
The following sections outline a) missing values analysis performed to determine
the nature of missing depression data7, b) modeling techniques employed to address the
7 Missingness was not a problem for GADS anxiety data, so this is dealt with in Chapter 5.

Depression and Anxiety in T2DM 47
issue of missingness in Study 2, and c) methodological implications for future
longitudinal research.
Data collection and study procedures
The assessment of depression symptoms throughout this thesis was performed
using the PHQ-9 (Kroenke & Spitzer, 2002). As stated in Study 1, this measure has high
sensitivity to change in depression over time (Löwe, Kroenke, Herzog, & Gräfe, 2004),
good diagnostic concordance with clinical interview (Spitzer et al., 1999), and is
validated for use in type 2 diabetes (Lin, Katon, Von Korff, Rutter, & et al., 2004; van
Steenbergen-Weijenburg et al., 2010). The PHQ-9 was collected at a maximum of 6
occasions for individuals entering the study between 2008 and 2011. This measure was
completed at face-to-face assessment when patients attended for baseline (Year 0) or
biennial interview, at 2-year (Year 2), and 4-year (Year 4) follow-up at Fremantle
Hospital. In the intervening years, the questionnaire was mailed to participants (Years 1,
3, and 5) and returned via reply-paid envelope. Complete data at all 6 time points were
available for 195 participants, 294 had complete data at 5 time points, 225 at 4, 269 at 3,
218 at 2, and 288 participants had data at one time point only.
Missing Values Analysis
To determine the amount and nature of missing data on the PHQ-9, missing
values analyses were performed in IBM SPSS Statistics Version 23. At the first stage,
analyses were performed at the item-level to examine patterns of missing items on the
PHQ-9 at each visit. This was performed for individuals with 8 or fewer missing items,
as individuals with 9 missing items had not completed the scale. At the second stage,
analyses were performed at the scale-level to examine patterns of drop-out and scale
non-completion over time.
Depression and Anxiety in T2DM 48
Item-level missing values analysis
At each time point, the Little’s MCAR statistic was calculated to examine
patterns of missingness with a non-significant p-value indicating that items were missing
completely at random (MCAR). Little’s MCAR was significant at Year 0, χ2 = 188.70, p
< .001, Year 1, χ2 = 243.57, p =.004, Year 3, χ2 = 342.72, p < .001, and Year 5, χ2 =
211.90, p < .001, suggesting that items were not missing completely at random.
However, as there was less than 5% missingness on items of the PHQ-9 at each time
point, examination of factors related to item missingness was not performed. Following
recommendations (Enders, 2010; SPSS Inc, 1989) expectation maximization (EM)
estimation was then employed to impute missing values for individuals with up to 3
missing items on the PHQ-9. Individuals with 4 or more missing items on the PHQ-9 at
any time point were excluded, as valid total scores could not be calculated. The resultant
scale totals were used for all subsequent analyses.
Scale-level missing values analysis
To examine factors associated with non-completion of the PHQ-9 longitudinally,
missing values analyses were performed using the scale totals derived following EM
imputed data for item scores, at each time point. PHQ-9 total scores for each time point
were entered together into the analyses, which revealed that Little’s MCAR was
significant, χ2 = 197.38, p =.027, indicating data were not MCAR. Separate variance t-
tests revealed that, at certain time-points, non-completion of the PHQ-9 was related to
the severity of depressive symptoms at other assessments. Higher PHQ-9 scores at Year
0 were associated with more missingness at Year 2, t (36.9) = -2.4, p = .023, and more
severe depression symptoms at Year 1 were significantly associated with more
missingness at Year 2, t (802.2) = -3.8, p < .001, Year 3, t (135.4) = -4.5, p < .001, and
Depression and Anxiety in T2DM 49
Year 4, t (543.6) = -3.0, p = .003. Demographic and clinical factors did not significantly
affect missingness (all ps > .05). Taken together, these data suggest that the severity of
individuals’ depression symptoms earlier in this study affected rates of scale non-
completion longitudinally. This indicates systematic and non-ignorable missingness in
the data and that data were NMAR (Enders, 2010; SPSS Inc, 1989). That is, the
probability of a missing PHQ-9 score was dependent on the severity of previous
depression scores. The remainder of this Chapter discusses longitudinal modeling
approaches designed to deal with NMAR data, and the application of these approaches
to PHQ-9 data in Study 2.
Longitudinal methods for modeling missing data
The primary research aim of Study 2 was to investigate how depression
symptoms, as assessed by the PHQ-9, develop and change over the course of type 2
diabetes. Therefore, a modeling approach that addresses this question in addition to
incorporating longitudinal NMAR data will be discussed for the remainder of this
Chapter.
To examine the course and pattern of depression symptoms over time, latent
curve growth analysis (LCGA) was performed using Mplus Version 7 (L. K. Muthén &
Muthén, 1998). This analysis investigates whether there are unobserved sub-groups
(classes) of individuals who show similar patterns of change on an outcome of interest
(e.g. PHQ-9 scores) over time, and estimates the probability of each individual
belonging to a particular class (Jung & Wickrama, 2008; Ram & Grimm, 2009). LCGA
then determines the number of classes or groups that best fit the data, and best represent
the pattern of change in that variable over time. Within the LCGA model, there are three
primary approaches which apply different methodologies to incorporating missingness;
Depression and Anxiety in T2DM 50
the missing at random (MAR) model, pattern-mixture model (PMM) and Diggle-
Kenward selection-model (Diggle-Kenward SM). Although data for this Chapter are
assumed to be NMAR, the MAR model is discussed in order to address the underlying
differences between this approach and those models designed specifically for NMAR
data.
Missing at random (MAR) modeling. The MAR model is the most commonly
performed modeling procedure for longitudinal curve growth analyses. This approach
incorporates systematic missingness into model development, whereby the likelihood of
missing data at Year x can relate to depression scores from previous assessments
(Enders, 2011b). In Mplus, the MAR model is estimated using Full Information
Maximum Likelihood (FIML) estimation. Strengths of the FIML procedure are that this
approach uses all available data to generate parameter estimates (Enders, 2010; Enders
& Bandalos, 2001) rather than excluding incomplete cases or missing values, and in
doing so maximizes the amount of data included. However, MAR models do not account
for non-ignorable missingness, which is incorporated into the following two models.
Pattern-mixture modeling (PMM). PMM incorporates missingness by
separating the sample into subgroups of individuals who share similar missing data
patterns (Enders, 2011). For example, individuals who all drop out after Year 1 may
share pattern a, all those who drop-out after Year 3 share pattern b, and all individuals
who complete the PHQ-9 at Year 0, 2, and 4 only (e.g. when assessed in person at
interview) would share pattern c. Then, PMM models a single growth curve and unique
model estimates for each pattern, and combines these to produce average estimates and
standard errors for the overall model (Enders, 2011a). This method assumes that subjects
in each pattern share a common response distribution. However, this assumption has
Depression and Anxiety in T2DM 51
been criticized (J. Roy, 2003), as individuals within each pattern may drop out for many
reasons, and where there are multiple patterns these may have small samples which bias
estimates. To account for this, the Roy latent dropout pattern-mixture model (Roy-
PMM) has been proposed. This method uses a latent class variable that is influenced by
dropout time, and influences the random effect for the outcomes (B. O. Muthén et al.,
2011). That is, Roy-PMM assumes class membership is unknown (J. Roy, 2003) and
that class membership is related to, but separate from, dropout times. In doing so, this
model views the formation of latent subgroups as a better dropout classification of
subjects than using observed dropout time (B. O. Muthén et al., 2011; J. Roy, 2003), as
in traditional PMM.
Selection-modeling (SM). Selection models, instead, deal with NMAR data by
combining a growth curve model with a set of regression equations that predict
missingness (Enders, 2011a). These models relate the probability of missing data at time
t to the outcome variable at time t (and at previous assessments; Enders, 2011). In doing
so, selection models such as the Diggle-Kenward model, allow modeling of the
relationships between the outcome variable across visits and the influence of proceeding
measures of outcomes on later missingness. The repeated measures variables predict the
probability of missing data at a particular wave (Enders, 2011a), thus accounting for
non-ignorable dropout and intermittent missingness. Similar to PMM, a number of
difficulties in running these models have been highlighted. This includes the assumption
of multivariate normality, meaning that even small deviations from normality in the data
can bias the model (Enders, 2011a).
Depression and Anxiety in T2DM 52
Application of NMAR modeling approaches to PHQ-9 data
As missing values analyses in SPSS revealed that the PHQ-9 data were NMAR
over time, Muthén and colleagues’ (B. O. Muthén et al., 2011) recommendations for
dealing with non-ignorable dropout were followed. Given the aforementioned
limitations of each method in modeling missingness, Muthén et al. (2011) recommend
running MAR, PMM, Roy-PMM, and Diggle-Kenward SM methods and comparing
results to determine the best approach to the data (B. O. Muthén et al., 2011). If all
approaches agree, then the MAR model can be considered supported (B. O. Muthén et
al., 2011). However, if the MAR model differs to the PMM and Diggle-Kenward SM
models’ in substantive ways, then NMAR results may better reflect the data. Finally, if
all three approaches differ, all results should be presented, as there is no statistical basis
for preferring one method of modeling to another.
Statistical analyses
At the first step, to determine the best fitting number of classes for each method,
LCGA for each of the above modeling techniques was run with 2-4 classes and a
quadratic fit. A conventional 1-class MAR model was also generated as a comparison
(B. O. Muthén et al., 2011). The best fitting number of classes within each method was
decided based on a combination of the following fit indices: the Bayesian Information
Criterion (BIC) which measures goodness of fit and model parsimony, where lower
scores indicate better fit (Jung & Wickrama, 2008); the Vuong-Lo-Mendell-Rubin
Likelihood Ratio Test (LRM-LRT), with significant values indicating improvement in
model fit when adding an extra class compared to the previous model (Lo, Mendell, &
Rubin, 2001); high entropy (near 1.0), considered to reflect good precision of the model
in classifying individuals to each class (Jung & Wickrama, 2008; Nagin, 2005); and the
Depression and Anxiety in T2DM 53
percentage of individuals in each class, with less than 5% in any given class considered
too small and suggesting exclusion of that class.
At the second step, the best fitting number of classes for each method was
compared based on the shape of growth curves generated and the number of individuals
who were classified into each group. This allows for exploration of whether non-
ignorable/intermittent missingness of the PHQ-9 data had an influence on the latent
growth curves generated in the MAR model, relative to when estimated using
approaches developed to account for NMAR data. The final method for modelling
longitudinal PHQ-9 data was chosen based on the degree of similarity or difference
between all models, in addition to computational burden, parsimony and model
interpretability (B. O. Muthén et al., 2011; Ram & Grimm, 2009).
Results
Of the 1549 individuals recruited to the FDS2 with clinically diagnosed type 2
diabetes, 1505 had PHQ-9 data at 1 or more time points and were thus included in the
LCGA. Tables 3-5 below present the model fit indices for the MAR, PMM, and Roy-
PMM models. Given the complexity and computational burden of selection-modeling
procedures (Enders, 2011b), the Diggle-Kenward SM 2-4 class models did not converge
and produced biased estimates. Unbiased models were unable to be generated, and
therefore the results of these models could not be trusted and have not been reported
here.
As can be seen in Table 3-5, there was agreement across the MAR, PMM and
Roy-PMM models that a 4-class solution had the lowest BIC value, suggesting best fit.
However, for all models, the 4-class solution did not significantly improve model fit
beyond the 3-class model (LRM-LRT p > .05) and the fourth class comprised fewer than

Depression and Anxiety in T2DM 54
5% of the sample. Based on a combination of these model fit indices, parsimony and
interpretability of the model, a 3-class solution was chosen for each method as the best-
fitting model for the longitudinal PHQ-9 data.
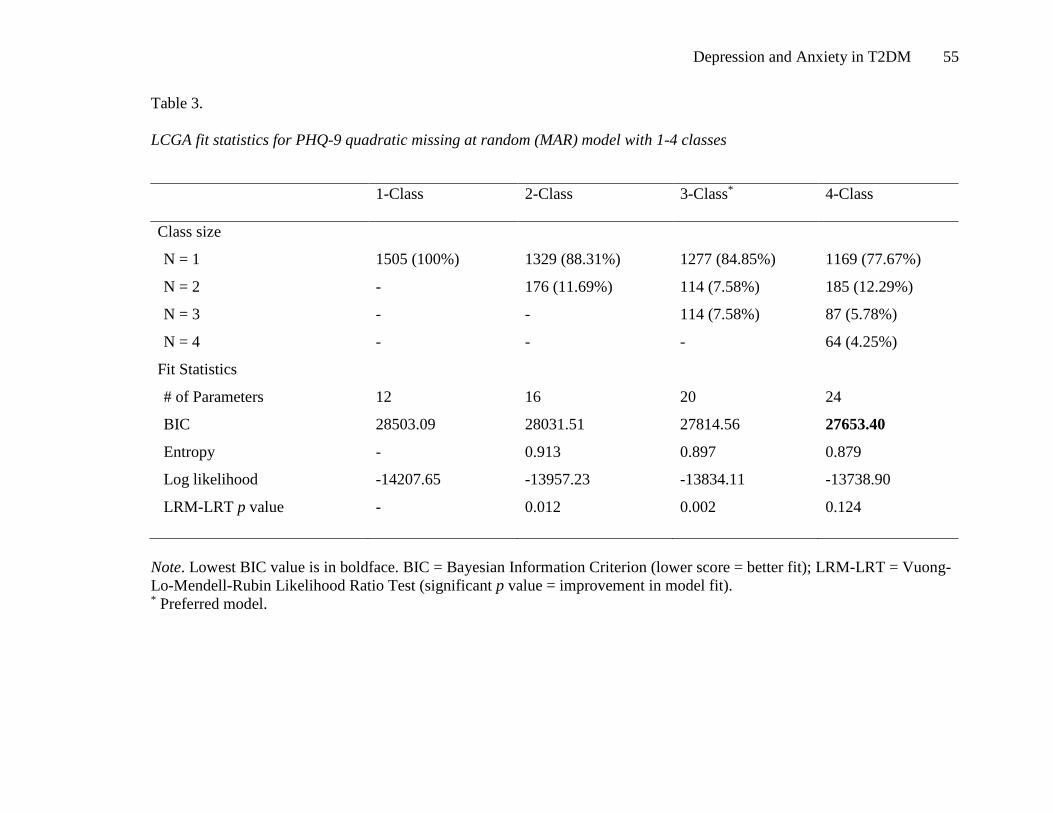
Depression and Anxiety in T2DM 55
Table 3.
LCGA fit statistics for PHQ-9 quadratic missing at random (MAR) model with 1-4 classes
Note. Lowest BIC value is in boldface. BIC = Bayesian Information Criterion (lower score = better fit); LRM-LRT = Vuong-Lo-Mendell-Rubin Likelihood Ratio Test (significant p value = improvement in model fit). * Preferred model.
1-Class 2-Class 3-Class* 4-Class
Class size
N = 1 1505 (100%) 1329 (88.31%) 1277 (84.85%) 1169 (77.67%)
N = 2 - 176 (11.69%) 114 (7.58%) 185 (12.29%)
N = 3 - - 114 (7.58%) 87 (5.78%)
N = 4 - - - 64 (4.25%)
Fit Statistics
# of Parameters 12 16 20 24
BIC 28503.09 28031.51 27814.56 27653.40
Entropy - 0.913 0.897 0.879
Log likelihood -14207.65 -13957.23 -13834.11 -13738.90
LRM-LRT p value - 0.012 0.002 0.124

Depression and Anxiety in T2DM 56
Table 4.
LCGA fit statistics for PHQ-9 quadratic pattern mixture model (PMM) with 2-4 classes
2-Class 3-Class* 4-Class
Class size
N = 1 1346 (8.94%) 1280 (85.05%) 1163 (77.28%)
N = 2 159 (10.57%) 116 (7.71%) 191 (12.69%)
N = 3 - 109 (7.24%) 87 (5.78%)
N = 4 - - 64 (4.25%)
Fit Statistics
# of Parameters 28 32 36
BIC 28093.15 27887.80 27720.88
Entropy 0.914 0.896 0.880
Log likelihood -13944.15 -13826.84 -13728.74
LRM-LRT p value 0.010 0.004 0.111
Note. Lowest BIC value is in boldface. BIC = Bayesian Information Criterion (lower score = better fit); LRM-LRT = Vuong-Lo-Mendell-Rubin Likelihood Ratio Test (significant p value = improvement in model fit). * Preferred model.

Depression and Anxiety in T2DM 57
Table 5.
LCGA fit statistics for PHQ-9 quadratic Roy-pattern mixture model (Roy-PMM) with 2-4 classes
2-Class 3-Class* 4-Class
Class size
N = 1 1328 (88.24%) 1267 (84.19%) 1199 (79.67%)
N = 2 177 (11.76%) 124 (8.24%) 130 (8.64%)
N = 3 - 114 (7.58%) 130 (8.64%)
N = 4 - - 46 (3.06%)
Fit Statistics
# of Parameters 21 30 39
BIC 28035.66 27841.87 27721.05
Entropy 0.914 0.892 0.890
Log likelihood -13941.01 -13811.19 -13717.85
LRM-LRT p value 0.005 0.006 0.132
Note. Lowest BIC value is in boldface. BIC = Bayesian Information Criterion (lower score = better fit); LRM-LRT = Vuong-Lo-Mendell-Rubin Likelihood Ratio Test (significant p value = improvement in model fit). * Preferred model.
Depression and Anxiety in T2DM 58
Table 6 presents a comparison of fit statistics for the 3-class preferred model for
MAR, PMM and Roy-PMM models. There was similarity between all 3-class models in
terms of model fit and parsimony, as indicated by similar BIC values and high entropy.
These models were then compared on similarities in the shape of growth curves for each
class, and the proportion of individuals classified to each class. As can be seen in Figure
2, the shapes of growth curves for the 3-class model were similar across methods. Each
method of modeling missingness displayed a class with low depression symptoms over
time (Class 1), a class with depression symptoms that worsened then began to improve
(Class 2), and a class with depression symptoms that began to improve and worsened
again (Class 3). There were only slight differences between the percentages of
individuals classified into each class across methods. Taken together, these findings
indicate agreement between MAR and NMAR (pattern-mixture) methods for modeling
missingness, and that the nature of missing depression data observed in this study did
not significantly affect model results. The MAR model was therefore supported, and this
method is applied to PHQ-9 data in all subsequent Chapters of this thesis.
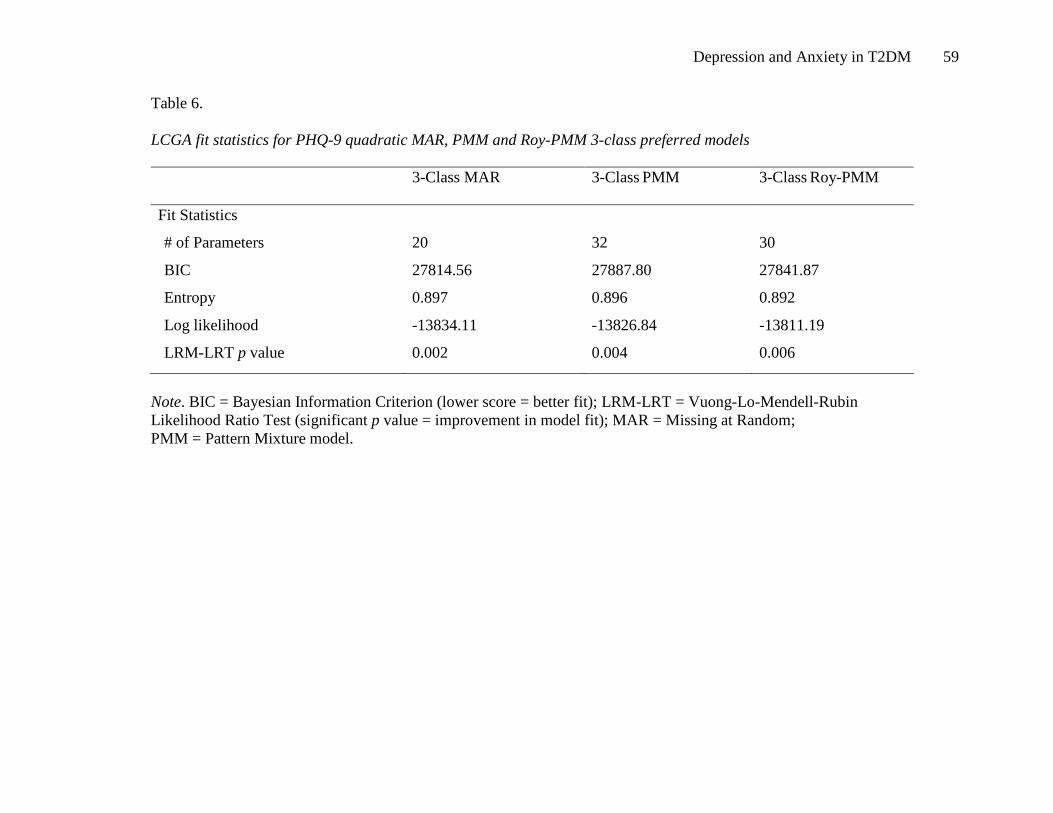
Depression and Anxiety in T2DM 59
Table 6.
LCGA fit statistics for PHQ-9 quadratic MAR, PMM and Roy-PMM 3-class preferred models
3-Class MAR 3-Class PMM 3-Class Roy-PMM
Fit Statistics
# of Parameters 20 32 30
BIC 27814.56 27887.80 27841.87
Entropy 0.897 0.896 0.892
Log likelihood -13834.11 -13826.84 -13811.19
LRM-LRT p value 0.002 0.004 0.006
Note. BIC = Bayesian Information Criterion (lower score = better fit); LRM-LRT = Vuong-Lo-Mendell-Rubin Likelihood Ratio Test (significant p value = improvement in model fit); MAR = Missing at Random; PMM = Pattern Mixture model.

Depression and Anxiety in T2DM 60
Figure 2. Mean, estimated PHQ-9 total scores for the preferred 3-class quadratic
LCGA models for a) MAR, b) PMM, and c) Roy-PMM models.

Depression and Anxiety in T2DM 61
Discussion
Missing data are a problem commonly faced by researchers undertaking
longitudinal cohort studies, and multiple methods have been proposed to account for
this. This Chapter provided an applied example of newly emerging modeling techniques
specifically designed to account for systematic and non-ignorable (NMAR) missing
data. The findings suggest that, relative to NMAR methods, a MAR model was the most
representative and parsimonious fit for the PHQ-9 data, as it was not significantly biased
by the nature of missingness in the study. By comparing MAR and NMAR approaches,
more informed decisions relating to the nature of missingness and the effect on results
are allowed. However, as with all missingness approaches, there are a number of
strengths and limitations that also require addressing.
Longitudinal modeling approaches to missingness: strengths and difficulties
MAR and NMAR modeling approaches have a number of strengths that build on
the difficulties faced by traditional methods. Traditional methods include listwise or
pairwise deletion, which require data to be MCAR (Enders & Bandalos, 2001). Listwise
deletion involves excluding any individuals who do not have a complete case for all
variables, and pairwise deletion utilizes all available data by deleting cases on a variable
by variables basis (Enders & Bandalos, 2001). Both methods can produce biased
estimates if data are MAR or NMAR (Enders, 2010) rather than MCAR. Further,
analyzing data only for those with complete cases excludes individuals who may have
intermittent missing data (e.g. come and go throughout the study but do not drop out),
Depression and Anxiety in T2DM 62
and those with non-ignorable missingness (e.g. those who dropout as they are more
depressed). In doing so, any estimates produced are biased by the samples that remain.
In contrast, MAR and NMAR modeling approaches for dealing with missing
data aim to include as many cases as possible and to incorporate predictors of
missingness into the model, and are thus significant improvements on earlier methods.
These methods have not been widely used in the behavioural research (Enders, 2010)
and provide a novel and potentially important avenue for dealing with the complexity of
missingness in longitudinal psychological data. However, while NMAR models provide
a strong alternative to deletion techniques, these procedures can also be biased by their
underlying assumptions. For example, pattern-mixture models involve accurate
specification of the values of inestimable parameters, and selection-models rely on the
underlying assumption of normality, which is hard to test (Enders, 2010; B. O. Muthén
et al., 2011). Further, the Diggle-Kenward method has very heavy computational burden
(B. O. Muthén et al., 2011) and, possibly due to underlying non-normality of the present
data, produced biased estimates so could not be included in the results of this Chapter.
The potential that selection modeling may have provided a different pattern of findings
cannot be ruled out. This difficulty highlights the issues associated with using such
methods for dealing with non-ignorable dropout, and that any decision made needs to
discuss the potential for bias even after missingness has been accounted for.
Methodological implications
The findings of this Chapter provide an example methodology of how to deal
with NMAR data in longitudinal modeling. This is one of the few studies to apply

Depression and Anxiety in T2DM 63
pattern-mixture and selection modeling to a psychological data set, and provides a novel
discussion of the decision-making process behind dealing with the complexity of
missingness. These approaches, whether they agree or not, provide a significant
improvement on deletion methods (Enders, 2010). Specific mechanisms of missing data,
for example data that are missing due to the outcome of interest, can be addressed and
individuals with intermittent missingness can remain in the study. Further, these
methods provide a critical way of testing whether the MAR model is trustworthy for
data that are NMAR (B. O. Muthén et al., 2011). However, even when NMAR
mechanisms are found, selection and pattern-mixture models may not necessarily be the
best solution (Enders, 2010). Therefore, we suggest, based on Muthén et al.’s
recommendations (B. O. Muthén et al., 2011), that any decisions made regarding how to
incorporate missing data should be based on consideration of all available approaches.
While further research is needed regarding the best application of these
approaches to the psychological and behavioural sciences, this Chapter suggests that
longitudinal MAR and NMAR modeling approaches provide a useful and
methodologically sound method for modeling missing data. The next Chapter of this
thesis (Study 2) therefore incorporates this approach into further modeling of
longitudinal PHQ-9 data.

Depression and Anxiety in T2DM 64
Depression and Anxiety in T2DM 65
Chapter 4: Depression Symptoms Are Persistent In Type 2 Diabetes: Risk Factors
And Outcomes Of 5-Year Depression Trajectories Using Latent Class Growth
Analysis.
Preface
A complicating factor in the successful management of depression in T2DM, is
the potential fluctuation and interplay between both depression and diabetes over time.
While this relationship is known to be bi-directional, longitudinal associations between
changes in depression and changes in diabetes-related outcomes are unclear. This
Chapter adapted the best-fitting Missing At Random LCGA model for longitudinal
PHQ-9 data identified in Chapter 3, to examine demographic, psychological, and
diabetes-specific predictors of the course of depression symptoms in T2DM.
Associations between the course of depression symptoms, and changes in weight,
glycaemic control, and self-management were then explored.
This chapter was published in the journal Diabetic Medicine: Whitworth, S.R.,
Bruce, D.G., Starkstein, S.E., Davis, W.A., Davis, T.M.E., Skinner, T.C., Bucks, R.S.
(2017). Depression symptoms are persistent in type 2 diabetes: risk factors and
outcomes of 5-year depression trajectories using latent class growth analysis. Diabetic
Medicine; 34; 1108-15. It is presented below, as published, but formatted for
consistency with the rest of the thesis.

Depression and Anxiety in T2DM 66
Abstract
Aims: Depression is common in type 2 diabetes and confers a poor prognosis, yet the
longitudinal course of depression symptoms in this population is unclear. This study
aimed to describe long-term trajectories of depression symptom severity, and to identify
predictors and associates of these trajectories.
Methods: A community-dwelling cohort of 1,201 individuals with type 2 diabetes from
the Fremantle Diabetes Study-Phase II (FDS2) was followed for 5 years. The PHQ-9
was administered annually to assess depression symptoms, and biomedical and
psychosocial measures were assessed at baseline and biennially. Latent class growth
analysis was used to identify classes of depression severity trajectories and associated
outcomes, and logistic regression models determined predictors of class membership.
Results: Three trajectories of depression symptoms were identified: continuously low
depression symptoms (85.2%), gradually worsening symptoms that then began to
improve (persistent depression – low-start, 7.3%), and gradually improving symptoms
which later worsened (persistent depression – high-start, 7.5%). Younger age, being a
woman, and a lifetime history of major depressive disorder, were associated with greater
risk of persistent depression symptoms. Persistent depression was associated with
consistently higher body mass index (BMI) over time, but not with changes in HbA1c or
self-monitoring of blood glucose (SMBG).
Conclusions: A sub-set of individuals with type 2 diabetes is at risk of depression
symptoms that remain elevated over time. Younger, overweight individuals with a

Depression and Anxiety in T2DM 67
history of depression may benefit from early and intensive depression management and
ongoing follow-up as part of routine type 2 diabetes care.
Depression and Anxiety in T2DM 68
Introduction
Depression is prevalent in type 2 diabetes (Type 2 DM) and results in impaired
diabetes self-management, worse glycaemic control, increased healthcare use, and
increased complications and mortality (de Groot et al., 2001; Egede et al., 2002;
Gonzalez et al., 2007). The relationship is bidirectional, whereby depression increases
the risk of diabetes and vice versa (Bruce et al., 2013; Renn et al., 2011). Given the
adverse clinical impact, routine screening for depression has been recommended (Egede
et al., 2002). However, little is known about the course of depressive symptomatology in
this population.
Longitudinal studies reveal that depression in diabetes is often recurrent and
persistent (Fisher et al., 2008; Lustman et al., 1997; Nefs et al., 2012; Schmitz et al.,
2014). These studies assessed depression at discrete time-points, and defined depression
by diagnostic criteria or scoring above a cut-point on depression scales. More gradual
changes in depression symptoms over time are, thus, overlooked. Individuals with sub-
threshold depression symptoms may be at risk of reduced function and poor quality of
life and could benefit from treatment (Schmitz et al., 2014). Identifying longitudinal
trajectories of depression symptoms may better reflect the underlying heterogeneity in
symptom experience across individuals (Rzewuska et al., 2015).
In addition, investigating associations between temporal changes in depression
symptoms and diabetes management may be revealing. While major depression is
associated with higher body mass index (BMI), less frequent self-monitoring of blood
glucose (SMBG) and worse glycaemic control (Ciechanowski et al., 2003; E. H. B. Lin
Depression and Anxiety in T2DM 69
et al., 2004; Lustman & Clouse, 2005), the longitudinal relationship between depression
severity and these outcomes remains unclear (Fisher et al., 2010; Gonzalez et al., 2007;
Gonzalez, Safren, et al., 2008).
The primary aims of this study were to describe trajectories of depression
symptoms over a 5-year period in 1,201 participants with Type 2 DM, identify
predictors of depression trajectories, and to explore associations between depression
trajectories and longitudinal changes in glycaemic control, BMI, and SMBG.
Subjects and methods
Study sample
The Fremantle Diabetes Study Phase II (FDS2) is an ongoing, longitudinal study
of known diabetes, conducted in a postcode-defined, geographic area surrounding the
city of Fremantle in the state of Western Australia. Participants (N = 1732) were
recruited between 2008 and 2011 through physician and allied health referrals, hospital
databases and local advertising (Davis et al., 2013). Of these, 1549 were aged >18 years,
had clinically diagnosed Type 2 DM and were eligible for this study. FDS2 was
approved by the Human Research Ethics Committees of the South Metropolitan Area
Health Service and the University of Western Australia, and participants gave written,
informed consent.
Study procedures
Comprehensive clinical, biochemical, demographic, depression and psychosocial
data were collected at three face-to-face assessments: baseline (Year 0), 2-year follow-
up (Year 2), and 4-year follow-up (Year 4). The collected information included all
Depression and Anxiety in T2DM 70
medications, weekly frequency of SMBG, current smoking status and the number of
General Practitioner (GP) and outpatient visits. A postal questionnaire in the intervening
years (Years 1, 3 and 5) provided additional depression data for up to 6 occasions.
Complete depression data at all 6 time points were available for 195 participants, 294
had complete data at 5 time points, 225 at 4 time points, 269 at 3 time points, 218 at 2
time points, and 288 participants had data at one time point only.
Details of the clinical examination and diabetes diagnosis are reported elsewhere
(Davis et al., 2013). Briefly, the assessment included fasting serum glucose, HbA1c,
BMI, and assessment of diabetes complications ascertained using standard criteria
(Davis et al., 2013).
Depression assessment
Depression symptoms were assessed using the Patient Health Questionnaire-9
item version (PHQ-9; Kroenke & Spitzer, 2002), a self-report measure validated for use
in diabetes (E. H. B. Lin et al., 2004; Manea, Gilbody, & McMillan, 2012; van
Steenbergen-Weijenburg et al., 2010). The PHQ-9 has high sensitivity to detect change
in depression over time (Löwe et al., 2004) and good agreement with structured
interview diagnoses (Kroenke & Spitzer, 2002). Total scores range from 0-27 with
higher scores indicating greater severity. PHQ-9 total scores can be categorized as no
symptoms (0-4), mild (5-9), moderate (10-14), moderately severe (15-19) and severe
depression (20+) (Kroenke & Spitzer, 2002). We also considered PHQ-9 cut-off scores
of 10 and 12, which have been recommended as sensitive and specific cut-points for
clinical depression in chronic disease and diabetes, respectively (Manea et al., 2012; van
Depression and Anxiety in T2DM 71
Steenbergen-Weijenburg et al., 2010). Following each assessment, an individuals’ GP
was advised if they met criteria for major depression.
The Brief Lifetime Depression Scale (BLDS; Bruce et al., 2013), which has been
validated in Type 2 DM (Bruce, Davis, Hunter, et al., 2016), was used to assess for
lifetime major depressive disorder (lifetime MDD) at baseline. This measure provides a
probable diagnosis of lifetime major depression based on the Diagnostic and Statistical
Manual of Mental Disorders-IV (DSM-IV) criteria.
Statistical analysis
Latent class growth analysis (LCGA) was employed to detect sub-groups of
individuals with distinctive patterns of change in depression severity over time, and to
estimate the probability of each individual belonging to a particular subgroup (Ram &
Grimm, 2009). At the first step, to determine the best single-group representation of
change, growth curve models with no growth (intercept only), then with intercept and
slope parameters estimated for a linear, quadratic (curvilinear or U-shaped), then
logarithmic fit, were estimated (Ram & Grimm, 2009). Model fit was assessed with the
Akaike Information Criterion (AIC) and Bayesian Information Criterion (BIC) (Jung &
Wickrama, 2008); the Root Mean Square Error of Approximation (RMSEA) (L. Hu &
Bentler, 1999); the Standard Root Mean Square Residual (SRMR); and, the Comparative
Fit Index (CFI) and Tucker Lewis Index (TLI)(L. Hu & Bentler, 1999).
Missing values analyses indicated that PHQ9 data were not missing at random
(NMAR) at baseline, Year 1, 3 or 5 (Little’s MCAR all p < 0.001). Missing at random

Depression and Anxiety in T2DM 72
(MAR), and NMAR pattern-mixture and selection models were generated and model fit
compared to determine their likely reliability (B. O. Muthén et al., 2011).
To determine the best fitting number of groups, latent class growth models were
built with 2, 3 and 4 groups. The variances of the intercept and slope were allowed to
vary within groups (Jung & Wickrama, 2008), and the quadratic term set at zero, as this
resulted in the most clinically meaningful groupings with the lowest computational
burden (also termed General Growth Mixture Modeling; GGMM). The Vuong-Lo-
Mendell-Rubin Likelihood Ratio Test (LRM-LRT) and the Parametric Bootstrap
Likelihood Ratio Test (BLRT) were used to determine the improvement in fit when
adding a group (Jung & Wickrama, 2008), with significant values indicating
improvement in model fit compared with the previous model. High posterior
probabilities for each group (≥0.70), and high entropy (near 1.0), were considered to
reflect good precision of the model in classifying individuals to each group (Jung &
Wickrama, 2008; Nagin & Odgers, 2010).
Identified groups were compared in unadjusted models on baseline demographic,
clinical and psychosocial variables using one-way ANOVA for normally distributed
data, and non-parametric χ2 tests and Mann-Whitney U or Kruskall-Wallis tests for
frequency or non-parametric data. Data are presented as proportions, mean±SD or
median [inter-quartile range, IQR] for non-normal variables. A binary logistic regression
model was used to determine predictors of depression group membership relative to a
reference group in adjusted models, and expressed as an odds ratio (OR) and 95%
confidence interval (95% CI). Age and gender were entered first, and psychological
Depression and Anxiety in T2DM 73
variables for which there were significant bivariate differences at baseline were entered
subsequently.
Finally, single-growth curve models were generated to represent change in BMI,
HbA1c, and frequency of SMBG between Years 0, 2 and 4. Depression group
membership was then entered as a predictor of the intercept and slope of these growth
curves, to explore whether changes in depression symptoms were associated with
change in diabetes management. Lifetime MDD was entered subsequently, to examine
whether lifetime depression added utility beyond depression group in explaining
diabetes management. Analyses were performed in Mplus Version 7 (L. K. Muthén &
Muthén, 1998) and IBM SPSS Version 23. Alpha was 0.05, two-tailed.
Results
Of the 1549 adults with Type 2 DM, 1201 (77.5%) had PHQ-9 data for 2 or more
time points and were included in LCGA. Compared to those with inadequate PHQ-9
data, included individuals were less likely to be women (55.2% vs 46.0%, p=0.002) or of
Aboriginal ethnicity (21.0% vs 2.7%, p<0.001), were more likely to be unmarried
(35.4% vs 42.9%, p=0.016), had shorter diabetes duration (10.0 [3.0-17.6] vs 8.5 [2.3-
15.4] years, p=0.020), and better glycaemic control (HbA1c: 54 [45-66] vs 51 [44-61]
mmol/mol, p<0.001) (7.1% [6.3-8.2%] vs 6.8% [6.2-7.6%]). The included participants
were also more likely to have received education beyond primary school (88.4% vs
76.2%, p<0.001) and to be fluent in English (91.8% vs 80.7%, p<0.001). There were no
significant differences between included and excluded participants in age (65.3±10.9 vs
65.2±12.4 years, p=0.93) or BMI (31.4 ±6.1 vs 31.1±6.6 kg/m2, p=0.47).

Depression and Anxiety in T2DM 74
At baseline, 32.7% of the final sample reported mild-to-severe depressive
symptoms, with 13.1% scoring above the chronic disease cut-off of 10, and 9.0%
scoring above the diabetes cut-off of 12. Criteria for lifetime MDD were met by 34.4%
of the sample, and 13.3% were taking antidepressants.
Depression trajectories
A quadratic model provided the best single-group representation of the data
(Table 7), resulting in the lowest χ2 (56.48), AIC (26315.83) and parsimony ratio (0.57)
statistics. There was no difference between the MAR and NMAR models in the shape of
growth curves, number of groups generated, or percentage of individuals in each group,
indicating the MAR models as reliable (B. O. Muthén et al., 2011). LCGA revealed the
data best fit a 3-group MAR model (see Table 8 and Figure 3). On average, Group 1
(‘no-depression’; 85.2% of the sample) had consistently low depression symptoms over
time. Group 2 (‘persistent-depression – low-start’; 7.3%) had depression symptoms
below clinical cut-points at baseline that gradually worsened to exceed clinical cut-
points over the first 2 years of assessment, plateaued, and then improved to their former
level. Group 3 (‘persistent-depression– high-start’; 7.5%) had depression symptoms at
baseline that exceeded clinical cut-points, slowly improved over the first 2 years,
plateaued but remained above chronic disease cut-points, and then worsened to their
former level. Depression symptoms remained elevated over all time-points in both
persistent-depression groups. There was no significant difference between the two
persistent-depression groups in mean PHQ-9 scores across all time points (high-start vs
low-start: 12.4±4.1 vs 11.8±2.9, F (1,136) = 1.0, p=0.31).
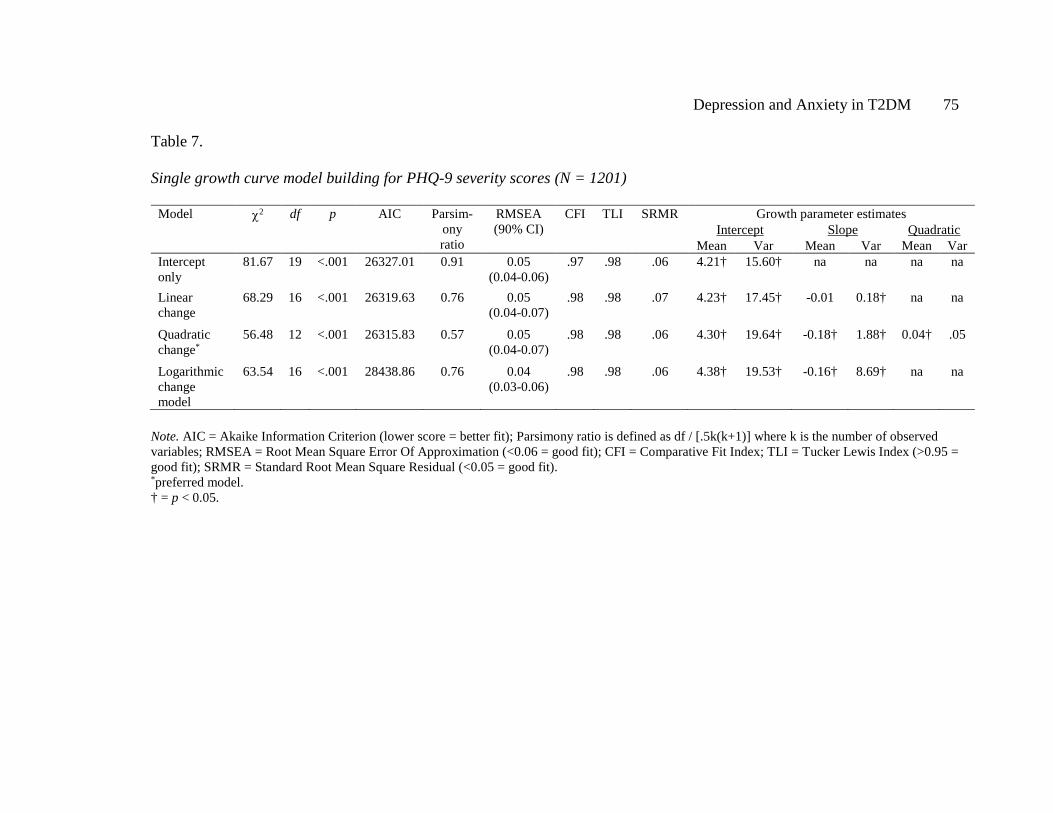
Depression and Anxiety in T2DM 75
Table 7.
Single growth curve model building for PHQ-9 severity scores (N = 1201)
Model χ2
df p AIC Parsim-ony ratio
RMSEA (90% CI)
CFI TLI SRMR Growth parameter estimates Intercept Slope Quadratic
Mean Var Mean Var Mean Var Intercept only
81.67 19 <.001 26327.01 0.91 0.05 (0.04-0.06)
.97 .98 .06 4.21† 15.60† na na na na
Linear change
68.29 16 <.001 26319.63 0.76 0.05 (0.04-0.07)
.98 .98 .07 4.23† 17.45† -0.01 0.18† na na
Quadratic change*
56.48 12 <.001 26315.83 0.57 0.05 (0.04-0.07)
.98 .98 .06 4.30† 19.64† -0.18† 1.88† 0.04† .05
Logarithmic change model
63.54 16 <.001 28438.86 0.76 0.04 (0.03-0.06)
.98 .98 .06 4.38† 19.53† -0.16† 8.69† na na
Note. AIC = Akaike Information Criterion (lower score = better fit); Parsimony ratio is defined as df / [.5k(k+1)] where k is the number of observed variables; RMSEA = Root Mean Square Error Of Approximation (<0.06 = good fit); CFI = Comparative Fit Index; TLI = Tucker Lewis Index (>0.95 = good fit); SRMR = Standard Root Mean Square Residual (<0.05 = good fit). *preferred model. † = p < 0.05.

Depression and Anxiety in T2DM 76
Table 8.
LCGA fit statistics for the PHQ9 latent class quadratic growth model (N = 1201)
1-Class 2-Class 3-Class* 4-Class
Sample size N = 1 1201 (100%) 1066 (88.76%) 1023 (85.18%) 944 (78.60%) N = 2 - 135 (11.24%) 90 (7.49%) 134 (11.16%) N = 3 - - 88 (7.33%) 77 (6.41%) N = 4 - - - 46 (3.83%)
Fit Statistics # of Parameters 12 16 20 24 AIC 26317.16 25903.55 25680.87 25532.25 BIC 26378.25 25985.01 25782.69 25654.43 ABIC 26340.13 25934.19 25719.16 25578.20 Entropy na 0.922 0.924 0.907 Log likelihood -13146.58 -12935.78 -12820.43 -12742.13 LRM-LRT p value na 0.020 0.002 0.115 BLRT p value na <.001 <.001 <.001
Note. AIC = Akaike Information Criterion AIC = (lower score = better fit); BIC = Bayesian Information Criterion (lower score = better fit); ABIC = adjusted Bayesian Information Criterion (lower score = better fit); LRM-LRT = Vuong-Lo-Mendell-Rubin Likelihood Ratio Test (significant p value = improvement in model fit from previous number of classes); BLRT = Bootstrap Likelihood Ratio Test (significant p value = improvement in model fit). *= preferred model.
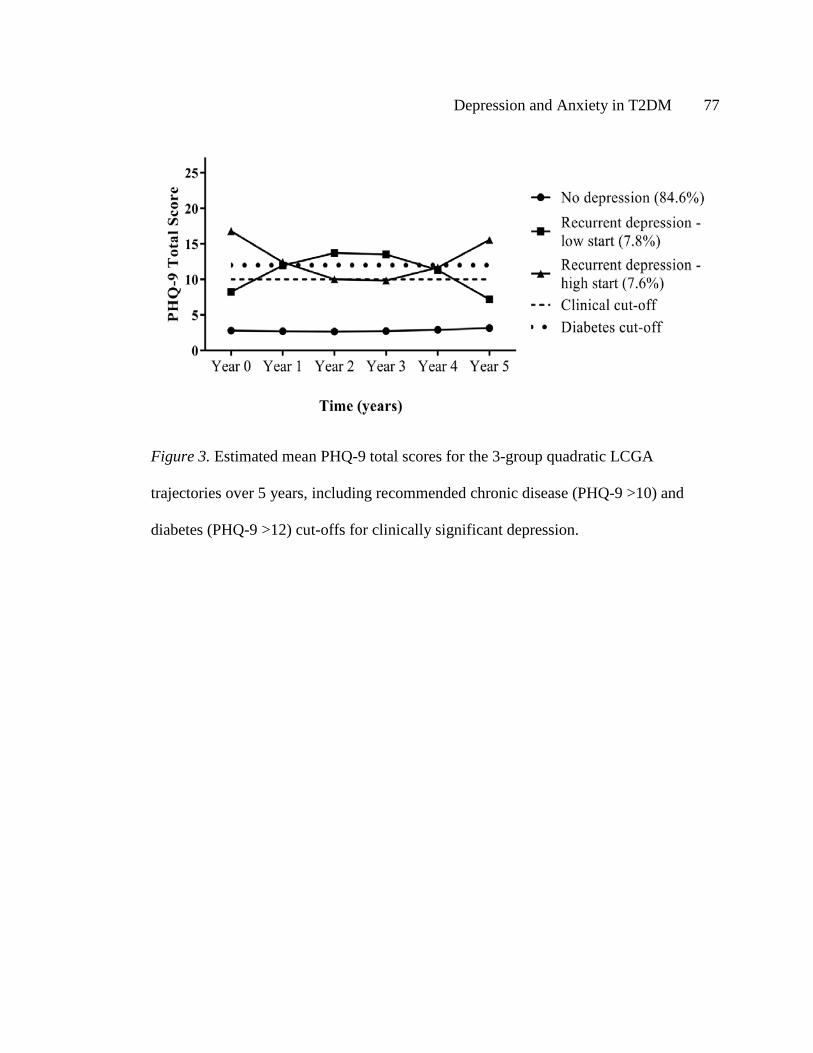
Depression and Anxiety in T2DM 77
Figure 3. Estimated mean PHQ-9 total scores for the 3-group quadratic LCGA
trajectories over 5 years, including recommended chronic disease (PHQ-9 >10) and
diabetes (PHQ-9 >12) cut-offs for clinically significant depression.
Depression and Anxiety in T2DM 78
Baseline characteristics associated with depression groups
Baseline characteristics of the three groups are presented in Table 9. Compared
with both persistent-depression groups, individuals in Group 1 were older at diabetes
diagnosis, had lower BMI, and reported less lifetime MDD. Compared with Group 1,
Group 3 were more likely to smoke, had worse glycemic control, more macrovascular
complications and attended more GP visits, and Group 2 attended more outpatient visits
in the previous year. Whilst individuals in Group 2 were more likely than Group 1 to
have macrovascular complications (47% vs 37%) and higher HbA1c (54 vs 50
mmol/mol; 7.1 vs 6.7%), these were not statistically significant. Group 3 were younger
and more likely to smoke than Group 2.
Fewer antidepressants were prescribed to Group 1 participants than both Groups
2 and 3 (Table 9), and most were taken by Group 3. Antidepressant use remained higher
at all time-points for Group 2 (Year 2: 27.4%; Year 4: 35.4%) and Group 3 (Year 2:
35.4%; Year 4: 35.1%) relative to Group 1 (p<0.001), with no significant differences
between Groups 2 and 3 over time (p>0.05).
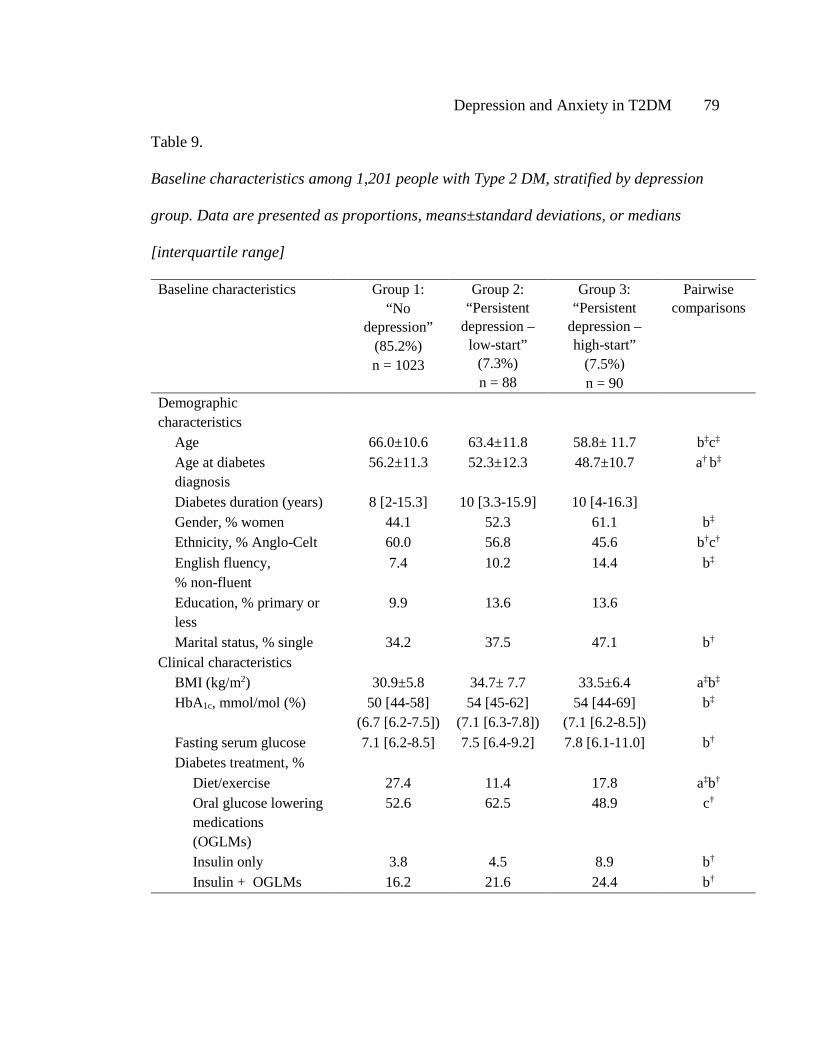
Depression and Anxiety in T2DM 79
Table 9.
Baseline characteristics among 1,201 people with Type 2 DM, stratified by depression
group. Data are presented as proportions, means±standard deviations, or medians
[interquartile range]
Baseline characteristics Group 1: “No
depression” (85.2%) n = 1023
Group 2: “Persistent
depression – low-start”
(7.3%) n = 88
Group 3: “Persistent
depression – high-start”
(7.5%) n = 90
Pairwise comparisons
Demographic characteristics
Age 66.0±10.6 63.4±11.8 58.8± 11.7 b‡c‡ Age at diabetes diagnosis
56.2±11.3 52.3±12.3 48.7±10.7 a† b‡
Diabetes duration (years) 8 [2-15.3] 10 [3.3-15.9] 10 [4-16.3] Gender, % women 44.1 52.3 61.1 b‡ Ethnicity, % Anglo-Celt 60.0 56.8 45.6 b†c† English fluency, % non-fluent
7.4 10.2 14.4 b‡
Education, % primary or less
9.9 13.6 13.6
Marital status, % single 34.2 37.5 47.1 b† Clinical characteristics
BMI (kg/m2) 30.9±5.8 34.7± 7.7 33.5±6.4 a‡b‡ HbA1c, mmol/mol (%) 50 [44-58]
(6.7 [6.2-7.5]) 54 [45-62]
(7.1 [6.3-7.8]) 54 [44-69]
(7.1 [6.2-8.5]) b‡
Fasting serum glucose 7.1 [6.2-8.5] 7.5 [6.4-9.2] 7.8 [6.1-11.0] b† Diabetes treatment, %
Diet/exercise 27.4 11.4 17.8 a‡b† Oral glucose lowering medications (OGLMs)
52.6 62.5 48.9 c†
Insulin only 3.8 4.5 8.9 b† Insulin + OGLMs 16.2 21.6 24.4 b†

Depression and Anxiety in T2DM 80
Baseline characteristics Group 1: “No
depression” (85.2%) n = 1023
Group 2: “Persistent
depression – low-start”
(7.3%) n = 88
Group 3: “Persistent
depression – high-start”
(7.5%) n = 90
Pairwise comparisons
Number of medical visits in past year
General Practitioner 3.0 [2-4] 4.0 [2-10] 4.0 [2-12] b‡ Diabetes outpatient clinic visit
0.0 [0-0] 0.0 [0-2] 0.0 [0-1] a‡b‡
Diabetes-related outpatient clinic visit
0.0 [0-0] 1.0 [0-2] 0.0 [0-1] a‡
Self-management and health outcomes
SMBG number of times per week
5.0 [2.0-10.0] 6.5 [1.0-14.0] 5.0 [0-14.0]
SMBG, % yes 86.6 86.0 78.3 c† Self and/or other monitoring of blood glucose, % yes
87.7 90.7 79.5 b†c‡
Smoking status, % current
7.4 4.5 16.7 b†c‡
Macrovascular complications, % yes
37.0 46.6 51.1 b†
Peripheral sensory neuropathy, % yes
59.5 55.7 54.4
Psychological characteristics
PHQ-9 total score 2.0 [0-4.0] 9.0 [5.8-11.0] 16.0 [13.0-20.0] a‡b‡c‡ Antidepressant use, % current
9.3 31.0 42.2 a‡b‡
Lifetime major depression, % yes
27.9 64.8 78.9 a‡b‡c‡
Note. Only significant pairwise comparisons are presented; HbA1c = glycated hemoglobin; SMBG = self-monitoring of blood glucose; lifetime MDD = Lifetime Major Depressive Disorder. a = difference between Group 1 and Group 2. b = difference between Group 1 and Group 3 c = difference between Group 3 and Group 2. † = significant at p < .05. ‡ = significant at p < .001.
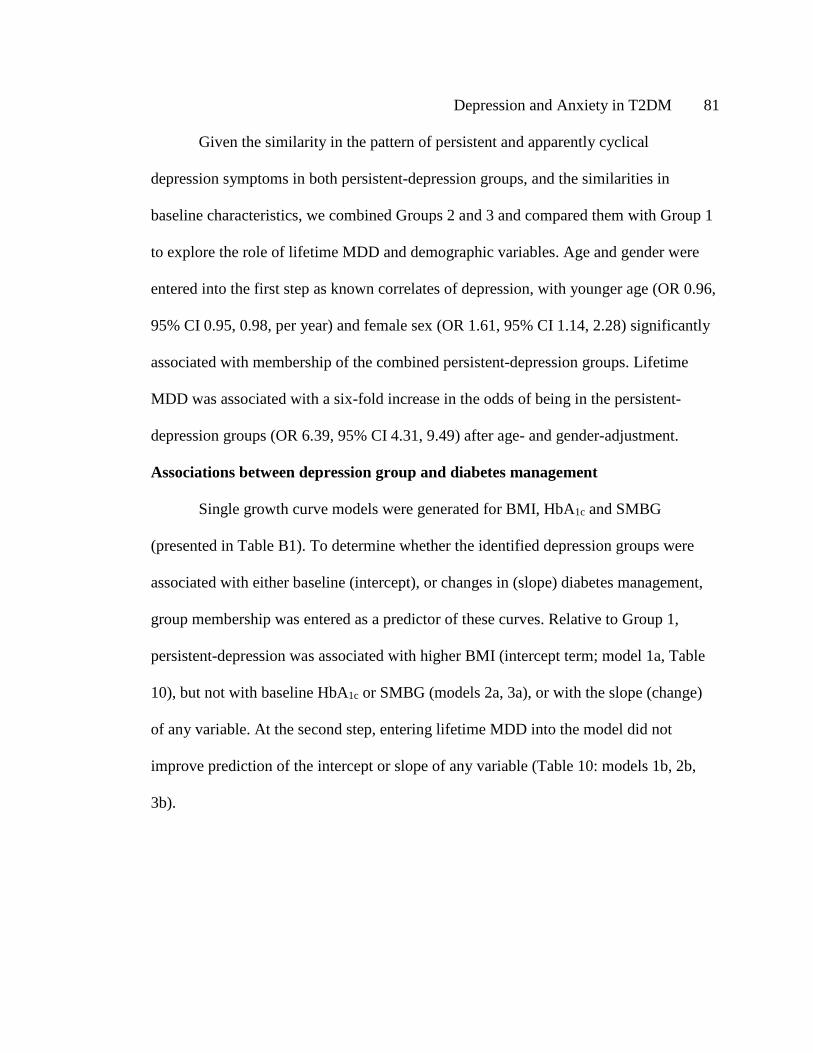
Depression and Anxiety in T2DM 81
Given the similarity in the pattern of persistent and apparently cyclical
depression symptoms in both persistent-depression groups, and the similarities in
baseline characteristics, we combined Groups 2 and 3 and compared them with Group 1
to explore the role of lifetime MDD and demographic variables. Age and gender were
entered into the first step as known correlates of depression, with younger age (OR 0.96,
95% CI 0.95, 0.98, per year) and female sex (OR 1.61, 95% CI 1.14, 2.28) significantly
associated with membership of the combined persistent-depression groups. Lifetime
MDD was associated with a six-fold increase in the odds of being in the persistent-
depression groups (OR 6.39, 95% CI 4.31, 9.49) after age- and gender-adjustment.
Associations between depression group and diabetes management
Single growth curve models were generated for BMI, HbA1c and SMBG
(presented in Table B1). To determine whether the identified depression groups were
associated with either baseline (intercept), or changes in (slope) diabetes management,
group membership was entered as a predictor of these curves. Relative to Group 1,
persistent-depression was associated with higher BMI (intercept term; model 1a, Table
10), but not with baseline HbA1c or SMBG (models 2a, 3a), or with the slope (change)
of any variable. At the second step, entering lifetime MDD into the model did not
improve prediction of the intercept or slope of any variable (Table 10: models 1b, 2b,
3b).
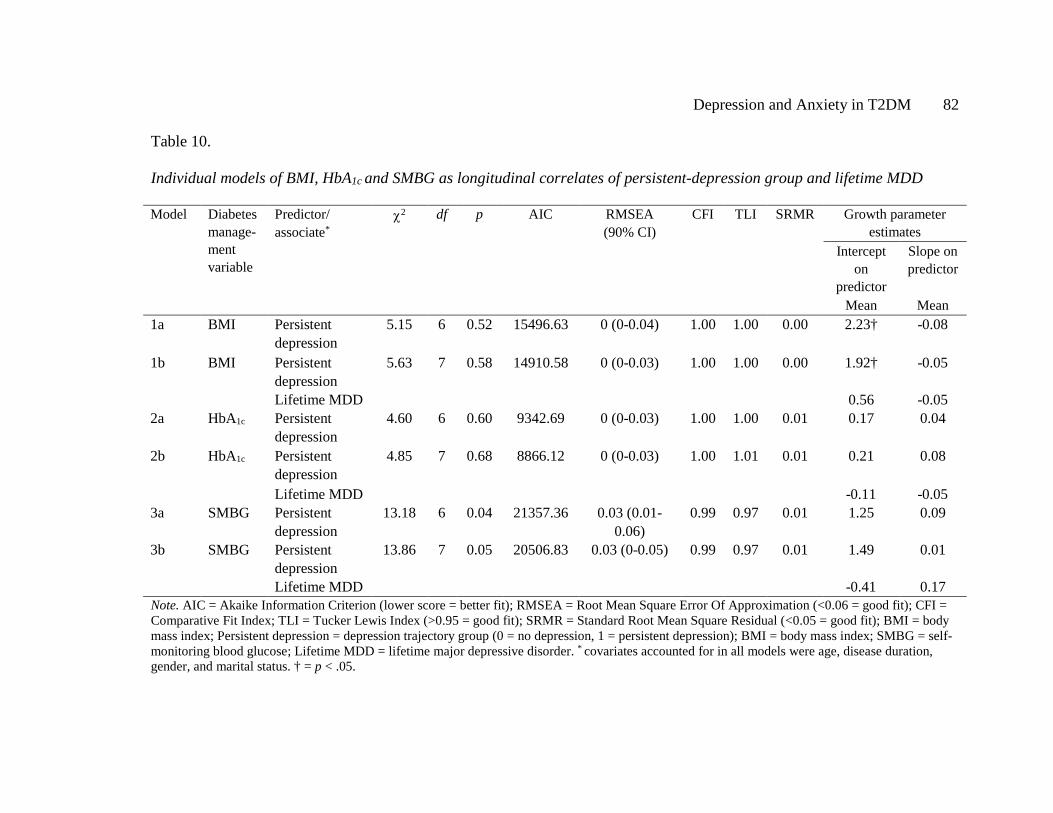
Depression and Anxiety in T2DM 82
Table 10.
Individual models of BMI, HbA1c and SMBG as longitudinal correlates of persistent-depression group and lifetime MDD
Model Diabetes manage-ment variable
Predictor/ associate*
χ2 df p AIC RMSEA (90% CI)
CFI TLI SRMR Growth parameter estimates
Intercept on
predictor
Slope on predictor
Mean Mean 1a BMI Persistent
depression 5.15 6 0.52 15496.63 0 (0-0.04) 1.00 1.00 0.00 2.23† -0.08
1b BMI Persistent depression
5.63 7 0.58 14910.58 0 (0-0.03)
1.00 1.00 0.00 1.92† -0.05
Lifetime MDD 0.56 -0.05 2a HbA1c Persistent
depression 4.60 6 0.60 9342.69 0 (0-0.03) 1.00 1.00 0.01 0.17 0.04
2b HbA1c Persistent depression
4.85 7 0.68 8866.12 0 (0-0.03) 1.00 1.01 0.01 0.21 0.08
Lifetime MDD -0.11 -0.05 3a SMBG Persistent
depression 13.18 6 0.04 21357.36 0.03 (0.01-
0.06) 0.99 0.97 0.01 1.25 0.09
3b SMBG Persistent depression
13.86 7 0.05 20506.83 0.03 (0-0.05) 0.99 0.97 0.01 1.49 0.01
Lifetime MDD -0.41 0.17 Note. AIC = Akaike Information Criterion (lower score = better fit); RMSEA = Root Mean Square Error Of Approximation (<0.06 = good fit); CFI = Comparative Fit Index; TLI = Tucker Lewis Index (>0.95 = good fit); SRMR = Standard Root Mean Square Residual (<0.05 = good fit); BMI = body mass index; Persistent depression = depression trajectory group (0 = no depression, 1 = persistent depression); BMI = body mass index; SMBG = self-monitoring blood glucose; Lifetime MDD = lifetime major depressive disorder. * covariates accounted for in all models were age, disease duration, gender, and marital status. † = p < .05.
Depression and Anxiety in T2DM 83
Discussion
This is the first study to use LCGA to examine the natural history of depression
symptomatology in Type 2 DM. Three clinical groups were identified in a large,
representative, community-based sample. The largest group (Group 1) had consistently
absent or low depression symptoms. The other two groups (2 and 3) displayed a pattern
of mild to moderate depression symptoms that persisted over the 5-year period, and
cycled above and below clinical cut-points for major depression but never entirely
remitted. Previous studies have estimated that clinically-elevated depression symptoms
may persist in up to 9% of individuals with type 2 DM over 18 months (Fisher et al.,
2008), and the present findings indicate that this can continue for considerably longer.
The cyclical nature of depression severity suggests that more individuals with type 2
DM experience elevated depression symptoms than indicated by prevalence estimates
based on clinical cut-offs at a single time-point.
Both persistent-depression groups demonstrated similar patterns of cyclical
depression symptoms. Although the high-start group reached higher ‘peaks’ in the cycle,
there appeared to be no difference in total exposure to depression severity. Between-
group comparisons revealed few clinical differences. Both were similar in baseline BMI,
HbA1c, chronic complications, and in the prevalence of lifetime MDD, and both were
more likely to be female, younger, to access healthcare services, to be prescribed
antidepressants, and to have persistently higher BMI (de Groot et al., 2001; Egede et al.,
2002; Fisher et al., 2008). Whilst the high-start persistent-depression group was younger,
more likely to smoke and was less adherent to medications and SMBG than the low-start

Depression and Anxiety in T2DM 84
persistent-depression group, this could be explained by differences in depression
severity at baseline (E. H. B. Lin et al., 2004; Whitworth et al., 2016). We believe that
these two groups represent similar patterns of underlying depression symptom change,
with little difference in clinical outcome. One explanation is that individuals were
captured at different phases of a similar cycle, based on the arbitrary timing of study
entry. However, it is also possible that these groups may be clinically distinct and
display different patterns of depression symptom change with ongoing assessment.
Longer-term follow up is needed to clarify this, and to determine whether differential
depression management is warranted for those with more severe depression symptoms at
baseline.
One prior study has investigated depression trajectories in Type 2 DM (Schmitz
et al., 2013). Schmitz and colleagues (Schmitz et al., 2013) identified four groups based
on patterns of change in categorical depression diagnoses over 3-years: a majority non-
depressed group, a group with worsening major depression, a group with increasing
prevalence of major and minor depression, and an improved depression group. The
present findings are consistent with this study but suggest that longer follow-up may
have led to different conclusions. An extension of Schmitz and colleagues’ findings
would help to determine whether a cyclical pattern is replicated long-term, as has been
shown by fluctuating depression diagnoses over 10 years in the general population
(Kennedy et al., 2004).
A key finding of the present study is that lifetime MDD was the strongest risk
factor for persistent depression symptoms, increasing the risk six-fold. In cross-sectional
Depression and Anxiety in T2DM 85
studies based on the baseline FDS2 data set, we previously reported that lifetime MDD
was associated with current depression (Bruce, Davis, Hunter, et al., 2016) and
depression symptom severity (Whitworth et al., 2016). The present study extends these
findings longitudinally, emphasizing the importance of lifetime MDD as a risk factor for
persistent depression in type 2 DM. There were no significant associations between
change in depression symptoms and change in either HbA1c or SMBG, consistent with
previous report (Fisher et al., 2010). Given diabetes requires daily management for
optimal control, changes in diabetes management may be more proximally predicted by
an individual’s current level of distress (Fisher et al., 2010).
These data have important clinical implications. Current recommendations are
that stepped-care depression management is offered based on screening positively at a
given time-point for either a depression diagnosis or scoring above a clinical cut-point.
The results of this study indicate that this approach is likely to miss individuals with
subthreshold depression symptoms who may benefit from preventive treatment (Schmitz
et al., 2014). In the FDS2, participants’ GPs were notified if they had major depression
but, while antidepressant use was highest in the persistent-depression groups, depression
symptoms continued to recur. The results suggest that regular monitoring of depression
symptoms is warranted, especially for those with lifetime MDD or with sub-threshold
depression, in order to identify at-risk individuals in need of more intensive depression
management. Screening for lifetime MDD with an instrument such as the BLDS at
diabetes diagnosis may provide an opportunity for targeted and pro-active monitoring of
depression.

Depression and Anxiety in T2DM 86
The strengths of the present study include the assessment of the course of
depression symptoms across 6 time-points, using a longitudinal modeling technique that
allows naturally occurring trajectories to arise from the data (Nagin & Odgers, 2010).
Benefits of LCGA over traditional methods include the ability empirically to test how
well the models fit the data, rather than subjectively deciding on the number of
hypothesized groups a priori (Nagin & Odgers, 2010). This reduces the chance of bias
when deciding on the best-fitting number of groups, and provides the most parsimonious
interpretation (Nagin & Odgers, 2010). LCGA also incorporated intermittent PHQ-9
data into the analyses, rather than excluding those with incomplete data and potentially
biasing estimates (B. O. Muthén et al., 2011). A potential limitation is that more clinical
groups may exist in the data, but are not included in the final model as they do not
substantively improve model fit, or contain too few individuals (Jung & Wickrama,
2008).
Limitations of this study include self-report measures that may result in over-
diagnosis compared with gold-standard clinical interviews, and the potential overlap
between ratings of lifetime and current depression at baseline. However, the PHQ-9 has
high sensitivity for symptomatic and diagnostic change across repeated assessments
(Löwe et al., 2004) and the BLDS has high diagnostic concordance with clinical
interview (Bruce et al., 2013). Finally, symptoms of anxiety and diabetes distress are
highly comorbid with depression and may influence the experience of depression
symptoms over time (Fisher et al., 2008). This overlap warrants further investigation.
Depression and Anxiety in T2DM 87
In conclusion, the present study demonstrates that a sub-set of individuals with
diabetes experience mild to high levels of depression symptoms that persist. Regular
screening for depression severity, in addition to assessment of lifetime depression and
psychosocial functioning, may better identify individuals at risk of a later relapse or
progression in symptoms and enable more targeted intervention.

Depression and Anxiety in T2DM 88
Depression and Anxiety in T2DM 89
Chapter 5: Anxiety in Type 2 Diabetes: Risk Factors and Outcomes of 4-Year
Anxiety Symptom Trajectories Using Latent Growth Mixture Modeling.
Preface
Study 2 (Chapter 4) examined the course of continuous depression symptom
severity in T2DM. This study revealed two groups of particular clinical interest, as
members of both groups displayed a pattern of cycling and persistent depression
symptoms over 5 years. This Chapter (Study 3) extended these findings to consider the
developmental course of generalized anxiety disorder symptoms in T2DM. Given the
high comorbidity between depression and anxiety reported in the literature, and
demonstrated in Chapter 1, overlap between the persistent-depression groups from Study
2 and the anxiety groups identified in Study 3 was also examined.
There was no significant change in BMI, HbA1c, or SMBG over time in Study 2,
and thus depression group membership was not found significantly to predict
longitudinal diabetes management and control. Study 3 thus employed a different
statistical method, Latent Growth Mixture Modeling (LGMM), to instead examine
This chapter has been prepared as a manuscript for submission to Diabetes
Care: Whitworth, S.R., Bruce, D.G., Starkstein, S.E., Davis, W.A., Davis, T.M.E.,
Skinner, T.C., & Bucks, R.S. Anxiety in type 2 diabetes: risk factors and outcomes of 4-
year anxiety symptom trajectories using latent growth mixture modeling. It is presented
below, as prepared for submission, but formatted for consistency with the rest of the
thesis.

Depression and Anxiety in T2DM 90
predictors of anxiety groups, and whether anxiety group membership then predicted
long-term health outcomes.
Depression and Anxiety in T2DM 91
Abstract
Background: Generalized anxiety disorder may be an important comorbidity in type 2
diabetes. There is a paucity of research investigating the course of anxiety in this
population. This study aimed to describe 4-year trajectories of anxiety symptoms and to
identify determinants and outcomes in a community-based cohort with type 2 diabetes.
Methods: Participants of the Fremantle Diabetes Study-Phase II with type 2 diabetes
(N=1091) completed the Generalized Anxiety Disorder Scale at baseline and biennially
for 4 years. The baseline and year 4 assessments included a range of psychological,
biomedical and self-management measures. Latent growth mixture modeling was used
to identify trajectories of anxiety symptom severity, and regression models determined
predictors of trajectory membership and associated outcomes.
Results: Two distinct groups of anxiety symptoms were identified: continuously low-to-
no anxiety symptoms (87.4%), and high anxiety symptoms which began to improve but
remained consistently elevated (elevated anxiety; 12.6%). Higher HbA1c and BMI, more
macrovascular complications, and a history of generalized anxiety and major depression,
significantly increased the risk of elevated-anxiety. Elevated-anxiety did not predict
change in health-related outcomes over time. Elevated-anxiety and depression symptoms
were highly comorbid, and these individuals displayed the most chronic pattern of
anxiety.
Conclusions: A sub-group of individuals with type 2 diabetes are at risk of elevated
anxiety symptoms which do not remit. Routine monitoring of the severity of anxiety and
depression symptoms in this population, especially for those younger in age, overweight

Depression and Anxiety in T2DM 92
and of poorer health, may be required to enable earlier and more intensive mood
management.
Depression and Anxiety in T2DM 93
Introduction
Depression is widely recognized to impact substantially on the management and
sequelae of type 2 diabetes (de Groot et al., 2001; Gonzalez et al., 2007). Anxiety
disorders, of which generalized anxiety disorder (GAD) is the most common, have
received significantly less attention. GAD frequently presents as persistent worry about
a number of life areas, in addition to physiological and behavioural symptoms (Smith et
al., 2013). This disorder is estimated to affect up to 14% of individuals with type 2
diabetes, with 25-40% experiencing increased anxiety symptoms (Grigsby et al., 2002;
Hermanns, Kulzer, Krichbaum, Kubiak, & Haak, 2005). In cross-sectional studies, GAD
has been associated with an increased risk of diabetes complications (Collins et al.,
2009), worse glycemic control (Anderson et al., 2002; Balhara & Sagar, 2011), greater
neuropathic pain (Gore et al., 2005; Jain, Jain, Raison, & Maletic, 2011), obesity
(Balhara & Sagar, 2011), and lower quality of life (Paschalides et al., 2004). However,
the long-term development and impact of anxiety symptoms in type 2 diabetes, and
implications for intervention, remain unclear.
General population studies indicate a GAD diagnosis can be chronic, though less
stable than depression (Schoevers et al., 2005; Wittchen, Lieb, Pfister, & Schuster,
2000), with symptoms improving for a sub-set of individuals (Ramsawh et al., 2009). In
type 2 diabetes, one longitudinal study found that the proportion of individuals meeting
criteria for a GAD diagnosis declined over 18-months (Fisher et al., 2008). However, it
is likely that these studies did not capture the broader spectrum of anxiety symptoms as
they only assessed clinical diagnoses. Furthermore, research lacks consensus concerning
Depression and Anxiety in T2DM 94
the strength and direction of the temporal relationships between anxiety, glycemic
control and diabetes complications (Anderson et al., 2002; Hermanns et al., 2005; Smith
et al., 2013). Given that subthreshold anxiety symptoms are an important precursor to
GAD (Smith et al., 2013), examining the longitudinal associations between anxiety
symptoms and health-related outcomes may be of substantial clinical relevance.
We recently identified, in a large cohort of individuals with type 2 diabetes
followed for 5 years, two groups of individuals who experienced persistently elevated
depression symptoms over time (Whitworth et al., 2017). These symptoms often cycled
below cut-points for clinically-significant depression but never fully remitted, and were
associated with reduced psychological and health-related function. Applying this
approach to trajectories of anxiety symptoms may be similarly revealing. Further, given
the known overlap between anxiety and depression in diabetes (Collins et al., 2009;
Deschênes et al., 2015), and the greater likelihood of recurrence of both disorders when
they present together (Merikangas et al., 2003), determining the natural history of
anxiety symptoms should also improve our understanding of this important comorbidity.
The primary aim of the present study was to identify trajectories of anxiety
symptoms over a 4-year period in 1,091 individuals with type 2 diabetes, to identify
predictors of these trajectories, and to explore whether anxiety trajectories are
determinants of glycaemic control and chronic complications. A secondary aim was to
examine the degree and impact of the overlap between anxiety symptom trajectories and
our previously published persistent-depression groups.
Depression and Anxiety in T2DM 95
Research Design and Methods
Study sample
The Fremantle Diabetes Study Phase II (FDS2) is a longitudinal observational
study of known diabetes, conducted in a postcode-defined geographical area surrounding
the city of Fremantle in the state of Western Australia (Davis et al., 2013). Details of
FDS2 recruitment procedures have been published elsewhere (Davis et al., 2000, 2013).
Briefly, 1,732 participants were recruited to the baseline arm of FDS2 between 2008-
2011 through physician and allied health referrals, hospital databases, local advertising
and word-of-mouth (Davis et al., 2013). Of these, 1549 were > 18 years with clinically
diagnosed type 2 diabetes and included in this study. The Human Research Ethics
Committee of the South Metropolitan Area Health Service and the University of
Western Australia approved the study, and all participants gave written, informed
consent.
Study procedures
Each participant underwent a comprehensive clinical examination, in addition to
collection of demographic and mood data, during a face-to-face assessment at study
entry and at subsequent two-year intervals. Anxiety data were potentially available for a
maximum of 3 occasions (Year 0, Year 2, and Year 4). Complete data at all 3 time
points were available for 801 participants, 290 had complete data at two time points, 380
at one time point only, and 78 participants had missing data at all 3 assessments.
Full details of FDS2 assessments are reported elsewhere (Davis et al., 2013), but
these included demographic characteristics, diabetes duration, current blood glucose-
Depression and Anxiety in T2DM 96
lowering treatment, frequency of self-monitoring of blood glucose (SMBG), smoking
status and antidepressant use, as well as the number of primary care and hospital clinic
visits in the past year. Body mass index was measured and macrovascular and
microvascular complications were ascertained using standard criteria (Davis et al.,
2013). Fasting biochemical tests including fasting serum glucose and HbA1c were also
carried out.
Mood assessment
Anxiety symptom severity was assessed using the Generalized Anxiety Disorder
Scale (GADS; Starkstein et al., 2014), an assessment that has been validated in the FDS2
for use in type 2 diabetes (Starkstein et al., 2014). The GADS demonstrated good test-
retest reliability (Starkstein et al., 2014), and provides a probable diagnosis of GAD
based on the Diagnostic and Statistical Manual of Mental Disorders-IV (DSM-IV)
criteria. The GADS items were rated as “not at all present”, “present several days”,
“present more than half of the days”, and “present nearly every day”, with an item
scored positively if endorsed as “more than half the days” or above. Probable GAD was
classified if individuals endorsed experiencing excessive worry and difficulty controlling
their worries, for more than half the days over the past 6 months, in addition to 3 or
more positive anxiety symptoms. Total scores range from 0-24 with higher scores
indicating more severe anxiety. To determine the optimal cut-point for detecting
clinically significant anxiety, the GADS was further validated in a stratified sample of
57 individuals from the FDS2 against the SCID-RV-Anxiety Disorders Module. ROC
curve analysis was performed, and based on the area under the curve and sensitivity and
Depression and Anxiety in T2DM 97
specificity values, a cut-off of 15 was chosen (Hanley & McNeil, 1982). This cut-off
resulted in the highest sensitivity (83.3%) and specificity (92.2%), and an area under the
curve of 0.93 indicating that 93% of individuals who met GAD criteria on the SCID-RV
also had a higher score on the GADS.
The Generalized Anxiety Disorder – Lifetime Scale (GAD-LT) was used to
assess for lifetime GAD. This instrument was designed for the FDS2 to map on to the
GADS, with the time criterion set to one month to reflect DSM-IV lifetime criteria. The
GAD-LT provides a probable diagnosis of lifetime generalized anxiety based on DSM-
IV criteria, and has been validated for use in type 2 diabetes (Whitworth et al., 2016).
The severity of depression symptoms was assessed using the Patient Health
Questionnaire-9 item version (PHQ-9; Kroenke & Spitzer, 2002), a self-report measure
widely validated for use in diabetes (van Steenbergen-Weijenburg et al., 2010). PHQ-9
total scores range from 0-27 with higher scores indicating more severe symptoms. This
measure was administered annually in the same sample, and total PHQ-9 scores at each
assessment were used to identify trajectories of depression symptoms in our previously
published study (Whitworth et al., 2017). Finally, the Brief Lifetime Depression Scale
(BLDS; Bruce et al., 2013), an assessment designed for use in type 2 diabetes and
mapping onto DSM-IV criteria (Bruce et al., 2013), assessed for lifetime prevalence of
major depressive disorder (lifetime major depression) at baseline.
Statistical analysis
Anxiety trajectories. Latent growth mixture modeling (LGMM) was used to
identify sub-groups of people who displayed a similar trajectory of anxiety symptom

Depression and Anxiety in T2DM 98
severity over time, based on changes in GADS total scores. LGMM examines whether
there exist sub-groups of individuals within the sample who share distinctive patterns of
symptom change, and estimates the probability of each individual belonging to a
particular group (Ram & Grimm, 2009).
To determine the best single-group representation of change, growth curve
models with no growth (intercept only), and with intercept and slope parameters, were
estimated for a linear and logarithmic fit (Ram & Grimm, 2009). The following methods
were used to assess model fit: the Bayesian Information Criterion (BIC) and Akaike
Information Criterion (AIC) (Hoyle, 2012); the Root Mean Square Error of
Approximation (RMSEA); the Standard Root Mean Square Residual (SRMR); and the
Tucker Lewis Index (TLI) and Comparative Fit Index (CFI) (Hoyle, 2012). Missing
values analyses revealed GADS data were missing completely at random at Year 0 and
Year 4 (Little’s MCAR p>0.05) and missing at random at Year 2 (Little’s MCAR
χ2(205)=289.38, p<0.001). There was less than 5% missingness at all assessments, so
expectation maximization was employed to impute missing values.
Next, LGMM was performed with 1-3 classes to determine the best fitting
number of groups, with variances of the intercept and slope allowed to vary (Jung &
Wickrama, 2008). The Vuong-Lo-Mendell-Rubin Likelihood Ratio Test (LRM-LRT)
and Parametric Bootstrap Likelihood Ratio Test (BLRT) were used to determine
improvement in fit when including an extra group (Lo et al., 2001). High posterior
probabilities for each class and high entropy were considered to reflect good model
precision (Jung & Wickrama, 2008; Nagin, 2005).
Depression and Anxiety in T2DM 99
Predictors of anxiety group membership were examined using unadjusted
bivariate regression models. To delineate the contribution of lifetime generalized anxiety
and major depression to group membership, an adjusted logistic regression model was
performed with significant bivariate demographic characteristics entered into the first
step, followed by lifetime anxiety, then lifetime depression. Anxiety group membership
was then used to predict clinical outcomes at Year 4 using bivariate regression models,
performed with and without controlling for these variables at baseline.
Finally, χ2 tests, one-way ANOVA, or Kruskall-Wallis tests for non-parametric
data, were used to examine the degree of overlap between identified anxiety groups, and
those with persistent-depression symptoms as described previously (Whitworth et al., in
press). Between-group differences for those with and without overlapping anxiety and
depression symptom trajectories in clinical and psychological variables, were explored
at baseline. Differences in GADS total scores were compared at Year 0, 2 and 4.
Analyses were performed using Mplus Version 7 and IBM SPSS Statistics Version 23.
Alpha was 0.05, two-tailed. Data are presented as proportions, mean±SD, or median
[inter-quartile range, IQR] for non-normal variables, and Bonferroni correction was
applied to adjust for multiple comparisons.
Results
Of the 1,549 adults with type 2 diabetes, 1,091 had GADS data for 2 or more
time points and were included in LGMM. Compared to included participants, those with
inadequate GADS data were older (64.8±10.8 vs 66.4±12.2 years, p = 0.02), had longer
diabetes duration (8.0 [2.0-15.1] vs 10.6 [4.0-18.0] years, p<0.001), higher HbA1c (6.8%
Depression and Anxiety in T2DM 100
[6.2%-7.5%] vs 7.0% [6.3%-8.1%]) (51 [44-58] vs 53 [45-65] mmol/mol, p<0.001), and
were less likely to have received secondary education (90.5% vs 77.0%, p<0.001) or to
be of Anglo-Celt ethnicity (58.8% vs 40.4%, p<0.001). Excluded participants were more
likely to be female (45.4% vs 54.4%, p<0.001) and to be unmarried (12.3% vs 44.1%, p
< 0.001). There were no significant between-group differences in BMI (31.4±5.9 vs
31.8±6.8, p=0.30).
At baseline, 6.2% of the final sample met DSM-IV criteria for current GAD and
7.1% endorsed symptoms of anxiety above the clinical cut-point of 15. The mean GADS
score for the overall sample was 5.6±5.2. DSM-IV criteria for lifetime generalized
anxiety were met by 26.7% and 35.9% for lifetime major depression, and 13.1% were
taking antidepressants.
Anxiety trajectories
A linear model emerged as the best fitting single growth model for GADS data,
Table C1). At the next step, LGMM revealed the GADS data best fit a linear 2-group
model (see Figure 4 and Table 11). Group 1 (‘no anxiety’; 87.4%), the majority of the
sample, had low-to-no anxiety symptoms over time (GADS total score at baseline =
4.1±3.2). Group 2 (‘elevated-anxiety’; 12.6%) displayed a pattern of anxiety symptoms
that fell above the clinical cut-point at baseline (GADS total score = 16.2±3.7),
gradually improved to below this cut-off over time, but remained elevated. Of clinical
relevance, anxiety symptoms were significantly higher in this group at all assessments
relative to the no-anxiety group (Year 0: F(1,1075)=1595.34, p<0.001; Year 2:
F(1,1051)=338.17, p<0.001; Year 4: F(1,851)=106.71, p<0.001).

Depression and Anxiety in T2DM 101
Figure 4. Mean estimated anxiety scores (GADS total scores) for 2-class LGMM over 4
years, including clinical cut-off (GADS ≥ 15).
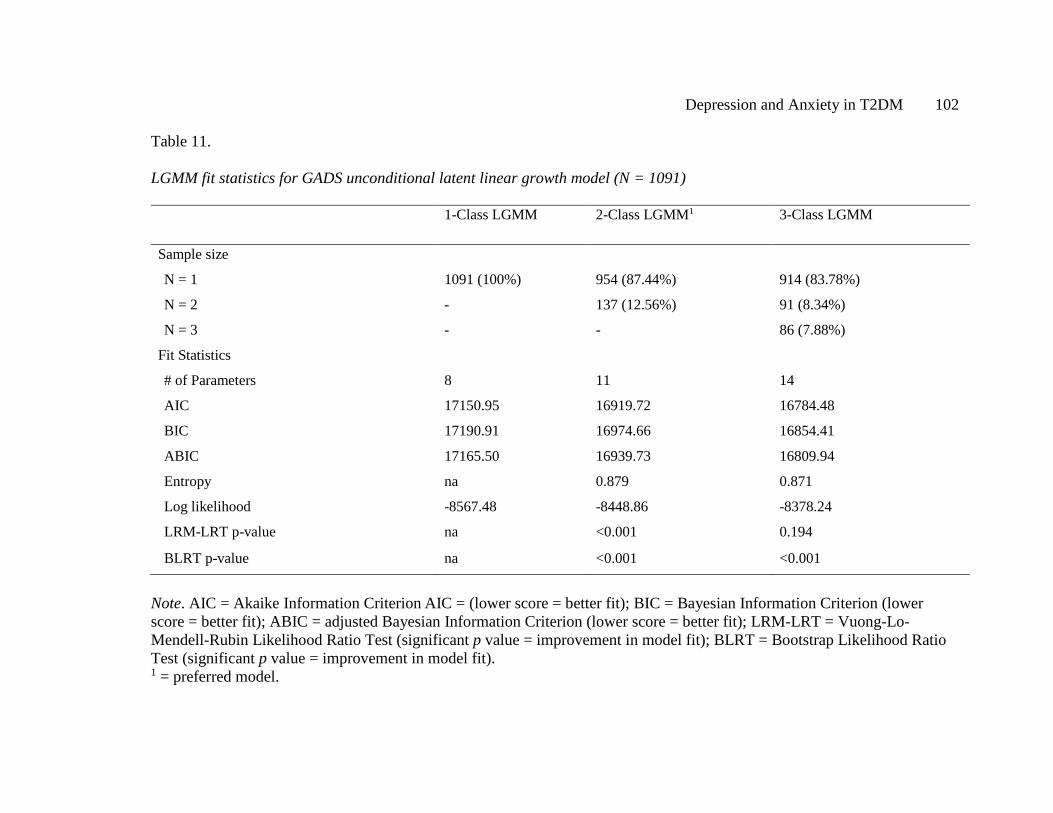
Depression and Anxiety in T2DM 102
Table 11.
LGMM fit statistics for GADS unconditional latent linear growth model (N = 1091)
1-Class LGMM 2-Class LGMM1 3-Class LGMM
Sample size
N = 1 1091 (100%) 954 (87.44%) 914 (83.78%)
N = 2 - 137 (12.56%) 91 (8.34%)
N = 3 - - 86 (7.88%)
Fit Statistics
# of Parameters 8 11 14
AIC 17150.95 16919.72 16784.48
BIC 17190.91 16974.66 16854.41
ABIC 17165.50 16939.73 16809.94
Entropy na 0.879 0.871
Log likelihood -8567.48 -8448.86 -8378.24
LRM-LRT p-value na <0.001 0.194
BLRT p-value na <0.001 <0.001
Note. AIC = Akaike Information Criterion AIC = (lower score = better fit); BIC = Bayesian Information Criterion (lower score = better fit); ABIC = adjusted Bayesian Information Criterion (lower score = better fit); LRM-LRT = Vuong-Lo-Mendell-Rubin Likelihood Ratio Test (significant p value = improvement in model fit); BLRT = Bootstrap Likelihood Ratio Test (significant p value = improvement in model fit). 1 = preferred model.
Depression and Anxiety in T2DM 103
Baseline predictors of anxiety groups
Bivariate regression models for predictors of anxiety group membership are
presented in Table 12. Compared with the no-anxiety group, the elevated-anxiety group
were younger in age, more likely to be female, and of non-Anglo Celt ethnicity. The
odds of experiencing elevated-anxiety symptoms were also increased for those with
higher BMI, worse glycaemic control, less frequent SMBG, more insulin and
antidepressant use, and for those presenting with more macrovascular complications and
more regularly attending healthcare appointments. A lifetime history of generalized
anxiety and major depression, were the strongest bivariate predictors of elevated-anxiety
symptoms.
To determine the separable contribution of lifetime generalized anxiety and
major depression, an adjusted logistic regression model was performed. Age, gender,
and Anglo-Celt ethnicity were entered into the first step, with younger age (OR = 0.95,
95% CI = 0.94, 0.97) and female gender (OR = 1.56, 95% CI = 1.07, 2.29) remaining
significant. In the second step, lifetime generalized anxiety was associated with a five-
fold increased risk of elevated-anxiety symptoms (OR = 5.51, 95% CI = 3.67, 8.29) after
age-and gender-adjustment. This relationship remained significant, but reduced, when
lifetime major depression was included in the third step (lifetime generalized anxiety:
OR = 2.78, 95% CI = 1.74, 4.44; lifetime major depression: OR = 4.09, 95% CI = 2.43,
6.87), with lifetime major depression emerging as the strongest predictor of elevated-
anxiety group.

Depression and Anxiety in T2DM 104
Table 12.
Bivariate logistic regression models examining baseline predictors of anxiety group
membership among 1,091 people with type 2 diabetes
Baseline characteristics Group 1: “No anxiety”
(87.4%) n = 954
Group 2: “Elevated anxiety”
(12.6%) n = 137
Odds Ratio (OR)
p-value
Demographic characteristics Age 65.5±10.5 59.9±11.4 0.96 <0.001 Age at diabetes diagnosis 55.9±11.3 50.4±11.9 0.96 <0.001 Diabetes duration (years) 8.0 [2.0-15.2] 8.9 [3.0-15.0] 0.99 0.625
Gender, % women 43.9 61.4 1.59 0.012 Ethnicity, % Anglo Celt 60.0 51.1 0.70 0.050
English fluency, % non-fluent
7.2 9.5 1.35 0.350
Education, % primary or less
9.0 12.5 1.44 0.196
Marital status, % single 34.0 35.6 1.07 0.716 Clinical characteristics
BMI (kg/m2) 31.1±5.7 33.6±6.8 1.07 <0.001 HbA1c, mmol/mol (%) 6.7 [6.2-7.5] 7.2 [6.2-7.9] 1.25 <0.001 Fasting serum glucose 7.1 [6.1-8.4] 7.7 [6.3-9.8] 1.12 <0.001 Diabetes treatment, %
Diet/exercise 27.1 19.0 0.63 0.043 Oral glucose lowering medications (OGLMs)
53.5 46.7 0.76 0.140
Insulin only 3.7 7.3 2.07 0.050 Insulin + OGLMs 15.7 27.0 1.98 0.001
Number of medical visits in past year
General Practitioner 3.0 [2.0-4.0] 4.0 [2.0-11.5] 1.07 <0.001 Diabetes outpatient clinic visit
0 [0-0] 0 [0-1.0] 1.18 0.002

Depression and Anxiety in T2DM 105
Baseline characteristics Group 1: “No anxiety”
(87.4%) n = 954
Group 2: “Elevated anxiety”
(12.6%) n = 137
Odds Ratio (OR)
p-value
Diabetes-related outpatient clinic visit
0 [0-0] 0 [0-1.0] 1.04 0.371
Self-management and health outcomes
SMBG number of times per week
5.5 [2.0-10.0] 6.0 [0-14.0] 1.01 0.490
SMBG, % yes 87.4 78.3 0.52 0.005 Self and/or other monitoring of blood glucose, % yes
88.4 79.8 0.52 0.007
Smoking status, % current
7.6 8.8 1.18 0.622
Macrovascular complications, % yes
35.2 51.8 1.99 <0.001
Peripheral sensory neuropathy, % yes
58.9 52.6 0.77 0.158
Psychological characteristics
Antidepressant use, % current
10.6 30.7 3.73 <0.001
Lifetime generalized anxiety, % yes
21.7 63.2 6.18 <0.001
Lifetime major depression, % yes
29.9 78.3 8.46 <0.001
Note. Reference category = no anxiety; HbA1c = glycated hemoglobin; SMBG = self-monitoring of blood glucose; lifetime MDD = lifetime major depressive disorder; lifetime GAD = lifetime generalized anxiety disorder. Data are presented as proportions, means±standard deviations, or medians [interquartile range].

Depression and Anxiety in T2DM 106
Outcomes of anxiety groups
Relative to those with no-anxiety, membership to the elevated-anxiety group
predicted higher BMI (B=1.98, p<0.001), more frequent attendance at GP (B=4.50,
p<0.001) and outpatient appointments (B=1.29, p=0.046), and more antidepressant use
at Year 4 (B=1.17, OR=3.21, p<0.001). However, these relationships became non-
significant after accounting for the severity of each variable at baseline (all p>0.05),
indicating that BMI, antidepressant use and healthcare attendance remained increased
and stable over time. Anxiety group was not associated with any other clinical or self-
management characteristic at Year 4 (all p>0.05).
Overlap between anxiety and depression groups
We next investigated whether there was an overlap between elevated-anxiety
symptom groups and previously determined depression groups in the same community
sample (Whitworth et al., 2017). Trajectories of PHQ-9 depression symptoms were
investigated similarly in the same cohort using Latent Curve Growth Analysis, and two
sub-groups were found to have persistently-elevated depression symptoms, although
with different patterns. Overall, 13.9% of the current sample had persistent-depression
symptoms over the same time period that the anxiety trajectories were examined, and
two-thirds of those in the elevated-anxiety group (n=87; 64.4%) also experienced
persistent-depression during this time.
We then explored whether having elevated-anxiety alone, persistent-depression
alone, or both symptoms in combination influenced the severity of anxiety. Figure 5
displays average anxiety symptom scores at each time point (baseline, Year 2 and Year
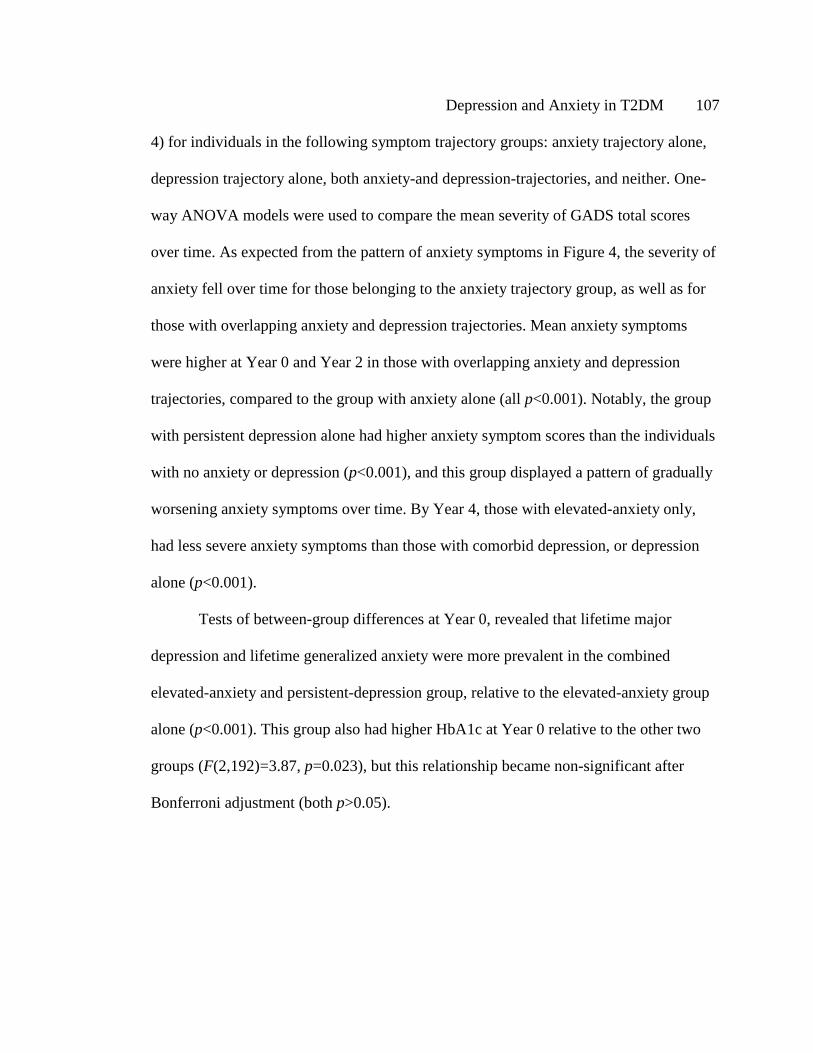
Depression and Anxiety in T2DM 107
4) for individuals in the following symptom trajectory groups: anxiety trajectory alone,
depression trajectory alone, both anxiety-and depression-trajectories, and neither. One-
way ANOVA models were used to compare the mean severity of GADS total scores
over time. As expected from the pattern of anxiety symptoms in Figure 4, the severity of
anxiety fell over time for those belonging to the anxiety trajectory group, as well as for
those with overlapping anxiety and depression trajectories. Mean anxiety symptoms
were higher at Year 0 and Year 2 in those with overlapping anxiety and depression
trajectories, compared to the group with anxiety alone (all p<0.001). Notably, the group
with persistent depression alone had higher anxiety symptom scores than the individuals
with no anxiety or depression (p<0.001), and this group displayed a pattern of gradually
worsening anxiety symptoms over time. By Year 4, those with elevated-anxiety only,
had less severe anxiety symptoms than those with comorbid depression, or depression
alone (p<0.001).
Tests of between-group differences at Year 0, revealed that lifetime major
depression and lifetime generalized anxiety were more prevalent in the combined
elevated-anxiety and persistent-depression group, relative to the elevated-anxiety group
alone (p<0.001). This group also had higher HbA1c at Year 0 relative to the other two
groups (F(2,192)=3.87, p=0.023), but this relationship became non-significant after
Bonferroni adjustment (both p>0.05).
Depression and Anxiety in T2DM 108
Figure 5. Mean estimated GADS total scores in the total available sample (N=1086) for
overlapping anxiety and depression groups over 4 years.

Depression and Anxiety in T2DM 109
Conclusions
The present study is the first to identify trajectories of anxiety symptoms in a
large, community-based cohort of individuals with type 2 diabetes. We found two
distinct groups, specifically individuals with low-to-no anxiety symptoms across all time
points (Group 1) and those experiencing high anxiety symptoms that began to improve
but remained elevated and did not fully remit over four years (Group 2). Membership of
this latter group was predicted by younger age, higher HbA1c and BMI, more
macrovascular complications, insulin use, and both lifetime anxiety and depression. The
presence of comorbid depression and anxiety symptoms conferred the greatest risk of a
more severe pattern of anxiety. These data indicate that screening for and treating any
elevated anxiety symptoms in diabetes, particularly for those with suboptimal diabetes
management, chronic complications and depression, may be beneficial.
For individuals with type 2 diabetes, anxiety can be expected to peak following
diabetes diagnosis and at key points during the disease course, for example at the onset
of chronic complications and with initiation of insulin treatment (Trento et al., 2015;
Young-Hyman et al., 2016). Current recommendations are to screen for, and treat,
individuals meeting a diagnosis of GAD or scoring above a clinical cut-point for anxiety
at these key stages (Young-Hyman et al., 2016). The most important finding in the
present study is that, for a group of individuals with long duration disease and chronic
complications (median diabetes duration of 9 years in Group 2), sub-threshold anxiety
symptoms appeared to be more persistent and prevalent than previously thought and
displayed a lifetime course. In the only prior study of the course of GAD in diabetes,

Depression and Anxiety in T2DM 110
Fisher and colleagues (2008) identified a decreasing prevalence of GAD diagnoses over
18 months, from 6.9% to 0.7% (Fisher et al., 2008). By assessing anxiety severity over a
longer follow-up period, we found that a substantially larger proportion of individuals
(Group 2: 12.6%) continued to experience sub-threshold anxiety symptoms which, while
also decreasing over time, remained consistently higher than in those with low-no
anxiety (Group 1). While reasons for the observed decrease in anxiety symptoms are
unclear, one explanation is that GAD symptoms may fluctuate and remain elevated over
a longer period of follow-up, displaying the pattern of relapse and remission over time
observed in the general population (Keller, 2002; Schoevers, Deeg, van Tilburg, &
Beekman, 2005; Trento et al., 2015). Taken together, these findings indicate that
assessing for a single DSM-IV GAD diagnosis in diabetes may under-represent those
individuals experiencing ongoing psychological issues. Regular monitoring of anxiety
symptoms, especially for those with lifetime generalized anxiety and/or major
depression, may facilitate earlier identification of individuals in need of ongoing mood
management.
An interesting finding was the significant association between diabetes
management and the severity of anxiety symptoms. There is debate in the literature
regarding whether less severe anxiety symptoms are associated with worse glycemic
control and health-related outcomes (Anderson et al., 2002; Balhara & Sagar, 2011;
Fisher et al., 2008; Trento et al., 2015) or vice versa. The present study indicates, for the
first time, that worse diabetes management and glycemic control are risk factors for a
more chronic underlying pattern of anxiety. While those with elevated-anxiety were not
Depression and Anxiety in T2DM 111
found to have worse health outcomes or self-care at Year 4 relative to the no-anxiety
group, it is likely that chronic anxiety symptoms have a more sinister long-term health
impact. In community samples, sub-threshold anxiety and worry have been associated
with heart failure and high blood pressure in individuals with cardiovascular disease
(Grenier et al., 2012; Tully, Cosh, & Baune, 2013) and, alongside GAD, may increase
insulin resistance and mortality risk due to underlying inflammatory changes (Black,
2003). These findings suggest that stepped-care treatment of any elevated anxiety
symptoms over time in diabetes may minimize the long-term impact of anxiety on
physiological and psychological functioning.
Another important contribution of the present study was the identification of a
high pattern of overlap between anxiety and depression symptom trajectories. Both
lifetime major depression and generalized anxiety were the strongest predictors of
membership to the elevated-anxiety group, and individuals with recurring depression
symptoms (persistent-depression group only) appeared to be particularly vulnerable to
the development of anxiety over time. The present study extends, through longer follow-
up, earlier findings that comorbid anxiety and depression can confer greater disability,
symptom burden and severity in diabetes (Deschênes, Burns, & Schmitz, 2015). We
suggest that more intensive monitoring and treatment of anxiety may be required for
individuals with depression, particularly to identify those who transition between
anxious-depressed states over time. As the presence of anxiety can make depression
harder to treat (Merikangas et al., 2003), referral to specialist psychological services for
individuals with symptoms of both disorders may be required to enable full symptomatic
Depression and Anxiety in T2DM 112
recovery, with Cognitive Behavior Therapy (CBT) demonstrating efficacy in this
population (Petrak, Baumeister, et al., 2015; Young-Hyman et al., 2016).
A key strength of this study was adopting a novel methodology that allowed for
the observation of underlying individual trajectories of anxiety symptoms (Nagin, 2005).
LGMM empirically tests how well a model fits to the data rather than deciding on a
number of hypothesized groups a priori and potentially biasing interpretation (Nagin,
2005). There were also several limitations. First, the GADS was used instead of the
Generalized Anxiety Disorder 7-item scale in this study (GAD-7; Kroenke, Spitzer,
Williams, Monahan, & Löwe, 2007), as the GAD-7 was not available when the FDS2
was designed. We believe the GADS is an improvement on this scale as it assesses
DSM-IV/5 criteria for GAD over the past 6 months, rather than a partial list of
symptoms over the past 2 weeks (Starkstein et al., 2014). The GADS has demonstrated
high test-retest reliability and good concordance with diagnostic interview (Starkstein et
al., 2014). Second, interpretation of the overlap between depression and anxiety groups
may be limited, as the PHQ-9 was administered annually and the GADS biennially.
Ongoing follow-up of the overlap in, and correlates of, depression and anxiety symptom
trajectories over more regular intervals is needed. Finally, we did not assess for diabetes-
specific emotional distress, which refers to the complex psychological and behavioral
burden associated with having diabetes (Fisher et al., 2010). It is possible that some of
the longitudinal inter-relationships observed between anxiety, depression, and glycemic
control may be driven by elevated levels of diabetes distress (Ehrmann et al., 2015;
Fisher et al., 2010).
Depression and Anxiety in T2DM 113
In conclusion, the present data show that generalized anxiety is an important
comorbidity in type 2 diabetes, and is a disorder that clinicians should attend to in
routine care. A sub-group of individuals were found to experience anxiety symptoms
that remained elevated but below clinical cut-points over time, with anxiety symptoms
more chronic for those with comorbid depression. Extending on current guidelines
(Young-Hyman et al., 2016), we recommend screening for anxiety and depression
severity visit-to-visit, in addition to clinical DSM-IV diagnoses, to enable earlier
detection and targeted psychological intervention for these at-risk groups. Assessing
lifetime major depression and generalized anxiety at diabetes diagnosis using measures
such as the BLDS and GAD-LT provides another opportunity to identify and pro-
actively monitor those at risk of worsening psychological and health-related outcomes.

Depression and Anxiety in T2DM 114
Depression and Anxiety in T2DM 115
Chapter 6: General Discussion
Preface
The overarching aim of this thesis was to provide an in-depth examination of the
longitudinal interrelationships between depression, anxiety, and type 2 diabetes. Specific
findings relating to each empirical study have been detailed in each Chapter, so they are
summarized only briefly here. This general discussion then aims to examine the findings
presented from their broader methodological and clinical contexts, and to consider
implications for the assessment and treatment of psychological problems in type 2
diabetes.
Overview of study findings
Study 1 (Chapter 2) identified, in a representative community sample of
individuals’ with T2DM, that reporting a lifetime history of GAD, as well as lifetime
MDD, is a significant risk factor for more severe current anxiety and depression
symptoms. A crucial finding was that individuals with a lifetime history of both
disorders were at the greatest risk of reporting more severe depressive symptoms, which
in turn was associated with having a higher BMI, worse glycaemic control, being less
likely to perform SMBG, and a greater likelihood of currently smoking. Taken together,
this study points to the chronicity of depression and anxiety in T2DM, and highlighted
the importance of considering depression and anxiety as a continuous construct in
diabetes.
Study 2 extended the findings of Study 1, longitudinally, and identified two sub-
groups of individuals with diabetes who experienced a pattern of cycling but persistent
Depression and Anxiety in T2DM 116
depression symptoms that did not fully remit over 5 years. The most important risk-
factor for this symptom course was a self-reported lifetime MDD history. Using a novel
trajectory approach, the key contribution of this study is the finding that a larger number
of individuals experienced ongoing subthreshold depressive symptoms than previously
estimated: individuals who may be missed under current screening protocols. While
these individuals had higher baseline HbA1c and BMI, the persistence in symptoms over
time did not correspond with a worsening in glycaemic control, weight management, or
frequency of SMBG.
Study 3 examined the course of anxiety symptoms in the same sample, and
explored diabetes-related predictors and outcomes of this symptom course. The most
important finding of this study was the identification of a group of individuals who
experienced gradually improving but consistently elevated anxiety symptoms over 4
years. As in Study 2, the strongest risk factor for these symptoms was having a lifetime
history of both GAD and MDD. Individuals with elevated-anxiety experienced more
macrovascular complications at baseline, and were more likely to be overweight,
hyperglycemic and to use insulin. However, and as in Study 2, these outcomes remained
stable over the follow-up period. Of considerable clinical importance, this study
identified a high overlap between the elevated-anxiety group, and the combined
persistent-depression groups from Study 2. Those individuals captured by both groups
had the most severe pattern of anxiety, and a number of individuals with persistent-
depression developed increasing anxiety symptoms over time. Taken together, these
findings indicate that the overlap between depression and anxiety likely contributes to a
Depression and Anxiety in T2DM 117
more chronic pattern of anxiety symptoms, which may warrant more intensive
management.
A consistent finding across all the empirical studies in this thesis, is the
importance of considering the severity of depression and anxiety symptoms, in addition
to clinical diagnoses and diagnostic thresholds, longitudinally in diabetes. This broader
symptom perspective contributes to three key areas of knowledge: (1) our understanding
of the course of depression and anxiety in T2DM; (2) conceptualization and
measurement of the overlap between depression and anxiety; and (3) the strength of
developmental interrelationships between mood disturbance and diabetes. Each area is
discussed in turn, below, followed by implications of these findings for the screening,
monitoring, and treatment of psychosocial issues in diabetes. Finally, future directions
are explored.
Understanding the course of depression and anxiety in T2DM
Two decades ago, it was proposed that “the inclusion of subthreshold categories
of depression dramatically improves the coverage of treated depression, and better
enables the characterization of its longitudinal course” (Angst & Merikangas, 1997).
However, a broader examination of the course of depression and anxiety symptom
severity in type 2 diabetes has not been undertaken, representing a significant gap in our
knowledge. This thesis addresses that gap. A key finding is that a larger proportion of
individuals experienced ongoing but sub-threshold depression and anxiety symptoms
over time, than previous cross-sectional and longitudinal estimates of MDD and GAD
diagnoses (Fisher et al., 2008). These findings support the need to consider prevalence
Depression and Anxiety in T2DM 118
over multiple assessments (Fisher et al., 2008; Schmitz et al., 2014), and suggest that
conceptualizing mood more broadly from a longitudinal symptom framework, may
improve the detection of individuals experiencing psychological difficulties in this
population.
Across all studies, an underlying chronicity and recurrence to the experience of
psychological symptoms was observed. The severity of both depression and anxiety
symptoms fluctuated over time, and frequently fell below clinical cut-points: but only
just. This symptom course supports the transition between threshold and sub-threshold
diagnoses observed in the general population (Angst & Merikangas, 1997; Merikangas
et al., 2003; Schoevers et al., 2005), and has substantial implications for individuals with
type 2 diabetes. First, Study 2 suggests that an initial reduction in depression symptoms
does not necessarily translate into longer-term improvements. Second, screening only
for individuals meeting clinical depression and anxiety diagnoses or scoring above
clinical cut-offs, may overlook those with less severe symptoms, who are at-risk of
poorer health or quality of life over time (Schmitz et al., 2014). Taken together, this
thesis implies that routine tracking of continuous depression and anxiety symptom
scores, in addition to ongoing mood management, may be of particular benefit in this
population.
Finally, taking a life-course perspective to the experience of psychological
dysfunction revealed a long-standing pattern to mood problems in this large, community
cohort. A self-reported, prior episode of lifetime major depression, generalized anxiety,
or both, were the strongest risk factors for more severe and recurring mood symptoms in
Depression and Anxiety in T2DM 119
all studies. This effect held even after accounting for diabetes-specific characteristics.
Thus, these findings consistently underscore the need for detection of both lifetime
depression and anxiety at diabetes diagnosis. Brief, self-report measures such as the
BLDS and GAD-LT have demonstrated utility in this group, but require further
validation.
The depression-anxiety comorbidity in T2DM: implications for conceptualization
and measurement
Historically, major depression has been studied as the most debilitating
psychological condition to affect individuals with type 2 diabetes. Extending
longitudinally on recent research (Collins et al., 2009; Deschênes et al., 2015; Starkstein
et al., 2014), Studies 1 and 3 provide compelling evidence that this population is
vulnerable to experiencing comorbid depression and anxiety over time. These findings
replicate the strong life-course association found between MDD and GAD (Merikangas
et al., 2003; Schoevers et al., 2005), and question how we conceptualize and measure
these disorders more broadly.
There is ongoing debate in the field of psychiatry as to whether MDD and GAD
are actually separable constructs, given the frequent rates of comorbidity observed, in
addition to their shared genetic and environmental risk factors (Goldberg, 2010; Watson,
2005). It has, instead, been proposed that MDD and GAD should be conceptualized
similarly under a class of “distress disorders”, which share common variance in addition
to unique symptoms (Watson, 2005). Given this similarity, conceptualization of either

Depression and Anxiety in T2DM 120
disorder should thus account for the likely presence of the other (Goldberg, 2010). The
findings of Studies 1 and 3 lend support to this argument.
However, it has also been suggested that the symptom overlap between
depression and anxiety, including tiredness, concentration issues and difficulty sleeping
(Starkstein et al., 2014), may drive some of the observed associations (van Loo,
Schoevers, Kendler, de Jonge, & Romeijn, 2016). To address this argument, Starkstein
and colleagues (2014) adopted a data-driven approach to identify classes of individuals
with T2DM based on the overlap in PHQ-9 and GADS symptoms, after excluding
anxiety symptoms that were shared with depression (Starkstein et al., 2014). Two classes
of individuals were identified with a high comorbidity of depression and anxiety
symptoms (termed major anxious-depression and minor anxious-depression by the
authors). Similar to this thesis, both groups had poorer diabetes-related outcomes
relative to those without depression and anxiety symptoms (Starkstein et al., 2014), and
a greater long-term risk of cardiovascular disease (CVD) compared with groups based
on DSM-IV/5 diagnoses (Bruce, Davis, Dragovic, & Starkstein, 2016). Taken together,
it appears that the overlap between depression and anxiety in diabetes, thus reflects a
unique group of individuals experiencing greater symptom burden and severity
(Deschênes et al., 2015; Schoevers, Beekman, Deeg, Jonker, & van Tilburg, 2003),
which is unlikely to be explained by shared items only.
Viewing comorbidity in this way has important implications for diabetes care.
These findings suggest that assessment of depression alone in this population is unlikely
to be sufficient. Further, the data presented highlight the need to recognize that
Depression and Anxiety in T2DM 121
individuals who present with symptoms of one disorder are likely to develop or
experience worsening in the other, over time. Practitioners should be mindful of this
transition, and consider routinely assessing for symptoms of both disorders, even when
one may not be present at a previous assessment. Early and intensive psychosocial
intervention is likely to be needed for those experiencing this overlap, to promote long-
term remission in both disorders (Deschênes et al., 2015; Schoevers et al., 2005).
Implications for the strength of developmental interrelationships between mood
and T2DM
There is extensive debate in this field relating to whether the severity, rather than
diagnosis of depression and anxiety symptoms, affects diabetes self-management,
glycaemic control, and health complications (Anderson et al., 2002; Fisher et al., 2010;
Gonzalez et al., 2007; Snoek, Bremmer, & Hermanns, 2015). All studies make a
substantial contribution by indicating that there exist significant, developmental
relationships between the course and severity of depression and anxiety symptoms, and a
range of diabetes-related outcomes. Two primary pathways of interest are considered
below.
Pathway 1: the course of psychological symptoms affects diabetes
management and control. Study 1 identified a significant association between
continuous PHQ-9 total scores, and both diabetes management and HbA1c. This extends
on earlier findings that a one-point increase in depression severity corresponds to poorer
adherence to self-care and medication recommendations (Gonzalez et al., 2007), even
after accounting for diabetes distress (Gonzalez, Delahanty, Safren, Meigs, & Grant,
Depression and Anxiety in T2DM 122
2008), but contrasts with other studies. Notably, Fisher and colleagues (2010) found that
the association between continuous depression scores and HbA1c became non-significant
after accounting for a range of diabetes-related factors, including comorbid
complications, diabetes distress, diet and exercise (Fisher et al., 2010). We would argue
that covarying for these factors, which are known to be related to depression symptoms
(de Groot et al., 2001; Gonzalez et al., 2007), may have excluded important information
on this relationship, effectively removing the very variance of interest.
The chronicity of depression and anxiety in this population appeared to be a
particular risk factor for poorer health. Lifetime major depression and generalized
anxiety, especially when comorbid, conferred the greatest risk of poorer outcome by
increasing the severity of current depressive symptoms. A number of pathways may
explain this association. First, lifetime MDD and GAD may contribute, through
biopsychosocial factors, to an increased risk of diabetes onset (Edwards & Mezuk, 2012;
Engum, 2007; Katon, 2003) and difficulty adapting to diabetes diagnosis (Katon, 2003).
In turn, this chronicity in psychological symptoms may continue to contribute, over
time, to a worsening in disease severity through underlying inflammatory, immune and
endocrine changes (Black, 2003; Gonzalez, Safren, et al., 2008; Windle & Windle,
2013). Taken together, these findings suggest that individuals with a history of
depression or anxiety, and more severe current depression symptoms, may benefit
particularly from early diabetes education and adherence training, to maximize
engagement in successful diabetes self-management (Davies et al., 2008).

Depression and Anxiety in T2DM 123
Pathway 2: the severity of diabetes affects the course of psychological
symptoms. The findings from Studies 2 and 3 offer compelling, prospective evidence
that, in addition to clinical diagnoses (Schmitz et al., 2013; Trento et al., 2015), diabetes
which is more severe and insufficiently managed confers significant risk for ongoing,
subthreshold and non-remitting mood symptoms. Shared associates of ongoing
subthreshold depression and anxiety included worse glycaemic control, higher BMI, and
more attendance at healthcare appointments. Less frequent self-management, more
insulin use, and more macrovascular complications were also predictive of ongoing, sub-
threshold anxiety symptoms. A number of mechanisms may contribute to these
associations. Fear of further health complications and/or hypoglycaemia, which can
result from difficulties managing HbA1c levels, may worsen or maintain anxiety (Wild et
al., 2007). Common factors shared between depression, anxiety, and diabetes, including
obesity, inflammation and socio-economic disadvantage, may also contribute to
psychological dysfunction over time (Everson et al., 2002; Tabák et al., 2014). These
findings indicate a particular need to screen for the presence of sub-threshold mood
symptoms, for individuals experiencing chronic diabetes complications and
hyperglycaemia.
Despite these proposed pathways by which mood symptoms and diabetes may be
interrelated over time, longitudinal examination over 4-years did not reveal any
significant worsening in BMI, glycaemic control, or SMBG. Thus, the underlying
recurrence of psychological symptoms did not appear to contribute further to poorer
outcomes in this population. One explanation for these results is that mood severity is
Depression and Anxiety in T2DM 124
not associated with long-term changes in glycaemic control (Fisher et al., 2010). A more
plausible explanation is that individuals with elevated-anxiety and persistent-depression
already tended to be overweight, and to have worse glycaemic control and diabetes self-
management at baseline. For individuals with established diabetes, these factors, which
are common to both mood problems and T2DM (Tabák et al., 2014), tend to remain
chronic. Thus, a ceiling effect may have occurred, with limited room for outcomes to
worsen in these groups. However, it is also possible that a longer period of follow-up
may reveal a worsening in outcomes associated with ongoing, subthreshold depression
and anxiety symptoms. Irrespective of this, it appears that preventive measures aimed at
targeting factors such as weight, smoking, and sedentary activity prior to the onset of
both diabetes and mood problems, may be the most promising method for improving
long-term health in this population.
In summary, all studies of this thesis reflect the same theme: that there exists a
clinically relevant and likely under-recognized relationship between the course and
severity of an individuals’ psychological symptoms and health-related outcomes in
T2DM.
Clinical implications
Studies 2 and 3 were among the first to identify heterogeneous trajectories of
depression and anxiety symptoms in diabetes, and to demonstrate deleterious
relationships between the continuous severity of mood symptoms, and glycaemic
control, self-management and obesity. The findings of all experimental studies have
Depression and Anxiety in T2DM 125
important implications for the screening, monitoring and treatment of psychological
symptoms in this population.
Screening for depression and anxiety. While all clinical guidelines now
recommend routinely screening for depression and anxiety at primary care appointments
(International Diabetes Federation Clinical Guidelines Task Force, 2012; Young-Hyman
et al., 2016), rates of case detection are notoriously low (Pouwer, 2009; Tylee &
Walters, 2006). The findings from this thesis suggest a further complicating factor in this
process may be the reliance on identifying ‘cases’ of MDD and GAD (American
Diabetes Association, 2017; Young-Hyman et al., 2016), at the expense of considering
the broader experience of psychological distress (Fisher et al., 2014). This may under-
detect those individuals experiencing persistently elevated but sub-threshold mood
symptoms. A number of recommendations regarding the nature and timing of
psychological screening processes in this population, arise from this work.
First, the diagnosis of diabetes is a critical time for any individual, involving a
comprehensive medical and lifestyle assessment to confirm diagnosis (American
Diabetes Association, 2017). As previously discussed, we recommend incorporating
brief screening measures of both lifetime and current depression and anxiety into this
assessment. At this stage, individuals reporting a history of psychological problems can
be flagged as at-risk. Based on our findings, individuals presenting with more complex
weight management issues, hyperglycaemia, and more diabetic complications at diabetes
diagnosis, should also be flagged as requiring more proactive diabetes and mood
management.
Depression and Anxiety in T2DM 126
Second, we recommend that, at annual healthcare assessments of diabetes
complications and management, the continuous severity of depression and anxiety
symptoms using instruments such as the PHQ-9 and GADS, be re-assessed for these at-
risk groups. By monitoring more gradual patterns of symptom change, an earlier
response to symptomatic worsening can be made, before a larger deterioration in
psychological or metabolic status occurs (American Diabetes Association, 2017). This is
particularly relevant for individuals who transition between depression and anxiety
states over time. If an individual presents with sub-threshold psychological symptoms
over two or more assessments, this may indicate the need for psychosocial intervention
(Pouwer, 2009).
Treatment of depression and anxiety: an integrated approach. International
guidelines support a patient-centered approach to diabetes care, which addresses the
psychosocial barriers that interfere with the person’s ability to carry out diabetes self-
management (American Diabetes Association, 2017; International Diabetes Federation
Clinical Guidelines Task Force, 2012). This thesis indicates that treatment of those with
sub-threshold and chronic depression and anxiety symptoms, particularly if they also
have lifetime MDD or GAD, may be required to achieve optimal diabetes control. These
data also suggest that supporting individuals to cope with the symptoms of anxiety may
prevent the later development or worsening in depression for a sub-group of this
population. However, the best treatment approach for those who do not fall into
traditional diagnostic categories is currently not clear. A brief review of best-practice

Depression and Anxiety in T2DM 127
evidence for the treatment of psychosocial problems in T2DM, and implications of the
present research, is presented below.
Which psychosocial treatments are effective in T2DM? A range of
psychological therapies offer promise for the treatment of depression and anxiety in
diabetes. Cognitive Behaviour Therapy (CBT; Petrak, Herpertz, et al., 2015; Safren et
al., 2014; van der Feltz-Cornelis et al., 2010) psycho-education (Penckofer et al., 2012),
and selective-serotonin reuptake inhibitors (SSRIs) for more severe depression
symptoms (Lustman, Freedland, Griffith, & Clouse, 2000; Petrak, Baumeister, et al.,
2015), have demonstrated effectiveness. Diabetes-specific CBT and Mindfulness-Based
Cognitive Therapy (MBCT) have also shown utility for improving elevated depressive
symptoms and emotional distress, for those without clinical diagnoses of MDD
(Hermanns et al., 2015; van Son et al., 2013). Whether these approaches can be extended
to treat sub-threshold mood symptoms warrants further investigation.
Further, there is extensive debate regarding whether the treatment of mood
translates to an improvement in glycaemic control (Hermanns et al., 2015; Markowitz,
Gonzalez, Wilkinson, & Safren, 2011; van der Feltz-Cornelis et al., 2010). Growing
evidence suggests that interventions which integrate psychosocial and self-management
strategies may be more effective in improving mood, self-care, and HbA1c (Bogner,
Morales, de Vries, & Cappola, 2012; Safren et al., 2014; van der Feltz-Cornelis et al.,
2010). In addition to mood, psychosocial targets in these interventions frequently
include: diabetes-specific distress; understanding of glycaemic control and how to self-
manage; fear of diabetes complications and hypoglycaemia; self-efficacy relating to
Depression and Anxiety in T2DM 128
diabetes self-management; and specific beliefs relating to diabetes (Aljasem, Peyrot,
Wissow, & Rubin, 2001; Chao, Nau, Aikens, & Taylor, 2005; Fisher et al., 2014;
Padgett, 1991; Paschalides et al., 2004; Snoek et al., 2015). Findings from the
DESMOND trial indicate that even a brief, self-management program following diabetes
diagnosis is effective in improving health behaviour, weight management, depression
symptoms, understanding of illness, and perceptions of responsibility for diabetes
management (Davies et al., 2008). This thesis posits that extending these programs more
specifically to target elevated depression and anxiety symptoms early in the diabetes
disease process, and to incorporate routine monitoring of treatment uptake and
symptomatic improvement, will likely be beneficial.
How should we offer treatment to at-risk individuals? While the discussed
therapies offer significant promise, issues of follow-through frequently arise after
screening, due to a lack of structured and collaborative follow-up (Holt & van der Feltz-
Cornelis, 2012). To resolve this issue, stepped-care management approaches for
depression have been proposed to align each individual’s current presentation with
graded treatment and referral pathways (Gonzalez et al., 2011; Petrak, Baumeister, et al.,
2015). We propose that an extension to this approach will be particularly useful for
individuals identified as at-risk in the present data.
First, at the primary care level, individuals with more mild psychological
symptoms may initially benefit from a discussion and normalization of the common
emotional reactions to diabetes, and provision of self-help materials (Gonzalez et al.,
2011; Petrak, Baumeister, et al., 2015). Assessment of the content of psychological
Depression and Anxiety in T2DM 129
distress, for example whether symptoms are related specifically to diabetes or to other
life stressors (Fisher et al., 2014), may also facilitate cost-effective multidisciplinary
management within existing diabetes care centers (Gonzalez et al., 2011). This may be
sufficient to improve mood.
For individuals who do not show symptomatic improvement at the first step,
there is currently no clear guidance regarding how severe psychological symptoms
should be to warrant referral to a psychologist or mental health practitioner. The
evidence presented here indicates that those with any ongoing and persistently elevated
depression or anxiety symptoms, and who have issues with diabetes self-management
and/or adjusting to changes in the severity of their disease (Snoek et al., 2015; Young-
Hyman et al., 2016), should be referred. Referral earlier than previously recommended
(Young-Hyman et al., 2016), rather than waiting for symptoms to rise to the point of
meeting a clinical cut-off, may also facilitate faster recovery. At this step, evidence
indicates that psychotherapy specific to mood and diabetes, of which CBT currently has
the best support, in addition to possible antidepressant prescription (Petrak, Baumeister,
et al., 2015), should be offered. Ongoing monitoring of treatment uptake and
modification of therapy is essential (Petrak, Baumeister, et al., 2015).
In conclusion, ongoing screening, monitoring, and early stepped-care
intervention is likely to be useful for individuals with persistent, sub-threshold
depression and anxiety symptoms. Future research will benefit from a detailed
evaluation of the effectiveness of collaborative psychological and self-management
interventions for these subthreshold mood symptoms, particularly in the treatment of

Depression and Anxiety in T2DM 130
comorbid depression and anxiety. Determining whether altering the long-term trajectory
of mood symptoms, translates into an improvement in diabetes-related outcomes and
health-related quality of life, is of particular clinical interest.
Future directions
The overlap between mood symptoms and diabetes distress. Diabetes distress
refers to the complex psychological and behavioural burden associated with having
diabetes (Fisher et al., 2010; Polonsky et al., 2005). Diabetes distress is most commonly
measured using the Diabetes Distress Scale (DDS; Polonsky et al., 2005) or the Problem
Areas in Diabetes Scale (PAID; Polonsky et al., 1995), and taps into domains of
interpersonal, emotional, regimen-related, and physician-related distress (Polonsky et al.,
2005). As such, diabetes distress reflects a broader affective experience to that captured
by depression and anxiety symptom measures (Fisher et al., 2014). At the time of the
FDS2 study design, diabetes distress was a newly developed construct for studying the
emotional concomitants of T2DM, and was, thus, not included as part of routine FDS2
measurement. Since then, a large body of research now supports diabetes distress as an
important, separable and longitudinal predictor of diabetes self-care and clinical
outcomes, including glycaemic control (Fisher et al., 2010; Gonzalez, Delahanty, et al.,
2008).
There is also evidence for considerable overlap between depression and diabetes
distress. Recent studies have identified a cyclical relationship between the two, whereby
higher levels of depression symptoms predict later diabetes distress, which then
contributes to a worsening in depression, and vice versa (Burns, Deschênes, & Schmitz,

Depression and Anxiety in T2DM 131
2015; Ehrmann et al., 2015). There exists debate within the field as to whether
depression is a separate risk factor for poorer outcome, or whether the poor self-
management commonly associated with depression is actually mediated by
exacerbations in diabetes distress (Fisher et al., 2010; Snoek et al., 2015). Finally, a
recent study identified separable trajectories of diabetes distress that were similar to the
depression groups in Study 2, further highlighting a potential, long-term overlap
between these constructs (Lipscombe, Burns, & Schmitz, 2015). While understudied,
overlap between anxiety and diabetes distress is expected. Thus, diabetes distress may
confound some of the associations observed between depression, anxiety and diabetes-
related outcomes presented in this thesis. Future research will benefit from a
comprehensive examination of the overlapping and additive effects of depression,
anxiety and diabetes distress trajectories, to delineate where, when, and what
intervention is most warranted.
Understanding the mechanisms of change. It was beyond the scope of this
thesis to examine specific mechanisms underlying the relationships between depression,
anxiety and diabetes across time. Further, the full spectrum of diabetes self-care
behaviours associated with mood (Gonzalez et al., 2007) were not addressed. In order to
more accurately inform intervention targets for individuals with recurring, sub-threshold
mood symptoms, identifying the factors which underlie how psychological symptoms
and diabetes-related outcomes interact for these groups will be beneficial. For example,
are changes mediated by biological inflammatory or endocrine pathways, onset of
broader life stressors, beliefs about diabetes and diabetes distress, and/or difficulties
Depression and Anxiety in T2DM 132
engaging in self-care (Collins et al., 2009; Everson et al., 2002; Fisher et al., 2014;
Tabák et al., 2014; Tully et al., 2016)?
A promising statistical method to delineate these mechanisms is longitudinal,
cross-lagged, autoregressive study designs. This method accounts for the temporal order
of longitudinal data by examining whether variable X at time t, causes variable Y at time
t + 1 and, by extension whether variable Y at time t causes variable X at time t + 1
(Pakpahan, Hoffmann, & Kröger, 2017). Mediating effects can also be modelled, to
address whether the pathways between X and Y over time are via another mechanism.
This method has been adopted recently to examine mechanisms underlying the
reciprocity between depressive symptoms and HbA1c across time (Schmitz, Deschênes,
Burns, & Smith, 2016), as well as between depression and diabetes distress (Burns et al.,
2015; Ehrmann et al., 2015). For example, Schmitz and colleagues (2016) found
depressive symptoms at one time point, predicted higher HbA1c 4-years later, and this
effect was mediated by lifestyle-related factors at year 2 (Schmitz et al., 2016). We
recommend modeling cross-lagged relationships between emotional distress and
diabetes self-care/control routinely following diabetes diagnosis, to capture the
mechanisms by which mood symptoms may worsen or change at expected points in the
disease process (Snoek et al., 2015), and further impact health-related outcomes. This is
particularly relevant for those identified as falling into an “at risk” trajectory.
Continuous mood symptoms: what are we actually measuring? Another
unanswered question of this thesis is: what does a change in symptom severity score
truly mean? For example, does a reduction of X points on a depression scale translate to
Depression and Anxiety in T2DM 133
a meaningful improvement in the experience of depression for that individual (Fried,
2016)? The findings presented here suggest that ongoing change and persistence in
psychological symptom severity appears to be associated with adverse outcome.
However, conclusions regarding the nature and impact of the symptoms experienced
cannot be drawn. Recent research posits that as depression is not a uni-dimensional
construct (Fried, 2015; Fried & Nesse, 2015), examination of the pattern or network of
symptoms experienced over time may be more meaningful than considering overall
symptom severity (Fried, 2015; Fried, Epskamp, Nesse, Tuerlinckx, & Borsboom, 2016;
Snoek et al., 2015). This is supported by the finding that separate depression symptoms
may differentially impact glycaemic control (Bot et al., 2013). A detailed,
phenomenological examination of whether there are distinct profiles of individuals who
endorse a particular pattern of depression, anxiety and distress symptoms will be
revealing. Indeed, this is currently underway in the FDS2 cohort. Implications of
different symptom profiles across time on psychosocial and health-related outcomes will
likely be clinically informative and may help to tailor more individualized treatments.
The discourse of psychological dysfunction in T2DM. This thesis has
emphasized the breadth of psychological experience for individuals with diabetes, and
proposed that sub-threshold psychological symptoms still play an important role in long-
term health behaviour. As a result, a review of the discourse relating to psychopathology
in chronic disease populations, and how this affects access to care, is needed. Distress is
often pathologised (Gonzalez et al., 2011), which can facilitate a fear of stigma
surrounding mental health problems, and limit the individual’s likelihood of accessing

Depression and Anxiety in T2DM 134
support. Facilitated discussion between the individual and their healthcare provider
about the broader relationship between diabetes and elevated emotional distress, of
which more severe depression and anxiety may be a part, may assist in reducing stigma
and improving rates of symptom detection and treatment (Barnard, Peyrot, & Holt,
2012; Fisher et al., 2014; Holt et al., 2016). Further, improvements in training programs
for the healthcare professional that emphasize the importance of dealing with a spectrum
of emotional issues in routine care, and of accounting for the values, preferences, and
priorities of the individual, may assist in improving early screening and referral to
stepped-care treatment (Holt et al., 2016).
Concluding statements
This thesis examined, for the first time in a large community cohort of
individuals with clinically diagnosed T2DM, the complex interplay between depression,
anxiety, and diabetes over time. Lifetime generalized anxiety, in addition to depression,
emerged as an important predictor of later psychological symptomatology and diabetes
self-management. Most notably, the findings presented here indicate a chronic,
underlying pattern of cycling depression and anxiety symptoms for a sub-set of this
population, which frequently fall below clinical cut-offs and likely remain untreated or
under-treated. Importantly, the mechanisms that underlie the relationship between long-
standing mood symptoms and diabetes self-management and control remain to be
clarified.
The title of this thesis posed the question “depression and anxiety symptoms in
type 2 diabetes mellitus: a matter of time?” The answer provided by all studies presented

Depression and Anxiety in T2DM 135
here is: yes. Extending our examination of depression and anxiety to a broader
symptomatic experience which develops and changes over the course of type 2 diabetes,
provides a novel and clinically meaningful perspective on the relationships between
mood and diabetes-related health outcomes. Without an appreciation of the individual’s
history and development, predictions of future functioning will be inherently limited.

Depression and Anxiety in T2DM 136

Depression and Anxiety in T2DM 137
References
Aljasem, L. I., Peyrot, M., Wissow, L., & Rubin, R. R. (2001). The impact of barriers
and self-efficacy on self-care behaviors in type 2 diabetes. The Diabetes
Educator, 27(3), 393–404. doi:10.1177/014572170102700309
American Diabetes Association. (2006). Diagnosis and classification of diabetes
mellitus. Diabetes Care, 29(1), S43–S48.
doi:http://citeseerx.ist.psu.edu/viewdoc/download?doi=10.1.1.772.6751&rep=rep
1&type=pdf
American Diabetes Association. (2015). Standards of medical care in diabetes—2015
abridged for primary care providers. Clinical Diabetes, 33(2), 97–111.
doi:10.2337/diaclin.33.2.97
American Diabetes Association. (2017). Standards of medical care in diabetes—2017,
40(Suppl. 1), S1–S132. doi: 10.2337/dc17-S001
American Psychiatric Association. (2000). Diagnostic and statistical manual of mental
disorders: DSM-IV-TR®. US: American Psychiatric Association.
Anderson, R. J., De Groot, M., Grigsby, A. B., McGill, J. B., Freedland, K. E., Clouse,
R. E., & Lustman, P. J. (2002). Anxiety and poor glycemic control: a meta-
analytic review of the literature. International Journal of Psychiatry Medicine,
32(3), 235–247. doi:10.2190/KLGD-4H8D-4RYL-TWQ8
Angst, J., & Merikangas, K. (1997). The depressive spectrum: diagnostic classification
and course. Journal of Affective Disorders, 45(1–2), 31–40. doi:10.1016/S0165-
0327(97)00057-8

Depression and Anxiety in T2DM 138
Balhara, Y. P. S., & Sagar, R. (2011). Correlates of anxiety and depression among
patients with type 2 diabetes mellitus. Indian Journal of Endocrinology and
Metabolism, 15(5), 50–54. doi:10.4103/2230-8210.83057
Barnard, K. D., Peveler, R. C., & Holt, R. I. G. (2013). Antidepressant medication as a
risk factor for type 2 diabetes and impaired glucose regulation. Diabetes Care,
36(10), 3337–3345. doi:10.2337/dc13-0560
Barnard, K. D., Peyrot, M., & Holt, R. I. G. (2012). Psychosocial support for people
with diabetes: past, present and future. Diabetic Medicine, 29(11), 1358–1360.
doi:10.1111/j.1464-5491.2012.03727.x
Bereza, B. G., Machado, M., & Einarson, T. R. (2009). Systematic review and quality
assessment of economic evaluations and quality-of-life studies related to
generalized anxiety disorder. Clinical Therapeutics, 31(6), 1279–1308.
doi:10.1016/j.clinthera.2009.06.004
Bijl, J. V., Poelgeest‐Eeltink, A. V., & Shortridge‐Baggett, L. (1999). The psychometric
properties of the diabetes management self‐efficacy scale for patients with type 2
diabetes mellitus. Journal of Advanced Nursing, 30(2), 352–359.
doi:10.1046/j.1365-2648.1999.01077.x
Black, P. H. (2003). The inflammatory response is an integral part of the stress response:
implications for atherosclerosis, insulin resistance, type II diabetes and metabolic
syndrome X. Brain, Behavior, and Immunity, 17(5), 350–364.
doi:10.1016/S0889-1591(03)00048-5
Bogner, H. R., Morales, K. H., de Vries, H. F., & Cappola, A. R. (2012). Integrated
Depression and Anxiety in T2DM 139
management of type 2 diabetes mellitus and depression treatment to improve
medication adherence: a randomized controlled trial. The Annals of Family
Medicine, 10(1), 15–22. doi:10.1370/afm.1344
Bonanno, G. A., Kennedy, P., Galatzer-Levy, I. R., Lude, P., & Elfström, M. L. (2012).
Trajectories of resilience, depression, and anxiety following spinal cord injury.
Rehabilitation Psychology, 57(3), 236–247. doi:10.1037/a0029256
Bot, M., Pouwer, F., Jonge, P., Tack, C. J., Geelhoed-Duijvestijn, P. H. L. M., & Snoek,
F. J. (2013). Differential associations between depressive symptoms and
glycaemic control in outpatients with diabetes. Diabetic Medicine, 30(3), e115–
e122. doi:10.1111/dme.12082
Boulanger, L., Zhao, Y., Bao, Y., & Russell, M. W. (2009). A retrospective study on the
impact of comorbid depression or anxiety on healthcare resource use and costs
among diabetic neuropathy patients. BMC Health Services Research, 9(1), 111.
doi:10.1186/1472-6963-9-111
Bruce, D. G., Casey, G., Davis, W. A., Starkstein, S. E., Clarnette, R. C., Foster, J. K.,
… Davis, T. M. E. (2006). Vascular depression in older people with diabetes.
Diabetologia, 49(12), 2828–2836. doi:10.1007/s00125-006-0478-y
Bruce, D. G., Davis, W. A., Cetrullo, V., Starkstein, S. E., & Davis, T. M. E. (2013).
Clinical impact of the temporal relationship between depression and type 2
diabetes: the Fremantle Diabetes Study Phase II. PLoS ONE, 8(12), 1–7.
doi:10.1371/journal.pone.0081254
Bruce, D. G., Davis, W. A., Dragovic, M., & Starkstein, S. E. (2016). Comorbid anxiety
Depression and Anxiety in T2DM 140
and depression and their impact on cardiovascular disease in type 2 diabetes: the
Fremantle Diabetes Study Phase II. Depression and Anxiety, 33(10), 960–966.
doi:10.1002/da.22523
Bruce, D. G., Davis, W. A., Hunter, M. L., Peters, K. E., Davis, T. M. E., & Starkstein,
S. E. (2016). Lifetime depression history and depression risk in type 2 diabetes: a
case-control study. Journal of Diabetes and Its Complications, 30(1), 38–42.
doi:10.1016/j.jdiacomp.2015.10.010
Bruce, D. G., Davis, W. A., Starkstein, S. E., & Davis, T. M. E. (2005). A prospective
study of depression and mortality in patients with type 2 diabetes: the Fremantle
Diabetes Study. Diabetologia, 48(12), 2532–2539. doi:10.1007/s00125-005-
0024-3
Burns, R. J., Deschênes, S. S., & Schmitz, N. (2015). Cyclical relationship between
depressive symptoms and diabetes distress in people with Type 2 diabetes
mellitus: results from the Montreal Evaluation of Diabetes Treatment Cohort
Study. Diabetic Medicine, 32(10), 1272–1278. doi:10.1111/dme.12860
Chao, J., Nau, D. P., Aikens, J. E., & Taylor, S. D. (2005). The mediating role of health
beliefs in the relationship between depressive symptoms and medication
adherence in persons with diabetes. Research in Social and Administrative
Pharmacy, 1(4), 508–25. doi:10.1016/j.sapharm.2005.09.002
Chen, L., Magliano, D. J., & Zimmet, P. Z. (2012). The worldwide epidemiology of type
2 diabetes mellitus - present and future perspectives. Nature Reviews
Endocrinology, 8(4), 228–236. doi:10.1038/nrendo.2011.183

Depression and Anxiety in T2DM 141
Cheung, N. W., Conn, J. J., d’Emden, M. C., Gunton, J. E., Jenkins, A. J., Ross, G. P.,
… Twigg, S. M. (2009). Position statement of the Australian Diabetes Society:
individualisation of glycated haemoglobin targets for adults with diabetes
mellitus. Medical Journal of Australia, 191(6), 339–344. Retrieved from
https://www.mja.com.au/system/files/issues/191_06_210909/che10487_fm.pdf
Ciechanowski, P. S., Katon, W. J., & Russo, J. E. (2000). Depression and diabetes:
impact of depressive symptoms on adherence, function, and costs. Archives of
Internal Medicine, 160(21), 3278–3285. doi:10.1001/archinte.160.21.3278
Ciechanowski, P. S., Katon, W. J., Russo, J. E., & Hirsch, I. B. (2003). The relationship
of depressive symptoms to symptom reporting, self-care and glucose control in
diabetes. General Hospital Psychiatry, 25(4), 246–252. doi:10.1016/S0163-
8343(03)00055-0
Ciechanowski, P. S., Katon, W. J., Russo, J. E., & Walker, E. A. (2001). The patient-
provider relationship: attachment theory and adherence to treatment in diabetes.
American Journal of Psychiatry, 158(1), 29–35. doi: 10.1176/appi.ajp.158.1.29
Collins, M. M., Corcoran, P., & Perry, I. J. (2009). Anxiety and depression symptoms in
patients with diabetes. Diabetic Medicine, 26(2), 153–161. doi:10.1111/j.1464-
5491.2008.02648.x
Culpepper, L. (2009). Generalized anxiety disorder and medical illness. The Journal of
Clinical Psychiatry, 70(Suppl. 2), 20–24. Retrieved from
http://europepmc.org/abstract/MED/19371503
Davies, M., Heller, S., Skinner, T. C., Campbell, M. J., Carey, M. E., Cradock, S., …
Depression and Anxiety in T2DM 142
Eaton, S. (2008). Effectiveness of the diabetes education and self management
for ongoing and newly diagnosed (DESMOND) programme for people with
newly diagnosed type 2 diabetes: cluster randomised controlled trial. BMJ,
336(7642), 491–495. doi:10.1136/bmj.39474.922025.BE
Davis, T. M. E., Bruce, D. G., & Davis, W. A. (2013). Cohort profile: the Fremantle
Diabetes Study. International Journal of Epidemiology, 42(2), 412–421.
doi:10.1093/ije/dys065
Davis, T. M. E., Hunt, K., Bruce, D. G., Starkstein, S. E., Skinner, T., McAullay, D., &
Davis, W. A. (2015). Prevalence of depression and its associations with cardio-
metabolic control in Aboriginal and Anglo-Celt patients with type 2 diabetes: the
Fremantle Diabetes Study Phase II. Diabetes Research and Clinical Practice,
107(3), 384–391. doi:10.1016/j.diabres.2014.12.014
Davis, T. M. E., Zimmet, P., Davis, W. A., Bruce, D. G., Fida, S., & Mackay, I. R.
(2000). Autoantibodies to glutamic acid decarboxylase in diabetic patients from a
multi‐ethnic Australian community: the Fremantle Diabetes Study. Diabetic
Medicine, 17(9), 667–674. doi:10.1046/j.1464-5491.2000.00359.x
de Groot, M., Anderson, R., Freedland, K. E., Clouse, R. E., & Lustman, P. J. (2001).
Association of depression and diabetes complications: a meta-analysis.
Psychosomatic Medicine, 63, 619–630. doi:0033-3174/01/6304-0619
DeFronzo, R. A., Ferrannini, E., Groop, L., Henry, R. R., Herman, W. H., Holst, J. J., …
Weiss, R. (2015). Type 2 diabetes mellitus. Nature Reviews Disease Primers, 1,
1–22. doi:10.1038/nrdp.2015.19

Depression and Anxiety in T2DM 143
Deschênes, S. S., Burns, R. J., & Schmitz, N. (2015). Associations between diabetes,
major depressive disorder and generalized anxiety disorder comorbidity, and
disability: findings from the 2012 Canadian Community Health Survey —
Mental Health (CCHS-MH). Journal of Psychosomatic Research, 78(2), 137–
142. doi:10.1016/j.jpsychores.2014.11.023
DiMatteo, M. R., Lepper, H. S., & Croghan, T. W. (2000). Depression is a risk factor for
noncompliance with medical treatment: meta-analysis of the effects of anxiety
and depression on patient adherence. Archives of Internal Medicine, 160(14),
2101–2107. doi:10.1001/archinte.160.14.2101
Edwards, L. E., & Mezuk, B. (2012). Anxiety and risk of type 2 diabetes: evidence from
the Baltimore Epidemiologic Catchment Area Study. Journal of Psychosomatic
Research, 73(6), 418–423. doi:10.1016/j.jpsychores.2012.09.018
Egede, L. E., Zheng, D., & Simpson, K. (2002). Comorbid depression is associated with
increased health care use and expenditures in individuals with diabetes. Diabetes
Care, 25(3), 464–470. doi:10.2337/diacare.25.3.464
Ehrmann, D., Kulzer, B., Haak, T., & Hermanns, N. (2015). Longitudinal relationship of
diabetes‐related distress and depressive symptoms: analysing incidence and
persistence. Diabetic Medicine, 32(10), 1264–1271. doi:10.1111/dme.12861
Enders, C. K. (2010). Applied missing data analysis. New York: Guilford Press.
Enders, C. K. (2011a). Analyzing longitudinal data with missing values. Rehabilitation
Psychology, 56(4), 267. doi:10.1037/a0025579
Enders, C. K. (2011b). Missing not at random models for latent growth curve analyses.
Depression and Anxiety in T2DM 144
Psychological Methods, 16(1), 1–16. doi:10.1037/a0022640
Enders, C. K., & Bandalos, D. L. (2001). The relative performance of full information
maximum likelihood estimation for missing data in structural equation models.
Structural Equation Modeling: A Multidisciplinary Journal, 8(3), 430–457.
doi:10.1207/S15328007SEM0803_5
Engum, A. (2007). The role of depression and anxiety in onset of diabetes in a large
population-based study. Journal of Psychosomatic Research, 62(1), 31–38.
doi:10.1016/j.jpsychores.2006.07.009
Everson, S. A., Maty, S. C., Lynch, J. W., & Kaplan, G. A. (2002). Epidemiologic
evidence for the relation between socioeconomic status and depression, obesity,
and diabetes. Journal of Psychosomatic Research, 53(4), 891–895.
doi:10.1016/S0022-3999(02)00303-3
First, M. B., Spitzer, R. L., Gibbon, M., & Williams, J. B. (2002). Structured clinical
interview for DSM-IV-TR axis I disorders: research version, non-patient edition
(SCID-I/NP). New York: Biometrics Research, New York State Psychiatric
Institute.
Fisher, L., Gonzalez, J. S., & Polonsky, W. H. (2014). The confusing tale of depression
and distress in patients with diabetes: a call for greater clarity and precision.
Diabetic Medicine, 31(7), 764–772. doi:10.1111/dme.12428
Fisher, L., Mullan, J. T., Arean, P., Glasgow, R. E., Hessler, D., & Masharani, U.
(2010). Diabetes distress but not clinical depression or depressive symptoms is
associated with glycemic control in both cross-sectional and longitudinal
Depression and Anxiety in T2DM 145
analyses. Diabetes Care, 33(1), 23–28. doi:10.2337/dc09-1238
Fisher, L., Skaff, M. M., Mullan, J. T., Arean, P., Glasgow, R., & Masharani, U. (2008).
A longitudinal study of affective and anxiety disorders, depressive affect and
diabetes distress in adults with type 2 diabetes. Diabetic Medicine, 25(9), 1096–
1101. doi:10.1111/j.1464-5491.2008.02533.x
Fried, E. I. (2015). Problematic assumptions have slowed down depression research:
why symptoms, not syndromes are the way forward. Frontiers in Psychology,
6(309), 1–11. doi:10.3389/fpsyg.2015.00309
Fried, E. I. (2016). Are more responsive depression scales really superior depression
scales? Journal of Clinical Epidemiology, 77, 4–6.
doi:10.1016/j.jclinepi.2016.05.004
Fried, E. I., Epskamp, S., Nesse, R. M., Tuerlinckx, F., & Borsboom, D. (2016). What
are “good” depression symptoms? Comparing the centrality of DSM and non-
DSM symptoms of depression in a network analysis. Journal of Affective
Disorders, 189, 314–320. doi:10.1016/j.jad.2015.09.005
Fried, E. I., & Nesse, R. M. (2015). Depression is not a consistent syndrome: an
investigation of unique symptom patterns in the STAR* D study. Journal of
Affective Disorders, 172, 96–102. doi:10.1016/j.jad.2014.10.010
Gois, C., Dias, V. V., Raposo, J. F., do Carmo, I., & Barbosa, A. (2012). Vulnerability to
stress, anxiety and depressive symptoms and metabolic control in type 2
diabetes. BMC Research Notes, 5, 271. doi:10.1186/1756-0500-5-271
Goldberg, D. P. (2010). Diagnostic issues in depression and generalized anxiety

Depression and Anxiety in T2DM 146
disorder: refining the research agenda for DSM-V. Arlington, VA: American
Psychiatric Association.
Gonzalez, J. S., Delahanty, L. M., Safren, S. A., Meigs, J. B., & Grant, R. W. (2008).
Differentiating symptoms of depression from diabetes-specific distress:
relationships with self-care in type 2 diabetes. Diabetologia, 51(10), 1822–1825.
doi:10.1007/s00125-008-1113-x
Gonzalez, J. S., Fisher, L., & Polonsky, W. H. (2011). Depression in diabetes: have we
been missing something important? Diabetes Care, 34(1), 236–239.
doi:10.2337/dc10-1970
Gonzalez, J. S., Peyrot, M., McCarl, L. A., Collins, E. M., Serpa, L., Mimiaga, M. J., &
Safren, S. A. (2008). Depression and diabetes treatment nonadherence: a meta-
analysis. Diabetes Care, 31(12), 2398–2403. doi:10.2337/dc08-1341
Gonzalez, J. S., Safren, S. A., Cagliero, E., Wexler, D. J., Delahanty, L., Wittenberg, E.,
… Grant, R. W. (2007). Depression, self-care, and medication adherence in type
2 diabetes relationships across the full range of symptom severity. Diabetes
Care, 30(9), 2222–2227. doi:10.2337/dc07-0158
Gonzalez, J. S., Safren, S. A., Delahanty, L. M., Cagliero, E., Wexler, D. J., Meigs, J. B.,
& Grant, R. W. (2008). Symptoms of depression prospectively predict poorer
self‐care in patients with type 2 diabetes. Diabetic Medicine, 25(9), 1102–1107.
doi:10.1111/j.1464-5491.2008.02535.x
Gore, M., Brandenburg, N. A., Dukes, E., Hoffman, D. L., Tai, K.-S., & Stacey, B.
(2005). Pain severity in diabetic peripheral neuropathy is associated with patient
Depression and Anxiety in T2DM 147
functioning, symptom levels of anxiety and depression, and sleep. Journal of
Pain and Symptom Management, 30(4), 374–385.
doi:10.1016/j.jpainsymman.2005.04.009
Grenier, S., Potvin, O., Hudon, C., Boyer, R., Préville, M., Desjardins, L., & Bherer, L.
(2012). Twelve-month prevalence and correlates of subthreshold and threshold
anxiety in community-dwelling older adults with cardiovascular diseases.
Journal of Affective Disorders, 136(3), 724–732. doi:10.1016/j.jad.2011.09.052
Grigsby, A. B., Anderson, R. J., Freedland, K. E., Clouse, R. E., & Lustman, P. J.
(2002). Prevalence of anxiety in adults with diabetes: a systematic review.
Journal of Psychosomatic Research, 53(6), 1053–1060. doi:10.1016/S0022-
3999(02)00417-8
Grøntved, A., & Hu, F. B. (2011). Television viewing and risk of type 2 diabetes,
cardiovascular disease, and all-cause mortality: a meta-analysis. Jama, 305(23),
2448–2455. doi:10.1001/jama.2011.812
Hanley, J. A., & McNeil, B. J. (1982). The meaning and use of the area under a receiver
operating characteristic (ROC) curve. Radiology, 143(1), 29–36.
doi:10.1148/radiology.143.1.7063747
Hasan, S. S., Clavarino, A. M., Mamun, A. A., Doi, S. A., & Kairuz, T. (2013).
Population impact of depression either as a risk factor or consequence of type 2
diabetes in adults: a meta-analysis of longitudinal studies. Asian Journal of
Psychiatry, 6(6), 460–472. doi:10.1016/j.ajp.2013.09.008
Hayes, A. F. (2013). Introduction to mediation, moderation, and conditional process

Depression and Anxiety in T2DM 148
analysis. New York: Guilford Press.
Hayes, A. F., & Preacher, K. J. (2014). Statistical mediation analysis with a
multicategorical independent variable. British Journal of Mathematical &
Statistical Psychology, 67(3), 451–470. doi:10.1111/bmsp.12028
Hayes, A. F., & Scharkow, M. (2013). The relative trustworthiness of inferential tests of
the indirect effect in statistical mediation analysis: does method really matter?
Psychological Science, 24(10), 1918–1927. doi:10.1177/0956797613480187
Hermanns, N., Kulzer, B., Krichbaum, M., Kubiak, T., & Haak, T. (2005). Affective and
anxiety disorders in a German sample of diabetic patients: prevalence,
comorbidity and risk factors. Diabetic Medicine, 22(3), 293–300.
doi:10.1111/j.1464-5491.2005.01414.x
Hermanns, N., Schmitt, A., Gahr, A., Herder, C., Nowotny, B., Roden, M., … Kulzer, B.
(2015). The effect of a diabetes-specific cognitive behavioral treatment program
(DIAMOS) for patients with diabetes and subclinical depression: results of a
randomized controlled trial. Diabetes Care, 38(4), 551–560. doi:10.2337/dc14-
1416
Holt, R. I. G., Nicolucci, A., Kovacs Burns, K., Lucisano, G., Skovlund, S. E., Forbes,
A., … Peyrot, M. (2016). Correlates of psychological care strategies for people
with diabetes in the second Diabetes Attitudes, Wishes and Needs (DAWN2TM)
study. Diabetic Medicine, 33(9), 1174–1183. doi:10.1111/dme.13109
Holt, R. I. G., & van der Feltz-Cornelis, C. M. (2012). Key concepts in screening for
depression in people with diabetes. Journal of Affective Disorders, 142(S1),
Depression and Anxiety in T2DM 149
S72–S79. doi:10.1016/S0165-0327(12)70011-3
Hoyle, R. H. (2012). Handbook of structural equation modeling. New York: The
Guildford Press.
Hu, F. B. (2011). Globalization of diabetes. Diabetes Care, 34(6), 1249–1257.
doi:10.2337/dc11-0442
Hu, L., & Bentler, P. M. (1999). Cutoff criteria for fit indexes in covariance structure
analysis: conventional criteria versus new alternatives. Structural Equation
Modeling: A Multidisciplinary Journal, 6(1), 1–55.
doi:10.1080/10705519909540118
International Diabetes Federation Clinical Guidelines Task Force. (2012). Global
Guideline for Type 2 Diabetes. Retrieved from http://www.idf.org/guideline-
type-2-diabetes.
Inzucchi, S. E., Bergenstal, R. M., Buse, J. B., Diamant, M., Ferrannini, E., Nauck, M.,
… Matthews, D. R. (2012). Management of hyperglycemia in type 2 diabetes: a
patient-centered approach. Diabetes Care, 35(6), 1364–1379. doi:10.2337/dc12-
0413
Jain, R., Jain, S., Raison, C. L., & Maletic, V. (2011). Painful diabetic neuropathy is
more than pain alone: examining the role of anxiety and depression as mediators
and complicators. Current Diabetes Reports, 11(4), 275–284.
doi:10.1007/s11892-011-0202-2
Jung, T., & Wickrama, K. A. S. (2008). An introduction to latent class growth analysis
and growth mixture modeling. Social and Personality Psychology Compass,
Depression and Anxiety in T2DM 150
2(1), 302–317. doi:10.1111/j.1751-9004.2007.00054.x
Katon, W. J. (2003). Clinical and health services relationships between major
depression, depressive symptoms, and general medical illness. Biological
Psychiatry, 54(3), 216–226. doi:10.1016/s0006-3223(03)00273-7
Katon, W. J., Russo, J., Lin, E. H. B., Heckbert, S. R., Ciechanowski, P., & Ludman, E.
J. (2009). Depression and diabetes: factors associated major depression at five-
year follow up. Psychosomatics, 50(6), 570–579. doi:10.1016/S0033-
3182(09)70858-8
Katon, W. J., Rutter, C. M., Simon, G., Lin, E. H. B., Ludman, E., Ciechanowski, P., …
Von Korff, M. (2005). The association of comorbid depression with mortality in
patients with type 2 diabetes. Diabetes Care, 28(11), 2668–2672.
doi:10.2337/diacare.28.11.2668
Katon, W. J., Von Korff, M., Ciechanowski, P., Russo, J., Lin, E. H. B., Simon, G., …
Young, B. (2004). Behavioral and clinical factors associated with depression
among individuals with diabetes. Diabetes Care, 27(4), 914–920.
doi:10.2337/diacare.27.4.914
Keller, M. B. (2002). The long-term clinical course of generalized anxiety disorder. The
Journal of Clinical Psychiatry, 63(Suppl. 8), 11–16. Retrieved from http://www-
psychiatrist-com.ezproxy.library.uwa.edu.au/JCP/article/Pages/2002/
v63s08/v63s0803.aspx
Kennedy, N., Abbott, R., & Paykel, E. S. (2004). Longitudinal syndromal and sub-
syndromal symptoms after severe depression: 10-year follow-up study. The

Depression and Anxiety in T2DM 151
British Journal of Psychiatry, 184(4), 330–336. doi:10.1192/bjp.184.4.330
Kiecolt-Glaser, J. K., & Glaser, R. (2002). Depression and immune function: central
pathways to morbidity and mortality. Journal of Psychosomatic Research, 53(4),
873–876. doi:10.1016/S0022-3999(02)00309-4
Knol, M., Twisk, J., Beekman, A., Heine, R., Snoek, F., & Pouwer, F. (2006).
Depression as a risk factor for the onset of type 2 diabetes mellitus. A meta-
analysis. Diabetologia, 49(5), 837–845. doi:10.1007/s00125-006-0159-x
Kroenke, K., & Spitzer, R. L. (2002). The PHQ-9: a new depression diagnostic and
severity measure. Psychiatric Annals, 32(9), 509–515. doi:10.3928/0048-5713-
20020901-06
Kroenke, K., Spitzer, R. L., Williams, J. B. W., Monahan, P. O., & Löwe, B. (2007).
Anxiety disorders in primary care: prevalence, impairment, comorbidity, and
detection. Annals of Internal Medicine, 146(5), 317–325. doi: 10.7326/0003-
4819-146-5-200703060-00004
Lin, E. H. B., Katon, W., Michael Von, K., Rutter, C., & et al. (2004). Relationship of
depression and diabetes self-care, medication adherence, and preventive care.
Diabetes Care, 27(9), 2154–2160. doi:10.2337/diacare.27.9.2154
Lin, H., McCulloch, C. E., & Rosenheck, R. A. (2004). Latent pattern mixture models
for informative intermittent missing data in longitudinal studies. Biometrics,
60(2), 295–305. doi:10.1111/j.0006-341X.2004.00173.x
Lipscombe, C., Burns, R. J., & Schmitz, N. (2015). Exploring trajectories of diabetes
distress in adults with type 2 diabetes; a latent class growth modeling approach.

Depression and Anxiety in T2DM 152
Journal of Affective Disorders, 188, 160–166. doi:10.1016/j.jad.2015.08.003
Lo, Y., Mendell, N. R., & Rubin, D. B. (2001). Testing the number of components in a
normal mixture. Biometrika, 88(3), 767–778. doi:10.1093/biomet/88.3.767
Löwe, B., Kroenke, K., Herzog, W., & Gräfe, K. (2004). Measuring depression outcome
with a brief self-report instrument: sensitivity to change of the Patient Health
Questionnaire (PHQ-9). Journal of Affective Disorders, 81(1), 61–66.
doi:10.1016/S0165-0327(03)00198-8
Lustman, P. J., Anderson, R. J., Freedland, K. E., De Groot, M., Carney, R. M., &
Clouse, R. E. (2000). Depression and poor glycemic control: a meta-analytic
review of the literature. Diabetes Care, 23(7), 934–942. Retrieved from
http://search.proquest.com.ezproxy.library.uwa.edu.au/docview/223022523/fullte
xtPDF/19D0592D1CA54768PQ/1?accountid=14681
Lustman, P. J., & Clouse, R. E. (2005). Depression in diabetic patients: the relationship
between mood and glycemic control. Journal of Diabetes and Its Complications,
19(2), 113–122. doi:10.1016/j.jdiacomp.2004.01.002
Lustman, P. J., Freedland, K. E., Griffith, L. S., & Clouse, R. E. (2000). Fluoxetine for
depression in diabetes: a randomized double-blind placebo-controlled trial.
Diabetes Care, 23(5), 618–623. doi:10.2337/diacare.23.5.618
Lustman, P. J., Griffith, L. S., Freedland, K. E., & Clouse, R. E. (1997). The course of
major depression in diabetes. General Hospital Psychiatry, 19(2), 138–143.
doi:10.1016/S0163-8343(96)00170-3
Lustman, P. J., Griffith, L. S., Freedland, K. E., Kissel, S. S., & Clouse, R. E. (1998).

Depression and Anxiety in T2DM 153
Cognitive behavior therapy for depression in type 2 diabetes mellitus: a
randomized, controlled trial. Annals of Internal Medicine, 129(8), 613–21.
doi:10.7326/0003-4819-129-8-199810150-00005
Manea, L., Gilbody, S., & McMillan, D. (2012). Optimal cut-off score for diagnosing
depression with the Patient Health Questionnaire (PHQ-9): a meta-analysis.
Canadian Medical Association Journal, 184(3), E191–E196.
doi:10.1503/cmaj.112004
Marcus, M. D., Wing, R. R., Guare, J., Blair, E. H., & Jawad, A. (1992). Lifetime
prevalence of major depression and its effect on treatment outcome in obese type
II diabetic patients. Diabetes Care, 15(2), 253–255. doi:10.2337/diacare.15.2.253
Markowitz, S. M., Gonzalez, J. S., Wilkinson, J. L., & Safren, S. A. (2011). A review of
treating depression in diabetes: emerging findings. Psychosomatics, 52(1), 1–18.
doi:10.1016/j.psym.2010.11.007
Merikangas, K. R., Zhang, H., Avenevoli, S., Acharyya, S., Neuenschwander, M., &
Angst, J. (2003). Longitudinal trajectories of depression and anxiety in a
prospective community study: the Zurich Cohort Study. Archives of General
Psychiatry, 60(10), 993–1000. doi:10.1001/archpsyc.60.9.993
Mezuk, B., Eaton, W. W., Albrecht, S., & Golden, S. H. (2008). Depression and type 2
diabetes over the lifespan. Diabetes Care, 31(12), 2383–2390. doi:10.2337/dc08-
0985
Muthén, B. O., Asparouhov, T., Hunter, A. M., & Leuchter, A. F. (2011). Growth
modeling with nonignorable dropout: alternative analyses of the STAR* D
Depression and Anxiety in T2DM 154
antidepressant trial. Psychological Methods, 16(1), 17–33. doi:10.1037/a0022634
Muthén, B. O., & Muthén, L. K. (2000). Integrating person-centered and variable-
centered analyses: growth mixture modeling with latent trajectory classes.
Alcoholism: Clinical and Experimental Research, 24(6), 882–891.
doi:10.1111/j.1530-0277.2000.tb02070.x
Muthén, L. K., & Muthén, B. O. (1998). Mplus user’s guide. Los Angeles, CA: Muthén
& Muthén.
Nagin, D. S. (2005). Group-based modeling of development. Cambridge, Massachusetts:
Harvard University Press.
Nagin, D. S., & Odgers, C. L. (2010). Group-based trajectory modeling in clinical
research. Annual Review of Clinical Psychology, 6, 109–138.
doi:10.1146/annurev.clinpsy.121208.131413
Naranjo, D. M., Fisher, L., Areán, P. A., Hessler, D., & Mullan, J. (2011). Patients with
type 2 diabetes at risk for major depressive disorder over time. Annals of Family
Medicine, 9(2), 115–120. doi:10.1370/afm.1212
Nefs, G., Pouwer, F., Denollet, J., & Pop, V. (2012). The course of depressive symptoms
in primary care patients with type 2 diabetes: results from the Diabetes,
Depression, Type D Personality Zuidoost-Brabant (DiaDDZoB) study.
Diabetologia, 55(3), 608–616. doi:10.1007/s00125-011-2411-2
Ogurtsova, K., da Rocha Fernandes, J. D., Huang, Y., Linnenkamp, U., Guariguata, L.,
Cho, N. H., … Makaroff, L. E. (2017). IDF Diabetes Atlas: global estimates for
the prevalence of diabetes for 2015 and 2040. Diabetes Research and Clinical
Depression and Anxiety in T2DM 155
Practice, 128, 40–50. doi:10.1016/j.diabres.2017.03.024
Padgett, D. K. (1991). Correlates of self-efficacy beliefs among patients with non-insulin
dependent diabetes mellitus in Zagreb, Yugoslavia. Patient Education and
Counseling, 18(2), 139–147. doi:10.1016/0738-3991(91)90006-Q
Pakpahan, E., Hoffmann, R., & Kröger, H. (2017). Statistical methods for causal
analysis in life course research: an illustration of a cross-lagged structural
equation model, a latent growth model, and an autoregressive latent trajectories
model. International Journal of Social Research Methodology, 20(1), 1–19.
doi:10.1080/13645579.2015.1091641
Paschalides, C., Wearden, A. J., Dunkerley, R., Bundy, C., Davies, R., & Dickens, C. M.
(2004). The associations of anxiety, depression and personal illness
representations with glycaemic control and health-related quality of life in
patients with type 2 diabetes mellitus. Journal of Psychosomatic Research, 57(6),
557–564. doi:10.1016/j.jpsychores.2004.03.006
Penckofer, S. M., Ferrans, C., Mumby, P., Byrn, M., Emanuele, M. A., Harrison, P. R.,
… Lustman, P. (2012). A psychoeducational intervention (SWEEP) for
depressed women with diabetes. Annals of Behavioral Medicine, 44(2), 192–206.
doi:10.1007/s12160-012-9377-2
Penninx, B. W., Nolen, W. A., Lamers, F., Zitman, F. G., Smit, J. H., Spinhoven, P., …
van der Meer, K. (2011). Two-year course of depressive and anxiety disorders:
results from the Netherlands Study of Depression and Anxiety (NESDA).
Journal of Affective Disorders, 133(1), 76–85. doi:10.1016/j.jad.2011.03.027
Depression and Anxiety in T2DM 156
Petrak, F., Baumeister, H., Skinner, T. C., Brown, A., & Holt, R. I. G. (2015).
Depression and diabetes: treatment and health-care delivery. The Lancet
Diabetes & Endocrinology, 3(6), 472–485. doi:10.1016/S2213-8587(15)00045-5
Petrak, F., Herpertz, S., Albus, C., Hermanns, N., Hiemke, C., Hiller, W., … Müller, M.
J. (2015). Cognitive behavioral therapy versus sertraline in patients with
depression and poorly controlled diabetes: the Diabetes and Depression (DAD)
study. Diabetes Care, 38(5), 767–775. doi:10.2337/dc14-1599
Peyrot, M., & Rubin, R. R. (1999). Persistence of depressive symptoms in diabetic
adults. Diabetes Care, 22(3), 448–452. Retrieved from http://search.proquest.
com.ezproxy.library.uwa.edu.au/docview/223030477/fulltextPDF/E0223DB9B7
59466CPQ/1?accountid=14681
Polonsky, W. H., Anderson, B. J., Lohrer, P. A., Welch, G., Jacobson, A. M., Aponte, J.
E., & Schwartz, C. E. (1995). Assessment of diabetes-related distress. Diabetes
Care, 18(6), 754–760. Retrieved from https://www.researchgate.net/profile/
William_Polonsky/publication/15642616_Assessment_of_Diabetes-
Related_Distress/links/543701b50cf2dc341db4c6f9/Assessment-of-Diabetes-
Related-Distress.pdf
Polonsky, W. H., Fisher, L., Earles, J., Dudl, R. J., Lees, J., Mullan, J., & Jackson, R. A.
(2005). Assessing psychosocial distress in diabetes: development of the Diabetes
Distress Scale. Diabetes Care, 28(3), 626–631. doi:10.2337/diacare.28.3.626
Porensky, E. K., Dew, M. A., Karp, J. F., Skidmore, E., Rollman, B. L., Shear, M. K., &
Lenze, E. J. (2009). The burden of late-life generalized anxiety disorder: effects
Depression and Anxiety in T2DM 157
on disability, health-related quality of life, and healthcare utilization. The
American Journal of Geriatric Psychiatry, 17(6), 473–482.
doi:10.1097/JGP.0b013e31819b87b2
Pouwer, F. (2009). Should we screen for emotional distress in type 2 diabetes mellitus?
Nature Reviews Endocrinology, 5(12), 665–671. doi:10.1038/nrendo.2009.214
Radloff, L. S. (1977). The CES-D scale: a self-report depression scale for research in the
general population. Applied Psychological Measurement, 1(3), 385–401.
doi:10.1177/014662167700100306
Ram, N., & Grimm, K. J. (2009). Growth mixture modeling: a method for identifying
differences in longitudinal change among unobserved groups. International
Journal of Behavioral Development, 33(6), 565–576.
doi:10.1177/0165025409343765
Ramsawh, H. J., Raffa, S. D., Edelen, M. O., Rende, R., & Keller, M. B. (2009). Anxiety
in middle adulthood: effects of age and time on the 14-year course of panic
disorder, social phobia and generalized anxiety disorder. Psychological
Medicine, 39(4), 615–624. doi:10.1017/S0033291708003954
Renn, B. N., Feliciano, L., & Segal, D. L. (2011). The bidirectional relationship of
depression and diabetes: a systematic review. Clinical Psychology Review, 31(8),
1239–1246. doi:10.1016/j.cpr.2011.08.001
Rothman, K. J. (1990). No adjustments are needed for multiple comparisons.
Epidemiology, 1(1), 43–46. doi:http://journals.lww.com/epidem/
Fulltext/1990/01000/No_Adjustments_Are_Needed_for_Multiple.10.aspx

Depression and Anxiety in T2DM 158
Roy, J. (2003). Modeling longitudinal data with nonignorable dropouts using a latent
dropout class model. Biometrics, 59(4), 829–836. doi:10.1111/j.0006-
341X.2003.00097.x
Roy, T., Lloyd, C. E., Pouwer, F., Holt, R. I. G., & Sartorius, N. (2012). Screening tools
used for measuring depression among people with type 1 and type 2 diabetes: a
systematic review. Diabetic Medicine, 29(2), 164–175. doi:10.1111/j.1464-
5491.2011.03401.x
Rzewuska, M., Mallen, C. D., Strauss, V. Y., Belcher, J., & Peat, G. (2015). One-year
trajectories of depression and anxiety symptoms in older patients presenting in
general practice with musculoskeletal pain: a latent class growth analysis.
Journal of Psychosomatic Research, 79(3), 195–201.
doi:10.1016/j.jpsychores.2015.05.016
Sadek, N., & Bona, J. (2000). Subsyndromal symptomatic depression: a new concept.
Depression and Anxiety, 12(1), 30–39. doi:10.1002/1520-
6394(2000)12:1<30::AID-DA4>3.0.CO;2-P
Safren, S. A., Gonzalez, J. S., Wexler, D. J., Psaros, C., Delahanty, L. M., Blashill, A. J.,
… Cagliero, E. (2014). A randomized controlled trial of cognitive behavioral
therapy for adherence and depression (CBT-AD) in patients with uncontrolled
type 2 diabetes. Diabetes Care, 37(3), 625–633. doi:10.2337/dc13-0816
Schmitz, N., Deschênes, S., Burns, R., & Smith, K. J. (2016). Depressive symptoms and
glycated hemoglobin A1c: a reciprocal relationship in a prospective cohort study.
Psychological Medicine, 46(5), 945–955. doi:10.1017/S0033291715002445

Depression and Anxiety in T2DM 159
Schmitz, N., Gariépy, G., Smith, K. J., Clyde, M., Malla, A., Boyer, R., … Wang, J.
(2014). Recurrent subthreshold depression in type 2 diabetes: an important risk
factor for poor health outcomes. Diabetes Care, 37(4), 970–978.
doi:10.2337/dc13-1832
Schmitz, N., Gariépy, G., Smith, K. J., Malla, A., Wang, J. L., Boyer, R., … Lesage, A.
(2013). The pattern of depressive symptoms in people with type 2 diabetes: a
prospective community study. Journal of Psychosomatic Research, 74(2), 128–
134. doi:10.1016/j.jpsychores.2012.09.021
Schoevers, R. A., Beekman, A. T. F., Deeg, D. J. H., Jonker, C., & van Tilburg, W.
(2003). Comorbidity and risk-patterns of depression, generalised anxiety disorder
and mixed anxiety-depression in later life: results from the AMSTEL study.
International Journal of Geriatric Psychiatry, 18(11), 994–1001.
doi:10.1002/gps.1001
Schoevers, R. A., Deeg, D. J. H., van Tilburg, W., & Beekman, A. T. F. (2005).
Depression and generalized anxiety disorder: co-occurrence and longitudinal
patterns in elderly patients. The American Journal of Geriatric Psychiatry, 13(1),
31–39. doi:10.1097/00019442-200501000-00006
Simon, G. E., Katon, W. J., Lin, E. H. B., Ludman, E., VonKorff, M., Ciechanowski, P.,
& Young, B. A. (2005). Diabetes complications and depression as predictors of
health service costs. General Hospital Psychiatry, 27(5), 344–351.
doi:10.1016/j.genhosppsych.2005.04.008
Skinner, T. C., Carey, M. E., Cradock, S., Dallosso, H. M., Daly, H., Davies, M. J., …

Depression and Anxiety in T2DM 160
DESMOND Collaborative. (2010). Depressive symptoms in the first year from
diagnosis of type 2 diabetes: results from the DESMOND trial. Diabetic
Medicine, 27(8), 965–967. doi:10.1111/j.1464-5491.2010.03028.x
Smith, K. J., Béland, M., Clyde, M., Gariépy, G., Pagé, V., Badawi, G., … Schmitz, N.
(2013). Association of diabetes with anxiety: a systematic review and meta-
analysis. Journal of Psychosomatic Research, 74(2), 89–99.
doi:10.1016/j.jpsychores.2012.11.013
Snoek, F. J., Bremmer, M. A., & Hermanns, N. (2015). Constructs of depression and
distress in diabetes: time for an appraisal. The Lancet Diabetes & Endocrinology,
3(6), 450–460. doi:10.1016/S2213-8587(15)00135-7
Spitzer, R. L., Kroenke, K., & Williams, J. B. (1999). Validation and utility of a self-
report version of PRIME-MD: the PHQ primary care study. Journal of the
American Medical Association, 282(18), 1737–1744.
doi:10.1001/jama.282.18.1737
Spitzer, R. L., Kroenke, K., Williams, J. B. W., & Lowe, B. (2006). A brief measure for
assessing generalized anxiety disorder: the GAD-7. Archives of Internal
Medicine, 166(10), 1092–1097. doi:10.1001/archinte.166.10.1092
SPSS Inc. (1989, 2010). IBS SPSS Missing Values 19. SPSS Inc. Retrieved from
https://www.csun.edu/sites/default/files/missing-values19.pdf
Starkstein, S. E., Davis, W. A., Dragovic, M., Cetrullo, V., Davis, T. M. E., & Bruce, D.
G. (2014). Diagnostic criteria for depression in type 2 diabetes: a data-driven
approach. PloS One, 9(11), e112049. doi:10.1371/journal.pone.0112049

Depression and Anxiety in T2DM 161
Tabák, A. G., Akbaraly, T. N., Batty, G. D., & Kivimäki, M. (2014). Depression and
type 2 diabetes: a causal association? The Lancet Diabetes & Endocrinology,
2(3), 236–245. doi:10.1016/S2213-8587(13)70139-6
Trento, M., Charrier, L., Salassa, M., Merlo, S., Passera, P., Cavallo, F., & Porta, M.
(2015). Depression, anxiety and cognitive function in patients with type 2
diabetes: an 8-year prospective observational study. Acta Diabetologica, 52(6),
1157–1166. doi:10.1007/s00592-015-0806-0
Trento, M., Trevisan, M., Raballo, M., Passera, P., Charrier, L., Cavallo, F., & Porta, M.
(2014). Depression, anxiety, cognitive impairment and their association with
clinical and demographic variables in people with type 2 diabetes: a 4-year
prospective study. Journal of Endocrinological Investigation, 37(1), 79–85.
doi:10.1007/s40618-013-0028-7
Tully, P. J., Baumeister, H., Martin, S., Atlantis, E., Jenkins, A., Januszewski, A., …
Wittert, G. A. (2016). Elucidating the biological mechanisms linking depressive
symptoms with type 2 diabetes in men: the longitudinal effects of inflammation,
microvascular dysfunction, and testosterone. Psychosomatic Medicine, 78(2),
221–232. doi:10.1097/PSY.0000000000000263
Tully, P. J., Cosh, S. M., & Baune, B. T. (2013). A review of the affects of worry and
generalized anxiety disorder upon cardiovascular health and coronary heart
disease. Psychology, Health & Medicine, 18(6), 627–644.
doi:10.1080/13548506.2012.749355
Tylee, A., & Walters, P. (2006). Underrecognition of anxiety and mood disorders in

Depression and Anxiety in T2DM 162
primary care: why does the problem exist and what can be done? The Journal of
Clinical Psychiatry, 68(Suppl. 2), 27–30. Retrieved from http://www-
psychiatrist-com.ezproxy.library.uwa.edu.au/JCP/article/Pages/
2007/v68s02/v68s0204.aspx
van der Feltz-Cornelis, C. M., Nuyen, J., Stoop, C., Chan, J., Jacobson, A. M., Katon,
W., … Sartorius, N. (2010). Effect of interventions for major depressive disorder
and significant depressive symptoms in patients with diabetes mellitus: a
systematic review and meta-analysis. General Hospital Psychiatry, 32(4), 380–
395. doi:10.1016/j.genhosppsych.2010.03.011
van Loo, H. M., Schoevers, R. A., Kendler, K. S., de Jonge, P., & Romeijn, J.-W.
(2016). Psychiatric comorbidity does not only depend on diagnostic thresholds:
an illustration with major depressive disorder and generalized anxiety disorder.
Depression and Anxiety, 33(2), 143–152. doi:10.1002/da.22453
van Son, J., Nyklíček, I., Pop, V. J., Blonk, M. C., Erdtsieck, R. J., Spooren, P. F., …
Pouwer, F. (2013). The effects of a mindfulness-based intervention on emotional
distress, quality of life, and HbA1c in outpatients with diabetes (DiaMind).
Diabetes Care, 36(4), 823–830. doi:10.2337/dc12-1477
van Steenbergen-Weijenburg, K. M., Vroege, L., Ploeger, R. R., Brals, J. W., Vloedbeld,
M. G., Veneman, T. F., … der Feltz-Cornelis, C. M. (2010). Validation of the
PHQ-9 as a screening instrument for depression in diabetes patients in
specialized outpatient clinics. BMC Health Services Research, 10(235), 1–6.
doi:10.1186/1472-6963-10-235

Depression and Anxiety in T2DM 163
Wagner, J. A., Tennen, H., & Osborn, C. Y. (2010). Lifetime depression and diabetes
self-management in women with Type 2 diabetes: a case-control study. Diabetic
Medicine, 27(6), 713–717. doi:10.1111/j.1464-5491.2010.02996.x
Watson, D. (2005). Rethinking the mood and anxiety disorders: a quantitative
hierarchical model for DSM-V. Journal of Abnormal Psychology, 114(4), 522–
536. doi:10.1037/0021-843X.114.4.522
Wells, K. B., Burnam, M. A., Rogers, W., Hays, R., & Camp, P. (1992). The course of
depression in adult outpatients: results from the Medical Outcomes Study.
Archives of General Psychiatry, 49(10), 788–794.
doi:10.1001/archpsyc.1992.01820100032007
Whitworth, S. R., Bruce, D. G., Starkstein, S. E., Davis, W. A., Davis, T. M. E., &
Bucks, R. S. (2016). Lifetime depression and anxiety increase prevalent
psychological symptoms and worsen glycemic control in type 2 diabetes: the
Fremantle Diabetes Study Phase II. Diabetes Research and Clinical Practice,
122, 190–197. doi:10.1016/j.diabres.2016.10.023
Whitworth, S. R., Bruce, D. G., Starkstein, S. E., Davis, W. A., Davis, T. M. E., Skinner,
T. C., & Bucks, R. S. (2017). Depression symptoms are persistent in type 2
diabetes: risk factors and outcomes of 5-year depression trajectories using latent
class growth analysis. Diabetic Medicine, 34, 1108-1115.doi:10.1111/dme.13372
Wild, D., von Maltzahn, R., Brohan, E., Christensen, T., Clauson, P., & Gonder-
Frederick, L. (2007). A critical review of the literature on fear of hypoglycemia
in diabetes: implications for diabetes management and patient education. Patient
Depression and Anxiety in T2DM 164
Education and Counseling, 68(1), 10–15. doi:10.1016/j.pec.2007.05.003
Windle, M., & Windle, R. C. (2013). Recurrent depression, cardiovascular disease, and
diabetes among middle-aged and older adult women. Journal of Affective
Disorders, 150(3), 895–902. doi:10.1016/j.jad.2013.05.008
Wittchen, H.-U., Lieb, R., Pfister, H., & Schuster, P. (2000). The waxing and waning of
mental disorders: evaluating the stability of syndromes of mental disorders in the
population. Subthreshold Disorders in Psychiatry, 41(2, Suppl. 1), 122–132.
doi:10.1016/S0010-440X(00)80018-8
World Health Organization. (2011). Use of glycated haemoglobin (HbA1c) in the
diagnosis of diabetes mellitus: abbreviated report of a WHO consultation.
Geneva: WHO Press.
Yonkers, K. A., Bruce, S. E., Dyck, I. R., & Keller, M. B. (2003). Chronicity, relapse,
and illness—course of panic disorder, social phobia, and generalized anxiety
disorder: findings in men and women from 8 years of follow‐up. Depression and
Anxiety, 17(3), 173–179. doi:10.1002/da.10106
Young-Hyman, D., de Groot, M., Hill-Briggs, F., Gonzalez, J. S., Hood, K., & Peyrot,
M. (2016). Psychosocial care for people with diabetes: a position statement of
the American Diabetes Association. Diabetes Care, 39(12), 2126–2140.
doi:10.2337/dc16-2053
Zigmond, A. S., & Snaith, R. P. (1983). The hospital anxiety and depression scale. Acta
Psychiatrica Scandinavica, 67(6), 361–370. doi:10.1111/j.1600-
0447.1983.tb09716.x
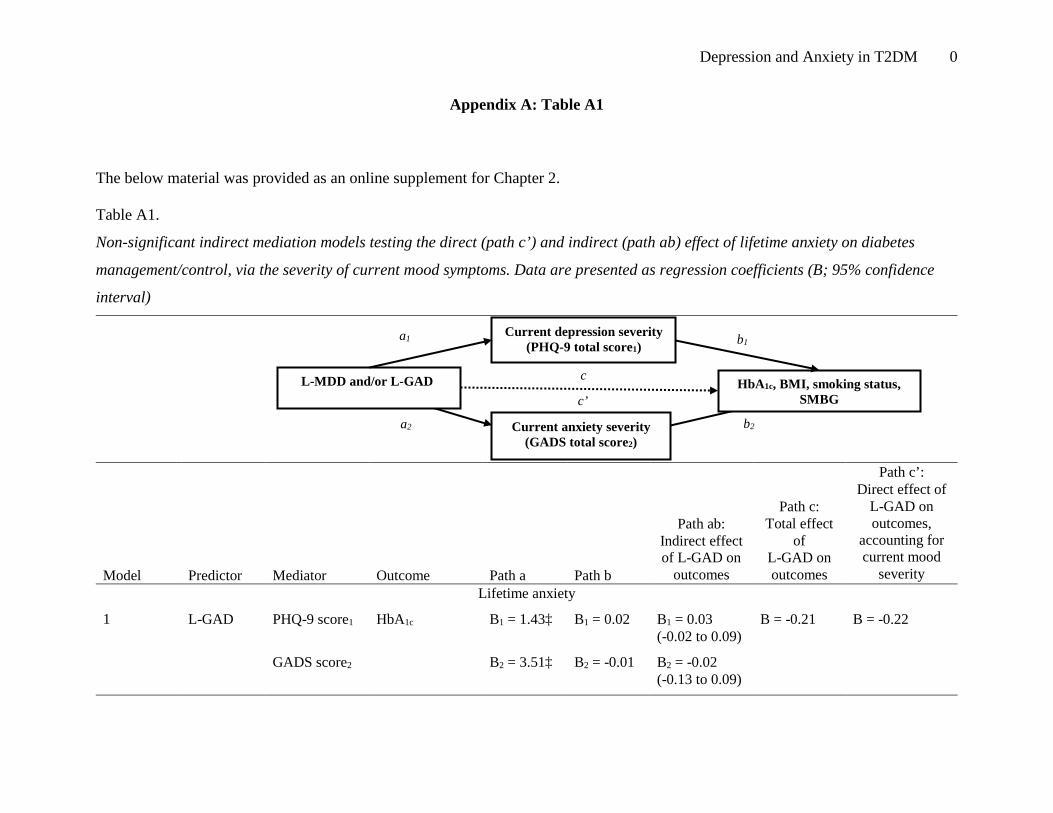
Depression and Anxiety in T2DM 0
Appendix A: Table A1
The below material was provided as an online supplement for Chapter 2.
Table A1.
Non-significant indirect mediation models testing the direct (path c’) and indirect (path ab) effect of lifetime anxiety on diabetes
management/control, via the severity of current mood symptoms. Data are presented as regression coefficients (B; 95% confidence
interval)
Model
Predictor
Mediator
Outcome
Path a
Path b
Path ab: Indirect effect of L-GAD on
outcomes
Path c: Total effect
of L-GAD on outcomes
Path c’: Direct effect of
L-GAD on outcomes,
accounting for current mood
severity Lifetime anxiety
1
L-GAD PHQ-9 score1 HbA1c B1 = 1.43‡ B1 = 0.02 B1 = 0.03 (-0.02 to 0.09)
B = -0.21 B = -0.22
GADS score2 B2 = 3.51‡ B2 = -0.01 B2 = -0.02 (-0.13 to 0.09)
c
a2
b2
c’
a1
b1 Current depression severity
(PHQ-9 total score1)
L-MDD and/or L-GAD HbA1c, BMI, smoking status, SMBG
Current anxiety severity (GADS total score2)
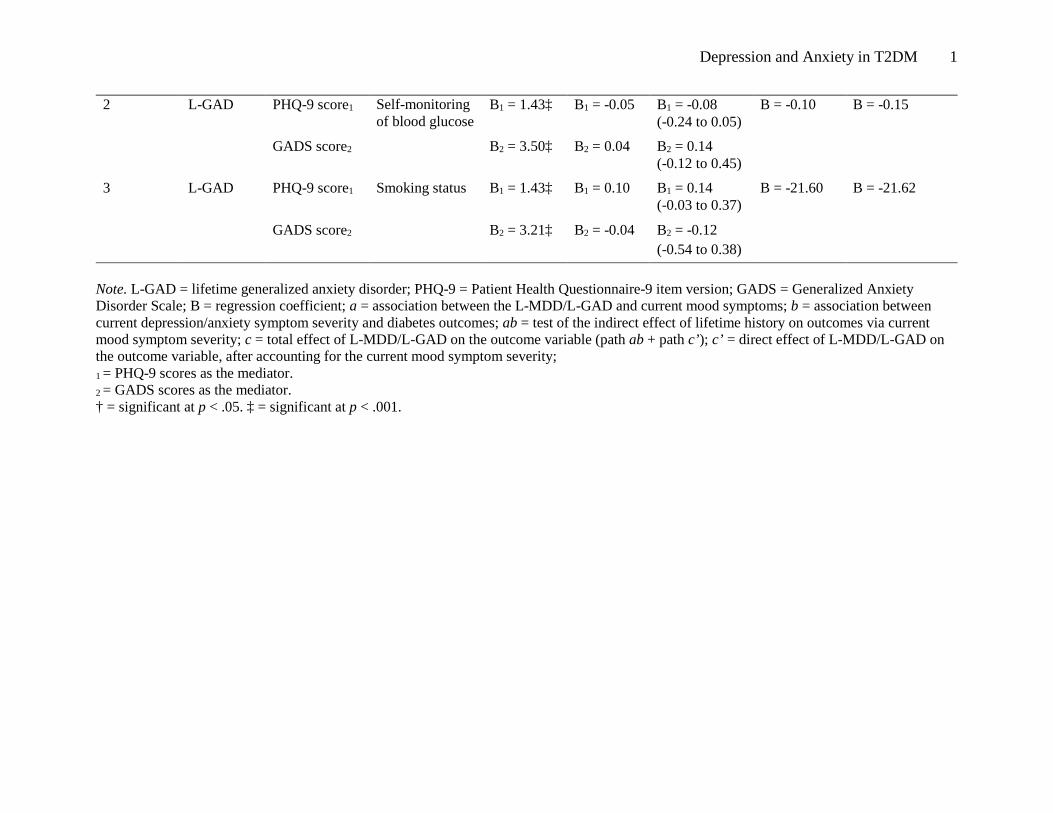
Depression and Anxiety in T2DM 1
2 L-GAD PHQ-9 score1 Self-monitoring of blood glucose
B1 = 1.43‡ B1 = -0.05 B1 = -0.08 (-0.24 to 0.05)
B = -0.10 B = -0.15
GADS score2 B2 = 3.50‡ B2 = 0.04 B2 = 0.14 (-0.12 to 0.45)
3 L-GAD PHQ-9 score1 Smoking status B1 = 1.43‡ B1 = 0.10 B1 = 0.14 (-0.03 to 0.37)
B = -21.60 B = -21.62
GADS score2 B2 = 3.21‡ B2 = -0.04 B2 = -0.12 (-0.54 to 0.38)
Note. L-GAD = lifetime generalized anxiety disorder; PHQ-9 = Patient Health Questionnaire-9 item version; GADS = Generalized Anxiety Disorder Scale; B = regression coefficient; a = association between the L-MDD/L-GAD and current mood symptoms; b = association between current depression/anxiety symptom severity and diabetes outcomes; ab = test of the indirect effect of lifetime history on outcomes via current mood symptom severity; c = total effect of L-MDD/L-GAD on the outcome variable (path ab + path c’); c’ = direct effect of L-MDD/L-GAD on the outcome variable, after accounting for the current mood symptom severity; 1 = PHQ-9 scores as the mediator. 2 = GADS scores as the mediator. † = significant at p < .05. ‡ = significant at p < .001.

Depression and Anxiety in T2DM 2
Appendix B: Table B1
The below material was provided as an online supplement for Chapter 4.
Table B1. Single growth curve model building for BMI, HbA1c, and self-monitoring of blood glucose at Year 0, 2 and 4 Model Diabetes-
management χ2 df p AIC Parsimony
ratio RMSEA (90% CI)
CFI TLI SRMR Growth parameter estimates Intercept Slope
Mean Var Mean Var Intercept only
BMI 22.44 4 <0.001 16370.82 0.28 0.06 (0.04-0.09)
0.99 0.99 0.06 31.38† 34.92† na na
Linear change*
BMI 1.80 1 0.18 16356.18 0.07 0.03 (0-0.09)
1.00 0.99 0.00 31.41† 35.07† -0.03 0.29†
Logarithmic change
BMI 2.90 1 0.09 16357.29 0.07 0.04 (0-0.10)
1.00 0.99 0.00 31.40† 35.89† -0.12 9.48†
Intercept only
HbA1c 17.88 4 <0.001 10040.88 0.27 0.05 (0.03-0.08)
0.99 0.99 0.06 7.17† 1.24† na na
Linear change
HbA1c 1.69 1 0.19 10030.68 0.07 0.02 (0-0.09)
0.99 0.99 0.01 7.14† 1.34† 0.02 0.04†
Logarithmic change*
HbA1c 0.79 1 0.38 10029.78 0.07 0 (0-0.07)
1.00 1.00 0.00 7.13† 1.47† 0.10 1.29†
Intercept only
Self-monitoring blood glucose
20.45 4 <0.001 22262.54 0.27 0.06 (0.04-0.09)
0.97 0.98 0.04 7.44† 35.74† na na
Linear change*
Self-monitoring blood glucose
1.03 1 0.31 22249.12 0.07 0.01 (0-0.08)
1.00 1.00 0.01 7.33† 40.69† 0.07 1.95†
Logarithmic change
Self-monitoring blood glucose
1.41 1 0.24 22249.50 0.07 0.02 (0-0.08)
0.99 0.99 0.01 7.36† 46.31† 0.27 63.70†
Note. AIC = Akaike Information Criterion (lower score = better fit); Parsimony ratio is defined as df / [.5k(k+1)] where k is the number of observed variables; RMSEA = Root Mean Square Error Of Approximation (<0.06 = good fit); CFI = Comparative Fit Index; TLI = Tucker Lewis Index (>0.95 = good fit); SRMR = Standard Root Mean Square Residual (<0.05 = good fit); * preferred model. † = p < 0.05.
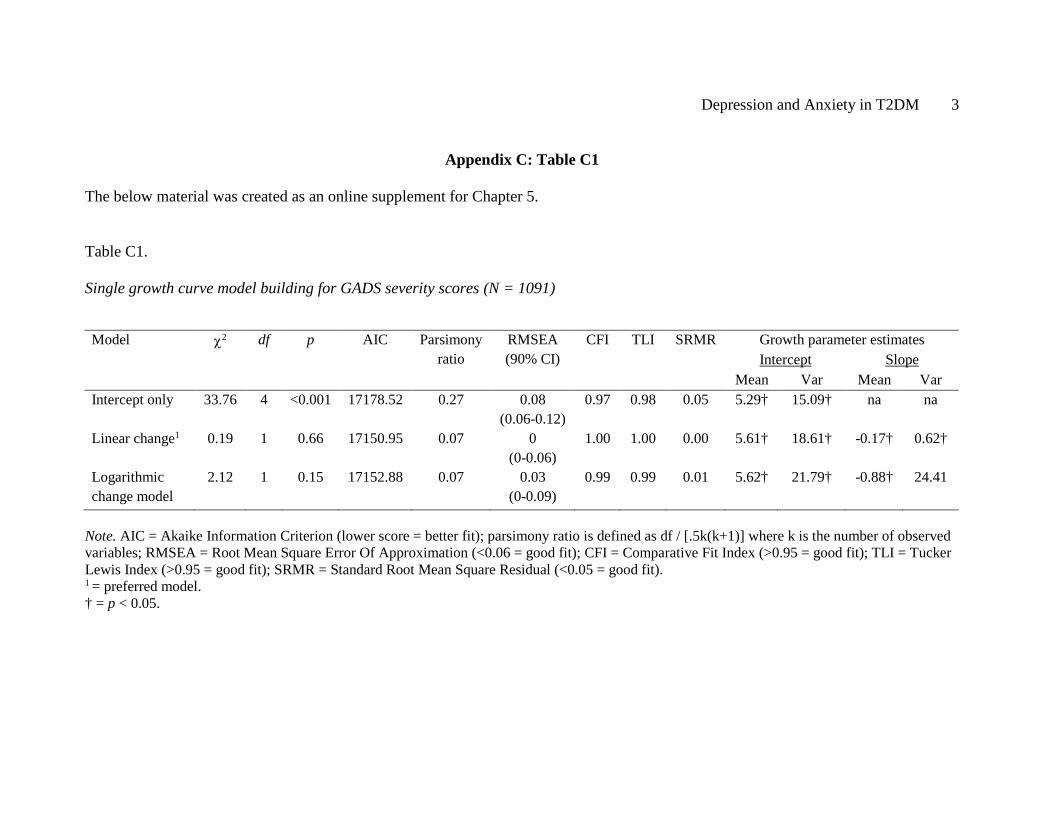
Depression and Anxiety in T2DM 3
Appendix C: Table C1
The below material was created as an online supplement for Chapter 5.
Table C1.
Single growth curve model building for GADS severity scores (N = 1091)
Note. AIC = Akaike Information Criterion (lower score = better fit); parsimony ratio is defined as df / [.5k(k+1)] where k is the number of observed variables; RMSEA = Root Mean Square Error Of Approximation (<0.06 = good fit); CFI = Comparative Fit Index (>0.95 = good fit); TLI = Tucker Lewis Index (>0.95 = good fit); SRMR = Standard Root Mean Square Residual (<0.05 = good fit). 1 = preferred model. † = p < 0.05.
Model χ2 df p AIC Parsimony ratio
RMSEA (90% CI)
CFI TLI SRMR Growth parameter estimates Intercept Slope
Mean Var Mean Var Intercept only 33.76 4 <0.001 17178.52 0.27 0.08
(0.06-0.12) 0.97 0.98 0.05 5.29† 15.09† na na
Linear change1 0.19 1 0.66 17150.95 0.07 0 (0-0.06)
1.00 1.00 0.00 5.61† 18.61† -0.17† 0.62†
Logarithmic change model
2.12 1 0.15 17152.88 0.07 0.03 (0-0.09)
0.99 0.99 0.01 5.62† 21.79† -0.88† 24.41
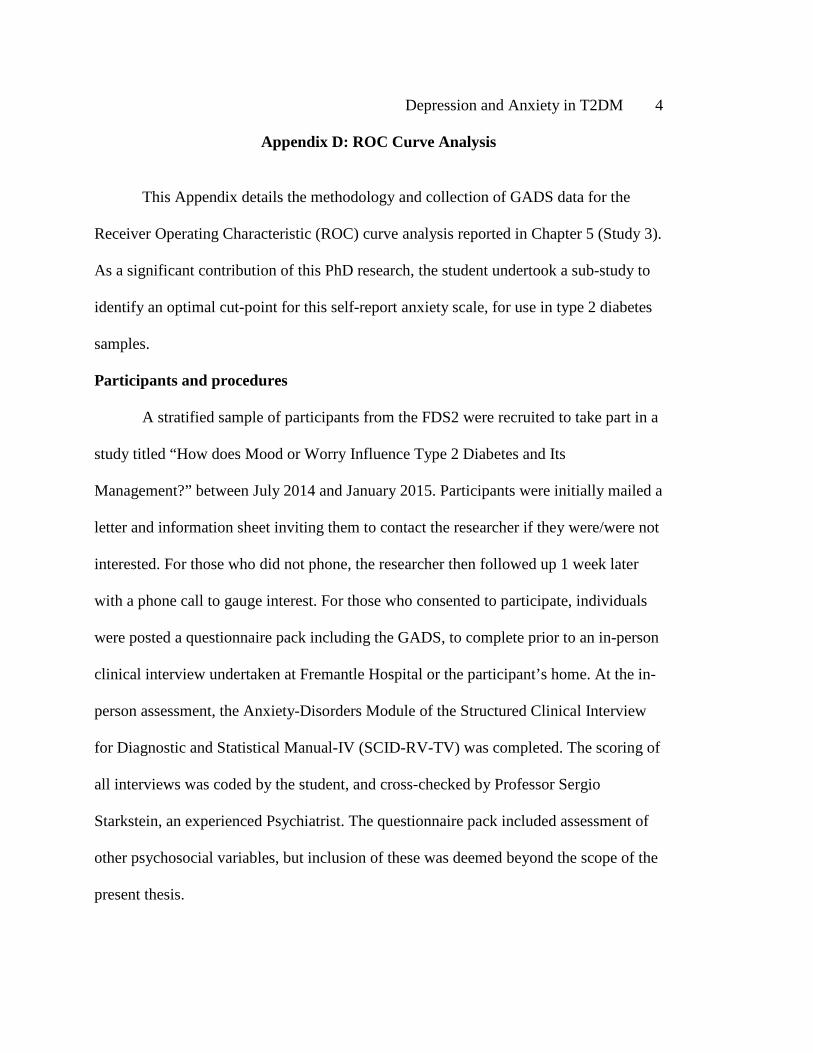
Depression and Anxiety in T2DM 4
Appendix D: ROC Curve Analysis
This Appendix details the methodology and collection of GADS data for the
Receiver Operating Characteristic (ROC) curve analysis reported in Chapter 5 (Study 3).
As a significant contribution of this PhD research, the student undertook a sub-study to
identify an optimal cut-point for this self-report anxiety scale, for use in type 2 diabetes
samples.
Participants and procedures
A stratified sample of participants from the FDS2 were recruited to take part in a
study titled “How does Mood or Worry Influence Type 2 Diabetes and Its
Management?” between July 2014 and January 2015. Participants were initially mailed a
letter and information sheet inviting them to contact the researcher if they were/were not
interested. For those who did not phone, the researcher then followed up 1 week later
with a phone call to gauge interest. For those who consented to participate, individuals
were posted a questionnaire pack including the GADS, to complete prior to an in-person
clinical interview undertaken at Fremantle Hospital or the participant’s home. At the in-
person assessment, the Anxiety-Disorders Module of the Structured Clinical Interview
for Diagnostic and Statistical Manual-IV (SCID-RV-TV) was completed. The scoring of
all interviews was coded by the student, and cross-checked by Professor Sergio
Starkstein, an experienced Psychiatrist. The questionnaire pack included assessment of
other psychosocial variables, but inclusion of these was deemed beyond the scope of the
present thesis.
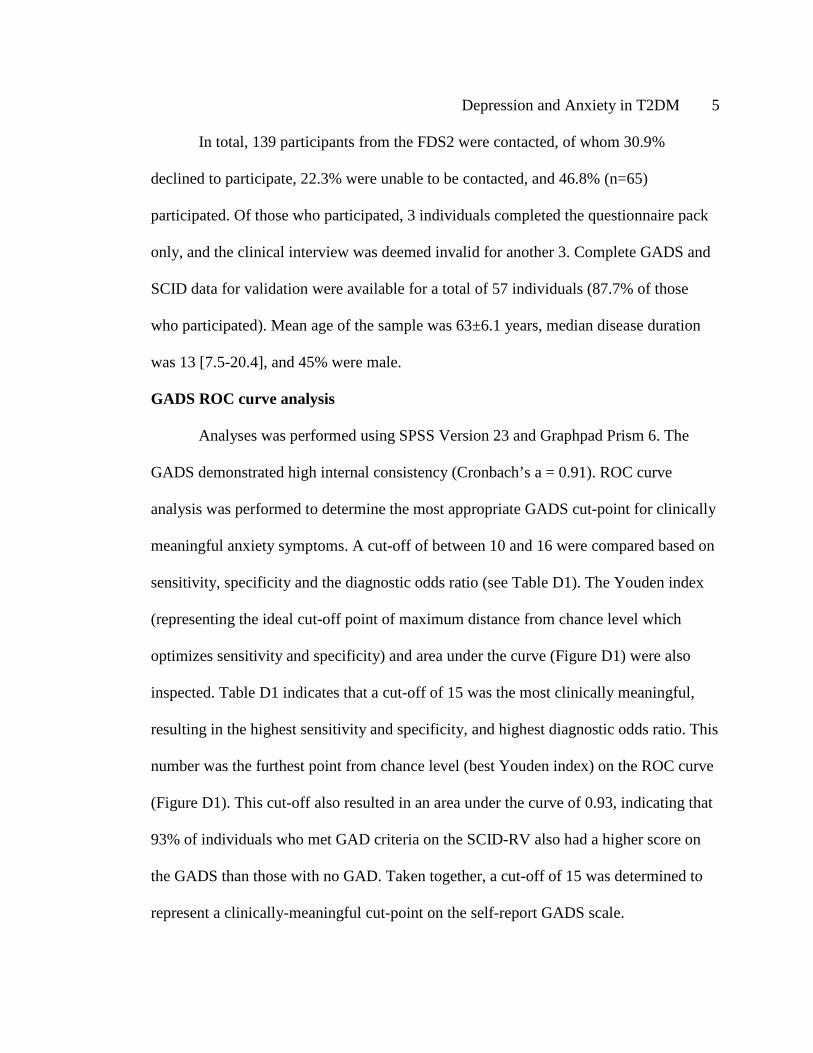
Depression and Anxiety in T2DM 5
In total, 139 participants from the FDS2 were contacted, of whom 30.9%
declined to participate, 22.3% were unable to be contacted, and 46.8% (n=65)
participated. Of those who participated, 3 individuals completed the questionnaire pack
only, and the clinical interview was deemed invalid for another 3. Complete GADS and
SCID data for validation were available for a total of 57 individuals (87.7% of those
who participated). Mean age of the sample was 63±6.1 years, median disease duration
was 13 [7.5-20.4], and 45% were male.
GADS ROC curve analysis
Analyses was performed using SPSS Version 23 and Graphpad Prism 6. The
GADS demonstrated high internal consistency (Cronbach’s a = 0.91). ROC curve
analysis was performed to determine the most appropriate GADS cut-point for clinically
meaningful anxiety symptoms. A cut-off of between 10 and 16 were compared based on
sensitivity, specificity and the diagnostic odds ratio (see Table D1). The Youden index
(representing the ideal cut-off point of maximum distance from chance level which
optimizes sensitivity and specificity) and area under the curve (Figure D1) were also
inspected. Table D1 indicates that a cut-off of 15 was the most clinically meaningful,
resulting in the highest sensitivity and specificity, and highest diagnostic odds ratio. This
number was the furthest point from chance level (best Youden index) on the ROC curve
(Figure D1). This cut-off also resulted in an area under the curve of 0.93, indicating that
93% of individuals who met GAD criteria on the SCID-RV also had a higher score on
the GADS than those with no GAD. Taken together, a cut-off of 15 was determined to
represent a clinically-meaningful cut-point on the self-report GADS scale.
Depression and Anxiety in T2DM 6
Table D1.
ROC Curve Analysis to determine the optimal GADS clinical cut-off score
Note. A value was not produced for a GADS cut-off of 14, and is subsequently not reported; GADS = Generalized Anxiety Disorder Scale; CI = Confidence Interval. *preferred clinical cut-off score.
GADS cut-off
score
Sensitivity (95% CI) Specificity (95% CI) Diagnostic odds ratio
10 83.3 (35.9-99.6) 78.4 (35.9-99.6%) 3.86
11 83.3 (35.9-99.6) 82.4 (69.1-91.6) 4.7
12 83.3 (35.9-99.6) 84.3 (71.4-93.0) 5.3
13 83.3 (35.9-99.6) 88.2 (76.1-95.6) 7.1
15* 83.3 (35.9-99.6) 92.2 (81.1-97.8) 10.6
16 50.0 (11.8-88.2) 94.1 (83.8-98.8) 8.5

Depression and Anxiety in T2DM 7
Figure D1. ROC curve produced to identify the optimal clinical cut-off on the GADS,
against the SCID-RV.
Depression and Anxiety in T2DM 8
Appendix E: Conference Presentations
International Congress of Behavioural Medicine Meeting, December 2016,
Melbourne, Australia. “Risk factors for, and course of, generalized anxiety symptoms in
type 2 diabetes assessed from 6-year anxiety trajectories using latent curve growth
analysis” (oral presentation).
International Congress of Behavioural Medicine Meeting, December 2016,
Melbourne, Australia. “Lifetime major depression affects self-efficacy and illness
perceptions in diabetes by increasing depression and distress” (oral presentation).
European Association for the Study of Diabetes Annual Meeting, September 2016,
Munich, Germany. “What is the course of depression symptoms in type 2 diabetes? Risk
factors and outcomes of 6-year depression trajectories using latent curve growth
analysis” (poster displayed by colleague).
8th World Congress of Behavioural and Cognitive Therapies Meeting, June 2016,
Melbourne, Australia. “History matters: lifetime depression and anxiety as risk factors
for prevalent psychological symptoms and inappropriate self-management in type 2
diabetes” (oral presentation).
Depression and Anxiety in T2DM 9
American Diabetes Association 76th Annual Congress, June 2016, New Orleans,
USA. “What is the course of depression symptoms in type 2 diabetes? Risk factors and
outcomes of 6-year depression trajectories using latent curve growth analysis” (late
breaking poster presentation).
International Diabetes Federation World Diabetes Congress, November 2015,
Vancouver, Canada. “Lifetime depression and anxiety: risk factors for symptom severity
and inappropriate self-management in type 2 diabetes” (poster displayed by colleague).
Australian Association of Cognitive Behaviour Therapy Annual Conference,
October 2013, Adelaide, Australia. “The impact of lifetime psychological difficulties on
the symptomatology of depression and anxiety in type 2 diabetes” (oral presentation).