depreciation systems in nepal: a comparison based on … · depreciation systems in nepal: a...
TRANSCRIPT
Depreciation Systems in Nepal: A Comparison Based on ETR
Dr. Puspa Raj Kandel
The administrator after the introduction of Income Tax Act, 2002 has claimed that the depreciation rule under the new law is more generous than the depreciation rule of 1992 in case of all the assets including machinery and building. The analysis made on the basis of ETR, however, shows no decrease in ETRs in 2002 in comparison to 1992. That means, the depreciation rule of 2002 in case of building and machinery is not generous as claimed by the tax policy maker. In opposite of this, the analysis proves that the depreciation provisions of 1992 and 2002 are more liberal than the depreciation provisions of earlier periods.
1. INTRODUCTION
Depreciation means decrease in the value of assets due to their use in production process or reduction in market value or obsolescence. The main purposes of depreciation are the replacement of assets, exact pricing of the product, prevent from consuming capital, reduction of tax liability directing investment towards intended area and providing source of finance. There are mainly two types of deprecations, namely, tax depreciation and economic depreciation. The amount of depreciation which is permitted to write off as expenditure by tax law is tax depreciation. It is tax depreciation because it reduces the amount of tax to be paid by the firm. As opposed to tax depreciation, economic depreciation is the decline in asset value due to aging and use in production process. In fact, it is the real change in the value of the fixed asset during the firms accounting period. Nepal exercised various rates of depreciation system prescribed by various Income Tax related acts and rules. After the introduction in 1962; it was changed in 1974, 1981, 1982, 1992 and 2002. After each reform, the administration used to claim that the depreciation provision brought was more generous than the previous one. After introducing the Income Tax Act, 2002 also; they boasted that depreciation system is made more liberal than the previous ones especially for industrial sector.
ECONOMIC REVIEW: OCCASIONAL PAPER
228
The main purpose of the study is to compare the effective tax burden under different provisions of depreciation for industrial sector and find out whether the claim of the administrator in regards to depreciation provision of Income Tax Act, 2002 is correct or not. The method of analysis is based on ETR technique7. For the purpose of comparing the depreciation system, the present value of depreciation, present value of tax saving and ETRs under different tax provisions for industrial sector during 1962 to 2002 are analysed. Because of the unavailability of data, the depreciation provision of 1974 is excluded from the study. From the study, it is known that the present provision of depreciation for industrial sector is not more beneficial than the previous one as claimed by the policy maker. The study is divided into 7 parts. The remaining parts of the article are Tax Depreciation System under different Tax Related Laws, Earlier Studies under ETR, Parameters and Methodology, Assumptions and Sources of Data, Analysis of Data and Conclusion.
2. TAX DEPRECIATION SYSTEM UNDER DIFFERENT TAX RELATED LAWS Nepal introduced depreciation system as a part of the Income Tax Act, 1962. The method of depreciation proposed by that Act was straight line method and the rate allowed were 10 percent for plant and machinery, 6 percent for building, 5 percent for furniture and 15 percent for vehicles. In 1974, Income Tax Act, 1974 was introduced and the depreciation rates were changed. By the introduction of Industrial Enterprise Act, 1981; the provision of depreciation given in Income Tax Act of previous years was also altered. According to the Industrial Enterprise Act, the permitted life span of the assets were 20 years for building, drainage and water distribution system; 5 years for vehicle, furniture and fixture; 10 years for all types of plant and machinery and 5 years for other assets. That means, the rate percent for calculating the depreciation as per the Industrial Enterprise Act, 1981 were 5 percent for building, drainage and water distribution system, 10 percent for plant and machinery, 20 percent for vehicle, furniture and fixture and 20 percent for other assets. To industries, an alternative to choose any one from the two methods of depreciation – straight line and diminishing balance – applying the same rate was allowed. In 1982, the depreciation rate was again changed by Income Tax Rules, 1982. The rate schedule of depreciation given by Income Tax Rules, 1982 is as presented in Appendix II of this article. As per the prescribed rule, the rate of depreciation for building used in industrial purpose varies from 2 percent to 4 percent specifying 4 percent for go down etc. and 2 percent for factory building. The rate of depreciation for machinery also varies from 10 percent to 20 percent specifying 10 percent for basic type of equipment.
7 The full form of ETR is Effective Tax Rate. ETR in this context is Marginal Effective Tax Rate.
Sometime, it is also called METR. ETR is the tax burden borne by a new investment project. It is the difference between gross of tax required rate of return to investor and net of tax return to saver.

In 1992, the rate schedule of depreciation given by Income Tax Rules 1982 was again changed by the first amendment in this rule. The rate schedule prescribed by this amendment is given in Appendix III. According to the Rule, the rate for building is basically 5 percent and the rate for machinery although varying from 10 to 20 percent is 15 percent for most of the type of machinery. Industries were allowed to choose either of the straight line or diminishing balance method of depreciation. Since the rates for diminishing balance method were almost triple of the rates for straight-line method, the former method was more generous than the latter one (Kandel, 2001). Income Tax Act, 2002 started from last fiscal year has classified depreciable into 5 groups –structure, office-related furniture and equipment, vehicles, other machinery equipment and intangible assets. The rate for these groups are 5 percent for building, 25 percent for office related materials, 20 percent for vehicles, 15 percent for machinery items and total cost divided by life for intangible assets.
3. EARLIER STUDIES UNDER ETR Theory of effective tax is related to the theory of the cost of capital developed by Jorgenson (1963). The developers of this theory were Auerbach and Jorgenon. They introduced ETR theory in 1980 in the debate over the US Economic Recovery Tax Act, 1981. They used this concept as a mean of comparing tax burden across different types of assets. After their study, this theory was used by various researchers like Boadway, Bruce and Mintz (1987), King and Fullerton (1984) and (1991); Jorgenson and Landau (1993); Mintz and Tsipoulas (1993), Mintz (1996), Mckenzie and Mintz (1994); Mintz (1990); Mintz and Tsipoulas (1995) etc. In Nepal this theory is used by Maxwell Stamp (1990), Kandel (2000). The methodology of evaluating the tax systems in all these researches was the comparison of effective tax burden calculated through marginal ETR technique. In Kandel (2000) and (2001), the effects of depreciation on ETRs are presented.
4. PARAMETERS AND METHODOLOGY Computation of ETR needs various parameters like inflation rate, interest rate, interest tax rate, physical depreciation rate, tax depreciation rate, return on equity rate, debt equity ratio, dividend tax rate, capital gain tax rate, investment allowance rate, new issue to retained earning rate and so forth. Besides, there can be numerous ETRs based on different assumptions. That is why this analysis is limited within the estimate of ETR for building and machinery. These two assets are selected because as per the Central Bureau of Statistics Data, machinery and equipment cover 40 percent and structure or building covers 22 percent of the total fixed assets. That means of the total depreciable assets, machinery covers 56 percent where as building covers 31 percent. The tax depreciation rates used in the calculation are as given by the Income Tax Act, 1962; Industrial Enterprise Act, 1981; Income Tax Rules, 1982; Industrial Enterprise Act, 1992 and Income Tax Act, 2002. Straight-line method of depreciation is assumed for the period before

ECONOMIC REVIEW: OCCASIONAL PAPER
230
1992 and diminishing balance methods of depreciation are assumed for the period after 1992. The service life of the asset used for tax depreciation purpose under straight-line method is determined by dividing 100% by the depreciation rate. The tax rates are given in terms of the percentage of gross of tax required rate of return to investor. The industries covered for analysis are non-holiday tax paying ordinary industry under two sources of finance - debt and equity. For the purpose of calculating ETRs, economic depreciation rate is very necessary. But neither in Nepal nor in any other neighbouring countries; such economic or actual depreciation rate is measured. So, for the purpose of this study, the economic depreciation rate developed by Hulten and Wykoff (1981) is used. According to them, the economic depreciation rate for building and machinery were 3.07 percent and 13.33 percent respectively. The other variables like interest rate, interest tax rate, dividend tax rate, corporate tax rate and capital gain tax rate are the actual prevailing rate of the concerned years. Inflation rate were assumed as zero percent, 5 percent and 9 percent. The rate of 9 percent is the average of the inflation rate of all the years after 1974. The procedures followed in analysis are as discussed in methodology part given in Appendix I. Some of the parameters used for analysis are as given in Table 1 and 2 below: Table 1. Parameters for Analysis
Year Interest Interest Dividend Corporate Inflation Cap. Gain Rate Tax Rate Tax Rate Tax Rate Rate T. Rate
1962 15 .0 0 .25 0,.05,.09 0 1981 13 .05 0 .55 0,.05,.09 0 1982 14 .05 0 .50 0,.05,.09 0 1992 17 .05 0 .25 0,.05,.09 0 2002 12 .06 .05 .20 0,.05,.09 .10
Source: Compiled from different sources. Table 2. Rates of Depreciation and Service Lives 1962 1981 1982 1992 2002
Economic Depreciation Rate Building 3.7 3.7 3.7 3.7 3.7 Plant and Machinery 13.3 13.3 13.3 13.3 13.3
Tax Depreciation Rate Building .06 .05 .02 .067 .067 Plant and Machinery .10 .10 .10 .20 .20 Service Life Years (Building) 16.67 20 50 - - Service Life Years (Machinery) 10 10 10 - - Source: Compiled from different sources. Note: Depreciation rates for 1962, 1981 and 1982 are under straight-line method.
5. ASSUMPTIONS AND SOURCES OF DATA As stated earlier, calculation of ETR requires various information and assumptions. In this study, the assumptions are operation of the firm under neoclassical theory of investment, consideration of corporate and personal tax, Nepalese economy as a small open economy, profitable firm etc. For this study, the sources of data are Finance Acts, Quarterly Economic Bulletin of Nepal Rastra Bank, Nepal Stock Exchange Ltd., Central Bureau of Statistics, Industrial Enterprise Acts, Income Tax Acts and Rules of various years etc.
6. ANALYSIS OF THE DATA
A. Present Value of Depreciation As we know, depreciation is the reduction in assets value due to wear and tear or effluxion of time or obsolescence. For depreciation, the business houses use to deduct certain percentage of the cost of assets each year generally at the rate given in income tax act. Such reduction of cost within the span of time by a rate could not cover the whole amount of original cost if considered in real value. As we know, the value of money goes to be decreased each year due to the inflation. Because of this decrease in real value of money each year, the depreciation covers only a certain percentage of the original cost. The magnitude of coverage rests basically on the rate of depreciation in initial years of the life of the asset and the discount factor, i.e., cost of capital. Within diminishing balance and straight line methods of depreciation; straight line method is faster than the diminishing balance method if the rate of depreciation is same. However, if the rate of diminishing balance is higher than the double of the rate of depreciation rate under straight line method, the former method is faster than the latter one. The reason is that the diminishing balance method uses to have higher amount of depreciation in initial years of its service life. In the same way, within different sources of finance; the debt finance uses to have higher present value due to lower cost of capital in comparison to equity finance. Table 3 shows the present value of depreciation of both the assets - building and machinery. As per the Table, it is known that the present value is higher under full debt finance in comparison to full equity finance in case of both the assets. While comparing the present value of depreciation of different years, it is seen that in case of building, it is lowest in 1982 provision when it is 30 percent of cost under debt finance and 12 percent of cost under equity finance. The reason of being this is the decrease in depreciation rate in 1982 provision in comparison to previous and subsequent years. In case of machinery, the present value of depreciation is lowest in 1962 system when it is 58 percent under debt finance and 44 percent under equity finance. The Table shows that the present value of depreciation in 2002 system is more than the same in 1992 and previous years, system. For example, in 2002 provision for building; it is 42 percent under debt finance and 31

ECONOMIC REVIEW: OCCASIONAL PAPER
232
percent under equity finance where as the same for machinery are 67 percent under equity finance and 57 percent under debt finance. All these present values are greater than the present value of depreciation of previous years in all the cases except the present value of depreciation of machinery in 1981 and 1982 laws under debt finance. This indicates that the depreciation rate under 2002 provision is to some extent liberal in comparison to previous depreciation rates. However, it can not be claimed accurately that the latter provision is more advantageous to industrial sector than the previous one because it is the tax factor that is to be considered not the present value of depreciation.
Table 3. Present Value of Depreciation under Different Interest Rates (In Percentage of Costs of Assets)
Sources of Finance Year Assets Debt Finance Equity Finance
1962 Building Machinery
44 58
30 44
1981 Building Machinery
55 72
29 48
1982 Building Machinery
30 73
12 46
1992 Building Machinery
35 61
25 50
2002 Building Machinery
42 67
31 57
Source : Calculated
B. Tax Saving from Depreciation The depreciation has different purposes. One among them is reducing the tax burden of a taxpayer. Since depreciation is a deductible expense before deriving the taxable income, it saves the tax of a taxpayer. The amount of tax saving depends on the rate of depreciation and the rate of tax. The higher are the rate of depreciation and the rate of tax, the higher is the amount of tax saved. From Table 4, it is seen that the tax saving in case of machinery is higher than the tax saving in case of building in all the years. It means that the depreciation rate for machinery is higher than the depreciation rate for building. Across different sources of finance; the tax saving under debt finance is higher than the tax saving under equity finance. The main reason of this difference is the deductibility of interest from the income before paying the tax. From the Table 4, it is also found that the highest percentage of tax saving are under the provision of 1981 and 1982 and lowest percentage of tax saving are under the provision of 1962, 1992 and 2002. The main reason of being highest percent of tax saving in the provision of 1981 and 1982 is the high tax rates of that period i.e., 55 percent and 50 percent under the provision of 1981 and 1982 respectively. Conversely, the
reason of being lowest percentage of tax saving in 1962, 1992 and 2002 rules is the lower rate of tax in these years i.e., 25 percent in 1962 provision and 20 percent in 1992 and 2002 provisions. Table 4 shows that the present value of tax saving only can not measure the generosity of the depreciation system because it is higher in most of the earlier provisions than in 2002 provision. So, from the analysis of tax saving, it cannot be concluded that the depreciation provisions provided by Income Tax Act, 2002 is more liberal than the provisions of previous years. Table 4. Tax saving under different Interest Rates
Sources of Finance Year Assets Debt Finance Equity Finance
1962 Building Machinery
11 15
8 11
1981 Building Machinery
28 36
15 24
1982 Building Machinery
16 40
7 25
1992 Building Machinery
9 15
6 13
2002 Building Machinery
8 14
6 11
Source: Calculated
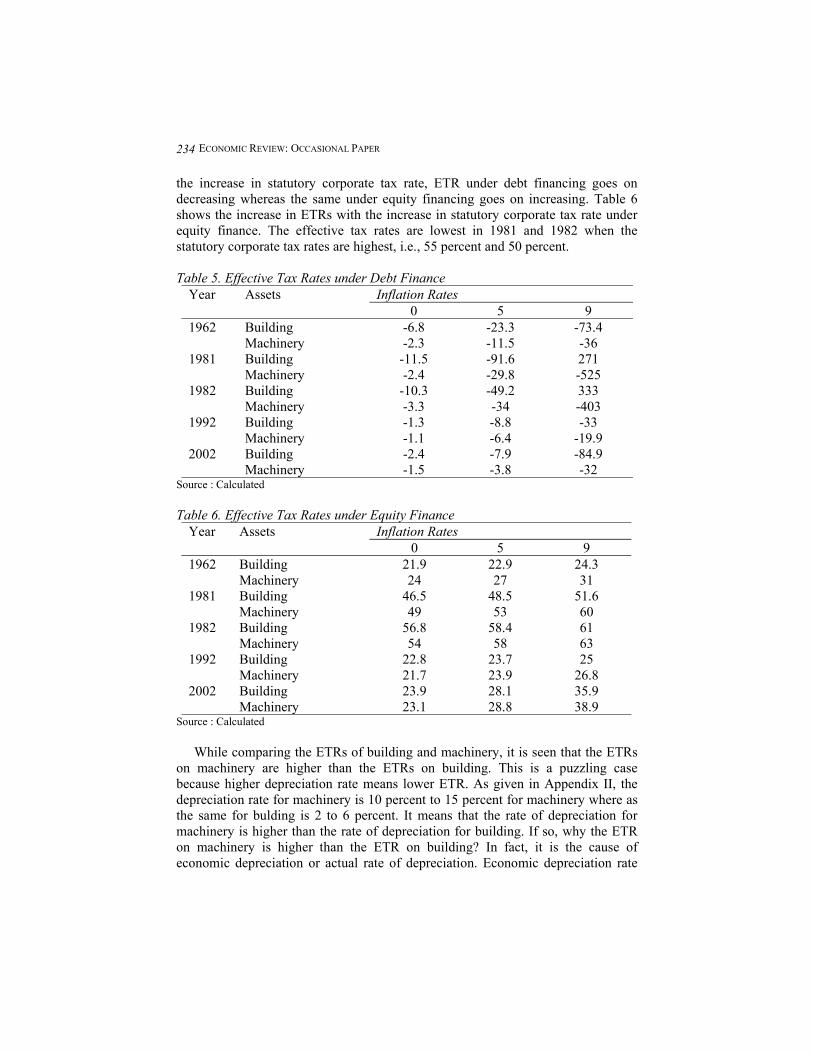
C. Effective Tax Rates for Different Years Effective tax rate (ETR) is the difference between gross of tax required rate of return to the investor and net of tax rate of return to the saver. In other words, ETR is the combined rate of tax paid to the government by the investor and saver. It covers both the corporate tax paid by the investor and dividend and capital gain tax paid by the saver. ETR is affected by different variables like inflation rate, interest rate, tax depreciation rate, economic depreciation rate, debt equity ratio etc. However, it is mostly dependent on the magnitude of tax rate. The ETR becomes higher with the increase in statutory tax rate if other variables like inflation rate, interest rate, depreciation rate, source of financing etc. remain constant. Besides tax rate, the second main variable which affects the ETR is the tax depreciation rate allowed by the law. Table 5, and 6 show the ETRs under different sources of financing considering depreciation. From the Tables, it is known that there is difference between the ETR under debt finance and ETR under equity finance. ETR under debt finance is lower than the ETR under equity finance. The reason of this is the deductibility of interest as expense but not the capital gain and dividend from the income. The other thing that can be seen from the Table is that inflation hits the ETR very highly. The inflation reduces the tax rate with its increase if the source of finance is debt. Instead, if the source of finance is equity capital; ETR goes on increasing with the increase in inflation rates. Accordingly, it can also be seen from the Table that with
ECONOMIC REVIEW: OCCASIONAL PAPER
234
the increase in statutory corporate tax rate, ETR under debt financing goes on decreasing whereas the same under equity financing goes on increasing. Table 6 shows the increase in ETRs with the increase in statutory corporate tax rate under equity finance. The effective tax rates are lowest in 1981 and 1982 when the statutory corporate tax rates are highest, i.e., 55 percent and 50 percent. Table 5. Effective Tax Rates under Debt Finance
Inflation Rates Year Assets 0 5 9
1962 Building Machinery
-6.8 -2.3
-23.3 -11.5
-73.4 -36
1981 Building Machinery
-11.5 -2.4
-91.6 -29.8
271 -525
1982 Building Machinery
-10.3 -3.3
-49.2 -34
333 -403
1992 Building Machinery
-1.3 -1.1
-8.8 -6.4
-33 -19.9
2002 Building Machinery
-2.4 -1.5
-7.9 -3.8
-84.9 -32
Source : Calculated Table 6. Effective Tax Rates under Equity Finance
Inflation Rates Year Assets 0 5 9
1962 Building Machinery
21.9 24
22.9 27
24.3 31
1981 Building Machinery
46.5 49
48.5 53
51.6 60
1982 Building Machinery
56.8 54
58.4 58
61 63
1992 Building Machinery
22.8 21.7
23.7 23.9
25 26.8
2002 Building Machinery
23.9 23.1
28.1 28.8
35.9 38.9
Source : Calculated While comparing the ETRs of building and machinery, it is seen that the ETRs on machinery are higher than the ETRs on building. This is a puzzling case because higher depreciation rate means lower ETR. As given in Appendix II, the depreciation rate for machinery is 10 percent to 15 percent for machinery where as the same for bulding is 2 to 6 percent. It means that the rate of depreciation for machinery is higher than the rate of depreciation for building. If so, why the ETR on machinery is higher than the ETR on building? In fact, it is the cause of economic depreciation or actual rate of depreciation. Economic depreciation rate
has great impact on ETR causing it higher if the economic depreciation rate is greater than the tax depreciation rate. Instead, if the tax depreciation rate is higher than the economic depreciation rate, it causes lowered ETRs. In our case, the economic depreciation rate for building is 3.07 percent which is lower than the tax depreciation rate of mostly 5 or 6 percent except in 1982 system when it is 2 percent. In contrast to this, economic depreciation rate of machinery is 13.3 percent which is higher than the tax depreciation rate of generally 10 percent except in 1992 and 2002 systems. In 1992 and 2002 systems also the magnitude of difference between economic depreciation rate and tax depreciation rate are higher in case of building than in case of machinery being economic depreciation rate 13.33 and tax depreciation rate 15 percent for machinery and economic depreciation rate 3.07 and tax depreciation rate 5 percent in case of building. All these mean that if there had been the tax depreciation rate higher than the economic depreciation rate in case of machinery, the ETRs on machinery would have been lower than the ETRs on building. While comparing the ETRs of 2002 with previous years' provisions, it is known that the highest taxed years are after 1981 and before 1992. The reason of this higher ETRs may be higher corporate tax rates not the lower depreciation rates. In comparing the ETRs under 1992 and 2002 provisions, one can observe that the effective tax rates of the latter year is increased to some extent. The reason of this increase is also not the depreciation rate but the imposition of capital gain and dividend tax in this year. Thus the analysis shows that the ETRs under the assumed variables as given above cannot say whether the ETR is increased or decreased due to depreciation rule change. In other words, it cannot prove whether the new depreciation provision is liberal or conservative in comparison to old provision.
D. Simulation with changed Variables Effective tax rate is not the function of tax and economic depreciation rate only. Rather it is also affected by various factors like interest rate, inflation rate, rates of different types of taxes, debt equity ratio etc. Due to the combined effect of different types of variables in above discussion, the exact impact of depreciation on ETR and the difference in impact of the depreciation provisions brought in different financial years are presented below. The assumptions for the new case are no inflation, 12 percent interest rate, 20 percent corporate tax rate, 5 percent dividend tax rate, 10 percent capital gain tax rate and 6 percent interest tax rate for all the cases. The main purpose of these assumptions is to neutralize the effect of these variables using the same in all the cases. The results of the simulation exercise are presented in Table 7 and 8.

ECONOMIC REVIEW: OCCASIONAL PAPER
236
Table 7. Present Value of Depreciation assuming the same Variables in all the Years (In Percentage of Costs of Assets)
Sources of Finance Year Assets Debt Finance Equity Finance
1962 Building Machinery
48 63
35 50
1981 Building Machinery
44 63
31 50
1982 Building Machinery
21 63
13 50
1992 Building Machinery
41 68
31 57
2002 Building Machinery
41 68
31 57
Source: Calculated Table 7 shows the present value of depreciation under the above assumptions. Interest and tax rates in this simulation case are assumed as similar to the rates which were used in earlier case. Only depreciation and source of finance are assumed to be different in this case. As per the Table, it is seen that the present value of depreciation is highest under 1992 and 2002 provisions when they are 68 percent for building and 41 percent for machinery under debt finance and 31 percent for building and 57 percent for machinery under equity finance. It means, in these years, the depreciation rates are made more liberals than in previous years. Furthermore, contrary to this situation, the present value of depreciation is not much different in 2002 provision in comparison to 1992 provision, there is no such significant evident which shows the depreciation provision of 2002 is more liberal than the depreciation in 1992 provisions. Table 8. ETR under different Sources of Finance with 0 Inflation Rate
Sources of Finance Year Assets Debt Finance Equity Finance
1962 Building Machinery
.3 4
23 25
1981 Building Machinery
1.7 4
24 25
1982 Building Machinery
7.8 4
27 25
1992 Building Machinery
2.4 1.5
24 23
2002 Building Machinery
2.4 1.5
24 23
Source: Calculated
Under the above assumption, the ETR is also derived to measure the generosity of depreciation in 2002 rules related to depreciation. The result obtained in such way is presented in Table 8. As per the Table, it is known that under both the sources of finance, ETR on machinery is more or less similar. There is not much variation in ETRs. It is up to 3-percentage point only. For example, under debt finance, minimum rate of ETR in 1962 provision is 1.5 percent and maximum rate of ETR is 4 percent. However, the ETR in 1992 and 2002 rules, i.e., 1.5 percent are smaller than the ETRs of 1962, 1981 and 1982 rules, i.e., 4 percent. This means the ETR in latter years are decreased. Since all variables used in the simulation case are same, the difference in ETR is the result of increase in depreciation rate. Under equity finance case too, this decrease can be seen. However, in case of building that is not the case. The ETR in 1982 case is greater than the ETRs of other years under both the sources of finance. Except in 1982 provision, the ETRs of other years are more or less similar. There is only the variation of up to 2.5 percent under both the sources of finance. This means the decrease in depreciation rate of building under1982 to 2 percent from 5 percent under 1981 have negatively affected the ETRs. But this is not the case for 1992 and 2002 provisions. There is decrease in the rate of ETRs in 1992 and 2002 depreciation rules in comparison to the ETRs in 1962 rules. It shows that the rates of depreciation of building and machinery have been increased during 1992 and 2002. However, this analysis too does not show that the depreciation provision of 2002 is more generous than the depreciation provision of 1992 for either of the assets under either of the sources of financing.
7. CONCLUSION OF THE STUDY It is claimed by the government that the Income Tax Act, 2002 has made the depreciation provision more liberal than in 1992 for both the assets - building and machinery. The present analysis of both the provisions based on ETR compares the present value of depreciation, tax saving through depreciation and ETR under different assumptions and concludes that the depreciation provision of 2002 is not much liberal in comparison to 1992 for both the assets. They are more or less same. It means, the claim of tax administrator that the depreciation provision of 2002 is more beneficial than the depreciation provision of 1992 is not true. Instead, they are more or less the same if the variables other than the depreciation itself are assumed same to analyse the data. If the analysis is made on the basis of the actual variables of 1992 and 2002 including capital gain tax and dividend tax, it is seen that the ETRs are increased. In other words, if capital gain tax and dividend tax are considered, the ETRs are increased in 2002 in comparison to 1992. That means the depreciation provision of 2002 has not reduced ETRs. Rather, it is increased due to dividend and capital gain tax.

ECONOMIC REVIEW: OCCASIONAL PAPER
238
APPENDIX I Computation of ETR needs two variables named gross of tax required rate of return or before tax income to investor 'rg
', and net of tax rate of return to saver the saver 'rn
'. Furthermore, gross of tax rate of return to investor in turn needs real cost of finance rf, tax depreciation rate 'α', present value of tax depreciation' z', economic depreciation rate 'δ' etc. The following are the technique and procedure used for deriving the ETRs in the study.
a. Computing Real Cost of Finance There may be three sources of finance that can be used for generating resources to purchase the capital asset. By name, these sources are – full debt, full equity and a mix of debt and equity. Equity source itself can be bifurcated into two parts– share issues and retained earnings. Across these sources, the debt financing has certain advantages over others due to deductibility of its cost i.e., interest, while calculating taxable profit. Because of the deductibility of interest, the cost of debt financing becomes to some extent less than the cost of other sources of financing. The real cost of debt, denoted by ‘rb’ is given by rb = i (1 – u) – π (1) Where, i = interest rate, u = corporate tax rate and π = inflation rate. In this equation, i (1 – u) means tax adjusted interest rate. Inflation is deducted to find out real value instead of nominal one. Similarly, the real cost of equity is denoted by 're' = ρ- π (2) Where, ‘ρ’ means rate of return in the form of dividend to new equity holders and both the capital gain and dividend to old equity holders. In case of mix finance, the real cost finance is the weighted average cost of debt and equity denoted by 'rf' that is, real cost of finance and is given by rf = βi (1 – u) ρ – π (3) Where, β = fraction of finance raised through debt.
b. Treatment of Depreciation By using the following formula, one can calculate the present value of from depreciation under diminishing balance method as given below:
Pv of depreciation = )(
''απ
α++fr
(4a)
Present value of depreciation under straight-line method is as given below:
Pv of depreciation =
++
−+ )1(
11)(
''11 ππ
αrr
(4b)

where, Pv = present value, and 'α'= tax depreciation rate. Multiplying by the tax rate ‘u’ to present value of depreciation, the tax saving denoted by ‘z’ through tax depreciation 'α' can be derived.
c. Required Rate of Return to Investor ‘rg’ The user cost of capital (cost of financing, economic depreciation and the tax paid to government) includes real cost of finance, economic depreciation and tax paid to the government. In this sense, the per period user cost of capital except tax saving becomes (1 – z) (rf + δ). It is also mentioned that for a marginal investment the total revenue becomes equal to its cost. If the economic depreciation is deducted from this user cost of capital, there remains the gross of tax rate of return to the investor ‘rg’.
That is rg =u
zrg−
−+1
)1)(( δ- δ (5)
For a non-depreciable asset, neither the economic nor the tax depreciation is applicable. It means, rg = rf /(1-u) (6) A part of this return ‘rg’ goes to saver as a return from saving denoted by ‘rn’ and other part goes to tax authorities as tax denoted by ‘t’.
d. Required Rate of Return to Saver ‘rn’ Now proceed to find out the net rate of return ‘rn’ which really goes to the saver of the economy. Here, it is assumed that marginal rupee saved does not go into special tax sheltering assets and the intermediaries do not make monopoly profit. The rate of return to the saver or ‘rn’ is the sum total of two types of returns to savers - earning from debt ‘rn
b’ and earning from equity ‘rne’. Here, the ‘rn
b’ can be calculated as follows: rn
b = i (1-m) - π (7) Where, ‘m’ is the personal tax rate. In case of equity, the after tax rate of return to saver depends on whether the financing comes from retained earnings or new issues. If there is no dividend taxation, net of tax rate of return to saver ‘rn
e’ simply becomes ρ–π, where ‘ρ’ denotes capital gain in case of retained earning and dividend in case of new issues. Thus, in case of dividend and no capital gain tax assumption, the weighted average ‘rn’ becomes, rn = βi (1 – m) + (1 – β) ρ – π (8) If there is dividend and capital gain tax, the formula becomes, rn = β i (1 – m) + (1 – β) [a ρ (1 – θ) + (1 – a) ρ (1 – c)] – π (9) Where 'a' means ratio of new issue to retained earnings, 'θ' rate of dividend taxation and 'c' capital gain tax rate.
e. ETR
ECONOMIC REVIEW: OCCASIONAL PAPER
240
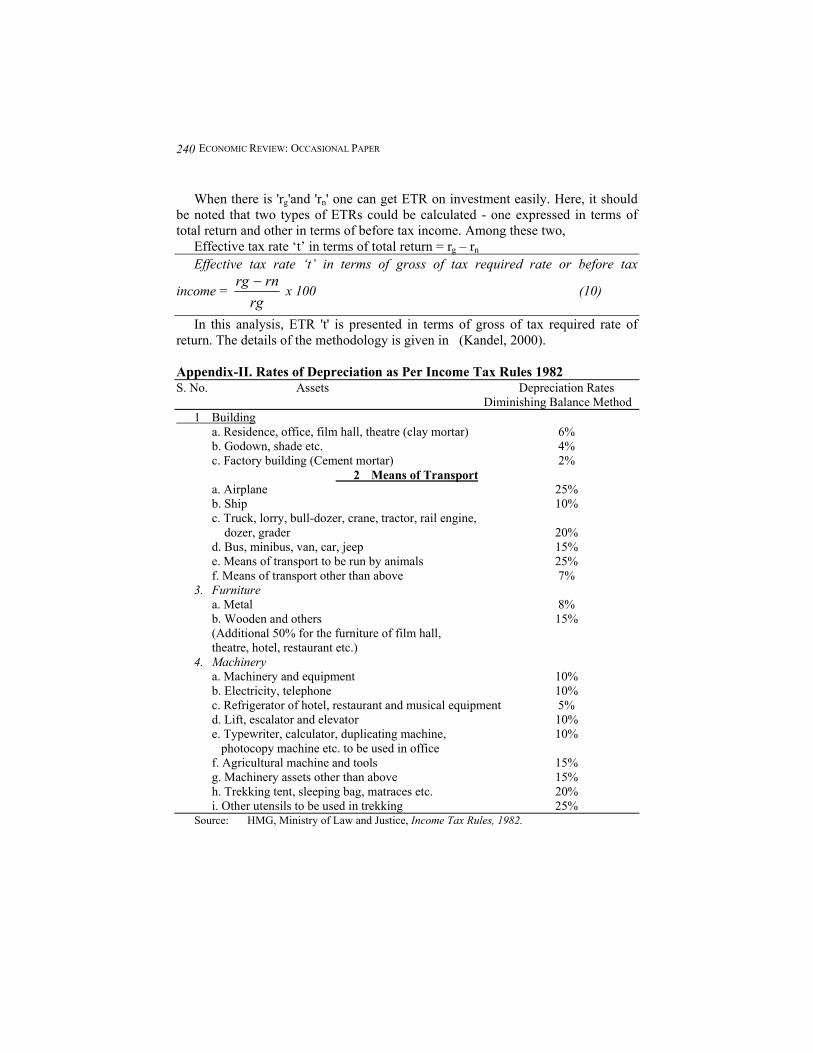
When there is 'rg'and 'rn' one can get ETR on investment easily. Here, it should be noted that two types of ETRs could be calculated - one expressed in terms of total return and other in terms of before tax income. Among these two, Effective tax rate ‘t’ in terms of total return = rg – rn Effective tax rate ‘t’ in terms of gross of tax required rate or before tax
income = rg
rnrg − x 100 (10)
In this analysis, ETR 't' is presented in terms of gross of tax required rate of return. The details of the methodology is given in (Kandel, 2000). Appendix-II. Rates of Depreciation as Per Income Tax Rules 1982 S. No. Assets Depreciation Rates Diminishing Balance Method 1 Building a. Residence, office, film hall, theatre (clay mortar) 6% b. Godown, shade etc. 4% c. Factory building (Cement mortar) 2%
2 Means of Transport a. Airplane 25% b. Ship 10% c. Truck, lorry, bull-dozer, crane, tractor, rail engine, dozer, grader 20% d. Bus, minibus, van, car, jeep 15% e. Means of transport to be run by animals 25% f. Means of transport other than above 7% 3. Furniture a. Metal 8% b. Wooden and others 15% (Additional 50% for the furniture of film hall, theatre, hotel, restaurant etc.) 4. Machinery a. Machinery and equipment 10% b. Electricity, telephone 10% c. Refrigerator of hotel, restaurant and musical equipment 5% d. Lift, escalator and elevator 10% e. Typewriter, calculator, duplicating machine, 10% photocopy machine etc. to be used in office f. Agricultural machine and tools 15% g. Machinery assets other than above 15% h. Trekking tent, sleeping bag, matraces etc. 20% i. Other utensils to be used in trekking 25%
Source: HMG, Ministry of Law and Justice, Income Tax Rules, 1982.
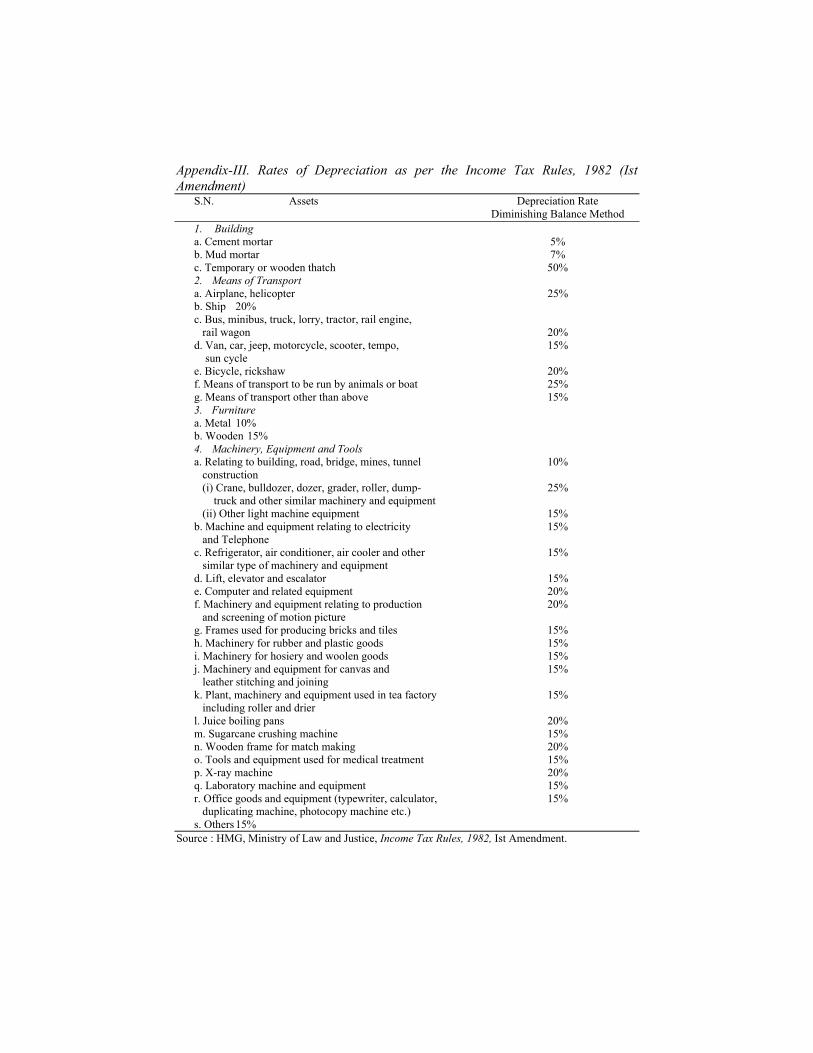
Appendix-III. Rates of Depreciation as per the Income Tax Rules, 1982 (Ist Amendment) S.N. Assets Depreciation Rate Diminishing Balance Method 1. Building a. Cement mortar 5% b. Mud mortar 7% c. Temporary or wooden thatch 50% 2. Means of Transport a. Airplane, helicopter 25% b. Ship 20% c. Bus, minibus, truck, lorry, tractor, rail engine, rail wagon 20% d. Van, car, jeep, motorcycle, scooter, tempo, 15% sun cycle e. Bicycle, rickshaw 20% f. Means of transport to be run by animals or boat 25% g. Means of transport other than above 15% 3. Furniture a. Metal 10% b. Wooden 15% 4. Machinery, Equipment and Tools a. Relating to building, road, bridge, mines, tunnel 10% construction (i) Crane, bulldozer, dozer, grader, roller, dump- 25% truck and other similar machinery and equipment (ii) Other light machine equipment 15% b. Machine and equipment relating to electricity 15% and Telephone c. Refrigerator, air conditioner, air cooler and other 15% similar type of machinery and equipment d. Lift, elevator and escalator 15% e. Computer and related equipment 20% f. Machinery and equipment relating to production 20% and screening of motion picture g. Frames used for producing bricks and tiles 15% h. Machinery for rubber and plastic goods 15% i. Machinery for hosiery and woolen goods 15% j. Machinery and equipment for canvas and 15% leather stitching and joining k. Plant, machinery and equipment used in tea factory 15% including roller and drier l. Juice boiling pans 20% m. Sugarcane crushing machine 15% n. Wooden frame for match making 20% o. Tools and equipment used for medical treatment 15% p. X-ray machine 20% q. Laboratory machine and equipment 15% r. Office goods and equipment (typewriter, calculator, 15% duplicating machine, photocopy machine etc.) s. Others 15% Source : HMG, Ministry of Law and Justice, Income Tax Rules, 1982, Ist Amendment.

ECONOMIC REVIEW: OCCASIONAL PAPER
242
REFERENCES
Auerbach, Alan J. and Dale W. Jorgenson (1980), “Inflation Proof Depreciation," Harvard Business Review (Sept.-Oct.), pp.113-118.
Boadway, Robin W., Neil Bruce and Jack M. Mintz (1987), Taxes on Capital Income in Canada: Analysis and Policy , Canadian Tax Foundation, Toronto.
HMG/Nepal, Ministry of Law and Justice, Income Tax Act, 1974. HMG/Nepal, Ministry of Law and Justice, Income Tax Act, 2002. HMG/Nepal, Ministry of Law and Justice, Income Tax Rules, 1982. HMG/Nepal, Ministry of Law and Justice, Industrial Enterprise Act, 1981. HMG/Nepal, Ministry of Law, "Justice and Parliamentary Affairs", Industrial
Enterprise Act, 1992, with and without amendment in 1997. HMG/Nepal, Ministry of finance, Finance Act, 1974/75 to 1999/2000. HMG/Nepal Central Bureau of Statistics, Census of Manufacturing Establishments,
1973/74, 1986/87, 1991/92, 1996/1997 Hulten,Charles R. and Frank C. Wykoff (1981), "The Measurement of Economic
Depreciation". In Charles R. Hulten (ed.) Depreciation, Inflation, and Taxation of Income from Capital, Urban Institute Press, Washington D.C, pp.81-125.
Jorgenson, Dale W.and Ralph Landau (1993), Tax Reform and the Cost of Capital: An International Comparison. Washington D.C.: The Brookings Institution pp. 134-165.
Kandel, Puspa (2000), "Capital Income Taxation in Nepal: An Analysis of Effective Burden ", Nepalese Journal of Government Revenue, Vol. 20, No.1, pp.228-241.
_________(2001), "Discriminatory Tax Burden: An Implication of Differences in Methods and Rates of Depreciation in Present Income Tax Act", Tribhuvan University Journal, Volume XXIII, No. 1, June 2001.
King, Mervyn A. and Don Fullerton(1984), The Taxation of Income from Capital (Chicago: University of Chicago Press).
Maxwell, Stamp (1990), Second Industrial Sector Study, Nepal, Draft Final Report. Kathmandu: Maxwell Stamp, Mimeo.
McKenzie, Kenneth J. and J.M. Mintz (1992), “Tax Effects on the Cost of Capital”. In John B. Shoven and John Whalley (eds) Canada-U.S. Tax Comparisons, National Bureau of Economic Research, pp. 189-216.
Mintz, Jack (1990) “Corporate Tax Holidays and Investment”, The World Bank Economic Review, vol. 4, no. 1, pp. 81-102.
_________Mintz, Jack (1990), “The Corporation Tax”, In Michael P. Devereux (ed.) The Economics of Tax Policy, Oxford University Press, pp.137-187.
Mintz, Jack and Thomas Tsiopoulas. “Taxation of Foreign Investment in South Asia”. Internal Discussion Paper, Report No. IDP-135. Washington D.C.: World Bank, Mimeo. (1993).
_________(1990), “Corporate Income Taxation and Foreign Direct Investment in Central and Eastern Europe”. In Anwar Shah (ed.) Fiscal Incentives for Investment and Innovations. Washington D.C.:World Bank, pp. 455-480.
Nepal Rastra Bank, Quarterly Economic Bulletin, Various. Nepal Stock Exchange Ltd., Financial Statements of Listed Companies (1993, 1995/96,
1997/98).