depolymerizing kinesins kip3 and mcak shape … · shape cellular microtubule architecture by...
TRANSCRIPT

Depolymerizing Kinesins Kip3 and MCAKShape Cellular Microtubule Architectureby Differential Control of CatastropheMelissa K. Gardner,1,2,3 Marija Zanic,2,3 Christopher Gell,2 Volker Bormuth,2 and Jonathon Howard2,*1Department of Genetics, Cell Biology, and Development, University of Minnesota, Minneapolis, MN 55455, USA2Max Planck Institute of Molecular Cell Biology and Genetics, 01307 Dresden, Germany3These authors contributed equally to this work
*Correspondence: [email protected] 10.1016/j.cell.2011.10.037
SUMMARY
Microtubules are dynamic filaments whose endsalternate between periods of slow growth and rapidshortening as they explore intracellular space andmove organelles. A key question is how regulatoryproteins modulate catastrophe, the conversionfrom growth to shortening. To study this process,we reconstituted microtubule dynamics in theabsence and presence of the kinesin-8 Kip3 andthe kinesin-13 MCAK. Surprisingly, we found that,even in the absence of the kinesins, the microtubulecatastrophe frequency depends on the age of themicrotubule, indicating that catastrophe is a multi-step process. Kip3 slowed microtubule growth ina length-dependent manner and increased the rateof aging. In contrast, MCAK eliminated the aging pro-cess. Thus, both kinesins are catastrophe factors;Kip3 mediates fine control of microtubule length bynarrowing the distribution of maximum lengths priorto catastrophe, whereas MCAK promotes rapidrestructuring of the microtubule cytoskeleton bymaking catastrophe a first-order random process.
INTRODUCTION
Microtubules are highly dynamic polymeric filaments for which
the protein subunit tubulin rapidly exchanges with the soluble
pool. Filament turnover is essential for many cellular processes
such as cell motility and mitosis. Assembly and disassembly of
filaments can generate force (Dogterom et al., 2005), and the
balance between growth and disassembly dynamically deter-
mines the distribution of filament lengths. How filament growth
and shrinkage are regulated by nucleotide hydrolysis and by
regulatory proteins is a central question in cell biology.
Microtubules turn over primarily by a process called dynamic
instability. This process involves gain and loss of subunits at one
end only: assembly at the plus end alternates stochastically with
disassembly at the same end (Mitchison and Kirschner, 1984).
The other end of the microtubule (the minus end) is usually stabi-
1092 Cell 147, 1092–1103, November 23, 2011 ª2011 Elsevier Inc.
lized at the microtubule-organizing center or at the centrosome
and participates to a lesser extent in subunit exchange. The
sudden random transition at the plus end between relatively
slow growth and rapid shortening is termed catastrophe. Despite
intense study for many years, the catastrophe mechanism and
its regulation by so-called catastrophe factors are still poorly
understood.
Catastrophe is thought to occur as a result of the loss of
a stabilizing GTP-tubulin cap at the plus end of the microtubule.
This GTP-cap model is supported by the following evidence: (1)
microtubule growth involves addition of GTP-tubulin from
solution, (2) there is a lag between subunit addition and GTP
hydrolysis (Carlier et al., 1984; Nogales and Wang, 2006;
Nogales et al., 1998), (3) tubulin subunits bound to the slowly
hydrolyzable GTP analog GMPCPP dissociate slowly from the
microtubule end (Hyman et al., 1992) and, when added to the
ends of GDP-microtubules, prevent depolymerization (Mickey
and Howard, 1995), (4) GDP-tubulin microtubules depolymerize
rapidly following dilution of soluble tubulin or after microtubule
severing (Walker et al., 1989, 1991), and (5) an antibody raised
to GTPgS-tubulin, which also binds GMPCPP microtubules,
preferentially labels the plus ends of microtubules (Dimitrov
et al., 2008), similar to EB1 (Maurer et al., 2011; Zanic et al.,
2009). However, the GTP cap has never been visualized on
a dynamic, growing microtubule and thus remains hypothetical.
Whereas a single GTP tubulin at the end of each of the 13 proto-
filaments that make up the microtubule is sufficient for stabiliza-
tion (Caplow and Shanks, 1996; Drechsel and Kirschner, 1994), it
is not known how many protofilaments need to become uncap-
ped before catastrophe occurs or even whether loss of the
presumed GTP cap is necessary for catastrophe. Furthermore,
the mechanism by which microtubule-binding proteins influence
catastrophe rates and whether or how they influence the proper-
ties of the cap are not known.
In this work, we asked how depolymerizing kinesins influence
microtubule dynamics. In cells, both kinesin-8 and kinesin-13 are
catastrophe factors that dramatically affect the number, distribu-
tion, and lengths of microtubules. Depletion of the kinesin-13
MCAK in mitotic egg extracts decreases the catastrophe rate
and increasesmitotic spindle length (Desai et al., 1999; Tourneb-
ize et al., 2000; Walczak et al., 1996). In Drosophila cells or
embryos, RNAi or antibodies against kinesin-13 increase spindle

length (Goshima et al., 2005; Rogers et al., 2004) and increase
the lengths of astral microtubules (Goshima et al., 2005).
Conversely, in vivo overexpression of MCAK results in loss of
spindle microtubules (Maney et al., 1998) and increased catas-
trophe frequency (Kline-Smith and Walczak, 2002). Kinesin-8 is
a catastrophe factor in budding yeast (Desai et al., 1999; Gardner
et al., 2008; Gupta et al., 2006) and fission yeast (Tischer et al.,
2009), where it plays a role in spindle positioning. Kinesin-8
deletion mutants in budding yeast have aberrant chromosome
positioning (Gardner et al., 2008; Gupta et al., 2006; Wargacki
et al., 2010), and RNAi of the Kif18A kinesin-8 inmammalian cells
leads to large fluctuations in chromosome position during
metaphase, suggesting that Kif18A affects individual microtu-
bule dynamics within kinetochore fibers (Mayr et al., 2007;
Stumpff et al., 2008). These phenotypes are all consistent with
kinesin-8 and -13 being catastrophe factors.
Experiments with purified proteins show that both kinesin-8
(Kip3, Kif18A) and kinesin-13 (MCAK) can depolymerize
microtubules stabilized by taxol or GMPCPP (Desai et al.,
1999; Gupta et al., 2006; Helenius et al., 2006; Hunter et al.,
2003; Mayr et al., 2007; Varga et al., 2006, 2009). Based on
the assumption that GMPCPP-tubulin is a model for GTP-
tubulin, it has been suggested that the mechanism underlying
the increase in catastrophe rate observed in vivo is depolymer-
ization of the GTP cap (Gupta et al., 2006; Varga et al., 2006,
2009). However, it has not been shown that purified kinesin-8
increases the catastrophe rate of microtubules, nor has kine-
sin-13 been shown to promote catastrophes of dynamic micro-
tubules on its own, though it does promote catastrophes in the
presence of other proteins such as XMAP215 (Kinoshita et al.,
2002) and EB1 (Montenegro Gouveia et al., 2010) and destabi-
lizes microtubules polymerized from purified HeLa cell tubulin
(Newton et al., 2004). The goal of this study was to determine
whether Kip3 and/or MCAK are catastrophe factors in vitro
and, if so, what the mechanism is.
One expectation that we had before starting these experi-
ments was that Kip3 might be a length-dependent catastrophe
factor. This expectation was based on our earlier finding that
Kip3 depolymerizes long microtubules faster than short ones
due to the so-called ‘‘antenna’’ effect: the longer the microtu-
bule, the more motors land on it, and therefore, because Kip3
is a highly processive motor, more motors reach the plus end
of longer microtubules, where they remove tubulin dimers (Varga
et al., 2006, 2009). We therefore hypothesized that the longer
themicrotubule, themore labile the cap, and therefore the higher
the catastrophe rate. In order to test this hypothesis, we needed
to measure carefully the kinetics of microtubule catastrophes in
the absence of kinesins. Surprisingly, we found that, even in the
absence of kinesins, microtubules have a length-dependent
catastrophe frequency. Therefore, we begin the paper by
describing catastrophes in tubulin alone, and because the
results were surprising and have unexpected and interesting
implications on the nature of the GTP cap and the mechanism
of catastrophe, we have included several control experiments
so that we can be sure of the ‘‘baseline.’’ We then tested the
influence of the depolymerizing kinesins on catastrophes and,
in a further surprise, found that they influenced catastrophes
by quite different mechanisms.
C
RESULTS
Catastrophes Visualized by TIRF MicroscopyTo study catastrophes of dynamic microtubules, we assembled
GTP-tubulin labeled with green Alexa-488 (Invitrogen Corpora-
tion) onto red GMPCPP-tubulin seeds attached to a coverslip
in a total internal reflection fluorescence (TIRF) microscope
assay (Gell et al., 2010) (Figure 1A). A slice through the microtu-
bule image was taken in each frame of the time-lapse movie,
and the slices were displayed one under another to generate
a kymograph. Catastrophes were clearly observed, and both
the catastrophe time and the catastrophe length were indepen-
dently recorded for each event (Figure 1A). The catastrophe time,
also called the microtubule lifetime, is the elapsed time during
which a microtubule grows prior to catastrophe. This is the
microtubule’s age at catastrophe. Under the conditions of our
assay, rescue events were not observed.
We measured the catastrophe time of 692 microtubules at a
free GTP-tubulin concentration of 12 mM. The 692 times were
plotted as a cumulative distribution curve (Figure 1B, blue): the
catastrophe events were ordered from shortest to longest time
to catastrophe, and each point on the graph corresponds to
the time (x axis) and event number normalized by the total
number of events (y axis). For each time, the y axis value of the
cumulative distribution corresponds to the fraction of microtu-
bules that underwent catastrophe prior to that time. The distribu-
tion has the value zero at time zero (corresponding to initiation of
growth off the seed) and approaches one for large times.
Microtubule Catastrophe Requires Multiple StepsIt is widely assumed (but see Odde et al., 1995, 1996; Stepanova
et al., 2010) that catastrophe is a first-order process that is
described by a single rate constant (Howard, 2001; Phillips
et al., 2008). According to this assumption, the catastrophe
rate is independent of the microtubule age, and therefore, the
rate constant can be estimated by dividing the number of catas-
trophe events by the total microtubule growth time. If this
assumption is correct, then the cumulative distribution should
increase linearly for short times. However, the cumulative distri-
bution shows a clear nonlinearity at early time points (Figure 1B,
inset, blue dots). Furthermore, the cumulative distribution falls
well below the predicted constant catastrophe rate line (Fig-
ure 1B, inset, red line), indicating that there is a paucity of catas-
trophes at short times. The ‘‘missing’’ catastrophes cannot be
accounted for by failure to detect the short microtubules in our
assay: microtubules of age 45 s have lengths �675 nm, corre-
sponding to 10 pixels, and are easily detected (the red line is
shifted by 45 s to account conservatively for possible missing
events at short times), and yet there remains a large difference
between the single-step model and the data, as shown by the
black double arrow in Figure 1B (inset) (also Figure S1 available
online). We conclude that younger microtubules have a lower
catastrophe rate than older microtubules. Thus, our data are
not consistent with catastrophe being a single transition
between a growing phase and a shortening phase. This suggests
that catastrophe is a multistep process (Figure 1C).
To test quantitatively whether our catastrophe time data are
consistent with a single-step catastrophe model, we used the
ell 147, 1092–1103, November 23, 2011 ª2011 Elsevier Inc. 1093

A B
C D
Figure 1. Catastrophe of In Vitro Microtubules Is
a Multistep Process
(A) Kymograph showing the catastrophe of a green
microtubule extension growing from a red seed.
(B) The experimentally observed distribution of catas-
trophe times (blue dots) is represented using a cumulative
distribution plot. The catastrophe distribution at short
times, though expected to be linear for a single-step
stochastic process (inset, red line), is nonlinear due to
fewer observed short time catastrophe events than pre-
dicted by a single-step process (black double arrow). The
red line is offset by 45 s to represent a conservative esti-
mate of short-duration, missed catastrophes.
(C) Catastrophe has been considered to be a single-step
process (left, red), in which a single stochastic catas-
trophe-promoting event is equally likely at any moment in
time. Alternatively, catastrophe could be a multistep
process (right, blue), in which several features required for
catastrophe are remembered over time.
(D) The catastrophe frequency increases with microtubule
age (blue dots), consistent with a multistep catastrophe
process and inconsistent with a single-step process (red
line). Error bars represent SE.
See also Figures S1 and S2.
cumulative distribution, F(t), to measure the time-dependent
catastrophe frequency, f±(t), as a function of microtubule age,
t, according to:
f±ðtÞ=dFðtÞ=dt1� FðtÞ : (1)
The catastrophe frequency represents the ratio of the number
of catastrophes observed at age t to the total number of micro-
tubules that reached age t. The above relationship assumes that
there are no rescues, as was the case under these conditions. As
shown in Figure 1D (blue markers), the catastrophe frequency
increased from near zero for young microtubules and tended
toward a saturation value of z0.005 s�1 for older microtubules.
It is clear that a single-step, first-order process described by
a constant catastrophe frequency (Figure 1D, red line) is incon-
sistent with our data.
A catastrophe frequency that increases from zero and satu-
rates at long times is indicative of a multistep aging process.
Such a process has memory: a number of independent events
must occur before catastrophe, and each of these events is
remembered, such that the microtubule end becomes less
stable over time.
A commonly used distribution that describes a multistep pro-
cess with n equal random steps is the gamma distribution (Rice,
1094 Cell 147, 1092–1103, November 23, 2011 ª2011 Elsevier Inc.
1995). The assumption of equal steps minimizes
the variance of the distribution, so the gamma
distribution gives the lower limit on the number
of steps in a multistep process. The gamma
distribution has beenwidely used tomodel wait-
ing times (Rice, 1995) and has been previously
used to describe microtubule catastrophes
(Odde et al., 1995; 1996).
The gamma distribution as applied to micro-
tubule catastrophe is characterized by two
parameters: a step parameter n, which describes the minimum
number of steps that are required to produce a catastrophe,
and a rate parameter, r, which describes the rate of occurrence
of each step (Figure S2). A single-step model is a special case
with step parameter n = 1 and in which microtubule catastrophe
does not depend on age. Using these parameters, the predicted
number of catastrophe events at time t (the probability density
function) is:
dFnðtÞdt
=rntn�1e�rt
GðnÞ (2)
wherein G(n) is the gamma function. By constraining the step
parameter to be one (n = 1; i.e., a single-step process), the fit
to the experimental data was poor (p < 0.0001, chi-square test)
(Figure 1D, red line). Therefore, we used our raw, unbinned
catastrophe time data at 12 mM tubulin to calculate themaximum
likelihood estimates for the gamma distribution parameters. The
step parameter was 2.93 ± 0.29 (95% confidence interval) in
12 mM GTP-tubulin. The gamma distribution provided a reason-
able fit to experimental data (p > 0.04, chi-square test), consis-
tent with a multistep process.
To verify that our results are not an artifact of imaging or
growth conditions, we performed several additional control
experiments. First, to eliminate the possibility that aging is

A
B
C
D
Figure 2. Controls against Light Damage and Rundown
(A) Control experiments with labeled and unlabeled tubulin were repeated
using DIC microscopy (left, kymograph). Similar to the TIRF microscopy
results, the catastrophe distribution at short times (right, inset), though ex-
pected to be linear for a single-step stochastic process (red line), is nonlinear
C
a result of light-induced damage during TIRF imaging, the 12 mM
control experiments were repeated using differential interference
contrast (DIC) microscopy (Figure 2A, left). Both labeled and
unlabeled tubulin show a clear nonlinearity at early time points
(Figure 2A, right, inset, green and blue dots) and fall well below
the predicted constant catastrophe rate line (inset, red line).
Therefore, the catastrophe frequency increases as a function
of microtubule age in DIC, as was seen by TIRF microscopy
(also see Figure S3).
Second, to further test that no light-induced damage occurs
during TIRF imaging, we imaged growing microtubules at
different time-lapse intervals. We found that, irrespective of
whether the time-lapse interval was 10 s, 15 s, or 20 s (with the
same exposure per frame), the catastrophe time distributions
were similar, with no significant effect of total exposure on the
mean microtubule lifetimes (Figure 2B). In addition, regardless
of time-lapse interval, the catastrophe frequency increased as
a function of microtubule age, suggesting that light-induced
damage is not an important factor in the catastrophe of older
microtubules (Figure 2C).
Finally, we analyzed catastrophes over a range of times after
the beginning of an experiment, which is defined as the time that
data collection is started (10 min after the tubulin is added to the
experimental chamber). As shown in Figure 2D, both the mean
lifetime and themean growth velocity are independent of whether
the microtubule is the first, second, third, or fourth to grow off the
same seed. This demonstrates that catastrophe time does not
depend on the age of the experimental chamber and also that
our measurements represent steady-state conditions in the flow
chamber. In addition, the free tubulin is not depleted during the
experiments, aswecalculate that, for an averageextension length
of 5 mm, the concentration of tubulin polymerized onto the seeds
isz2.4 nM, which is less than one-thousandth the concentration
of soluble tubulin used in the assays (7–14 mM; see Extended
Experimental Procedures for calculations).
Thus, our data demonstrate that a catastrophe event results
from at least three steps (n R 3) as the microtubule ages. This
confirms earlier results based on smaller sample sizes (Odde
et al., 1995).
Catastrophe Is a Multistep Process over a Rangeof Tubulin ConcentrationsTo test the generality of our finding, we repeated our mea-
surements at tubulin concentrations ranging from 7 to 14 mM
due to fewer observed short time catastrophe events than predicted by a
single-step process.
(B) To test whether light-induced damage occurs, we imaged growing
microtubules using a series of longer time intervals (left). Regardless of the
imaging time-lapse interval, the catastrophe time distributions were similar,
with no significant effect of imaging frequency on the mean microtubule life-
times (right).
(C) Regardless of time-lapse interval, the catastrophe frequency increases as
a function of microtubule age (left). The gamma step and rate parameters are
similar regardless of time-lapse interval (right). Error bars represent SE.
(D) Catastrophe times were analyzed as a function of the experimental
chamber age (left). Both the mean microtubule lifetime and the mean micro-
tubule growth velocity remained constant regardless of chamber age (right).
See also Figure S3.
ell 147, 1092–1103, November 23, 2011 ª2011 Elsevier Inc. 1095

A
C
E F
D
B
Figure 3. Catastrophe Depends onMicrotubule Age over a Range ofTubulin Concentrations
(A and B) Catastrophe length distributions were independently measured and
then plotted over a range of tubulin concentrations.
(C) The growth rate of microtubules was slower at lower tubulin concentrations
and was independent of microtubule length.
(D) The effect of tubulin concentration on the catastrophe time was less
pronounced than on catastrophe length (colors as in B). The inset shows that
increasing the tubulin concentration leads to a small increase in the lifetime.
(E) Regardless of the tubulin concentration, the catastrophe frequency
increased with microtubule age, consistent with a multistep catastrophe
process (error bars = SE).
(F) Catastrophe is described by a multistep process (n > 1, top) over the
observed range of tubulin concentrations. Tubulin concentration has only a
mild influence on either of the gamma distribution parameters (error bars =
95% confidence intervals).
1096 Cell 147, 1092–1103, November 23, 2011 ª2011 Elsevier Inc.
(Figure 3A). This range was chosen to minimize the number of
missed catastrophe events so as not to bias the catastrophe
length and time distributions. For example, below 7 mM, the
microtubules tend to be short, and it is difficult to accurately
measure the shortest ones. Above 14 mM, the microtubules
tend to be long and to bend away from the surface (due to
thermal fluctuations); it is difficult to accurately measure the
longest ones in the TIRF assay. In addition, at high tubulin
concentrations, the microtubules tend to grow out of the field
of view of the camera (33 mm), and rescue events complicate
the analysis. By restricting our analysis to 7–14 mM, we mini-
mized these sources of experimental bias.
Increasing the tubulin concentration from 7 mM to 14 mM
(Figure 3B) more than tripled the mean catastrophe length from
1.83 ± 0.08 mm (mean ± SE, n = 377) to 5.7 ± 0.22 mm (mean ±
SE, n = 239). This large increase in catastrophe length correlated
with the increased microtubule growth rates at higher tubulin
concentrations (Figure 3C). Because the catastrophe time is
approximately equal to the catastrophe length divided by the
growth velocity, we expected that the effect of tubulin on the
catastrophe time distribution would be less pronounced than
on the catastrophe length distribution. This is indeed the case:
the independently measured catastrophe time distribution
curves nearly superimpose (Figure 3D), with only a small
increase in mean lifetimes with increasing tubulin concentrations
(Figure 3D, inset). This indicates that microtubule age is the
dominant predictor of catastrophe, rather than length. For
example, after 300 s of growth, microtubules in 12 mM GTP-
tubulin are�5 mm long on average, whereas in 7 mMGTP-tubulin,
they are only �2 mm on average. However, in both cases, �50%
of microtubules will catastrophe by this time.
The catastrophe frequency increased as a function of microtu-
bule age, regardless of tubulin concentration (Figure 3E). We fit
the multistep model to each catastrophe time raw data set
(dashed gray curves in Figure 3D) and found that the number
of steps increased slightly from 2.5 ± 0.26 at 7 mM tubulin (n =
608 microtubules, 95% confidence interval) to 3.4 ± 0.76 (n =
141 microtubules, 95% confidence interval) at 14 mM tubulin
(Figure 3F, top). In all cases, the step parameter was significantly
larger than 1 (Figure 3F, bottom) and therefore inconsistent with
the single-step model. The effect of tubulin concentration on
either the step parameter or the rate parameter was slight,
consistent with our observation that tubulin concentration had
only a small effect on catastrophe time over the range of concen-
trations that we tested.
Experimental Design for Testing Whether the KinesinsAre Catastrophe FactorsHaving characterized catastrophes in tubulin alone, we asked
whether the depolymerizing kinesins are catastrophe factors
and, if they are, whether they alter the microtubule aging pro-
cess. To quantify the kinesin effects, we added increasing
concentrations of protein to flow cells containing 12 mM GTP-
tubulin and measured the effect on the catastrophe length and
catastrophe time distributions. In order to avoid biases intro-
duced if the lengths or lifetimes become too long or short (and
an appreciable number of events are missed), we restricted
our study to Kip3 and MCAK concentrations that kept the

A B
C D
E F
Figure 4. The Kinesin-8 Molecular Motor Kip3 Promotes Length-
Dependent Slowing ofMicrotubule Growth and Accelerates the Rate
of Microtubule Aging
(A) In the presence of Kip3 and 12 mM GTP-tubulin, green microtubules grow
from red seeds.
(B) The cumulative catastrophe length distribution in various concentrations of
Kip3.
(C) Kip3 promotes length-dependent slowing of microtubule growth rate, such
that longer microtubules grow more slowly than shorter microtubules.
(D) Increasing concentrations of Kip3 in the presence of 12 mM tubulin (colors
as in B) reduced the time to catastrophe and the mean microtubule lifetime
(inset).
(E) Catastrophe frequency increased as a function of microtubule age in the
presence of Kip3 (error bars = SE).
(F) Increasing concentrations of Kip3 led to an increase in the rate parameter
for aging (r, bottom), whereas the minimum number of steps that are required
to produce a catastrophe event (n, top) remained unchanged (error bars = 95%
confidence intervals). Thus, Kip3 promotes catastrophe by accelerating the
rate of microtubule aging.
C
catastrophe distributions within the range established for the
different tubulin concentrations. In other words, we ‘‘bracketed’’
the kinesin concentrations by the tubulin concentrations.
The Kinesin-8 Kip3 Reduces Microtubule CatastropheLengthTo determine whether Kip3 is a catastrophe factor, we added
varying amounts of Kip3 to the dynamic assay (Figure 4A).
Kip3 reduced the catastrophe lengths relative to the 12 mM
controls (Figure 4B). The mean catastrophe length was reduced
more than 2-fold in 18 nM Kip3 to 1.81 ± 0.08 mm (mean ± SE,
n = 290 microtubules) from 4.46 ± 0.11 mm (mean ± SE, n =
554) in the 12 mM control (p < 0.0001, t test). This is a similar
decrease to that obtained when the tubulin concentration was
reduced to 7 mM.
Kip3 Slows Microtubule Growth Ratein a Length-Dependent FashionThe reduction in catastrophe length by Kip3 could be due to
a decrease in growth rate, as seen when the tubulin concentra-
tion is reduced. Indeed, we found that Kip3 reduced themicrotu-
bule growth rate. However, in contrast to the effect of decreasing
tubulin concentration (Figure 3C), the effect of Kip3 on microtu-
bule growth rate depended on the extension length of the micro-
tubule (Figure 4C): the growth rate of short microtubules was
similar to that of controls, but the growth rate of long microtu-
bules was decreased. This effect is consistent with a model in
which longer microtubules more efficiently recruit Kip3 motors,
leading to a higher flux of the processive Kip3 motors to the
microtubule ends, where they reduce the growth rate (Varga
et al., 2006, 2009).
Kip3 Reduces Microtubule LifetimesBecause Kip3 promotes length-dependent slowing of microtu-
bule growth, we expected that Kip3’s effect on catastrophe
time would be distinct from its effect on catastrophe length.
Therefore, we measured catastrophe time over a range of Kip3
concentrations, all in the presence of 12 mM GTP-tubulin (Fig-
ure 4D). Although Kip3 had a more modest effect on the catas-
trophe time compared to its effect on the catastrophe length,
increasing theKip3 concentration nevertheless resulted in a large
decrease in mean microtubule lifetimes (Figure 4D, inset). Thus,
Kip3 is a catastrophe factor.
Kip3 Accelerates the Rate of Microtubule Aging thatLeads to CatastropheTo determine the mechanism by which Kip3 induces catastro-
phes, we calculated the dependence of catastrophe frequency
on age (Figure 4E). The catastrophe frequency increases sub-
stantially with age, showing that, in the presence of Kip3, catas-
trophe remains a multistep process. We fit the multistep model
to all of the raw catastrophe time data sets (dashed gray lines
in Figure 4D) and found that the number of steps was signifi-
cantly greater than one and was independent of the Kip3
concentration (slope of step parameter versus Kip3 concentra-
tion line: �0.004 ± 0.037, mean ± 95% CI) (Figure 4F, top). By
contrast, the rate parameter (r) was larger at higher Kip3 con-
centrations, increasing�2-fold at 18 nMKip3 (Figure 4F, bottom,
ell 147, 1092–1103, November 23, 2011 ª2011 Elsevier Inc. 1097
A B
C D
E F
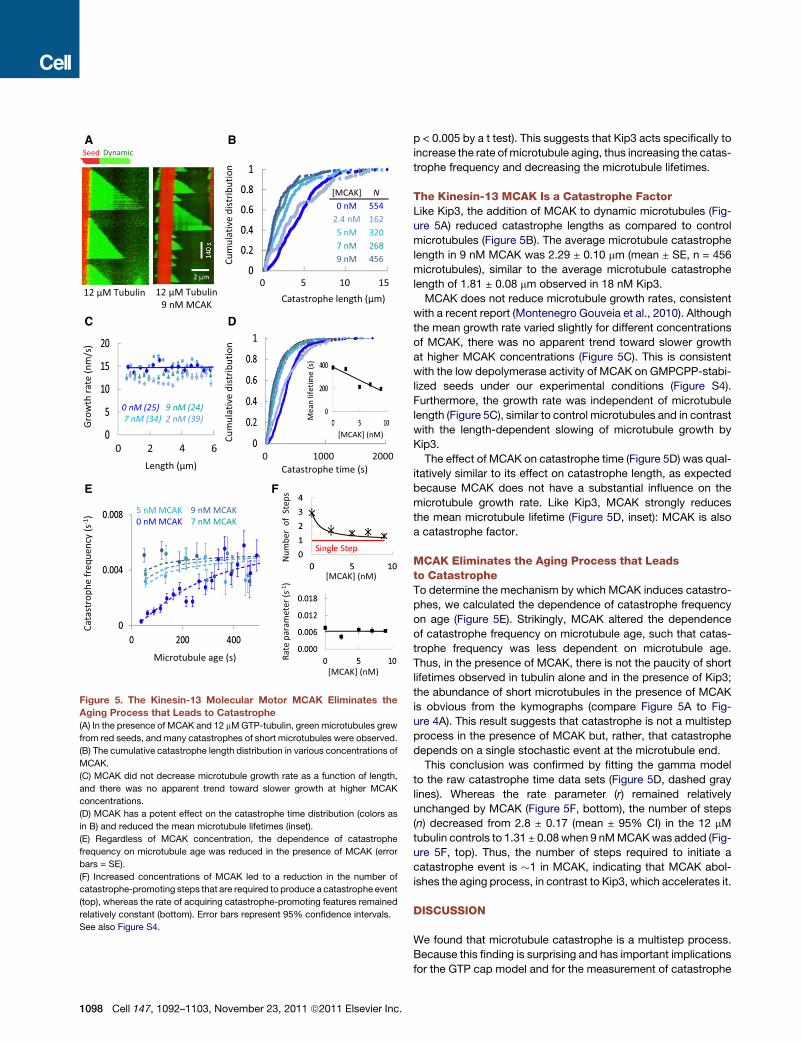
Figure 5. The Kinesin-13 Molecular Motor MCAK Eliminates the
Aging Process that Leads to Catastrophe
(A) In the presence of MCAK and 12 mMGTP-tubulin, green microtubules grew
from red seeds, and many catastrophes of short microtubules were observed.
(B) The cumulative catastrophe length distribution in various concentrations of
MCAK.
(C) MCAK did not decrease microtubule growth rate as a function of length,
and there was no apparent trend toward slower growth at higher MCAK
concentrations.
(D) MCAK has a potent effect on the catastrophe time distribution (colors as
in B) and reduced the mean microtubule lifetimes (inset).
(E) Regardless of MCAK concentration, the dependence of catastrophe
frequency on microtubule age was reduced in the presence of MCAK (error
bars = SE).
(F) Increased concentrations of MCAK led to a reduction in the number of
catastrophe-promoting steps that are required to produce a catastrophe event
(top), whereas the rate of acquiring catastrophe-promoting features remained
relatively constant (bottom). Error bars represent 95% confidence intervals.
See also Figure S4.
1098 Cell 147, 1092–1103, November 23, 2011 ª2011 Elsevier Inc.
p < 0.005 by a t test). This suggests that Kip3 acts specifically to
increase the rate ofmicrotubule aging, thus increasing the catas-
trophe frequency and decreasing the microtubule lifetimes.
The Kinesin-13 MCAK Is a Catastrophe FactorLike Kip3, the addition of MCAK to dynamic microtubules (Fig-
ure 5A) reduced catastrophe lengths as compared to control
microtubules (Figure 5B). The average microtubule catastrophe
length in 9 nM MCAK was 2.29 ± 0.10 mm (mean ± SE, n = 456
microtubules), similar to the average microtubule catastrophe
length of 1.81 ± 0.08 mm observed in 18 nM Kip3.
MCAK does not reduce microtubule growth rates, consistent
with a recent report (Montenegro Gouveia et al., 2010). Although
the mean growth rate varied slightly for different concentrations
of MCAK, there was no apparent trend toward slower growth
at higher MCAK concentrations (Figure 5C). This is consistent
with the low depolymerase activity of MCAK on GMPCPP-stabi-
lized seeds under our experimental conditions (Figure S4).
Furthermore, the growth rate was independent of microtubule
length (Figure 5C), similar to control microtubules and in contrast
with the length-dependent slowing of microtubule growth by
Kip3.
The effect of MCAK on catastrophe time (Figure 5D) was qual-
itatively similar to its effect on catastrophe length, as expected
because MCAK does not have a substantial influence on the
microtubule growth rate. Like Kip3, MCAK strongly reduces
the mean microtubule lifetime (Figure 5D, inset): MCAK is also
a catastrophe factor.
MCAK Eliminates the Aging Process that Leadsto CatastropheTo determine the mechanism by which MCAK induces catastro-
phes, we calculated the dependence of catastrophe frequency
on age (Figure 5E). Strikingly, MCAK altered the dependence
of catastrophe frequency on microtubule age, such that catas-
trophe frequency was less dependent on microtubule age.
Thus, in the presence of MCAK, there is not the paucity of short
lifetimes observed in tubulin alone and in the presence of Kip3;
the abundance of short microtubules in the presence of MCAK
is obvious from the kymographs (compare Figure 5A to Fig-
ure 4A). This result suggests that catastrophe is not a multistep
process in the presence of MCAK but, rather, that catastrophe
depends on a single stochastic event at the microtubule end.
This conclusion was confirmed by fitting the gamma model
to the raw catastrophe time data sets (Figure 5D, dashed gray
lines). Whereas the rate parameter (r) remained relatively
unchanged by MCAK (Figure 5F, bottom), the number of steps
(n) decreased from 2.8 ± 0.17 (mean ± 95% CI) in the 12 mM
tubulin controls to 1.31 ± 0.08 when 9 nMMCAKwas added (Fig-
ure 5F, top). Thus, the number of steps required to initiate a
catastrophe event is �1 in MCAK, indicating that MCAK abol-
ishes the aging process, in contrast to Kip3, which accelerates it.
DISCUSSION
We found that microtubule catastrophe is a multistep process.
Because this finding is surprising and has important implications
for the GTP cap model and for the measurement of catastrophe

frequency in vivo and in vitro, we performed several control
experiments. First, we restricted our measurements to a rela-
tively small range of tubulin and kinesin concentrations to mini-
mize biases introduced by missing short and long events.
Second, we confirmed that multistep catastrophes were not
due to light damage. And third, the MCAK experiments served
as an important control because they confirm that short events
can indeed be detected.
We do not think that the paucity of catastrophes at short
lengths is due to microtubule end proximity to the surface (the
shorter the length, the closer to the seed and therefore the
surface). This is because, in the absence of kinesins, microtubule
age, and not length, is the primary predictor of catastrophe
(compare Figures 3B and 3D). Furthermore, the high catastrophe
rate at short lengths in the presence of MCAK also argues
against a surface effect.
In addition to our own control experiments, two additional
observations from the literature support the multistep mecha-
nism of catastrophe. First, nonexponential cumulative catas-
trophe distributions have been reported by the Odde (Odde
et al., 1995) and Dogterom (Janson et al., 2003) labs. And
second, many labs have reported that the distribution of lengths
in a population of dynamic microtubules deviates from the expo-
nential predicted by single-step models (Stepanova et al., 2010;
Tischer et al., 2009; Cassimeris et al., 1986; Du et al., 2010;
Foethke et al., 2009; Fygenson et al., 1994; Voter et al., 1991;
Walker et al., 1991). In these studies, the nonexponential length
distributions provide support for the multistep process that does
not rely on the direct observation of catastrophes. Taken
together, the new results in this paper and the observations
from the literature provide strong evidence that microtubule
catastrophe is a multistep process, rather than a single-step
process, as commonly assumed.
Another of our findings that contradicts a commonly held view
is that the catastrophe frequency correlated only weakly with
growth rate. First, we found that a 2-fold increase in tubulin
concentration more than doubled the growth rate but only
decreased the catastrophe frequency by �25%. This finding is
consistent with the results from Walker et al. (Walker et al.,
1988) over a corresponding range of microtubule growth rates.
However, they found that a further increase in tubulin concentra-
tion dramatically decreased the catastrophe frequency, a finding
reported by several other groups (e.g., Chretien et al., 1995).
Also, lowering the tubulin concentration has been reported to
dramatically increase the catastrophe rates (Chretien et al.,
1995; Voter et al., 1991; Walker et al., 1991). Second, MCAK
had little effect on growth rate and yet had a dramatic effect on
catastrophe frequency. Taken together with results from the
literature (Fygenson et al., 1994), our results suggest that catas-
trophe is not simply related to growth.
Nature of the Microtubule Aging ProcessOur picture of the multistep process is that catastrophe-
promoting lattice features at the microtubule end are acquired
and remembered as the microtubule ages. During growth, ‘‘de-
stabilizing events’’ occur, and these events are remembered as
structural features that increase the likelihood of catastrophe.
After a sufficient number of these events, a catastrophe occurs.
C
In other words, we think it is likely that the microtubule tip
structure is evolving in a time-dependent fashion from a stable
configuration when microtubules are young to a less stable con-
figuration when microtubules have aged. The depolymerizing ki-
nesins Kip3 and MCAK both increase the catastrophe frequency
but by different mechanisms: Kip3 increases the rate of forma-
tion of lattice-destabilizing features, whereas MCAK reduces
the number of features necessary for catastrophe.
Our finding that catastrophe depends on microtubule age has
interesting implications for the GTP cap model because it
suggests that the cap has substructure. We do not know what
the catastrophe-promoting structural feature is. There are
several possibilities. For example, the protofilaments might
have individual caps, and catastrophe may occur when a
minimum of three protofilaments become uncapped (Figure 6D).
These uncapped protofilaments could be adjacent, or they could
be separated from each other. This possibility requires that the
uncapped protofilament remains as the microtubule grows;
perhaps if the GTP hydrolyzes in the last subunit, hydrolysis of
incoming subunits is accelerated. Another possibility is that the
catastrophe-promoting feature is a structural dislocation of
a protofilament relative to its neighbors. Again, the dislocation
must be retained as the microtubule grows. Catastrophe would
occur when three or more dislocations are accumulated. A third
possibility is that the feature corresponds to loss of a protofila-
ment at the microtubule tip; if enough protofilaments are lost,
then the microtubule catastrophes. Changes in protofilament
number have been observed by cryoelectron microscopy (Chre-
tien et al., 1992, 1995), but whether they correlate with microtu-
bule age or catastrophe is not known. Changes in protofilament
number could explain the presence of the GTP-tubulin
‘‘remnants’’ along the microtubule lattice, as described by Dimi-
trov et al. (2008), which would represent GTP-capped lagging
protofilaments. The effects of the kinesins are compatible with
all three possibilities. In the case of Kip3, the removal of subunits
might increase the likelihood of exposure of a GDP subunit, the
formation of a dislocation, or the loss of the protofilament.
MCAK may have higher activity on GDP tubulin or a lattice dislo-
cation. Clearly, additional experiments are required to test these
and other possibilities.
The Mechanism of Catastrophe Promotion by Kip3and MCAKThe increase in catastrophe frequency by Kip3 and MCAK is
generally consistent with the idea that these proteins act by
promoting the depolymerization of the growing GTP cap,
thereby destabilizing it and increasing the likelihood that it is
lost and the microtubule undergoes catastrophe. The alternative
hypothesis, that Kip3 and MCAK act by slowing polymerization,
is not readily reconciled with the data. For example, if Kip3
simply inhibits the subunit addition rate, then adding Kip3 should
be equivalent to reducing the tubulin concentration; yet, the
latter treatment has a much weaker effect on the catastrophe
rate than addition of Kip3. Rather than inhibiting subunit addition,
it appears instead that, by accelerating subunit removal from the
microtubule tip, Kip3 increases the rate of formation of lattice-
destabilizing features. Likewise, the finding that MCAK reduces
the number of steps required for catastrophe suggests that it is
ell 147, 1092–1103, November 23, 2011 ª2011 Elsevier Inc. 1099

A
B
C
D
Figure 6. System-wide Microtubule Length Control by Depolyme-
rizing Kinesins
(A) Because catastrophe requires multiple steps in tubulin alone, catastrophe
events are less likely for shorter microtubules (left). As a result, microtubules
shorter than the peak catastrophe length (blue arrow) will tend to grow well,
creating a zone of high microtubule density that surrounds the microtubule
nucleation origin (upper-right; pdf, probability density function in units of nm�1;
1100 Cell 147, 1092–1103, November 23, 2011 ª2011 Elsevier Inc.
not simply reducing the subunit on rate. Because MCAK does
not increase the rate of lattice-destabilizing feature formation,
it appears that MCAK recognizes the feature only after it has
formed; only then does MCAK use the lattice-destabilizing
feature as a starting point for destabilizing the entire cap,
perhaps by inducing protofilament curling (Moores and Milligan,
2006; Mulder et al., 2009).
The Effect of Catastrophe Mechanism on MicrotubuleLength DistributionWhat are the consequences of the different catastrophe mecha-
nisms of the kinesins on the system-wide determination of
microtubule lengths? In tubulin alone, the multistep process
implies that microtubules are less likely to catastrophe when
they are short (as compared to when they are long), creating
a peak in the probability density function for microtubule catas-
trophe (Figure 6A, left, blue arrow). Therefore, microtubules that
are shorter than the peak catastrophe length will tend to grow
well, creating a zone of high microtubule density surrounding
the microtubule nucleation origin (Figure 6A, upper-right, red
double arrow; see Extended Experimental Procedures). This
inherent property of microtubule catastrophe has a significant
influence on the density of space exploration by microtubule
tips, such that microtubule tip exploration can be concentrated
in a dense zone away from the nucleation origin (Figure 6A,
lower-right, blue dots represent individual microtubule catas-
trophe lengths for microtubules originating from the center).
Thus, search and capture of kinetochores by dynamic microtu-
bule tips could be regulated, in part, by a catastrophe mecha-
nism that is inherent to the microtubule itself (Wollman et al.,
2005).
The distribution of catastrophe lengths in 14 nM Kip3 shows
that the most common catastrophe length is nearly equal to
themean catastrophe length, with a narrow range of catastrophe
lengths both smaller and larger than the mean length (Figure 6B,
left). Thus, the search space that a microtubule tip will explore in
the presence of Kip3 occurs within a strongly limited zone of
optimal microtubule growth while still allowing for robust search
away from the nucleation origin (Figure 6B, upper-right, red
red double-arrow; see Extended Experimental Procedures for calculations).
The theoretical density of catastrophe lengths around a nucleation point is
shown in the lower right; each blue dot represents a catastrophe length.
(B) The addition of Kip3 results in a narrow distribution of microtubule
catastrophe lengths (left; lower-right), creating a well-defined region of high
microtubule density that is away from the microtubule nucleation origin
(upper-right).
(C) Although MCAK is a potent catastrophe promoter, MCAK is not able to
fine-tune the distribution of catastrophe lengths away from the nucleation
origin (left), and as a result, microtubule catastrophe lengths (left; lower-right)
andmicrotubule lengths (upper-right) are highly concentrated at the nucleation
origin, regardless of MCAK concentration.
(D) Stochastic GDP-tubulin exposure at the tips of individual protofilaments
may prevent efficient growth of these protofilaments, leading to lattice-de-
stabilizing features that are remembered in time. Kip3 may act by increasing
the rate of producing spontaneous protofilament uncapping events that ulti-
mately lead to catastrophe, whereas MCAK could either create or stabilize
curled protofilaments at the microtubule tip, thus destabilizing the entire
microtubule tip.

double arrow zone, and lower-right, where green dots represent
catastrophe lengths). Because Kip3 leverages the natural
tendency of microtubules to grow well when they are short but
also limits longer microtubule lengths via length-dependent
velocity slowing, this could explain, in part, why metaphase
kinetochore oscillation amplitudes in human cells are larger
and faster in the absence of the Kip3 homolog Kif18A (Jaqaman
et al., 2010; Stumpff et al., 2008). Thus, though Kip3 is a relatively
weak microtubule depolymerase, it has the unique ability to limit
longer microtubule growth while still allowing for robust growth
of shorter microtubules, thus concentrating microtubule tip
excursions to a narrow region of space that is away from the
nucleation origin.
In contrast, the catastrophe length distribution in 7 nM MCAK
approximates an exponential distribution, in which the most
common catastrophe length observed is in the shortest histo-
gram bin, with a long tail of longer lengths observed as well (Fig-
ure 6C, left). Thus, although the mechanism for catastrophe
promotion in Kip3 is optimized to produce a narrow microtubule
catastrophe length distribution, MCAK results in a wider catas-
trophe length range. In this case, there is no optimal search
zone outside of the nucleation area (Figure 6C, right). Rather,
by reducing the number of steps that are required to promote
a catastrophe event, MCAK is uniquely proficient in rapid catas-
trophe promotion. Therefore, MCAK is ideally suited for rapid
restructuring in the cell, as could be mediated by a phosphoryla-
tion event, such as to break down a mitotic spindle at the
completion of mitosis (Rankin andWordeman, 2010) or to rapidly
correct improper kinetochore-microtubule attachments during
mitosis by synchronously promoting catastrophe of several
microtubules (Bakhoum et al., 2009; Kline-Smith and Walczak,
2004; Wordeman et al., 2007).
Together, our results demonstrate how microtubule-associ-
ated proteins increase the versatility of microtubules in the cell.
A protein such as Kip3 could be important when precise micro-
tubule length control is required, such as during mitosis for
spindle length control, during chromosome congression, or for
efficient search and capture of kinetochores by microtubules
(Du et al., 2010; Mayr et al., 2007; Stumpff et al., 2008; Wollman
et al., 2005). In contrast, a potent catastrophe promoter such as
MCAKwould be better suited to allow for rapid depolymerization
and restructuring of microtubules in the cell, such as during
mitosis to correct improper kinetochore-microtubule attach-
ments or to efficiently execute microtubule depolymerization
and chromosome segregation during anaphase (Bakhoum
et al., 2009; Goshima et al., 2005; Kline-Smith and Walczak,
2004; Rizk et al., 2009; Wordeman et al., 2007). Consistent
with this division of labor between the depolymerizing kinesins,
kinesin-13s, but not kinesin-8s, dramatically decrease the length
of astral microtubules in the metaphase spindle, whereas kine-
sin-8s play a stronger role than kinesin-13s in regulating spindle
length (Goshima et al., 2005).
EXPERIMENTAL PROCEDURES
TIRF Experiments
Assembly of GTP-tubulin labeled with Alexa-488 onto rhodamine-labeled
GMPCPP-tubulin seeds was imaged by TIRF microscopy as previously
C
described (Gell et al., 2010; Varga et al., 2006), with the exception that flow
chambers were constructed with two layers of double-stick tape and with
extra width to allow for longer time-lapse experiments without reaction
chamber degradation. Images were collected with an Andor iXon camera on
a Zeiss Axiovert 200 M microscope using a Zeiss1003/1.45 NA Plan FLUAR
objective. The Imaging Buffer consisted of BRB80 supplemented with
40 mM glucose, 40 mg/ml glucose-oxidase, 16 mg/ml catalase, 0.1 mg/ml
casein, and 10 mM DTT. In addition, all experiments included 1 mM GTP,
1 mM ATP, and 110 mM KCl, regardless of whether or not a motor was
included in the assay. A 2.53 Optovar was used to provide additional magni-
fication and to limit pixel size to�64 nm. An objective heater was used to warm
the flow channel to 28�C. In all cases, once reaction mixture was added to
coverslip-attached seeds in the flow chamber, we waited 10 min prior to col-
lecting images to allow the reaction to come to steady state.
Image Analysis
Image analysis was performed by creating kymographs of individual microtu-
bule seeds, along with green extensions, using ImageJ analysis software.
Catastrophe events are readily detected using this analysis, so catastrophe
time can be measured using vertical distances, and catastrophe length can
be measured using horizontal distances. Instant growth velocity was calcu-
lated for each 30 s interval, with the average length calculated for each interval.
The growth rates versus time plots were calculated by binning length ranges
together and then by calculating the mean and standard deviation of the
instant growth velocity for each bin using MATLAB.
Gamma Distribution Fitting Analysis
Gamma distribution parameters were directly estimated using all experimental
data (no binning) for catastrophe times or catastrophe lengths at a given exper-
imental condition. Here, a gamma distribution was assumed, and the best-fit
gammamodel parameters were directly calculated from the entire catastrophe
time data set for a given experimental condition. This was accomplished using
the gamfit function in the MATLAB statistics toolbox, which calculates the
maximum likelihood estimates (MLEs) and the corresponding confidence
intervals for the parameters of the gamma distribution given the experimental
data in an input vector.
SUPPLEMENTAL INFORMATION
Supplemental Information includes Extended Experimental Procedures and
four figures and can be found with this article online at doi:10.1016/j.cell.
2011.10.037.
ACKNOWLEDGMENTS
The authors thank members of the Howard Laboratory, in particular the
Muffins Group, for advice and assistance. We thank Dr. V. Varga and
Dr. C. Friel for protein and advice. M.K.G. was supported by a Whitaker Inter-
national Scholar Fellowship, M.Z. by a Cross-Disciplinary Fellowship from the
International Human Frontier Science Program Organization, and V.B. by
a fellowship from the Boehringer Ingelheim Fonds.
Received: April 17, 2011
Revised: July 11, 2011
Accepted: October 26, 2011
Published: November 23, 2011
REFERENCES
Bakhoum, S.F., Genovese, G., and Compton, D.A. (2009). Deviant kinetochore
microtubule dynamics underlie chromosomal instability. Curr. Biol. 19, 1937–
1942.
Caplow, M., and Shanks, J. (1996). Evidence that a single monolayer tubulin-
GTP cap is both necessary and sufficient to stabilize microtubules. Mol. Biol.
Cell 7, 663–675.
ell 147, 1092–1103, November 23, 2011 ª2011 Elsevier Inc. 1101

Carlier, M.F., Hill, T.L., and Chen, Y. (1984). Interference of GTP hydrolysis in
the mechanism of microtubule assembly: an experimental study. Proc. Natl.
Acad. Sci. USA 81, 771–775.
Cassimeris, L.U., Wadsworth, P., and Salmon, E.D. (1986). Dynamics of
microtubule depolymerization in monocytes. J. Cell Biol. 102, 2023–2032.
Chretien, D., Metoz, F., Verde, F., Karsenti, E., and Wade, R.H. (1992). Lattice
defects in microtubules: protofilament numbers vary within individual microtu-
bules. J. Cell Biol. 117, 1031–1040.
Chretien, D., Fuller, S.D., and Karsenti, E. (1995). Structure of growing
microtubule ends: two-dimensional sheets close into tubes at variable rates.
J. Cell Biol. 129, 1311–1328.
Desai, A., Verma, S., Mitchison, T.J., and Walczak, C.E. (1999). Kin I kinesins
are microtubule-destabilizing enzymes. Cell 96, 69–78.
Dimitrov, A., Quesnoit, M., Moutel, S., Cantaloube, I., Pous, C., and Perez, F.
(2008). Detection of GTP-tubulin conformation in vivo reveals a role for GTP
remnants in microtubule rescues. Science 322, 1353–1356.
Dogterom, M., Kerssemakers, J.W., Romet-Lemonne, G., and Janson, M.E.
(2005). Force generation by dynamic microtubules. Curr. Opin. Cell Biol. 17,
67–74.
Drechsel, D.N., and Kirschner, M.W. (1994). TheminimumGTP cap required to
stabilize microtubules. Curr. Biol. 4, 1053–1061.
Du, Y., English, C.A., and Ohi, R. (2010). The kinesin-8 Kif18A dampens micro-
tubule plus-end dynamics. Curr. Biol. 20, 374–380.
Foethke, D., Makushok, T., Brunner, D., and Nedelec, F. (2009). Force- and
length-dependent catastrophe activities explain interphase microtubule
organization in fission yeast. Mol. Syst. Biol. 5, 241.
Fygenson, D.K., Braun, E., and Libchaber, A. (1994). Phase diagram of micro-
tubules. Phys. Rev. E Stat. Phys. Plasmas Fluids Relat. Interdiscip. Topics 50,
1579–1588.
Gardner, M.K., Bouck, D.C., Paliulis, L.V., Meehl, J.B., O’Toole, E.T., Haase,
J., Soubry, A., Joglekar, A.P., Winey, M., Salmon, E.D., et al. (2008). Chromo-
some congression by Kinesin-5 motor-mediated disassembly of longer kinet-
ochore microtubules. Cell 135, 894–906.
Gell, C., Bormuth, V., Brouhard, G.J., Cohen, D.N., Diez, S., Friel, C.T.,
Helenius, J., Nitzsche, B., Petzold, H., Ribbe, J., et al. (2010). Microtubule
dynamics reconstituted in vitro and imaged by single-molecule fluorescence
microscopy. Methods Cell Biol. 95, 221–245.
Goshima, G., Wollman, R., Stuurman, N., Scholey, J.M., and Vale, R.D. (2005).
Length control of the metaphase spindle. Curr. Biol. 15, 1979–1988.
Gupta, M.L., Jr., Carvalho, P., Roof, D.M., and Pellman, D. (2006). Plus end-
specific depolymerase activity of Kip3, a kinesin-8 protein, explains its role
in positioning the yeast mitotic spindle. Nat. Cell Biol. 8, 913–923.
Helenius, J., Brouhard, G., Kalaidzidis, Y., Diez, S., and Howard, J. (2006).
The depolymerizing kinesin MCAK uses lattice diffusion to rapidly target
microtubule ends. Nature 441, 115–119.
Howard, J. (2001). Mechanics of Motor Proteins and the Cytoskeleton
(Sunderland, MA: Sinauer Associates, Inc.).
Hunter, A.W., Caplow, M., Coy, D.L., Hancock, W.O., Diez, S., Wordeman, L.,
and Howard, J. (2003). The kinesin-related protein MCAK is a microtubule de-
polymerase that forms an ATP-hydrolyzing complex at microtubule ends. Mol.
Cell 11, 445–457.
Hyman, A.A., Salser, S., Drechsel, D.N., Unwin, N., and Mitchison, T.J. (1992).
Role of GTP hydrolysis in microtubule dynamics: information from a slowly
hydrolyzable analogue, GMPCPP. Mol. Biol. Cell 3, 1155–1167.
Janson, M.E., de Dood, M.E., and Dogterom, M. (2003). Dynamic instability of
microtubules is regulated by force. J. Cell Biol. 161, 1029–1034.
Jaqaman, K., King, E.M., Amaro, A.C., Winter, J.R., Dorn, J.F., Elliott, H.L.,
McHedlishvili, N., McClelland, S.E., Porter, I.M., Posch, M., et al. (2010).
Kinetochore alignment within the metaphase plate is regulated by centromere
stiffness and microtubule depolymerases. J. Cell Biol. 188, 665–679.
1102 Cell 147, 1092–1103, November 23, 2011 ª2011 Elsevier Inc.
Kinoshita, K., Habermann, B., and Hyman, A.A. (2002). XMAP215: a key
component of the dynamic microtubule cytoskeleton. Trends Cell Biol. 12,
267–273.
Kline-Smith, S.L., and Walczak, C.E. (2002). The microtubule-destabilizing ki-
nesin XKCM1 regulates microtubule dynamic instability in cells. Mol. Biol. Cell
13, 2718–2731.
Kline-Smith, S.L., and Walczak, C.E. (2004). Mitotic spindle assembly and
chromosome segregation: refocusing on microtubule dynamics. Mol. Cell
15, 317–327.
Maney, T., Hunter, A.W., Wagenbach, M., and Wordeman, L. (1998). Mitotic
centromere-associated kinesin is important for anaphase chromosome segre-
gation. J. Cell Biol. 142, 787–801.
Maurer, S.P., Bieling, P., Cope, J., Hoenger, A., and Surrey, T. (2011).
GTPgammaS microtubules mimic the growing microtubule end structure
recognized by end-binding proteins (EBs). Proc. Natl. Acad. Sci. USA 108,
3988–3993.
Mayr, M.I., Hummer, S., Bormann, J., Gruner, T., Adio, S., Woehlke, G., and
Mayer, T.U. (2007). The human kinesin Kif18A is a motile microtubule depoly-
merase essential for chromosome congression. Curr. Biol. 17, 488–498.
Mickey, B., and Howard, J. (1995). Rigidity of microtubules is increased by
stabilizing agents. J. Cell Biol. 130, 909–917.
Mitchison, T., and Kirschner, M. (1984). Dynamic instability of microtubule
growth. Nature 312, 237–242.
Montenegro Gouveia, S., Leslie, K., Kapitein, L.C., Buey, R.M., Grigoriev, I.,
Wagenbach, M., Smal, I., Meijering, E., Hoogenraad, C.C., Wordeman, L.,
et al. (2010). In vitro reconstitution of the functional interplay between MCAK
and EB3 at microtubule plus ends. Curr. Biol. 20, 1717–1722.
Moores, C.A., and Milligan, R.A. (2006). Lucky 13-microtubule depolymerisa-
tion by kinesin-13 motors. J. Cell Sci. 119, 3905–3913.
Mulder, A.M., Glavis-Bloom, A., Moores, C.A., Wagenbach, M., Carragher, B.,
Wordeman, L., and Milligan, R.A. (2009). A newmodel for binding of kinesin 13
to curved microtubule protofilaments. J. Cell Biol. 185, 51–57.
Newton, C.N., Wagenbach, M., Ovechkina, Y., Wordeman, L., and Wilson, L.
(2004). MCAK, a Kin I kinesin, increases the catastrophe frequency of
steady-state HeLa cell microtubules in an ATP-dependent manner in vitro.
FEBS Lett. 572, 80–84.
Nogales, E., andWang, H.W. (2006). Structural mechanisms underlying nucle-
otide-dependent self-assembly of tubulin and its relatives. Curr. Opin. Struct.
Biol. 16, 221–229.
Nogales, E., Wolf, S.G., and Downing, K.H. (1998). Structure of the alpha beta
tubulin dimer by electron crystallography. Nature 391, 199–203.
Odde, D.J., Cassimeris, L., and Buettner, H.M. (1995). Kinetics of microtubule
catastrophe assessed by probabilistic analysis. Biophys. J. 69, 796–802.
Odde, D.J., Buettner, H.M., and Cassimeris, L. (1996). Spectral analysis of
microtubule assembly dynamics. AIChE J. 42, 1434–1442.
Phillips, R., Kondev, J., and Theriot, J. (2008). Physical Biology of the Cell
(London: Taylor & Francis Group).
Rankin, K.E., and Wordeman, L. (2010). Long astral microtubules uncouple
mitotic spindles from the cytokinetic furrow. J. Cell Biol. 190, 35–43.
Rice, J.A. (1995). Mathematical Statistics and Data Analysis (Belmont, CA:
Duxbury Press).
Rizk, R.S., Bohannon, K.P., Wetzel, L.A., Powers, J., Shaw, S.L., andWalczak,
C.E. (2009). MCAK and paclitaxel have differential effects on spindle microtu-
bule organization and dynamics. Mol. Biol. Cell 20, 1639–1651.
Rogers, G.C., Rogers, S.L., Schwimmer, T.A., Ems-McClung, S.C., Walczak,
C.E., Vale, R.D., Scholey, J.M., and Sharp, D.J. (2004). Two mitotic kinesins
cooperate to drive sister chromatid separation during anaphase. Nature 427,
364–370.
Stepanova, T., Smal, I., van Haren, J., Akinci, U., Liu, Z., Miedema, M.,
Limpens, R., van Ham, M., van der Reijden, M., Poot, R., et al. (2010).
History-dependent catastrophes regulate axonal microtubule behavior. Curr.
Biol. 20, 1023–1028.

Stumpff, J., von Dassow, G., Wagenbach, M., Asbury, C., and Wordeman, L.
(2008). The kinesin-8 motor Kif18A suppresses kinetochore movements to
control mitotic chromosome alignment. Dev. Cell 14, 252–262.
Tischer, C., Brunner, D., and Dogterom, M. (2009). Force- and kinesin-8-
dependent effects in the spatial regulation of fission yeast microtubule
dynamics. Mol. Syst. Biol. 5, 250.
Tournebize, R., Popov, A., Kinoshita, K., Ashford, A.J., Rybina, S., Pozniakov-
sky, A., Mayer, T.U., Walczak, C.E., Karsenti, E., and Hyman, A.A. (2000).
Control of microtubule dynamics by the antagonistic activities of XMAP215
and XKCM1 in Xenopus egg extracts. Nat. Cell Biol. 2, 13–19.
Varga, V., Helenius, J., Tanaka, K., Hyman, A.A., Tanaka, T.U., and Howard, J.
(2006). Yeast kinesin-8 depolymerizes microtubules in a length-dependent
manner. Nat. Cell Biol. 8, 957–962.
Varga, V., Leduc, C., Bormuth, V., Diez, S., and Howard, J. (2009). Kinesin-8
motors act cooperatively to mediate length-dependent microtubule depoly-
merization. Cell 138, 1174–1183.
Voter, W.A., O’Brien, E.T., and Erickson, H.P. (1991). Dilution-induced disas-
sembly of microtubules: relation to dynamic instability and the GTP cap. Cell
Motil. Cytoskeleton 18, 55–62.
Walczak, C.E., Mitchison, T.J., and Desai, A. (1996). XKCM1: a Xenopus kine-
sin-related protein that regulates microtubule dynamics during mitotic spindle
assembly. Cell 84, 37–47.
C
Walker, R.A., O’Brien, E.T., Pryer, N.K., Soboeiro, M.F., Voter, W.A., Erickson,
H.P., and Salmon, E.D. (1988). Dynamic instability of individual microtubules
analyzed by video light microscopy: rate constants and transition frequencies.
J. Cell Biol. 107, 1437–1448.
Walker, R.A., Inoue, S., and Salmon, E.D. (1989). Asymmetric behavior of
severed microtubule ends after ultraviolet-microbeam irradiation of individual
microtubules in vitro. J. Cell Biol. 108, 931–937.
Walker, R.A., Pryer, N.K., and Salmon, E.D. (1991). Dilution of individual
microtubules observed in real time in vitro: evidence that cap size is small
and independent of elongation rate. J. Cell Biol. 114, 73–81.
Wargacki, M.M., Tay, J.C., Muller, E.G., Asbury, C.L., and Davis, T.N. (2010).
Kip3, the yeast kinesin-8, is required for clustering of kinetochores at meta-
phase. Cell Cycle 9, 2581–2588.
Wollman, R., Cytrynbaum, E.N., Jones, J.T., Meyer, T., Scholey, J.M., and
Mogilner, A. (2005). Efficient chromosome capture requires a bias in the
‘search-and-capture’ process during mitotic-spindle assembly. Curr. Biol.
15, 828–832.
Wordeman, L., Wagenbach, M., and von Dassow, G. (2007). MCAK facilitates
chromosome movement by promoting kinetochore microtubule turnover.
J. Cell Biol. 179, 869–879.
Zanic, M., Stear, J.H., Hyman, A.A., and Howard, J. (2009). EB1 recognizes the
nucleotide state of tubulin in the microtubule lattice. PLoS ONE 4, e7585.
ell 147, 1092–1103, November 23, 2011 ª2011 Elsevier Inc. 1103