deployment analysis and optimization of … analysis and optimization of heterogeneous networks...
TRANSCRIPT
Martínez-Vargas and Andrade EURASIP Journal on Wireless Communicationsand Networking (2015) 2015:55 DOI 10.1186/s13638-015-0276-7
RESEARCH Open Access
Deployment analysis and optimization ofheterogeneous networks under the spectrumunderlay strategyAnabel Martínez-Vargas* and Ángel G Andrade
Abstract
To meet the growing mobile traffic demand, deployment of heterogeneous networks (HetNets) is proposed as asolution to enhance network capacity. It will enable the coexistence of several systems consisting of Macro, Micro,and Femto or WiFi layers. However, the main issue is the coexistence due to mutual interference. To guarantee thatHetNet performance will not be compromised due to the interference, some deployment parameters should becontrolled, such as primary exclusion zones and density of users. In this context, the present work provides deploymentanalysis and optimization for a Macro-Femto scenario, considering interference constraints to maximize the data rate ofthe HetNet. To fulfill this, we characterize some spectrum underlay scenarios in which HetNets would be expected tooperate, setting different signal-to-interference-plus-noise ratio (SINR) thresholds. They are evaluated using a solutionprocedure based on the socio-cognitive particle swarm optimization (SCPSO) algorithm. Considering the best scenariosfound, we show deployment parameters to achieve maximum system throughput, such as density of femto-users andprimary exclusion zones of macro-users.
Keywords: Deployment parameters; Heterogeneous network; Spectrum underlay
1 IntroductionArchitecture of traditional cellular networks has beenundergoing dramatic changes due to the intense consumerdemand for mobile data. Recently, the heterogeneousnetworks (HetNets) have emerged as the network architec-ture to support the growing demand for data services. Theyhave a hierarchical architecture, comprising an overlay of amacrocell network with additional tiers of small cells (picos,femtos, or WiFi access points). This enlarges the pool ofavailable spectrum resources for mobile users, sincethey are reused across the multiple tiers in the HetNet,harnessing also an additional spectrum in unlicensedbands by integrating WiFi hotspots (femtocells) in thenetwork. The use of WiFi in conjunction with theMacrocell allows relieving congestion on it. From the aboveand the cost point of view, WiFi has become an integralpart of the operator’s strategy [1]. However, by reusingresources, potentially destructive interference in the HetNetis generated.
* Correspondence: [email protected] of Engineering, MyDCI, Autonomous University of Baja California(UABC), Blvd. Benito Juárez, Mexicali 21280, México
© 2015 Martínez-Vargas and Andrade; licenseeCreative Commons Attribution License (http://cdistribution, and reproduction in any medium,
Unlike macro base stations (macro-BSs), which areinstalled according to detail network planning, operatorshave limited control over femto base stations (femto-BSs)since they are deployed by the end-users. This leads to twokinds of interference between macro and femto cells:cross-tier (the aggressor and the victim of interferencebelong to different tiers) and intra-tier (the aggressorand the victim of interference belong to the sametier) [2]. Cognitive radio (CR) technology can addressthose issues, providing to femto-BS capabilities tosense the environment, interpret the received signalfrom the macro-BS and the surrounding femto-BSs, andintelligently allocate spectrum resources while cross-tierand the intra-tier interference are controlled. The set oftechniques to share and allocate spectrum resourcesthrough CR technology is known as dynamic spectrumaccess, where the users with low priority are known assecondary users (femtocells), whereas the membersof the prioritized user group are named primaryusers (macrocell) [3]. To access the cellular channels(or primary channels), a secondary user performsone of the following dynamic spectrum access techniques:
Springer. This is an Open Access article distributed under the terms of thereativecommons.org/licenses/by/4.0), which permits unrestricted use,provided the original work is properly credited.
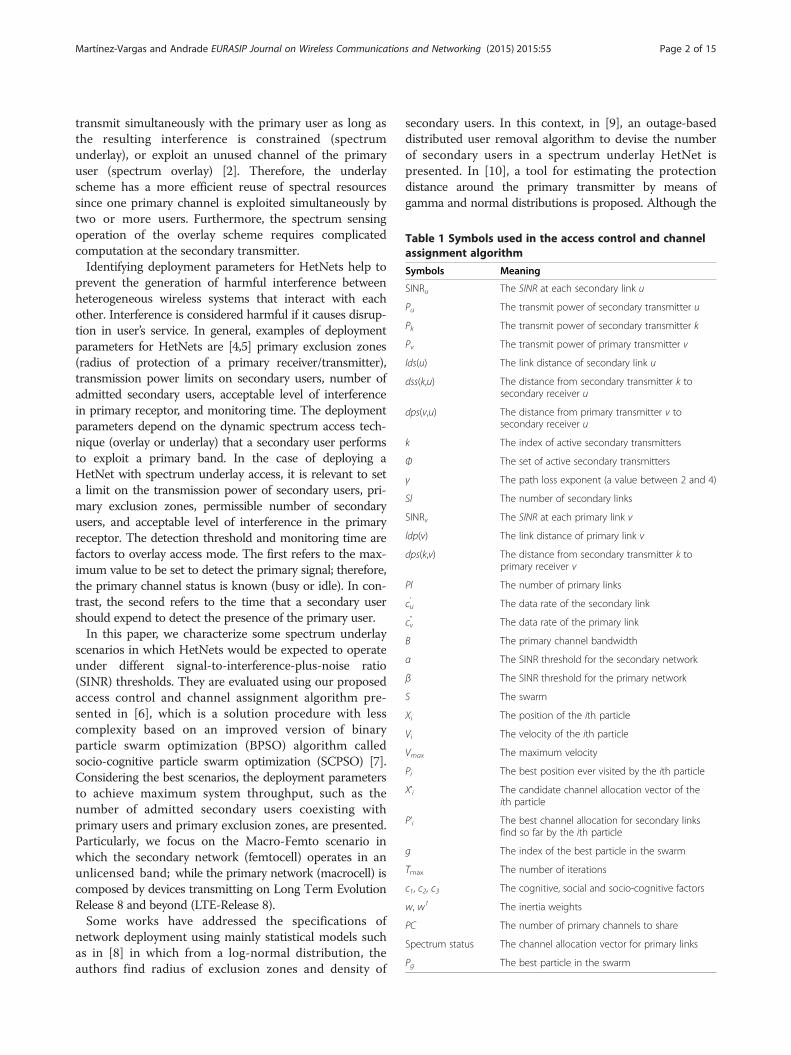
Table 1 Symbols used in the access control and channelassignment algorithm
Symbols Meaning
SINRu The SINR at each secondary link u
Pu The transmit power of secondary transmitter u
Pk The transmit power of secondary transmitter k
Pv The transmit power of primary transmitter v
lds(u) The link distance of secondary link u
dss(k,u) The distance from secondary transmitter k tosecondary receiver u
dps(v,u) The distance from primary transmitter v tosecondary receiver u
k The index of active secondary transmitters
Φ The set of active secondary transmitters
γ The path loss exponent (a value between 2 and 4)
Sl The number of secondary links
SINRv The SINR at each primary link v
ldp(v) The link distance of primary link v
dps(k,v) The distance from secondary transmitter k toprimary receiver v
Pl The number of primary links
cu’ The data rate of the secondary link
cv” The data rate of the primary link
B The primary channel bandwidth
α The SINR threshold for the secondary network
β The SINR threshold for the primary network
S The swarm
Xi The position of the ith particle
Vi The velocity of the ith particle
Vmax The maximum velocity
Pi The best position ever visited by the ith particle
X’i The candidate channel allocation vector of theith particle
P’i The best channel allocation for secondary linksfind so far by the ith particle
g The index of the best particle in the swarm
Tmax The number of iterations
c1, c2, c3 The cognitive, social and socio-cognitive factors
w, w1 The inertia weights
PC The number of primary channels to share
Spectrum status The channel allocation vector for primary links
Pg The best particle in the swarm
Martínez-Vargas and Andrade EURASIP Journal on Wireless Communications and Networking (2015) 2015:55 Page 2 of 15
transmit simultaneously with the primary user as long asthe resulting interference is constrained (spectrumunderlay), or exploit an unused channel of the primaryuser (spectrum overlay) [2]. Therefore, the underlayscheme has a more efficient reuse of spectral resourcessince one primary channel is exploited simultaneously bytwo or more users. Furthermore, the spectrum sensingoperation of the overlay scheme requires complicatedcomputation at the secondary transmitter.Identifying deployment parameters for HetNets help to
prevent the generation of harmful interference betweenheterogeneous wireless systems that interact with eachother. Interference is considered harmful if it causes disrup-tion in user’s service. In general, examples of deploymentparameters for HetNets are [4,5] primary exclusion zones(radius of protection of a primary receiver/transmitter),transmission power limits on secondary users, number ofadmitted secondary users, acceptable level of interferencein primary receptor, and monitoring time. The deploymentparameters depend on the dynamic spectrum access tech-nique (overlay or underlay) that a secondary user performsto exploit a primary band. In the case of deploying aHetNet with spectrum underlay access, it is relevant to seta limit on the transmission power of secondary users, pri-mary exclusion zones, permissible number of secondaryusers, and acceptable level of interference in the primaryreceptor. The detection threshold and monitoring time arefactors to overlay access mode. The first refers to the max-imum value to be set to detect the primary signal; therefore,the primary channel status is known (busy or idle). In con-trast, the second refers to the time that a secondary usershould expend to detect the presence of the primary user.In this paper, we characterize some spectrum underlay
scenarios in which HetNets would be expected to operateunder different signal-to-interference-plus-noise ratio(SINR) thresholds. They are evaluated using our proposedaccess control and channel assignment algorithm pre-sented in [6], which is a solution procedure with lesscomplexity based on an improved version of binaryparticle swarm optimization (BPSO) algorithm calledsocio-cognitive particle swarm optimization (SCPSO) [7].Considering the best scenarios, the deployment parametersto achieve maximum system throughput, such as thenumber of admitted secondary users coexisting withprimary users and primary exclusion zones, are presented.Particularly, we focus on the Macro-Femto scenario inwhich the secondary network (femtocell) operates in anunlicensed band; while the primary network (macrocell) iscomposed by devices transmitting on Long Term EvolutionRelease 8 and beyond (LTE-Release 8).Some works have addressed the specifications of
network deployment using mainly statistical models suchas in [8] in which from a log-normal distribution, theauthors find radius of exclusion zones and density of
secondary users. In this context, in [9], an outage-baseddistributed user removal algorithm to devise the numberof secondary users in a spectrum underlay HetNet ispresented. In [10], a tool for estimating the protectiondistance around the primary transmitter by means ofgamma and normal distributions is proposed. Although the
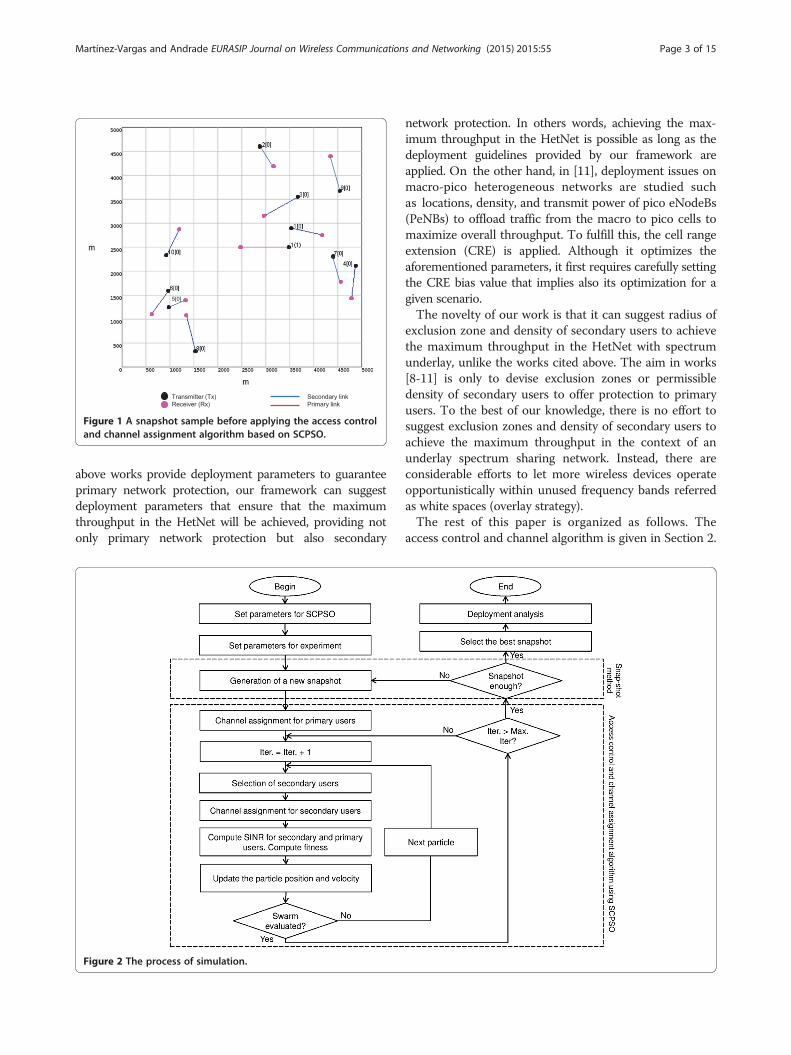
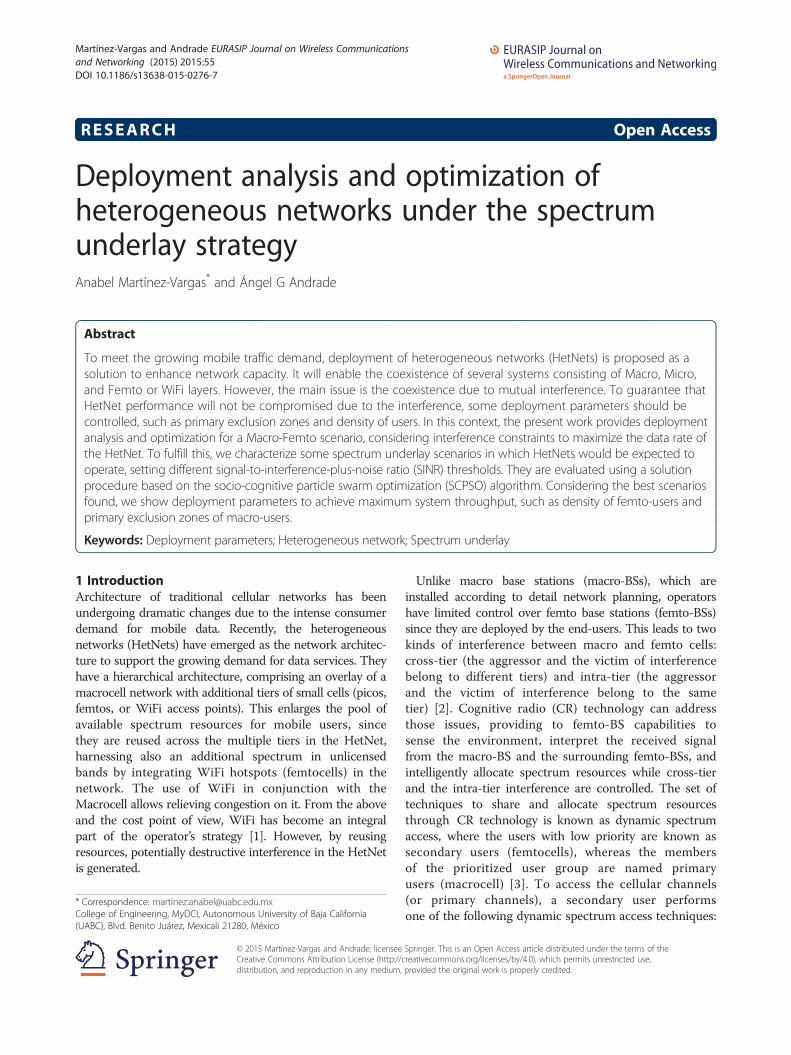
Figure 1 A snapshot sample before applying the access controland channel assignment algorithm based on SCPSO.
Martínez-Vargas and Andrade EURASIP Journal on Wireless Communications and Networking (2015) 2015:55 Page 3 of 15
above works provide deployment parameters to guaranteeprimary network protection, our framework can suggestdeployment parameters that ensure that the maximumthroughput in the HetNet will be achieved, providing notonly primary network protection but also secondary
Figure 2 The process of simulation.
network protection. In others words, achieving the max-imum throughput in the HetNet is possible as long as thedeployment guidelines provided by our framework areapplied. On the other hand, in [11], deployment issues onmacro-pico heterogeneous networks are studied suchas locations, density, and transmit power of pico eNodeBs(PeNBs) to offload traffic from the macro to pico cells tomaximize overall throughput. To fulfill this, the cell rangeextension (CRE) is applied. Although it optimizes theaforementioned parameters, it first requires carefully settingthe CRE bias value that implies also its optimization for agiven scenario.The novelty of our work is that it can suggest radius of
exclusion zone and density of secondary users to achievethe maximum throughput in the HetNet with spectrumunderlay, unlike the works cited above. The aim in works[8-11] is only to devise exclusion zones or permissibledensity of secondary users to offer protection to primaryusers. To the best of our knowledge, there is no effort tosuggest exclusion zones and density of secondary users toachieve the maximum throughput in the context of anunderlay spectrum sharing network. Instead, there areconsiderable efforts to let more wireless devices operateopportunistically within unused frequency bands referredas white spaces (overlay strategy).The rest of this paper is organized as follows. The
access control and channel algorithm is given in Section 2.
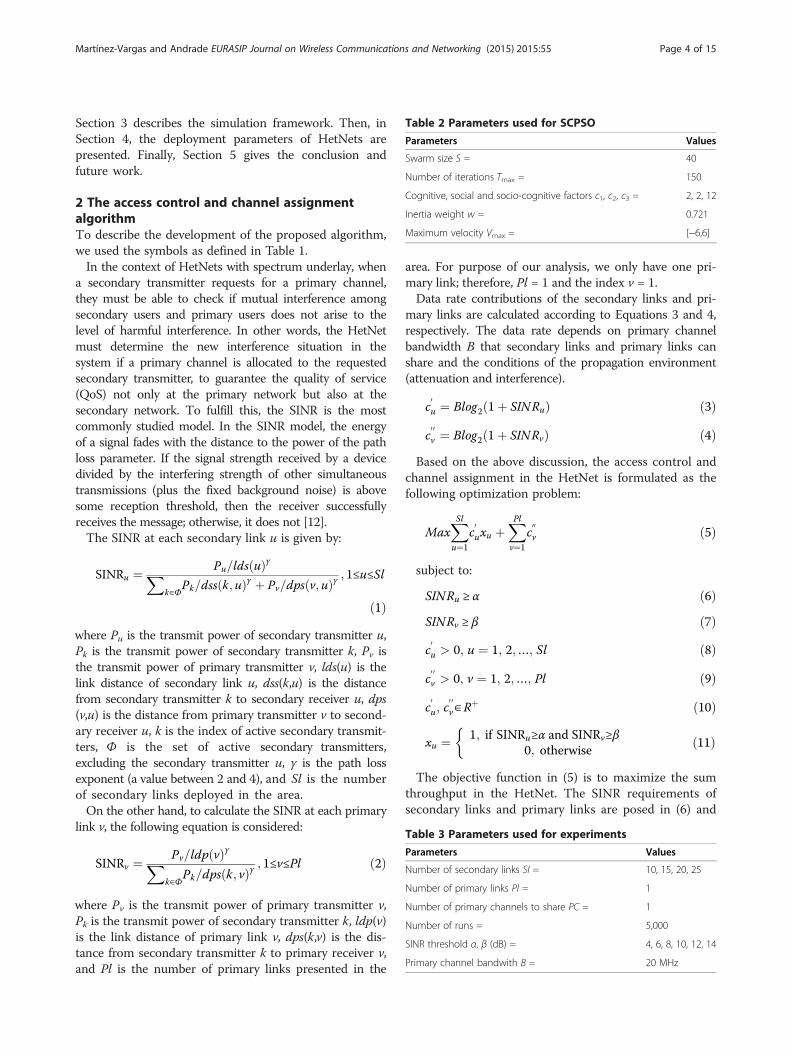
Table 2 Parameters used for SCPSO
Parameters Values
Swarm size S = 40
Number of iterations Tmax = 150
Cognitive, social and socio-cognitive factors c1, c2, c3 = 2, 2, 12
Inertia weight w = 0.721
Maximum velocity Vmax = [−6,6]
Table 3 Parameters used for experiments
Parameters Values
Number of secondary links Sl = 10, 15, 20, 25
Number of primary links Pl = 1
Number of primary channels to share PC = 1
Number of runs = 5,000
SINR threshold α, β (dB) = 4, 6, 8, 10, 12, 14
Primary channel bandwith B = 20 MHz
Martínez-Vargas and Andrade EURASIP Journal on Wireless Communications and Networking (2015) 2015:55 Page 4 of 15
Section 3 describes the simulation framework. Then, inSection 4, the deployment parameters of HetNets arepresented. Finally, Section 5 gives the conclusion andfuture work.
2 The access control and channel assignmentalgorithmTo describe the development of the proposed algorithm,we used the symbols as defined in Table 1.In the context of HetNets with spectrum underlay, when
a secondary transmitter requests for a primary channel,they must be able to check if mutual interference amongsecondary users and primary users does not arise to thelevel of harmful interference. In other words, the HetNetmust determine the new interference situation in thesystem if a primary channel is allocated to the requestedsecondary transmitter, to guarantee the quality of service(QoS) not only at the primary network but also at thesecondary network. To fulfill this, the SINR is the mostcommonly studied model. In the SINR model, the energyof a signal fades with the distance to the power of the pathloss parameter. If the signal strength received by a devicedivided by the interfering strength of other simultaneoustransmissions (plus the fixed background noise) is abovesome reception threshold, then the receiver successfullyreceives the message; otherwise, it does not [12].The SINR at each secondary link u is given by:
SINRu ¼ Pu=lds uð ÞγXk∈Φ
Pk=dss k; uð Þγ þ Pv=dps v; uð Þγ ; 1≤u≤Sl
ð1Þwhere Pu is the transmit power of secondary transmitter u,Pk is the transmit power of secondary transmitter k, Pv isthe transmit power of primary transmitter v, lds(u) is thelink distance of secondary link u, dss(k,u) is the distancefrom secondary transmitter k to secondary receiver u, dps(v,u) is the distance from primary transmitter v to second-ary receiver u, k is the index of active secondary transmit-ters, Φ is the set of active secondary transmitters,excluding the secondary transmitter u, γ is the path lossexponent (a value between 2 and 4), and Sl is the numberof secondary links deployed in the area.On the other hand, to calculate the SINR at each primary
link v, the following equation is considered:
SINRv ¼ Pv=ldp vð ÞγXk∈Φ
Pk=dps k; vð Þγ ; 1≤v≤Pl ð2Þ
where Pv is the transmit power of primary transmitter v,Pk is the transmit power of secondary transmitter k, ldp(v)is the link distance of primary link v, dps(k,v) is the dis-tance from secondary transmitter k to primary receiver v,and Pl is the number of primary links presented in the
area. For purpose of our analysis, we only have one pri-mary link; therefore, Pl = 1 and the index v = 1.Data rate contributions of the secondary links and pri-
mary links are calculated according to Equations 3 and 4,respectively. The data rate depends on primary channelbandwidth B that secondary links and primary links canshare and the conditions of the propagation environment(attenuation and interference).
c0u ¼ Blog2 1þ SINRuð Þ ð3Þ
c0 0v ¼ Blog2 1þ SINRvð Þ ð4Þ
Based on the above discussion, the access control andchannel assignment in the HetNet is formulated as thefollowing optimization problem:
MaxXSlu¼1
c0uxu þ
XPlv¼1
c00v ð5Þ
subject to:
SINRu ≥ α ð6ÞSINRv ≥ β ð7Þ
c0u > 0; u ¼ 1; 2;…; Sl ð8Þ
c0 0v > 0; v ¼ 1; 2;…; Pl ð9Þ
c0u; c
0 0v∈R
þ ð10Þ
xu ¼ 1; if SINRu≥α and SINRv≥β0; otherwise
�ð11Þ
The objective function in (5) is to maximize the sumthroughput in the HetNet. The SINR requirements ofsecondary links and primary links are posed in (6) and
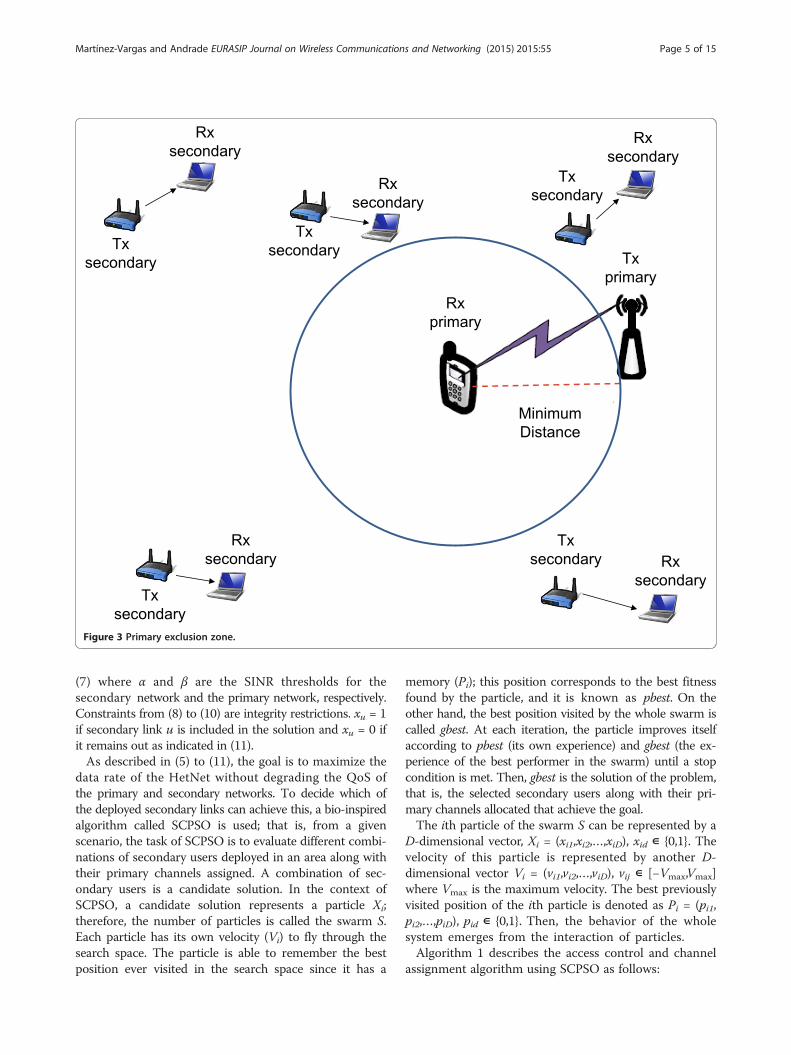
Figure 3 Primary exclusion zone.
Martínez-Vargas and Andrade EURASIP Journal on Wireless Communications and Networking (2015) 2015:55 Page 5 of 15
(7) where α and β are the SINR thresholds for thesecondary network and the primary network, respectively.Constraints from (8) to (10) are integrity restrictions. xu = 1if secondary link u is included in the solution and xu = 0 ifit remains out as indicated in (11).As described in (5) to (11), the goal is to maximize the
data rate of the HetNet without degrading the QoS ofthe primary and secondary networks. To decide which ofthe deployed secondary links can achieve this, a bio-inspiredalgorithm called SCPSO is used; that is, from a givenscenario, the task of SCPSO is to evaluate different combi-nations of secondary users deployed in an area along withtheir primary channels assigned. A combination of sec-ondary users is a candidate solution. In the context ofSCPSO, a candidate solution represents a particle Xi;therefore, the number of particles is called the swarm S.Each particle has its own velocity (Vi) to fly through thesearch space. The particle is able to remember the bestposition ever visited in the search space since it has a
memory (Pi); this position corresponds to the best fitnessfound by the particle, and it is known as pbest. On theother hand, the best position visited by the whole swarm iscalled gbest. At each iteration, the particle improves itselfaccording to pbest (its own experience) and gbest (the ex-perience of the best performer in the swarm) until a stopcondition is met. Then, gbest is the solution of the problem,that is, the selected secondary users along with their pri-mary channels allocated that achieve the goal.The ith particle of the swarm S can be represented by a
D-dimensional vector, Xi = (xi1,xi2,…,xiD), xid ∊ {0,1}. Thevelocity of this particle is represented by another D-dimensional vector Vi = (vi1,vi2,…,viD), vij ∊ [−Vmax,Vmax]where Vmax is the maximum velocity. The best previouslyvisited position of the ith particle is denoted as Pi = (pi1,pi2,…,piD), pid ∊ {0,1}. Then, the behavior of the wholesystem emerges from the interaction of particles.Algorithm 1 describes the access control and channel
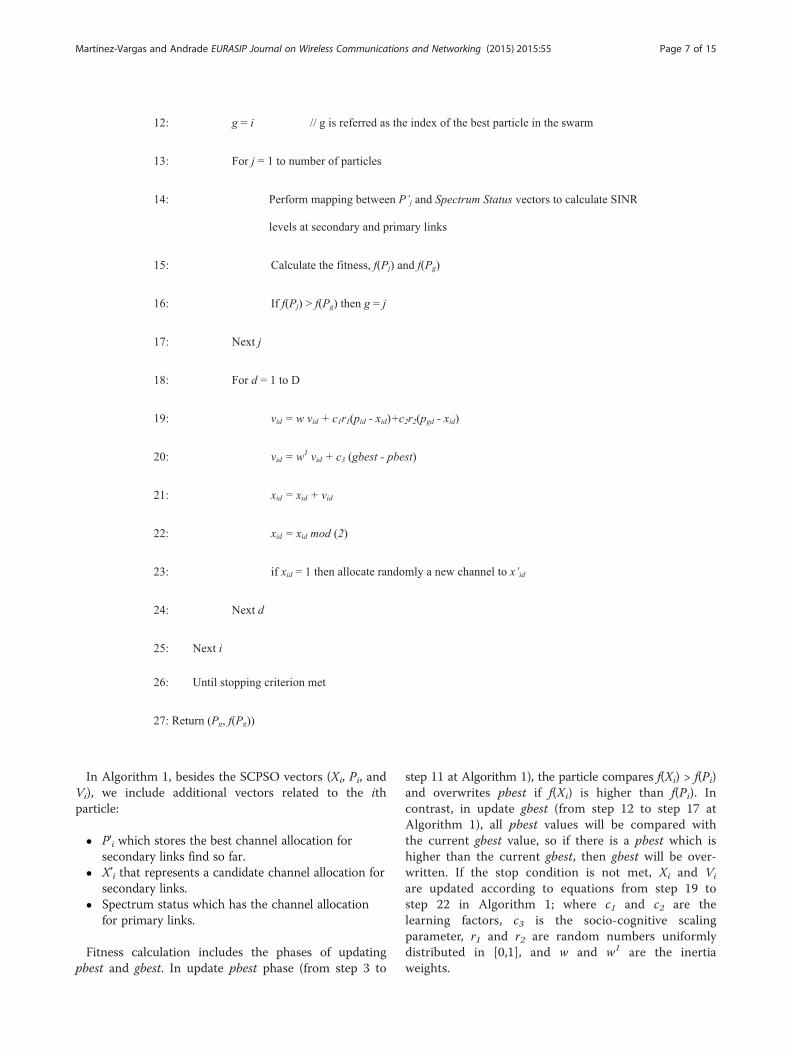
assignment algorithm using SCPSO as follows:

Martínez-Vargas and Andrade EURASIP Journal on Wireless Communications and Networking (2015) 2015:55 Page 6 of 15
Martínez-Vargas and Andrade EURASIP Journal on Wireless Communications and Networking (2015) 2015:55 Page 7 of 15
In Algorithm 1, besides the SCPSO vectors (Xi, Pi, andVi), we include additional vectors related to the ithparticle:
� P’i which stores the best channel allocation forsecondary links find so far.
� X’i that represents a candidate channel allocation forsecondary links.
� Spectrum status which has the channel allocationfor primary links.
Fitness calculation includes the phases of updatingpbest and gbest. In update pbest phase (from step 3 to
step 11 at Algorithm 1), the particle compares f(Xi) > f(Pi)and overwrites pbest if f(Xi) is higher than f(Pi). Incontrast, in update gbest (from step 12 to step 17 atAlgorithm 1), all pbest values will be compared withthe current gbest value, so if there is a pbest which ishigher than the current gbest, then gbest will be over-written. If the stop condition is not met, Xi and Vi
are updated according to equations from step 19 tostep 22 in Algorithm 1; where c1 and c2 are thelearning factors, c3 is the socio-cognitive scalingparameter, r1 and r2 are random numbers uniformlydistributed in [0,1], and w and w1 are the inertiaweights.

Figure 4 A snapshot sample after applying the access controland channel assignment algorithm based on SCPSO.
Martínez-Vargas and Andrade EURASIP Journal on Wireless Communications and Networking (2015) 2015:55 Page 8 of 15
Infeasible solutions, that is, candidate solutions whichcannot achieve one or both SINR constraints presentedin (6) and (7) are penalized by setting total particle’sfitness to zero; therefore, they are not chosen during theprocess. On the other hand, when conditions (6) and (7)are satisfied, sum data rate is performed as indicated inobjective function (5), being the total particle’s fitness.Further details and the complete implementation of oursolution procedure based on the SCPSO algorithm areprovided in [6].
3 Simulation frameworkFigure 1 shows a snapshot sample (the deployment ofsecondary links and a primary link in an instant of time)of a particular HetNet that will be analyzed by the accesscontrol and channel assignment algorithm using SCPSOto determinate the exclusion zone and the number ofselected secondary links which maximize throughput inthe HetNet. Due to the distance between different linksaffects the performance of the HetNet, we considered astochastic model for the location of the links. The stochasticgeometry [13] is a tool for analyzing the distribution of theinterference and disruptions that have the links, so that it ispossible to statistically analyze network performance. Forthis, the stochastic models focus on the analysis of a singlereceiver, or link, as shown in Figure 1, the primary receiveris placed permanently in the center of the coverage areaand its corresponding transmitter is located at a distanceof 1,000 m. The location of the secondary transmitters isbased on the spatial model point Poisson process (PPP) inwhich each node took a random location represented by apair of coordinates (ai, bi).The metrics for evaluating the performance of the
HetNet are directly related to the SINR on links.The SINR depends on many factors such as the distancebetween the desired transmitter and the desired receiver,and the set of interfering transmitters and their distancesfrom the desired receiver [14]. The SINR is consideredin this work by applying Equations (1) and (2) fromSection 2, respectively.During the simulation, several experiments are performed,
each of them characterized by a different QoS requirement(α = β), then a number of independent runs are taken byeach experiment. A run represents a new snapshot withrandom locations for secondary nodes. Consequently, ateach run, different combinations of secondary linkscoexisting with the primary link are evaluated to findout the best solution, i.e., the combination of secondarylinks that maximizes throughput in the heterogeneoussystem. After a number of runs (or snapshots) are taken,the next step is to select the best snapshot; that is, the onewith the highest throughput. Then, that snapshot isanalyzed to provide the deployment guidelines. Figure 2summarizes the aforementioned.
Some of the assumptions made for snapshots are:
� The secondary link is located in an area of 25 km2
and its distance is limited to 1,000 m.� Transmission powers of the primary and secondary
are the same.� The links require the same channel bandwidth since
they use the same type of traffic (homogeneoustraffic).
� Power attenuation due to multipath and shadowingphenomena is not considered for calculation of SINR.
� For simplicity, the SINR thresholds α and β coincide.
The parameter settings for the SCPSO algorithm areshown in Table 2.The number of experiments depends on α and β; to
analyze, in this work, six experiments are performed,each one representing a different QoS level in the system(α, β = 4, 6, 8, 10, 12, and 14 dB). At each experiment, thecases of 10, 15, 20, and 25 secondary links along with 1primary link are evaluated. The configuration parametersfor each experiment are shown in Table 3.The following section shows deployment results from
the simulation framework.
4 Deployment parameters of HetNetsThrough the simulation framework described in the lastsection, we determine the design parameters that arerequired for achieving the maximum throughput in theHetNet. The results for the primary exclusion zones andthe number of secondary users coexisting with the primaryuser are shown in the next subsections.

Martínez-Vargas and Andrade EURASIP Journal on Wireless Communications and Networking (2015) 2015:55 Page 9 of 15
4.1 Primary exclusion zonesIn the context of HetNets, interference caused by secondarytransmitters to the primary receiver should be as low aspossible. A solution proposed is to reduce the transmissionpower of the secondary users. However, this action has animpact on the capacity of the secondary network since thedesired signal is affected, decreasing the receivedSINR. Another solution is to deny transmission toany secondary node when it is in close proximity to aprimary receiver. The above is achieved by setting aprimary exclusion zone which is the radius of protectionfor a primary receiver, i.e., the minimum distance to placeone or more secondary transmitters with respect to theprimary receiver, to use simultaneously the frequencyband (see Figure 3).From Figure 3, it is assumed that each secondary
link (transmitter-receiver pair) represents a second-ary network or femtocell network. In this case, the
Figure 5 The minimum and average distances by experiment and casusers, and (d) 25 secondary users.
secondary transmitter is able to assign a communicationchannel to its secondary receiver when it requests. As-suming that in an instant of time, the secondary trans-ceiver does not have available channels to assign toits user, it can use its cognitive abilities to exploit anyof the primary channels that are assigned to the primarynetwork; so that a primary channel will be allocated to itsrequested secondary user. Under this situation, the second-ary link can exploit concurrently with the primary link thechannel, as long as a minimum distance is placed betweenthem; so that the transmission of the secondary link doesnot interfere with the transmission of the primary link.After performing the simulation framework described
in Section 3, the best snapshot is analyzed by experimentand case to set the primary exclusion zone. Supposingthat Figure 4 was the best snapshot, it shows theselected secondary links (black lines) after performingthe access control and channel assignment algorithm
e. (a) 10 secondary users, (b) 15 secondary users, (c) 20 secondary
Martínez-Vargas and Andrade EURASIP Journal on Wireless Communications and Networking (2015) 2015:55 Page 10 of 15
using SCPSO. From the ten secondary users that arerequesting for a primary channel, only four of them areselected (secondary links 2, 5, 7, 9). They maximize thethroughput of the HetNet. The selected secondary linksalong with the primary link have the same channel(channel 1). That is indicated in square and roundedbrackets for the selected secondary links and the primarylink, respectively. Then, the distance between each selectedsecondary transmitter and the primary receiver is calcu-lated. Among the calculated distances, the shortest distanceis selected, and it is considered as the radius of theexclusion zone. Distances are calculated from the locationcoordinates (ai, bi) known of each node.In this context, Figure 5a,b,c,d shows the values of the
minimum (exclusion zone) and average distance thatshould exist between the secondary transmitters and theprimary receiver for different cases (the number ofsecondary links) and conditions of SINR (the experiments).In this sense, the HetNet performance is not compromiseddue to mutual interference.The results in Figure 5a,b,c,d suggest that the
higher the QoS level in the HetNet, the longer thedistance that should be deployed the secondary trans-mitters. However, secondary users with lower trans-mission powers can transmit at a shorter distancefrom the primary receiver. Those results represent thecoverage area (primary exclusion zone) in which aprimary receiver can decode the information sent by
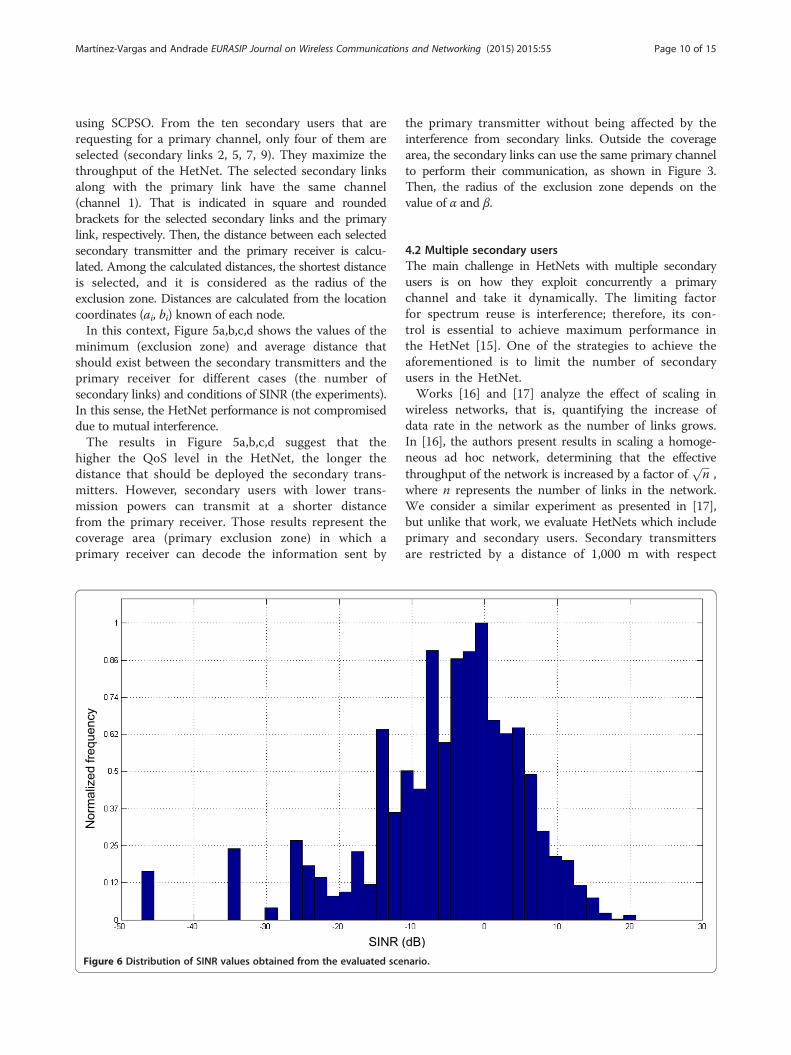
Figure 6 Distribution of SINR values obtained from the evaluated sce
the primary transmitter without being affected by theinterference from secondary links. Outside the coveragearea, the secondary links can use the same primary channelto perform their communication, as shown in Figure 3.Then, the radius of the exclusion zone depends on thevalue of α and β.
4.2 Multiple secondary usersThe main challenge in HetNets with multiple secondaryusers is on how they exploit concurrently a primarychannel and take it dynamically. The limiting factorfor spectrum reuse is interference; therefore, its con-trol is essential to achieve maximum performance inthe HetNet [15]. One of the strategies to achieve theaforementioned is to limit the number of secondaryusers in the HetNet.Works [16] and [17] analyze the effect of scaling in
wireless networks, that is, quantifying the increase ofdata rate in the network as the number of links grows.In [16], the authors present results in scaling a homoge-neous ad hoc network, determining that the effectivethroughput of the network is increased by a factor of
ffiffiffin
p,
where n represents the number of links in the network.We consider a similar experiment as presented in [17],but unlike that work, we evaluate HetNets which includeprimary and secondary users. Secondary transmittersare restricted by a distance of 1,000 m with respect
nario.

Martínez-Vargas and Andrade EURASIP Journal on Wireless Communications and Networking (2015) 2015:55 Page 11 of 15
to the secondary receiver. Additionally, our scenariodiffers from the reported in [16] in which one-hop isconsidered unlike multiple-hops as in an ad hoc network.Unlike the experiment presented in [17], our work does notevaluate the data rate of the network when the number ofsecondary links is gradually increased since the accesscontrol and channel allocation algorithm is able to selectthe set of secondary links that meet SINR restrictions.Figure 6 shows the distribution of SINR values in the
primary receiver obtained from our evaluation scenario.It is noted that SINR values are in the range from −46 to22 dB. This graph shows that the access control andchannel allocation algorithm based on SCPSO evaluatesdifferent combinations of secondary users to find thebest solution.On the other hand, Figure 7a,b,c,d shows the result of
the number of selected secondary links and averagenumber of selected secondary links that can share a
Figure 7 The number of selected secondary links by experiment andusers, and (d) 25 secondary users.
channel with the primary user. The number of selectedsecondary links is derived from the best snapshot byexperiment (SINR threshold) and case (number ofsecondary links); therefore, it corresponds to the mini-mum distances shown in Figure 5a,b,c,d. In contrast, theaverage number of selected secondary links is calculatedtaking into account the number of selected secondarylinks in each of the 5,000 runs (snapshots) by experimentand case.From Figure 7a,b,c,d, the observation is as the SINR
thresholds values increase, the number of secondaryusers that the HetNet admits to share a primary channeldecreases. On the other hand, when the SINR thresholdsvalues decrease, the HetNet can admit a greater numberof secondary users but at the cost of sacrificing QoS.The above is also true, for the average number of selectedsecondary links, except for the cases of 20 secondary usersand 25 secondary users.
case. (a) 10 secondary users, (b) 15 secondary users, (c) 20 secondary
Martínez-Vargas and Andrade EURASIP Journal on Wireless Communications and Networking (2015) 2015:55 Page 12 of 15
The benefit of the HetNet is the reuse of spectrum.However, the risks are equally important to consider, forexample to control the number of admitted secondaryusers to coexist with the primary user. If the above isnot controlled, it can lead to a ‘tragedy of the commons’in which many users try to access the same spectralresource and neither of them is able to communicatedue to the interference. A higher permissible density ofsecondary users also represents a more efficient reuse[18]. These facts show the importance for providers andregulators in the tradeoff between the permissible densityof secondary users and the SINR threshold (QoS).We will now present system performance results in
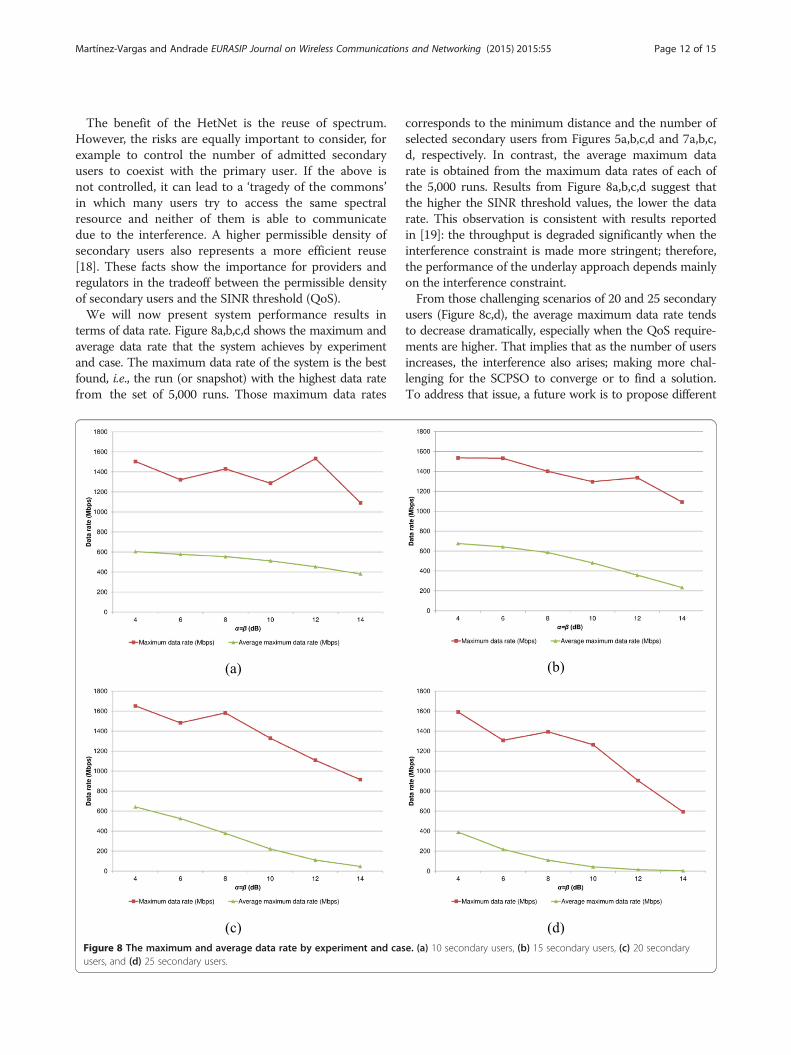
terms of data rate. Figure 8a,b,c,d shows the maximum andaverage data rate that the system achieves by experimentand case. The maximum data rate of the system is the bestfound, i.e., the run (or snapshot) with the highest data ratefrom the set of 5,000 runs. Those maximum data rates
Figure 8 The maximum and average data rate by experiment and casusers, and (d) 25 secondary users.
corresponds to the minimum distance and the number ofselected secondary users from Figures 5a,b,c,d and 7a,b,c,d, respectively. In contrast, the average maximum datarate is obtained from the maximum data rates of each ofthe 5,000 runs. Results from Figure 8a,b,c,d suggest thatthe higher the SINR threshold values, the lower the datarate. This observation is consistent with results reportedin [19]: the throughput is degraded significantly when theinterference constraint is made more stringent; therefore,the performance of the underlay approach depends mainlyon the interference constraint.From those challenging scenarios of 20 and 25 secondary
users (Figure 8c,d), the average maximum data rate tendsto decrease dramatically, especially when the QoS require-ments are higher. That implies that as the number of usersincreases, the interference also arises; making more chal-lenging for the SCPSO to converge or to find a solution.To address that issue, a future work is to propose different
e. (a) 10 secondary users, (b) 15 secondary users, (c) 20 secondary
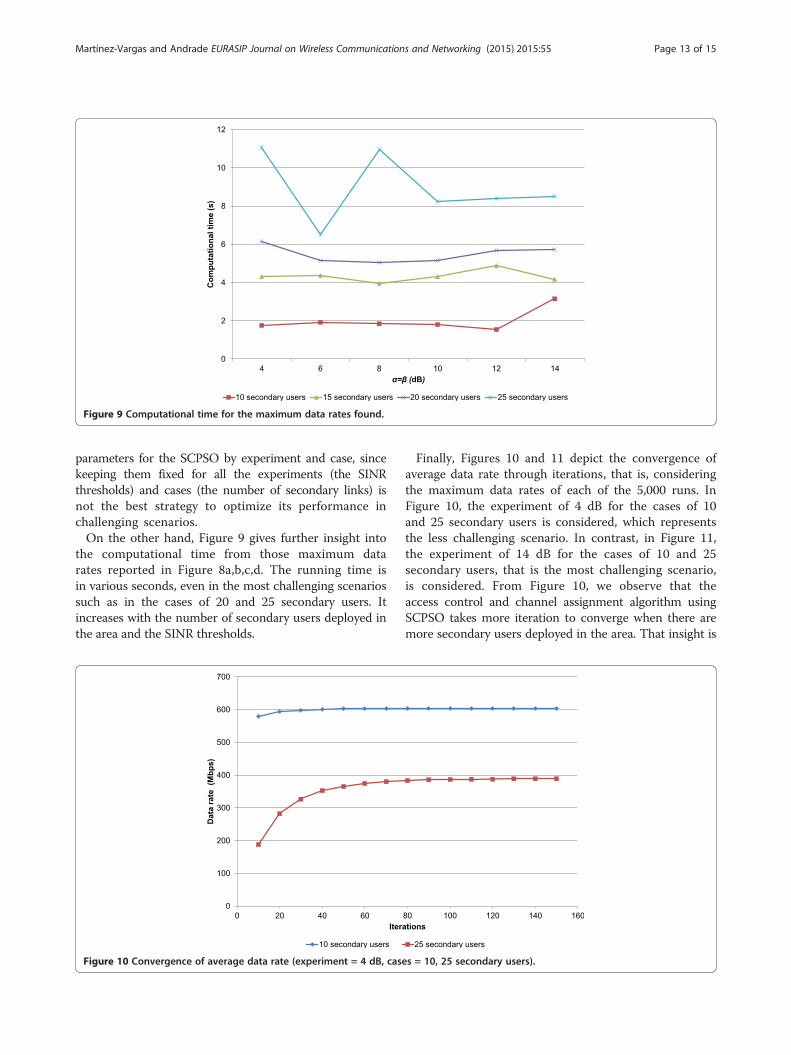
Figure 9 Computational time for the maximum data rates found.
Martínez-Vargas and Andrade EURASIP Journal on Wireless Communications and Networking (2015) 2015:55 Page 13 of 15
parameters for the SCPSO by experiment and case, sincekeeping them fixed for all the experiments (the SINRthresholds) and cases (the number of secondary links) isnot the best strategy to optimize its performance inchallenging scenarios.On the other hand, Figure 9 gives further insight into
the computational time from those maximum datarates reported in Figure 8a,b,c,d. The running time isin various seconds, even in the most challenging scenariossuch as in the cases of 20 and 25 secondary users. Itincreases with the number of secondary users deployed inthe area and the SINR thresholds.
Figure 10 Convergence of average data rate (experiment = 4 dB, case
Finally, Figures 10 and 11 depict the convergence ofaverage data rate through iterations, that is, consideringthe maximum data rates of each of the 5,000 runs. InFigure 10, the experiment of 4 dB for the cases of 10and 25 secondary users is considered, which representsthe less challenging scenario. In contrast, in Figure 11,the experiment of 14 dB for the cases of 10 and 25secondary users, that is the most challenging scenario,is considered. From Figure 10, we observe that theaccess control and channel assignment algorithm usingSCPSO takes more iteration to converge when there aremore secondary users deployed in the area. That insight is
s = 10, 25 secondary users).
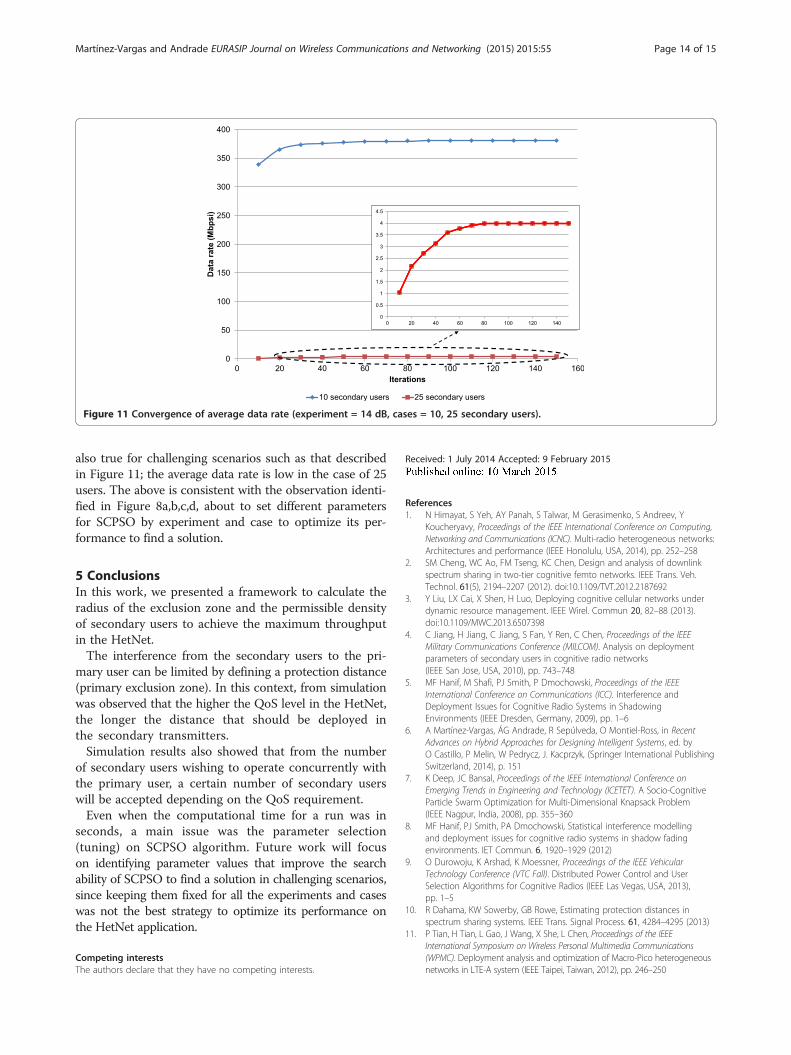
Figure 11 Convergence of average data rate (experiment = 14 dB, cases = 10, 25 secondary users).
Martínez-Vargas and Andrade EURASIP Journal on Wireless Communications and Networking (2015) 2015:55 Page 14 of 15
also true for challenging scenarios such as that describedin Figure 11; the average data rate is low in the case of 25users. The above is consistent with the observation identi-fied in Figure 8a,b,c,d, about to set different parametersfor SCPSO by experiment and case to optimize its per-formance to find a solution.
5 ConclusionsIn this work, we presented a framework to calculate theradius of the exclusion zone and the permissible densityof secondary users to achieve the maximum throughputin the HetNet.The interference from the secondary users to the pri-
mary user can be limited by defining a protection distance(primary exclusion zone). In this context, from simulationwas observed that the higher the QoS level in the HetNet,the longer the distance that should be deployed inthe secondary transmitters.Simulation results also showed that from the number
of secondary users wishing to operate concurrently withthe primary user, a certain number of secondary userswill be accepted depending on the QoS requirement.Even when the computational time for a run was in
seconds, a main issue was the parameter selection(tuning) on SCPSO algorithm. Future work will focuson identifying parameter values that improve the searchability of SCPSO to find a solution in challenging scenarios,since keeping them fixed for all the experiments and caseswas not the best strategy to optimize its performance onthe HetNet application.
Competing interestsThe authors declare that they have no competing interests.
Received: 1 July 2014 Accepted: 9 February 2015
References1. N Himayat, S Yeh, AY Panah, S Talwar, M Gerasimenko, S Andreev, Y
Koucheryavy, Proceedings of the IEEE International Conference on Computing,Networking and Communications (ICNC). Multi-radio heterogeneous networks:Architectures and performance (IEEE Honolulu, USA, 2014), pp. 252–258
2. SM Cheng, WC Ao, FM Tseng, KC Chen, Design and analysis of downlinkspectrum sharing in two-tier cognitive femto networks. IEEE Trans. Veh.Technol. 61(5), 2194–2207 (2012). doi:10.1109/TVT.2012.2187692
3. Y Liu, LX Cai, X Shen, H Luo, Deploying cognitive cellular networks underdynamic resource management. IEEE Wirel. Commun 20, 82–88 (2013).doi:10.1109/MWC.2013.6507398
4. C Jiang, H Jiang, C Jiang, S Fan, Y Ren, C Chen, Proceedings of the IEEEMilitary Communications Conference (MILCOM). Analysis on deploymentparameters of secondary users in cognitive radio networks(IEEE San Jose, USA, 2010), pp. 743–748
5. MF Hanif, M Shafi, PJ Smith, P Dmochowski, Proceedings of the IEEEInternational Conference on Communications (ICC). Interference andDeployment Issues for Cognitive Radio Systems in ShadowingEnvironments (IEEE Dresden, Germany, 2009), pp. 1–6
6. A Martínez-Vargas, ÁG Andrade, R Sepúlveda, O Montiel-Ross, in RecentAdvances on Hybrid Approaches for Designing Intelligent Systems, ed. byO Castillo, P Melin, W Pedrycz, J. Kacprzyk, (Springer International PublishingSwitzerland, 2014), p. 151
7. K Deep, JC Bansal, Proceedings of the IEEE International Conference onEmerging Trends in Engineering and Technology (ICETET). A Socio-CognitiveParticle Swarm Optimization for Multi-Dimensional Knapsack Problem(IEEE Nagpur, India, 2008), pp. 355–360
8. MF Hanif, PJ Smith, PA Dmochowski, Statistical interference modellingand deployment issues for cognitive radio systems in shadow fadingenvironments. IET Commun. 6, 1920–1929 (2012)
9. O Durowoju, K Arshad, K Moessner, Proceedings of the IEEE VehicularTechnology Conference (VTC Fall). Distributed Power Control and UserSelection Algorithms for Cognitive Radios (IEEE Las Vegas, USA, 2013),pp. 1–5
10. R Dahama, KW Sowerby, GB Rowe, Estimating protection distances inspectrum sharing systems. IEEE Trans. Signal Process. 61, 4284–4295 (2013)
11. P Tian, H Tian, L Gao, J Wang, X She, L Chen, Proceedings of the IEEEInternational Symposium on Wireless Personal Multimedia Communications(WPMC). Deployment analysis and optimization of Macro-Pico heterogeneousnetworks in LTE-A system (IEEE Taipei, Taiwan, 2012), pp. 246–250

Martínez-Vargas and Andrade EURASIP Journal on Wireless Communications and Networking (2015) 2015:55 Page 15 of 15
12. C Avin, Y Emek, E Kantor, Z Lotker, D Peleg, L Roditty, SINR diagrams:convexity and its applications in wireless networks. JACM59(18), 1–18 (2012). 34. doi:10.1145/2339123.2339125
13. RK Ganti, M Haenggi, Interference and outage in clustered wireless ad hocnetworks. IEEE Trans Inf Theor 55, 4067–4086 (2009)
14. JG Andrews, RK Ganti, M Haenggi, N Jindal, S Weber, A primer on spatialmodeling and analysis in wireless networks. IEEE Commun. Mag.48, 156–163 (2010)
15. EZ Tragos, S Zeadally, AG Fragkiadakis, VA Siris, Spectrum assignment incognitive radio networks: a comprehensive survey. IEEE Commun Surv Tutor15, 1108–1135 (2013)
16. P Gupta, PR Kumar, Towards an information theory of large networks:an achievable rate region. IEEE Trans. Inf. Theory 49, 1877–1894 (2003)
17. M Vu, N Devroye, M Sharif, V Tarokh, in Proceedings of the IEEE InternationalConference on Cognitive Radio Oriented Wireless Networks andCommunications (CrownCom) (USA, Scaling Laws of Cognitive Networks(IEEE Orlando, 2007). pp. 2–8
18. J Lee, JG Andrews, D Hong, Spectrum-sharing transmission capacity.IEEE Trans. Wirel. Commun. 10, 3053–3063 (2011)
19. A Alsarhan, A Agarwal, I Obeidat, M Bsoul, A Khasawneh, Y Kilani, Optimalspectrum utilization in cognitive network using combined spectrum sharingapproach: overlay, underlay and trading. Int J Bus Inform Syst 12, 423–454 (2013)
Submit your manuscript to a journal and benefi t from:
7 Convenient online submission
7 Rigorous peer review
7 Immediate publication on acceptance
7 Open access: articles freely available online
7 High visibility within the fi eld
7 Retaining the copyright to your article
Submit your next manuscript at 7 springeropen.com