depersonalization disorder: thinking without feeling · psychiatry research: neuroimaging section...
TRANSCRIPT

Ž .Psychiatry Research: Neuroimaging Section 108 2001 145�160
Depersonalization disorder: thinking without feeling
Mary L. Phillipsa,�, Nicholas Medforda, Carl Seniorb,Edward T. Bullmorec, John Sucklingc, Michael J. Brammerd,
Chris Andrewe, Mauricio Sierraa, Stephen C.R. Williamse,Anthony S. Davida
aDepersonalization Research Unit and Di�ision of Psychological Medicine, Institute of Psychiatry, 103 Denmark Hill,London SE5 8AF, UK
bNational Institute of Mental Health, Laboratory of Brain and Cognition, Building 10, Room 4C114, Bethesda, MD20892-1366, USA
cDepartment of Psychiatry, Uni�ersity of Cambridge, Addenbrooke’s Hospital, Cambridge CB2, 2QQ, UKdBrain Image Analysis Unit, Institute of Psychiatry, London, SE5 8AF, UK
eNeuroimaging Research, Institute of Psychiatry, London SE5 8AF, UK
Received 26 February 2001; received in revised form 21 August 2001; accepted 11 September 2001
Abstract
Ž .Patients with depersonalization disorder DP experience a detachment from their own senses and surroundingevents, as if they were outside observers. A particularly common symptom is emotional detachment from the
Ž .surroundings. Using functional magnetic resonance imaging fMRI , we compared neural responses to emotionallysalient stimuli in DP patients, and in psychiatric and healthy control subjects. Six patients with DP, 10 with
Ž .obsessive�compulsive disorder OCD , and six volunteers were scanned whilst viewing standardized pictures ofaversive and neutral scenes, matched for visual complexity. Pictures were then rated for emotional content. Bothcontrol groups rated aversive pictures as much more emotive, and demonstrated in response to these scenessignificantly greater activation in regions important for disgust perception, the insula and occipito-temporal cortex,
Ž .than DP patients covarying for age, years of education and total extent of brain activation . In DP patients, aversivescenes activated the right ventral prefrontal cortex. The insula was activated only by neutral scenes in this group. Ourfindings indicate that a core phenomenon of depersonalization � absent subjective experience of emotion � isassociated with reduced neural responses in emotion-sensitive regions, and increased responses in regions associatedwith emotion regulation. � 2001 Elsevier Science Ireland Ltd. All rights reserved.
Keywords: Depersonalized; Emotion; Functional magnetic resonance imaging
� Corresponding author. Tel.: �44-171-740-5078; fax: �44-171-740-5129.Ž .E-mail address: [email protected] M.L. Phillips .
0925-4927�01�$ - see front matter � 2001 Elsevier Science Ireland Ltd. All rights reserved.Ž .PII: S 0 9 2 5 - 4 9 2 7 0 1 0 0 1 1 9 - 6

( )M.L. Phillips et al. � Psychiatry Research: Neuroimaging Section 108 2001 145�160146
1. Introduction
Depersonalization is an alteration in the per-ception or experience of the self. Sufferers feeluncomfortably detached from their own sensesand surrounding events, as if they were outside
Žobservers American Psychiatric Association,.1994 . Such symptoms have been found in 2.4%
Ž .of the general population Ross, 1991 and 80%of psychiatric inpatients, and were severe and
Ž .persistent in 12% Brauer et al., 1970 . Deperson-alization can occur as a primary disorder, or ac-companying depression, anxiety states, and
Ž .schizophrenia Simeon et al., 1997 . It also occursin neurological conditions such as the aura to
Žtemporal lobe epilepsy Kenna and Sedman,.1965 , and in healthy individuals during fatigue,
meditation, extreme stress or after use of psy-Žchotomimetic drugs Simeon and Hollander, 1993;.Mathew et al., 1999 . Classical descriptions em-
phasize reduced, ‘numbed’, or even absent, emo-tional reactions: e.g. ‘all my emotions are blunted’Ž .Shorvon, 1946 , and ‘the emotional part of my
Ž .brain is dead’ Mayer-Gross, 1935 . There arefurther reports that the skin conductance re-sponse, a measure of autonomic function andarousal, is abnormally flattened in depersonalized
Žpatients in response to emotional stimuli Lader,.1975; Sierra et al., 2001 .
Historically, a neuropsychological basis for de-Žpersonalization has been considered Sierra and
.Berrios, 1998 , stimulated by clinical studies onpatients with neurological disorders, and psy-
Ž .chophysiological research Lader, 1975 . More re-cently, functional neuroimaging has highlightedthe role of the amygdala in the perception of fearŽ .Morris et al., 1996 , and the insula in the percep-
Ž .tion of disgust Phillips et al., 1997 and negativeŽemotions Reiman et al., 1997; Mayberg et al.,
.1999 , the latter study emphasizing the reciprocalroles of the lateral and orbito-medial prefrontalcortex and insula, amongst other regions, inchanges in depressed mood. For example, in-
Ž .creases in regional cerebral blood flow rCBF inthe insula and subgenual cingulate gyrus wereassociated with decreases in rCBF in the right
� Ž . �prefrontal cortex Brodmann area BA 47 duringinduction of sadness in healthy volunteers. Inhibi-
tion of limbic centers by the prefrontal cortexŽ .and vice versa has been inferred from the pat-tern of rCBF correlations in several human func-
Žtional neuroimaging studies Davidson and Sut-.ton, 1995; Drevets and Raichle, 1998 . Such stud-
ies have paved the way for a neurobiologicalunderstanding of a range of mood and anxietydisorders, and have been incorporated into a
Ž .model Sierra and Berrios, 1998 for the reducedemotionality in depersonalization.
To date, there have been two functional neu-roimaging studies in depersonalization. One was aresting state single photon emission computed
Ž .tomography SPECT case study showing leftŽfronto-temporal activation Hollander et al.,
.1992 . The authors interpreted this as evidencefor a common neurobiological basis for deperson-alization and OCD, in which increased frontalactivation has been associated with the urge to
Ž .ritualize Breiter et al., 1996 . The second studyŽ .employed positron emission tomography PET to
measure metabolism during performance of averbal learning task, and demonstrated reducedactivity in superior and middle temporal gyri indepersonalized patients compared with healthy
Ž .volunteers Simeon et al., 2000 . The authors sug-gested that these findings indicated underlyingfunctional abnormalities in brain regions impor-tant for an intact body schema in depersonaliza-tion disorder. No study has employed functional
Ž .magnetic resonance imaging fMRI , or examinedneural responses to emotionally salient stimuli inpatients with depersonalization disorder.
In the current study we employed fMRI todemonstrate the neural response to standardized
Ž .emotionally salient stimuli aversive scenes , usedŽpreviously in neuroimaging studies Lane et al.,
.1997; Lang et al., 1998 in six depersonalizedpatients, in contrast to that in healthy volunteersand patients with OCD. We recruited the latteras a separate group of psychiatric patients inwhom, as for patients with depersonalization, theexperience of anxiety and depression occurs fre-quently but, unlike in patients with depersonaliza-tion, the detachment from their own emotionalexperiences and emotional blunting is uncom-mon. We sought to distinguish between the neu-robiological basis of depersonalization and OCD,

( )M.L. Phillips et al. � Psychiatry Research: Neuroimaging Section 108 2001 145�160 147
predicting that, compared with both healthyvolunteers and patients with OCD, depersonal-
Ž .ized patients would: a rate aversive scenes de-picting particularly disgusting material as less
Ž .emotional; b fail to demonstrate the expectedŽincreased activation in general visual occipito-
. Žtemporal cortex Lane et al., 1997; Lang et al.,.1998 and emotion-specific regions important for
the perception of disgust, particularly the insulaŽLane et al., 1997; Phillips et al., 1997; Reiman et
.al., 1997; Mayberg et al., 1999 , in response toŽ .such scenes; c demonstrate increased activation
in regions implicated in the inhibition of theŽ .emotional response lateral prefrontal cortex
ŽDavidson and Sutton, 1995; Drevets and Raichle,.1998; Mayberg et al., 1999 .
2. Methods
2.1. Subjects
Six right-handed patients with depersonaliza-Žtion disorder American Psychiatric Association,
. Ž .1994 5 males were recruited from the inpatientand outpatient departments of the Maudsley Hos-pital. Depersonalization was defined as a score
Ž .�2 on the Present State Examination PSEŽ .Wing et al., 1974 criteria for depersonalization�
Ž .derealization maximum score�4 , and a scoreon the depersonalization taxon of the Dissociative
Ž . ŽExperiences Scale DES Bernstein-Carlson and. ŽPutnam, 1986 of 13 or more Simeon et al.,
.1998 . All patients experienced depersonalizationas their primary and most distressing syndromeand, because of the chronic nature of their ill-ness, were experiencing depersonalization at thetime of scanning. Six right-handed healthy volun-
Ž .teers 4 males were recruited from hospital staff,and were screened by psychiatric examination toensure that they neither had a history nor currentexperience of psychiatric illness, and were not
Ž .taking any psychotropic or other medication.Ten outpatients with obsessive�compulsive dis-
Ž .order OCD , but without a history or currentŽ .experience of depersonalization 8 males , were
included as psychiatric control subjects.
Table 1Subject details: demographics and psychopathology ratings
Variable Normal OCD patients DepersonalizedŽ .controls n�10 patients
Ž . Ž . Ž .n�6 DP n�6
Ž . Ž . Ž . Ž .Age years 33.8 24�48 30.9 24�42 28.3 22�34Male:female 4:2 8:2 5:1
�Ž . Ž . Ž .Years of education 19.2 15�20 14.5 10�18 15.2 10�20Ž . Ž .Duration of illness � 15.7 9�35 11 9�17
Ž .Present State � 0 3 2�4Ž .Examination 0�4
a Ž . Ž .Dissociative Experiences Scale � 19.4 2.5�68.1 31 6.4�80.4��b Ž . Ž .DES�taxon � 8.8 0�38.8 33.3 13.0�74.3
Spielberger Anxiety Scale:Ž . Ž .State � 42.0 30�61 47.2 36�59Ž . Ž .Trait � 52.9 42�75 53.0 41�64
c Ž . Ž .Beck Depression � 14.12 15.14 23.5 12.96Ž .Inventory S.D.
dŽ . Ž .YBOCS 0�40 � 27.1 18�37 �
Figures are means; numbers in parentheses refer to the range.a Ž . Ž .Dissociative Experiences Scale DES : cutoff for dissociative disorder �30 .b Ž .Depersonalization taxon of DES score depersonalization disorder �13 .c Ž .Beck Depression Inventory BDI : mild depression �10.d Ž .YBOCS: Yale�Brown Obsessive�Compulsive Scale score moderate OCD score �16 .� Ž .ANOVA P�0.05 .�� Independent t-test: P�0.05.

( )M.L. Phillips et al. � Psychiatry Research: Neuroimaging Section 108 2001 145�160148
Ratings on the Spielberger State and TraitŽ .Anxiety Scales Spielberger, 1983 , and the Beck
Ž .Depression Inventory BDI; Beck et al., 1961Žwere obtained for both patient groups see Table
.1 . Four of the depersonalized patients were tak-ing medication: three patients were taking antide-
Žpressants citalopram, fluoxetine and me-.clobemide . Two were being treated experimen-
Žtally by their psychiatrists with clozapine despite.not having true schizophrenia symptoms . Eight
OCD patients were taking antidepressant medica-Ž .tion fluoxetine, sertraline or clomipramine . Ex-
clusion criteria included a history of head injury,significant alcohol or drug abuse and, by defini-tion, a primary neurological or psychiatric dis-order.
The groups did not differ significantly in ageŽ .F �1.0; P�0.39 , although the normal con-2,19trol subjects were non-significantly older than thetwo patient groups. The normal volunteers were
Žmore educated than the patients F �3.4; P�2,19.0.05 . The range of years of education in each
subject group indicated a relatively high level ofeducation and a similar psychosocial profile ofsubjects within each group, however. The twopatient groups did not differ on years of educa-
Ž .tion t�0.09; d.f.�14; P�0.93 , duration of ill-Ž .ness t�1.65; d.f.�14; P�0.12 , or SpielbergerŽ . ŽState t�0.53; d.f.�14; P�0.60 or Trait t�
.0.14; d.f.�14; P�0.89 anxiety scales. The de-personalized patients were slightly more de-
Žpressed than the OCD patients higher scores on.the BDI , although this difference was not sig-Ž .nificant t�1.5; d.f.�14; P�0.15 . The two
patient groups did not differ in their DES scoresŽ .overall t�0.86; d.f.�11; P�0.41 , but differed
significantly in scores on the DES taxon for de-Ž .personalization t � 3.14; d.f.� 14; P� 0.007 .
This score reflected the severity of depersonaliza-tion experienced by the depersonalized and OCDpatients during scanning. After complete descrip-tion of the study to the subjects, written informedconsent was obtained.
2.2. Stimuli
ŽThirty-five color pictures of aversive scenes e.g.. Žcockroaches, wounds and 39 neutral scenes pas-
.toral scenes, household objects were chosen fromŽ .a standard set Lang et al., 1997 . Each picture
was rated by a separate group of normal volun-teers for visual complexity on a four-point scaleŽ .1� low complexity; 4�very high complexity .Twenty aversive and 20 neutral matched pictures
Žwere selected mean complexity: 2.45 vs. 2.50,.respectively; no significant difference .
2.3. Procedure
Pictures were presented on a screen 3.5 m awayfrom subjects lying in the scanner, in alternating30-s blocks in a 5-min fMRI experiment. Each
Žblock contained 10 pictures either all aversive.and, in particular, disgusting or all neutral scenes ,
each presented for 2 s, with a 1-s interstimulusŽ .interval ISI . These stimuli have been employed
in a previous study examining neural responses todifferent types of disgusting scenes in normal and
Ž .psychiatric populations Phillips et al., 2000 . Thus,five blocks of each type of picture were presentedover 5 min. Subjects decided whether the picturedepicted an outdoor or indoor scene and pressedone of two buttons accordingly with the rightthumb. These are implicit tasks with regard toemotional processing: subjects attend to the sti-muli throughout without being made aware of thenature of the study so that cerebral regions un-derlying the perception of emotions but not label-ing are activated. The order of individual stimuliwithin each block, and the starting order of the
Žblocks within each experiment aversive or neu-.tral scene first were counterbalanced across sub-
jects.
2.4. Rating of scenes
Previous studies have demonstrated that neuralresponses to emotional stimuli are dependentupon the nature of the task performed duringviewing of the stimuli, and that performance ofexplicit emotion-labeling tasks is associated withreduced limbic and increased prefrontal activa-
Žtion e.g. Critchley et al., 2000; Hariri et al.,.2000 . We did not wish subjects to become aware
that the aim of the study was to examine neuralresponses during the experience of emotion, and

( )M.L. Phillips et al. � Psychiatry Research: Neuroimaging Section 108 2001 145�160 149
thus did not request subjects to label their emo-tional experiences by rating the intensity withwhich they experienced emotion at any time dur-ing participation in the experiments inside thescanner. Instead, all subjects were re-presentedwith the scenes outside the scanner after scan-ning. Subjects rated each scene according to theintensity with which they then experienced dis-gust, fear and anxiety when viewing the scene.Subjects were requested to rate on a nine-point
Ž .intensity scale 0�nil; 8�extreme adjectives de-Ž . Žscribing disgust e.g. ‘nauseous’ , fear e.g.
. Ž .‘afraid’ , and general anxiety e.g. ‘worried’ . To-tal scores for all aversive and all neutral scenes
Ž .on each dimension disgust, fear and anxietyŽwere calculated for each subject maximum�
.480 , and an aversive�neutral difference was de-rived.
2.5. Image acquisition and analysis
Ž .Gradient echo echoplanar imaging EPI dataŽwere acquired on a GE Signa 1.5-T system Gen-
.eral Electric, Milwaukee, WI, USA retrofittedŽwith Advanced NMR hardware ANMR, Woburn,
.MA, USA at the Maudsley Hospital, London. Aquadrature birdcage headcoil was used for RFtransmission and reception. A total of 100 T�-2weighted images depicting BOLD contrastŽ .Kwong et al., 1992 were acquired over 5 minŽ .for each task at each of 14 near-axial non-con-tiguous 5-mm-thick planes parallel to the inter-
Ž .commissural AC�PC line: TE, 40 ms; TR, 3 s;in-plane resolution, 5 mm; interslice gap, 0.5 mm.This EPI dataset provided complete coverage of
Žthe temporal lobes including hippocampus and.amygdala and almost complete coverage of
frontal, occipital and parietal lobes. In the samescanning session an inversion recovery EPI datasetwas acquired at 43 near-axial 3-mm-thick planesparallel to the AC�PC line: TE, 80 ms; TI, 180ms; TR, 16 s; in-plane resolution, 1.5 mm; inter-slice gap, 0.3 mm; number of signal averages�8.This higher resolution EPI dataset provided wholebrain coverage and was later used to register thefMRI datasets acquired from each individual instandard stereotactic space.
ŽFollowing motion correction Bullmore et al.,. �1999a , periodic change in T -weighted signal in-2
Ž .tensity at the fundamental experimentally de-termined frequency of alternation between A and
Ž .B conditions �1�60 Hz was estimated by aniterated least squares fit of a sinusoidal regressionmodel to the fMRI time series observed at eachvoxel, modeling residual autocorrelation as a
Žfirst-order autoregressive process Bullmore et al.,.1996 . This model included sine and cosine waves
at the fundamental AB frequency of the experi-mental input function, parameterized by coeffi-
� 4cients �, � . The power of periodic response toŽ 2 2 .the input function was estimated by � �� ;
and fundamental power divided by its standarderror yielded a standardized test statistic, the
Ž .fundamental power quotient FPQ , at each voxel.Parametric maps representing FPQ observed ateach intracerebral voxel were constructed. In or-der to sample the distribution of FPQ under thenull hypothesis that observed values of FPQ were
Žnot determined by experimental design with few.assumptions , the 99 images observed in each
anatomical plane were randomly permuted andFPQ was estimated exactly as above in each per-muted time series. This process was repeated 10times, resulting in 10 permuted parametric mapsof FPQ at each plane for each subject.
Observed and randomized FPQ maps weretransformed into the standard space of Talairach
Ž .and Tournoux 1988 and smoothed by a two-di-mensional Gaussian filter with full width halfmaximum�11 mm. This filter size was chosen toaccommodate regional differences in brain ana-
Ž .tomy between subjects Clark et al., 1996 , andhas been employed in previous studies examining
Žneural responses to emotional stimuli e.g. Phillips.et al., 1997, 1999 . The median observed FPQ at
each intracerebral voxel in standard space wastested against a critical value of the permutationdistribution for median FPQ ascertained from the
Ž .permuted FPQ maps Brammer et al., 1997 .
2.6. Between-group comparisons
To estimate between-group differences in meanpower of functional activation, we fitted an analy-

( )M.L. Phillips et al. � Psychiatry Research: Neuroimaging Section 108 2001 145�160150
sis of covariance model at each intracerebral voxelof the standardized power maps after their co-
Ž .registration in standard Talairach space. For thecomparison between comparison subjects andpatients with depersonalization disorder, thismodel included only age as a covariate; for thecomparison between comparison subjects andpatients with OCD, the model included only totalFPQ as a covariate.
We used a non-parametric mode of inferenceon spatially informed test statistics to identifybrain regions that showed a significant differencein mean power of response between diagnosticgroups; for full details of this method and its
Ž .validation, see Bullmore et al. 1999b . Briefly,fitting an ANCOVA model at each intracerebralvoxel generated a map of the estimated coeffi-cient of the factor coding group membership; thiscoefficient, divided by its standard error, was ourstandardized voxel test statistic b. Equivalentanalysis after repeated randomization of the vec-tor coding group generated a distribution underthe null hypothesis of no between-group differ-
Ž . Ž .ence. The critical value at Prob b �0.05 CV0.05
was calculated and the voxel test statistic map was� �thresholded such that if b �CV , the value0.05
was set to b�CV ; otherwise it was set to zero.0.05This procedure generated a set of suprathresholdvoxel clusters in three dimensions, each of whichcan be described in terms of its mass or the sumof suprathreshold voxel statistics it comprises. Themass of each cluster was tested against a nulldistribution ascertained by similar thresholding ofthe voxel test statistic after randomization. Therationale for this non-parametric mode of infer-ence is that test statistics for image analysis whichincorporate spatial information, such as three-di-mensional cluster mass, are generally more pow-erful than other possible test statistics, such as b,which are informed only by data at a single voxel.
Besides greater sensitivity to between-groupdifferences in brain function that are located overa spatial neighborhood of voxels, another advan-tage of cluster-level inference compared withvoxel-level testing is that it substantially mitigatesthe multiple comparisons problem. The searchvolume or number of clusters to be tested istypically 1�2 orders of magnitude less than the
Fig. 1. The median total scores for the neutral and aversive scenes are shown on the disgust, fear and anxiety dimensions for eachŽ .subject group. The ranges of scores for the normal control subjects for the neutral scenes on each dimension were: 0�2 disgust ,
Ž . Ž . Ž . Ž . Ž .0�2 fear , and 0�6 anxiety , and for the aversive scenes, 52�251 disgust , 31�286 fear , and 31�310 anxiety . The ranges ofŽ . Ž . Ž .scores for the OCD patients for the neutral scenes were: 0�5 disgust , 0�43 fear , and 0�28 anxiety , and for the aversive scenes,
Ž . Ž . Ž .7�410 disgust , 7�421 fear , and 20�416 anxiety . The ranges of scores for the depersonalized patients for the neutral scenes wereŽ . Ž . Ž . Ž . Ž . Ž .0�21 disgust , 0�126 fear , and 0�100 anxiety , and for the aversive scenes, 0�223 disgust , 0�261 fear , and 0�250 anxiety .

( )M.L. Phillips et al. � Psychiatry Research: Neuroimaging Section 108 2001 145�160 151
number of voxels, meaning that satisfactory type 1error control can be obtained without an unac-ceptably severe risk of type 2 error. For example,
here we have consistently applied a cluster-wiseprobability threshold P�0.005. At this size oftest, and over a search volume V of 200 clusters
Table 2Normal control subjects, patients with OCD, and patients with depersonalization: generically activated brain regions to aversive vs.neutral scenes
a a a bŽRegion approx. Side x y z No. of Significance Conditions.Brodmann area voxels of signal
cincrease
( )a Normal controlsŽ .Lingual gyrus 18 R 23 �75 �7 33 0.00004
Middle occipital R 40 �72 9 4 0.001Ž .gyrus 18�19 L �38 �78 4 22 0.00002
Inferior occipital L �26 81 �2 18 0.0001Ž .gyrus 18
Inferior temporal R 43 �69 �2 14 0.000008Ž .gyrus 19
Ž .Fusiform gyrus 18 R 26 �75 �13 7 0.0001Superior temporal L �46 11 �7 6 0.0001
Ž .gyrus 38�22 �46 6 �2 4 0.002Cerebellum L �32 �67 �13 5 0.0008Middle temporal R 46 �64 9 5 0.002
Ž .gyrus 37Insula R 38 �17 15 3 0.001
( )b Patients with OCDMiddle occipital R 40 �56 �7 64 0.000006
Ž .gyrus 19 43 �67 �2 62 0.00000614 �44 �2 39 0.0000066 �81 4 17 0.0002
L �40 �72 �2 61 0.000006�23 �64 �7 40 0.000006�12 �56 4 14 0.000006
Middle temporal R 46 �61 4 63 0.000006Ž .gyrus 21�37�39 46 �53 9 26 0.0001
L �26 �69 26 38 0.000006�49 �53 9 24 0.000002
Primary visual R 3 �81 9 40 0.000006Ž .cortex 17
Posterior cingulate R 12 �44 26 32 0.000006Ž .gyrus 23�29�31 L �17 �61 15 24 0.0002
Parahippocampal gyrus R 20 �47 4 32 0.000006Superior temporal R 61 �25 4 29 0.000006
Ž .gyrus 22�39 40 �56 20 20 0.000006Middle prefrontal R 43 8 26 14 0.0005
Ž .cortex 44Ž .Precuneus 7 R 14 �36 48 11 0.00004
L �26 �50 48 9 0.00007Ž .Fusiform gyrus 18 L �23 �81 �13 10 0.000006
Thalamus R 3 �31 4 10 0.00002Insula L �43 0 9 5 0.0005

( )M.L. Phillips et al. � Psychiatry Research: Neuroimaging Section 108 2001 145�160152
Ž .Table 2 Continued
a a a bŽRegion approx. Side x y z No. of Significance Conditions.Brodmann area voxels of signal
cincrease
( )c Patients with depersonalizationVentral prefrontal R 35 25 �7 6 0.0002 A
Ž .cortex 47Middle temporal R 46 �61 9 5 0.0003 A
Ž .gyrus 37Lingual gyrus L �12 �67 �2 4 0.001 AŽ .18�19 R 20 �47 �2 4 0.002 A
Ventral prefrontal L �40 33 �2 20 0.000008 NŽ .cortex 47
Superior temporal R 26 8 �13 9 0.0001 NŽ .gyrus 38
Middle temporal L �49 �33 �2 7 0.0004 NŽ .gyrus 21
Putamen R 26 8 4 6 0.0001 NInsula L �40 3 �2 3 0.002 N
a The cluster with the largest number of voxels within each region is reported. Talairach co-ordinates refer to the voxel with theŽ .maximum FPQ fundamental power quotient in each cluster.
bAll such voxels were identified by a one-tailed test of the null hypothesis that median FPQ is not determined by experimentaldesign. The probability threshold for activation was P0.004. No regions were more active in the neutral vs. aversive scenes ineither the normal control subjects or the OCD patients.
cA, aversive; N, neutral.
or less, the expected number of false-positivetests under the null hypothesis PV is less thanone for each ANOVA map reported.
3. Results
All subjects were able to identify scenes accu-Ž .rately as either outdoor or indoor �95% .
3.1. Ratings of scenes
In view of the relatively small numbers of sub-jects within each group, we employed non-para-metric statistical analyses to compare the ratingsfor the intensity of emotion experienced whenviewing the scenes across the three subject groups.The median values and ranges of the ratings byeach subject group for all aversive and all neutralscenes on each of the three dimensions are shown
Ž . Ž . Ž .Fig. 2. Generic brain activation GBAM in the normal control subjects n�6 , OCD patients n�10 , and depersonalizedŽ . Ž . Ž . Ž .patients DP n�6 in response to aversive red voxels and neutral scenes yellow voxels . The left side of the brain is shown on
the right side of the image, and vice versa. The probability threshold for activation was P0.004. Five transverse brain slices areŽ . Ž . Ž .shown at 7 and 1.5 mm below left side , 4 mm middle , and 9.5 and 15 mm above right side the transcallosal plane. The positions
of the planes 1.5 mm below and 15 mm above the transcallosal plane are shown in the inset. In the normal control subjects, majorŽ .regions of activation in response to the aversive scenes are shown in the right insula I ; regions important for visual processing:
Ž . Ž . Ž .right lingual, bilateral middle and left inferior occipital gyri BA 18 ; and right inferior BA 19 , right middle BA 37 , and leftŽ . Ž .superior 22�38 temporal gyri, and bilateral anterior cingulate gyri BA 24 . In the OCD patients, major regions of activation in
Ž . Ž .response to the aversive scenes are shown in the left insula I ; bilateral visual regions: bilateral middle occipital gyri BA 19 andŽ . Ž . Ž .left primary visual cortex BA 17 ; right superior temporal gyrus 22 ; and right inferior frontal cortex BA 44 . Neither group
demonstrated major activation in response to the neutral scenes. In the depersonalized patients, major regions of activation areŽ . Ž . Ž .shown primarily in response to the neutral scenes in the left insula I , left inferior frontal gyrus BA 47 , and right putamen P ,
Ž . Ž .and in response to the aversive scenes in the right inferior frontal gyrus BA 47 and right middle temporal gyrus BA 37 .

( )M.L. Phillips et al. � Psychiatry Research: Neuroimaging Section 108 2001 145�160 153
Fig
.2.

( )M.L. Phillips et al. � Psychiatry Research: Neuroimaging Section 108 2001 145�160154
in Fig. 1. Normal subjects and OCD patientsrated aversive scenes with significantly higher val-ues on each dimension compared with the neutralscenes: Wilcoxon signed ranks tests for normal
Ž .subjects: z�2.20, P�0.03 disgust rating ; z�Ž .2.20, P�0.03 anxiety rating ; z�3.46, P�0.03
Ž .fear rating ; Wilcoxon signed ranks tests for OCDŽ .patients; z�2.80, P�0.005 disgust rating ; z�
Ž .2.80, P�0.005 anxiety rating ; z�2.50, P�0.01Ž .fear rating . The depersonalized patients did notrate the aversive scenes significantly differentlyfrom neutral scenes.
3.2. Generic brain acti�ation maps
Motion: A value representing the mean of sixseparate head motion measurements at the fre-
Žquency of the experimental input function theextent of rotation and translation in the x, y and
.z planes was calculated for each subject duringthe scanning procedure. There was no significantdifference in the extent of stimulus-correlatedhead motion during the experimental procedure
Žamongst the three subject groups F �1.44;2,19.P�0.26 .
3.3. Acti�ation in response to a�ersi�e and neutralscenes
In both the healthy volunteers and the OCDpatients, the aversive scenes activated the insula
Ž . Žand occipito-temporal visual cortex Table 2a,b;.Fig. 2 . The aversive scenes did not activate the
Ž .insula in the depersonalized patients Table 2c .In response to these scenes, both the depersonal-ized and OCD patients but not the healthy volun-teers demonstrated activation in right prefrontalcortex. In the OCD patients, the activation was
Ž .within the middle prefrontal cortex BA 44 , whilstin the depersonalized patients, this activation waswithin a more ventral region of the frontal cortexŽ .BA 47 . Healthy volunteers and the OCD patientsdemonstrated a greater neural response overallŽ .i.e. more activated voxels to aversive comparedwith neutral scenes; the depersonalized patients,however, had an apparently greater neural re-
Ž .sponse more activated voxels to the neutralscenes, including activation in the left insula.
3.4. Differences between groups in neural responseto a�ersi�e and neutral scenes
Globally, there was a significant differenceamongst the three groups in the total extent and
Ž .strength of activation total FPQ in response toŽthe aversive and neutral scenes F �17.52; P2,21
.�0.0001 . This was due to the significantly greatertotal FPQ of the neural response of the OCDpatients compared with either the normal control
Ž .subjects t��5.09; d.f.�10.7; P�0.0001 orŽpatients with depersonalization t��4.48; d.f.�
.14; P�0.001 . There was no significant differ-ence in total FPQ between the normal controlsubjects and patients with depersonalization.
3.4.1. Normal control subjects and patients withdepersonalization
Comparison of neural responses in normal con-trol subjects and patients with depersonalization,covarying for the effect of mismatching of ageand years of education, revealed three three-di-mensional clusters activated to a significantlygreater extent in the normal control subjects in
Žresponse to the aversive scenes P�0.01; num-ber of false-positive activated three-dimensional
.clusters �1 . These clusters of activation weredemonstrated predominantly in left insula, bilat-
Ž .eral cingulate gyrus BA 24�32 and regions in-volved in visual processing: left inferior occipitalŽ . Ž .BA 18 , lingual BA 19 and superior temporal
Ž .gyri BA 22�42 , and left inferior parietal lobuleŽ . Ž .BA 40 Table 3a .
3.4.2. Patients with depersonalization and OCDComparison of neural responses to the aversive
and neutral scenes in patients with depersonaliza-tion and OCD, covarying for the total FPQ, re-vealed three three-dimensional clusters activatedto a significantly different extent between the two
Žgroups P�0.01; number of false-positive acti-.vated three-dimensional clusters � 0 . In the
patients with OCD compared with the deperson-alized patients, in response to the aversive scenesthere was significantly greater activation in slicesin two three-dimensional clusters predominantly
Žwithin the right superior temporal gyrus BA
( )M.L. Phillips et al. � Psychiatry Research: Neuroimaging Section 108 2001 145�160 155
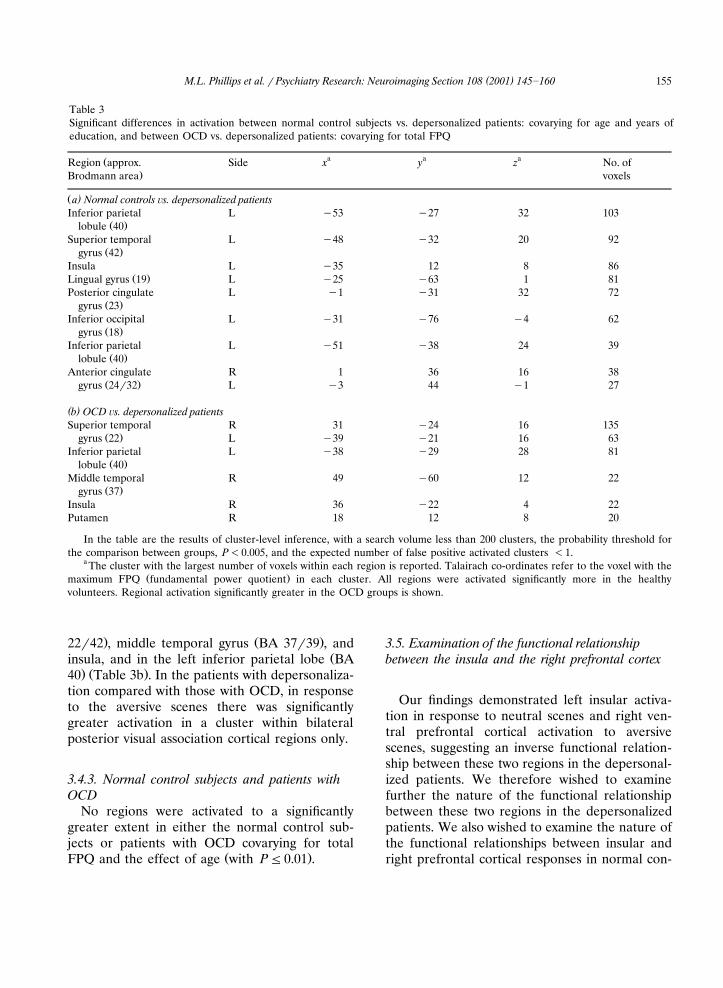
Table 3Significant differences in activation between normal control subjects vs. depersonalized patients: covarying for age and years ofeducation, and between OCD vs. depersonalized patients: covarying for total FPQ
a a aŽRegion approx. Side x y z No. of.Brodmann area voxels
Ž )a Normal controls �s. depersonalized patientsInferior parietal L �53 �27 32 103
Ž .lobule 40Superior temporal L �48 �32 20 92
Ž .gyrus 42Insula L �35 12 8 86
Ž .Lingual gyrus 19 L �25 �63 1 81Posterior cingulate L �1 �31 32 72
Ž .gyrus 23Inferior occipital L �31 �76 �4 62
Ž .gyrus 18Inferior parietal L �51 �38 24 39
Ž .lobule 40Anterior cingulate R 1 36 16 38
Ž .gyrus 24�32 L �3 44 �1 27
( )b OCD �s. depersonalized patientsSuperior temporal R 31 �24 16 135
Ž .gyrus 22 L �39 �21 16 63Inferior parietal L �38 �29 28 81
Ž .lobule 40Middle temporal R 49 �60 12 22
Ž .gyrus 37Insula R 36 �22 4 22Putamen R 18 12 8 20
In the table are the results of cluster-level inference, with a search volume less than 200 clusters, the probability threshold forthe comparison between groups, P�0.005, and the expected number of false positive activated clusters �1.
a The cluster with the largest number of voxels within each region is reported. Talairach co-ordinates refer to the voxel with theŽ .maximum FPQ fundamental power quotient in each cluster. All regions were activated significantly more in the healthy
volunteers. Regional activation significantly greater in the OCD groups is shown.
. Ž .22�42 , middle temporal gyrus BA 37�39 , andŽinsula, and in the left inferior parietal lobe BA
. Ž .40 Table 3b . In the patients with depersonaliza-tion compared with those with OCD, in responseto the aversive scenes there was significantlygreater activation in a cluster within bilateralposterior visual association cortical regions only.
3.4.3. Normal control subjects and patients withOCD
No regions were activated to a significantlygreater extent in either the normal control sub-jects or patients with OCD covarying for total
Ž .FPQ and the effect of age with P0.01 .
3.5. Examination of the functional relationshipbetween the insula and the right prefrontal cortex
Our findings demonstrated left insular activa-tion in response to neutral scenes and right ven-tral prefrontal cortical activation to aversivescenes, suggesting an inverse functional relation-ship between these two regions in the depersonal-ized patients. We therefore wished to examinefurther the nature of the functional relationshipbetween these two regions in the depersonalizedpatients. We also wished to examine the nature ofthe functional relationships between insular andright prefrontal cortical responses in normal con-

( )M.L. Phillips et al. � Psychiatry Research: Neuroimaging Section 108 2001 145�160156
trol subjects and OCD patients. We used, as ameasure of the power of response in all subjectsin each of the three groups, the peak FPQ inindex voxels defining the following regions ofgeneric activation: in the depersonalized patients,
Ž .the left insula x��40, y�3, z��2 and rightŽ .ventral prefrontal cortex x�35, y�25, z��7 ;
Žin the OCD patients, the left insula x��43,.y�0, z�9 and right middle prefrontal cortex
Ž .x�43, y�8, z�26 ; and in the normal controlŽsubjects, the right insula x�38, y��17, z�
.15 . The right prefrontal cortex was not activatedsignificantly to aversive scenes within the normalcontrol subjects. In the examination of the natureof the functional relationship between right pre-frontal cortex and insula within the normal con-trol subjects, we therefore used the peak FPQ inindex voxels defining regions of the right pre-frontal cortex that were activated to aversivescenes in the depersonalized and OCD patients,the right ventral prefrontal cortex and right mid-dle frontal cortex, respectively.
The power of response was averaged over eachindex voxel and its eight nearest neighbors in two
Ž 3dimensions total cortical volume�0.57 cm for.each region . In view of the relatively small num-
bers of subjects within each of the three subjectgroups, we used non-parametric correlation anal-yses to determine the nature of the functionalrelationships between the insula and right pre-frontal cortex in each group. Spearman’s rankcorrelation coefficients were therefore de-termined for the FPQs within insular and rightprefrontal cortical regions in each subject group.These analyses revealed a strong positive correla-tion, which just missed significance at P�0.05,between FPQs within the left insula to neutralscenes and right ventral prefrontal cortex to aver-
Žsive scenes in the depersonalized patients Spear-.man’s rank correlation coefficient �0.8; P�0.07 .
There were small positive and non-significant cor-relations between FPQs within the right insulaand right ventral prefrontal cortex in the normal
Žcontrol subjects Spearman’s rank correlation co-.efficient �0.26; P�0.1 , and between the left
insula and right middle prefrontal cortex in theŽOCD patients Spearman’s rank correlation co-
.efficient �0.38; P�0.1 . There was also a small
negative and non-significant correlation betweenthe right insula and right middle prefrontal cortex
Žin the normal control subjects Spearman’s rank.correlation coefficient��0.3; P�0.1 .
4. Discussion
We employed fMRI to investigate the neuralresponse in depersonalized patients to aversiveand neutral scenes. As predicted, depersonalizedpatients rated the aversive, disgusting scenes asless emotive than control subjects and, in re-sponse to these stimuli, showed reduced activa-tion in structures implicated in the perception ofdisgust. The patients clearly attended to the sti-muli since their ratings of location were nearlyperfect. Many depersonalized patients said thatthey saw and understood the content of the pic-tures but did not experience an emotional re-sponse.
Healthy volunteers and OCD patients, but notthe depersonalized patients, activated the insulain response to the aversive scenes, and statisticalcontrasts between the depersonalized patients andthe other groups were significant. This brain re-gion has been implicated previously in the neural
Ž .response to disgust Phillips et al., 1997 , otherŽnegative moods Reiman et al., 1997; Mayberg et
.al., 1999 and unpleasant visceral sensations suchŽ .as pain Ploghaus et al., 1999 . Paradoxically, this
area was activated in the depersonalized patients,and to a significantly greater extent comparedwith normal control subjects, when they wereshown neutral scenes. Regions important for vi-
Žsual object and spatial perception middle andsuperior temporal gyri, and the inferior parietal
.lobe were also activated to a significantly greaterextent in normal control subjects and OCDpatients compared with depersonalized patientswhen they viewed the aversive scenes. Thesefindings are similar to those of a previous study,in which depersonalized patients demonstratedreduced metabolism within middle and superiortemporal gyri during performance of a variant of
Žthe California Verbal Learning Test Simeon et.al., 2000 . Activation of occipito-temporal cortex
has been demonstrated in the response to expres-

( )M.L. Phillips et al. � Psychiatry Research: Neuroimaging Section 108 2001 145�160 157
Žsions of fear and disgust Morris et al., 1996;.Phillips et al., 1997 , and to the same unpleasant
Žscenes we used Lane et al., 1997; Lang et al.,.1998 . The increased activation in these regions in
both normal control subjects and OCD patients,in particular, middle and superior temporal gyri,may reflect the heightened visual attention andprocessing induced by aversive stimuli in thesesubjects but not the depersonalized patients. Thenormal control subjects also demonstrated sig-nificantly greater activation in bilateral anteriorcingulate gyri and the left posterior cingulategyrus in response to the aversive scenes comparedwith the depersonalized patients. These areas havebeen previously associated with the experience of
Ž .negative mood Mayberg et al., 1999 and emotio-Ž .nal appraisal Maddock, 1999 , respectively.
The OCD patients activated more brain re-gions overall than either the healthy volunteers orthe depersonalized patients. This might bethought to be due to increased visual scanning ofthe stimuli by patients with OCD compared withthe other two groups, in view of the increase inchecking behavior noted in such patients. A re-cent study has demonstrated, however, thatpatients with anxiety disorders, in whom hypervig-
Ž .ilance has been postulated Eysenck, 1992 , havesimilar viewing strategies to those of normalvolunteers when regarding different types of
Žpleasant and unpleasant scenes Freeman et al.,.2000 . Furthermore, activity in the frontal eye
fields was not detected in any of the subjects. It isalso difficult to explain the observed finding of aninverse functional relationship between right ven-tral prefrontal cortex and left insula in the deper-sonalized patients in terms of abnormal visualscanning.
Both patient groups but not normal controlsubjects demonstrated significant activation in theright prefrontal cortex in response to the aversivescenes. This activation was within a region of the
Ž .ventral prefrontal cortex BA 47 in the deperson-alized patients and within the middle prefrontal
Ž .cortex BA 44 in the OCD patients. Only in thedepersonalized patients, however, did activationwithin the right ventral prefrontal cortex occur inthe absence of activation within the insula inresponse to the aversive scenes. Furthermore, a
measure of the maximal regional power of re-sponse, the peak FPQ, within the left insula dur-ing presentation of the neutral scenes was stronglypositively correlated with the peak FPQ withinthe right ventral frontal cortex during presenta-tion of the a�ersi�e scenes in all depersonalizedpatients but not the OCD patients or normalcontrol subjects. This therefore indicates an in-verse correlation between BOLD signal changeswithin the left insula and right ventral prefrontalcortex during presentation of the aversive scenes,and an inverse functional relationship betweenthese two neural regions during presentation ofemotionally salient stimuli in the depersonalizedpatients.
Frontal regions are richly interconnected inŽprimates with ‘limbic’ structures Shi and Cassell,.1998; Cipolloni and Pandya, 1999 , and the pre-
frontal cortex has been implicated in the regula-Žtion of fear extinction in rats Morgan et al.,
.1993 . Earlier studies have demonstrated pre-frontal activation in subjects with repressive�de-
Žfensive coping styles Tomarken and Davidson,.1994 , and an inverse relationship between the
insula and right dorsolateral prefrontal cortexactivation has been demonstrated during induc-
Žtion of sadness in healthy volunteers Mayberg et.al., 1999 . Drug-induced depersonalization seems
to produce analogous effects, namely increasedinferior frontal and reduced sub-cortical blood
Ž .flow Mathew et al., 1999 . In more recent stud-ies, activation within the right middle and dor-
Ž .solateral prefrontal cortices BA 44 and 45 hasbeen reported during the performance of explicit,
Žemotion-labeling tasks Nakamura et al., 1999;.Hariri et al., 2000 , and activation within right BA
47, during the performance of emotional facialexpression delayed matching-to-sample tasksŽ .Narumoto et al., 1999 . These findings suggestthat the right prefrontal cortex, including theright ventral prefrontal cortex, may have a role inthe appraisal of emotional stimuli and regulationof emotional experience. The inverse functionalrelationship between the left insula and rightventral frontal cortex during presentation of theaversive scenes demonstrated by the depersonal-ized patients, but not by the normal control sub-jects or the OCD patients, may therefore reflect a

( )M.L. Phillips et al. � Psychiatry Research: Neuroimaging Section 108 2001 145�160158
greater regulation or ‘inhibition’ by the right ven-tral frontal cortex of the normal insular responseto emotional stimuli in the depersonalizedpatients.
It is possible that the depersonalized patientswere able to attend to the emotional content ofthe stimuli more explicitly and overtly than thenormal control subjects and OCD patients, andthereby inhibit their emotional response to thestimuli during the scanning procedure. It is, how-ever, difficult to distinguish between this possibil-ity and the alternative interpretation of the find-ings described above, in which it is suggested thatthe reduced insular response to the aversive sti-muli is associated with and may result in theemotional blunting of depersonalized patients, in-stead of occurring as a result of the performanceof explicit rather than implicit emotional tasks bythese patients. Additionally, the depersonalizedpatients were able to perform the implicit task asaccurately as the other subjects, and thereby de-monstrated an ability to attend to the non-emo-tional components of the stimuli.
Differences in medication between the deper-sonalized and the OCD patients may have con-tributed to the above findings. Patients in bothgroups were taking antidepressant medication,and two depersonalized patients were treated withclozapine for intractable depersonalization symp-
Ž .toms two were not taking any medication . In aprevious study, we reported that medicatedschizophrenic patients, although impaired com-pared with healthy volunteers on recognition ofemotive visual stimuli, did not demonstrate such amarked reduction in neural response as shown inthe depersonalized patients described here, anddid not demonstrate activation in response to
Ž .neutral stimuli Phillips et al., 1999 . It is there-fore unlikely that the pattern of behavioral andneural responses demonstrated in the depersonal-ized patients was the effect primarily of neurolep-tic medication and�or other psychiatric symp-toms.
Differences in the number of years of educa-tion, age and gender amongst the three groupsare unlikely explanations for all the differences inactivation between the patients with depersonal-ization and the two control groups. A significant
difference in years of education was found onlybetween the normal control subjects and each ofthe patient groups, and not between the twopatient groups. Despite this, there were signifi-cant differences in patterns of generic activationbetween the two patient groups, as describedabove. Furthermore, the range of years of educa-tion within each group indicated a relatively highlevel of education in all participating subjects.Although there were proportionally more malesin the depersonalized and OCD patient groupsthan the normal control subjects, all three groupscomprised mainly male subjects: 67% in the nor-mal control subjects, 80% in the OCD patients,and 83% in the depersonalized patients. Al-though it is possible that this difference in theproportion of males in the patient groups com-pared with the normal control subjects accountedfor some of the differences in generic activationto aversive scenes across the three groups, thesimilar proportion of males within the two psychi-atric populations renders it unlikely that genderdifferences were responsible for the significantdifference in generic activation to aversive scenesbetween the two patient groups.
It could be argued that structural brain abnor-malities in the depersonalized patients may havecontributed to the reduced activation in regionsnormally activated by emotionally salient stimuliobserved in depersonalized patients. Again, this isan unlikely explanation for all the results of thevoxel-wise functional analyses, since activation inspecific regions in the depersonalized patientsranged from reduced to increased depending on
Ž .the stimulus condition neutral or aversive . Inaddition, there were similar significant differencesin activation between patients with OCD, in whomstructural brain abnormalities have been demon-
Ž .strated Jenike et al., 1996 and those with deper-sonalization. Furthermore, an experienced neu-roradiologist reviewed all structural scans andnone were deemed abnormal. Nevertheless, sub-tle quantitative differences may not be excludedby this method. Detailed neuroanatomical studiesof depersonalization disorder are awaited withinterest.
Depersonalization disorder is a distressing, pre-viously under-researched psychiatric disorder in

( )M.L. Phillips et al. � Psychiatry Research: Neuroimaging Section 108 2001 145�160 159
which patients frequently report flattening ofemotional experience. This is the first study toexamine the neural correlates of cognitive-emo-tional processing in patients with this disorder.Our findings confirm the presence of impairedbehavioral and neural responses to emotionallysalient stimuli in patients with depersonalizationdisorder, and they also suggest a plausible neuralmechanism for the abnormality in emotion per-ception demonstrated in these patients. The studyhighlights the need for future studies examiningneural responses to emotional stimuli in largergroups of depersonalized patients, and the devel-opment of treatment strategies employing tech-niques to optimize the perception and experienceof emotion in these patients.
Acknowledgements
This work was supported by grants from theCol WW Pilkington, Cecil Pilkington and APPilkington Pilozzo Charitable Trusts and theMedical Research Council.
References
American Psychiatric Association, 1994. Diagnostic and Statis-tical Manual of Mental Disorders, 4th ed. APA, Washing-ton, DC.
Beck, A.T., Ward, C.H., Mendelson, M., Mock, J., Erbaugh, J.,1961. An inventory for measuring depression. Archives ofGeneral Psychiatry 4, 561�571.
Bernstein-Carlson, E.M., Putnam, F.W., 1986. Development,reliability and validity of a dissociation scale. Journal ofNervous and Mental Disease 174, 727�735.
Brammer, M., Bullmore, E., Simmons, A., 1997. Generic brainactivation mapping in functional magnetic resonance imag-ing: a non-parametric approach. Magnetic ResonanceImaging 15, 763�770.
Brauer, R., Harrow, M., Tucker, G.J., 1970. Depersonalizationphenomena in psychiatric patients. British Journal of Psy-chiatry 117, 509�515.
Breiter, H.C., Rauch, S.L., Kwong, K.K., Baker, J.R., Weiss-koff, R.M., Kennedy, D.N., Kendrick, A.D., Davis, T.L.,Jiang, A., Cohen, M.S., Stern, C.E., Belliveau, J.W., Baer,L., O’Sullivan, R.L., Savage, C.R., Jenike, M.A., Rosen,B.R., 1996. Functional magnetic resonance imaging ofsymptom provocation in obsessive�compulsive disorder.Archives of General Psychiatry 49, 595�606.
Bullmore, E., Brammer, M., Williams, S., 1996. Statisticalmethods of estimation and inference for functional MR
image analysis. Magnetic Resonance in Medicine 35,261�277.
Bullmore, E., Brammer, M., Rabe-Hesketh, S., 1999a. Meth-ods for the diagnosis and treatment of stimulus correlatedmotion in generic brain activation studies using fMRI.Human Brain Mapping 7, 38�48.
Bullmore, E.T., Suckling, J., Overmeyer, S., Rabe-Hesketh, S.,Taylor, E., Brammer, M.J., 1999b. Global, voxel and clustertests, by theory and permutation, for a difference betweentwo groups of structural MR images of the brain. IEEETransactions on Medical Imaging 18, 32�42.
Cipolloni, P.B., Pandya, D.N., 1999. Cortical connections ofthe frontoparietal opercular areas in the rhesus monkey.Journal of Comparative Neurology 403, 431�458.
Clark, V.P., Keil, K., Maisog, J.M., Courtney, S., Ungerleider,L.G., Haxby, J.V., 1996. Functional magnetic resonanceimaging of human visual cortex during face-matching: acomparison with positron emission tomography. Neu-roimage 4, 1�15.
Critchley, H., Daly, E., Phillips, M., Brammer, M., Bullmore,E., Williams, S., Van Amelsvoort, T., Robertson, D., David,A., Murphy, D., 2000. Explicit and implicit neural mecha-nisms for processing of social information from facial ex-pressions: a functional Magnetic Resonance Imaging study.Human Brain Mapping 9, 93�105.
Davidson, R.J., Sutton, K., 1995. Affective neuroscience: theemergence of a discipline. Current Opinions in Neurobi-ology 5, 217�224.
Drevets, W.C., Raichle, M.E., 1998. Reciprocal suppression ofregional cerebral blood flow during emotional versus highercognitive processes: implications for interactions betweenemotion and cognition. Cognition and Emotion 12, 353�385.
Eysenck, M.W., 1992. Anxiety: The Cognitive Perspective.Lawrence Erlbaum Associates, Inc, Hillsdale, NJ.
Freeman, D., Garety, P.A., Phillips, M.L., 2000. An examina-tion of hypervigilance for external threat in individuals withgeneralized anxiety disorder and individuals with persecu-tory delusions using visual scan paths. Quarterly Journal ofExperimental Psychology 53A, 549�567.
Hariri, A.R., Bookheiner, S., Mazziotta, J.C., 2000. Modulat-ing emotional responses: effects of a neocortical network ofthe limbic system. NeuroReport 11, 43�48.
Hollander, E., Carrasco, J.L., Mullen, L.S., Trungold, S., De-Caria, C.M., Towey, J., 1992. Left hemispheric activation indepersonalization disorder: a case report. Biological Psychi-atry 31, 1157�1162.
Jenike, M.A., Breiter, H.C., Baer, L., Kennedy, D.N., Savage,C.R., Olivares, M.J., O’Sullivan, R.L., Shera, D.M., Rauch,S.L., Keuthen, N., Rosen, B.R., Caviness, V.S., Filipek,P.A., 1996. Cerebral structural abnormalities inobsessive�compulsive disorder: a quantitative morphomet-ric magnetic resonance imaging study. Archives of GeneralPsychiatry 53, 625�632.
Kenna, J.C., Sedman, G., 1965. Depersonalisation in temporallobe epilepsy and the organic psychoses. British Journal ofPsychiatry 111, 293�299.
Kwong, K.K., Belliveau, J.W., Chesler, D.A., Goldberg, I.E.,

( )M.L. Phillips et al. � Psychiatry Research: Neuroimaging Section 108 2001 145�160160
Weisskoff, R.M., Poncelet, B.P., Kennedy, D.N., Hoppel,B.E., Cohen, M.S., Turner, R., Cheng, H.-M., Brady, T.J.,Rosen, B.R., 1992. Dynamic magnetic resonance imaging ofhuman brain activity during primary sensory stimulation.Proceedings of the National Academy of Sciences, USA 89,5675�5679.
Lader, M.H., 1975. The Psychophysiology of Mental Illness.Routledge & Kegan Paul, London.
Lane, R.D., Reiman, E.M., Bradley, M.M., Lang, P.J., Ahern,G.L., Davidson, R.J., Schwartz, G.E., 1997. Neuroanatomi-cal correlates of pleasant and unpleasant emotion. Neu-ropsychologia 35, 1437�1444.
Lang, P.J., Bradley, M.M., Cuthbert, B.N., 1997. InternationalŽ .Affective Picture System IAPS . NIMH Center for the
Study of Emotion and Attention.Lang, P.J., Bradley, M.M., Fitzsimmons, J.R., 1998. Emotional
arousal and activation of the visual cortex: an fMRI analy-sis. Psychophysiology 35, 199�210.
Maddock, R.J., 1999. The retrosplenial cortex and emotion:new insights from functional neuroimaging of the humanbrain. Trends in Neuroscience 22, 310�316.
Mathew, R.J., Wilson, W.H., Chiu, N.Y., Tirkington, T.G.,Degrado, T.R., Coleman, R.E., 1999. Regional cerebralblood flow and depersonalization after tetrahydrocannabi-nol administration. Acta Psychiatrica Scandinavica 100,67�75.
Mayberg, H.S., Liotti, M., Brannan, S.K., McGinnis, S.,Mahurin, R.K., Jarabek, P.A., Silva, A., Tekell, J.L., Martin,C.C., Lancaster, J.L., Fox, P.T., 1999. Reciprocallimbic�cortical function and negative mood: convergingPET findings in depression and normal sadness. AmericanJournal of Psychiatry 156, 675�682.
Mayer-Gross, W., 1935. On depersonalization. British Journalof Medical Psychology 15, 103�122.
Morgan, M.A., Romanski, L.M., LeDoux, J.E., 1993. Extinc-tion of emotional learning: contribution of medial pre-frontal cortex. Neuroscience Letters 163, 109�113.
Morris, J., Frith, C., Perret, D., Rowland, D., Young, A.,Calder, A., Dolan, R., 1996. A differential neural responsein the human amygdala to fearful and happy facial expres-
Ž .sions. Nature 383 31 , 812�815.Nakamura, K., Kawashima, R., Ito, K., Sugiura, M., Kato, T.,
Nakamura, A., Hatano, K., Nagumo, S., Kubota, K., Fukuda,H., Kojima, S., 1999. Activation of the right inferior frontalcortex during assessment of facial emotion. Journal ofNeurophysiology 82, 1610�1614.
Narumoto, J., Yamada, H., Iidaka, T., Sadato, N., Fukui, K.,Itoh, H., Yonekura, Y., 1999. Brain regions involved inverbal or non-verbal aspects of facial emotion recognition.NeuroReport 11, 2571�2576.
Phillips, M.L., Young, A.W., Senior, C., Brammer, M., An-drew, C., Calder, A.J., Bullmore, E.T., Perrett, D.I., Row-land, D., Williams, S.C.R., Gray, J.A., David, A.S., 1997. Aspecific neural substrate for perception of facial expres-sions of disgust. Nature 389, 495�498.
Phillips, M.L., Williams, L., Senior, C., Bullmore, E.T.,Brammer, M.J., Andrew, C., Williams, S.C.R., David, A.S.,1999. A differential neural response to threatening and
non-threatening negative facial expressions in paranoid andnon-paranoid schizophrenics. Psychiatry Research: Neu-roimaging 92, 11�31.
Phillips, M.L., Marks, I.M., Senior, C., Lythgoe, D., O’Dwyer,A.-M., Meehan, O., Williams, S.C.R., Brammer, M.J., Bull-more, E.T., McGuire, P.K., 2000. A differential neuralresponse in obsessive�compulsive patients with washingcompared with checking symptoms to disgust. PsychologicalMedicine 30, 1037�1050.
Ploghaus, A., Tracey, I., Gati, J.S., Gati, J.S., Clare, S., Menon,R.S., Matthews, P.M., Rawlins, J.N.P., 1999. Dissociatingpain from its anticipation in the human brain. Science 284,1979�1981.
Reiman, E.M., Lane, R.D., Ahern, G.L., Scwartz, G.E., David-son, R.J., Friston, K.J., Yun, L.S., Chen, K., 1997. Neu-roanatomical correlates of externally and internally gener-ated human emotion. American Journal of Psychiatry 154,918�925.
Ross, C.A., 1991. Epidemiology of multiple personality anddissociation. Psychiatric Clinics of North America 14,503�517.
Shi, C.J., Cassell, M.D., 1998. Cortical, thalamic, and amyg-daloid connections of the anterior and posterior insularcortices. Journal of Comparative Neurology 399, 440�468.
Shorvon, H.J., 1946. The depersonalization syndrome.Proceedings of the Royal Society of Medicine 39, 779�792.
Sierra, M., Berrios, G.E., 1998. Depersonalization: neurobio-logical perspectives. Biological Psychiatry 44, 898�908.
Sierra M., Senior, C., Dalton, J., McDonough, M., Bond, A.,Phillips, M.L., O’Dwyer, A.M., David, A.S., 2001. Au-tonomic Response in Depersonalisation Disorder. Submit-ted for publication.
Simeon, D., Hollander, E., 1993. Depersonalization disorder.Psychiatric Annals 23, 382�388.
Simeon, D., Gross, S., Guralnik, O., Stein, D.J., Schmeidler, J.,Hollander, E., 1997. Feeling unreal: 30 cases of DSM-III-Rdepersonalization disorder. American Journal of Psychiatry154, 1107�1113.
Simeon, D., Guralnik, O., Gross, S., 1998. The detection andmeasurement of depersonalization disorder. Journal ofNervous and Mental Disease 186, 536�542.
Simeon, D., Guralnik, O., Hazlett, E.A., Spiegel-Cohen, J.,Hollander, E., Buchsbaum, M.S., 2000. Feeling unreal: aPET study of depersonalization disorder. American Journalof Psychiatry 157, 1782�1788.
Spielberger, C.D., 1983. Manual for the State�Trait AnxietyŽ .Inventory STAI . Consulting Psychologists Press, Palo Alto,
CA.Talairach, J., Tournoux, P., 1988. Co-planar Stereotactic Atlas
of the Human Brain. Thieme, Stuttgart.Tomarken, A.J., Davidson, R.J., 1994. Frontal brain activation
in repressors and nonrepressors. Frontal brain activation inrepressors and nonrepressors. Journal of Abnormal Psy-chology 103, 339�349.
Wing, J.K., Cooper, J.E., Sartorius, N., 1974. Measurementand Classification of Psychiatric Symptoms. CambridgeUniversity Press, Cambridge.