deped region 02 annual reportregion2.deped.gov.ph/wp-content/uploads/2015/08/annual... · web...
TRANSCRIPT

58
2013DepEd Region 02 Annual Report
Introduction
As the newly appointed Officer-In-Charge at the Office of the
Director IV/Regional Director in this beautiful region, I am overjoyed
with the impression that I am accepted and I belong. The feeling of
acceptance and belongingness is coupled with pride as I take honor in
presenting this document which contains the performances and
accomplishments of DepEd Region 02, both Physical and Financial, for
the year just ended.
This book contains the region’s targets, accomplishments,
variances and reasons thereof in terms of programs’ and projects’
implementation anchored on its Goal and mandates, as indicated in the
Organizational Performance Indicators Framework.
Further, it also shows the performance contract for the year 2014
inclusive of resources, governance and other essential education inputs.
Atty. SEBASTIAN G. TAYABAN Chief Administrative Officer
OIC, Office of the Director IV/Regional Director
PIX NI RD

58
2013DepEd Region 02 Annual Report
PrefaceThe Department of Education, Cagayan Valley Region, with the
stewardship of Lourdes G. Angoluan, Ph.D., CESO III, Director III and
Officer-Incharge, Office of the Director IV, and Corazon T. Barrientos,
Ed.D., CESO IV and Officer-Incharge, Office of the Director III together
with the Schools Division Superintendents and Assistant Schools
Division Superintendents, school officials, teachers, parents, local
community leaders and civic minded individuals, envisions an
organization of culture and excellence. DepED 02 continues to soar high
and achieve remarkable and significant accomplishments through
empowered staff that are gifted with creative insights, focused on the
vision and mission. With the concerted efforts of all education
stakeholders it is proud that the Child-Friendly School System alongside
good governance transports the agency onward the delivery of quality
basic education to its Learners.
The implementation of the Medium Term Philippine Development
Plan (MTPDP) 2006-2010 which is anchored on 2015 EFA (Education
for All) Goal of providing access to basic education, DepED Region 02
is motivated, full of vibrant in implementing laudable programs and
projects that sustain the performance gained and to further elevate to
higher plane the areas which need significant improvement.
With the aggregate budget of Eleven Billion Three Hundred Ninety
Nine Million Three Hundred Fifteen Thousand Pesos, as released and
published in the General Appropriations Act (GAA) Book for FY 2013,
the agency was able to achieve the overarching goal and mandate to bring
education to the in-school and out-of-school youth.

58
2013DepEd Region 02 Annual Report
Accomplishments vis-à-vis targets for the year 2013 are presented
in this book for the information of all stakeholders. .
Table of Contents
Item Subject Page
1 Vision 4
2 Mission 4
3 Performance Covenant 5
4 Profile of Cagayan Valley Region 6
5 The Regional Management Committee 7
6 The Regional Executive Committee 8
7 Basic Education Data 9
8 DepED Logical Framework 11
9 Goal, Strategic Directions 12
10 Major Final Outputs:
MFO 2 – Basic Education Services 13
Education Governance 21
MFO 3 – Regulatory and Developmental Services
For Private Schools
25
11 Education Outcomes/Key Performance Indicators:
Elementary 26
Secondary 38
12 Programs, Activities, Projects 46
13 2013 Operational Budget 54
14 Golden Harvests 56
15 2014 Performance Contract 57

58
2013DepEd Region 02 Annual Report
The Cagayan Valley Region adopts the DepED Vision:
We dream of Filipinoswho passionately love their countryand whose values and competencies
enable them to realize their full potentialand contribute meaningfully to building the nation.
As a learner-centered public institution,the Department of Educationcontinuously improves itself
to better serve its stakeholders.
and Mission:
To protect and promote the right of every Filipino to quality, equitable, culture-based, and complete basic education where:
Students learn in a child-friendly, gender-sensitive, safe, and motivating environment
Teachers facilitate learning and constantly nurture every learner
Administrators and staff, as stewards of the institution, ensure an enabling and supportive environment for effective learning to happen

58
2013DepEd Region 02 Annual Report
Family, community, and other stakeholders are actively engaged and share responsibility for developing life-long learners
Performance Covenant
L- evitate the level of education outcomes and outputs;
G –enerate the unwavering support of all stakeholders in Region 02; and
A -chieve the goal of EFA alongside MDG and BESRA.
where
C -anons of the Agency are strictly observed;
T-raits of altruistic public servants are exemplified; that
B-rought out the best in education personnel and leaders in region 2.

58
2013DepEd Region 02 Annual Report
The Cagayan Valley Region
Region 02 or the Cagayan Valley Region is composed of five
provinces: Batanes, Cagayan, Isabela, Nueva Vizcaya and Quirino; one
independent city, and three component cities. It has 89 municipalities,
2,311 barangays and 10 congressional districts spread over a land area of
26,857 km2.
Based from the 2010 census, region 02 has a total population of
3,361,967 with an annual population growth rate of 1.62 percent.
195,741 students and 508,954 pupils are currently enrolled in the 534
public and private secondary schools and 2,550 public and private
elementary schools in the region. Additionally, DepED Region 02 has
nine schools divisions and 143 school districts.
Among the provinces in the Philippines, Batanes has the least
population recorded at 16,604.

58
2013DepEd Region 02 Annual Report
The Management Committee
The Executive Committee
WIVINA B. GONZALES, CESO VISchools Division Superintendent
Batanes
JESUS B. MAGGAY, CESO VAssistant Schools Division Superintendent
OIC, Office of the Schools Division SuperintendentCagayan
JESS L. AMIN, Ph.D.Assistant Schools Division Superintendent
OIC, Office of the Schools Division SuperintendentCauayan City
GILBERT N. TONG, Ph.D., CESO VAssistant Schools Division Superintendent
OIC, Office of the Schools Division SuperintendentTuguegarao City
REYNALDA R. BANGUNAN, CESO VSchools Division Superintendent
Quirino
BENJAMIN D. PARAGAS, Ph.D.Schools Division Superintendent
Nueva Vizcaya
EDNA A. PASAMONTE, Ph.D.Assistant Schools Division Superintendent
OIC, Office of the Schools Division SuperintendentIsabela
CESAR O. ADAOAG, CESO VSchools Division Superintendent
Santiago city
LOURDES G. ANGOLUAN, Ph.D., CESO IVDirector III/Assistant Regional Director
OIC, Office of the Director IV/Regional Director(Ret. on December 1, 2013)
FELIPE L. MARALLAGChief Administrative OfficerBudget and Finance Division
HORTENCIA P. CALVANChief Education Supervisor
Alternative Learning System Division
JOSELITO NARAG, Ph.D.Education Program Supervisor
OIC, Office of the Chief Educ. Program SupervisorPhysical Educ. & Sch. Sports Division
LEONCIO P. LUMABAN, Ph.D.Chief Education Supervisor
Secondary Education Division
NORMA C. GUILLERMO, Ph.D.Chief Education Supervisor
Elementary Education Division
CARIDAD B. TAACA Chief Administrative Officer
Administrative Division(deceased December 20, 2013)
CORAZON T. BARRIENTOS, Ed.D., CESO IVSchools Division Superintendent
OIC, Office of the Director III/Asst. Regional Director
DENIZON P. DOMINGO, Ph.D.Chief Education Supervisor
OIC, Office of the Schools Division SuperintendentCity of Ilagan

58
2013DepEd Region 02 Annual Report
The Regional Executive Committee (ExeCom) is chaired still by the Regional Director with the firm support of the Assistant Regional Director and the Chiefs of Divisions who are members of the Management Committee (ManCom). Other members are the following section/unit heads:
Administrative Division
Flora M. Baniqued, Ph.D.Administrative Officer V
Cash Section
Atty. Jose Mario M. MacarilayAttorney III
Legal Section
Ms. Jocelyn C. De PoloniaAdministrative Officer V
Personnel Section
Mr. Ronald A. PerlasAdministrative Officer V
Records Section
Mr. Jaime M. ColasAdministrative Officer V
Supply Section
Budget and Finance DivisionMr. Rogie A. Sion
Accountant IIIAccounting Section
Ms. Norma F. BalisiAdministrative Officer V
Budget Section
Ms. Myline D. LuquingAccountant I
Payroll Services Unit
Directorate
Mr. Basilio C. BacuyagEducation Program Supervisor IIPhysical Facilities Coordinator
Ms. Ma. Theresa F. TamayaoSenior Education Program SpecialistOfficer-In-Charge, Planning Unit
Jean M. Solomon, MDMedical Officer IV
Health and Nutrition Unit
Mr. Mario M. BaniquedAdministrative Officer V
Human Resource Development Unit
Ms. Margie M. CayetanoLibrarian
Ms. Dominga B. RaymundoDormitory ManagerRELC-Teachers Hall
Our Logical Framework

58
2013DepEd Region 02 Annual Report
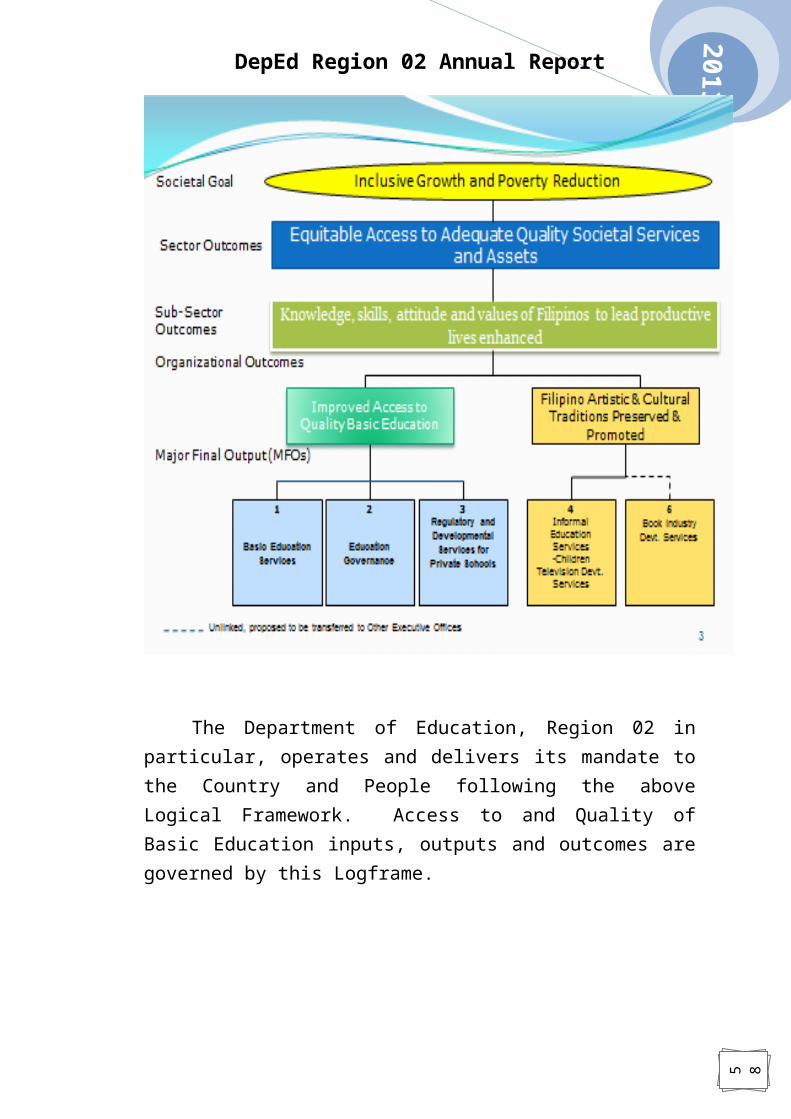
The Department of Education, Region 02 in particular, operates and delivers its mandate to the Country and People following the above Logical Framework. Access to and Quality of Basic Education inputs, outputs and outcomes are governed by this Logframe.
Our Goal Meet the National and International Education Targets and Commitments aligned with the 10-point agenda of the present government:

58
2013DepEd Region 02 Annual Report
Improve the Mastery Level of Learners to 76% and above
Make education more inclusive and relevant by increasing Access
Improve holding power of the elementary and secondary schools by decreasing dropouts and school leavers
Our Strategic DirectionsACCESS
Social Marketing to improve/close gaps in basic education inputs (Kinder teachers, learning center, ICT, infrastructure)
Continuing advocacy on IP and Muslim education
Intensify Alternative Delivery Modes (ADMs) and other alternative learning modes utilization
QUALITY
Increase education technology utilization to improve instruction
Ensure regional/division manpower to improve instruction
Strengthen PPP in financing DepED programs and projects e.g. ICT, infrastructure, etc.
Continuing capability for teaching and non-teaching staff to improve organizational efficiency and effectiveness
GOVERNANCE
Reengineer planning and monitoring processes and mechanisms
Improve transparency and accountability in schools
Our Basic Education DataTable 1
Public Elementary Schools

58
2013DepEd Region 02 Annual Report
DivisionPerformance
2012 Actual
2013 Target
2013 Actual
Batanes 21 21 21Cagayan 699 715 701City of Ilagan ----- ----- 88Isabela 845 772 757Nueva Vizcaya 330 338 331Quirino 172 175 172Cauayan City 65 66 65Santiago City 32 33 32Tuguegarao City 28 29 28REGION 02 2192 2149 2195
This year there was an increase in the number of public elementary schools from 2,192 in 2012 to 2,195 in the latest year. This is attributed to the opening of additional schools particularly in the Divisions of Cagayan and Nueva Vizcaya. As observed, the segregation of the data in the Basic Education Information System (BEIS) in the Divisions of Isabela and the newly created City Division of Ilagan justifies the decrease in the number of schools in the former Division.
Table 2Public Secondary Schools
DivisionPerformance
2012 Actual
2013Target
2013Actual
Batanes 8 8 8Cagayan 107 109 107City of Ilagan ----- ----- 15Isabela 161 164 145Nueva Vizcaya 45 46 45Quirino 38 39 39Cauayan City 13 13 14Santiago City 7 7 9Tuguegarao City 5 5 6REGION 02 384 391 388
In the Secondary Level there were four (4) additional schools established in the year 2013. These newly opened schools are located in the Divisions of Quirino, Cauayan City, Santiago City and Tuguegarao City. While the region did not meet its target increase, it still has surpassed its actual number by four.
Table 3Public Elementary Schools Enrolment
Division Performance2012 Actual 2013 Target 2013 Actual
58
2013DepEd Region 02 Annual Report
Batanes 2,329 2,352 2,600Cagayan 137,535 141,989 159,754Ilagan ----- ----- 19,950Isabela 162,150 172,173 171,804Nueva Vizcaya 59,402 64,489 68,094Quirino 25,389 23,099 29,574Cauayan City 15,767 18,428 19,054Santiago City 15,974 19,341 19,287Tuguegarao City 16,028 18,579 18,837REGION 02 434,574 478,393 508,954 The Region surpassed its prior year’s and target enrolment by 74,380 pupils, from 434,574 in 2012 to 508,954 in 2013. Notably, there is corresponding huge in increase in enrolment of Indigenous and Muslim children, and the Balik-arals.
Table 4Public Secondary Schools Enrolment
DivisionEnrolment
2012 2013 Target 2013 ActualBatanes 1,523 1,538 1,511Cagayan 58,410 73,526 59,366Ilagan ----- 9,500 9,205Isabela 75,658 91,235 66,575Nueva Vizcaya 23,286 30,054 23,978Quirino 11,440 12,898 11,846Cauayan City 6,767 9,346 6,902Santiago City 7,126 10,609 7,038Tuguegarao City 9,177 12,743 9,320REGION 02 193,387 251,449 195,741 The enrolment in the secondary schools increased by more than 2%, from 193,387 in 2012 to 195,741 in 2013. However, it falls short of the target enrolment in 2013.
Our Major Final Outputs (MFOs)

58
2013DepEd Region 02 Annual Report
Following the standards set by the local and international education arena, the Cagayan Valley Region (Region 02) presents its accomplishments vis-à-vis targets for the year just ended.
Major Final Output (MFO) 2Basic Education Services
A. QUANTITY
Table 1ENROLMENT IN PUBLIC KINDERGARTEN IN PROPORTION TO 5-YEAR OLD CHILDREN
School Year 2013-2014
Division # of Schools
Total Ages of 4 1/2 to Ages 19 & Above Age 5
TotalMale Female Male Female
Batanes 21 169 138 145 110 562
Cagayan 701 10,871 10,107 8,520 8,014 37,512
Cauayan City 65 1,516 1,384 1,094 1,015 5,009
City of Ilagan 88 1,433 1,278 1,060 961 4,732
Isabela 757 12,543 11,770 10,078 9,525 43,916
Nueva Vizcaya 331 4,512 4,164 3,462 3,137 15,275
Quirino 172 2,069 1,932 1,583 1,484 7,068
Santiago City 32 1,622 1,396 1,170 1,026 5,214
Tuguegarao City 28 1,274 1,278 932 915 4,399
REGION 2 2,195 36,009 33,447 28,044 26,187 123,687
The Region’s enrolment in Kindergarten aged 5 recorded a remarkable increase at 78.08% or 123,687 this year. All the nine (9) Divisions have increments in Kindergarten enrolment, and the greater improvements are seen in the Divisions of Isabela and Cagayan at 80.63% or 43,916 and 78.82% or 37,512, respectively.
The increase is attributed to the following factors:
The passing into law of Republic Act (R.A.) 10157, gave the department more elbow-room to institutionalize reforms in basic education which include the implementation of the universal kindergarten program in all public schools.
Government, schools, communities and other partners work closely in the implementation of Child-Friendly School System
Sustained implementation of Early Registration System in partnership with local media for social marketing
Increase in economic activities in the region Increase in the number of OCWs contributed to the increase in financial
capability of parents to support needs of their children. Strong LGU support to education
Table 2

58
2013DepEd Region 02 Annual Report
ENROLMENT IN PUBLIC ELEMENTARY SCHOOLS IN PROPORTION TO ALL 6-11-YEAR OLD CHILDREN
School Year 2013-2014
Division # of Schools
Total Ages of 4 1/2 to Ages 19 & Above Total Ages 6 to 11
TotalMale Female Male Female
Batanes 21 1,186 1,107 1,073 1,041 4,407
Cagayan 701 72,662 66,114 61,942 58,223 258,941
Cauayan City 65 8,426 7,728 7,332 6,822 30,308
City of Ilagan 88 9,084 8,155 7,977 7,386 32,602
Isabela 757 77,285 70,206 67,903 63,515 278,909
Nueva Vizcaya 331 30,919 28,499 25,978 24,996 110,392
Quirino 172 13,558 12,015 11,453 10,691 47,717
Santiago City 32 8,477 7,792 7,601 7,210 31,080
Tuguegarao City 28 8,413 7,872 7,613 7,291 31,189
REGION 2 2,195 230,010 209,488 198,872 187,175 825,545
The enrolment of children aged 6-11 is registered at 87.84% or 386,047 out of the gross enrolment 439,498. The Divisions of Isabela, Cagayan and Nueva Vizcaya captured the highest number of enrollees at 89.10% or 278,909, 86.59% or 258,941 and 85.79% or 110,392, respectively.
The increment is attributed to the following:
Sustained implementation of Early Registration System in partnership with local media for social marketing
Tracking of Out-of-School Children (OSCs) increased the number of Balik-Aral enrollees
Interventions implemented for the Pupils At-Risk of Dropping Out (PARDOs) Increase CCT/4Ps recipient Strong support to IP and Muslim Education through PRIME/IPEd and
MADRASAH
Table 3ENROLMENT IN PUBLIC SECONDARY SCHOOLS IN PROPORTION TO ALL
12-15-YEAR OLD CHILDRENSchool Year 2013-2014

58
2013DepEd Region 02 Annual Report
Division # of Schools
Total Ages of 10 & Below to Ages 20 & Above Total Ages 12 to 15
TotalMale Female Male Female
Batanes 8 798 713 743 688 2,942
Cagayan 107 29,594 29,772 26,132 28,010 113,508
Cauayan City 14 3,386 3,516 3,078 3,277 13,257
City of Ilagan 15 4,593 4,612 4,064 4,266 17,535
Isabela 145 33,341 33,234 29,945 30,826 127,346
Nueva Vizcaya 45 11,548 12,430 9,747 11,180 44,905
Quirino 39 5,818 6,028 4,823 5,382 22,051
Santiago City 9 3,406 3,632 3,060 3,373 13,471
Tuguegarao City 6 4,533 4,787 4,259 4,618 18,197
REGION 2 388 97,017 98,724 85,851 91,620 373,212
The Region’s enrolment in secondary is increasing at 90.67% or 177,471 which is 9.33% lower from the EFA Target. The Divisions of Isabela and Cagayan supplied the biggest enrolment at 91.67% or 60,771 and 91.20% or 54,142, respectively while Batanes Division which used to have the least percentage of enrolment had 94.71% or 1,431.
The contributory factors to the increased Access include:
Sustained implementation of Early Registration System in partnership with local media for social marketing
Tracking of Out of School Children (OSCs) and Students At-Risk of Dropping Out (SARDOs)
Increase in the number of Balik-Aral enrollees Lack of differentiated curricular offerings to attract students interest Implementation of the different Alternative Delivery Mode (ADMs) Increase in economic activities in the region Increase in the number of OCWs that contributed to the increase in financial
capability of parents to support needs of their children. Strong LGU support to education
Table 4Number of Learners in Alternative Learning System Programs
Division Number of Learners in theA&E Programs
Batanes 530

58
2013DepEd Region 02 Annual Report
Cagayan 7869
Cauayan City 1018
Ilagan City 740
Isabela 8695
Nueva Vizcaya 4765
Quirino 1947
Santiago City 774
Tuguegarao City 1056
REGION Total: 27,394
This year there are 27, 394 children enrolled in the ALS Accreditation and Equivalency (A&E) Program. This is higher as compared to the enrolment in the immediate preceding year. Most learners are from the Divisions of Isabela and Cagayan.
Table 5SCHOOL LEAVER RATE
ELEMENTARY SCHOOLSSchool Year 2012-2013
Division
DEPED ELEMENTARY SCHOOLS
School Leaver Rate Average School Leaver RateGrade I Grade II Grade III Grade IV Grade V Grade VI
REGION: Region II – Cagayan ValleyBatanes 1.97% 0.00% 0.50% 0.30% 1.08% 0.00% 0.64%
Cagayan 7.35% 1.77% 1.33% 1.25% 2.49% 0.84% 3.31%
Cauayan City 4.26% 0.36% 2.29% 0.12% 2.15% 3.40% 2.16%
Isabela 7.14% 2.61% 1.63% 1.76% 3.81% 1.37% 3.67%
Nueva Vizcaya 11.90% 4.71% 2.97% 2.72% 4.08% 1.27% 6.03%
Quirino 10.37% 5.02% 4.61% 4.13% 4.99% 2.21% 6.48%
Santiago City 13.65% 2.09% 3.10% 1.28% 2.65% 2.04% 5.16%
Tuguegarao City 3.61% 0.23% 0.43% 2.01% 1.36% 1.96% 1.61%
REGION 2 8.11% 2.58% 1.93% 1.79% 3.28% 1.35% 3.96%
The Region’s average school leaver rate stands at 3.96%, which is still high as compared with the EFA standard. The Divisions that contributed to the high rate in school leavers are Quirino, Nueva Vizcaya and Santiago City at 6.48%, 6.03% and 5.16%, respectively. Highest leaver rate is seen in Grade 1 across all divisions. The presence of internet café’s, malls and other recreation centers attributed which could eventually lead to absenteeism and dropout. Other factors affecting the indicator are distance of home to school, illness and family problems, and psychological preparedness of 6-year olds.
Table 6SCHOOL LEAVER RATE SECONDARY SCHOOLSSchool Year 2012-2013
DivisionDEPED & SUC SECONDARY SCHOOLS Average School
Leaver RateSchool Leaver

58
2013DepEd Region 02 Annual Report
Year I Year II Year III Year IVBatanes 2.69% 1.19% 5.41% 1.60% 2.59%Cagayan 5.97% 6.82% 8.36% 2.51% 7.17%Cauayan City 6.30% 3.98% 9.51% 3.79% 6.78%Isabela 5.36% 6.67% 7.32% 4.80% 6.60%Nueva Vizcaya 7.48% 8.49% 9.12% 5.11% 8.68%Quirino 7.89% 8.33% 9.31% 3.88% 8.70%Santiago City 8.11% 8.66% 7.67% 5.25% 9.06%Tuguegarao City 3.94% 5.79% 4.85% 2.75% 4.89%REGION Total: 6.02% 6.93% 7.92% 3.95% 7.14%
School Leaver Rate in the secondary level is high at 7.14%. Almost all the divisions registered high in the rate of school leavers except for the division of Batanes. The development in IT, involvement of children in labor and weak guidance and counseling program in time could lead to absenteeism and dropout.
Table 7DROPOUT RATE
GOVERNMENT & PRIVATE ELEMENTARY SCHOOLSSchool Year 2012-2013
DivisionGrade I Grade II Grade III Grade IV Grade V Grade VI
Ave. Dropout
RateBatanes 0.00% 0.00% 0.50% 0.00% 0.00% 0.00% 0.09%
Cagayan 0.89% 0.33% 0.34% 0.39% 0.38% 0.38% 0.47%Cauayan City 1.08% 0.59% 0.74% 0.51% 0.50% 1.02% 0.75%Isabela 0.78% 0.46% 0.52% 0.53% 0.52% 0.51% 0.56%Nueva Vizcaya 0.64% 0.41% 0.45% 0.49% 0.49% 0.41% 0.49%Quirino 1.00% 0.63% 0.50% 0.93% 0.79% 1.24% 0.84%Santiago City 1.57% 0.64% 0.81% 0.77% 1.20% 0.56% 0.95%Tuguegarao City 0.27% 0.22% 0.17% 0.31% 0.16% 0.31% 0.24%SUBTOTAL : 0.83% 0.42% 0.46% 0.51% 0.50% 0.51% 0.55%
The Region’s Average Dropout Rate for this school year is registered at an average of 0.55% which is nearing the standard. However, per grade level analysis would show that Grade 1 has the highest rate of dropouts at 0.83% with the Divisions of Santiago City, Cauayan City and Quirino contributed to the high dropout rate at 1.57%, 1.08% and 1.00%, respectively. The high dropout rate is attributed to the following:
Some Grade 1 pupils have no Early Childhood Care and Development (ECCD) experience Inaccessible/distance of home to school where children have to walk quite a good distance
to reach educational facilities Poor health and nutritional status of children Schools are within calamity prone area Family problems
Table 8DROPOUT RATE
GOVERNMENT & PRIVATE SECONDARY SCHOOLSSchool Year 2012-2013

58
2013DepEd Region 02 Annual Report
Division Year I Year II Year III Year IV Ave. Dropout Rate
Batanes1.08% 0.28% 1.42% 0.54% 0.85%
Cagayan4.15% 3.74% 3.11% 1.64% 3.22%
Cauayan City4.41% 2.70% 3.07% 1.94% 3.09%
Isabela4.22% 3.81% 3.60% 2.04% 3.46%
Nueva Vizcaya7.00% 4.74% 4.31% 2.69% 4.85%
Quirino6.64% 4.80% 3.81% 2.05% 4.49%
Santiago City3.02% 2.87% 2.25% 1.84% 2.53%
Tuguegarao City1.36% 2.11% 2.32% 1.29% 1.78%
REGION 24.49% 3.77% 3.38% 1.93% 3.46%
The Dropout rate in secondary is high at an average of 3.46%. The Divisions of Nueva Vizcaya, Quirino, Isabela and Cagayan have the most notable rates of dropouts at 4.49%, 4.85%, 3.46% and 3.22%, respectively while Batanes Division registered the lowest at 0.85%.
Factors that contributed to the high dropout rates in the secondary include:
IT development in the region increase proliferation of online gaming activity which is a distraction to learners, and the reason for school leavers
Involvement of children in labor Difficulty in road access due to mountainous terrain Calamity prone area High poverty incidence especially those who live far from school Lack of interest
B. QUALITYFigure 1
NATIONAL ACHIEVEMENT TESTQuartile Distribution
Grade 6

58
2013DepEd Region 02 Annual Report
DIVISION
Overall TestPoor
(0-25%)Below Average
(26-25%)Upper Average
(51-75%)Superior(76-100%) TOTAL
n % n % n % n % n %
Batanes 0 0.00 46 13.33 197 57.10 102 29.57 345 100.00
Cagayan 12 0.06 170 0.84 2421 11.97 17615 87.13 20218 100.00
Isabela 206 0.88 6096 26.09 13406 57.37 3660 15.66 23368 100.00
Nueva Vizcaya 3 0.04 541 6.76 3529 44.11 3927 49.09 8000 100.00
Quirino 17 0.50 1013 29.66 1838 53.82 547 16.02 3415 100.00
Tuguegarao City 5 0.20 300 12.03 705 28.27 1484 59.50 2494 100.00
Cauayan City 40 1.82 810 36.94 1162 52.99 181 8.25 2193 100.00
Santiago City 50 2.18 1083 47.23 1014 44.22 146 6.37 2293 100.00
REGION 2 333 0.53 10059 16.14 24272 38.94 27662 44.38 62326 100.00
The National Achievement Test is an annual examination given to both Grade 6 and Year 4 students. The students’ knowledge and mastery over the subjects Mathematics, Science, Filipino and Araling Panlipunan is measured using a multiple choice type test. For this school year, the NAT Grade 6 overall test results is distributed according to scale of which 44.38% belongs to superior, 38.94% upper average, 16.14% below average and 0.53% poor. The data conveys that 83.32% of the pupils who took the test have met and exceeded the standard 75%. This could be ascribed by strong LGU support like the increase in the allocation, established partnership of parents and community support to education.
Figure 2NATIONAL ACHIEVEMENT TEST-TOTAL TEST
Year 4

58
2013DepEd Region 02 Annual Report
Division
OVERALL TESTSUPERIOR (76-
100%)UPPER AVERAGE
(51-75%)LOWER AVERAGE
(26-50%) POOR (0-25%) TOTAL
n % n % n % n % n %
Batanes 24 7.29 170 51.67 133 40.43 2 0.61 329 100.00
Cagayan 402 3.25 7529 60.81 4392 35.47 59 0.48 12382 100.00
Isabela 224 1.36 5183 31.47 10418 63.25 647 3.93 16472 100.00
Nueva Vizcaya 86 1.82 2545 54.00 2071 43.94 11 0.23 4713 100.00
Quirino 16 0.67 1201 50.31 1165 48.81 5 0.21 2387 100.00
Tuguegarao City 107 4.94 1050 48.52 981 45.33 26 1.20 2164 100.00
Cauayan City 23 1.58 635 43.52 766 52.50 35 2.40 1459 100.00
Santiago City 5 0.32 326 20.74 1183 75.25 58 3.69 1572 100.00
REGION 2 887 2.14 18639 44.94 21109 50.89 843 2.03 41478 100.00
The National Achievement Test Total Test Mean Percentage Score (MPS) in the secondary schools is below the standard at 47.08%. The Divisions of Santiago City, Isabela and Cauayan City supplied to the very low achievement in the secondary level. This could be attributed to the coming after another of natural calamities like typhoons and rain-induced floods that disrupt contact days, not meeting the desired Student-Teacher Ratio, class size and textbooks ratio due to influx in enrolment from neighboring municipalities
Table 9PASSING RATE IN THE ACCREDITATION AND EQUIVALENCY TEST
IN DEPED PROCURED AND DELIVERED ALS PROGRAMSDivision Elementary Secondary Takers Passers Percentage

58
2013DepEd Region 02 Annual Report
Batanes 3 55 58 25 43.10
Cagayan 225 1243 1887 1012 53.63
Cauayan City 21 265 286 110 38.46
Isabela 136 1708 1844 571 30.97
Nueva Vizcaya 99 927 1045 429 41.05
Quirino 65 570 635 163 25.67
Santiago City 30 645 675 253 37.48
Tuguegarao City 64 458 522 336 64.37
REGION 2 779 7473 8796 2899 32.96
The ALS A&E Test is one of the four components of the ALS A&E that offers the successful test takers certification of learning achievements at two learning levels that is comparable to the formal school system, Elementary and Secondary.
This year’s Accreditation and Equivalency (A&E) Test result stands at 32.96% which is higher by 1.62 percentage points as compared to 31.34% in 2011. This is ascribed to the increase in the number of takers of the A&E.
Education Governance
A. QUANTITY
Table 10Public Elementary Schools Teachers
Division Number of Teachers2012 Actual 2013 Targets 2013 Actual
Batanes 215 217 216Cagayan 4706 4753 4881Isabela 5644 5700 5983Nueva Vizcaya 1949 1968 2043Quirino 968 978 1012Cauayan City 485 490 210Santiago City 466 471 493Tuguegarao City 587 493 597REGION 02 15020 15070 15435 The region was able to get a share of 415teacher allocation for 2013 and distributed as follows: 1 teacher item for Batanes, 175 teacher items for Cagayan, 339 teacher items for Isabela, 94 teacher items for Nueva Vizcaya, 44 teacher items for Quirino, 25 teacher items for Cauayan City, 27 teacher items for Santiago City and 10 teacher items for Tuguegarao City.
Table 11Public Secondary Schools Teachers

58
2013DepEd Region 02 Annual Report
Division Number of Schools2012 2013 Target 2013 Actual
Batanes 129 129 129Cagayan 1908 1927 3235Isabela*City of Ilagan
2481 2506349
2978
Nueva Vizcaya 736 743 868Quirino 422 426 479Cauayan City 183 185 235Santiago City 182 184 252Tuguegarao City 325 328 356REGION 02 6366 6777 8532 We increase in the number of teachers for 2013. This is due to the 1,166 teacher allocation given to the region in 2013.
Table 12Public Elementary Schools Classrooms
Division Number of Classrooms2012 2013 Target 2013 Actual
Batanes 179 177 175Cagayan 4866 4992 4943Isabela*Ilagan
5850 5396644
5343638
Nueva Vizcaya 2057 2183 2162Quirino 1046 1069 1058Cauayan City 484 489 484Santiago City 466 475 470Tuguegarao City 507 512 507REGION 02 15455 15937 15780 There were 325 number of classrooms added to the elementary schools in 2013.
Table 13Public Secondary Schools Classrooms

58
2013DepEd Region 02 Annual Report
Division Number of Classrooms2012 2013 Target 2013 Actual
Batanes 90 92 91Cagayan 1778 1668 1854Isabela*Ilagan 2362
2016281
2127278
Nueva Vizcaya 573 618 612Quirino 347 375 371Cauayan City 184 186 201Santiago City 153 148 168Tuguegarao City 212 227 225REGION 02 5699 5611 5927 There were 228 additional new classrooms constructed in the secondary schools in 2013.
Table 14Public Elementary Schools Seats
Division Number of Seats2012 2013 Target 2013 Actual
Batanes 2687 3095 3064Cagayan 113634 126725 125470Isabela*Ilagan 157324
15829319628
15672619434
Nueva Vizcaya 50996 55657 55106Quirino 23274 25766 23495Cauayan City 13425 15537 15383Santiago City 12574 15788 15632Tuguegarao City 13582 1548 15330REGION 02 387496 422037 429640 There were 42,144 additional school seats procured for the elementary schools in 2013.
Table 15Public Secondary Schools Seats

58
2013DepEd Region 02 Annual Report
Division Number of Seats2012 2013 Target 2013 Actual
Batanes 1844 1885 1866Cagayan 53053 51402 50893Isabela 68439 7,150 70,446Nueva Vizcaya 19492 19895 19698Quirino 10496 1144 11133Cauayan City 6230 6479 6415Santiago City 5324 5357 5304Tuguegarao City 6241 6664 6598REGION 02 171119 163976 172353 There were 1,234 seats delivered to the secondary schools for 2013.
Major Final Output (MFO) 3

58
2013DepEd Region 02 Annual Report
Regulatory and Developmental Services for Private Schools
A. QUANTITY
Number of Private Schools Submitting EBEIS Data on or before October 15, 2013
Of the 501 private schools in the whole region, 100% have submitted their EBEIS Data on time.
B. QUALITY
Private Schools Operating with Permit
All the 501 private elementary and secondary schools are operating with the necessary DepED permit.
Our Education Outcomes/

58
2013DepEd Region 02 Annual Report
Key Performance IndicatorsA. Elementary Schools
Figure 3
Figure 4
Gross Enrolment Ratio (GER) is the total enrolment in a specific level of education, regardless of age. It indicates the capacity of the education system to enroll pupils of a particular age. Thus, it is a complementary indicator to net enrolment rate by indicating the extent of over-aged and under-aged learners who are enrolled in the formal system.
For the last 2 years, the Region’s GER increased from 105.04% in 2010 and 106.86% in 2011. However, it falls short of the 2013 target by 3.2%. Almost all the divisions performed well in this indicator except for the division of Santiago City.

58
2013DepEd Region 02 Annual Report
Figure 5
Figure 6
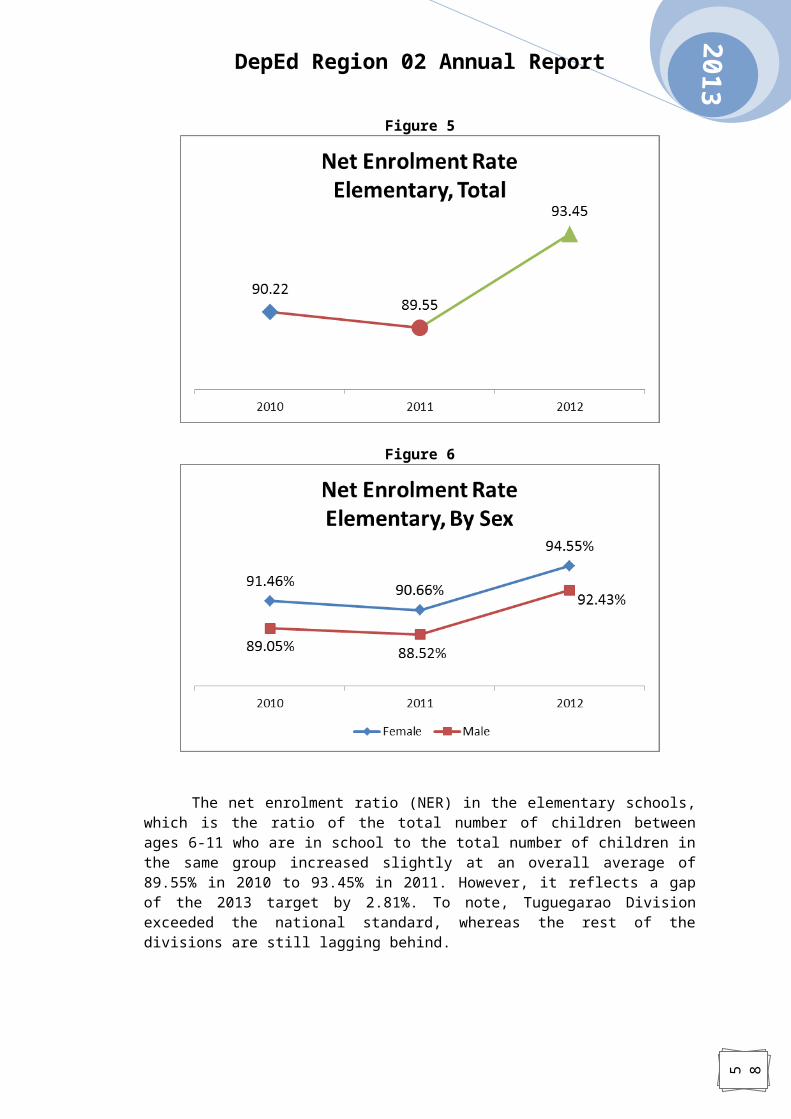
The net enrolment ratio (NER) in the elementary schools, which is the ratio of the total number of children between ages 6-11 who are in school to the total number of children in the same group increased slightly at an overall average of 89.55% in 2010 to 93.45% in 2011. However, it reflects a gap of the 2013 target by 2.81%. To note, Tuguegarao Division exceeded the national standard, whereas the rest of the divisions are still lagging behind.

58
2013DepEd Region 02 Annual Report
Figure 7Apparent Intake Rate
Figure 8
Notwithstanding the fast rate of growth in the school-going population, the Region’s
provided a high level of access to primary education. The apparent intake rate (AIR) for new entrants into Grade 1 was 133.09% in 2010, whereas, 137.93 percent in 2011. Although the gender parity rate was quite very far to 13.77% in the latest year, males nonetheless had slightly higher AIRs.
These figures indicate that at that time there were substantial numbers of overage and underage children entering Grade 1 for the first time, which suggests that many families were postponing their children’s schooling, especially those in the rural areas. Furthermore, the large difference between the gross and the net intake rates reveals that a great proportion of children of official primary school-entrance still did not enter school at the

58
2013DepEd Region 02 Annual Report
right age. The familial practice of deferring schooling for Grade 1-eligible children was therefore still being observed.
Figure 9Net Intake Rate
This indicator gives a more precise measurement of access to primary education of the eligible, primary school-entrance population. However, despite high level of access in primary education, the Region’s Net Intake Rate is beyond the standard by an overall average of 70.17% in 2010 and 80.01% in 2011. Females to some extent had higher NIR compared to males in terms of gender parity rate.

58
2013DepEd Region 02 Annual Report
Figure 10
Figure 10
Figure 11
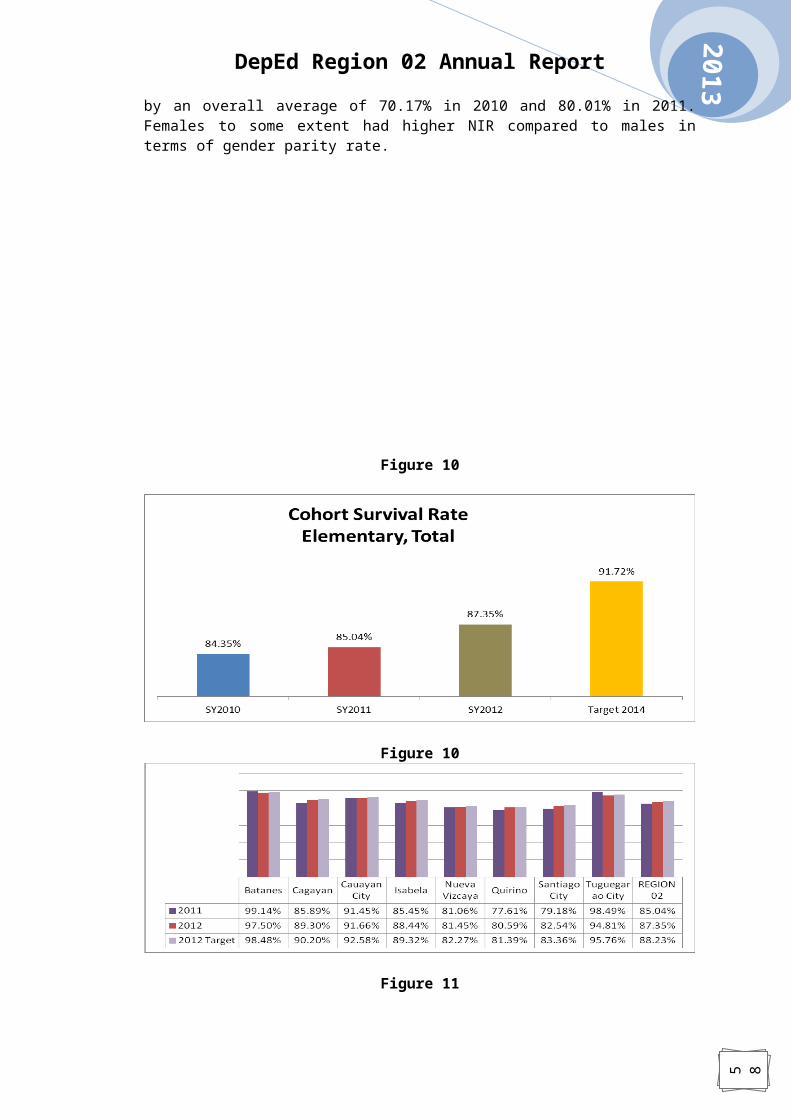
Ensuring that pupils stay in school until they complete their education is a major concern in basic education. Cohort Survival Rates (CSR) which is the proportion of enrollees at the beginning grade who reach the final grade at the end of the required number of years of study, for the past 2 years showed an increase from 87.35% to 88.23%. These statistics mean that about between 17% of Grade 1 pupils do not reach Grade 6.
These facts reflect a worrisome reality about the holding power of public schools, which is further elucidated by data on dropouts. The statistics on the region’s average dropout rate for each school level has remained higher than expected (1 to 2 %), sometimes

58
2013DepEd Region 02 Annual Report
as much as 2 digits. Moreover, even if dropouts re-enter school at some point, many repeaters eventually drop out at a later time. Re-admission seems to have little positive effect on achievement.
Figure 12
Figure 13
Figure 14

58
2013DepEd Region 02 Annual Report
The Completion Rate measures the percentage of grade entrants who graduate in elementary. This year’s completion rate indicates a significant increase of 8.97% in 2012. However, it left a difference of 0.82% from the 2012 target. This means that in every 100 pupils enrolled, only 82 of them completed the first cycle of basic education, while the remaining 18 pupils were either the school leavers or repeaters.
Figure 15Promotion Rate
The promotion rate which is the extent of pupils who are promoted to the next grade level is declining from 102.60% in 2011 to 97.36% in 2012. This means that it dropped by about by 5% in the latest year.
Figure 16Graduation Rate

58
2013DepEd Region 02 Annual Report
In terms of graduation rate the Region has declined by almost 6.11% in 2012 compared to that in 2011. It falls short of the 2013 target by 0.99%. Though the data is decreasing, still the rate of pupils finishing the first cycle of basic education is likely a good indicator. This explains that if the region has 100 pupils in its entering grade and a 6 year-year graduation rate of 98.14% in 2012, we can realistically see that, if the graduation rate holds, within 6 years about 98 of those pupils will graduate or finish school.
Figure 17Retention Rate
The retention rate which determines the degree of pupils in a particular year who continue to be in school in the succeeding year surpasses the national standard from 94.45% in 2011 to 100.86% in 2012. The staying power of the pupils and holding power of DepEd Region 2 through the implementation of the different national programs coupled with region’s local initiatives and the alternative delivery modes explained the increase.
Figure 18
Figure 19
58
2013DepEd Region 02 Annual Report
Figure 20
School Leaver Rate is the EFA measure for dropout rate. It covers both pupils/students who do not finish a particular grade/year level as well as those who finish but fail to enroll in the next grade/year level following school year.
The Region’s School Leavers stand at 4.73% in 2011 while 3.93% in 2012. It falls short of the 2012 target by 1 percentage point Though the data is decreasing there are still a large number of pupils who leave the school during the school year. This is attributed primarily to some children live far from school, not to mention the increase in number of incomplete families/ families with absentee parents may possibly reduce parental support to learning.

58
2013DepEd Region 02 Annual Report
Figure 21
Figure 22

58
2013DepEd Region 02 Annual Report
Figure 23
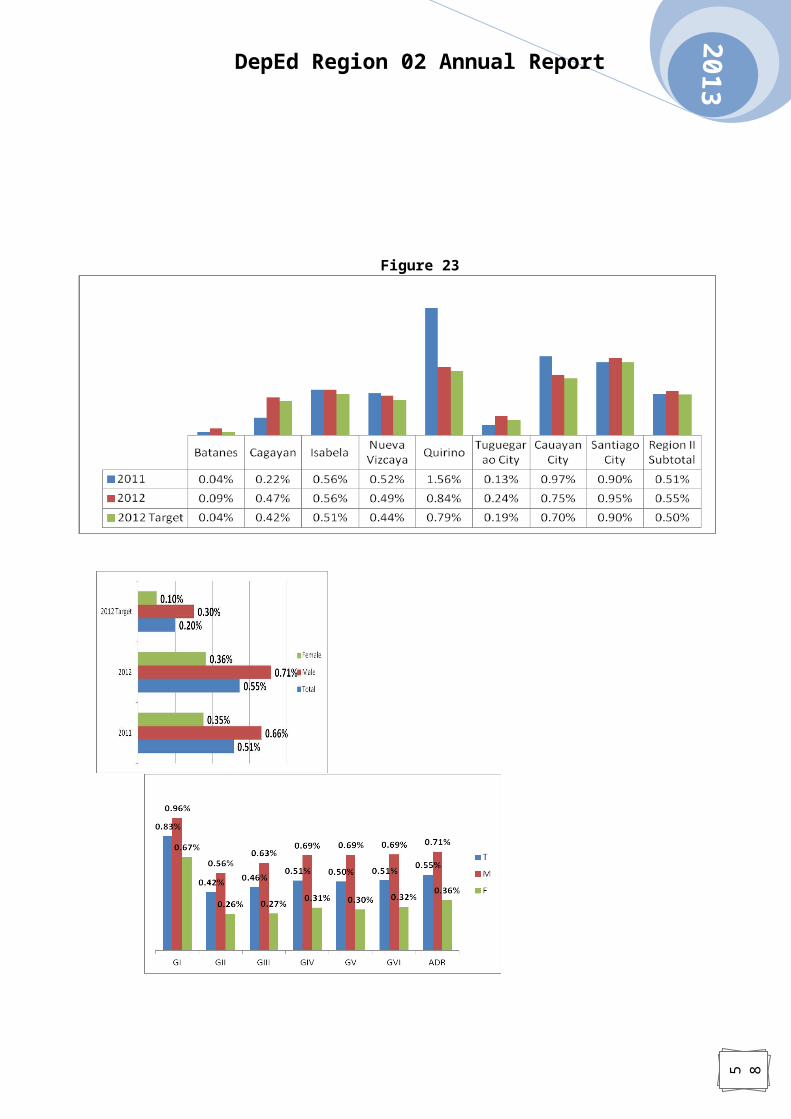
The dropout rate which is the proportion of pupils who leave school during the year as well as those who fail to enroll in the next grade level to the total number of pupils enrolled during the previous school year has a marginal increase of 0.04% and though very low, still beyond the national standard.
The data reveals other intriguing facts about dropping out. First, majority of those who stopped schooling did so during the first year of elementary education. Dropout rates in the first level of elementary were higher than those in other grades. For example, dropout rate in Grade I (0.83%) is higher than that in Grade VI (0.51%). Second, gender comparison
58
2013DepEd Region 02 Annual Report
showed that boys had higher dropout rates in elementary level compared to girls (0.71% and 0.36%).
Distance of schools from their homes, take care of siblings, illness, among others are the major causes of dropping out for young elementary pupils.
Figure 24Repetition Rate
Repetition Rate determines the magnitude of pupils who repeat a grade level. It is an indicator which measures the phenomenon of pupils repeating a grade, and is a measure of the internal efficiency of the primary education cycle. Low repetition rate reveals internal efficiency and possibly reflects good level of instruction.
In the elementary level, the average repetition rates are 1.58% in 2011 and 1.54% in 2012. The rate has decreased by 0.04 percentage point over the years, from 1.58% of the previous school year.
B. Secondary Level
Figure 25

58
2013DepEd Region 02 Annual Report
Figure 26
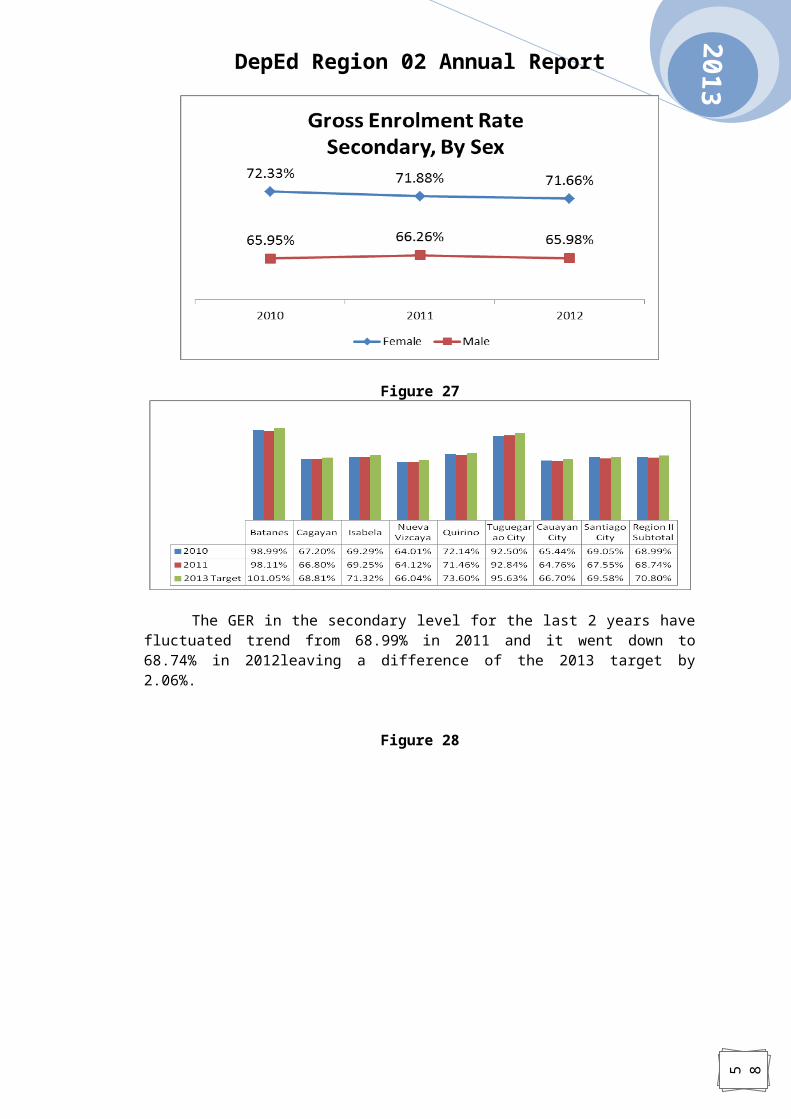
Figure 27

58
2013DepEd Region 02 Annual Report
The GER in the secondary level for the last 2 years have fluctuated trend from 68.99% in 2011 and it went down to 68.74% in 2012leaving a difference of the 2013 target by 2.06%.
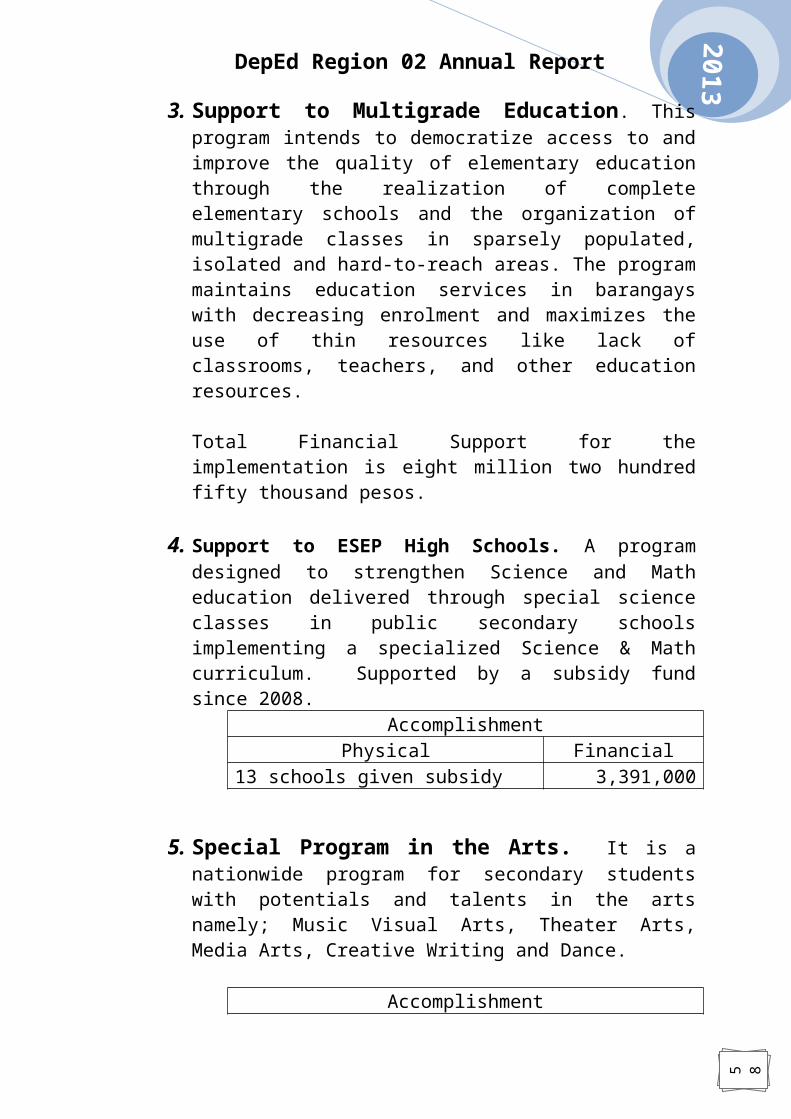
Figure 28
Figure 29

58
2013DepEd Region 02 Annual Report
Figure 30
Similar trends are manifested for secondary schools. Net enrolment ratio increased from 53.59% in 2011 to 68.99% 2012. However, the net enrolment is lagging behind by almost 31% in the latest year.
Figure 31

58
2013DepEd Region 02 Annual Report
Figure 32
For the secondary level cohort survival rates, of the 100 students who enter secondary school, about 29.73% in 2011 whereas 18.16% in 2012 do not finish high school. If the numbers are added up, they indicate that about half of Grade 1 pupils complete secondary level; the other half are, for one reason or another, lost along the way.
Figure 33

58
2013DepEd Region 02 Annual Report
Figure 34
Figure 35
The region’s completion rate in the secondary level suffers a big drop from 83.03% in 2011 to 78.21% in 2012 which resulted to almost 5% decrease over the year.

58
2013DepEd Region 02 Annual Report
Figure 36Promotion Rate
The promotion rates in the secondary level have declined to 20.49% from 114.52% in 2011 to 94.03% in 2012.
Figure 37Graduation Rate
Graduation rates in the secondary are similar in trend to that in promotion rates. It dropped at about 22% from 118.44% in 2011 to 96.81% in 2012.
Figure 38Retention Rate
The trend in retention rates in the secondary is similar to that in the elementary that during the years it surpasses the national standard.
58
2013DepEd Region 02 Annual Report
Figure 39
Figure 40
Figure 41

58
2013DepEd Region 02 Annual Report
School Leavers in the secondary is tremendously increasing from 4.46% in 2011 to 6.68% in 2012. Many students leave during the school year due to child labor and the presence of incomplete families.
Figure 42
Figure 43
Figure 44

58
2013DepEd Region 02 Annual Report
The dropout rates in the secondary which used to be high over the years stand at 4.94% in 2011 and 3.46% in 20912. Though the trend is decreasing it is still high compared to that in the elementary level. Far distance of home from school, child labor, take care of siblings, illness are just among the major causes why children get out from the system.
Figure 45Repetition Rate
Repetition rate had increase from 1.31% in 2011 to 1.41% in 2012.
58
2013DepEd Region 02 Annual Report
Our Special Programs, Activities and Projects (PAPs)
1. K to 12K+12 means Kindergarten and the 12 years of elementary and secondary education.Kindergarten refers to the 5 year old cohort who undergoes standardized kinder curriculum.Elementary education refers to primary schooling that involves 6 or 7 years old of education while secondary education refers to high school.
The region is implementing the approved model for implementation which is the K-6-4-2 Model.
This model involves kindergarten, 6 years of elementary education, 4 years of junior high school (Grade 7-10) and two years of senior high school (Grades 11-12). The two years senior HS intend to provide time for students to consolidate acquired academic skills and competencies.
Accomplishment in 2013
Division No. of Trained Grade 2 Teachers Financial
Batanes 31 178,250Cagayan 754 4,335,500Isabela 1119 6,434,250Nueva Vizcaya 438 2,518,500Quirino 186 1,069,500Cauayan City 98 563,500Santiago City 72 414,000Tuguegarao City 78 448,500
2. Special Science Elementary School (SSES). It is a research and development project designed to develop students with higher aptitude for science and mathematics through the implementation of an enhanced science and mathematics curriculum at the elementary level. Children enrolled in the program are identified using set criteria and are primed to be mainstreamed to the Science and Technology High Schools.
Division No. of Schools Financial

58
2013DepEd Region 02 Annual Report
given SubsidyBatanesCagayan 2 354,165Isabela 1 354,165Nueva VizcayaQuirinoCauayan CitySantiago City 1 354,165Tuguegarao City 1 354,165REGION 02 5 1,416,660
3. Support to Multigrade Education. This program intends to democratize access to and improve the quality of elementary education through the realization of complete elementary schools and the organization of multigrade classes in sparsely populated, isolated and hard-to-reach areas. The program maintains education services in barangays with decreasing enrolment and maximizes the use of thin resources like lack of classrooms, teachers, and other education resources.
Total Financial Support for the implementation is eight million two hundred fifty thousand pesos.
4. Support to ESEP High Schools. A program designed to strengthen Science and Math education delivered through special science classes in public secondary schools implementing a specialized Science & Math curriculum. Supported by a subsidy fund since 2008.
AccomplishmentPhysical Financial
13 schools given subsidy 3,391,000
5. Special Program in the Arts. It is a nationwide program for secondary students with potentials and talents in the arts namely; Music Visual Arts, Theater Arts, Media Arts, Creative Writing and Dance.
AccomplishmentPhysical Financial
1 school given subsidy 500,000

58
2013DepEd Region 02 Annual Report
6. Special Program for Sports. It is a program aimed to address the needs of secondary students with potentials/talents in sports namely: Archery, Arnis, Badminton, Chess, Gymnastics, Table Tennis, Taekwondo, Tennis, Dancesport Under the program, the students undergo an 4-15 hours per week training under trained coaches. specializing in sports where they excel in.
AccomplishmentPhysical Financial
1 school given subsidy 500,000
7. Special Education (SPED). It is designed to serve students with special needs. Currently covers 385 elementary SPED centers and 190 secondary schools with SPED classes, across the country. Enjoys fund support since 2008: @ 500,000 per elem SPED Center; for secondary, a fixed cost & variable allocation depending on enrolment per exceptionality. Caters to 11 exceptionalities, namely: mentally retarded, learning disabled, behavior problems, hearing impairment, visual impairment, speech defective, orthopedically handicapped, multiply handicapped, chronically ill, developmental handicapped.
Division No. of Schools FinancialBatanesCagayan 2 804,800Isabela 3 1,295,200Nueva Vizcaya 4 1,644,000Quirino 2 1,080,800Cauayan City 1 368,000Santiago City 1 592,000Tuguegarao City 4 2,095,200
8. ECARP. It is a national program that addresses the thrust of DepED to make every Filipino child a reader at his/her own level. It is designed to equip elementary pupils with strategic reading and writing skills to make them independent young readers and writers. It also provides a year-long training for teachers to make them multi-literate and independent problem solvers.

58
2013DepEd Region 02 Annual Report
AccomplishmentPhysical Financial
Number of schools given Subsidy 1,100,000
9. Alternative Delivery Mode Program (Open High School). ADMs are tried and tested acceptable alternative modality in basic education delivery, not as a stop-gap measure, within the formal system that allow schools to deliver quality education to marginalized students and those at risk of dropping out by helping them overcome personal, social, and economic constraints in schooling.
It is 1 program which aims to provide independent, self-pacing and flexible options of study within the formal basic education system with equal opportunities for learners.
10. Alternative Learning Systems:Basic Literacy Program (BLP) - A program aimed at eradicating illiteracy among out-of-school youth (OSY) and adults (in extreme cases, school-aged children) by developing basic literacy skills of reading, writing, and numeracy.
AccomplishmentDivision Number of Learners Served
Batanes 64Cagayan 485Cauayan City 80Ilagan City 73Isabela 636Nueva Vizcaya 755Quirino 227Santiago City 29Tuguegarao City 100
REGION 02 2,449
Accreditation and Equivalency (A&E) Program - A program aimed at providing an alternative pathway of learning for out-of-school youth and adults who are basically literate but have not completed the 10 years of basic education mandated by the Philippine Constitution. Through this program, school dropouts are able to complete elementary and secondary education outside the formal system.

58
2013DepEd Region 02 Annual Report
Balik-Paaralan para sa Out-of School Adults (BP-OSA) Program – a school-based Accreditation and Equivalency Program for elementary and secondary levels. Its main features are:
The Instructional Managers (IMs) are the teachers of the school - the Service Provider is the school represented by the school principal. Each Instructional Manager has a learning group made up of not less than fifty (50) learners;
The School principals of those schools serving as Principal-Coordinators (PCs) supervise the conduct of the learning sessions;
The learning sessions are conducted outside the regular class schedule (after class periods or during weekends);
The program uses the ALS Curriculum and learning materials; and
Entry of learners in the program at any time is allowed as a matter of policy.
DepEd Delivered by Mobile Teachers & District ALS Coordinators - An ALS program implementation lodged primarily with the Mobile Teachers and District ALS Coordinators who are assigned to conduct intensive community-based learning intervention in Basic Literacy (BL) and Accreditation and Equivalency (A&E) programs for out-of-school children, youth, and adults in far-flung communities in all divisions nationwide.DepEd Procured - An ALS program implementation namely, Basic Literacy (BL), Accreditation and Equivalency (A&E), Indigenous Peoples Program, and Balik-Paaralan para sa Out-of School Adults (BP-OSA) programs, which are delivered through ALS Unified Contracting Scheme, which includes hiring of ALS Literacy Volunteers.
Literacy Volunteers - Formerly known as ALS Gabay sa Pamayanan or AGAP Volunteers, serve as volunteer learning facilitators delivering ALS programs to Out-of-School children, youth, and adults in their assigned communities. These are private individuals who handle ALS programs within their community. A minimal allowance is provided by DepED for their service.
11. Indigenous People (IP) Education. This program is the DepEd response to the desire of IP communities for an education that is responsive to their context, respects their identities, and promotes the value of their traditional knowledge, skills, and other aspects of their cultural heritage. Specifically, it aims to improve the appropriateness and responsiveness of the IP curriculum, capacity building for teachers, managers, and personnel and development of culturally appropriate learning resources in public schools with IP enrollees as well as to address the learning needs of those IP learners who are outside the formal education system.

58
2013DepEd Region 02 Annual Report
AccomplishmentPhysical Financial
Number of Schools and Community supported 4,470,000
12. Basic Education Madrasah. The program was created to provide quality education to Muslim learners in the public schools and private Madaris and to Muslim out of school youths and adults. This is to ensure that all Muslim school children and OSYs have access to an Islamic-friendly educational curriculum and quality basic education.
Accomplishment
DivisionNo. of Asatidz
EmployedMonthly
HonorariaTotal Subsidy
Ilagan City 2 6,000 120,000
Nueva Vizcaya 2 6,000 120,000
Santiago City 2 6,000 120,000
REGION 02 6 18,000 360,000
13. Redesigned Technical-Vocational High School Program (STVEP). STVEP is devised to provide high school graduates with opportunities to acquire certifiable vocational and technical skills that will allow broader options in pursuing their post-secondary career, whether this is a college education, short term technical courses, entrepreneurship or apprenticeship leading to eventual formal employment. It also offers high school graduates employable and entrepreneurial skills that will enable them to support their post-secondary career and/or their family needs.
AccomplishmentPhysical Financial
34 Schools supported by STVEP 45,474,000

58
2013DepEd Region 02 Annual Report
14. Human Resource Training and Development. HRTD is a pool of fund for human resource development and training programs. More specifically, it aims to make the Department responsive to the organizational needs and manpower requirements by developing appropriate skills and attitudes of personnel.
Program Coverage : Training of teachers and non-teaching personnel, including programs related to gender and development. Currently, its focus is on capacity building on K to 12 program.
AccomplishmentPhysical Financial
Number of Trainings Conducted 37,434,000
15. School Health and Nutrition Program.
The School Based Feeding program. It was previously known as the Breakfast Feeding Program (BFP) which was initially conceptualized and launched in 1997 to address the “short-term-hunger syndrome” among public elementary school children. As the program progressed, it shifted from just addressing the short-term hunger to addressing a more serious problem of under-nutrition in schools. The program was renamed to SBFP so as not to limit the feeding to breakfast only.
Medical/Dental and Optical Health and Nursing Services.
The program aims to promote, protect and maintain the health status of students and school personnel through the provision of various health services such as health appraisal, treatment, consultation, referral, health counseling among others.
Dental Service is the provision of promotive, preventive and curative services aimed to improve the oral health status of the school population specifically the pupil in the public elementary schools.

58
2013DepEd Region 02 Annual Report
Gulayan sa Paaralan (GPP)This program promotes the production of foods in school that are rich in protein, carbohydrates, vitamin A, and iron as a major input to school feeding. It adopts environment-friendly technologies like the Bio-Intensive Gardening (BIG), Food Always in the Home (FAITH), and others to improve the quality and quantity of vegetable crops raised in school and pupils’ homes.It also covers composting, establishment of plant nursery, tree planting, propagation of medicinal plants, orchard and school landscape development and related livelihood activities
AccomplishmentPhysical Financial
Number of Learners served 13,824,000
16. Lump-sum for Acquisition, Improvement, Titling and Survey of School Sites.This program aims to firmly establish ownership of school sites occupied by elementary and secondary schools nationwide, to contribute to the further development and improvement of the public school system on a more stable basis, to protect the rights and interest from legal and administrative issues affecting school sites.

58
2013DepEd Region 02 Annual Report
Our 2013 Operational BudgetFigure 46
Figure 47
Figure 48

58
2013DepEd Region 02 Annual Report
Figure 49

58
2013DepEd Region 02 Annual Report
Our Golden Harvests . . . . National Best Brigada ImplementerHall of Fame Award:
Exceptional Category - Mallig Elementary School
Big School Category - Aparri East Central School(Elementary)
Small School Category - Batug-Palagao Elem. School
Big School Category - Gattaran National Trade School(Secondary)
- Cabarroguis National High School
58
2013DepEd Region 02 Annual Report
Our 2014 Performance Contract
DepED Region 02 commits to further increase/improve performance towards EFA 2015 and PDP 2016 Targets, to wit:
PERFORMANCE CONTRACT FOR 2014-2015
AREA PERFORMANCE INDICATOR
2011-2012 2012-2013 2014 2015 2016BASE ACTUAL ADJUSTED EFA PDPDATA ACCOMPLISHMENT INDICATIVE TARGET TARGET
TARGET
`
Apparent Intake Rate 133.09 137.93 138.00 113.29 -Net Intake Rate 80.12 81.01 88.00 95.00 -Gross Enrolment Rate:
Elementary 112.94 106.86 121.07 120.00 122.93Secondary 68.99 68.74 89.37 110.00 115.79
Net Enrolment Rate: Elementary 93.39 93.45 95.77 98.10 100.00Secondary 68.55 53.59 70.66 87.73 93.94

58
2013DepEd Region 02 Annual Report
AREA
2011-2012 2012-2013 2014 2015 2016PERFORMANCE BASE ACTUAL ADJUSTED EFA PDP
INDICATOR DATA ACCOMPLISHMENT INDICATIVE TARGET TARGET TARGET
EFFICIENCY
Cohort-Survival Rate: Elementary 79.34 87.35 87.50 84.67 86.76Secondary 81.84 72.31 77.65 83.00 83.91
Completion Rate Elementary 73.05 82.02 83.82 81.04 82.52Secondary 77.82 78.21 80.00 75.27 75.53
School Leaver Rate Elementary 4.73 3.93 1.81 - -Secondary 6.27 6.76 2.41 - -
Dropout Rate Elementary 0.51 0.55 0.17 - -Secondary 4.94 3.46 2.13 - -
QUALITY Achievement Rate Elementary 69.71 68.14 71.17 74.20 75.00Secondary 47.75 49.49 60.29 71.10 75.00