department of water affairs and forestry …€¦ · · 2015-01-20department of water affairs and...
TRANSCRIPT

DEPARTMENT OF WATER AFFAIRS AND FORESTRY LIMPOPO PROVINCE
WATER RESOURCE INFORMATION
STATUS ON MONITORING & SURFACE WATER LEVEL TRENDS
April 2014 to September 2014
D VILJOEN December 2014

2
TABLE OF CONTENTS Page
1. EXECUTIVE SUMMARY 5
2. MONITORING NETWORK 5
3. OVERVIEW 6
4. LIMPOPO WATER MANAGEMENT AREA 7
A4 DRAINAGE REGION 7
A5 DRAINAGE REGION 7
A6 DRAINAGE REGION 8
A7 DRAINAGE REGION 8
A8 DRAINAGE REGION 8
5. LUVUVHU / LETABA WATER MANAGEMENT AREA 8
A9 DRAINAGE REGION 8
B8 DRAINAGE REGION 9
B9 DRAINAGE REGION 9
6. OLIFANTS WATER MANAGEMENT AREA 9
B3 DRAINAGE REGION 9
B5 DRAINAGE REGION 10
B6 DRAINAGE REGION 10
B7 DRAINAGE REGION 10
7. NKOMATI WATER MANAGEMENT AREA 10
X2 DRAINAGE REGION 10
X3 DRAINAGE REGION 10

3
LIST OF MAPS AND GRAPHS Page
NATIONAL RAINFALL MAP INDICATING THE PERCENTAGE OF RAINFALL FOR JULY 2013 TO JUNE 2014 11
NATIONAL RAINFALL FORECAST MAPS FOR PERIOD OCTOBER 2014 TO FEBRUARY 2015 12 GRAPH 1: PROVINCIAL RAINFALL UP TO MIDDLE JUNE 2014 13
GRAPH 2: NATIONAL STORAGE PERCENTAGE 14
GRAPH 3: STORAGE PERCENTAGE FOR LIMPOPO WMA 15
GRAPH 5: STORAGE PERCENTAGE FOR LUVUVHU / LETABA WMA 16
WMA STORAGE SUMMARY 17
GRAPH 7: PERCENTAGE CAPACITY AND CAPACITY IN MILLIONS OF
CUBIC METERS FOR MOKOLO DAM 18
GRAPH 8: PERCENTAGE CAPACITY AND CAPACITY IN MILLIONS OF CUBIC METERS FOR DOORNDRAAI DAM 19
GRAPH 9: PERCENTAGE CAPACITY AND CAPACITY IN MILLIONS OF
CUBIC METERS FOR GLEN ALPINE DAM 20
GRAPH 10: PERCENTAGE CAPACITY AND CAPACITY IN MILLIONS OF CUBIC METERS FOR NZHELELE DAM 21
GRAPH 11: PERCENTAGE CAPACITY AND CAPACITY IN MILLIONS OF
CUBIC METERS FOR LUPHEPHE DAM 22
GRAPH 12: PERCENTAGE CAPACITY AND CAPACITY IN MILLIONS OF CUBIC METERS FOR NWANEDZI DAM 23
GRAPH 13: PERCENTAGE CAPACITY AND CAPACITY IN MILLIONS OF
CUBIC METERS FOR MUTSHEDZI DAM 24
GRAPH 14: PERCENTAGE CAPACITY AND CAPACITY IN MILLIONS OF CUBIC METERS FOR ALBASINI DAM 25
GRAPH 15: PERCENTAGE CAPACITY AND CAPACITY IN MILLIONS OF
CUBIC METERS FOR VONDO DAM 26
GRAPH 16: PERCENTAGE CAPACITY AND CAPACITY IN MILLIONS OF CUBIC METERS FOR NANDONI DAM 27
GRAPH 17: PERCENTAGE CAPACITY AND CAPACITY IN MILLIONS OF CUBIC METERS FOR EBENEZER DAM 28

4
GRAPH 18: PERCENTAGE CAPACITY AND CAPACITY IN MILLIONS OF
CUBIC METERS FOR MAGOEBASKLOOF DAM 29
GRAPH 19: PERCENTAGE CAPACITY AND CAPACITY IN MILLIONS OF CUBIC METERS FOR TZANEEN DAM 30
GRAPH 20: PERCENTAGE CAPACITY AND CAPACITY IN MILLIONS OF
CUBIC METERS FOR MIDDLE-LETABA DAM 31
GRAPH 21: PERCENTAGE CAPACITY AND CAPACITY IN MILLIONS OF CUBIC METERS FOR NSAMI DAM 32
GRAPH 22: PERCENTAGE CAPACITY AND CAPACITY IN MILLIONS OF
CUBIC METERS FOR MODJADJI DAM 33
GRAPH 23: PERCENTAGE CAPACITY AND CAPACITY IN MILLIONS OF CUBIC METERS FOR RUST DE WINTER DAM 34
GRAPH 24: PERCENTAGE CAPACITY AND CAPACITY IN MILLIONS OF
CUBIC METERS FOR LOSKOP DAM 35
GRAPH 25: PERCENTAGE CAPACITY AND CAPACITY IN MILLIONS OF CUBIC METERS FOR FLAG BOSHIELO DAM 36
GRAPH 26: PERCENTAGE CAPACITY AND CAPACITY IN MILLIONS OF
CUBIC METERS FOR OHRIGSTAD DAM 37
GRAPH 27: PERCENTAGE CAPACITY AND CAPACITY IN MILLIONS OF CUBIC METERS FOR BLYDE RIVIERSPOORT DAM 38
GRAPH 28: PERCENTAGE CAPACITY AND CAPACITY IN MILLIONS OF
CUBIC METERS FOR KLASERIE DAM 39
GRAPH 29: PERCENTAGE CAPACITY AND CAPACITY IN MILLIONS OF CUBIC METERS FOR TOURS DAM 40
GRAPH 30: PERCENTAGE CAPACITY AND CAPACITY IN MILLIONS OF
CUBIC METERS FOR KWENA DAM 41
GRAPH 31: PERCENTAGE CAPACITY AND CAPACITY IN MILLIONS OF CUBIC METERS FOR INYAKA DAM 42
MAP OF LIMPOPO SURFACE MONITORING GAUGING STATIONS 43

5
1. EXECUTIVE SUMMARY
The majority of dams used in this report have more water than during the corresponding period last year. In the Luvuvhu / Letaba Water Management Area the Middle Letaba Dam is at a storage capacity of 50.4% and the Nsami Dam with storage of 54.5%. In the Limpopo WMA the majority of dams have more water than the previous year: The average storage volume for the Limpopo WMA is 273.2 million cubic meters (97.4%) and is 22.5 million cubic meters more than the corresponding period last year (89.4%). The average storage volume for the Luvuvhu / Letaba WMA is 539.8 million cubic meters (81.8%) and is 10.2 million cubic meters more than the corresponding period last year (80.3%). In the Sekhukune area the Flag Boshielo Dam is at a storage level of 91.3% (169 x 106m3) and 14% higher than the previous year, which means that the storage volume is 25.9 million cubic meters more than the corresponding period last year. The average storage volume for the Olifants WMA is 1184.4 million cubic meters (83.5%) and is 210 million cubic meters more than the corresponding period last year (68.7%). Please take note that the De Hoop Dam storage has also been taken into account. The dam is at a storage level of 282.5 million cubic meters (82%) Numerous smaller dams (0.7 – 3.5 million cubic meter capacity) exist in this WMA but only two are equipped with Data Loggers namely Piet Gouws and Molepo Dams. No Real Time data is available from these dams and the obtaining of updated dam status observations are hampered by the remoteness thereof. Although provision has been made at some dams for the installation of Data logging equipment, funds for the purchasing thereof are lacking. The following dams falls within the Olifants WMA, but no status information is available: 1. Piet Gouws (3.94 million Cubic meters), Lola Montes (1.2 million Cubic meters), Makotswane (3.48 million Cubic meters), Spitskop (0.54million Cubic meters), Vergelegen (1.34million Cubic meters) Dr. Esselen (0.73million Cubic meters), Chunnies Poort (2.47million Cubic meters meters), Der Broggen, Lepellane and Mahlangu dams. The average storage volume for the Inkomati WMA is 968.1 million cubic meters (92.2%) and is 20.4 million cubic meters more than the corresponding period last year (90.3%). The challenge in all the WMAs discussed in this report is the fact that there are smaller dams, which supply water to communities that still need to be monitored. Owing to the lack of data these dams could not be included. Infrastructure at these dams are also a major concern and will have to be put in place before any form of water level monitoring can be considered. Gauge plates have been installed at some of the smaller dams, but there are no observers to relay gauge plate readings to the Tzaneen Office. Hout River Dam has been equipped with near real-time data acquisitioning equipment. The information presented in this report is based on the status of all the major dams in the province up to the end of September 2014.

6
2. MONITORING NETWORK The hydrological monitoring network for the Limpopo Province consists of the following amount of gauging stations: 81 river flow gauging stations (excluding canals and pipelines) 21 dam gauging stations 16 evaporation stations It is important to take cognizance of the fact that the hydrological gauging stations in the Crocodile-West and Olifants Water Management Areas (shared boundaries) are being managed by the hydrological offices of Gauteng and Mpumalanga respectively. For the purpose of this report and owing to the strategic location and importance of certain dams in the Olifants and Nkomati Water Management Areas, information regarding their status is also attached. 3. OVERVIEW No river flow gauging stations were used in this report as their importance will only play a role when inflow stream requirements have to be met or during big flood events. Take note that that the following dams have been included under the provincial boundary of the Limpopo Province: Modjadji, Nandoni, Flag Boshielo, Klaserie, Rust De Winter, Tonteldoos, Tours, Vlugkraal and Warmbad. This results in the full supply storage capacity increasing from 767.6 million cubic meters to 1166.6 million cubic meters. To give an indication of what the percentage of normal rainfall was for the period July 2013 up to June 2014, see attached map (page 11). For information purposes a graph depicting provincial rainfall for the current hydrological year is attached (page 12). The National dam storage graph (page 13) has been attached to the report for additional information as well as the graphs of the two WMAs (page 14-15), indicates the current situation clearly. This information was obtained from Mr Elias Nel, National Office. For information purposes a table indicating the comparison of water storage percentage for the different WMA’s is attached on page 16. Rainfall forecasts for October 2014 up to February 2015 are also attached see page 17. This information was obtained from the South African Weather Service. The purpose for attaching graphs of individual dams (pages 18-42) is to give a broader picture of water storage and status in the sub drainage catchments.

7
4. LIMPOPO WATER MANAGEMENT AREA LIMPOPO WATER MANAGEMENT AREA The catchment consists of secondary drainage areas A4, A5, A6, A7 and A8.
4.1 A4 Drainage Area (Matlabas, Mokolo Rivers) The Mokolo Dam (A4R001) was used as no other dam exists in the A4 hydrological monitoring network. The dam storage is at a storage level of 98.5% (143.2 x 10⁶m3) and 5.2% lower than the previous year, which means that the storage volume is 7.5 million cubic meters less than the corresponding period last year. See attached graph! 4.2 A5 Drainage Area (Lephalala River) Two small dams exists in the A5 hydrological network namely the Susandale Dam (A5R001) and the Vischgat Dam (A5R002). Owing to their relatively small storage volumes of approximately 0.6 million cubic meters in total, these dams have not been included in this report! 4.3 A6 Drainage Area (Nile, Sterk, Mogalakwena and Dorps Rivers) The Doorndraai Dam (A6R001) and Glen Alpine Dam (A6R002) were used as no other dams exist in the A6 hydrological monitoring network. The Doorndraai Dam is at a storage level of 95.3% (41.72 x 10⁶m3) and 9% higher than the previous year, which means that the storage volume is 3.94 million cubic meters more than the corresponding period last year. See attached graph! Glen Alpine Dam is at a storage level of 95.9% (18.12 x 10⁶m3) and 38.7% higher than the previous year, which means that the storage volume is 7.3 million cubic meters more than the corresponding period last year. See attached graph! It must be noted that the full capacity storage of Glen Alpine Dam is only 18.889 million cubic and therefore the dam fills and empties much faster than Doorndraai Dam! The graph of Glen Alpine clearly indicates this! Take note that the full supply capacity (18.889 x 10⁶m3) as supplied in the National Weekly Dam Status report, was used for calculation purposes! 4.4 A7 Drainage Area (Sand, Blood, Diep, Hout, Dwars and Brak Rivers) There are no existing dam monitoring stations in the hydrological network for this drainage area! The Tzaneen Area Office in conjunction with the Hydrometry office is currently busy with the installation of gauge plates at dams in both of the Water Management Areas. Hout River Dam has been equipped with gauge plates, but a futile exercise at Mashashane Dam just iterated the point that gauge plates should be installed once water levels are below lowest outlet levels! Data capturing and real-time equipment has been installed at Hout River Dam. Seshego and Rietfontein Dams will be investigated, but due to high water levels and the lack of infrastructure, the installation of gauge plates remains a huge challenge. According to preliminary investigations it seems obvious that the installation of gauge plates will only be feasible when water levels at these dams are on or below lowest outlet levels! 4.5 A8 Drainage Area (Nwanedzi and Nzhelele Rivers) The Nzhelele Dam (A8R001), Luphephe (A8R002), Nwanedzi (A8R003) and Mutshedzi (A8R004) Dams were used as indicators! The Nzhelele Dam is at a storage level of 96% (49.19 x 10⁶m3) and 4.5% higher than the previous year, which means that the storage volume is 2.3 million cubic meters more than the corresponding period last year. See attached graph!
8
Luphephe and Nwanedzi Dams are at storage levels of 99.3% and 98.6% respectively. Their combined storage is at 18.96 x 10⁶m3. The combined storage for the corresponding period the previous year was 17.17 x 10⁶m3. (89.8% of storage volume) See attached graphs! Mutshedzi Dam is at a storage level of 100% (2.04 x 10⁶m3) and the same level as the previous year. See attached graph! 5. LUVUVHU / LETABA WATER MANAGEMENT AREA The catchment consists of secondary drainage areas A9, B8 and B9. 5.1 A9 Drainage Area (Mutale, Luvuvhu Rivers) The Albasini Dam (A9R001), Vondo Dam (A9R002) and Nandoni (A9R004) Dams were used as monitoring points in this report. Albasini Dam is at a storage level of 97.7% (27.56 x 10⁶m3) and 12.6% higher than the previous year, which means that the storage volume is 3.56 million cubic meters more than the corresponding period last year. See attached graph! Vondo Dam is at a storage level of 91.8% (27.95 x 10⁶m3) and 0.6% lower than the previous year, which means that the storage volume is 0.185 million cubic meters more than the corresponding period last year. See attached graph! Nandoni Dam is at a storage level of 99% (164.46 x 10⁶m3) and 0.5% lower than the previous year, which means that the storage volume is 0.82 million cubic meters less than the corresponding period last year. See attached graph! 5.2 B8 Drainage Area (Groot, Middle and Klein Letaba Rivers) The Ebenezer Dam (B8R001), Magoebaskloof Dam (B8R003), Tzaneen Dam (B8R005), Middle-Letaba Dam (B8R007), Nsami Dam (B8R009) and Modjadji Dam (B8R011) were used as monitoring points in this report. The Dap Naudé Dam (B8R006) and Hans Merensky Dam (B8R002) are also being monitored, but were not included in this report! Thapane Dam has been investigated but due to high water levels and the lack of infrastructure, the installation of gauge plates remains a huge challenge. According to preliminary investigations it seems obvious that the installation of gauge plates will only be feasible when the water level at this dam is on or below lowest outlet level! The Ebenezer Dam is at a storage level of 98.3% (67.99 x 10⁶m3) and 0.9% lower than the previous year, which means that the storage volume is 0.61 million cubic meters less than the corresponding period last year. See attached graph! Magoebaskloof Dam is at a storage level of 100.3% (4.853 x 10⁶m3) and 0.1% lower than the previous year, which means that the storage volume virtually the same as the corresponding period last year. See attached graph! Take note that the full supply capacity (4.84 x 10⁶m3) as supplied in the National Weekly Dam Status report, was used for calculation purposes!

9
Tzaneen Dam is at a storage level of 88.8% (139.02 x 10⁶m3) and 0.8% lower than the previous year, which means that the storage volume is 1.29 million cubic meters less than the corresponding period last year. See attached graph! Take note that the full supply capacity (156.53 x 10⁶m3) as supplied in the National Weekly Dam Status report, was used for calculation purposes! Middle-Letaba Dam is at a storage level of 50.4% (86.72 x 10⁶m3) and 6.2% higher than the previous year, which means that the storage volume is 10.67 million cubic meters more than the corresponding period last year. See attached graph! The Nsami Dam is at a storage level of 54.5% (11.92 x 10⁶m3) and 5.9% lower than the previous year, which means that the storage volume is 1.28 million cubic meters less than the corresponding period last year. The Modjadji Dam is at a storage level of 85.1% (6.11 x 10⁶m3) and 6.5% higher than the previous year, which means that the storage volume is 0.46 million cubic meters more than the corresponding period last year. 5.3 B9 Drainage Area (Shingwedzi, Phugwane and Mphongolo Rivers) Only a limited part of this drainage area falls outside the Kruger National Park! There are no existing dam monitoring stations in the hydrological network for this drainage area! 6. OLIFANTS WATER MANAGEMENT AREA Monitoring points in the B3, B5, B6 and, B7 sub drainage areas were also included in this report owing to their strategic location and importance to operational matters in the Limpopo Province. 6.1 B3 Drainage Area (Olifants, Elands, Bloed and Selons Rivers) For information as well as operational matters the status of Rust de Winter Dam (B3R001) and Loskop Dam (B3R002) has been included in this report. Rust de Winter Dam is at a storage level of 98.3% (27.7 x 10⁶m3) and 7.3% higher than the previous year, which means that the storage volume is 2.08 million cubic meters more than the corresponding period last year. See attached graph! Loskop Dam is at a storage level of 92.9% (335.98 x 10⁶m3) and 22.5% higher than the previous year, which means that the storage volume is 81.59 million cubic meters more than the corresponding period last year. See attached graph! 6.2 B5 Drainage Area (Olifants River)
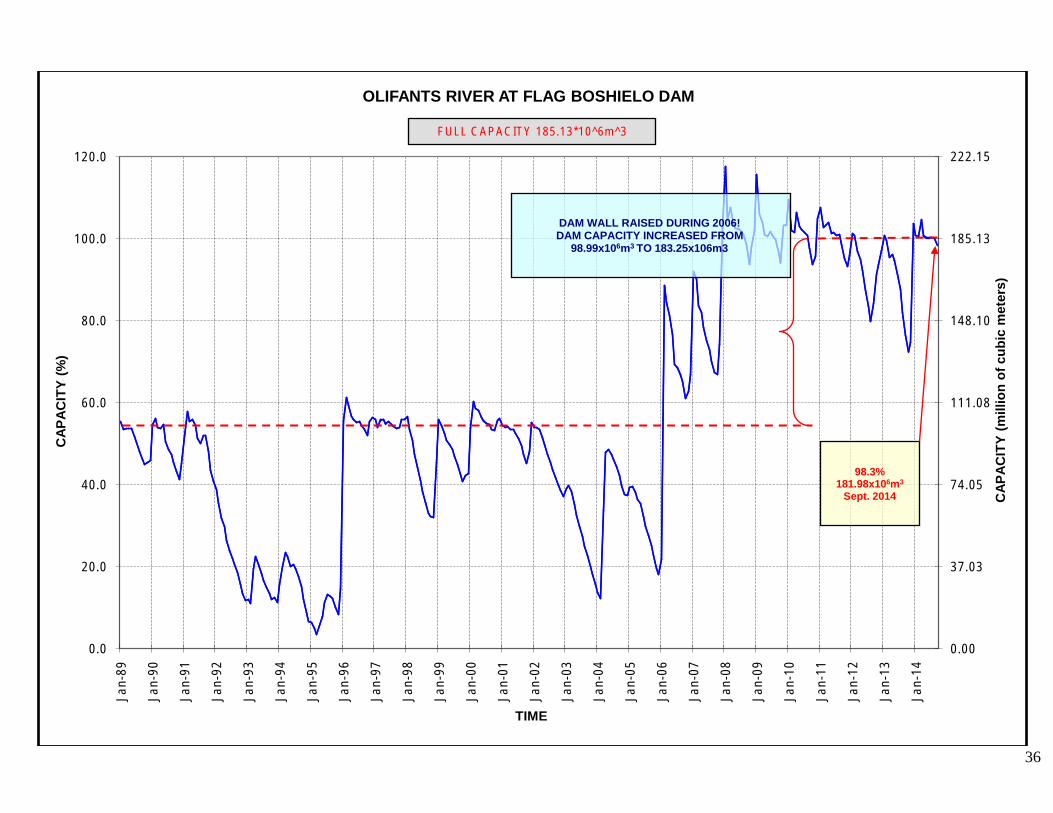
For information as well as operational matters the status of Flag Boshielo Dam (B5R002) has been included in this report. Flag Boshielo Dam is at a storage level of 91.3% (169.02 x 10⁶m3) and 14.8% higher than the previous year, which means that the storage volume is 27.3 million cubic meters more than the corresponding period last year. See attached graph! 6.3 B6 Drainage Area (Blyde and Ohrigstad Rivers) For information as well as operational matters the status of Ohrigstad Dam (B6R001) and Blyde Rivierspoort Dam (B6R003) has been included in this report.

10
Ohrigstad Dam is at a storage level of 72.1% (9.7 x 10⁶m3) and 11.6% lower than the previous year, which means that the storage volume is 1.56 million cubic meters less than the corresponding period last year. See attached graph! Take note that the full supply capacity (13.448 x 10⁶m3) as supplied in the National Weekly Dam Status report, was used for calculation purposes! Blyde Dam is at a storage level of 96.1% (52.2 x 10⁶m3) and 1.4% higher than the previous year, which means that the storage volume is 0.73 million cubic meters more than the corresponding period last year. See attached graph! Take note that the full supply capacity (54.369 x 10⁶m3) as supplied in the National Weekly Dam Status report, was used for calculation purposes! 6.4 B7 Drainage Area (Klaserie and Olifants Rivers) For information as well as operational matters the status of Klaserie Dam (B7R001) and Tours Dam (B7R003) has been included in this report. Klaserie Dam is at a storage level of 102.3% (5.74 x 10⁶m3) and 6.4% higher than the previous year, which means that the storage volume is 0.37 million cubic meters more than the corresponding period last year. See attached graph! Tours Dam is at a storage level of 93.7% (5.7 x 10⁶m3) and 0.1% higher than the previous year, which means that the storage volume is virtually the same as the corresponding period last year. See attached graph! Take note that the full supply capacities (5.604 x 10⁶m3 and 6.084 x 10⁶m3) Klaserie and Tours Dams respectively, as supplied in the National Weekly Dam Status report, were used for calculation purposes! 7. NKOMATI WATER MANAGEMENT AREA 7.1 X2 Drainage Area (Crocodile River) For information as well as operational matters the status of Kwena Dam (X2R005) has been included in this report. Kwena Dam is at a storage level of 91.2% (144.95 x 10⁶m3) and 3.6% lower than the previous year, which means that the storage volume is 5.68 million cubic meters less than the corresponding period last year. See attached graph! 7.2 X3 Drainage Area (Mariti River) For information as well as operational matters the status of Inyaka Dam (X3R002) has been included in this report. Inyaka Dam is at a storage level of 97.9% (121.08 x 10⁶m3) and 1.2% lower than the previous year, which means that the storage volume is 1.45 million cubic meters less than the corresponding period last year. See attached graph!


12

13
0
10
20
30
40
50
60
70
80
90
10015
-Oct
-80
15-O
ct-8
115
-Oct
-82
15-O
ct-8
315
-Oct
-84
15-O
ct-8
515
-Oct
-86
15-O
ct-8
715
-Oct
-88
15-O
ct-8
915
-Oct
-90
15-O
ct-9
115
-Oct
-92
15-O
ct-9
315
-Oct
-94
15-O
ct-9
515
-Oct
-96
15-O
ct-9
715
-Oct
-98
15-O
ct-9
915
-Oct
-00
15-O
ct-0
115
-Oct
-02
15-O
ct-0
315
-Oct
-04
15-O
ct-0
515
-Oct
-06
15-O
ct-0
715
-Oct
-08
15-O
ct-0
915
-Oct
-10
15-O
ct-1
115
-Oct
-12
15-O
ct-1
315
-Oct
-14
% o
f FSC
Period
National Dams: Water Storage: The Storage for 15 September 2014 since August 1981 (Weekly values since 4/10/04)
Inspired by E A Nel
15 September 2014: STORAGE = 82.1% FSC; Median for August since 1981 = 70.2%
2 Jan 200656.0%
15 Nov 199534.4%
15 Nov 198334.0%
FSC 1 APR 1980=23113 mcmFSC 1 APR 2010=31719 mcm
NOW 137% OF 1980 FSC
15 Sep 201482.1%
15 Sep 1985
15 Sep 1987
15 Dec 1999
15 Jan 1991
1 Oct 2007
14
50
55
60
65
70
75
80
85
90
95
100
105
1101-
Oct
15-O
ct
29-O
ct
12-N
ov
26-N
ov
10-D
ec
24-D
ec
7-Ja
n
21-J
an
4-Fe
b
18-F
eb
4-M
ar
18-M
ar
1-Ap
r
15-A
pr
29-A
pr
13-M
ay
27-M
ay
10-J
un
24-J
un
8-Ju
l
22-J
ul
5-Au
g
19-A
ug
2-Se
p
16-S
ep
% S
tora
ge
Week
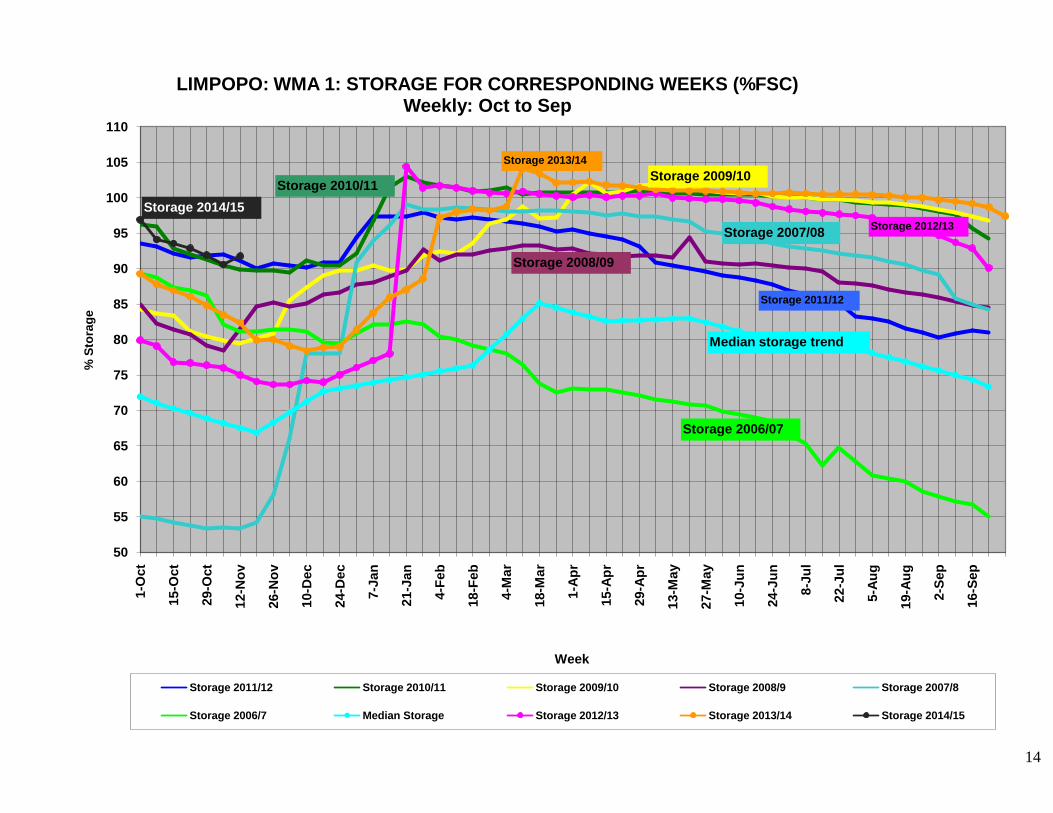
LIMPOPO: WMA 1: STORAGE FOR CORRESPONDING WEEKS (%FSC)Weekly: Oct to Sep
Storage 2011/12 Storage 2010/11 Storage 2009/10 Storage 2008/9 Storage 2007/8
Storage 2006/7 Median Storage Storage 2012/13 Storage 2013/14 Storage 2014/15
Median storage trend
Storage 2010/11
Storage 2008/09
Storage 2007/08
Storage 2006/07
Storage 2009/10
Storage 2011/12
Storage 2012/13
Storage 2013/14
Storage 2014/15

15
30
35
40
45
50
55
60
65
70
75
80
85
90
95
1001-
Oct
15-O
ct
29-O
ct
12-N
ov
26-N
ov
10-D
ec
24-D
ec
7-Ja
n
21-J
an
4-Fe
b
18-F
eb
4-M
ar
18-M
ar
1-Ap
r
15-A
pr
29-A
pr
13-M
ay
27-M
ay
10-J
un
24-J
un
8-Ju
l
22-J
ul
5-Au
g
19-A
ug
2-Se
p
16-S
ep
% S
tora
ge
Week
Luvuvhu-Letaba: WMA 2: STORAGE FOR CORRESPONDING WEEKS (%FSC)Weekly: Oct to Sep
Storage 2011/12 Storage 2010/11 Storage 2009/10 Storage 2008/9 Storage 2007/8
Storage 2006/7 Median Storage Storage 2012/13 Storage 2013/14 Storage 2014/15
Median storage trend
Storage 2010/11
Storage 2008/09
Storage 2007/08
Storage 2006/07
Storage 2009/10
Storage 2011/12
Storage 2012/13
Storage 2013/14
Storage 2014/15

16
29/09/2014

17
Figure 1: Rainfall forecasts for the three overlapping seasons valid for the period of October 2014 to February 2015

18
0 .00
29 .07
58 .15
87 .22
116 .29
145 .37
0 .0
20 .0
40 .0
60 .0
80 .0
100 .0
Apr-8
0
Apr-8
2
Apr-8
4
Apr-8
6
Apr-8
8
Apr-9
0
Apr-9
2
Apr-9
4
Apr-9
6
Apr-9
8
Apr-0
0
Apr-0
2
Apr-0
4
Apr-0
6
Apr-0
8
Apr-1
0
Apr-1
2
Apr-1
4
CA
PAC
ITY
(mill
ion
of c
ubic
met
ers)
CA
PAC
ITY
(%)
TIME
MOGOL RIVER AT MOKOLO DAM
FU LL C A P A C ITY 145.37 *10^6m ^3
98.5%143.18106m3
Sept. 2014

19
0.00
8.75
17.50
26.26
35.01
43.76
0.0
20.0
40.0
60.0
80.0
100.0
Mar
-53
Mar
-56
Mar
-59
Mar
-62
Mar
-65
Mar
-68
Mar
-71
Mar
-74
Mar
-77
Mar
-80
Mar
-83
Mar
-86
Mar
-89
Mar
-92
Mar
-95
Mar
-98
Mar
-01
Mar
-04
Mar
-07
Mar
-10
Mar
-13
CAP
AC
ITY
(mill
ions
of c
ubic
met
ers)
CAP
AC
ITY
(%)
TIME
STERK RIVER AT DOORNDRAAI DAM
FU LL C A P A C ITY 43 .76 *10^6m ^3FU LL C A P A C ITY 43 .76 *10^6m ^3
95.341.71x106m3
Sept. 2014

20
0.00
3.78
7.56
11.33
15.11
18.89
0.0
20.0
40.0
60.0
80.0
100.0
Oct
-67
Oct
-72
Oct
-77
Oct
-82
Oct
-87
Oct
-92
Oct
-97
Oct
-02
Oct
-07
Oct
-12
CAP
AC
ITY
(mill
ions
of c
ubic
met
ers)
CAP
AC
ITY
(%)
TIME
MOKGALAKWENA RIVER AT GLEN ALPINE DAM
FU LL C A P A C ITY 18 .89 *10^6m ^3
95.9%18.11x10⁶m3
Sept. 2014

21
0.00
10.25
20.49
30.74
40.98
51.23
0.0
20.0
40.0
60.0
80.0
100.0
Feb-
48
Feb-
53
Feb-
58
Feb-
63
Feb-
68
Feb-
73
Feb-
78
Feb-
83
Feb-
88
Feb-
93
Feb-
98
Feb-
03
Feb-
08
Feb-
13
CAP
AC
ITY
(%)
TIME
NZHELELE RIVER AT NZHELELE DAM
F U LL C A P A C IT Y 51 .23 *10^6m ^3
96%49.18x10⁶m3
Sept. 2014
D A M W A LL R A IS E D D U R IN G 1968!FU LL S U P LY C A P A C ITY IN C R E A S E D FR O M
31.58x10 6m 3 TO 57.12x10 6m 3
G A P IN R E C O R D - N O R E LIA B LE
D A TA A V A ILA B LE!
N o te : V a rious F u ll S upp ly Leve ls as a resu lt o f s ilta tion !

22
0.00
2.80
5.59
8.39
11.18
13.98
0.0
20.0
40.0
60.0
80.0
100.0
May
-79
May
-81
May
-83
May
-85
May
-87
May
-89
May
-91
May
-93
May
-95
May
-97
May
-99
May
-01
May
-03
May
-05
May
-07
May
-09
May
-11
May
-13
CAP
AC
ITY
(mill
ion
of c
ubic
met
ers)
CAP
AC
ITY
(%)
TIME
LUPHEPHE RIVER AT LUPHEPHE DAM
F U LL C A P A C IT Y 13 .984 *10^6m ^3
99.3%13.89x10⁶m3
Sept. 2014

23
0.00
1.03
2.06
3.08
4.11
5.14
0.0
20.0
40.0
60.0
80.0
100.0
Oct
-79
Oct
-81
Oct
-83
Oct
-85
Oct
-87
Oct
-89
Oct
-91
Oct
-93
Oct
-95
Oct
-97
Oct
-99
Oct
-01
Oct
-03
Oct
-05
Oct
-07
Oct
-09
Oct
-11
Oct
-13
CAP
AC
ITY
(mill
ion
of c
ubic
met
ers)
CAP
AC
ITY
(%)
TIME
NWANEDZI RIVER AT NWANEDZI DAM
F U LL C A P A C IT Y 5 .14 *10^6m ^3
98.6%5.07x10⁶m3
Sept. 2014

24
0
0.468
0.936
1.404
1.872
2.34
0.0
20.0
40.0
60.0
80.0
100.0
Jul-9
0
Jul-9
1
Jul-9
2
Jul-9
3
Jul-9
4
Jul-9
5
Jul-9
6
Jul-9
7
Jul-9
8
Jul-9
9
Jul-0
0
Jul-0
1
Jul-0
2
Jul-0
3
Jul-0
4
Jul-0
5
Jul-0
6
Jul-0
7
Jul-0
8
Jul-0
9
Jul-1
0
Jul-1
1
Jul-1
2
Jul-1
3
Jul-1
4
CAP
AC
ITY
(mill
ion
of c
ubic
met
ers)
CAP
AC
ITY
(%)
TIME
MUTSHEDZI RIVER AT MUTSHEDZI DAM
F U LL C A P A C IT Y 2 .34 *10^6m ^3
100 %2.34x10⁶m3
Sept. 2014
G reen line is based on s ilt survey perform ed a fte r 2000 flood event. Fu ll
capac ity vo lum e for th is period need to be verified !

25
0.00
5.64
11.28
16.92
22.56
28.20
0.0
20.0
40.0
60.0
80.0
100.0
Oct
-52
Oct
-54
Oct
-56
Oct
-58
Oct
-60
Oct
-62
Oct
-64
Oct
-66
Oct
-68
Oct
-70
Oct
-72
Oct
-74
Oct
-76
Oct
-78
Oct
-80
Oct
-82
Oct
-84
Oct
-86
Oct
-88
Oct
-90
Oct
-92
Oct
-94
Oct
-96
Oct
-98
Oct
-00
Oct
-02
Oct
-04
Oct
-06
Oct
-08
Oct
-10
Oct
-12
CAP
AC
ITY
(%)
TIME
LUVUVHU RIVER AT ALBASINI DAM
F U LL C A P A C IT Y 28 .21*10^6m ^3
97.7%27.56x10⁶m3
Sept. 2014

26
0.00
6.09
12.18
18.27
24.36
30.45
0.0
20.0
40.0
60.0
80.0
100.0
Dec
-93
Dec
-94
Dec
-95
Dec
-96
Dec
-97
Dec
-98
Dec
-99
Dec
-00
Dec
-01
Dec
-02
Dec
-03
Dec
-04
Dec
-05
Dec
-06
Dec
-07
Dec
-08
Dec
-09
Dec
-10
Dec
-11
Dec
-12
Dec
-13
CAP
AC
ITY
(mill
ion
of c
ubic
met
ers)
CAP
AC
ITY
(%)
TIME
MUTSHINDUDI RIVER AT VONDO DAM
FU LL C A P A C ITY 30 .447*10^6m ^3
101.2%30.82x10⁶m3
March 2014

27
0.00
33.22
66.44
99.66
132.88
166.10
199.32
0.0
20.0
40.0
60.0
80.0
100.0
120.0
Feb-
05
Aug-
05
Feb-
06
Aug-
06
Feb-
07
Aug-
07
Feb-
08
Aug-
08
Feb-
09
Aug-
09
Feb-
10
Aug-
10
Feb-
11
Aug-
11
Feb-
12
Aug-
12
Feb-
13
Aug-
13
Feb-
14
Aug-
14
CAP
AC
ITY
(mill
ion
of c
ubic
met
ers)
CAP
AC
ITY
(%)
TIME
LUVUVHU RIVER AT NANDONI DAM
FU LL C A P A C ITY 166.11*10^6m ^3
99%164.45x10⁶m3
Sept. 2014
Note: Full Supply Capacity was adjusted from 150 million cubic meters to 166.11 million cubic meters, after dam basin survey was completed by HO!

28
0.00
13.83
27.65
41.48
55.31
69.14
0.0
20.0
40.0
60.0
80.0
100.0
Jun-
59
May
-61
Apr-6
3
Mar
-65
Feb-
67
Jan-
69
Dec
-70
Nov
-72
Oct
-74
Sep-
76
Aug-
78
Jul-8
0
Jun-
82
May
-84
Apr-8
6
Mar
-88
Feb-
90
Jan-
92
Dec
-93
Nov
-95
Oct
-97
Sep-
99
Aug-
01
Jul-0
3
Jun-
05
May
-07
Apr-0
9
Mar
-11
Feb-
13
CAP
AC
ITY
(mill
ion
of c
ubic
met
ers)
CAP
AC
ITY
(%)
TIME
GREAT LETABA RIVER AT EBENEZER DAM
FU LL C A P A C ITY 69.139 *10^6m ^3
98.3%67.96x10⁶m3
Sept. 2014

29
0.00
0.97
1.94
2.90
3.87
4.84
0.0
20.0
40.0
60.0
80.0
100.0
Jun-
71
Jun-
76
Jun-
81
Jun-
86
Jun-
91
Jun-
96
Jun-
01
Jun-
06
Jun-
11
CAP
AC
ITY
(%)
TIME
POLITSI RIVER AT MAGOEBASKLOOF DAM
FU LL C A P A C ITY 4 .840 *10^6m ^3
100.34.85x106m3
Sept 2014

30
0.00
31.31
62.61
93.92
125.22
156.53
0.0
20.0
40.0
60.0
80.0
100.0
Jan-
77
Dec
-78
Nov
-80
Oct
-82
Sep-
84
Aug-
86
Jul-8
8
Jun-
90
May
-92
Apr-9
4
Mar
-96
Feb-
98
Jan-
00
Dec
-01
Nov
-03
Oct
-05
Sep-
07
Aug-
09
Jul-1
1
Jun-
13
CAP
AC
ITY
(mill
ion
of c
ubic
met
ers)
CAP
AC
ITY
(%)
TIME
GREAT LETABA RIVER AT TZANEEN DAM
FU LL C A P A C ITY 156.53 *10^6m ^3
88.8%139x106m3
Sept.2014

31
0.00
34.39
68.78
103.17
137.56
171.95
0.00
20.00
40.00
60.00
80.00
100.00
Mar
-86
Feb-
87
Jan-
88
Dec
-88
Nov
-89
Oct
-90
Sep-
91
Aug-
92
Jul-9
3
Jun-
94
May
-95
Apr-9
6
Mar
-97
Feb-
98
Jan-
99
Dec
-99
Nov
-00
Oct
-01
Sep-
02
Aug-
03
Jul-0
4
Jun-
05
May
-06
Apr-0
7
Mar
-08
Feb-
09
Jan-
10
Dec
-10
Nov
-11
Oct
-12
Sep-
13
Aug-
14
CAP
AC
ITY
(mill
ions
of c
ubic
met
ers)
CAP
AC
ITY
(%)
TIME
MIDDLE LETABA RIVER AT MIDDLE LETABA DAM
FU LL C A P A C ITY 171.93 *10^6m ^3
50.4%86.66x10⁶m3
Sept. 2014

32
0.00
4.37
8.75
13.12
17.49
21.87
26.24
30.61
34.98
0
20
40
60
80
100
120
140
160Ju
n-95
May
-96
Apr-9
7
Mar
-98
Feb-
99
Jan-
00
Dec
-00
Nov
-01
Oct
-02
Sep-
03
Aug-
04
Jul-0
5
Jun-
06
May
-07
Apr-0
8
Mar
-09
Feb-
10
Jan-
11
Dec
-11
Nov
-12
Oct
-13
Sep-
14
CAP
AC
ITY
(mill
ions
of c
ubic
met
ers)
CAP
AC
ITY
(%)
TIME
NSAMI DAM AT NSAMA RIVERFU LL C A P A C ITY 21 .87 *10^6m ^3
54.5%11.92x10⁶m3
Sept. 2014

33
0.00
1.44
2.87
4.31
5.74
7.18
0.0
20.0
40.0
60.0
80.0
100.0
Sep-
97
Sep-
98
Sep-
99
Sep-
00
Sep-
01
Sep-
02
Sep-
03
Sep-
04
Sep-
05
Sep-
06
Sep-
07
Sep-
08
Sep-
09
Sep-
10
Sep-
11
Sep-
12
Sep-
13
Sep-
14
CAP
AC
ITY
(mill
ions
of c
ubic
met
ers)
CAP
AC
ITY
(%)
TIME
MOLOTOTSI RIVER AT MODJADJI DAM
FU LL C A P A C ITY 7 .18 *10^6m ^3
85.1%6.11x10⁶m3
Sept. 2014
Note: Information based on insufficient survey data!

34
0.00
5.64
11.27
16.91
22.54
28.18
0.0
20.0
40.0
60.0
80.0
100.0
Dec
-33
Dec
-38
Dec
-43
Dec
-48
Dec
-53
Dec
-58
Dec
-63
Dec
-68
Dec
-73
Dec
-78
Dec
-83
Dec
-88
Dec
-93
Dec
-98
Dec
-03
Dec
-08
Dec
-13
CAP
AC
ITY
(mill
ion
of c
ubic
met
ers)
CAP
AC
ITY
(%)
TIME
ELANDS RIVER AT RUST DE WINTER DAM
FU LL C A P A C ITY 28 .186*10^6m ^3
98.3%27.71x10⁶m3
Sept. 2014

35
0.00
72.30
144.60
216.91
289.21
361.51
0.0
20.0
40.0
60.0
80.0
100.0
Dec
-197
8
Dec
-198
0
Dec
-198
2
Dec
-198
4
Dec
-198
6
Dec
-198
8
Dec
-199
0
Dec
-199
2
Dec
-199
4
Dec
-199
6
Dec
-199
8
Dec
-200
0
Dec
-200
2
Dec
-200
4
Dec
-200
6
Dec
-200
8
Dec
-201
0
Dec
-201
2
CAP
AC
ITY
(mill
ion
of c
ubic
met
ers)
CAP
AC
ITY
(%)
TIME
OLIFANTS RIVER AT LOSKOP DAM
FU LL C A P A C ITY 361 .51*10^6m ^3
92.9%335.84x10⁶m3
March 2014
36
0.00
37.03
74.05
111.08
148.10
185.13
222.15
0.0
20.0
40.0
60.0
80.0
100.0
120.0
Jan-
89
Jan-
90
Jan-
91
Jan-
92
Jan-
93
Jan-
94
Jan-
95
Jan-
96
Jan-
97
Jan-
98
Jan-
99
Jan-
00
Jan-
01
Jan-
02
Jan-
03
Jan-
04
Jan-
05
Jan-
06
Jan-
07
Jan-
08
Jan-
09
Jan-
10
Jan-
11
Jan-
12
Jan-
13
Jan-
14
CAP
AC
ITY
(mill
ion
of c
ubic
met
ers)
CAP
AC
ITY
(%)
TIME
OLIFANTS RIVER AT FLAG BOSHIELO DAM
FU LL C A P A C ITY 185 .13*10^6m ^3
98.3%181.98x10⁶m3
Sept. 2014
DAM WALL RAISED DURING 2006! DAM CAPACITY INCREASED FROM
98.99x10⁶m3 TO 183.25x10⁶m3

37
0.00
2.69
5.38
8.07
10.76
13.45
0.0
20.0
40.0
60.0
80.0
100.0
May
-56
May
-61
May
-66
May
-71
May
-76
May
-81
May
-86
May
-91
May
-96
May
-01
May
-06
May
-11
CAP
AC
ITY
(%)
TIME
OHRIGSTAD RIVER AT OHRIGSTAD DAM
FU LL C A P A C ITY 13 .45*10^6m ^3
72.1%9.7x10⁶m3
Sept. 2014

38
0.00
10.87
21.75
32.62
43.49
54.37
0.0
20.0
40.0
60.0
80.0
100.0
Dec
-75
Dec
-77
Dec
-79
Dec
-81
Dec
-83
Dec
-85
Dec
-87
Dec
-89
Dec
-91
Dec
-93
Dec
-95
Dec
-97
Dec
-99
Dec
-01
Dec
-03
Dec
-05
Dec
-07
Dec
-09
Dec
-11
Dec
-13
CAP
AC
ITY
(mill
ions
of c
ubic
met
ers)
CAP
AC
ITY
(%)
TIME
BLYDE RIVER AT BLYDE RIVIERSPOORT DAM
FU LL C A P A C ITY 54 .369*10^6m ^3
96.1%52.25x10⁶m3
Sept. 2014

39
0.00
1.12
2.24
3.36
4.48
5.60
0.0
20.0
40.0
60.0
80.0
100.0
Apr-6
8
Apr-7
0
Apr-7
2
Apr-7
4
Apr-7
6
Apr-7
8
Apr-8
0
Apr-8
2
Apr-8
4
Apr-8
6
Apr-8
8
Apr-9
0
Apr-9
2
Apr-9
4
Apr-9
6
Apr-9
8
Apr-0
0
Apr-0
2
Apr-0
4
Apr-0
6
Apr-0
8
Apr-1
0
Apr-1
2
Apr-1
4
CAP
AC
ITY
(mill
ions
of c
ubic
met
ers)
CAP
AC
ITY
(%)
TIME
KLASERIE RIVER AT KLASERIE DAM
FU LL C A P A C ITY 5 .604*10^6m ^3
102.3%5.73x10⁶m3
Sept. 2014

40
0.00
1.22
2.43
3.65
4.86
6.08
0.0
20.0
40.0
60.0
80.0
100.0
Sep-
92
Sep-
93
Sep-
94
Sep-
95
Sep-
96
Sep-
97
Sep-
98
Sep-
99
Sep-
00
Sep-
01
Sep-
02
Sep-
03
Sep-
04
Sep-
05
Sep-
06
Sep-
07
Sep-
08
Sep-
09
Sep-
10
Sep-
11
Sep-
12
Sep-
13
Sep-
14
CAP
AC
ITY
(%)
TIME
NGWABITSI RIVER AT TOURS DAM
FU LL C A P A C ITY 6 .084*10^6m ^3
93.7%5.70x10⁶m3
Sept. 2014
G A P IN R E C O R D -N O D A TA
A V A ILA B LE!

41
0.00
31.78
63.55
95.33
127.11
158.89
0.0
20.0
40.0
60.0
80.0
100.0
Dec
-85
Nov
-86
Oct
-87
Sep-
88
Aug-
89
Jul-9
0
Jun-
91
May
-92
Apr-9
3
Mar
-94
Feb-
95
Jan-
96
Dec
-96
Nov
-97
Oct
-98
Sep-
99
Aug-
00
Jul-0
1
Jun-
02
May
-03
Apr-0
4
Mar
-05
Feb-
06
Jan-
07
Dec
-07
Nov
-08
Oct
-09
Sep-
10
Aug-
11
Jul-1
2
Jun-
13
May
-14
CAP
AC
ITY
(%)
TIME
CROCODILE RIVER AT KWENA DAM
FU LL C A P A C ITY 158.89 *10^6m ^3
91.2%144.91x10⁶m3
Sept. 2014
CAP
AC
ITY
(mill
ions
of c
ubic
met
ers)

42
0.00
24.73
49.46
74.20
98.93
123.66
0.00
20.00
40.00
60.00
80.00
100.00
Apr-0
2
Apr-0
3
Apr-0
4
Apr-0
5
Apr-0
6
Apr-0
7
Apr-0
8
Apr-0
9
Apr-1
0
Apr-1
1
Apr-1
2
Apr-1
3
Apr-1
4
CAP
ACIT
Y (%
)
TIME
MERITI RIVER AT INYAKA DAM
FU LL C A P A C ITY 123.66 *10^6m ^3
97.9 %121.06x10⁶m3
Sept. 2014
CAP
AC
ITY
(mill
ions
of c
ubic
met
ers)

43