department of public safety and correctional services · sb 946 requires the department of public...
TRANSCRIPT

DEPARTMENT OF PUBLIC SAFETY AND CORRECTIONAL SERVICES
Report on Restrictive Housing – Fiscal Year 2016
Fulfilling Reporting Requirements of SB 946
December 2016
Governor Lawrence J. Hogan Lt. Governor Boyd K. Rutherford
Secretary Stephen T. Moyer

Report on the use of Restrictive Housing during Fiscal Year 2016
TABLE OF CONTENTS
Page
Introduction……………………………………………………………………………………………………... 1
Overview……………………………………………………………………………………….……………….… 2
DPSCS Population and Demographics…………………………………………………………….… 4
Restrictive Housing Placements and Individuals Placed …………….………………….…. 5
Individuals Placed Age Demographics………………………….……………………… 6
Individuals Placed Race Demographics……………………….…………………….… 7
Serious Mental Illness ……………………………………………………………………………………... 8
Pregnancy……………………………………………………………………………………………………….. 8
Lengths of Stay………………………………………………………………………………………..………. 8
Deaths, Self-Harm and Attempted Self-Harm …………………………………….…………... 9
Direct Releases from Restrictive Housing……………………………….……………..…..……. 9
Miscellaneous Data …………………………………………………………………………………………. 9
Restrictive Housing Policy and Procedure……………………………………………….………. 10
Conclusion……………………………………………………………………………………………….………. 11

1
INTRODUCTION
Senate Bill 946 (SB 946), Chapter 596, Correctional Services – Restrictive Housing – Report went into effect October 1, 2016. SB 946 requires the Department of Public Safety and Correctional Services (“the Department”) to submit the preceding year’s restrictive housing data to the Governor’s Office of Crime Control and Prevention for publication on their web site. This report includes restrictive housing data for fiscal year 2016 (FY16). FY16 begins July 1, 2015 and ends June 30, 2016. SB 946 requires the following restrictive housing data elements be reported:
the total population of the correctional facility;
the number of inmates who have been placed in restrictive housing during the preceding year by age, race, gender, classification of housing, and the basis for the inmate’s placement in restrictive housing;
the department’s definition of “serious mental illness” and the number of inmates with serious mental illness that were placed in restrictive housing during the preceding year;
the number of inmates known to be pregnant when placed in restrictive housing during the preceding year;
the average and median lengths of stay in restrictive housing of the inmates placed in restrictive housing during the preceding year;
the number of incidents of death, self-harm, and attempts at self-harm by inmates in restrictive housing during the preceding year;
the number of inmates released from restrictive housing directly into the community during the preceding year;
any other data DPSCS considers relevant to the use of restrictive housing by correctional facilities in the State;
and, any changes to written policies or procedures at each correctional facility relating to the use and conditions of restrictive housing, including steps to reduce reliance on restrictive housing.

2
OVERVIEW – Restrictive Housing
The types of restrictive housing used throughout the Department currently include:
Administrative Segregation - The housing status for an inmate who requires close supervision or limited segregation from the general population. This status may be utilized to ensure the safety and security of the facility, staff, individual inmate, or the general inmate population. While inmates placed on administrative segregation are held in their cells, segregated from the general population, they still retain many privileges that Disciplinary Segregation inmates do not retain. Two examples of common reasons for an inmate to be placed on Administrative Segregation are:
o An inmate is being investigated under suspicion of being involved in activities that pose a direct threat to facility, staff or inmate security or safety; and
o An inmate has received a serious infraction report and is awaiting their disciplinary hearing.
Disciplinary Segregation - A special housing status, where the inmate is removed from the general inmate population. This status is often used for those inmates who have been found guilty at an adjustment hearing for violating Departmental rules, institutional rules, or both.
Special Housing, sometimes confused with Restrictive Housing, does not restrict the inmate’s privileges. Inmates housed in the following two types of special housing share the same privileges of general population inmates.
Protective Custody – A special housing status for an inmate who requires a period of separation from the general population, protection for safety reasons or both. These inmates receive the same privileges as those inmates in general population.
Special Needs Unit – Housing status designed to manage inmates with a serious mental illness in the least restrictive environment as possible, with the goal of returning the inmate to general population and providing aftercare support. These are operated as general population tiers with a special designation. These units offer more intensive mental health services.
3
DPSCS Population and Demographics
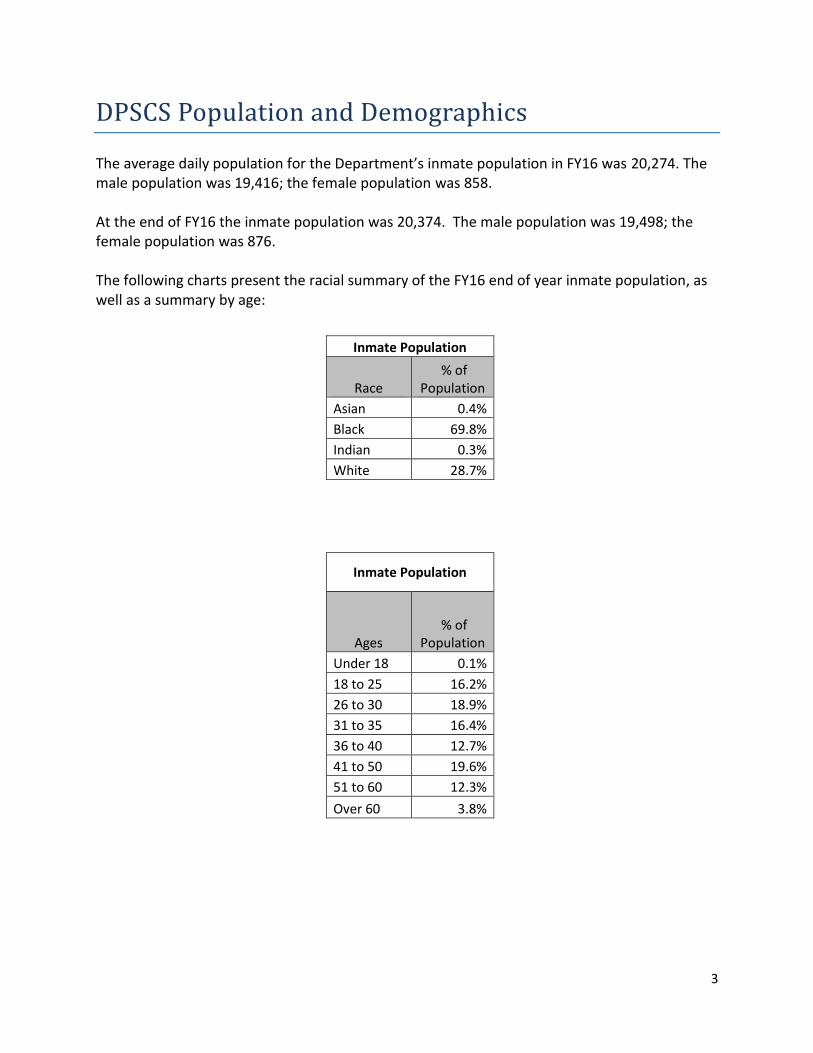
The average daily population for the Department’s inmate population in FY16 was 20,274. The male population was 19,416; the female population was 858. At the end of FY16 the inmate population was 20,374. The male population was 19,498; the female population was 876. The following charts present the racial summary of the FY16 end of year inmate population, as well as a summary by age:
Inmate Population
Ages % of
Population
Under 18 0.1%
18 to 25 16.2%
26 to 30 18.9%
31 to 35 16.4%
36 to 40 12.7%
41 to 50 19.6%
51 to 60 12.3%
Over 60 3.8%
Inmate Population
Race % of
Population
Asian 0.4%
Black 69.8%
Indian 0.3%
White 28.7%
4
Restrictive Housing Placements and Individuals Placed
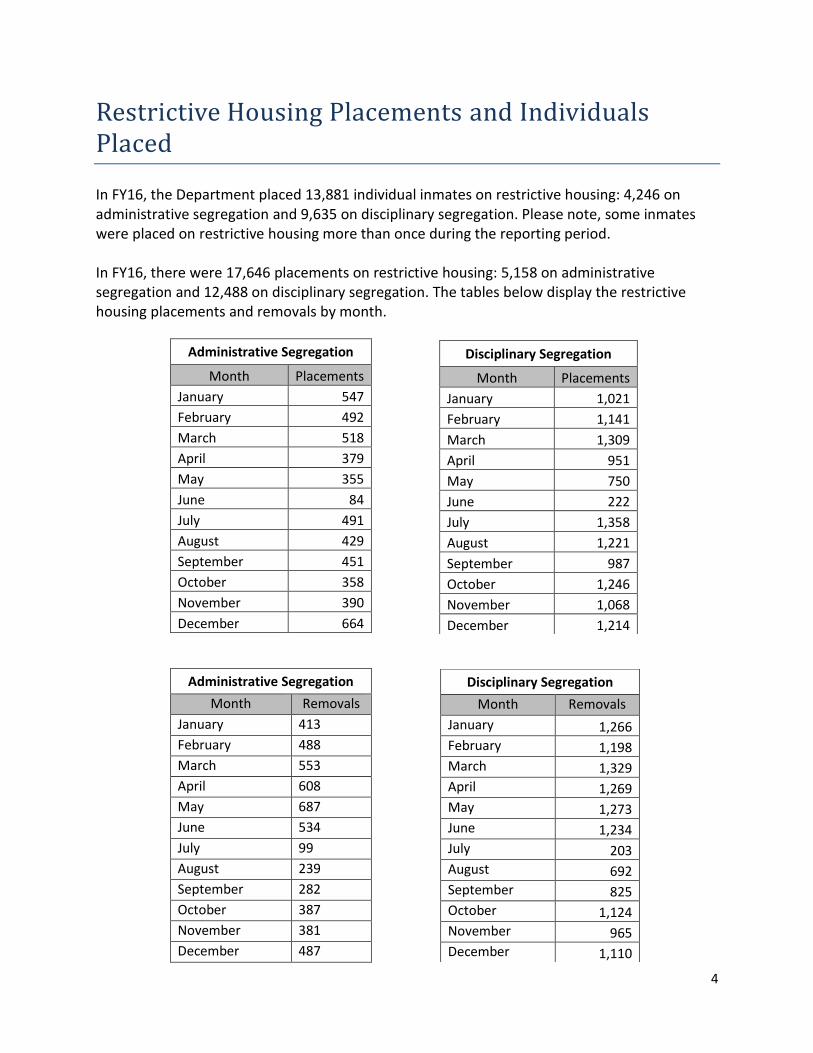
In FY16, the Department placed 13,881 individual inmates on restrictive housing: 4,246 on administrative segregation and 9,635 on disciplinary segregation. Please note, some inmates were placed on restrictive housing more than once during the reporting period. In FY16, there were 17,646 placements on restrictive housing: 5,158 on administrative segregation and 12,488 on disciplinary segregation. The tables below display the restrictive housing placements and removals by month.
Administrative Segregation
Month Placements
January 547
February 492
March 518
April 379
May 355
June 84
July 491
August 429
September 451
October 358
November 390
December 664
Disciplinary Segregation
Month Placements
January 1,021
February 1,141
March 1,309
April 951
May 750
June 222
July 1,358
August 1,221
September 987
October 1,246
November 1,068
December 1,214
Administrative Segregation
Month Removals
January 413
February 488
March 553
April 608
May 687
June 534
July 99
August 239
September 282
October 387
November 381
December 487
Disciplinary Segregation
Month Removals
January 1,266
February 1,198
March 1,329
April 1,269
May 1,273
June 1,234
July 203
August 692
September 825
October 1,124
November 965
December 1,110

5
The following charts and graphs display the age categories for the individual inmates placed on restrictive housing in FY16:
Individuals Placed on Restrictive Housing
Ages Count % Restrictive
Housing
17 and Under 9 0.1%
18 to 25 2,756 19.9%
26 to 30 3,258 23.5%
31 to 35 2,679 19.3%
36 to 40 1,730 12.5%
41 to 50 2,449 17.6%
51 to 60 893 6.4%
Over 60 107 0.8%
Individuals Placed on Administrative Segregation
Ages Count %
Administrative
17 and Under 5 0.1%
18 to 25 741 16.6%
26 to 30 1,003 22.5%
31 to 35 936 21.0%
36 to 40 604 13.5%
41 to 50 818 18.3%
51 to 60 300 6.7%
Over 60 58 1.3%
Individuals Placed on Disciplinary Segregation
Ages Count %
Disciplinary
17 and Under 4 0.0%
18 to 25 2,242 21.1%
26 to 30 2,540 24.0%
31 to 35 1,976 18.6%
36 to 40 1,265 11.9%
41 to 50 1,853 17.5%
51 to 60 660 6.2%
Over 60 62 0.6%

6
The following charts and graph display the racial summaries of the individual inmates placed on restrictive housing in FY16:
0.0%
5.0%
10.0%
15.0%
20.0%
25.0%
30.0%
17 andUnder
18 to 25 26 to 30 31 to 35 36 to 40 41 to 50 51 to 60 Over 60
% Administrative % Disciplinary
RACE
% Restrictive
Housing
Asian 0.1%
Black 50.9%
Indian 0.2%
White 18.3%
RACE
% Administrative
Segregation
Asian 0.2%
Black 62.2%
Indian 0.2%
White 36.4%
RACE
% Disciplinary Segregation
Asian 0.1%
Black 72.5%
Indian 0.2%
White 26.3%
0.0%
10.0%
20.0%
30.0%
40.0%
50.0%
60.0%
70.0%
80.0%
Asian Black Indian White
Race Percentages of Inmate Population with Restrictive Housing
% of Entire InmatePopulation
% Restrictive Housing
% Administrative
% Disciplinary

7
Serious Mental Illness
The Department defines “Serious Mental Illness” in accordance with the Code of Maryland Regulations (COMAR), as follows:
COMAR 10.21.17.02 (76) (76) "Serious mental illness" means a mental disorder that is: (a) Manifest in an individual 18 years old or older; (b) Diagnosed, according to a current diagnostic classification system that is recognized by the Secretary as: (i) Schizophrenic disorder; (ii) Major affective disorder; (iii) Other psychotic disorder; or (iv) Borderline or schizotypal personality disorder, with the exclusion of an abnormality that is manifested only by repeated criminal or otherwise antisocial conduct; and (c) Characterized by impaired functioning on a continuing or intermittent basis, for at least 2 years, and includes at least three of the following: (i) Inability to maintain independent employment; (ii) Social behavior that results in interventions by the mental health system; (iii) Inability, due to cognitive disorganization, to procure financial assistance to support living in the community; (iv) Severe inability to establish or maintain a personal support system; or (v) Need for assistance with basic living skills.
In FY16, the Department had a total of 1,468 inmates diagnosed with a SMI. 172 inmates diagnosed with a SMI were placed on restrictive housing: 65 on administrative segregation and 107 on disciplinary segregation.
Pregnancy
In FY16, there were no pregnant inmates placed on restrictive housing.
Lengths of Stay
The following chart displays the average and median length of stay, in days, for FY16 restrictive housing placements:
Average Median
Restrictive Housing 58 42
Administrative Segregation 67 49
Disciplinary Segregation 52 38

8
Deaths, Self-Harm and Attempted Self-Harm
The following chart displays suicidal gestures, attempts, and deaths occurring in FY16 while placed on restrictive housing:
According to a 2012 study by the U.S. Department of Justice Bureau of Justice Statistics, the national rate of suicide in state prisons as of 2010 is 42 per 100,000 inmates. Noonan, M. E. (n.d.). Mortality in Local Jails and State Prisons, 2000-2010 - Statistical Tables (December, 2012, NCJ 239911). doi:https://www.bjs.gov/content/pub/pdf/mljsp0010st.pdf. Therefore, Maryland figures for FY16 represent less than half the national average.
Direct Releases from Restrictive Housing
The following chart displays the number of inmates released directly from restrictive housing in FY16 with the average and median length of stay, in days.
Miscellaneous Data
The Department included restrictive housing placements and removals by month, which was not requested as part of SB 946. The Department also included the total number of inmates diagnosed with a serious mental illness (SMI).
Releases while on Restrictive Housing Length Of Stay
Count Average Median
Restrictive Housing 269 58 42
Administrative Segregation 101 67 49
Disciplinary Segregation 168 52 38
Self-Harm while on Restrictive Housing
Suicidal
Gestures Attempted
Suicides Suicides
All Inmates 39 238 4
Restrictive Housing 3 38 2
Administrative Segregation 1 2 0
Disciplinary Segregation 2 36 2

9
Restrictive Housing Policy and Procedure
The Department is in the process of implementing several initiatives to make improvements to the housing of dangerous offenders, including the establishment of a Max II Structured Housing facility; developing a designating housing program for offenders with serious mental illnesses; and, modifying the disciplinary matrix.
I. Development of a Max II Structured Housing facility One of the primary initiatives of the Department, as supported by numerous National Institute of Corrections (NIC) recommendations, is to develop a Max II Structured Housing facility program that would target the most violent offenders who continuously commit assaults and infractions while incarcerated. The Max II Structured Housing program will be located at one designated correctional facility. The program targets an inmate’s inappropriate behaviors – especially violent behaviors – and develops individualized case plans to alter outcomes by incentive based programming. The individualized case plans will target the top four risk factors for violent behavior, which include: (1) Antisocial Behavior; (2) Antisocial Personality Patterns; (3) Antisocial Cognition; and (4) Antisocial Associates.
II. SMI Structured Housing facility
Additionally, NIC recommended designating an institution as the primary facility to house those inmates who have been diagnosed with a SMI and continuously commit acts of violence while incarcerated. As a result, the Department is in the process of developing and implementing policies to establish a program that is similar to the Max II Structured Housing facility program, but tailored to address the specific mental health needs of the SMI population.
I. Modification of the Disciplinary Matrix NIC also recommended the Department modify its policies to adjust the Inmate Disciplinary Matrix. Section 12.02.27.00 of the Code of Maryland Regulations (COMAR) stipulates the Inmate Disciplinary process, covering the investigatory process, the hearing procedures, the adjustment history sentencing matrix, and the appeals process. If an inmate is found guilty of committing an infraction, the officer presiding over the inmate discipline hearing utilizes the “Inmate Disciplinary Matrix” to determine the appropriate sanction. NIC recommended revising the matrix used for assigning disciplinary segregation time, as well as reducing the maximum disciplinary segregation time from 360 days to 60 days.

10
CONCLUSION
The Department anticipates that the Maximum II Structured Housing initiative will be fully implemented by fall 2017. The Department has already received additional technical and operational assistance with Crisis Intervention Training from the National Institute of Corrections. The training is necessary as part of a best practices training curriculum for staff assigned to work with Maximum II Structured Housing Offenders. Departmental Case Managers and Custody Staff are diligent administers of administrative segregation, ensuring timely segregation reviews are held and inmates removed as soon as possible given the circumstances of the placement. Disciplinary segregation is always the result of the documented disciplinary hearing and appeal process where a sentencing matrix is followed for fairness. The Department finds this report to be of great value for measuring planned improvements to the fair and conscientious use of restrictive housing.