department of pesticide regulation sacramento, ca 95812 ... · pdf fileinclude oryzalin,...
TRANSCRIPT
Department of Pesticide Regulation Environmental Monitoring Branch
1001 I Street Sacramento, CA 95812
Study 308: Pesticide mitigation through a woodchip bioreactor at Sea Mist Farms,
Castroville, CA
Scott D. Wagner September 8, 2016
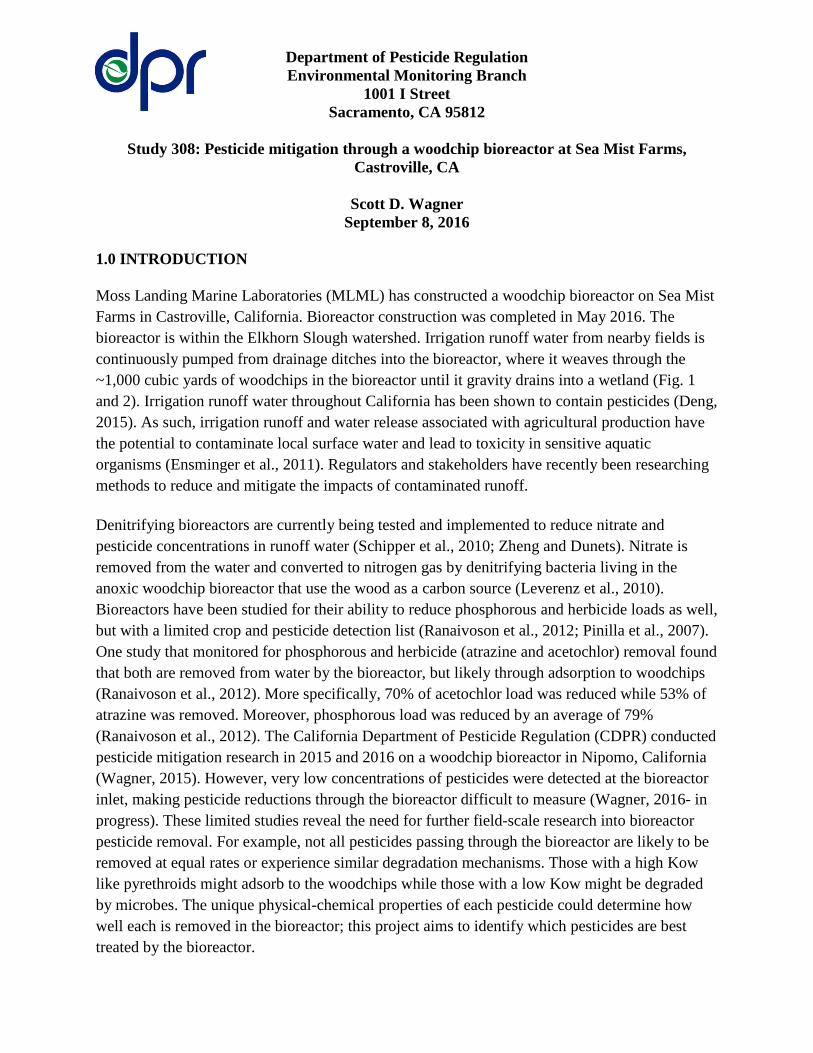
1.0 INTRODUCTION Moss Landing Marine Laboratories (MLML) has constructed a woodchip bioreactor on Sea Mist Farms in Castroville, California. Bioreactor construction was completed in May 2016. The bioreactor is within the Elkhorn Slough watershed. Irrigation runoff water from nearby fields is continuously pumped from drainage ditches into the bioreactor, where it weaves through the ~1,000 cubic yards of woodchips in the bioreactor until it gravity drains into a wetland (Fig. 1 and 2). Irrigation runoff water throughout California has been shown to contain pesticides (Deng, 2015). As such, irrigation runoff and water release associated with agricultural production have the potential to contaminate local surface water and lead to toxicity in sensitive aquatic organisms (Ensminger et al., 2011). Regulators and stakeholders have recently been researching methods to reduce and mitigate the impacts of contaminated runoff. Denitrifying bioreactors are currently being tested and implemented to reduce nitrate and pesticide concentrations in runoff water (Schipper et al., 2010; Zheng and Dunets). Nitrate is removed from the water and converted to nitrogen gas by denitrifying bacteria living in the anoxic woodchip bioreactor that use the wood as a carbon source (Leverenz et al., 2010). Bioreactors have been studied for their ability to reduce phosphorous and herbicide loads as well, but with a limited crop and pesticide detection list (Ranaivoson et al., 2012; Pinilla et al., 2007). One study that monitored for phosphorous and herbicide (atrazine and acetochlor) removal found that both are removed from water by the bioreactor, but likely through adsorption to woodchips (Ranaivoson et al., 2012). More specifically, 70% of acetochlor load was reduced while 53% of atrazine was removed. Moreover, phosphorous load was reduced by an average of 79% (Ranaivoson et al., 2012). The California Department of Pesticide Regulation (CDPR) conducted pesticide mitigation research in 2015 and 2016 on a woodchip bioreactor in Nipomo, California (Wagner, 2015). However, very low concentrations of pesticides were detected at the bioreactor inlet, making pesticide reductions through the bioreactor difficult to measure (Wagner, 2016- in progress). These limited studies reveal the need for further field-scale research into bioreactor pesticide removal. For example, not all pesticides passing through the bioreactor are likely to be removed at equal rates or experience similar degradation mechanisms. Those with a high Kow like pyrethroids might adsorb to the woodchips while those with a low Kow might be degraded by microbes. The unique physical-chemical properties of each pesticide could determine how well each is removed in the bioreactor; this project aims to identify which pesticides are best treated by the bioreactor.

2.0 OBJECTIVES The objectives of the study are to:
1) Determine the presence and concentrations of selected pesticides at the inlet and outlet to the bioreactor;
2) Determine the removal rates of various classes of pesticides and identify which are most effectively removed by the bioreactor
3.0 PERSONNEL This project is a joint effort between many state and local agencies. SWPP staff will be working with involved groups as it studies pesticide removal in the bioreactor. The study will be conducted by SWPP staff under the general direction of Kean S. Goh, Ph.D., Environmental Program Manager I (Supervisory). Key personnel are listed below:
• Project Leader: Scott Wagner • Field Coordinator: Kevin Kelley • Reviewing Scientist: Xin Deng, Ph.D. • Statistician: Yina Xie, Ph.D. • Laboratory Liaison: Sue Peoples • Analytical Chemistry, water: Center for Analytical Chemistry, California Department
of Food and Agriculture (CDFA) • Collaborators: Ross Clark, Jason Adelaars (Moss Landing Marine Laboratories), Pam
Krone-Davis (NOAA)
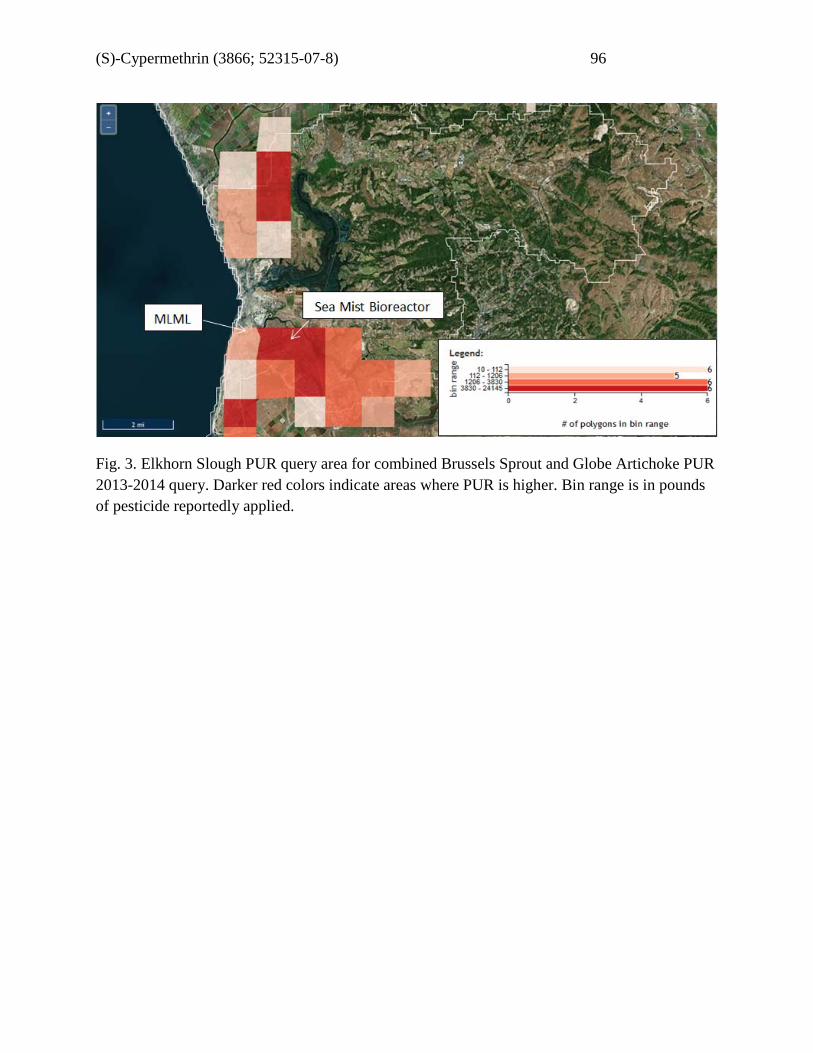
Please direct questions regarding this study to Scott Wagner, Environmental Scientist, at 916-324-4087 or [email protected]. 4.0 STUDY PLAN Pesticides that will be analyzed were selected based on results from queries of Pesticide Use Reporting (PUR) and CDPR’s monitoring prioritization model. Runoff to the bioreactor is sourced from fields planted with artichokes and Brussels sprout. Thus, pesticides applied to these crops (sourced from PUR data) in this watershed will be prioritized. Some of the most commonly used pesticides in the Elkhorn Slough watershed are in the pesticide classes of pyrethroids, organophosphates, and neonicotinoids (imidacloprid) (Table 1, Fig. 3). These top detections are supported by the monitoring prioritization model (Table 2). Many of the insecticides in the prioritization model with the highest final score are pyrethroids (e.g. permethrin and bifenthrin), organophosphates (e.g. methidathion), neonicotinoids (e.g. imidacloprid), and dinitroanilines. The organophosphate multi-residue analytical list includes dimethoate, methidathion, malathion, and chlorpyrifos. Six pyrethroids were chosen based on results from the monitoring prioritization model for Elkhorn Slough (Table 2) and include bifenthrin, lambda-cyhalothrin, permethrin, cyfluthrin, fenvalerate/esfenvalerate, and cypermethrin. Pesticides in the dinitroaniline screen

include oryzalin, ethalfluralin, trifluralin, benfluralin, prodiamine, pendimethalin, and oxyfluorfen.
Preliminary samples were collected from the bioreactor inlet and outlet on July 12, 2016. Results from this preliminary sampling could refine this protocol to refocus efforts on certain pesticides or remove others from the monitoring list. Samples from the inlet and outlet will be collected in September 2016 and May, July, and September 2017. To account for residence time in the bioreactor and in an effort to sample the same pulse of water, samples at the inlet will be collected 2 days (the expected hydraulic residence time of the bioreactor) before outlet samples. 5.0 CHEMICAL ANALYSIS A suite of pesticides in each class of organophosphates, pyrethroids, dinitroanilines and neonicotinoids (imidacloprid) will be analyzed by CDFA. Classes were chosen based on PUR data (Table 2) and CDPR’s monitoring prioritization model (Table 3) (Luo et al. 2013, 2014, 2015). Laboratory QA/QC will follow CDPR guidelines and will consist of laboratory blanks, matrix spikes, matrix spike duplicates, surrogate spikes, and blind spikes (Segawa, 1995).
Ammonia, NO3-N, and reactive orthophosphate will also be measured after each sampling event. Nitrate will be measured on site. A colorimetric meter (Hach DR 900 Handheld Colorimeter) will be used to measure all nutrient levels at the inlet and outlet in an effort to continue monitoring for nitrate reduction. Given the low cost of the colorimetric measurement method, nutrient sampling is not included in the budget. 6.0 DATA ANALYSIS The concentration and mass of each pesticide analyzed will be estimated and compared to determine the removal efficacy of the bioreactor. Statistical analysis will be performed to test 1) the difference in pesticide concentration between inlet and outlet and 2) the difference in pesticide removal rate among different pesticide classes. Possible procedures may include parametric tests, nonparametric tests, and permutation tests. Since the dataset will be quite small (i.e. eight paired data for each pesticide analyzed) and could be censored and skewed, nonparametric tests and permutation tests are expected to be more desirable than parametric tests (Helsel, 2011). The R statistical program will be used.
7.0 TIMETABLE Field Sampling: July 2016 – September 2017 Chemical Analysis: July 2016 – September 2017 Summary Report: January 2018 8.0 LABORATORY BUDGET

The expected cost for chemical analysis of samples through the CDFA lab is $21,120 (Table 3). All costs are estimated but do not include field blanks or laboratory QC. 9.0 LITERATURE CITED CDPR (California Department of Pesticide Regulation) 2014. California Department of Pesticide Regulation’s Pesticide Information Portal, Pesticide Use Report (PUR) data. http://calpip.cdpr.ca.gov/
Ensminger, M; Bergin, R; Spurlock, F; and Goh, KS. 2011. Pesticide concentrations in water and sediment and associated invertebrate toxicity in Del Puerto and Orestimba Creeks, California, 2007-2008. Environmental Monitoring and Assessment. 175: 573-587.
Leverenz, HL; Haunschild, K; Hopes, G; Tchobanoglous, G; and Darby, JL. 2010. Anoxic treatment wetlands for denitrification. Ecological Engineering. 36: 1544-1551.
Luo , Y., X. Deng, R. Budd, K. Starner and M. Ensminger. 2013. Methodology for Prioritizing Pesticides for Surface Water Monitoring in Agricultural and Urban Areas. May 2013. http://www.cdpr.ca.gov/docs/emon/pubs/ehapreps/analysis_memos/prioritization_report.pdf Luo, Y., M. Ensminger, R. Budd, X. Deng and A. DaSilva . 2013.Methodology for Prioritizing Pesticides for Surface Water Monitoring in Agricultural and Urban Areas II: Refined Priority List. July 2014. http://www.cdpr.ca.gov/docs/emon/pubs/ehapreps/analysis_memos/prioritization_report_2.pdf Luo, Y and X. Deng. 2015. Methodology for prioritizing Pesticides for Surface Water Monitoring in Agricultural and Urban Areas III: Watershed-Based Prioritization. February 2015. http://www.cdpr.ca.gov/docs/emon/pubs/ehapreps/analysis_memos/luo_prioritization_3.pdf Pinilla, P; Ruiz, J; Lobo, MC; Martinez-Inigo, MJ. 2007. Degradation of oxadiazon in a bioreactor integrated in the water closed circuit of a plant nursery. Bioresource Technology. 99:2177-2181.
Ranaivoson, A; Moncrief, J; Venterea, R; Rice, P; and Dittrich, M. Report to the Minnesota Department of Agriculture: Anaerobic Woodchip Bioreactor for Denitrification, Herbicide Dissipation, and Greenhouse Gas Mitigation. 2012.
Schipper, LA; Robertson, WD; Gold, AJ; Jaynes, DB; and Cameron, SC. 2010. Denitrifying bioreactors–an approach for reducing nitrate loads to receiving waters. Ecological Engineering. 36:1532-1543.
Wagner, SD. 2016. In progress. Final Report: Mitigation of pesticide runoff using a bioreactor in Santa Maria Valley.
Wagner, SD. 2015. Mitigation of pesticide runoff using a bioreactor in Santa Maria Valley. http://www.cdpr.ca.gov/docs/emon/pubs/protocol/study302_pesticide_runoff.pdf
Zheng, Y. and Dunets, S. Bioreactors for contaminant removal. Greenhouse and Nursery Water Treatment Information System. School of Environmental Sciences, University of Guelph. http://www.ces.uoguelph.ca/water/NCR/Bioreactors.pdf
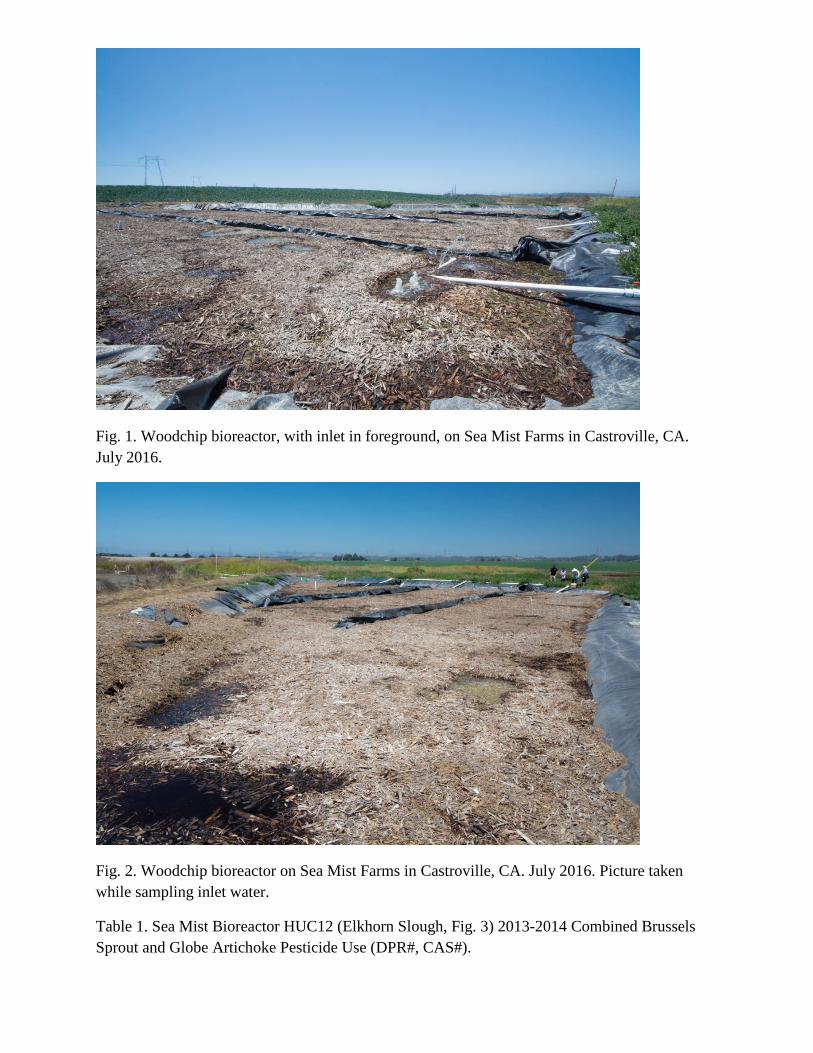
Fig. 1. Woodchip bioreactor, with inlet in foreground, on Sea Mist Farms in Castroville, CA. July 2016.
Fig. 2. Woodchip bioreactor on Sea Mist Farms in Castroville, CA. July 2016. Picture taken while sampling inlet water.
Table 1. Sea Mist Bioreactor HUC12 (Elkhorn Slough, Fig. 3) 2013-2014 Combined Brussels Sprout and Globe Artichoke Pesticide Use (DPR#, CAS#).

Pesticide Pounds Applied
1,3-Dichloropropene (573; 542-75-6) 38,563 Sulfur (560; 7704-34-9) 20,023 Naled (418; 300-76-5) 2,481 Metaldehyde (379; 108-62-3) 2,453 Diuron (231; 330-54-1) 2,131 Chlorothalonil (677; 1897-45-6) 1,946 Diflubenzuron (1992; 35367-38-5) 1,716 Paraquat Dichloride (1601; 1910-42-5) 1,708 Methidathion (1689; 950-37-8) 1,381 Permethrin (2008; 52645-53-1) 1,236 Pendimethalin (1929; 40487-42-1) 1,187 Oxyfluorfen (1973; 42874-03-3) 1,132 Dimethoate (216; 60-51-5) 1,118 Oxydemeton-Methyl (382; 301-12-2) 1,067 Ferric Sodium EDTA (5950; 15708-41-5) 985 Bifenthrin (2300; 82657-04-3) 890 Margosa Oil (6065; 8002-65-1) 611 Pyraclostrobin (5759; 175013-18-0) 574 Chlorpyrifos (253; 2921-88-2) 511 Chlorantraniliprole (5964; 500008-45-7) 395 Imidacloprid (3849; 105827-78-9) 368 Spinetoram (5946; 187166-15-0) 363 Malathion (367; 121-75-5) 311 Bacillus thuringiensis (Berliner), Subsp. Aizawai, Gc-91 Protein (3843; null) 311 Acephate (1685; 30560-19-1) 309 Thiamethoxam (5598; 153719-23-4) 291 Methoxyfenozide (5698; 161050-58-4) 260 Methomyl (383; 16752-77-5) 255 Aluminum Phosphide (484; 20859-73-8) 254 Azoxystrobin (4037; 131860-33-8) 235 Myclobutanil (2245; 88671-89-0) 209 Esfenvalerate (2321; 66230-04-4) 192 Trifloxystrobin (5321; 141517-21-7) 189 Indoxacarb (5331; 173584-44-6) 180 Penthiopyrad (6020; 183675-82-3) 142 Glyphosate, Isopropylamine Salt (1855; 38641-94-0) 122 Flonicamid (5886; 158062-67-0) 119 Boscalid (5790; 188425-85-6) 119 Spirotetramat (5955; 203313-25-1) 108 Pymetrozine (5232; 123312-89-0) 105 Fenamidone (5791; 161326-34-7) 102
(S)-Cypermethrin (3866; 52315-07-8) 96
Fig. 3. Elkhorn Slough PUR query area for combined Brussels Sprout and Globe Artichoke PUR 2013-2014 query. Darker red colors indicate areas where PUR is higher. Bin range is in pounds of pesticide reportedly applied.

Table 2. Monitoring Prioritization Model for Elkhorn Slough Watershed, using PUR data from 2013-2014
CHEMNAME usescore benchmark toxscore finalscore MALATHION 5 0.295 5 25
NALED 4 0.07 6 24 PERMETHRIN 3 0.0106 6 18 BIFENTHRIN 3 0.075 6 18
PARAQUAT DICHLORIDE 3 0.396 5 15 CAPTAN 5 13.1 3 15
DIFLUBENZURON 2 0.0014 7 14 CHLORPYRIFOS 2 0.05 6 12
PYRACLOSTROBIN 3 1.5 4 12 CHLOROTHALONIL 3 1.8 4 12
DIURON 3 2.4 4 12 MANCOZEB 4 47 3 12
FENPROPATHRIN 2 0.265 5 10 OXYFLUORFEN 2 0.29 5 10
CYPRODINIL 3 16 3 9 FLUDIOXONIL 3 70 3 9
METHIDATHION 2 1.1 4 8 METHOMYL 2 2.5 4 8
PENDIMETHALIN 2 5.2 4 8 LAMBDA-CYHALOTHRIN 1 0.0035 7 7
CYFLUTHRIN 1 0.0125 6 6 ESFENVALERATE 1 0.025 6 6
NOVALURON 1 0.075 6 6 DIMETHOATE 2 21.5 3 6
IMIDACLOPRID 2 34.5 3 6 SPINETORAM 2 77.9 3 6
OXYDEMETON-METHYL 2 95 3 6 BENSULIDE 3 290 2 6 BOSCALID 3 533 2 6
FENHEXAMID 3 670 2 6 THIOPHANATE-METHYL 3 930 2 6

DIAZINON 1 0.105 5 5 ABAMECTIN 1 0.17 5 5
TAU-FLUVALINATE 1 0.175 5 5 CYPERMETHRIN 1 0.195 5 5

Table 3. Sampling schedule and cost of chemical analysis.
Analyte Group*
September May July September
Total Number of Samples
Cost per sample
Total Cost Per Analyte
Group Total Cost
DN/OXY 2 2 2 2 8 840 6,720 IMD 2 2 2 2 8 600 4,800 OP 2 2 2 2 8 600 4,800
PY-6 2 2 2 2 8 600 4,800 21,120 *DN/OXY=Dinitroanilines/Oxyfluorfen; IMD=Imidacloprid; OP=Organophosphates; PY-6=Pyrethroids (six analyte screen)