department of labour job opportunities …api.ning.com/.../salabourmarket_joureport2015.pdfjob...
TRANSCRIPT

Job
Opp
ortu
niti
es a
nd U
nem
ploy
men
t in
the
Sout
h Af
rican
Lab
our M
arke
t 201
4 –
2015
I
JOB OPPORTUNITIES AND UNEMPLOYMENTIN THE SOUTH AFRICAN LABOUR MARKET
DEPARTMENT OF LABOUR
2014 – 2015

Job
Opp
ortu
niti
es a
nd U
nem
ploy
men
t in
the
Sout
h Af
rican
Lab
our M
arke
t 201
4 –
2015
III
PUBLISHERDepartment of LabourChief Directorate of CommunicationPrivate Bag X117Pretoria0001
CONTRIBUTORSEditor-in-Chief: Setsomi MolapoEditor: Abrahams MutediAuthor: Samson M. Muthethwa
EDITING, DISTRIBUTION, LAYOUT AND DESIGN
Sub Directorate of Media Production, Chief Directorate of Communication
PRINTERGovernment Printers
ISBN Number978-0-621-43904-5

Job
Opp
ortu
niti
es a
nd U
nem
ploy
men
t in
the
Sout
h Af
rican
Lab
our M
arke
t 201
4 –
2015
IV
TABLE OF CONTENTS
List of figures V
List of tables VI
List of acronyms and abbreviations VII
Executive summary VIII
Highlights of job opportunities and unemployment in the South African labour market 2014 – 2015 VIII
Introduction 1
Section Two: Trend analysis of job vacancies 2
2.1 Job vacancies by organising framework of occupation 2
2.2 Job vacancies by industry 4
Section Three: Overview of the labour force trends in South Africa 6
3.1 Labour market information based on administrative data 6
3.1.1 Public employment services data 6
3.1.2 Unemployment Insurance Fund’s data 9
3.2 Labour market information based on survey data 11
Section Four: Conclusion 17

Job
Opp
ortu
niti
es a
nd U
nem
ploy
men
t in
the
Sout
h Af
rican
Lab
our M
arke
t 201
4 –
2015
V
LIST OF FIGURES
Figure 1: Total number of job vacancies in the period, 2010/11 - 2014/15 2
Figure 2: Average percentage of employment by type of vacancies in the period 2010/11 - 2014/15 4
Figure 3: Work-seekers registered on Employment Services System for South Africa (ESSA) 7
2010/11 - 2014/15
Figure 4: Work-seekers placed or referred in registered employment opportunities, 2010/11 - 2014/15 7
Figure 5: Individual Immigrants work permits applications, 2010/11 - 2014/15 8
Figure 6: Private Employment Agencies (PEA) Registered, 2010/11 - 2014/15 8
Figure 7: Ordinary unemployment claimants by age group, 2010/11 - 2014/15 10
Figure 8: Educational level of ordinary unemployment claimants, 2010/11 - 2014/15 10
Figure 9: Reasons for termination in commercial employment, 2010/11 - 2014/15 11
Figure 10: Total number of employed people, 2010 – 2014 12
Figure 11: Total number of unemployed people, 2010 – 2014 12
Figure 12: Number of students enrolled in the post-school education and training sector, 2010 – 2013 15
Figure 13: Number of students enrolled in public FET/TVET, 2010 – 2013 15
Figure 14: Number of students graduated from public HEIs, 2010 – 2013 15

Job
Opp
ortu
niti
es a
nd U
nem
ploy
men
t in
the
Sout
h Af
rican
Lab
our M
arke
t 201
4 –
2015
VI
LIST OF TABLES
Table 1: Distribution of vacancies per office captured 2010/11 - 2014/15 3
Table 2: Number of vacancies by occupational group 2010/2011 – 2014/15 3
Table 3: Number of job vacancies by industry, 2010/11 - 2014/15 4
Table 4: Number of ordinary claims created by province, 2010/11 - 2014/15 9
Table 5: Employment by occupation, 2010 - 2014 13
Table 6: Educational level of the unemployed, 2010 – 2014 13
Table 7: Unemployment level by age group, 2010 – 2014 14

Job
Opp
ortu
niti
es a
nd U
nem
ploy
men
t in
the
Sout
h Af
rican
Lab
our M
arke
t 201
4 –
2015
VII
LIST OF ACRONYMS AND ABBREVIATIONS
AET Adult Education and Training
ALMP Active Labour Market Programmes
CWP Community Works Programme
DHET Department of Higher Education and Training
EPWP Extended Public Works Programme
ESSA Employment Services System for South Africa
FET Further Education and Training
FET/TVET Further Education and Training/Technical and Vocational Education and Training
GDP Gross Domestic Product
HEI Higher Education Institution
KRA Key Results Area
MTSF Medium Term Strategic Framework
NEET Not in Employment, Education or Training
NSC National Senior Certificate
NSFAS National Student Financial Aid Scheme
OFO Organising Framework for Occupation
PEA Private Employment Agencies
PES Public Employment Services
PSET Post-School Education and Training
PSETA Public Service Sector Education and Training Authority
QLFS Quarterly Labour Force Survey
SETA Sector Education and Training Authority
SIC Standard Industrial Classification
Stats SA Statistics South Africa
TLS Training Lay-Off Scheme

Job
Opp
ortu
niti
es a
nd U
nem
ploy
men
t in
the
Sout
h Af
rican
Lab
our M
arke
t 201
4 –
2015
VIII
EXECUTIVE SUMMARY
The Department of Labour records internal employment and unemployment data through the UIF and other systems. The Department also records job vacancies advertised on careers newspaper – Sunday Times and other regional newspapers in order to measure the demand for skills through the frequency of job vacancy advertisements in the different occupations and economic sectors in the country.
HIGHLIGHTS IN 2014 – 2015
• Overall, the labour market condition in South Africa is very tight when looking at the high unemployment rate with the high labour force participation rate. This persistent high unemployment rate at an average of 25% implies that, there are more people joining the labour force relative to the job opportunities created in the South African labour market or there is a mismatch skills somewhere
• Looking at the UI data, Gauteng remained the only province with the highest number of UI claims received in the last five years - 2010/11 to 2014/15. The UIF database recorded the highest number of workers who lost their jobs (108 795) in the last 5 years as a result of dismissals. This was from 33 712 in 2010/11 to 142 507 in 2014/15
• By age, those aged between 25 to 34 years reported as the highest age group having applied for ordinary UI claims over the same period. Those with grade 10-11 educational attainment were always the highest applicants with an average of 36% in the last five years
• The Job Opportunities Index database shows that there were only 46 391 job vacancies recorded 2014/15. It decreased by 13 954 from 60 345 advertised vacancies processed in 2010/11
* By occupations, job vacancies recorded increases in Technicians and Associate Professionals occupational category by 1 560 from 4 898 to 6 458 advertised vacancies between 2010/11 and 2014/15 financial years, followed by Elementary Occupations with an increase of 852 from 827 to 1 679 and then Plant and Machine Operators and Assemblers with an increase of 331 from 1 040 to 1 371 advertised vacancies over the same period.

Job
Opp
ortu
niti
es a
nd U
nem
ploy
men
t in
the
Sout
h Af
rican
Lab
our M
arke
t 201
4 –
2015
1
INTRODUCTION
This report presents the trends or results of the job opportunities and unemployment status of the South African Labour Market for the period of five years from the 2010/11 to 2014/15 financial years. On the job opportunities component, the data was collected by capturing the coded data according to the Organising Framework for Occupation (OFO) and Standard Industrial Classification of All Economic Activities, Fifth Edition, 1993 (SIC).
In the job opportunities section, the report covered total number of job vacancies by occupational group, average percentage of employment by type of vacancies, distribution of vacancies per office captured and vacancies by industry. Job opportunities recorded decreased by 23.1% (from 60 345 in 2010/11 to 46 391 in 2014/15).
Furthermore, the trends of the Unemployment Insurance Funds (UIF) data are aslo presented. This analysis included ordinary claims created by province, age, educational level, and the reasons for termination in commercial employment. Ordinary claims created increased by 4.5% (from 581 427 in the financial year 2010/11 to 608 624 in 2014/15). This section also analyses the data extracted from Public Employment Services (PES) including work-seekers registered on the Employment Services System for South Africa (ESSA), work-seekers placed or referred in registered employment opportunities, employers registered vacancies on ESSA, and individual immigrants work permit’s applications.
In the survey data section, the report examined the trends from 2010 to 2014 in the number of employed people, number of unemployed people, employment by occupation, education level of unemployed people, employment level by age and labour migration using the Quarterly Labour Force Surveys (QLFS) data. Employment increased by 8.9% (from 13 788 000 in 2010 to 15 146 000 in 2014), whereas unemployment increased by 9.9% (from 4 564 000 in 2010 to 5 070 000 in 2014). This section was supplemented by the data on education including the number of students enrolled in the post-school education and training sector (PSET), number of students graduated from public Higher Education Institutions (HEIs) and number of students enrolled in public Further Education and Training/Technical and Vocational Education and Training (FET/TVET).
In conducting the analysis of survey data, UIF data and job opportunities index, the Department of Labour attempts to provide an overview performance of the South African labour market, whether the economy is creating enough jobs to address the challenge of unemployment.
The report contributes to the understanding of trends in opportunities that exist in the current labour market. This helps to identify occupations that are in high demand.
Job
Opp
ortu
niti
es a
nd U
nem
ploy
men
t in
the
Sout
h Af
rican
Lab
our M
arke
t 201
4 –
2015
2
SECTION TWO: TREND ANALYSIS OF JOB VACANCIES
2.1 JOB VACANCIES BY ORGANISING FRAMEWORK OF OCCUPATION (OFO)
The size of the South African labour market has changed dramatically over the past five years as a result of substantial components of the labour force and a continuous increase in the number of new entrances. According to the Medium-Term Strategic Framework (MTSF) - Strategic Priorities 2009 – 2014, one of the Government priorities was speeding up economic growth and transforming the economy to create decent work and sustainable livelihoods. Thus, the Department of Labour committed to the achievement of this priority by committing to Key Results Areas (KRA) that are relevant including amongst others contribution to employment creation and monitoring the impact of legislation1.
Some of the apparatus of the South African labour market that the Department uses to monitor the labour market are QLFS, UIF and Vacancies data collected from news papers. In addition, this report analyses the data generated by PES and the Department of Higher Education and Training (DHET). These various statistical data sources are the measures of employment and unemployment rate, labour demand and supply, job opportunities, activities contributing to job creation and educational status in South Africa.
Below, the report provides a quarterly data of vacancy analysis. The data is produced at various levels by provinces, occupations, employment type and industry. This information is very helpful in understanding the skills mismatch regarding the labour demand and supply in South Africa.
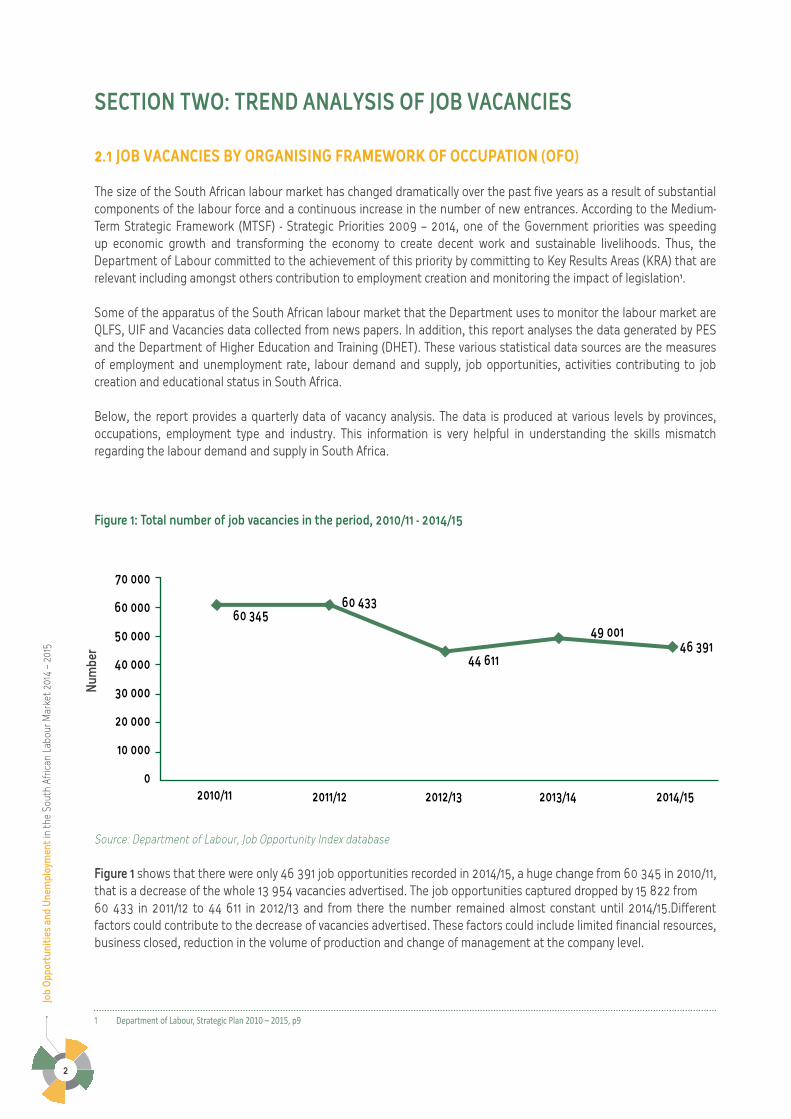
Figure 1: Total number of job vacancies in the period, 2010/11 - 2014/15
Source: Department of Labour, Job Opportunity Index database
Figure 1 shows that there were only 46 391 job opportunities recorded in 2014/15, a huge change from 60 345 in 2010/11, that is a decrease of the whole 13 954 vacancies advertised. The job opportunities captured dropped by 15 822 from 60 433 in 2011/12 to 44 611 in 2012/13 and from there the number remained almost constant until 2014/15.Different factors could contribute to the decrease of vacancies advertised. These factors could include limited financial resources, business closed, reduction in the volume of production and change of management at the company level.
1 Department of Labour, Strategic Plan 2010 – 2015, p9
70 000
60 000
50 000
40 000
30 000
20 000
10 000
0
60 345
2010/11 2011/12 2012/13 2013/14 2014/15
60 433
44 611
49 00146 391
Num
ber

Job
Opp
ortu
niti
es a
nd U
nem
ploy
men
t in
the
Sout
h Af
rican
Lab
our M
arke
t 201
4 –
2015
3
Table 1: Distribution of vacancies per office captured 2010/11 - 2014/15
2010/11 2011/12 2012/13 2013/14 2014/15 Grand Total
Eastern Cape 6 643 6 210 3 726 2 637 2 437 21 653
Free State 799 978 1 074 1 193 1 049 5 093Gauteng 3 779 5 029 4 131 5 515 3 722 22 176
Head Office 31 852 37 306 25 508 26 938 25 507 147 111
KwaZulu-Natal 679 707 402 533 468 2 789
Limpopo 3 098 1 638 788 4 791 4 920 15 235
Mpumalanga 3 330 3 241 2 466 1 393 1 159 11 589
North West 1 839 2 707 2 002 2 005 3 715 12 268
Northern Cape 2 396 905 980 1 145 1 234 6 660
Western Cape 5 930 1 712 3 534 2 851 2 180 16 207
Grand Total 60 345 60 433 44 611 49 001 46 391 260 781
Source: Department of Labour, Job Opportunity Index database
Table 1 shows the number of job opportunities recorded decreased in seven offices: Head Office being the highest decrease (6 345), followed by Eastern Cape (4 206), then Western Cape (3 750) between 2010/11 and 2014/15 financial years. The number of job opportunities recorded increased in only three offices: North West being the highest increase (1 876), followed by Limpopo (1 822), then Free State (250) over the same period. The overall decrease of the job opportunities recorded was 13 954 from 60 345 in 2010/11 to 46 391 in 2014/15.
This trend does validate the trends observed in the labour absorption rate overtime. It is indicative that the level of investment in the country is not stimulated enough to create new opportunities. Thus, the economy has recorded relatively the same labour absorption rate in the last five years.
Table 2: Number of vacancies by occupational group 2010/2011 – 2014/15
Source: Department of Labour, Job Opportunity Index database
2010/11 % change 2011/12 %
change 2012/13 % change 2013/14 %
change 2014/15 Grand Total %
Managers 15 214 1.3% 15 415 -12.8% 13 449 0.6% 13 527 -12.7% 11 803 69 408 26.6%Professionals 19 007 15.7% 21 986 -33.0% 14 726 -0.8% 14 613 -0.1% 14 597 84 929 32.6%
Technicians and Associate Professionals
4 898 18.8% 5 819 -23.9% 4 428 48.8% 6 587 -2.0% 6 458 28 190 10.8%
Clerical Support Workers
8 559 6.8% 9 138 -29.7% 6 424 -18.8% 5 219 -3.3% 5 045 34 385 13.2%
Service and Sales Workers
3 384 -53.1% 1 586 15.6% 1 833 53.6% 2 815 -13.5% 2 436 12 054 4.6%
Community and personal service workers
7 416 -44.0% 4 155 -47.9% 2 164 -100% 0 0% 0 13 735 5.3%
Skilled Agricultural, Forestry, Fishery, Craft and Related Trades Workers
0 0% 0 0% 0 0% 3 454 -13.1% 3 002 6 456 2.5%
Plant and Machine Operators and Assemblers
1 040 6.1% 1 103 -33.6% 732 26.1% 923 48.5% 1 371 5 169 2.0%
Elementary Occupations
827 48.9% 1 231 -30.5% 855 117.9% 1 863 -9.9% 1 679 6 455 2.5%
Grand Total 60 345 60 433 44 611 49 001 46 391 260 781 100%
Job
Opp
ortu
niti
es a
nd U
nem
ploy
men
t in
the
Sout
h Af
rican
Lab
our M
arke
t 201
4 –
2015
4
Table 2 reveals that job opportunities recorded increases in Technicians and Associate Professionals by 1 560 from 4 898 to 6 458 between 2010/11 and 2014/15 financial years, followed by Elementary Occupations with an increase of 852 from 827 to 1 679 and then Plant and Machine Operators and Assemblers with an increase of 331 from 1 040 to 1 371 during the same period. The decrease was observed in Professionals by 4 410 from 19 007 to 14 597, followed by Clerical Support Workers with a decrease of 3 514 from 8 559 to 5 045, and then Managers with a decrease of 3 411 from 15 214 to 11 803 and Service and Sales Workers with a decrease of 948 from 3 384 to 2 436 during the same period. Although there were some decreases in Professionals and Managers, overall Professional occupations have recorded the highest (32.6%), followed by Managerial occupations (26.6%) for the period of years under review2.
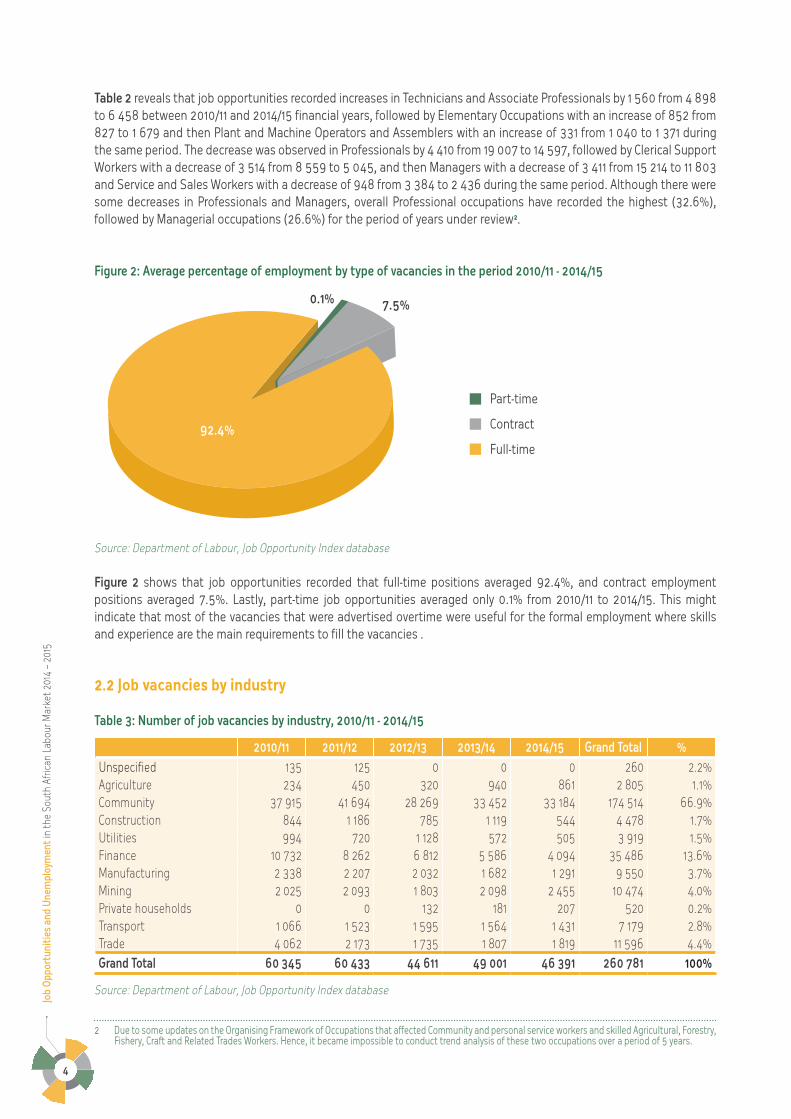
Figure 2: Average percentage of employment by type of vacancies in the period 2010/11 - 2014/15
Source: Department of Labour, Job Opportunity Index database
Figure 2 shows that job opportunities recorded that full-time positions averaged 92.4%, and contract employment positions averaged 7.5%. Lastly, part-time job opportunities averaged only 0.1% from 2010/11 to 2014/15. This might indicate that most of the vacancies that were advertised overtime were useful for the formal employment where skills and experience are the main requirements to fill the vacancies .
2.2 Job vacancies by industry
Table 3: Number of job vacancies by industry, 2010/11 - 2014/15
2010/11 2011/12 2012/13 2013/14 2014/15 Grand Total %
Unspecified 135 125 0 0 0 260 2.2%Agriculture 234 450 320 940 861 2 805 1.1%Community 37 915 41 694 28 269 33 452 33 184 174 514 66.9%Construction 844 1 186 785 1 119 544 4 478 1.7%Utilities 994 720 1 128 572 505 3 919 1.5%Finance 10 732 8 262 6 812 5 586 4 094 35 486 13.6%Manufacturing 2 338 2 207 2 032 1 682 1 291 9 550 3.7%Mining 2 025 2 093 1 803 2 098 2 455 10 474 4.0%Private households 0 0 132 181 207 520 0.2%Transport 1 066 1 523 1 595 1 564 1 431 7 179 2.8%Trade 4 062 2 173 1 735 1 807 1 819 11 596 4.4%Grand Total 60 345 60 433 44 611 49 001 46 391 260 781 100%
Source: Department of Labour, Job Opportunity Index database
2 Due to some updates on the Organising Framework of Occupations that affected Community and personal service workers and skilled Agricultural, Forestry, Fishery, Craft and Related Trades Workers. Hence, it became impossible to conduct trend analysis of these two occupations over a period of 5 years.
0.1% 7.5%
Part-time
Contract
Full-time92.4%

Job
Opp
ortu
niti
es a
nd U
nem
ploy
men
t in
the
Sout
h Af
rican
Lab
our M
arke
t 201
4 –
2015
5
*Note: In some cases, job advertisements did not have economic sectors information
Table 3 indicates that the three main industries that produced high number of job opportunities from 2010/11 to 2014/15 include Community (66.9%), finance (13.6%), and Wholesale and retail trade (4.4%). It is interesting to see the mining industry moving towards a positive direction as there is a need to promote a stable labour environment3. And it is also arguable that this might be as a result of the implementation of a number of programmes under the Framework Agreement for a Sustainable Mining Industry. During 2014/15, the industries that produced less number of job opportunities included Private households (0.4%), Utilities (1.1%), and Construction (1.2%).
When looking at the overall number of vacancies that were captured by the Department through the newspapers, there is an indication that the number has dropped since 2012/13 and has not went back to the highest level that it was in 2011/12 at 60 433 vacancies. The creation of limited skilled jobs that cannot match the large number of job seekers can also be attributed to the South African labour market that is still struggling to recover from the recession that also struck the global world, particularly the youth. Employment creation, and especially employment opportunities for the youth, shall be considered as the most urgent political economy issue all over the world nowadays4.
When comparing the performance of the provinces, the province that captured the highest number of vacancies from 2010/11 to 2014/15 was Gauteng5. Occupationally, Professionals have been the highest, followed by Managers for all the years during the same period.
In section three, the report briefly examines the trends in the South African labour market. This analysis is made possible by observing the trends in the labour market using statistical information sourced from the Public Employment Services, Unemployment Insurance Fund, Quarterly Labour Force Survey and Skills enrolment data.
3 State of Nation Address (SONA) June 20144 Minister of Labour: Ms Mildred N Oliphant, Ministerial Summit Public employment services, Saldanha bay, Western Cape, March 20145 Gauteng province data also include Head Office
Job
Opp
ortu
niti
es a
nd U
nem
ploy
men
t in
the
Sout
h Af
rican
Lab
our M
arke
t 201
4 –
2015
6
SECTION THREE: OVERVIEW OF THE LABOUR FORCE TRENDS IN SOUTH AFRICA
Although the labour market is constantly changing over time, the most noticeable story is its dramatic increase of unemployment post 2008/2009 recession. Between 2010 and 2014, the South African unemployment rate slightly rose by 0.2%, from 24.9% to 25.1%. This persistent high unemployment rate at an average of 25% implies that, there are more people joining the labour force relative to the job opportunities created in the South African labour market. Such a trend had a negative impact on the living standards of all people living in the country.
If the economy is not performing well, it probably means that only few people will be absorbed into employment. The GDP has decelerated by 1.5% from 3.0% in 2010 to 1.5% in 2014. The decline in GDP from 2010 to 2014 is not good news to the economy of the country6.
Changes in various South African demographics, including the province, sex, age, education and ethnic group of the population have considerably affected the size of the labour force. Unemployment is concentrated amongst black Africans who are less educated, youth, women and those without prior work experience. According to Statistics South Africa (Statssa), youth unemployment has increased by 197 000 from 3 180 000 in 2010 to 3 377 000 in 2014. The youth who are not in employment, education or training (NEET) rate of black Africans is more than twice that of a young white person. Experience and higher education levels play an important role in improving the chances of finding a job. A larger proportion of women compared to men were unemployed for a year or longer, while the black African population had the highest incidence of long-term unemployment among all population groups7.
3.1 LABOUR MARKET INFORMATION BASED ON ADMINISTRATIVE DATA
3.1.1 Public Employment Services data
The main functions of Employment Services are to register work-seekers, obtain vacancies and identify other opportunities so as to facilitate the entry and re-entry of work-seekers into the labour market. Employment Services therefore is supported by two main pillars: The ‘Employer Services’ and ‘Work-Seeker Services’. The key services include:
Registration of work-seekers, placement of work-seekers, employment counselling, special labour market (employment) programmes, regulation of PEAs; and temporary employment services, regulate the number of foreign nationals corporate and individual work visas, transfer funding to Supported Employment Enterprises (formerly known as Sheltered Employment Factories) to provide special employment to People with Disabilities, transfer funding to Productivity South Africa to promote productivity and competitiveness, transfer funding to Compensation Fund for occupational injuries and diseases incurred by public servants. However this report will only focus on just few services.
6 Statssa, Gross Domestic Product, First Quarter 2015, p87 Statssa, Labour Market Dynamics in South Africa 2014, Press Statement, April 2015
Job
Opp
ortu
niti
es a
nd U
nem
ploy
men
t in
the
Sout
h Af
rican
Lab
our M
arke
t 201
4 –
2015
7
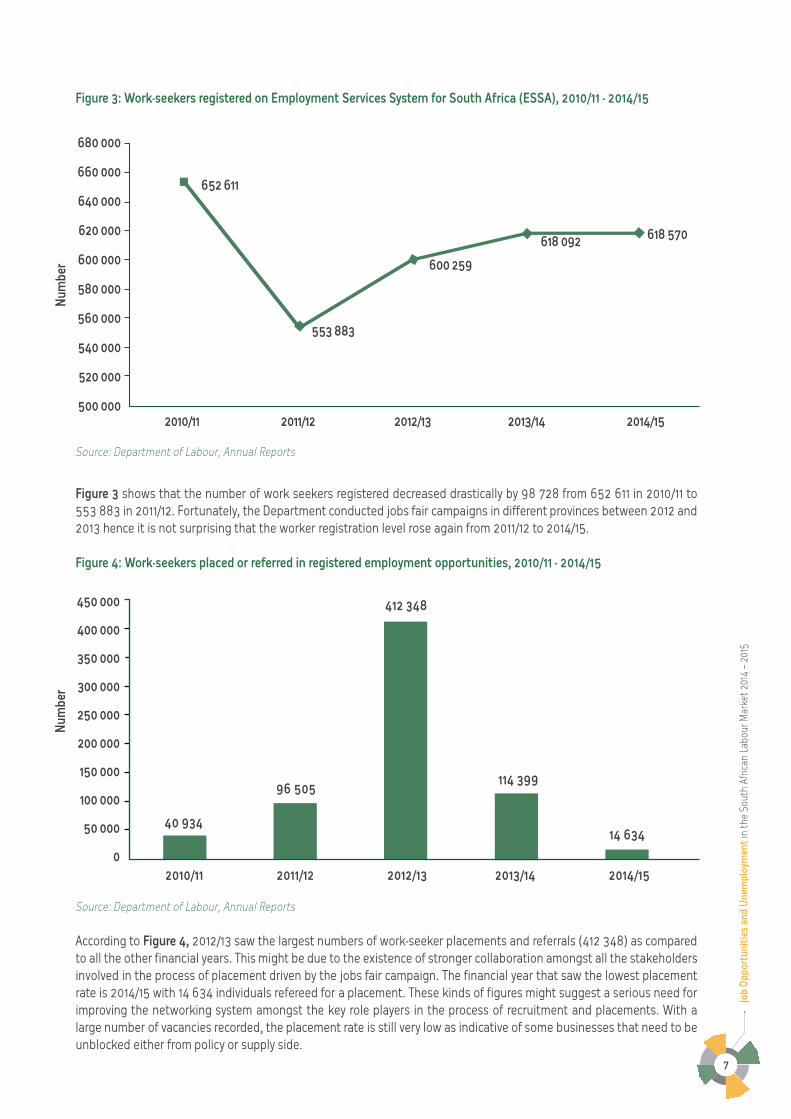
Figure 3: Work-seekers registered on Employment Services System for South Africa (ESSA), 2010/11 - 2014/15
Source: Department of Labour, Annual Reports
Figure 3 shows that the number of work seekers registered decreased drastically by 98 728 from 652 611 in 2010/11 to 553 883 in 2011/12. Fortunately, the Department conducted jobs fair campaigns in different provinces between 2012 and 2013 hence it is not surprising that the worker registration level rose again from 2011/12 to 2014/15. Figure 4: Work-seekers placed or referred in registered employment opportunities, 2010/11 - 2014/15
Source: Department of Labour, Annual Reports
According to Figure 4, 2012/13 saw the largest numbers of work-seeker placements and referrals (412 348) as compared to all the other financial years. This might be due to the existence of stronger collaboration amongst all the stakeholders involved in the process of placement driven by the jobs fair campaign. The financial year that saw the lowest placement rate is 2014/15 with 14 634 individuals refereed for a placement. These kinds of figures might suggest a serious need for improving the networking system amongst the key role players in the process of recruitment and placements. With a large number of vacancies recorded, the placement rate is still very low as indicative of some businesses that need to be unblocked either from policy or supply side.
450 000
400 000
350 000
300 000
250 000
200 000
150 000
100 000
50 000
0
680 000
660 000
640 000
620 000
600 000
580 000
560 000
540 000
520 000
500 000
40 934
2010/11 2011/12 2012/13 2013/14 2014/15
96 505
412 348
Num
ber
Num
ber
114 399
14 634
2010/11 2011/12 2012/13 2013/14 2014/15
652 611
553 883
600 259
618 570618 092

Job
Opp
ortu
niti
es a
nd U
nem
ploy
men
t in
the
Sout
h Af
rican
Lab
our M
arke
t 201
4 –
2015
8
Figure 5: Individual Immigrants work permits applications, 2010/11 - 2014/15
Source: Department of Labour, Annual Report
The Immigration Act of 2002 allows for the Minister of Home Affairs to consult with the Minister of Labour and the Minister of Trade and Industry in order to identify areas of scarce, critical and special skills required by the South African economy each year. A list of professional categories and occupational classes are then identified and work permits made available8. According to Figure 5, PES recorded an increase of 690 in individual immigrants work permits’ applications from 51 in 2013/2014 compared with the 741 in 2014/159. The process of accommodating immigrants in the labour market might assist the country in terms of feeling those hard to feel posts as a result of skills gap.
Figure 6: Private Employment Agencies (PEA) registered, 2010/11 - 2014/15
Source: Department of Labour, Annual Report
8 http://www.home-affairs.gov.za/index.php/scarce-skills-work-quotas9 The booming trend in 2014/15 is as the result of the amended immigration regulations, 2014 that strengthened the powers of the Department of Labour
in processing the applications
2010/11 2011/12 2012/13 2013/14 2014/15 Applications received/processed 119 55 45 51 741 Applications recommended for approval 63 21 32 5 211 Applications recommended for disapproval 56 34 13 46 530
800
700
600
500
400
300
200
100
0
1200
1000
800
600
400
200
0
675
1 162
350309
363
2010/11 2011/12 2012/13 2013/14 2014/15
Num
ber
Num
ber

Job
Opp
ortu
niti
es a
nd U
nem
ploy
men
t in
the
Sout
h Af
rican
Lab
our M
arke
t 201
4 –
2015
9
Figure 6 shows that as at 2014/15, there were only 363 PEAs who were registered on ESSA database. This is noticeably far less than were reported PEAs who were registered on ESSA database in 2011/12 with a total amount of 1 162. It is also worth noting that the number of PEAs who were registered on ESSA was constantly low from 2012/13 to 2014/15.
3.1.2 Unemployment Insurance Funds data
The Unemployment Insurance Fund (UIF) contributes to the alleviation of poverty in South Africa by providing short-term unemployment insurance to all workers who qualify for unemployment related benefits. The Fund is financed by a dedicated tax on the wage bill.
This section is looking into the use of UI data to track the labour supply through the data provided by the UI applicants when they come to apply for the ordinary unemployed benefits. On the UI data, the analysis is currently focusing on the ordinary claims created because it can be associated with unemployment trends in the country.
Table 4: Number of ordinary claims created by province, 2010/11 - 2014/15
Province 2010/11 2011/12 2012/13 2013/14 2014/15
Eastern Cape 51 443 45 996 57 683 58 698 62 291
Western Cape 105 190 86 852 101 214 96 812 102 062
Free State 29 110 23 112 29 039 30 442 33 025
Northern Cape 17 021 15 521 23 422 21 177 23 259
North West 22 463 22 876 20 587 31 397 28 939
Gauteng 154 153 144 378 158 692 145 556 133 482
Mpumalanga 51 217 41 924 48 686 48 868 53 630
Limpopo 39 516 37 214 48 311 52 509 57 756
KwaZulu Natal 111 314 93 715 102 018 103 306 114 180
Total 581 427 511 588 589 652 588 765 608 624
Source: Department of Labour, UIF database
Table 4 shows the extent of application of ordinary UI claims in the various provinces of South Africa. For all provinces, the level of ordinary UI claims was always highest in Gauteng than in other Provinces since 2010/11 to 2014/15, followed by KwaZulu-Natal. The other observation in Table 4 is that the province with the highest increase of the applications for ordinary UI claims was Limpopo (18 240) from 39 516 in 2010 to 57 756 in 2014. This was followed by the Eastern Cape with the second highest increase of the applications for ordinary UI claims (10 848) from 51 443 to 62 291 during the same period.
From 2010/11 to 2014/15 there is only one province that showed a recovery on job losses which is Western Cape. There was a decrease of 3 128 in application of ordinary UI claims of 3 128 from 105 190 to 102 062 over the same period.

Job
Opp
ortu
niti
es a
nd U
nem
ploy
men
t in
the
Sout
h Af
rican
Lab
our M
arke
t 201
4 –
2015
10
Figure 7: Ordinary unemployment claimants by age group, 2010/11 - 2014/15
Source: Department of Labour, UIF database
Figure 7 shows that in terms of age, an average of 37% of those aged 25 to 34 years reported as the highest age group having applied for ordinary UI claims between 2010/11 to 2014/15. This age group was followed by those aged 35 to 44 years reported having applied for ordinary UI claims at an average of 26% for the same period.
Figure 7 still highlights that youth, particularly the age of 15 to 34 years accounted for a high percentage of job losses, as compared to all other ages in the working-age population. Under these circumstances, it is worth noting the findings of the labour market dynamics in South Africa 2014 about the youth in the labour market which are as follows10: The number of young people in the working-age population increased from 18.3 million in 2008 to 19.4 million in 2014. Over this period, the number of employed youth declined by 467 000 to 6 million, while the number of unemployed increased by 319 000 to 3.4 million.
Figure 8: Educational level of ordinary unemployment claimants, 2010/11 - 2014/15
Source: Department of Labour, UIF
10 Stats SA, Labour Market Dynamics 2014, Pretoria, April 2015
40
35
30
25
20
15
10
5
0
40
35
30
25
20
15
10
5
0
15-24 25-34 35-44 45-54 55-65 66 plus 2010/11 11% 36% 25% 16% 11% 1% 2011/12 11% 36% 25% 16% 11% 1% 2012/13 8% 38% 26% 15% 10% 3% 2013/14 7% 37% 26% 16% 11% 3% 2014/15 6% 36% 26% 16% 12% 4%
Below Grade 12 Grade 8-9 Grade 10-11 Grade 12 Above Grade 12 2010/11 13% 14% 35% 34% 4% 2011/12 13% 14% 35% 34% 4% 2012/13 16% 13% 34% 32% 5% 2013/14 12% 13% 38% 33% 4% 2014/15 10% 14% 36% 29% 11%
%
%
Job
Opp
ortu
niti
es a
nd U
nem
ploy
men
t in
the
Sout
h Af
rican
Lab
our M
arke
t 201
4 –
2015
11
Figure 8 shows the patterns in respect of various educational levels for people who applied for ordinary UI claims between 2010/11 to 2014/15 as a result of having lost their jobs. Those with grade 10-11 educational level were always the highest applicants with an average of 36%. This was followed by those with grade 12 educational level at an average of 32%. There is an indication that UI claimants with an above grade 12 educational level were the least affected by job losses with an average of 5.8%. This suggests that it is those who are less educated who tend to lose jobs more than those who are more educated. This trend has been consistent overtime. It is therefore important for policy makers to look at various aspects that can improve educational attainment of individuals in the country which will in turn yield high returns on educational investment in the long term.
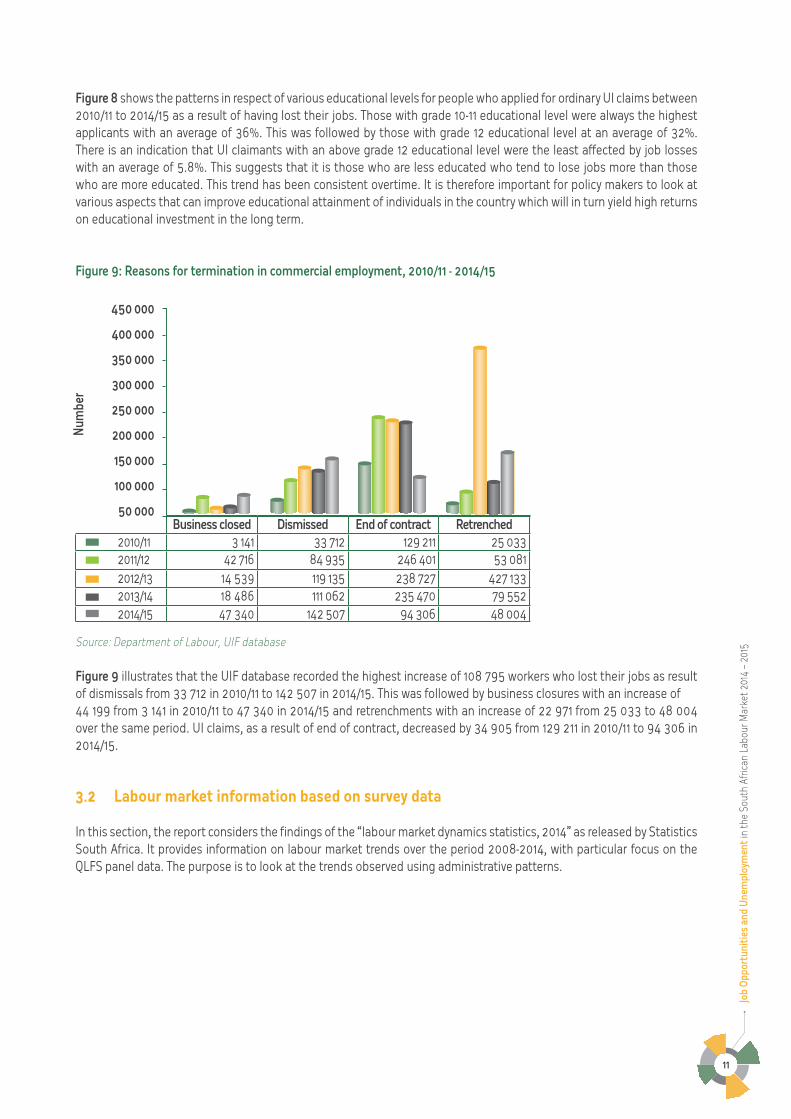
Figure 9: Reasons for termination in commercial employment, 2010/11 - 2014/15
Source: Department of Labour, UIF database
Figure 9 illustrates that the UIF database recorded the highest increase of 108 795 workers who lost their jobs as result of dismissals from 33 712 in 2010/11 to 142 507 in 2014/15. This was followed by business closures with an increase of 44 199 from 3 141 in 2010/11 to 47 340 in 2014/15 and retrenchments with an increase of 22 971 from 25 033 to 48 004 over the same period. UI claims, as a result of end of contract, decreased by 34 905 from 129 211 in 2010/11 to 94 306 in 2014/15.
3.2 Labour market information based on survey data
In this section, the report considers the findings of the “labour market dynamics statistics, 2014” as released by Statistics South Africa. It provides information on labour market trends over the period 2008-2014, with particular focus on the QLFS panel data. The purpose is to look at the trends observed using administrative patterns.
Business closed Dismissed End of contract Retrenched 2010/11 3 141 33 712 129 211 25 033 2011/12 42 716 84 935 246 401 53 081 2012/13 14 539 119 135 238 727 427 133 2013/14 18 486 111 062 235 470 79 552 2014/15 47 340 142 507 94 306 48 004
450 000
400 000
350 000
300 000
250 000
200 000
150 000
100 000
50 000
Num
ber

Job
Opp
ortu
niti
es a
nd U
nem
ploy
men
t in
the
Sout
h Af
rican
Lab
our M
arke
t 201
4 –
2015
12
Figure 10: Total number of employed people, 2010 – 2014
Source: Statistics South Africa, Labour Market Dynamics in South Africa, 2014, p3-7
Figure 10 shows the historical path of aggregate employment in South Africa from 2010 to 2014; the overall increase in employment rate since 2010 is evident. This is also achieved through Active Labour Market Programmes (ALMP) such as the Extended Public Works Programme (EPWP), Community Works Programme (CWP), Training Lay-Off Scheme (TLS), Learnerships/Apprenticeships and the Public Employment Services11. In 2010, the overall level of employment in South Africa was 13 788 000. This level increased fairly until 2014 when it reached 15 146 000. The number of employed people has increased by 1 358 000 from 13 788 000 to 15 146 000 between 2010 and 2014. In this regard, the South African labour market seemed to be progressing well on labour absorption although in a very slow pace. On the other hand, the official unemployment level shows a similar trend as illustrated below.
Figure 11: Total number of unemployed people, 2010 – 2014
Source: Statistics South Africa, Labour Market Dynamics in South Africa, 2014, p3-7
11 South Africa — Employment Plan 2014, G20, p3
15.5
15
14.5
14
13.5
13
5.2
5.1
5
4.9
4.8
4.7
4.6
4.5
4.4
4.3
2010 2011 2012 2013 2014
2010 2011 2012 2013 2014
13 788Num
ber (
000)
Num
ber (
000)
4 564
4 636
4 775
4 886
5 070
14 070
14 425
14 866
15 146

Job
Opp
ortu
niti
es a
nd U
nem
ploy
men
t in
the
Sout
h Af
rican
Lab
our M
arke
t 201
4 –
2015
13
From Figure 11, the number of unemployed people increased by 506 000 between 2010 and 2014 from 4 564 000 to 5 070 000. It illustrates the unemployment trends over the period 2010 to 2014. By 2014, the overall official unemployment rate (25.1%) was the highest as compared to 2010, 2011, 2012 and 2013. With this modest positive employment creation overtime, it has not resulted in a substantial reduction of a large number of unemployed people. The high level of unemployment is still a big challenge in the country.
Table 5: Employment by occupation, 2010 - 2014
Occupation 2010 2011 2012 2013 2014
(‘000)Managers 1 900 1 194 1 161 1 224 1 331
Professionals 764 800 842 925 842
Technicians 1 534 1 561 1 639 1 645 1 552
Clerk 1 517 1 484 1 506 1 606 1 653
Sales and services 1 974 2 054 2 113 2 163 2 326
Skilled Agriculture 92 73 68 70 76
Craft 1 682 1 722 1 734 1 730 1 813
Operators 1 195 1 200 1 200 1 274 1 277
Elementary 2 971 3 021 3 187 3 227 3 295
Domestic worker 959 961 975 1 002 981
Total 13 788 14 070 14 425 14 866 15 146
Source: Statistics South Africa, Labour Market Dynamics in South Africa, 2014, p4-7
Table 5 highlights the differences in the employment across occupations. It reveals that the largest decrease in employment was observed in managerial occupations by 569 000 from 1 900 000 in 2010 to 1 331 000 in 2014, followed by Skilled Agriculture 16 000 from 92 000 in 2010 to 76 000 in 2014. The largest job gains were observed in Sales and services workers with 352 000 from 1 974 000 in 2010 to 2 326 000 in 2014, followed by Elementary increasing (324 000) from 2 971 000 in 2010 to 3 295 000 in 2014 and then Clerk (136 000) from 1 682 000 in 2010 to 1 813 000 in 2014.
Table 6: Educational level of the unemployed, 2010 – 2014
Highest level of education 2010 2011 2012 2013 2014(‘000)
No Schooling 83 78 75 76 76Primary incomplete 374 325 334 301 321Primary completed 214 216 214 195 221Secondary not completed 2 077 2 161 2 258 2 329 2 382Secondary completed 1 513 1 555 1 572 1 625 1 668Tertiary 272 272 295 333 373Other 39 30 27 27 29
Total 4 564 4 636 4 775 4 886 5 070
Source: Statistics South Africa, Labour Market Dynamics in South Africa, 2014, p5-5

Job
Opp
ortu
niti
es a
nd U
nem
ploy
men
t in
the
Sout
h Af
rican
Lab
our M
arke
t 201
4 –
2015
14
The South African Government has recognised that low education will mostly disadvantage work-seekers when searching for jobs. In this regard, Government continues to improve the infrastructure in schools and higher education institutions to create a conducive environment for learning and teaching12. This is why it is very important to acquire more education in order to up lift our economy in terms of skills. The Department of Labour is also committed in addressing the issue of skills shortages in the labour market through various programmes. It has also trained and empowered individuals on various artisan skills in partnership with the National Skills Fund (NSF), the various Sector Education Training Authorities (SETA’s) and Productivity South Africa13.
It is evident from Table 6 that the educational groups that are mostly affected by unemployment are those who have not completed secondary school. The secondary not completed increased by 305 000 from 2 077 000 in 2010 to 2 382 000 in 2014. Although the unemployment of the group with no schooling has reduced by 7 000 from 83 000 in 2010 to 76 000 in 2014, there is a general tendency of the lowest labour absorption rate in this group across the globe.
On the other hand, there is a concern regarding the unemployment level of people with tertiary qualifications. The number of unemployed people with tertiary qualifications has increased by 101 000 from 272 000 in 2010 to 373 000 in 2014. In other words, the completion of tertiary education might not guarantee a quick placement into employment. This might indicate the mismatch that is currently observed in the labour market in terms of the demand and supply of labour.
Table 7: Unemployment level by age group, 2010 – 2014
Age group 2010 2011 2012 2013 2014
(‘000)15-24 1 330 1 286 1 329 1 352 1 33025-34 1 850 1 919 1 942 1 943 2 04735-44 891 941 984 1 045 1 10645-54 401 412 428 440 47455-64 92 78 92 107 113Total 4 564 4 636 4 775 4 887 5 070
Source: Statistics South Africa, Labour Market Dynamics in South Africa, 2014, pA2-6
One of the most important demographic changes affecting the South African labour market is the evolution of the population’s age distribution. The aging of the youth population has also changed the profile of the South African unemployment levels to reach the unemployment rate of 25.1% in 2014. The working-age population increased by 3 050 000 from 32 360 000 in 2010 to 35 410 000 in 2014.
As demonstrated by Table 7, which shows how the working-age population of the labour force has increased across years going back to 2010. For these years under review, young people (15-34 years) have been the highest group affected by unemployment than adults have. It is a common trend across the globe, but it has a significant impact in the South African economy as only a small proportion of individuals that are contributing to the economy. It is, however, interesting to see that most of the policies are now geared towards promoting a large number of youth and women to participate in the economy.
12 State of Nation Address (SONA) Feb 201513 Minister of Labour: Ms Mildred N Oliphant, Ministerial Summit Public employment services, Saldanha Bay, Western Cape, March 2014

Job
Opp
ortu
niti
es a
nd U
nem
ploy
men
t in
the
Sout
h Af
rican
Lab
our M
arke
t 201
4 –
2015
15
Figure 12: Number of students enrolled in the post-school education and training sector, 2010 – 2013*
Source: Department of Higher Education and Training (DHET) - Statistics on Post-School Education and Training in South Africa
*Note that data for 2014 was not yet available at the time of developing this report.
Figure 12 shows that the number of students who enrolled in Public HEIs has always been the highest from 2010 to 2013, followed by students who enrolled in Public Further Education and Training (FET) Colleges. There is also no doubt that the expansion of opportunities in education, for example the National Student Financial Aid (NSFAS) has contributed a lot to the rise in higher education and training as well as further education and training enrolment.
Figure 13: Number of students enrolled in public FET/TVET, 2010 – 2013*
Source: Statistics on Post-School Education and Training in South Africa - Department of Higher Education and Training (DHET)
*Note that data for 2014 was not yet available at the time of developing this report.
1 000 000
900 000
800 000
700 000
600 000
500 000
400 000
300 000
200 000
100 000
0
Public HEIs
Private HEIs
Public FET College
Private FET College
Public AET Centres
Private AET Centres
SETA programmes
2010 2011 2012 2013
Num
ber
Num
ber
450 000
400 000
350 000
300 000
250 000
200 000
150 000
100 000
50 000
- 2010 2011 2012 2013 NC(V) 1 816 130 039 140 575 154 960 N1 - N6 19 524 169 774 359 624 442 287 NQF 63 394 23 160 62 456 19 000 NSC 5 180 3 916 1 715 1 693 Other 44 532 31 504 92 056 21 678
Job
Opp
ortu
niti
es a
nd U
nem
ploy
men
t in
the
Sout
h Af
rican
Lab
our M
arke
t 201
4 –
2015
16
The South African labour market is also highly dependent on vocational skills that are useful in various industries, particularly in Agriculture, Construction, Utilities, Manufacturing, Mining and Transport. In Figure 13, statistics on post-school education and training in South Africa reveals important mixtures in terms of provision by FET/TVET. Figure 13 reveals a total amount of 991 209 headcount student enrolment in N1 - N6 qualifications in 2010 to 2014. NC(V) has also recorded a positive increase from 1 816 in 2010 to 154 960 in 2013. In other words, the Government’s financial support to assist and promote educational attainment for most of the discouraged group needs to be acknowledged in response to the shortage of artisans in the country.
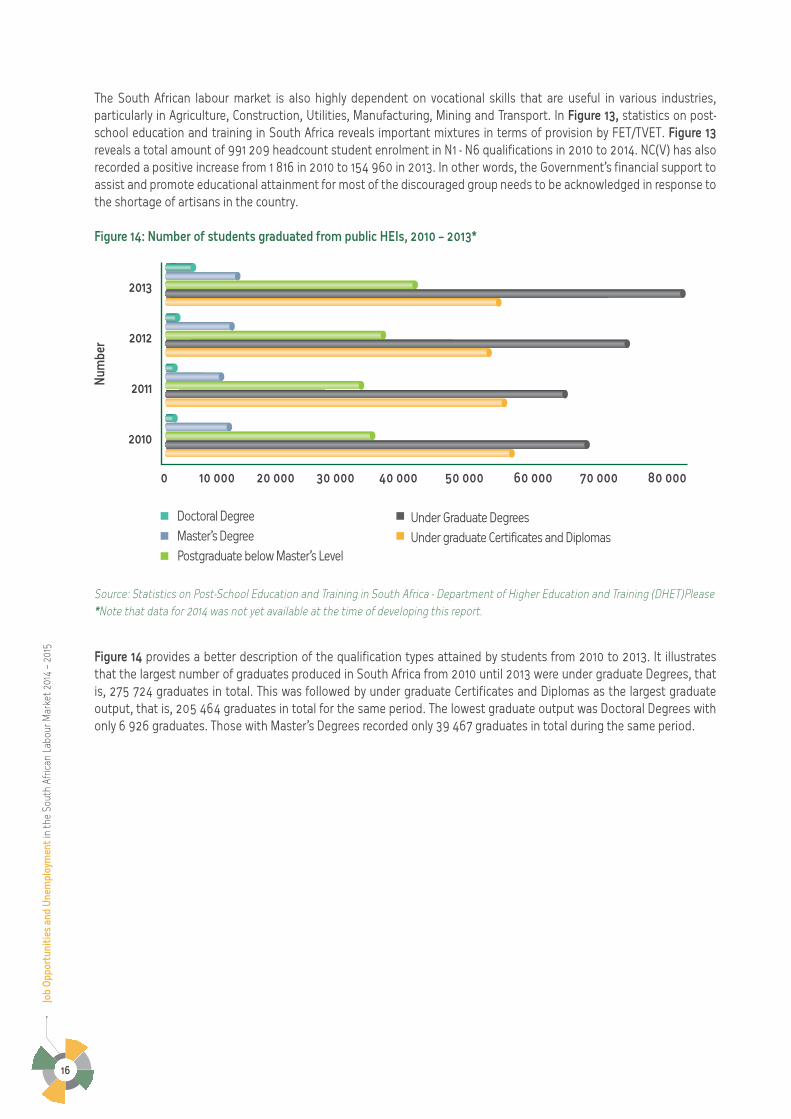
Figure 14: Number of students graduated from public HEIs, 2010 – 2013*
Source: Statistics on Post-School Education and Training in South Africa - Department of Higher Education and Training (DHET)Please *Note that data for 2014 was not yet available at the time of developing this report.
Figure 14 provides a better description of the qualification types attained by students from 2010 to 2013. It illustrates that the largest number of graduates produced in South Africa from 2010 until 2013 were under graduate Degrees, that is, 275 724 graduates in total. This was followed by under graduate Certificates and Diplomas as the largest graduate output, that is, 205 464 graduates in total for the same period. The lowest graduate output was Doctoral Degrees with only 6 926 graduates. Those with Master’s Degrees recorded only 39 467 graduates in total during the same period.
2013
2012
2011
2010
0 10 000 20 000 30 000 40 000 50 000 60 000 70 000 80 000
Doctoral Degree
Master’s Degree
Postgraduate below Master’s Level
Under Graduate Degrees
Under graduate Certificates and Diplomas
Num
ber

Job
Opp
ortu
niti
es a
nd U
nem
ploy
men
t in
the
Sout
h Af
rican
Lab
our M
arke
t 201
4 –
2015
17
SECTION FOUR: CONCLUSION
This report confirms the increasing need and importance of high-level skills within the South African economy. The rise in youth unemployment rate between 2010/11 and 2014/2015 financial years shows that through the youth wage subsidy programme, businesses must be encouraged to equip the young people with critical skills that are needed to grow the economy .
The demand for highly skilled workers is an indication of the importance of having education coupled with tertiary qualifications to be employed in top occupational categories. On the other hand, the high number of end of contract and dismissal recorded in the UIF data is an indication that the amended Labour Relations Act must be implemented and monitored to improve the working conditions of employees.
Policy implications to address the challenge of job creation:
• Create a collaborative partnership between Government, institutions producing skills, work-seekers, employers and all other relevant stakeholders
• Embark on research and development that will focus on stabilising and optimising all critical industries like mining, agriculture and manufacturing
• Expand investment in youth employment creation
• Accelerate work opportunities programmes.