department of international health effect of quality improvements on equity of health service...
TRANSCRIPT

Department of International Health
Effect of quality improvements on equity of health service utilization and patient satisfaction in Uttar Pradesh, IndiaDavid H PetersKrishna RaoGNV Ramana
February 19, 2004

Background: Uttar Pradesh (UP)
Population: 166 million
U5M: 123 /1,000 births
TFR: 4.0 children
Female Literacy: 43%
Poverty Headcount: 42%
Public Health Services:• Low quality• Low satisfaction• Low utilization• Large SES inequities

Intervention: Uttar Pradesh Health Systems Development Project (UPHSDP)
Physical Inputs: – Essential drugs delivered– Repairs of buildings and equipment
Management Improvements: – Motivational exercises for managers– Management training
Human Resources Changes:– Relocation of staff to fill mismatches– Visiting clinician service initiated

Research Questions
Can improving the quality of public clinical services in a resource poor environment in India improve:
(a)utilization of health services
(b)patient satisfaction?
For disadvantaged groups?

Methods and Sample
Uttar Pradesh Health Facilities
District Hospital (DH), Female DH (FDH), Community Health Center (CHC), Primary Health Center (PHC)
Control (117)DH 25, FDH 25
CHC 27, PHC 30
Project (117)DH 25, FDH 25
CHC 27, PHC 30
Project (25)DH 6, FDH 6
CHC 7, PHC 6
Control (22)DH 6, FDH 6
CHC 5, PHC 5
Facilities scored on infrastructure, utilization and area economic characteristics; poorer scoring facilities assigned to UPHSDP
July 2000 UPHSDP effective
Follow-up survey Apr-May03
• Baseline survey 1999;• Control facilities selected
randomly from non-project facilities;
• Convenience sample of patients for exit interviews.

Study Sample Size
Number of Facilities
Number of Patients 1999
Number of Patients 2003
Project Control Project Control Project Control
PHCs 6 5 123 108 124 103
CHCs 7 5 184 106 218 148
Female Hospital
6 6 155 164 183 182
District Hospital
6 6 195 209 370 347
Total 25 22 657 587 895 780
Variables Studied
Outcomes• New Outpatient Visits• Overall Patient Satisfaction
Scale: 1 (Strongly Disagree) to 5 (Strongly Agree)
Measures of Inequality• Caste Status• Housing• Asset Quintiles (Follow-up survey)
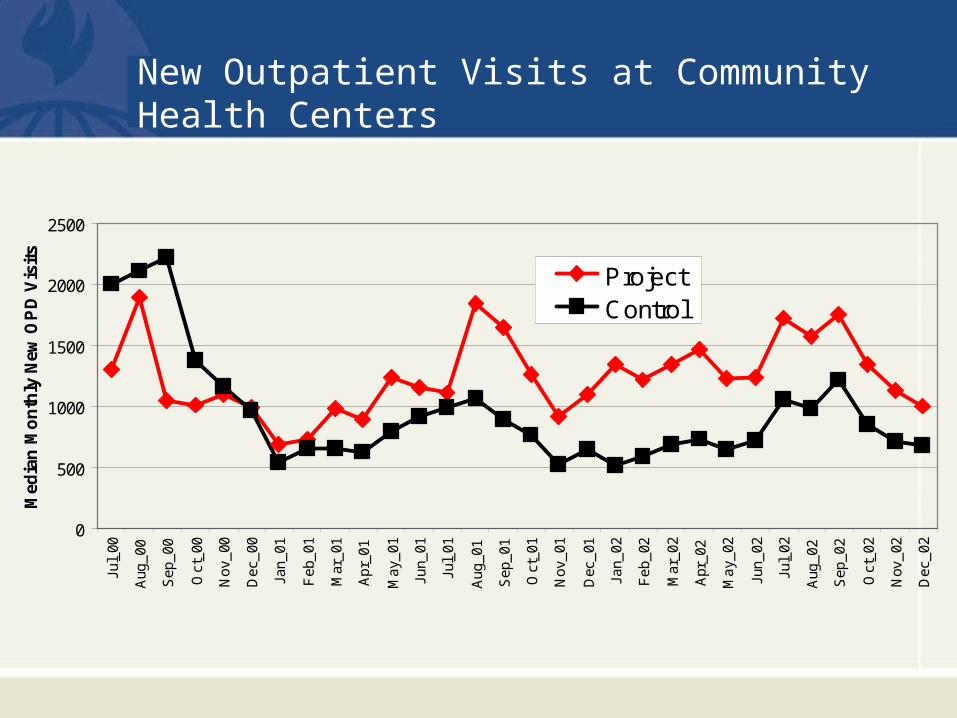
New Outpatient Visits at Community Health Centers
0
500
1000
1500
2000
2500
Jul_
00
Aug
_00
Sep
_00
Oct
_00
Nov
_00
Dec
_00
Jan_
01
Feb
_01
Mar
_01
Apr
_01
May
_01
Jun_
01
Jul_
01
Aug
_01
Sep
_01
Oct
_01
Nov
_01
Dec
_01
Jan_
02
Feb
_02
Mar
_02
Apr
_02
May
_02
Jun_
02
Jul_
02
Aug
_02
Sep
_02
Oct
_02
Nov
_02
Dec
_02
Med
ian
Mo
nth
ly N
ew O
PD
Vis
its
ProjectControl

Changes in Mean New Outpatient Visits by Level of Facility
0
100
200
300
400
500
600
700
District Hospital Female Hospital CommunityHealth Center
Primary HealthCenter
Dif
fere
nce
of
dif
fere
nce
in m
ean
mon
thly
new
OP
D v
isit
s
((P
roje
ct 0
2-P
roje
ct 0
0) -
(C
ontr
ol 0
2-C
ontr
ol 0
0)

Changes in Mean New Outpatient Visits by Caste & Level of Facility
-600
-400
-200
0
200
400
600
800
1000
1200
District Hospital Female Hospital Community HealthCenter
Primary HealthCenter
Low Caste High Caste
Dif
fere
nce
of
dif
fere
nce
in m
ean
mon
thly
new
OP
D v
isit
s
((P
roje
ct 0
2-P
roje
ct 0
0) -
(C
ontr
ol 0
2-C
ontr
ol 0
0)
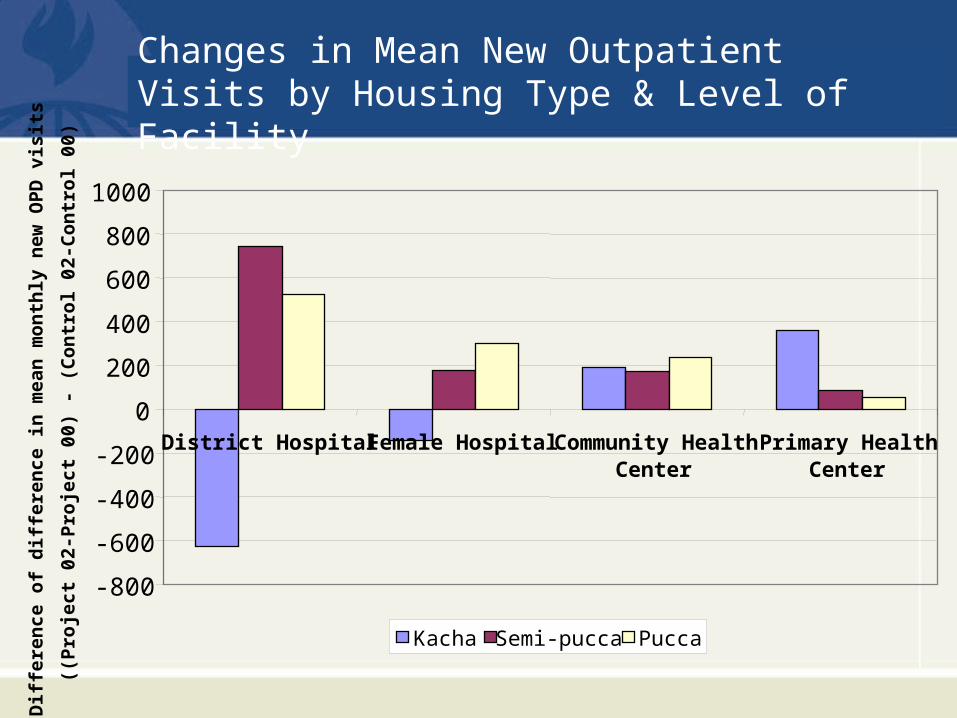
Changes in Mean New Outpatient Visits by Housing Type & Level of Facility
-800
-600
-400
-200
0
200
400
600
800
1000
District Hospital Female Hospital Community HealthCenter
Primary HealthCenter
Kacha Semi-pucca Pucca
Dif
fere
nce
of
dif
fere
nce
in m
ean
mon
thly
new
OP
D v
isit
s
((P
roje
ct 0
2-P
roje
ct 0
0) -
(C
ontr
ol 0
2-C
ontr
ol 0
0)

Patient Satisfaction at Project and Control Facilities, 1999-2003
Project FDH
Control PHC
3.5
3.6
3.7
3.8
3.9
4
4.1
4.2
4.3
1999 2003
Me
an
Pa
tie
nt
Sa
tis
fac
tio
n(1
-5 S
ca
le)

Changes in Patient Satisfaction By Level of Facility
-0.20
-0.10
0.00
0.10
0.20
0.30
0.40
0.50
0.60
0.70
District Hospital Female Hospital Community HealthCenter
Primary HealthCenter
Diff
ere
nce
of
Diff
eren
ce in
Mea
n O
utpa
tient
Sat
isfa
ctio
n(P
roje
ct 0
3-P
roje
ct 9
9)
- (C
ontr
ol 0
3-C
ontr
ol 9
9)
**
*
** p-value < 0.01
* p-value < 0.05
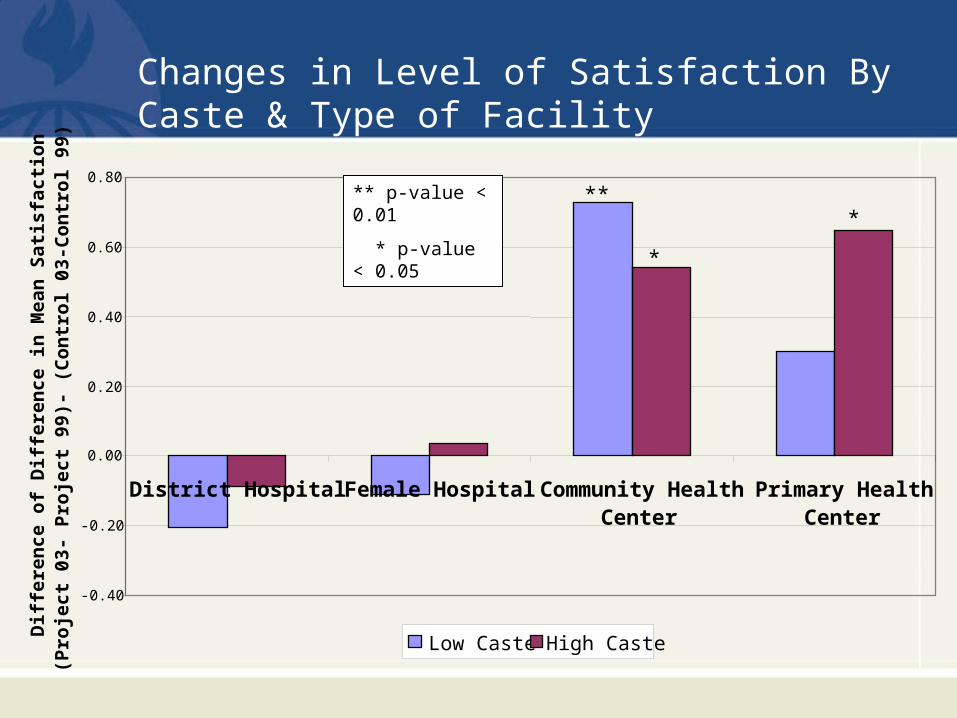
Changes in Level of Satisfaction By Caste & Type of Facility
-0.40
-0.20
0.00
0.20
0.40
0.60
0.80
District Hospital Female Hospital Community HealthCenter
Primary HealthCenter
Dif
fere
nce
of
Dif
fere
nce
in
Mea
n S
atis
fact
ion
(P
roje
ct
03-
Pro
ject
99)
- (C
on
tro
l 03
-Co
ntr
ol
99)
Low Caste High Caste
**
*
*** p-value < 0.01
* p-value < 0.05

Changes in Level of Satisfaction By Type of Housing & Type of Facility
-0.60
-0.40
-0.20
0.00
0.20
0.40
0.60
0.80
1.00
1.20
1.40
1.60
District Hospital Female Hospital Community HealthCenter
Primary HealthCenter
Dif
fere
nce
of
Dif
fere
nce
in
Mea
n S
atis
fact
ion
(P
roje
ct
03-
Pro
ject
99
)-(C
on
tro
l 0
3-C
on
tro
l 9
9)
Kacha Semi-pucca Pucca
**
*
**
** p-value < 0.01
* p-value < 0.05

Conclusions
• Reform efforts can improve utilization and patient satisfaction, but relationships are complex
• Effects stronger for poor at lower levels of facilities, where intervention more complete:– Utilization increases preferentially by low caste and
poorly housed at PHCs and CHCs, but mixed effects at hospitals
– Patient satisfaction increases at PHCs and CHCs, but not consistently for different vulnerable groups
• Better consistency in management of evaluation would yield better results