department of housingandw orks department of housing and
TRANSCRIPT

Department of Housing and Works
annua l repor t2002 -03
Department ofHousing and W orks

0
Contents
About the Department of Housing and Works…………………………………………………….. 2
Our Mission……………………………………………………………………………………………. 4
Director General’s Foreword………………………………………………………………………… 5
Works Procurement………………………………………………………………………………….. 6
Western Property…………………………………………………………………………………… 12
Regional Services (Western Property)…………………………………………………………… 14
Fremantle Prison……………………………………………………………………………………. 16
Industry Policy and Advice………………………………………………………………………… 18
Year of the Built Environment……………………………………………………………………… 22
Sustainability………………………………………………………………………………………… 23
Our People…………………………………………………………………………………………… 24
Statement of Compliance with Public Sector Standards and Codes………………………….. 27
Reporting Requirements……………………………………………………………………………. 28
Performance Indicators…………………………………………………………………………….. 30
Financial Statements.………………………………………………………………………………. 38
Western Australian Building Management Authority Annual Report
About the Western Australian Building Management Authority…………………………. 72
Performance Indicators………………………………………………………………………. 73
Financial Statements…………………………………………………………………………. 76
1
Statement of Compliance
DEPARTMENT OF HOUSING AND WORKS
Hon Nick Griffiths LLB MLC MINISTER FOR HOUSING AND WORKS; RACING AND GAMING; GOVERNMENT ENTERPRISES; LAND INFORMATION
I am pleased to submit for your information and presentation for Parliament the annual report of the Department of Housing and Works for the year ending 30 June 2003.
The annual report has been prepared in accordance with the provisions of the Financial Administration and Audit Act 1985 and other relevant written laws of the State of Western Australia.
G. Joyce Director General
2
About the Department of Housing and Works
The Department of Housing and Works (the Department), formed after the Machinery of Government review in July 2001, consolidates the public sector’s built environment and the Government’s assets and project management and will enhance the delivery of services in these areas.
Functions undertaken by the Department, in addition to its Statutory Authority, the State Housing Commission, are reported in separate annual reports and include:
Government Employees Housing Authority; Country Housing Authority; and Western Australian Building Management Authority.
Compliance with Legislation
The Department is required to comply with a range of Commonwealth and State Legislation.
Commonwealth Legislation
Housing Assistance Act 1996 Privacy Act 1998 Corporations Law Disability Discrimination Act 1992 Trade Practices Act 1974
State Legislation
Housing Act 1980 State Supply Commission Act 1991 Financial Administration and Audit Act 1985 Residential Tenancies Act 1987 Public Sector Management Act 1994 Salaries and Allowances Act 1975 Equal Opportunity Act 1984 Government Employees Superannuation Act 1987 Occupational Health, Wealth and Safety Act 1987 Workers’ Compensation and Rehabilitation Act 1981 Industrial Relations Act 1979 Industrial Relations Amendment Act 1993
3
Freedom of Information Act 1992 Environmental Protection Act 1986 Statutory Corporations (Liability of Directors) Act 1996 Fair Trading Act 1987 Consumer Credit (Western Australia) Act 1996 Transfer of Land Act 1893 Valuation of Land Act 1978 Land Administration Act 1997 Local Government Act 1995 Water Corporation Act 1995 Water Boards Act 1904 Public Works Act 1902 Town Planning and Development Act 1928 Metropolitan Region Scheme Act 1959 Aboriginal Heritage Act 1972 Native Title (State provisions) Act 1999 Swan Valley Planning Act 1995 State Title Planning Act 1995 Heritage of Western Australia Act 1990
Note: The above legislation is not intended to be a comprehensive list of all written laws with which the Department is required to comply.

4
Our Mission Responding to the hopes of all Western Australians for their housing and construction needs.
Our Vision Leading in the provision of housing services and development of a built environment which contributes to:
supportive, vibrant and sustainable communities; a robust economy; strong regional development; and the natural environment
for the benefit of all Western Australians.
Our Role To provide housing for Western Australians who cannot otherwise afford their own homes by arranging affordable home finance, rental housing and land.
The Department also builds homes, develops land and undertakes joint venture projects with other housing providers. Its programs are aimed at low-income homebuyers and renters, disadvantaged groups and people with special housing needs.
As part of its ‘Works’ function, the Department delivers, manages and maintains non-residential buildings in Western Australia.
Joondalup Police Academy
Designed by Architects. Peter Hunt and Daryl Jackson Architects

5
Director General’s Foreword
The 2002-03 financial year was the second for the Department of Housing and Works, since its inception on 1 July 2001 through the amalgamation of the former Ministry of Housing and parts of the former Department of Contract and Management Services.
It was pleasing to see many systems, processes and operations successfully refined within the Department and the evolution of a cohesive and purpose-driven organisation. In particular, the Works Procurement function has been significantly restructured and reorganised to provide two distinct functions – the Public Works Strategy Directorate with its whole-of-Government focus on advisory services and policy development; and the Project Services Directorate with a pivotal role to play in asset planning and project management, on behalf of a diversity of client agencies.
The non-residential works agenda is varied and challenging – from Government projects ranging from heritage precincts such as Fremantle Prison, to sensitive projects such as the Bali Memorial and ultra-large scale developments such as the Perth Convention and Exhibition Centre.
The Government’s focus on health, education and justice as priority areas has had an important impact on the Department and its project portfolio. Several major hospital and health service upgrades are in progress, along with state-
of-the-art schools and the visionary Nyandi Women’s Prison in Bentley.
Our Department’s approach to these and other projects is increasingly driven by the State Government’s Sustainability agenda. The Department of Housing and Works has been actively involved in the process of developing the State Sustainable Strategy that aims to balance environmental, social and economic imperatives for the future growth of Western Australia. There are many sustainability considerations relevant to the design and construction of public buildings, and the Department has initiated a number of projects to test new approaches to factors such as energy conservation and greenhouse gas emissions.
In this regard, the Department has the opportunity to be a role model to the private sector and to Government counterparts in other States and Territories.
I would like to acknowledge the flexibility and commitment of staff who have embraced the new challenges presented to them and adapted to a changing culture and organisational structure
The Western Australian Building Management Authority is a residual of the amalgamation of the Ministry of Housing and the Department of Contract and Management Services. The Authority's annual report has been included as a separate section of this report.
6
Works Procurement
Works Procurement provided a range of building-related management services to deliver the State Government’s Capital Works and Maintenance Programs. These services are delivered using extensive in-house expertise in asset planning, project delivery and maintenance planning for Government non-residential buildings. The Department of Housing and Works is committed to ensuring probity, value for money and effective risk management in all aspects of its operations.
Highlights 2002-03
The value of non-residential works managed during the year (including new works and improvements) exceeded $220 million.
Building Design Contracts
During the year, the Works Procurement Directorate awarded 279 contracts for service to building design professionals with a combined value of $12.9 million. The following are some of the major contracts for service awarded:
1. Bali Memorial
The Department assisted the Botanic Gardens and Parks Authority (formerly Kings Park Botanic Garden) and the Department of the Premier and Cabinet in planning a memorial to those who were lost or injured in the bombings in Bali in October 2002, their families and those involved in the aftermath.
The memorial will be located on the top of the escarpment in Kings Park overlooking Perth water and will be complemented by an informal barbecue area. A design was chosen following feedback from the public on
design proposals commissioned from three Perth-based architectural firms. The Department has put in place an intensively-managed construction process that will ensure the completion of the project for the anniversary of the event in October 2003. The total cost of the project is $850,000 including $500,000 for the cost of the memorial.
2. CBD Courts Complex
This project recommenced in earnest in October 2001 and since June 2002 the project has gained momentum with the appointment of a Project Director.
Cabinet has endorsed the project and allocated the funds in the capital works program for the management of the project procurement. The membership of the project team is currently being filled. The positions will involve a long-term engagement to manage the project to completion in late 2007.
Non-residential building works contracts
Over the same period Works Procurement awarded 251 non-residential building works contracts, at a combined contract value of $222 million. The following are some of the major construction contracts commenced during the year:
1. The Metropolitan Low Security Women’s Prison (Nyandi)
The construction of the new Metropolitan Low Security Women’s Prison (Nyandi) commenced in March 2003. The intention of the new facility is to create a community atmosphere within the complex, utilising small-
7
scale domestic residential-style accommodation.
The $11.0 million construction contract is due for completion in March 2004.
2. Sir Charles Gardiner Hospital Emergency Department Upgrade and Other Major Health Projects
The contract to upgrade the Emergency Department at Sir Charles Gairdner Hospital, was awarded in January 2003. The $8 million construction work, programmed for completion in April 2004, is being undertaken in four stages to allow the hospital to maintain its emergency services at all times.
Similar upgrades were undertaken at Rockingham-Kwinana District Hospital Emergency department, King Edward Memorial Hospital Delivery Suite and Osborne Park Hospital New Theatre Block for a total cost of $29 million.
3. Canning Vale College
The contract to construct the first stage of the new high school for Canning Vale was awarded in January 2003 for $12.4 million. The project is scheduled for completion for the commencement of the 2004 school year. The school is to be constructed in two distinct and separate stages, initially providing for years eight to ten, with years eight and nine commencing in 2004. The project will eventually be expanded to include facilities for years 11 and 12.
The school will have modern and innovative facilities developed in consultation with the school community including specialist areas for performing and visual arts, material and information technologies, student services, a sports hall and a library resource centre.
4. Lotteries Federation Walkway
The Botanic Garden and Parks Authority requested the Department to arrange, design, document and construct an elevated walkway in the grounds of Kings Park.
The walkway is at the top of the escarpment above the old Swan Brewery and below the Women’s Suffrage Memorial. The project consists of approximately 150 metres of on-ground walkways and approximately 250 metres of elevated walkways including a bridge.
Completed Projects
The following significant projects were completed during the year.
1. Mindarie College
The Department of Education and Training’s new $15 million senior college was built at Mindarie. The two-storey building constructed from coloured pre-cast concrete and masonry blocks was successfully delivered in January, in time for commencement of the school year. The facility features performing arts and multi-media production suites, ceramic, painting and drawing studios, an auditorium and teaching facilities for computing, science, metal and woodworking machine rooms.
2. Kinross College
Stage two of the College’s development was completed at Kinross in time for the new school year last January. A new auditorium and further teaching facilities were later completed in May 2003, bringing to a conclusion the site’s $15 million development.
The development offers two learning community-teaching blocks, a library, progressive community centres for technology and the arts, with a
8
distinctive covered sports area in addition to extensive hard courts.
3. Australian Marine Complex – Jervoise Bay
The construction of the infrastructure for the Australian Marine Complex project, formerly known as the Jervoise Bay development, for the State was completed. Major components of the project, included:
a protected and dredged harbour; a 15,000 tonne loadout wharf and a 3,000 tonne loadout wharf; a common user facility including a large movable Fabrication Hall; various other on site facilities including portal cranes and workers’ amenities; and a 80-hectare fabrication precinct /industrial estate.
The $118 million of infrastructure is now complete.
Special Government Projects
1. Perth Convention and Exhibition Centre
The Perth Convention and Exhibition Centre is currently under construction, and its completion is anticipated in May 2004.
2. WA Museum Francis Street
The Department has been working with the WA Museum and the Department of Culture and the Arts to develop a comprehensive plan to replace the Francis Street building.
3. New Metro Rail Committee
The New Metro Rail Committee has engaged the Department to project manage the possible sinking of the railway line between Wellington and Roe Streets in the Central Business District.
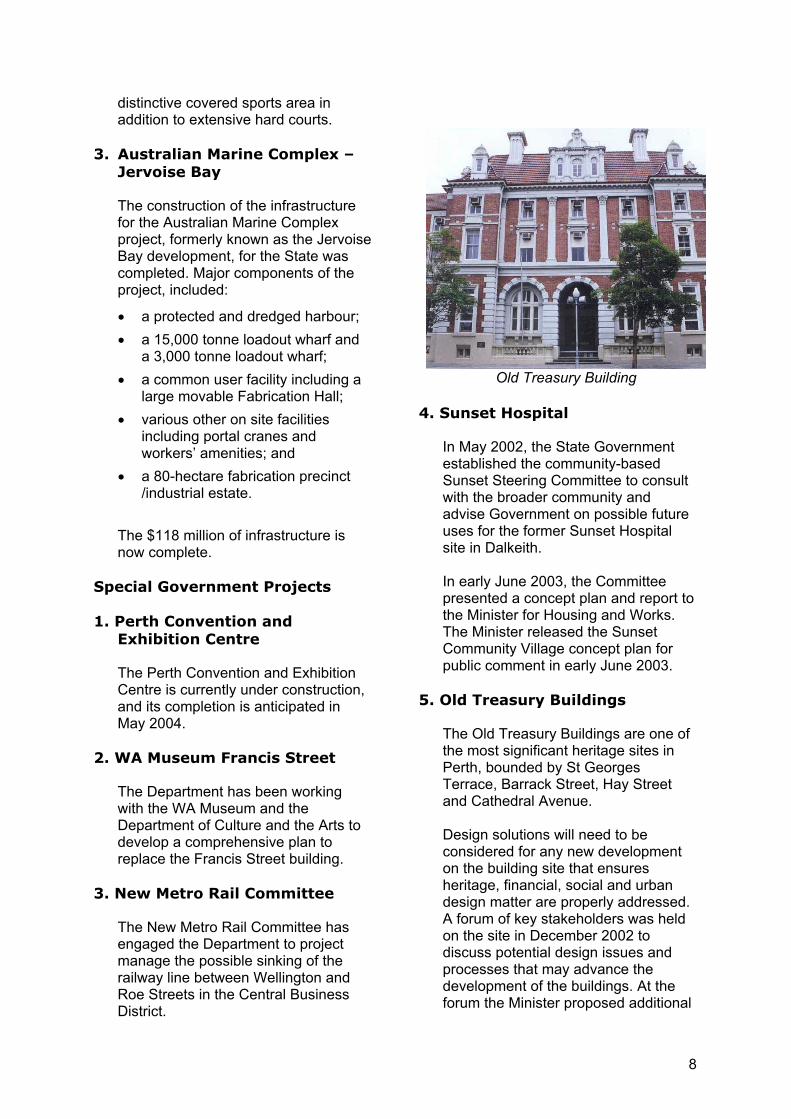
Old Treasury Building
4. Sunset Hospital
In May 2002, the State Government established the community-based Sunset Steering Committee to consult with the broader community and advise Government on possible future uses for the former Sunset Hospital site in Dalkeith.
In early June 2003, the Committee presented a concept plan and report to the Minister for Housing and Works. The Minister released the Sunset Community Village concept plan for public comment in early June 2003.
5. Old Treasury Buildings
The Old Treasury Buildings are one of the most significant heritage sites in Perth, bounded by St Georges Terrace, Barrack Street, Hay Street and Cathedral Avenue.
Design solutions will need to be considered for any new development on the building site that ensures heritage, financial, social and urban design matter are properly addressed. A forum of key stakeholders was held on the site in December 2002 to discuss potential design issues and processes that may advance the development of the buildings. At the forum the Minister proposed additional

9
consultation with stakeholders on the future of the buildings.
Draft heritage, planning and design guidelines are being prepared to ensure that any redevelopment complements the heritage values of the existing building. Key stakeholder groups are being consulted on the
guidelines.
Procurement options for the buildings are also being investigated, to identify how best to conserve the buildings whilst taking into the account the guidelines, market condition and Government requirements.
Output Measures
The following output measures apply to capital works projects managed by Works Procurement.
Measure Actual2002-03
Target2002-03
Value of capital works projects managed $220 million $298 million
Client satisfaction with advice and support for the delivery of capital works projects 73% 80%
Capital works projects delivered within timeframes agreed with clients 97% 95%
Cost as a percentage of the value of capital works projects 2.26% 1.98%
Overall cost of management of capital works projects $4,981,615 $5,893,908
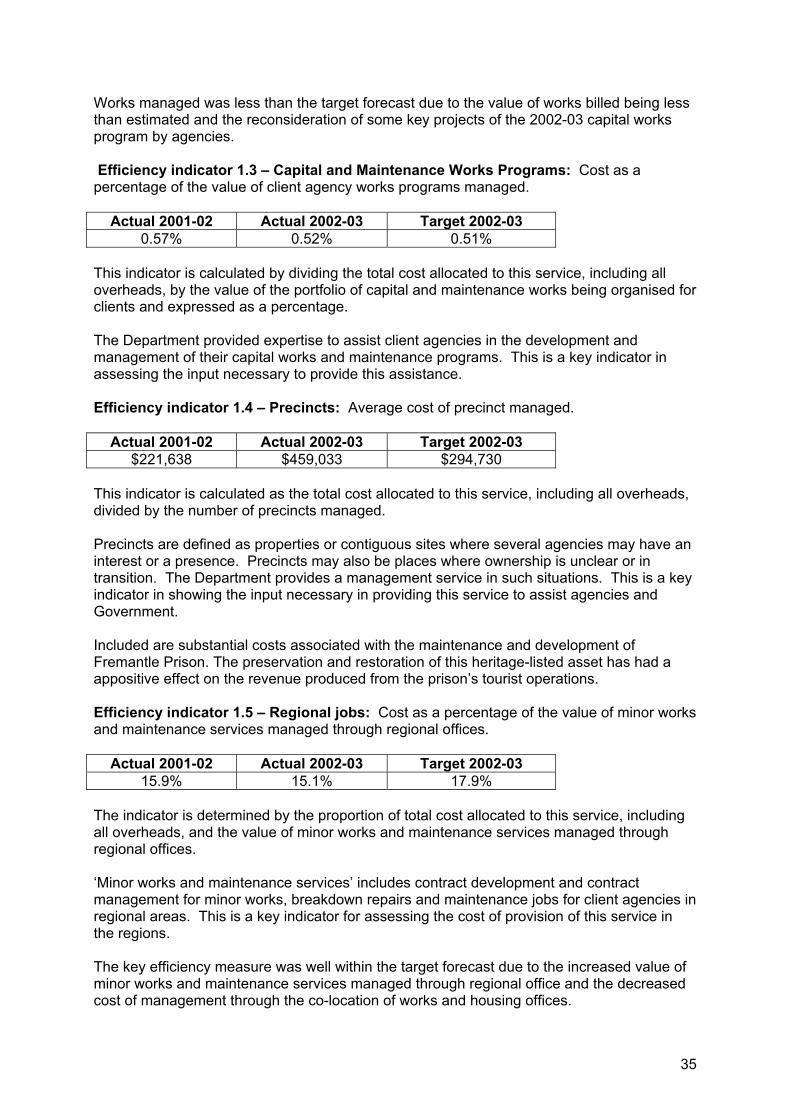
Works managed was less than the target forecast due to the value of works billed being less than estimated and the reconsideration of key projects of the 2002-03 capital works program by agencies.
The following output measures apply to the management of capital and maintenance works programs through head office.
Measure Actual2002-03
Target2002-03
Value of client agency works programs managed $308 million $378 million
Client satisfaction with advice and asset planning services for their capital works and maintenance programs
71% 80%
Works program reports delivered within timeframes agreed with clients 100% 95%
Cost as a percentage of the value of client agency programs managed 0.52% 0.51%
Overall cost of management of agency works programs $1,600,617 $1,912,173
The value of the client agency works programs managed was below the target forecast. An increase in the value of the maintenance program managed did not counterbalance the over-estimated target set for the capital works program. Client satisfaction was affected by the increases recovery of costs for this service.

10
The following output measures apply to the management of special and/or major projects.
Measure Actual2002-03
Target2002-03
Number of special projects managed 11 11
Degree of satisfaction with special projects managed 80% 70%
Degree of client satisfaction with timeliness of special projects managed 80% 70%
Average cost per special project $197,833 $448,545
Commercial Property
The Commercial Property branch is responsible for coordinating the effective delivery and ongoing management of the State Government’s office accommodation portfolio. The responsibility of the branch is divided into three main functional areas: Policy, Planning and Procurement; Lease Administration; and Portfolio Management.
Highlights 2002-03
The total property portfolio that the branch administers totals 479,000m2 in office space, comprising 30 per cent owned and 70 per cent leased. The branch administers 412 leases that consist of 90 per cent of the 301,000m2 that is leased from the private sector, with an annual gross rental totalling $72 million. $9.5
million was collected for the rental on the Government owned premises that fall within the Portfolio Management responsibility.
Outlook 2003-04
Important initiatives for the coming year include:
establishing a new property information database called ProgenNet;the launch of new office accommodation policy and procurement manual for Government agencies; and the energy auditing of Government owned buildings under the Department’s control.
Swanbourne Hospital
11
Output Measures
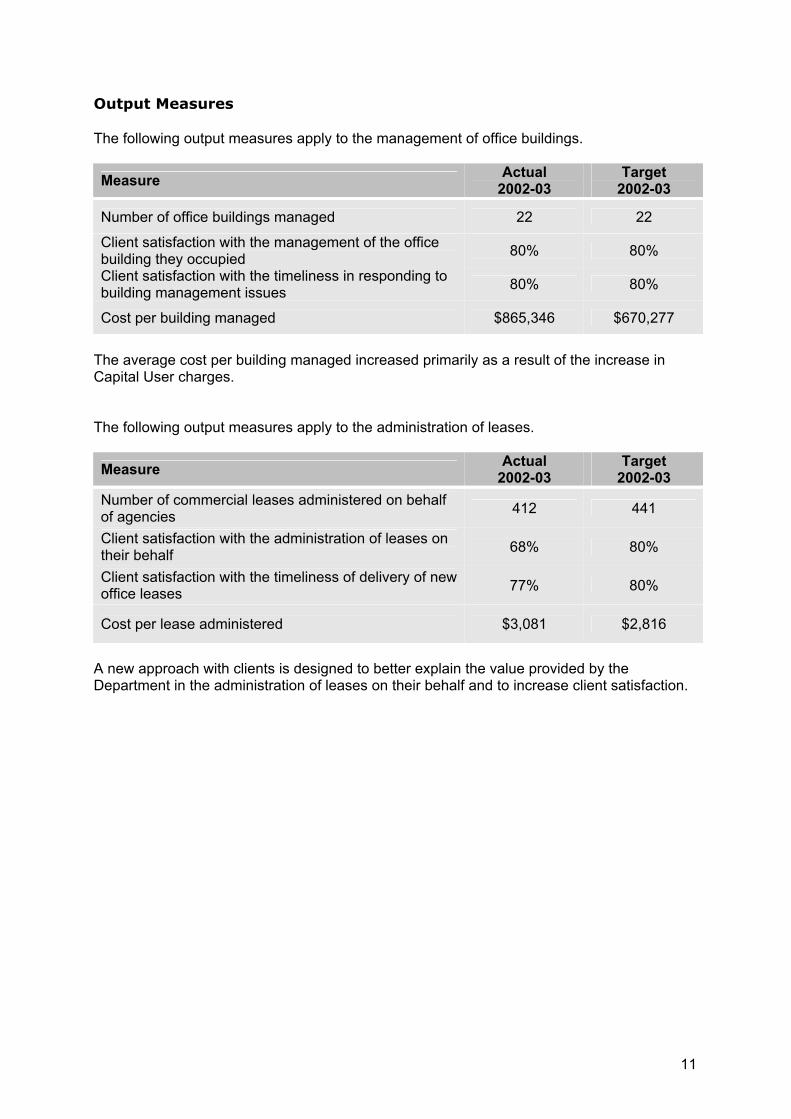
The following output measures apply to the management of office buildings.
Measure Actual2002-03
Target2002-03
Number of office buildings managed 22 22
Client satisfaction with the management of the office building they occupied 80% 80%
Client satisfaction with the timeliness in responding to building management issues 80% 80%
Cost per building managed $865,346 $670,277
The average cost per building managed increased primarily as a result of the increase in Capital User charges.
The following output measures apply to the administration of leases.
Measure Actual2002-03
Target2002-03
Number of commercial leases administered on behalf of agencies 412 441
Client satisfaction with the administration of leases on their behalf 68% 80%
Client satisfaction with the timeliness of delivery of new office leases 77% 80%
Cost per lease administered $3,081 $2,816
A new approach with clients is designed to better explain the value provided by the Department in the administration of leases on their behalf and to increase client satisfaction.

12
Western Property
Western Property was established in July 2002 to offer Government agencies increased flexibility in the way that maintenance services are contracted and significantly more choice, as well as an opportunity to become more directly involved in the supplier selection process.
There are currently 12 agency-specific contracts with six Service Arranger companies across 24 departments within the framework. The Service Arrangers perform works totalling approximately $73 million per annum.
The latest of these contracts is with Honeywell Limited for the Provision of Facilities and Energy Management Services at the Department of Land Administration. Honeywell Limited provides the services at Department of Land Administration’s offices in Midland.
The contract is for a five-year period commencing in May 2003 and includes three, two-year extension options exercisable at the absolute discretion of the Department.
This contract has an annual Guaranteed Maximum Price of $1,482,299 that is adjusted annually in accordance with changes in the CPI. This contract enables
the participants to share in ongoing savings arising out of contract innovation and good energy management practices.
Highlights 2002-03
A new One Call Centre, which receives requests for repairs and maintenance and arranges the required service providers has been operational since July 2002. The Call Centre is located in Manjimup and employs 21 local people to provide this service. 76,453 work orders were registered at the call centre at a value of $19.6 million.The average call time is 1.7 minutes, and 96 per cent of calls were answered in 20 seconds. Recent survey results indicated an 80 per cent satisfaction with the service.
Outlook 2003-04
Discussions are proceeding with the State Supply Commission and the Department of Treasury and Finance on the most appropriate way to consolidate the delivery of Property Services through Western Australia.

13
Output Measures
The following output measures apply to the management of minor works and maintenance services programs through Head Office.
Measure Actual2002-03
Target2002-03
Value of minor works and maintenance services managed $73.1 million $71.5 million
Client satisfaction with the delivery of minor works and maintenance services 73% 85%
Client satisfaction with the timeliness of delivery of minor works and maintenance services 67% 90%
Cost as a percentage of the value of minor works and maintenance services managed 6.28% 6.27%
Overall cost of management of minor works and maintenance services $4,588,545 $4,483,140
Client satisfaction was affected by the changes associated with the implementation of the new Western Property arrangements.
Goldfields Oasis Recreational Centre in Kalgoorlie
14
Regional Services (Western Property)
The Regional Service Facilities Management service became part of the state-wide Western Property facilities management arrangement with the commencement of Western Property in July 2002.
Highlights 2002-03
Regional Services (Western Property) delivered maintenance and minor works programs to client agencies in regional Western Australia, including:
routine maintenance ($2.8 million); restoration maintenance ($10.9 million);minor works ($11.6 million); small capital works ($3.9 million); and breakdown repair services ($12.1 million).
Clients included the Department of Education and Training, the WA Police Service, the Department of Justice, the Department of Community Development, Main Roads WA, Fire and Emergency Services and the Department of Culture and the Arts.
The following special programs were delivered:
The Department of Education and Training’s Operation RefreshThis program focussed on external painting and floor covering replacement in senior high schools throughout the State. This $6 million program was completed by 30 June 2003 and included the following expenditure:
$2.3 million in country areas; and$3.7 million in the metropolitan area.
An additional $4 million was allocated for special programs including improvements to access for people with disabilities and reducing maintenance backlogs and included the following expenditure:
$2 million in country areas; and $2 million in the metropolitan area.
The WA Police Service’s Occupational Health and Safety ProgramDetailed inspections to identify needs were completed during 2002-03. The $10 million program of works has commenced and is due for completion in both metropolitan and country areas by June 2005.
Rationalisation of the number of offices in country areas following the establishment of the Department of Housing and Works continued and was completed with the co-location of the former Ministry of Housing and the former Department of Contract and Management Services offices in Broome, Northam, Narrogin and Carnarvon.
Outlook 2003-04
Rationalisation of the number of offices in country areas will continue with the co-location of the Merredin, Karratha, Kalgoorlie and Esperance offices.
15
Output Measures
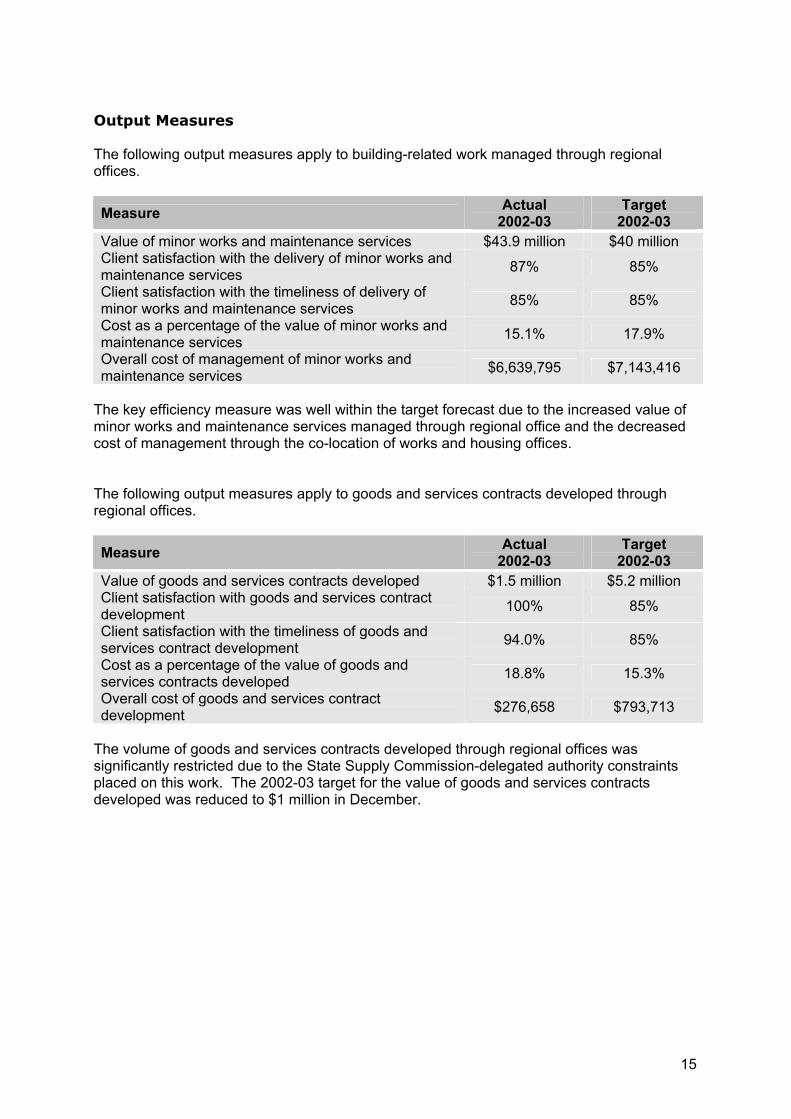
The following output measures apply to building-related work managed through regional offices.
Measure Actual2002-03
Target2002-03
Value of minor works and maintenance services $43.9 million $40 million Client satisfaction with the delivery of minor works and maintenance services 87% 85%
Client satisfaction with the timeliness of delivery of minor works and maintenance services 85% 85%
Cost as a percentage of the value of minor works and maintenance services 15.1% 17.9%
Overall cost of management of minor works and maintenance services $6,639,795 $7,143,416
The key efficiency measure was well within the target forecast due to the increased value of minor works and maintenance services managed through regional office and the decreased cost of management through the co-location of works and housing offices.
The following output measures apply to goods and services contracts developed through regional offices.
Measure Actual2002-03
Target2002-03
Value of goods and services contracts developed $1.5 million $5.2 million Client satisfaction with goods and services contract development 100% 85%
Client satisfaction with the timeliness of goods and services contract development 94.0% 85%
Cost as a percentage of the value of goods and services contracts developed 18.8% 15.3%
Overall cost of goods and services contract development $276,658 $793,713
The volume of goods and services contracts developed through regional offices was significantly restricted due to the State Supply Commission-delegated authority constraints placed on this work. The 2002-03 target for the value of goods and services contracts developed was reduced to $1 million in December.

16
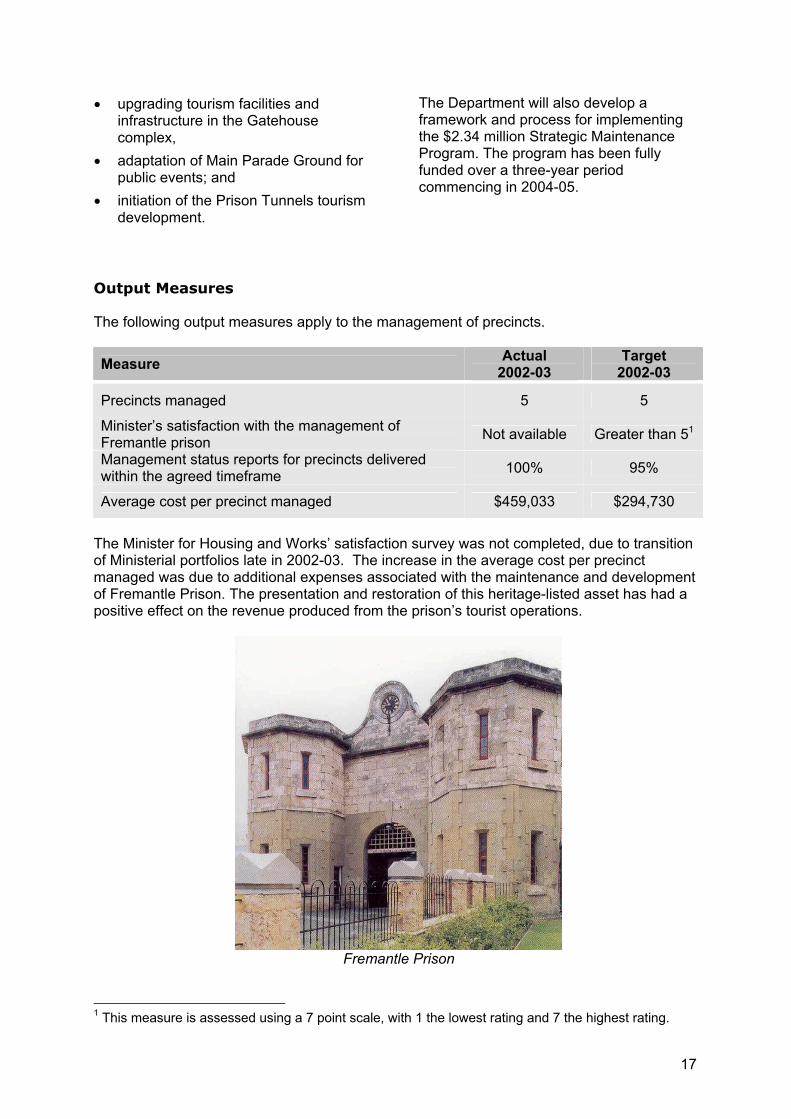
Fremantle Prison
Fremantle Prison
Fremantle Prison is one of Western Australia’s most significant heritage sites. It closed as an operating prison in 1991 and has since been developed as a tourism and heritage precinct. A Fremantle Prison Trust Committee, formed in 1992, advises the Minister for Housing and Works in relation to the Fremantle Prison site.
The Department of Housing and Works provides support to the Trust, managing day-to-day running of the complex and provides advice on conservation.
Highlights 2002-03
Visitor Services
The year marked the first full financial cycle for the in-house management of the tourism operation by the Department. Despite what has been widely acknowledged as one of the most difficult operating environments in the tourism sector, visitation grew at the Prison by 16 per cent with more than 121,000 tour sales. Targeted marketing and profile-building, supported by innovative new branding and improvements to product delivery, contributed to this positive result. Revenues generated by the in-house tourism operation have enabled an unprecedented 75 per cent increase in recurrent maintenance spend to $233,000.
Public Programs
A special event, Catalpa Day, took place on Easter Monday to raise public awareness of a fascinating story from the Prison’s convict origins, thus adding to the success of the annual Descendants’ Day celebrations. The program included a convict escape re-enactment on the tall
ship Leeuwin, themed guided tours and a stage play. The events resulted in an increase of 206 per cent in visitors for the day and ongoing interest in the story and a related exhibition project. It has been proposed that this program will continue on as an annual event.
Master Plan Project
Launched in May 2002, the Master Plan project was initiated to identify the issues associated with sustainable use and development. The aim of the project is to develop a ten-year strategic plan for the site. Following extensive stakeholder and public consultation, the final plan was completed in June 2003. The plan will be submitted to Cabinet for consideration in late 2003.
Outlook 2003-04
Visitor Services
An ongoing program of product development and enhancement will focus on both day and evening tours. Both areas have remained substantially unchanged for some time. The proposed development of the Prison’s tunnel system as a tourism attraction will be fully explored. It is believed that the availability of tunnel tours could increase annual visitor numbers by up to 40 per cent.
Master Plan
Subject to endorsement of the final Master Plan for Fremantle Prison by State Cabinet, the Department will establish a process to implement the key short-term recommendations with a focus on opportunities such as:
17
upgrading tourism facilities and infrastructure in the Gatehouse complex, adaptation of Main Parade Ground for public events; and initiation of the Prison Tunnels tourism development.
The Department will also develop a framework and process for implementing the $2.34 million Strategic Maintenance Program. The program has been fully funded over a three-year period commencing in 2004-05.
Output Measures
The following output measures apply to the management of precincts.
Measure Actual2002-03
Target2002-03
Precincts managed 5 5
Minister’s satisfaction with the management of Fremantle prison Not available Greater than 51
Management status reports for precincts delivered within the agreed timeframe 100% 95%
Average cost per precinct managed $459,033 $294,730
The Minister for Housing and Works’ satisfaction survey was not completed, due to transition of Ministerial portfolios late in 2002-03. The increase in the average cost per precinct managed was due to additional expenses associated with the maintenance and development of Fremantle Prison. The presentation and restoration of this heritage-listed asset has had a positive effect on the revenue produced from the prison’s tourist operations.
Fremantle Prison
1 This measure is assessed using a 7 point scale, with 1 the lowest rating and 7 the highest rating.

18
Industry Policy and Advice
I. PORTFOLIO LEGISLATION
Public Works Act 1902
The Public Works Act 1902 provides for the Minister for Housing and Works to undertake activities relating to the provision of public works for Western Australia. Public works are defined in the Act and comprise a wide range of buildings and physical infrastructure considered necessary for public purposes. The Act covers a wide variety of works relating to: transport; water supply, sewerage and drainage; public buildings, parks, gardens and grounds for public recreation; protection and conservation of places or environmental features; harbours, ports, quarries and similar works.
Specialist works agencies, such as the Department of Planning and Infrastructure and Government Trading Enterprises, have their own enabling legislation and do not rely on the Public Works Act. The Department uses Public Works Act powers for its core business of procurement and maintenance of public buildings.
Most Government departments and agencies do not have powers to construct buildings or other infrastructure. Generally, public works required for the purposes of these departments or Minister for Housing and Works constructs agencies through the Department. The Minister for Housing and Works administers the Public Works Act with the assistance of the Department and other public authorities.
Housing Act 1980
The State Housing Commission (the Commission) was established under the State Housing Act 1946 and continued under the current Housing Act 1980. The Commission is a body corporate and an agent of the Crown. The objectives of the Act are to:
improve existing housing conditions; provide housing and land for housing; provide assistance to enable persons to obtain accommodation or improve the standard of their accommodation; encourage the development and redevelopment of land for housing and related purposes; and carry into effect of agreements and arrangements entered into with the Commonwealth with respect to housing.
A seven-member Board that consists of the Director General and six other members appointed by the Governor presides over the Commission.
As a statutory authority, the Commission has general corporate powers, and specific powers to:
acquire, hold, maintain, improve, exchange, lease and dispose of real and personal property; borrow and lend money; and give guarantees, indemnities, and undertakings whether in respect of the payment or repayment of moneys, the performance of obligations, or otherwise.
19
The Commission can employ its own staff and does not have a power to use the staff and services of other agencies.
Country Housing Act 1998
The Country Housing Act established the Country Housing Authority. The Country Housing Authority is a body corporate and an agent of the Crown. The objectives of the Act are to:
provide housing outside the metropolitan regions for farmers and their employees and for retired farmers in connection with certain businesses and services; borrow and lend money; and acquire, hold, manage, improve, develop and dispose of real and personal property.
The Country Housing Authority is governed by a six-member Board appointed by the Minister, the State Treasurer and the Minister responsible for the Technology and Industry Development Act 1983.
The Country Housing Authority cannot employ its own staff but has the power to use the staff and services of other agencies. It currently uses the staff and services of the State Housing Commission.
Government Employees Housing Act 1964
This Act established the Government Employees Housing Authority, or GEHA. GEHA is a body corporate and an agent of the Crown. The objectives of the Act are to:
procure land and houses for Government employees; maintain those houses; and lease and dispose of those houses or land.
GEHA is governed by an eight-member Board appointed by the Minister.
GEHA can employ its own staff and does not have a power to use the staff and services of other agencies.
Architects Act 1921
The Architects Act 1921 provides for the registration of Architects. This Act establishes the Architects Board of Western Australia (the Board). The Board is a body corporate with perpetual succession and a common seal.
The principal purpose of the Board is to make provision for the registration of architects, to contribute to the educational standards of the schools of architecture in Western Australia, to discipline architects for breaches of professional standards and to prosecute others who breach the Act.
The Board is established under the Architects Act 1921. It consists of three members nominated by the Governor, six members elected by registered architects from among their members in accordance with by-laws and one member nominated by the Western Australian Chapter of the Royal Australian Institute of Architects.
Four positions on the Board become vacant in late January each year. Under the Act, two of these positions are to be filled by election of registered architects, one is to be filled by nomination by the Royal Australian Institute of Architects and one is to be nominated by the Governor.
Housing Loan Guarantee Act 1957
This Act is intended to encourage, through provisions for guarantees and indemnities, the building and purchasing of houses by:
enabling institutions concerned with advancing loans for the purposes of building houses or with making financial assistance available for the purposes of purchasing houses, or with both, to increase amounts of advances and financial assistance for those purposes; and
20
enabling institutions mentioned above to borrow money to be applied in the building and purchasing of houses.
The Treasurer is authorised to give guarantees and indemnities to encourage the building and purchase of houses.
Housing Societies Act 1976
The Housing Societies Act provides for the formation, regulation and control of housing societies (terminating building societies). Such societies can:
raise funds as authorised by this Act; apply those funds subject to this Act and making advances an in such other ways as authorised by this Act; and act as an agent for authorities or institutions whose objects are similar to those of the society.
Parts VIII and XV of the Local Government (Miscellaneous Provisions) Act 1960
Part XV of the Local Government Actprovides for all matters in relation to the administration, by local Governments, of building control matters. These include the approval processes for:
the development and demolition of buildings;the construction of protective hoardings, protection of footpaths during construction; the protection of adjoining properties adjacent to excavations, the construction of buildings, building encroachments into streets;the service of Notices by local Governments that require building alterations, stopping unlawful work; the management of dangerous, neglected, dilapidated and uncompleted buildings; the adequacy of fire escapes; the safety of public buildings; and
the process of Appealing to the Minister in relation to the decisions of local Governments; and the creation of local laws in relation to buildings.
The regulations represent the subordinate legislation that supports the Act and includes such matters as:
the adoption of the Building Code of Australia; the notification of other authorities prior to granting building licences; building applications; issuing Certificates of Classification upon completion of multi-residential, commercial, industrial and public buildings; the administration of precautionary measures required during the demolition of buildings; administering building projections beyond the street alignment; the provision and construction of safety barriers surrounding private swimming pools; and applicable offences and penalties.
Dividing Fences Act 1961
The Dividing Fences Act relates to the construction and repair of Dividing Fences between certain lands.
II. CURRENT LEGISLATIVE PROGRAM
Machinery of Government (Miscellaneous Amendment) Bill 2003
The Machinery of Government Bill is being prepared by the Department of Premier and Cabinet and is expected to be enacted in the Spring Session of Parliament.
The Bill makes provisions for the State Housing Commission, the Government Employees’ Housing Authority and the Country Housing Authority to be merged to
21
become a single Housing Authority under the Housing Act 1980. Management of the Housing Authority will be vested in the Chief Executive Officer who will manage the consolidated functions. The functions of the Housing Authority will be described in each relevant Act. The existing Boards will subsequently be abolished. The separate funds set up under each Act have not been merged, nor are the financial provisions. The Minister will be separate from the Housing Authority and will have the power to direct the Authority.
Housing Bill
Cabinet approved drafting of a new Housing Bill in December 2001. This Bill will continue the single Housing Authority and allow repeal of the Housing Act 1980,the Government Employees’ Housing Act 1964, and the Country Housing Act 1998.
A Counsel has been allocated to the drafting of this Bill but due to other legislative priorities substantial progress has not been made.
Public Works Act Amendment Bill
Cabinet approved drafting of amendments to the Public Works Act in December 2001. These amendments clarify the role and functions of the Minister for Housing Works and will abolish the Western Australian Building Management Authority.
Architects Bill 2003
The drafting instructions for the final Architects Bill were forwarded to Parliamentary Counsel in May 2003. Once the Department has received and accepted the final draft, the Bill will be submitted to Cabinet for approval to print.Introduction to Parliament will depend on the Government’s legislative priorities.
Construction Contracts Bill 2003
The drafting instructions for the final Construction Contracts Bill were
forwarded to Parliamentary Counsel in March 2003. Once the Department has received and accepted the final draft, the Bill will be submitted to Cabinet for approval to print. Introduction to Parliament will depend on the Government’s legislative priorities.
Repeal of the Housing Societies Act
Cabinet approval is being sought for repeal of the Housing Societies Act. The Act provides a framework for establishing and managing terminating building societies. The use of terminating building societies has been wound down in favour of loans schemes through Keystart. Over a long period of time, existing terminating building societies have amalgamated rather than having been wound up. As a result, accumulated reserves are concentrated in the few remaining societies, and if wound up under the current Act, the controllers of those societies would reap a windfall profit of approximately $8 million. The proposal before Cabinet is to repeal the Act and transfer the surplus to the State Government to fund public housing.
Building Act
The proposed Building Act will update and consolidate the framework for establishing building standards and issuing of building licences. Drafting instructions were prepared under the previous Government and endorsed by Cabinet in 2000. Drafting has not proceeded and a number of policy issues need to be reconsidered. The main issue is the use of private sector certification.
The Building Control Branch from the Department of Local Government and Regional Development are now part of the Department of Housing and Works. The knowledge and expertise of the Branch will help to expedite the progress of this legislation.
22
Year of the Built Environment
The Western Australian Government has proclaimed 2004 to be the Year of the Built Environment. The built environment can be defined as the buildings, places and structure in which we live, work and play.
The Year of the Built Environment 2004 is strongly supported, in Western Australia, by the built environment industry and the Minister for Housing and Works. This Western Australian initiative has gained the support of the Federal Government to make the Year of the Built Environment an Australia-wide event.
Highlights 2002-03
A Chair and State Steering Committee were appointed to plan the celebrations and events for the Year of the Built Environment 2004, to encourage community, industry and Government involvement.
The Federal Government announced that the Year of the Built Environment will receive national support through a program of events and formal funding of $168 million.
Outlook 2003-04
Planning for the year will proceed with the following key activities:
the development and completion of a marketing and communications plan including publications and display material; the development of a Commonwealth Website to encourage and enhance the national focus; and the development and implementation of a calendar of events, including the management of an activities program.
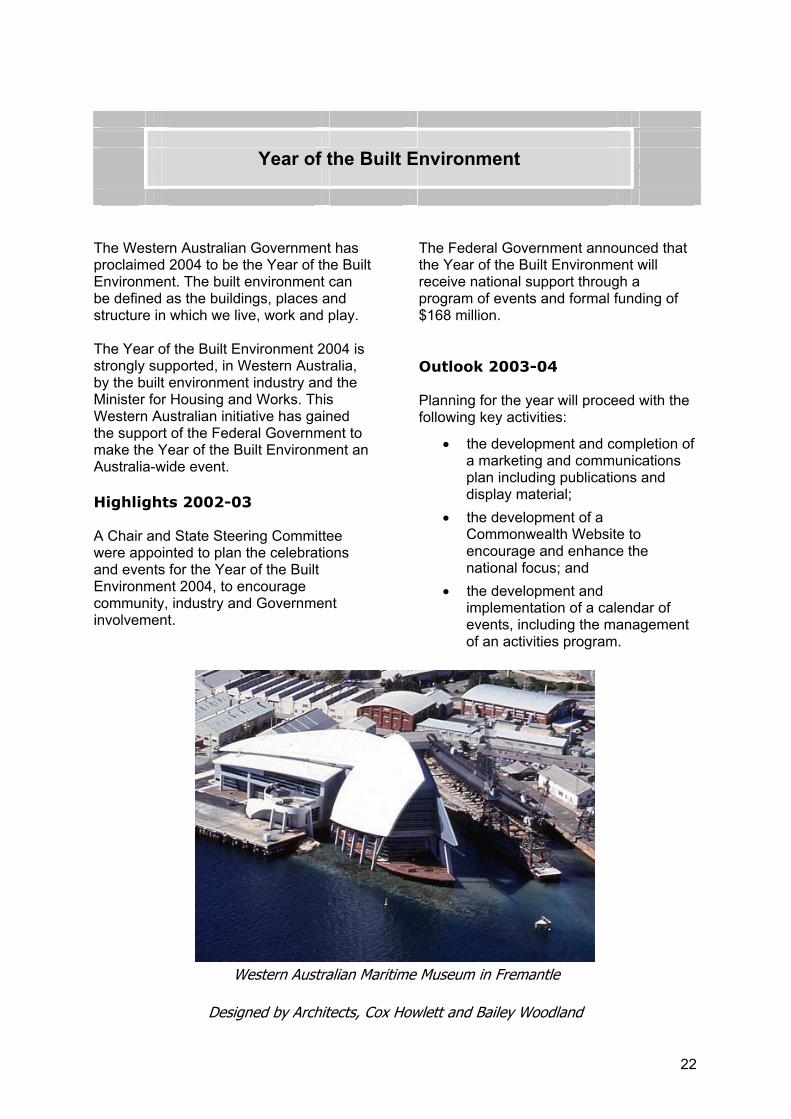
Western Australian Maritime Museum in Fremantle
Designed by Architects, Cox Howlett and Bailey Woodland

23
Sustainability
The State Labor Government will release a State Sustainability Strategy later this year to guide the implementation of sustainability in Western Australia over the next five to 10 years and beyond. Sustainability refers to meeting the needs of current and future generations through integration of environmental protection, social advancement and economic prosperity.
The Department of Housing and Works has been actively involved in the process of developing the Strategy through written submissions, participation in workshops and ongoing liaison at officer level.
The Department is committed to sustainability and has implemented a number of initiatives in advance of the release of the Strategy:
the implementation of a policy requiring all owners to disclose the Australian Building Greenhouse Rating Scheme (ABGRS) rating of their
buildings at the time a proposal is being considered to accommodate a Government agency. A proposal is currently being considered to accommodate a Government agency. Office buildings under the Department’s control will be ‘energy-audited’ and assigned an ABGR rating; planning for an innovative school incorporating a number of sustainability initiatives to be built at Harvest Lakes, South Atwell. This project is designed to demonstrate the key elements of sustainable design to the students and to the broader community; transfer of responsibility for building control standards and the Building Code of Australia to the Department in late April 2003. This supports Government initiatives in sustainable buildings by allowing direct input into building standards and regulatory frameworks.
Artist’s impression of proposed sustainable housing project in Broome.

24
Our People
Human Resources
The past year was one of ongoing consolidation of the Machinery of Government changes introduced in 2002. Significant projects undertaken included:
the merging of the former Ministry of Housing and Department of Contract and Management Services payroll systems; the implementation of revised Directorate structures;the development and delivery of training programs appropriate to the business needs of the new entity; and the revision of human resource policies.
The Human Resources branch is responsible for delivering human resource management and support to 1,109 departmental employees.
HR Planning
The branch continued to provide a quality human resource information reporting service, enabling the effective management of the Department’s workforce.
The following table sets out staff members for the Department and includes staff provided for the Government Employees Housing Authority and the Country Housing Authority.
Employees 2002-03
Permanent Full-time 880 Part-time 107
Contract Full-time 74Part-time 8
Casual 22Trainee 2Other 16Total Employees 1,109
Equal Opportunity
The following are some of the achievements accomplished during the year in relation to Equal Employment Opportunity and Diversity:
The Contact Officer Network was modified to blend the roles of former Ministry of Housing Contact Officers and the former Department of Contract and Management Services Grievance Officers into one. Vacancies in several areas were identified and filled. EEO Contact Officer training was held for all ongoing and new Grievance Officers; In response to the Government’s Equity and Diversity Plan, diversity targets were incorporated into the agency’s planning and monitoring processes and continued to drive the development of specific strategies to increase the employment of each equity group; Policies and Guidelines relating to the Public Sector Standards in Human Resource Management were updated;

25
The Code of Conduct policy was revised and made available to all staff; The Focus on Racism training program continued. Seven workshops were conducted at Metropolitan and Regional Branches throughout the year with 71 staff undergoing training; and
EEO Incidents and grievances were reported in the Balanced Scorecard, thus ensuring that areas requiring attention are identified and progressed.
Representation of Equal Opportunity Target Groups as at 30 June 2003.
2002-03No. %
Indigenous employees 94 8.5Culturally and linguistically diverse employees 42 3.9
Employees with disabilities 40 3.6Women 522 47.1Total employees 1,109 100.0
Employee Relations
All Workplace Agreements ceased in March 2003 and staff were given with choice to withdraw from their Workplace Agreements and move onto either the Public Service General Agreement 2002 or the Statutory Contract of Employment.
As at 30 June 2003:
537 were employed pursuant to the Public Service General agreement; and532 were employed pursuant to the Statutory Contract of Employment.
Workers’ Compensation Statistics
2002-03no.
2001-02no.
2000-01no.
No. of lost time injuries 9 14 12Frequency rate1 3.3 9.9 8.5Incident rate2 0.83 1.5 1.4
Note:1The number of lost time injuries per million hours worked. 2The number of lost time injuries per 100 workers.
Client Outcomes
The Department of Housing and Works has adopted the following State Housing Commission plans and procedures that address client and community requirements.
Cultural Diversity and Language ServicesThe Department aims to ensure that language is not a barrier to service for people from non-English speaking

26
backgrounds. Many of the Department’s clients are from culturally and linguistically diverse and indigenous backgrounds. The metropolitan regional offices have on-site interpreter services, which include a telephone interpreter service available on a needs basis. Telephone interpreter services are also available to country regions and clients with hearing impairments. The Department provides staff with training on cultural awareness and has a Cultural Services Policy. All letterheads have information in 17 languages on the reverse, advising clients of the interpreter/translation service. In 2002-03, the total cost of providing this service exceeded $40,000.
Youth Outcomes The Department continued to work in partnership with Anglicare, Fremantle Community Youth Services and the Rockingham Youth Accommodation Program to provide housing support for young people. The Department provides housing for a range of youth schemes and the Department for Community Development provides funding for the management services. The schemes supported by the Department include:
Youth Externally Supported Housing;Fremantle Regional Externally Supported Housing; and Rockingham Youth External Accommodation Program.
Waste Paper Recycling The Department uses Paper Recycling Industries for waste paper removal. The current contract is due to expire on 1 May 2005. The contractor collects all grades of paper with the exception of cardboard. The collection and destruction of confidential material is not included in this contract.
Code of Conduct
The Department’s Code of Conduct policy has undergone a substantial review to incorporate the Code of Conduct policy statements for the Department of Contract and Management Services and the Western Australian Building Management Authority.
The Department’s Code of Conduct policy statement responds to the whole-of-Government Code of Ethics principles of Justice, Respect for Persons and Responsible Care. The Code of Conduct outlines the Department’s expectations of its employees in the following areas:
advice to the Minister; communications;conflict of interest; loyalties and beliefs; gifts;rewards and hospitality; client complaints; management and staff relationships; harassment;appointment and relationships with applicants;use of Government assets and facilities; buying for Government; and benefits from intellectual property.
Information Services
The outsourced BDMW contract which provided mainframe services to Works has been transitioned to in-house management.
Business Systems
Cessation of an outsourcing contract (BDMW) resulting in the migration of dozens of works applications in-house, including the redevelopment of several of these applications.

27
FOR 2002-03 ANNUAL REPORT:
Statement of Compliance with Public Sector Standards and Codes
1. In the administration of the Department, I have complied with the Public Sector Standards in Human Resource Management, the Western Australian Public Sector Code of Ethics and the Department’ Code of Conduct.
2. I have put in place procedures designed to ensure such compliance and conducted appropriate internal checks to satisfy myself that the statement made above is correct.
3. The applications made for breach of standards review and the corresponding outcomes for the reporting period are:
Number lodged…………………… 2
Number of breaches found, including details of multiple breaches per application…………………….. 1
Number still under review………... 1
G L JOYCE DIRECTOR GENERAL

28
Reporting Requirements
Disability Services Plan
The Department is committed to providing access to its housing and client services across all its programs and does so in keeping with the Disabilities Services Plan to ensure people with disabilities have the same access and opportunity as others.
Access provisions for people with disabilities include:
adapting existing services to meet the needs of people with disabilities; improving access to office accommodation;
providing information about the Department of Housing and Works’ facilities and services in formats that enhance communication for people with disabilities; providing opportunities for people with disabilities to participate in public consultations, grievance mechanisms and decision-making processes; and delivering information and services by staff who are aware of and understand the needs of people with disabilities.
Advertising and Market Research
The advertising and Market Research costs incurred by the Department are also incurred by its overarching body, the State Housing Commission.
Advertising and Market Research 2002-03Advertising Agencies Nil
Market Research Organisations Market Equity Pty Ltd Paterson Market Research
$4,895$12,523
Polling Organisations Nil
Direct Mail Organisations NilMedia Organisations Market Force Media Decisions Total
$134,794$47,025
$181,819
Total Advertising and Market Research $199,273

29
Freedom of Information
In accordance with Section 94 of the Freedom of Information Act 1992 the Department of Housing and Works has an Information Statement that ensures information concerning its operations and the documents it holds are kept up-to-date and made available to the public. The Information Statement provides members of the public with a list of the kinds of documents held by the agency and the means of accessing these documents both outside the FOI process and within, by
providing the details of procedures to be followed for lodging a Freedom of Information access application.
The Department of Housing and Works received and finalised 80 applications during the 2002-03 financial year.
All enquiries should be made to the FOI Coordinator, Department of Housing and Works, 99 Plain Street, East Perth, WA 6004.
Energy Smart Government Policy
In accordance with the Energy Smart Government Policy, the Department has committed to achieving a 12 per cent reduction in non-transport related energy use by 2006-07.
Energy Smart Government Policy 2002-03
Energy Consumption (MJ) 391,455,014
Energy Cost ($) $2,754,472
Greenhouse Gas Emissions (tonnes of CO2) 100,056
Performance Indicators MJ / m2
MJ / FTE 286,554352,980

AUDITOR GENERAL
4th Floor Dumas House 2 Havelock Street West Perth 6005 Western Australia Tel: 08 9222 7500 Fax: 08 9322 5664
INDEPENDENT AUDIT OPINION
To the Parliament of Western Australia
DEPARTMENT OF HOUSING AND WORKS PERFORMANCE INDICATORS FOR THE YEAR ENDED JUNE 30, 2003
Audit Opinion In my opinion, the key effectiveness and efficiency performance indicators of the Department of Housing and Works are relevant and appropriate to help users assess the Department’s performance and fairly represent the indicated performance for the year ended June 30, 2003.
Scope The Director General’s Role The Director General is responsible for developing and maintaining proper records and systems for preparing performance indicators.
The performance indicators consist of key indicators of efficiency and effectiveness.
Summary of my Role As required by the Financial Administration and Audit Act 1985, I have independently audited the performance indicators to express an opinion on them. This was done by looking at a sample of the evidence.
An audit does not guarantee that every amount and disclosure in the performance indicators is error free, nor does it examine all evidence and every transaction. However, my audit procedures should identify errors or omissions significant enough to adversely affect the decisions of users of the performance indicators.
D D R PEARSON AUDITOR GENERAL September 25, 2003

31
DEPARTMENT OF HOUSING AND WORKS CERTIFICATION OF PERFORMANCE INDICATORS
FOR THE YEAR ENDED 30 JUNE 2003
I hereby certify that the performance indicators are based on proper records, are relevant and appropriate for assisting users to assess the Department of Housing and Works performance, and fairly represent the performance of the Department for the financial year ended 30 June 2003.
GREG JOYCE ACCOUNTABLE OFFICERDate: 15 August 2003

32
Performance Indicators
Outcome: Value for money in the delivery and management of Government projects, properties and office accommodation.
The Department of Housing and Works delivers, manages and maintains non-residential buildings across the State. A wide range of services are provided to facilitate the State Government's capital works and maintenance programs. These include:
a coordinated and specialist approach to procurement and management of the State Government’s non-residential capital works and office accommodation requirements; responsibility for managing the Government’s exposure to building and construction related risk and performing all commercial interface roles in architecture and building where appropriate; maintenance of appropriate contracting and building standards for the delivery of the State Government’s non-residential capital works procurement program; and establishment and maintenance of appropriate office and building standards for the State Government’s accommodation needs.
The Department participates in partnerships with private sector service providers. Capital works and non-residential projects are designed by private sector architects and constructed by commercial builders under contract to and managed by the Department.
Changes to the output and indicators for 2002-03 The Department of Housing and Works output measures for 2002-03 include the previous output measures for the Western Australian Building Management Authority, as the Department was responsible for the procurement of the Government’s building works in 2002-03. The Western Australian Building Management Authority continues as a legal entity servicing State borrowings.
The Department adopted a shared Outcome, Key Effectiveness Indicator, Output 1 statement and Output 1 description for 2002-03 to provide an inclusive definition of its expanded services.
Determination of Client Satisfaction Satisfaction surveys are based on the use of a 7-point Likert-type scale. The response rating is based on the proportion of respondents surveyed who were satisfied. Respondents were asked to provide a rating of the Department’s services in the range ‘Very satisfied’, ‘Satisfied’, ‘Slightly satisfied’, ‘Neither satisfied nor dissatisfied’, ‘Slightly dissatisfied’, ‘Dissatisfied’ or ‘Very dissatisfied’. All ‘Not applicable’ or ‘Don’t know’ responses have been excluded from the satisfaction rating.
A ‘satisfied respondent’ for a particular question is defined as a person providing a response in the range ‘Very satisfied’ to ‘Slightly satisfied’ inclusive. The number of responses to a question falling in this range, divided by the total number of valid responses to the question, is taken as a percentage and reported as the client satisfaction rating.
33
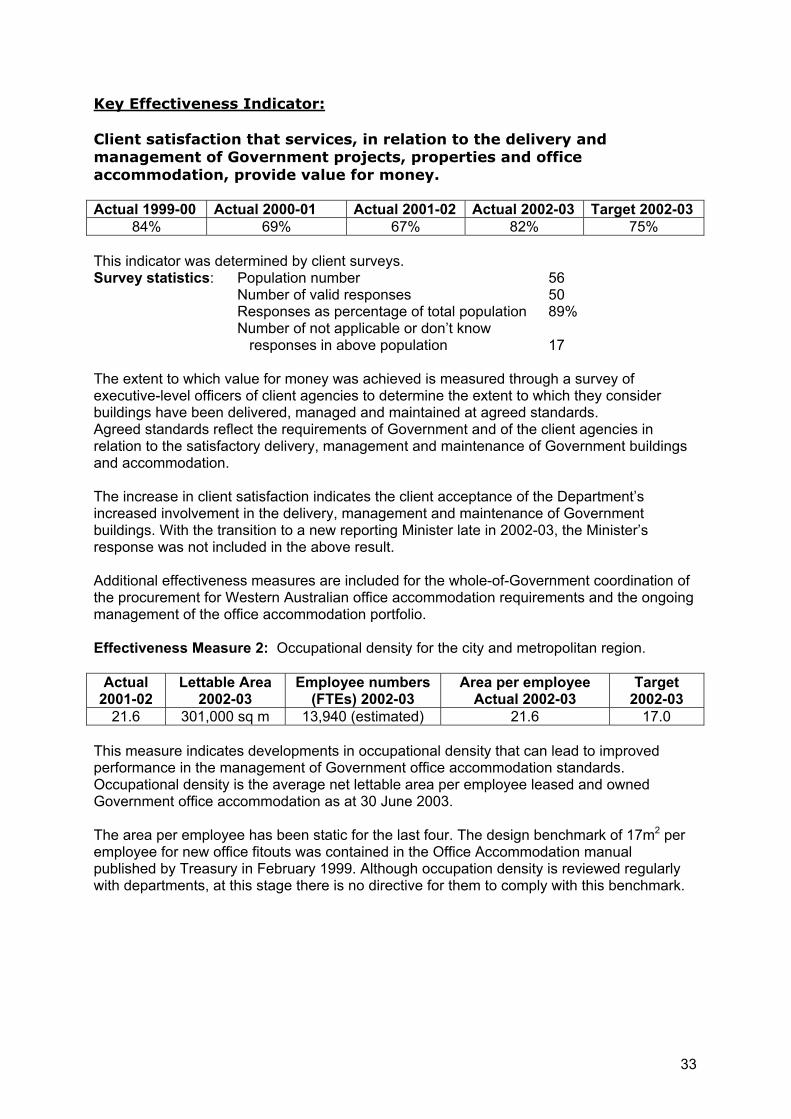
Key Effectiveness Indicator:
Client satisfaction that services, in relation to the delivery and management of Government projects, properties and office accommodation, provide value for money.
Actual 1999-00 Actual 2000-01 Actual 2001-02 Actual 2002-03 Target 2002-03 84% 69% 67% 82% 75%
This indicator was determined by client surveys. Survey statistics: Population number 56 Number of valid responses 50 Responses as percentage of total population 89% Number of not applicable or don’t know responses in above population 17
The extent to which value for money was achieved is measured through a survey of executive-level officers of client agencies to determine the extent to which they consider buildings have been delivered, managed and maintained at agreed standards. Agreed standards reflect the requirements of Government and of the client agencies in relation to the satisfactory delivery, management and maintenance of Government buildings and accommodation.
The increase in client satisfaction indicates the client acceptance of the Department’s increased involvement in the delivery, management and maintenance of Government buildings. With the transition to a new reporting Minister late in 2002-03, the Minister’s response was not included in the above result.
Additional effectiveness measures are included for the whole-of-Government coordination of the procurement for Western Australian office accommodation requirements and the ongoing management of the office accommodation portfolio.
Effectiveness Measure 2: Occupational density for the city and metropolitan region.
Actual2001-02
Lettable Area 2002-03
Employee numbers (FTEs) 2002-03
Area per employee Actual 2002-03
Target2002-03
21.6 301,000 sq m 13,940 (estimated) 21.6 17.0
This measure indicates developments in occupational density that can lead to improved performance in the management of Government office accommodation standards. Occupational density is the average net lettable area per employee leased and owned Government office accommodation as at 30 June 2003.
The area per employee has been static for the last four. The design benchmark of 17m2 per employee for new office fitouts was contained in the Office Accommodation manual published by Treasury in February 1999. Although occupation density is reviewed regularly with departments, at this stage there is no directive for them to comply with this benchmark.

34
Effectiveness Measure 3: Vacancy rate for the city and metropolitan region.
Actual2001-02
Lettable Area 2002-03
Vacant Area 2002-03
Vacancy Rate 2002-03
Target2002-03
0.25% 301,000 sq m 4,275 sq m 1.4% 0%
This measure indicates the actual performance in minimising the vacant office accommodation space under management. The vacancy rate is the percentage of total marketable office accommodation by area that is vacant in leased and owned Government office accommodation as at the 30 June 2003. Through the effective management by the Commercial Property branch, the vacancy rate has remained at a small percentage despite the increase in availability of leased accommodation.
Output 1: Delivery and management of Government projects, properties and office accommodation.
Output description: Management services for the planning and delivery of public buildings and infrastructure assets; leasing and coordination of Government's office accommodation portfolio; and the on-going management of Government properties; ensuring probity, integrity, management of risk and the achievement of value for money outcomes. Includes policy development and advice to the State Government in relation to the building and construction industry.
Efficiency indicator 1.1 – Special Projects: Average cost per special project managed.
Actual 2001-02 Actual 2002-03 Target 2002-03 $327,418 $197,833 $448,545
This measure is calculated as the total cost allocated to this service, including overheads, divided by the number of special projects managed.
The Department provided project management for 11 special projects for new or improved future use developments.
The redistribution of resources of the previous Government Projects Office and the reduction in Capital User Charges has reduced the cost allocated to this service.
Efficiency indicator 1.2 – Major and Heritage Contracts: Cost as a percentage of the value of capital works projects managed through head office.
Actual 2001-02 Actual 2002-03 Target 2002-03 2.2% 2.26% 1.98%
This indicator is calculated from the total costs allocated to this service, including all overheads, divided by the value of works billed and expressed as a percentage.
The value of works billed (invoiced) recovers the expenditure on consultant and builder contracts for capital and other non-residential building works. Clients are Government agencies. This is a key indicator for evaluating the cost of the service in relation to the value of the works projects managed through Perth Head Office.
35
Works managed was less than the target forecast due to the value of works billed being less than estimated and the reconsideration of some key projects of the 2002-03 capital works program by agencies.
Efficiency indicator 1.3 – Capital and Maintenance Works Programs: Cost as a percentage of the value of client agency works programs managed.
Actual 2001-02 Actual 2002-03 Target 2002-03 0.57% 0.52% 0.51%
This indicator is calculated by dividing the total cost allocated to this service, including all overheads, by the value of the portfolio of capital and maintenance works being organised for clients and expressed as a percentage.
The Department provided expertise to assist client agencies in the development and management of their capital works and maintenance programs. This is a key indicator in assessing the input necessary to provide this assistance.
Efficiency indicator 1.4 – Precincts: Average cost of precinct managed.
Actual 2001-02 Actual 2002-03 Target 2002-03 $221,638 $459,033 $294,730
This indicator is calculated as the total cost allocated to this service, including all overheads, divided by the number of precincts managed.
Precincts are defined as properties or contiguous sites where several agencies may have an interest or a presence. Precincts may also be places where ownership is unclear or in transition. The Department provides a management service in such situations. This is a key indicator in showing the input necessary in providing this service to assist agencies and Government.
Included are substantial costs associated with the maintenance and development of Fremantle Prison. The preservation and restoration of this heritage-listed asset has had a appositive effect on the revenue produced from the prison’s tourist operations.
Efficiency indicator 1.5 – Regional jobs: Cost as a percentage of the value of minor works and maintenance services managed through regional offices.
Actual 2001-02 Actual 2002-03 Target 2002-03 15.9% 15.1% 17.9%
The indicator is determined by the proportion of total cost allocated to this service, including all overheads, and the value of minor works and maintenance services managed through regional offices.
‘Minor works and maintenance services’ includes contract development and contract management for minor works, breakdown repairs and maintenance jobs for client agencies in regional areas. This is a key indicator for assessing the cost of provision of this service in the regions.
The key efficiency measure was well within the target forecast due to the increased value of minor works and maintenance services managed through regional office and the decreased cost of management through the co-location of works and housing offices.
36
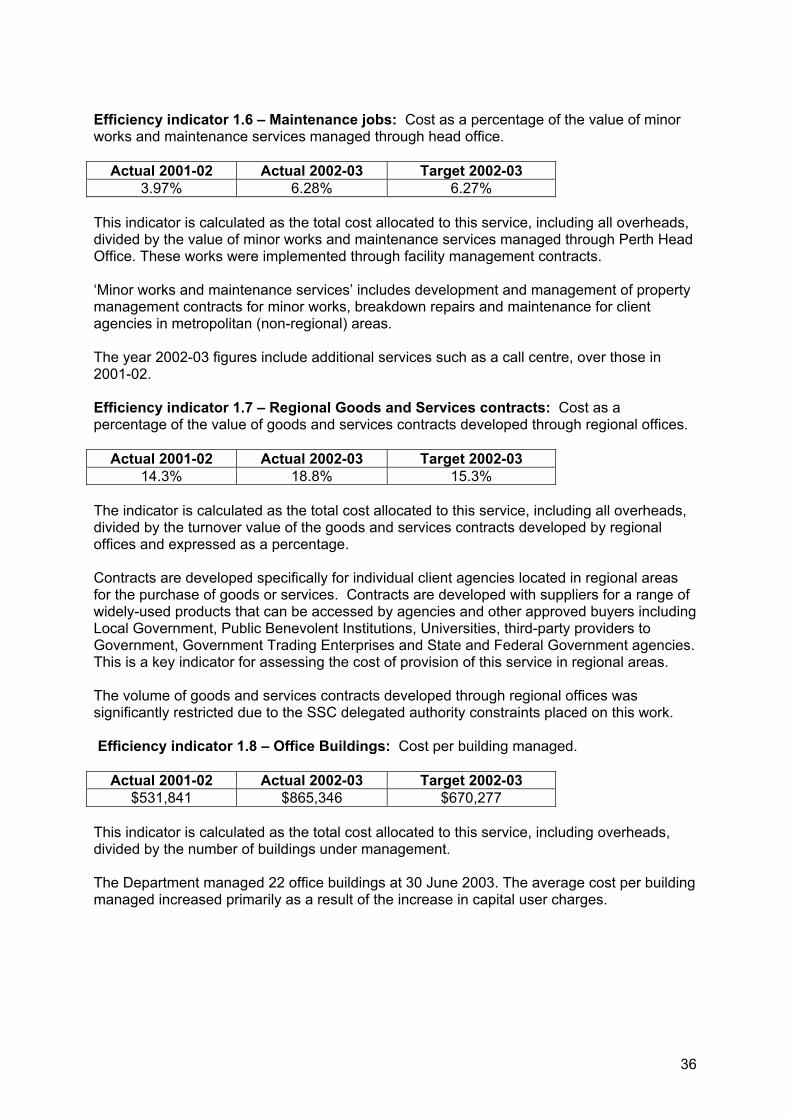
Efficiency indicator 1.6 – Maintenance jobs: Cost as a percentage of the value of minor works and maintenance services managed through head office.
Actual 2001-02 Actual 2002-03 Target 2002-03 3.97% 6.28% 6.27%
This indicator is calculated as the total cost allocated to this service, including all overheads, divided by the value of minor works and maintenance services managed through Perth Head Office. These works were implemented through facility management contracts.
‘Minor works and maintenance services’ includes development and management of property management contracts for minor works, breakdown repairs and maintenance for client agencies in metropolitan (non-regional) areas.
The year 2002-03 figures include additional services such as a call centre, over those in 2001-02.
Efficiency indicator 1.7 – Regional Goods and Services contracts: Cost as a percentage of the value of goods and services contracts developed through regional offices.
Actual 2001-02 Actual 2002-03 Target 2002-03 14.3% 18.8% 15.3%
The indicator is calculated as the total cost allocated to this service, including all overheads, divided by the turnover value of the goods and services contracts developed by regional offices and expressed as a percentage.
Contracts are developed specifically for individual client agencies located in regional areas for the purchase of goods or services. Contracts are developed with suppliers for a range of widely-used products that can be accessed by agencies and other approved buyers including Local Government, Public Benevolent Institutions, Universities, third-party providers to Government, Government Trading Enterprises and State and Federal Government agencies. This is a key indicator for assessing the cost of provision of this service in regional areas.
The volume of goods and services contracts developed through regional offices was significantly restricted due to the SSC delegated authority constraints placed on this work.
Efficiency indicator 1.8 – Office Buildings: Cost per building managed.
Actual 2001-02 Actual 2002-03 Target 2002-03 $531,841 $865,346 $670,277
This indicator is calculated as the total cost allocated to this service, including overheads, divided by the number of buildings under management.
The Department managed 22 office buildings at 30 June 2003. The average cost per building managed increased primarily as a result of the increase in capital user charges.

37
Efficiency indicator 1.9 – Lease Administration: Cost per lease administered.
Actual 2001-02 Actual 2002-03 Target 2002-03 $4,251 $3,081 $2,816
This indicator is calculated as the total cost allocated to this service including overheads, divided by the number of leases administered.
The Department administered 412 leases at 30 June 2003, compared to 434 leases at 30 June 2002.

AUDITOR GENERAL
4th Floor Dumas House 2 Havelock Street West Perth 6005 Western Australia Tel: 08 9222 7500 Fax: 08 9322 5664
INDEPENDENT AUDIT OPINION
To the Parliament of Western Australia
DEPARTMENT OF HOUSING AND WORKS FINANCIAL STATEMENTS FOR THE YEAR ENDED JUNE 30, 2003
Audit Opinion In my opinion,
(i) the controls exercised by the Department of Housing and Works provide reasonable assurance that the receipt and expenditure of moneys, the acquisition and disposal of property, and the incurring of liabilities have been in accordance with legislative provisions; and
(ii) the financial statements are based on proper accounts and present fairly in accordance with applicable Accounting Standards and other mandatory professional reporting requirements in Australia and the Treasurer’s Instructions, the financial position of the Department at June 30, 2003 and its financial performance and cash flows for the year ended on that date.
Scope The Director General’s Role The Director General is responsible for keeping proper accounts and maintaining adequate systems of internal control, preparing the financial statements, and complying with the Financial Administration and Audit Act 1985 (the Act) and other relevant written law.
The financial statements consist of the Statement of Financial Performance, Statement of Financial Position, Statement of Cash Flows, Summary of Consolidated Fund Appropriations and Revenue Estimates, and the Notes to the Financial Statements.
Summary of my Role As required by the Act, I have independently audited the accounts and financial statements to express an opinion on the controls and financial statements. This was done by looking at a sample of the evidence.
An audit does not guarantee that every amount and disclosure in the financial statements is error free. The term “reasonable assurance” recognises that an audit does not examine all evidence and every transaction. However, my audit procedures should identify errors or omissions significant enough to adversely affect the decisions of users of the financial statements.
D D R PEARSON AUDITOR GENERAL September 25, 2003
39
DEPARTMENT OF HOUSING AND WORKS CERTIFICATION OF FINANCIAL STATEMENTS
FOR THE YEAR ENDED 30 JUNE 2003
The accompanying financial statement of the Department of Housing and Works have been prepared in compliance with the provision of the Financial Administration and Audit Act 1985 from proper accounts and records to present fairly the financial transactions for the financial year ending 30 June 2003 and the financial position as at 30 June 2003.
At the date of signing we are not aware of any circumstances which would render any particulars included in the financial statements misleading or inaccurate.
R C Grantham Principal Accounting Officer 15 August 2003
G Joyce Accountable Officer15 August 2003
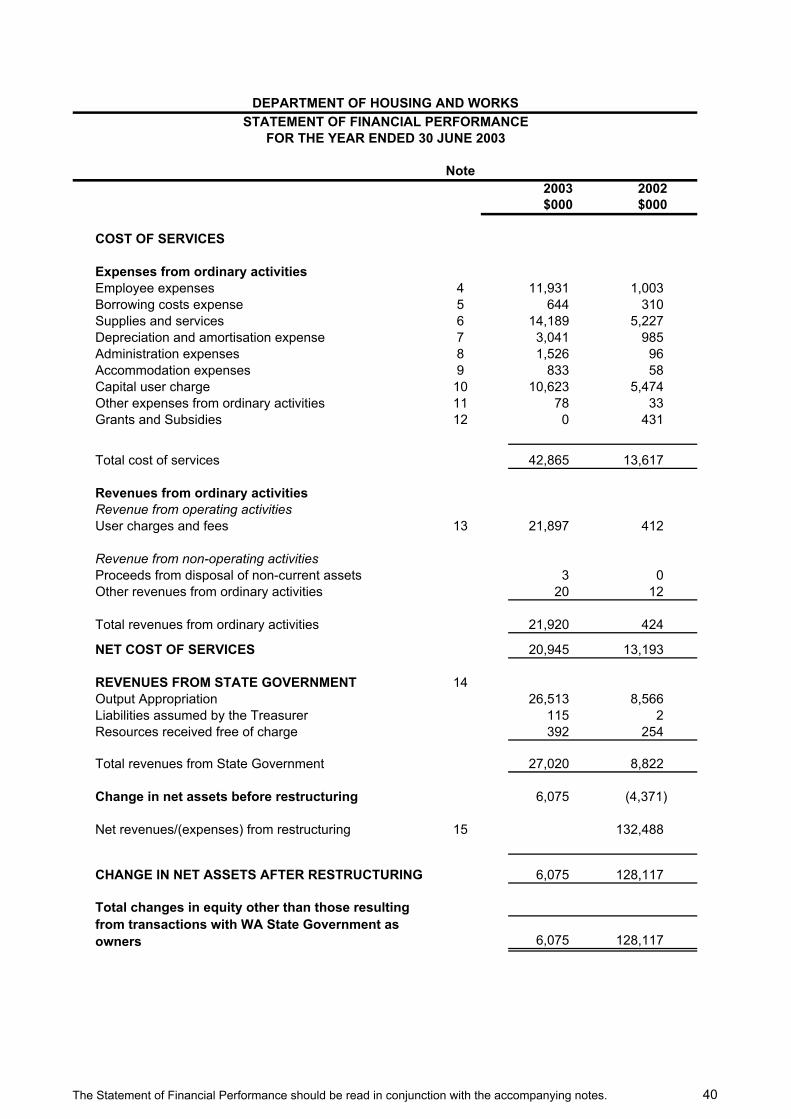
DEPARTMENT OF HOUSING AND WORKSSTATEMENT OF FINANCIAL PERFORMANCE
FOR THE YEAR ENDED 30 JUNE 2003
Note2003 2002$000 $000
COST OF SERVICES
Expenses from ordinary activitiesEmployee expenses 4 11,931 1,003 Borrowing costs expense 5 644 310 Supplies and services 6 14,189 5,227 Depreciation and amortisation expense 7 3,041 985 Administration expenses 8 1,526 96 Accommodation expenses 9 833 58 Capital user charge 10 10,623 5,474 Other expenses from ordinary activities 11 78 33 Grants and Subsidies 12 0 431
Total cost of services 42,865 13,617
Revenues from ordinary activitiesRevenue from operating activitiesUser charges and fees 13 21,897 412
Revenue from non-operating activitiesProceeds from disposal of non-current assets 3 0 Other revenues from ordinary activities 20 12
Total revenues from ordinary activities 21,920 424
NET COST OF SERVICES 20,945 13,193
REVENUES FROM STATE GOVERNMENT 14Output Appropriation 26,513 8,566 Liabilities assumed by the Treasurer 115 2 Resources received free of charge 392 254
Total revenues from State Government 27,020 8,822
Change in net assets before restructuring 6,075 (4,371)
Net revenues/(expenses) from restructuring 15 132,488
CHANGE IN NET ASSETS AFTER RESTRUCTURING 6,075 128,117
6,075 128,117
Total changes in equity other than those resulting from transactions with WA State Government as owners
The Statement of Financial Performance should be read in conjunction with the accompanying notes. 40
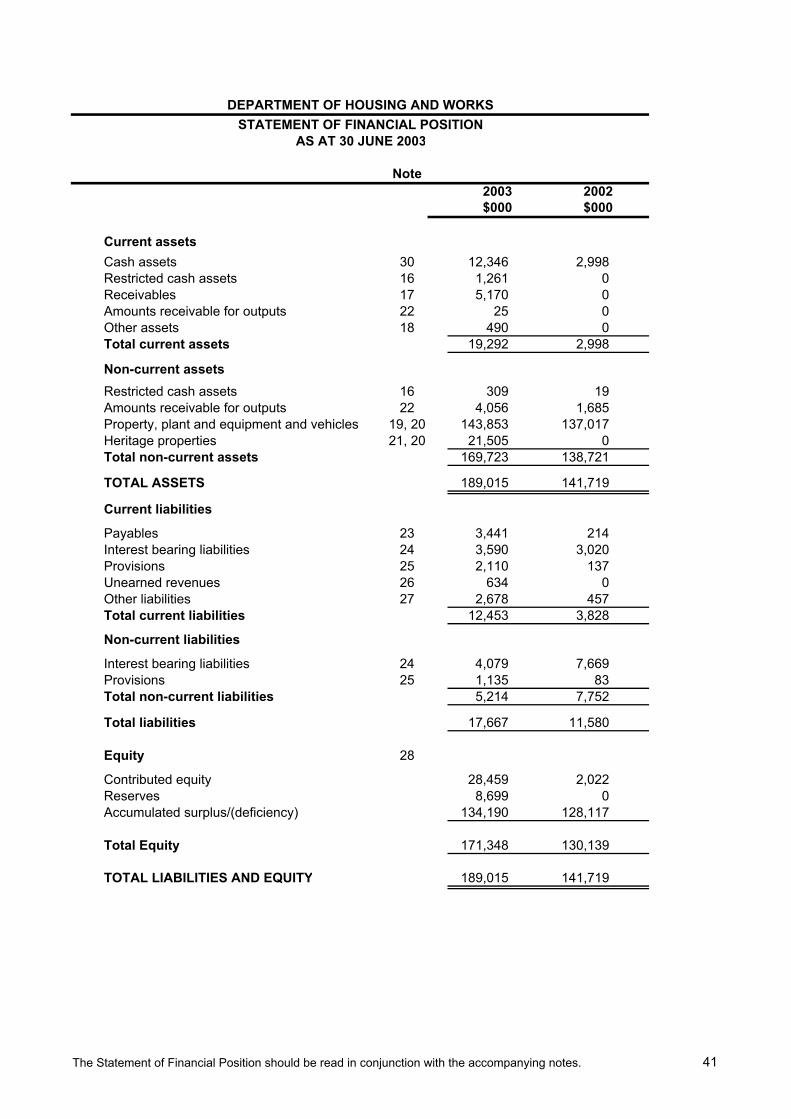
DEPARTMENT OF HOUSING AND WORKSSTATEMENT OF FINANCIAL POSITION
AS AT 30 JUNE 2003
Note2003 2002$000 $000
Current assetsCash assets 30 12,346 2,998 Restricted cash assets 16 1,261 0 Receivables 17 5,170 0 Amounts receivable for outputs 22 25 0 Other assets 18 490 0 Total current assets 19,292 2,998
Non-current assetsRestricted cash assets 16 309 19 Amounts receivable for outputs 22 4,056 1,685 Property, plant and equipment and vehicles 19, 20 143,853 137,017 Heritage properties 21, 20 21,505 0 Total non-current assets 169,723 138,721
TOTAL ASSETS 189,015 141,719
Current liabilities
Payables 23 3,441 214 Interest bearing liabilities 24 3,590 3,020 Provisions 25 2,110 137 Unearned revenues 26 634 0 Other liabilities 27 2,678 457 Total current liabilities 12,453 3,828
Non-current liabilities
Interest bearing liabilities 24 4,079 7,669 Provisions 25 1,135 83 Total non-current liabilities 5,214 7,752
Total liabilities 17,667 11,580
Equity 28
Contributed equity 28,459 2,022 Reserves 8,699 0 Accumulated surplus/(deficiency) 134,190 128,117
Total Equity 171,348 130,139
TOTAL LIABILITIES AND EQUITY 189,015 141,719
The Statement of Financial Position should be read in conjunction with the accompanying notes. 41

Note 2003 2002$000 $000
CASH FLOWS FROM STATE GOVERNMENTOutput appropriations 24,400 8,546 Capital contributions 596 2,022 Holding account drawdowns 25 0 Net cash provided by State Government 25,021 10,568
Utilised as follows:CASH FLOWS FROM OPERATING ACTIVITIESPaymentsEmployee costs (10,709) (922)Superannuation (1,061) 0 Supplies and services (12,358) (4,678)Borrowing Costs (555) (198)Grants and subsidies 0 (431)Capital User Charge (10,623) (5,474)GST payments on purchases (including managed contracts) (35,759) (4,503)GST payments to the taxation authority (4,415) (651)Other payments (2,337) (154)
ReceiptsUser charges and fees 21,104 658 GST receipts on sales (including managed contracts) 38,480 4,128 GST receipts from the taxation authority 1,459 1,503 Other receipts 21 0 Net cash provided by/(used in) operating activities 29 (16,753) (10,722)
CASH FLOWS FROM INVESTING ACTIVITIESPurchase of non-current physical assets (412) (562)Net cash provided by/(used in) investing activities (412) (562)
CASH FLOWS FROM FINANCING ACTIVITIESRepayment of Finance Lease (3,020) (1,589)Net cash provided by/(used in) financing activities (3,020) (1,589)
Net increase (decrease) in cash held 4,836 (2,305)
Cash assets at the beginning of the financial year 2,998 0
Cash assets transferred from other sources 5,773 5,303
CASH ASSETS AT THE END OF THE FINANCIAL YEAR 30 13,607 2,998
DEPARTMENT OF HOUSING AND WORKSSTATEMENT OF CASH FLOWS
FOR THE YEAR ENDED 30 JUNE 2003
The Statement of Cash Flows should be read in conjunction with the accompanying notes. 42

2003 2003 2003 2002Estimate Actual Variance Actual Actual Variance
$000 $000 $000 $000 $000 $000PURCHASE OF OUTPUTS
Item 48 Net amount appropriated to purchase outputs 23,214 26,387 3,173 26,387 (26,387)Item 44 Net amount appropriated to purchase outputs 1,949 1,949 Section 25 transfer of funding 6,493 6,493
Amount authorised by Other statutes- Salaries and Allowances Act 1975 126 126 126 124 (2)Total appropriations provided to purchase outputs 23,340 26,513 3,173 26,513 8,566 (17,947)
CAPITALItem 137 Capital Contribution 1,246 1,246 1,246 4,114 2,868
ADMINISTERED
50,197 48,955 (1,242) 48,955 1,154 (47,801)Total administered appropriations 50,197 48,955 (1,242) 48,955 1,154 (47,801)
GRAND TOTAL OF APPROPRIATIONS 74,783 76,714 1,931 76,714 13,834 (62,880)
Details of Expenses by OutputsAdvice, planning and development of significant capital projects 3,642 3,642 Centenary of Federation celebrations 1,290 1,290 Procurement and management of office accommodation 8,685 8,685
Delivery and management of Government projects, properties, and office accommodation 42,622 42,865 243 42,865 (42,865)
Total Cost of Outputs 42,622 42,865 243 42,865 13,617 (29,248)Less total revenues from ordinary activities (16,685) (21,920) (5,235) (21,920) (424) 21,496 Net Cost of Outputs 25,937 20,945 (4,992) 20,945 13,193 (7,752)Adjustments (I) (2,597) 5,568 8,165 5,568 (4,627) (10,195)Total appropriations provided to purchase outputs 23,340 26,513 3,173 26,513 8,566 (17,947)
Capital ExpenditurePurchase of non-current physical assets 650 3,196 2,546 3,196 16,355 13,159
596 779 183 779 1,106 327 Adjustments for other funding sources (2,729) (2,729) (2,729) (13,347) (10,618)Capital Contribution (appropriation) 1,246 1,246 1,246 4,114 2,868
DETAILS OF REVENUE ESTIMATESRevenues disclosed as Administered Revenues 368,730 369,730 (1,000) 369,730 39,753 (329,977)
(I) Adjustments are related to movements in cash balances and other accrual items such as receivables, payables and superannuation.
The Summary of Consolidated Fund Appropriations, Variance to Budget and Actual should be read in conjunction with the accompanying notes.
This Summary provides the basis for the Explanatory Statement information requirements of TI 945, set outin Note 37
Item 49 Amount provided for Administered Grants, Subsidies and Other Transfer Payments
Expenditure on projects funded through capital appropriations
DEPARTMENT OF HOUSING AND WORKS
FOR THE YEAR ENDED 30 JUNE 2003SUMMARY OF CONSOLIDATED FUND APPROPRIATIONS AND REVENUE ESTIMATES
43

44
DEPARTMENT OF HOUSING AND WORKS NOTES TO THE FINANCIAL STATEMENTS
FOR THE YEAR ENDED 30 JUNE 2003
1. Departmental mission and funding
The Department's mission is to respond to the hopes of all Western Australians for their housing and construction needs.
The Department is predominantly funded by Parliamentary appropriations. Revenues controlled by the Department are net appropriated under the Financial Administration and Audit (Net Appropriations) Determination 2002/2003, which causes all revenue controlled by the Department to be subject to net appropriation in the 2003 financial year. The financial statements encompass all Funds through which the Department controls resources to carry on its functions.
In the process of reporting on the Department as a single entity, all intra-entity transactions and balances have been eliminated.
2. Significant accounting policies
The following accounting policies have been adopted in the preparation of the financial statements. Unless otherwise stated these policies are consistent with those adopted in the previous year.
General Statement
The financial statements constitute a general purpose financial report which has been prepared in accordance with Accounting Standards, Statements of Accounting Concepts and other authoritative pronouncements of the Australian Accounting Standards Board, and Urgent Issues Group (UIG) Consensus Views as applied by the Treasurer's Instructions. Several of these are modified by the Treasurer's Instructions to vary application, disclosure, format and wording. The Financial Administration and Audit Act and the Treasurer's Instructions are legislative provisions governing the preparation of financial statements and take precedence over Accounting Standards, Statements of Accounting Concepts and other authoritative pronouncements of the Australian Accounting Standards Board, and UIG Consensus Views. The modifications are intended to fulfill the requirements of general application to the public sector, together with the need for greater disclosure and also to satisfy accountability requirements.
If any such modification has a material or significant financial effect upon the reported results, details of that modification and where practicable, the resulting financial effect, are disclosed in individual notes to these financial statements.
Basis of Accounting
The financial statements have been prepared in accordance with Accounting Standard AAS 29.
The statements have been prepared on the accrual basis of accounting using the historical cost convention, except for certain assets and liabilities which, as noted, are measured at fair value.

45
DEPARTMENT OF HOUSING AND WORKS NOTES TO THE FINANCIAL STATEMENTS
FOR THE YEAR ENDED 30 JUNE 2003
Administered assets, liabilities, expenses and revenues are not integral to the Department in carrying out its functions and are disclosed in the notes to the financial statements, forming part of the general purpose financial report of the Department. The administered items are disclosed on the same basis as is described above for the financial statements of the Department. The administered assets, liabilities, expenses and revenues are those which the Government requires the Department to administer on its behalf. The assets do not render any service potential or future economic benefits to the Department, the liabilities do not require the future sacrifice of service potential or future economic benefits of the Department, and the expenses and revenues are not attributable to the Department.
As the administered assets, liabilities, expenses and revenues are not recognised in the principal financial statements of the Department, the disclosure requirements of Accounting Standard AAS 33, Presentation and Disclosure of Financial Instruments, are not applied to administered transactions.
(a) Output Appropriations
Output Appropriations are recognised as revenues in the period in which the Department gains control of the appropriated funds. The Department gains control of appropriated funds at the time those funds are deposited into the Department's bank account or credited to the holding account held at the Department of Treasury and Finance. Refer to Note 14 for further commentary on output appropriations.
(b) Contributed Equity
Under UIG 38 “Contributions by Owners Made to Wholly-Owned Public Sector Entities“ transfers in the nature of equity contributions must be designated by the Government (owners) as contributions by owners (at the time of, or prior to transfer) before such transfers can be recognised as equity contributions in the financial statements. Capital contributions (appropriations) have been designated as contributions by owners and have been credited directly to Contributed Equity in the Statement of Financial Position. Capital appropriations which are repayable to the Treasurer are recognised as liabilities. Refer to Note 28 for further commentary on the application of UIG 38 and TI 955
(c) Net Appropriation Determination
Pursuant to section 23A of the Financial Administration and Audit Act, the net appropriation determination by the Treasurer provides for retention of the following moneys received by the Department:
Provision of Contract Services; Executive Vehicle Scheme; GST Input Credits; GST receipts on sales: Rental Income sufficient to cover outgoings paid for government owned buildings and other departmental revenue.
In accordance with the determination, the Department retained $61.064m in 2003 ($6.289m in 2002). Retained revenues may only be applied to the outputs specified in the 2002-2003 Budget Statements.

46
DEPARTMENT OF HOUSING AND WORKS NOTES TO THE FINANCIAL STATEMENTS
FOR THE YEAR ENDED 30 JUNE 2003
(d) Grants and Other Contributions
Grants, donations, gifts and other non-reciprocal contributions are recognised as revenue when the Department obtains control over the assets comprising the contributions. Control is normally obtained upon their receipt.
Contributions are recognised at their fair value. Contributions of services are only recognised when a fair value can be reliably determined and the services would
be purchased if not donated.
(e) Revenue Recognition
Revenue from the sale of goods and disposal of other assets and the rendering of services, is recognised when the Department has passed control of the goods or other assets or delivery of the service to the customer.
(f) Acquisitions of assets
The cost method of accounting is used for all acquisitions of assets. Cost is measured as the fair value of the assets given up or liabilities undertaken at the date of acquisition plus incidental costs directly attributable to the acquisition.
Assets acquired at no cost or for nominal consideration, are initially recognised at their fair value at the date of acquisition.
(g) Depreciation of non-current assets
All non-current assets having a limited useful life are systematically depreciated over their estimated useful lives in a manner which reflects the consumption of their future economic benefits.
Depreciation is calculated on the straight -line basis, using rates which are reviewed annually. Expected useful lives for each class of depreciable asset are:
Heritage assets 100 years Buildings 40 years Computer Hardware & Software 3 to 5 years Air Conditioning 10 years Office furniture and fittings 10 years Office machines and equipment 5 years
(h) Revaluation of Land, Buildings and Infrastructure
The Department has a policy of valuing land and buildings at fair value. The annual revaluations of the Department's land and buildings undertaken by the Valuer General's Office are recognised in the financial statements.
(i) Leases
The Department's rights and obligations under finance leases, which are leases that effectively transfer to the Department substantially all of the risks and benefits incident to ownership of the leased items, are initially recognised as assets and liabilities equal in amount to the present value of the minimum lease payments. The assets are disclosed as buildings depreciated to the Statement of Financial Performance over the period during which the Department is expected to benefit from use of the leased assets. Minimum lease payments are allocated between interest expense and reduction of the lease liability, according to the interest rate implicit in the lease.

47
DEPARTMENT OF HOUSING AND WORKS NOTES TO THE FINANCIAL STATEMENTS
FOR THE YEAR ENDED 30 JUNE 2003
Finance lease liabilities are allocated between current and non-current components. The principal component of lease payments due on or before the end of the succeeding year is disclosed as a current liability, and the remainder of the lease liability is disclosed as a non-current liability.
The Department has entered into a number of operating lease arrangements for properties, motor vehicles and office equipment where the lessor effectively retains all of the risks and benefits incident to ownership of the items held under the operating leases. Equal instalments of the lease payments are charged to the Statement of Financial Performance over the lease term as this is representative of the pattern of benefits to be derived from the leased property.
(j) Cash
For the purpose of the Statement of Cash Flows, cash includes cash assets and restricted cash assets. These include short-term deposits that are readily convertible to cash on hand and are subject to insignificant risk of changes in value.
(k) Accrued Salaries
The accrued salaries suspense account (refer note 16) consists of amounts paid annually into a suspense account over a period of 10 financial years to largely meet the additional cash outflow in each eleventh year when 27 pay days occur in that year instead of the normal 26. No interest is received on this account.
Accrued salaries (refer note 27) represent the amount due to staff but unpaid at the end of the financial year, as the end of the last pay period for that financial year does not coincide with the end of the financial year. Accrued salaries are settled within a few days of the financial year-end. The Department considers the carrying amount of accrued salaries to be equivalent to the net fair value.
(l) Receivables
Receivables are recognised at the amounts receivable as they are due for settlement no more than 30 days from the date of recognition.
Collectability of receivables is reviewed on an ongoing basis. Debts which are known to be uncollectable are written off. A provision for doubtful debts is raised where some doubt as to collection exists.
(m) Software
Significant costs associated with the acquisition or development of computer software are capitalised and amortised on a straight line basis over the periods of the expected benefit, which varies from three to five years.
(n) Payables
Payables, including accruals not yet billed, are recognised when the Department becomes obliged to make future payments as a result of a purchase of assets or services. Payables are generally settled within 30 days.

48
DEPARTMENT OF HOUSING AND WORKS NOTES TO THE FINANCIAL STATEMENTS
FOR THE YEAR ENDED 30 JUNE 2003
(o) Interest-bearing liabilities
Borrowing costs expense is recognised on an accrual basis
(p) Amounts Due to the Treasurer
The amount due to the Treasurer is in respect of a Treasurer's Advance, approval of which is renewed for each financial year. The amount is therefore repayable within a maximum period of one year. No interest is charged on this advance.
(q) Employee benefits
Annual leave
This benefit is recognised at the reporting date in respect to employees' services up to that date and is measured at the nominal amounts expected to be paid when the liabilities are settled.
Long service leave
The liability for long service leave expected to be settled within 12 months of the reporting date is recognised in the provisions for employee benefits and is measured at the nominal amounts expected to be paid when the liability is settled. The liability for long service leave expected to be settled more than 12 months from the reporting date is recognised in the provisions for employee benefits and is measured at the present value of expected future payments to be made in respect of services provided by employees up to the reporting date. Consideration is given, when assessing expected future payments, to expected future wage and salary levels including relevant on costs, experience of employee departures and periods of service. Expected future payments are discounted using market yields at the reporting date on national government bonds with terms to maturity and currency that match, as closely as possible, the estimated future cash outflows.
Superannuation
Staff may contribute to the Pension Scheme, a defined benefits pension scheme now closed to new members, or to the Gold State Superannuation Scheme, a defined benefit lump sum scheme now also closed to new members. All staff who do not contribute to either of these schemes become non-contributory members of the West State Superannuation Scheme, an accumulation fund complying with the Commonwealth Government's Superannuation Guarantee (Administration) Act 1992. All of these schemes are administered by the Government Employees Superannuation Board (GESB).
The superannuation expense comprises the following elements:
(i) change in the unfunded employer's liability in respect of current employees who are members of the Pension Scheme and current employees who accrued a benefit on transfer from that Scheme to the Gold State Superannuation Scheme; and
(ii) employer contributions paid to the Gold State Superannuation Scheme and the West State Superannuation Scheme.
49
DEPARTMENT OF HOUSING AND WORKS NOTES TO THE FINANCIAL STATEMENTS
FOR THE YEAR ENDED 30 JUNE 2003
The superannuation expense does not include payment of pensions to retirees, as this does not constitute part of the cost of services provided by the Department in the current year.
A revenue “Liabilities assumed by the Treasurer” equivalent to (i) is recognised under Revenues from State Government in the Statement of Financial Performance as the unfunded liability is assumed by the Treasurer. The GESB makes the benefit payments and is recouped by the Treasurer.
The Department is funded for employer contributions in respect of the Gold State Superannuation Scheme and the West State Superannuation Scheme. These contributions were paid to the GESB during the year. The GESB subsequently paid the employer contributions in respect of the Gold State Superannuation Scheme to the Consolidated Fund.
Employee benefit on-costs
Employee benefit on-costs, including payroll tax, are recognised and included in employee benefit liabilities and costs when the employee benefits to which they relate are recognised as liabilities and expenses. (See notes 4 and 25).
(r) Resources Received Free of Charge or For Nominal Value
Resources received free of charge or for nominal value which can be reliably measured are recognised as revenues and as assets or expenses as appropriate at fair value.
(s) Comparative Figures
Comparative figures are, where appropriate, reclassified so as to be comparable with the figures presented in the current financial year.
The functions previously reported under the Western Australian Building Management Authority have now been transferred to the Department of Housing and Works. There are significant differences between the current year amounts and the comparatives shown.
(t) Rounding of amounts
Amounts in the financial statements have been rounded to the nearest thousand dollars, or in certain cases, to the nearest dollar.
(u) Project Development costs
Project development costs, other than those directly attributable to the construction of assets, are expensed as it is generally expected that the Department will not derive any future economic benefits from the projects being managed. The projects are being managed and developed on behalf of government.
50
DEPARTMENT OF HOUSING AND WORKS NOTES TO THE FINANCIAL STATEMENTS
FOR THE YEAR ENDED 30 JUNE 2003
3. Outputs of the Department
Information about the Department's outputs and, the expenses and revenues which are reliably attributable to those outputs is set out in the Output Schedule. Information about expenses, revenues, assets and liabilities administered by the Department are given in note 38.
The key output of the Department:
Output 1: Delivery and management of Government projects, properties and office accommodation
This output comprises the Management services for the planning and delivery of public buildings and infrastructure assets: leasing and coordination of Government’s office accommodation portfolio: and the on-going management of government properties: ensuring probity, integrity, management of risk and the achievement of value for money outcomes. Includes policy development and advice to Government in relation to the building and construction industry.

DEPARTMENT OF HOUSING AND WORKSNOTES TO THE FINANCIAL STATEMENTS
FOR THE YEAR ENDED 30 JUNE 2003
2003 2002$000 $000
4 Employee Expenses
Salaries 9,323 809 Superannuation 1,138 74 Change in leave and severance entitlements (23)Other related expenses 1,493 120
11,931 1,003
5 Borrowing costs expense 644 310
6 Supplies and services
Consultants and contractors 5,326 2,295 Maintenance and repairs 3,985 2,678 Government accommodation 4,081 Insurance 405 Resources received free of charge 392 254
14,189 5,227
7 Depreciation and Amortisation expense
Buildings 2,514 969 Heritage buildings 216 Office furniture and equipment 28 5 Computer hardware and software 192 11 Plant and Equipment 91
3,041 985
8 Administration Expense
Communications 260 16 Motor vehicles 690 46 Other 576 34
1,526 96
These employee expenses include superannuation, workers compensation premiums and other employment on-costs associated with the recognition of annual and long service leave liability. The related on-costs liability is included in employee benefit liabilities at Note 25.
This represents the the interest expense for the repayment of the loan for 151 Royal Street leased from the Government Employees Superannuation Board. See Note 24. The previous year's comparison was shown in Other.
The analysis by category has been re-defined and the comparative values have been adjusted accordingly
51
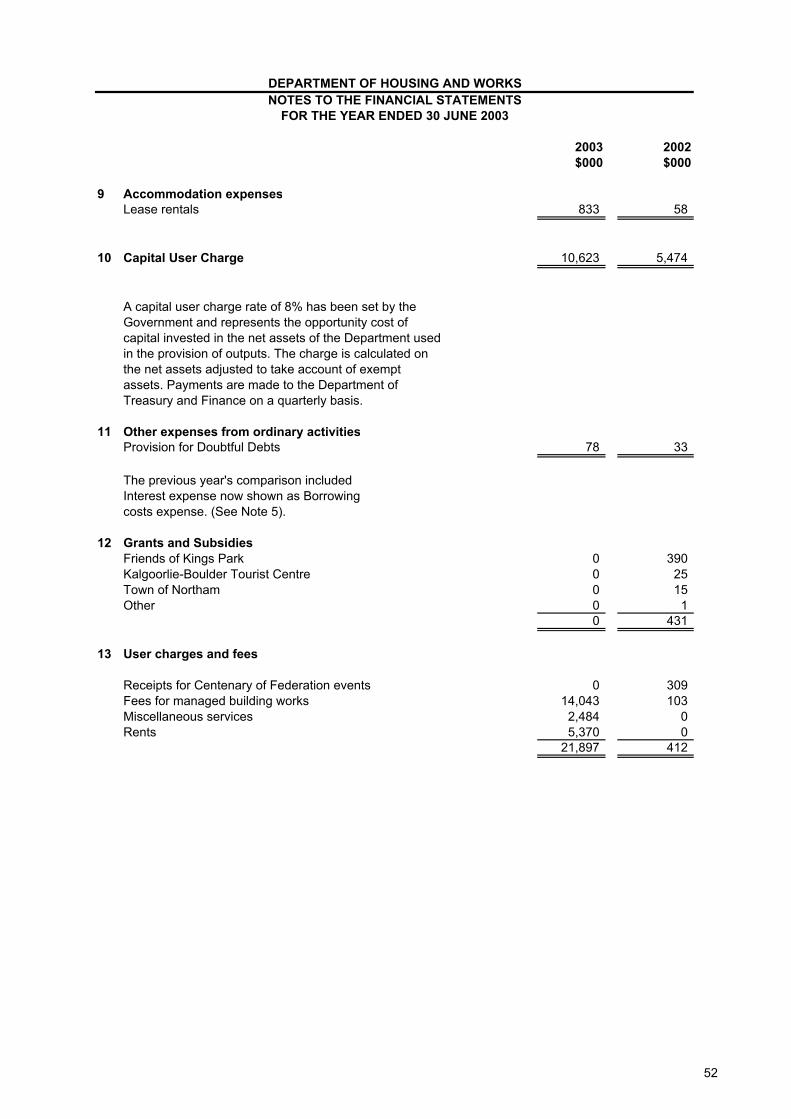
DEPARTMENT OF HOUSING AND WORKSNOTES TO THE FINANCIAL STATEMENTS
FOR THE YEAR ENDED 30 JUNE 2003
2003 2002$000 $000
9 Accommodation expensesLease rentals 833 58
10 Capital User Charge 10,623 5,474
11 Other expenses from ordinary activitiesProvision for Doubtful Debts 78 33
12 Grants and SubsidiesFriends of Kings Park 0 390 Kalgoorlie-Boulder Tourist Centre 0 25 Town of Northam 0 15 Other 0 1
0 431
13 User charges and fees
Receipts for Centenary of Federation events 0 309 Fees for managed building works 14,043 103 Miscellaneous services 2,484 0 Rents 5,370 0
21,897 412
A capital user charge rate of 8% has been set by the Government and represents the opportunity cost of capital invested in the net assets of the Department used in the provision of outputs. The charge is calculated on the net assets adjusted to take account of exempt assets. Payments are made to the Department of Treasury and Finance on a quarterly basis.
The previous year's comparison included Interest expense now shown as Borrowing costs expense. (See Note 5).
52

DEPARTMENT OF HOUSING AND WORKSNOTES TO THE FINANCIAL STATEMENTS
FOR THE YEAR ENDED 30 JUNE 2003
2003 2002$000 $000
14 Revenues from State Government
Appropriation revenue received during the year:Output appropriations (I) 26,513 8,566
- Superannuation (II) 115 2
Total Liabilities assumed by the Treasurer 115 2
Resources received free of charge (III)
Ministry of Justice 66 4 Office of the Auditor General 78 10 Department of Land Administration 248 240
392 254
27,020 8,822
(I)
(II)
(III) Where assets or services have been received free of charge or for nominal consideration, the Department recognises revenues (except where the contributions of assets or services are in the nature of contributions by owners in which case the Department shall make a direct adjustment to equity) equivalent to the fair value of the assets and/or the fair value of those services that can be reliably determined and which would have been purchased if not donated, and those fair values shall be recognised as assets or expenses, as applicable.
Output appropriations are accrual amounts reflecting the full cost of outputs delivered. The appropriations revenue comprises a cash component and a receivable (asset). The receivable (holding account) comprises the depreciation expense for the year and any agreed increase in leave liability during the year.
The assumption of the superannuation liability by the Treasurer is only notional revenue to offset the notional expense reported in respect of current employees who are members of the pension scheme and current employees who have a transfer benefit entitlement under the Gold State scheme.
The following liabilities have been assumed by the Treasurer during the financial year:
Determined on the basis of the following estimates provided by agencies:
53

DEPARTMENT OF HOUSING AND WORKSNOTES TO THE FINANCIAL STATEMENTS
FOR THE YEAR ENDED 30 JUNE 2003
2003 2002$000 $000
15 Net revenues/(expenses) from restructuring
Assets transferred to the Department
Cash 5,303Restricted cash 16Receivables 532Properties 137,129Furniture and equipment 305Amounts receivable for outputs 1,665
Liabilities assumed by the Department
Liabilities (12,308)Provisions (154)
0 132,488
The Department of Housing and Works was formed on the 1st July 2001 as a result of the recommendations of the "Machinery of Government" task force, to take on activities formerly performed by various other government departments. The activities taken up on the 1st July 2001 were from the Government Projects Office, Department of Tourism, and Department of Contract and Management Services. The activities for the Commercial Property Branch from Treasury were taken up as at 1st February 2002.
54
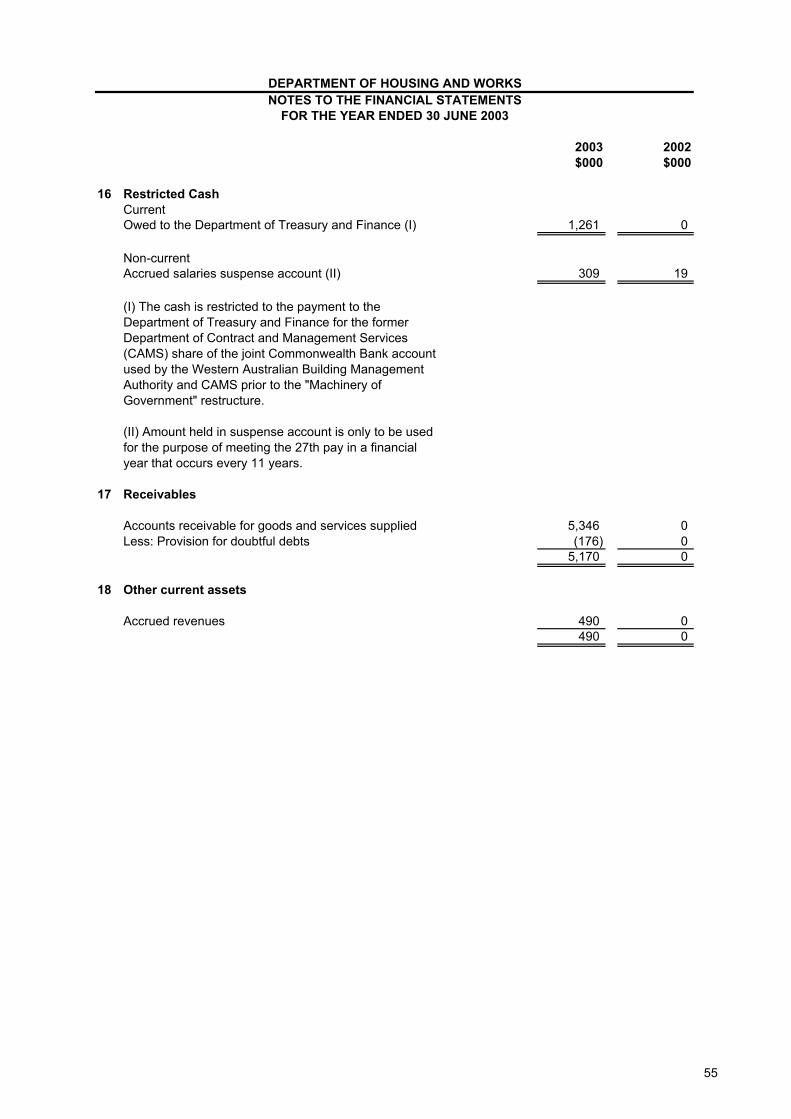
DEPARTMENT OF HOUSING AND WORKSNOTES TO THE FINANCIAL STATEMENTS
FOR THE YEAR ENDED 30 JUNE 2003
2003 2002$000 $000
16 Restricted CashCurrentOwed to the Department of Treasury and Finance (I) 1,261 0
Non-currentAccrued salaries suspense account (II) 309 19
17 Receivables
Accounts receivable for goods and services supplied 5,346 0 Less: Provision for doubtful debts (176) 0
5,170 0
18 Other current assets
Accrued revenues 490 0 490 0
(I) The cash is restricted to the payment to the Department of Treasury and Finance for the former Department of Contract and Management Services (CAMS) share of the joint Commonwealth Bank account used by the Western Australian Building Management Authority and CAMS prior to the "Machinery of Government" restructure.
(II) Amount held in suspense account is only to be used for the purpose of meeting the 27th pay in a financial year that occurs every 11 years.
55
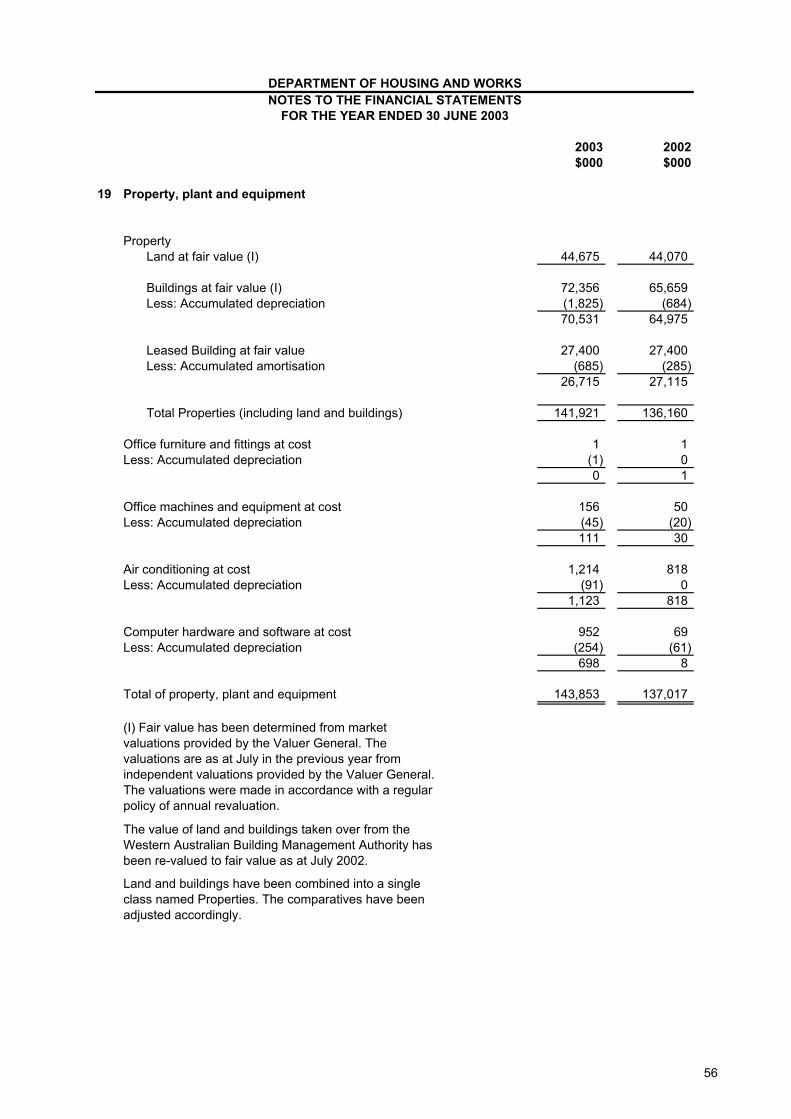
DEPARTMENT OF HOUSING AND WORKSNOTES TO THE FINANCIAL STATEMENTS
FOR THE YEAR ENDED 30 JUNE 2003
2003 2002$000 $000
19 Property, plant and equipment
PropertyLand at fair value (I) 44,675 44,070
Buildings at fair value (I) 72,356 65,659 Less: Accumulated depreciation (1,825) (684)
70,531 64,975
Leased Building at fair value 27,400 27,400 Less: Accumulated amortisation (685) (285)
26,715 27,115
Total Properties (including land and buildings) 141,921 136,160
Office furniture and fittings at cost 1 1 Less: Accumulated depreciation (1) 0
0 1
Office machines and equipment at cost 156 50 Less: Accumulated depreciation (45) (20)
111 30
Air conditioning at cost 1,214 818 Less: Accumulated depreciation (91) 0
1,123 818
Computer hardware and software at cost 952 69 Less: Accumulated depreciation (254) (61)
698 8
Total of property, plant and equipment 143,853 137,017
The value of land and buildings taken over from the Western Australian Building Management Authority has been re-valued to fair value as at July 2002.
Land and buildings have been combined into a single class named Properties. The comparatives have been adjusted accordingly.
(I) Fair value has been determined from market valuations provided by the Valuer General. The valuations are as at July in the previous year from independent valuations provided by the Valuer General. The valuations were made in accordance with a regular policy of annual revaluation.
56

DEPARTMENT OF HOUSING AND WORKSNOTES TO THE FINANCIAL STATEMENTS
30 JUNE 2003
20 Reconciliation of non-current assets
PropertiesFurniture
and Fittings
OfficeMachines
and Equip.Air
Conditioning
ComputerHardware &
SoftwareHeritage
Properties Total$000 $000 $000 $000 $000 $000 $000
Carrying amount at start of year 136,160 1 30 818 8 - 137,017 Additions 3,200 - 109 396 882 21,721 26,308 Disposals (3,626) - - - - - (3,626)Revaluation increments (decrements) 8,699 - - - - - 8,699 Depreciation (1,827) (1) (28) (91) (192) (216) (2,355)Amortisation (685) - - - - - (685)Carrying amount at end of year 141,921 111 1,123 698 21,505 165,358
2002/03
Reconciliations of the carrying amounts of property, plant and equipment and heritage assets at the beginning and end of the currentfinancial year are set out below.
57

DEPARTMENT OF HOUSING AND WORKSNOTES TO THE FINANCIAL STATEMENTS
FOR THE YEAR ENDED 30 JUNE 2003
2003 2002$000 $000
21 Heritage properties
Land at fair value 135 0
Buildings at fair value 21,586 0 Less: Accumulated depreciation (216) 0
21,370 0
Total heritage properties 21,505 0
22 Amounts receivable for outputs
Current 25 0 Non-current 4,056 1,685
4,081 1,685
23 Payables
GST payable to the Australian Taxation Office 2,123 214 Cash owed to the Department of Treasury and Finance (see note 16) 1,261 0 Sundry Accruals 57 0
3,441 214
Heritage properties taken over from the Western Australian Building Management Authority have been revalued to fair value as at July 2002 through an independent valuation process conducted by the Valuer General's Office.
This asset represents the non-cash component of output appropriations. It is restricted in that it can only be used for asset replacement or payment of leave liability.
58

DEPARTMENT OF HOUSING AND WORKSNOTES TO THE FINANCIAL STATEMENTS
FOR THE YEAR ENDED 30 JUNE 2003
2003 2002$000 $000
24 Interest bearing liabilities
Total value of lease liability at present value 7,669 10,689
CurrentPresent value of lease payable within 1 year 3,590 3,020
Non-currentPresent value of lease payable >1 year and < 5 years 4,079 7,669
The lease commitment is as follows:Payable within 1 year 4,553 3,575 Payable >1 year and < 5 years 5,575 10,128 Total lease commitment 10,128 13,703
25 Provisions
CurrentAnnual leave 1,087 42 Long service leave 1,023 95
2,110 137
Non-currentLong service leave 1,135 83
1,135 83
26 Unearned revenues
Invoices raised for services in next financial year 347 0 Unearned fee revenue 287 0
634 0
27 Other liabilities
CurrentAccrued salaries 305 24 Accrued Expenses 2,373 433
2,678 457
A government property at 151 Royal Street is being purchased by way of a finance lease arrangement from the Government Employees Superannuation Board with a final payment due in June 2005.
The settlement of annual and long service leave liabilities gives rise to the payment of employment on-costs including superannuation and workers compensation. The liability for such on-costs is included here.The associated expense is included under Other Related Expenses (under Employee Expenses) at Note 4.
The Department considers the carrying amount of employee benefits to approximate to the net fair value.
59

DEPARTMENT OF HOUSING AND WORKSNOTES TO THE FINANCIAL STATEMENTS
FOR THE YEAR ENDED 30 JUNE 2003
2003 2002$000 $000
28 Equity
Contributed EquityOpening balance 2,022 0 Capital Contributions (I) 596 2,022 Contributions by owners transfer of WABMA assets and liabilities(II) 29,467 0 Contributions by owners disposal of properties (III) (3,626) 0 Closing balance 28,459 2,022
Assets transferred to the Department
Cash 4,512Restricted cash 1,261 Receivables 3,350 Investment property 2,800 Amounts receivable for outputs - current 25 Other current assets 226 Property, plant and equipment 1,376 Heritage properties 21,721 Amounts receivable for outputs - non current 283
Liabilities transferred to the Department
Payables (1,562)Provisions (2,003)Unearned revenues (132)Other current liabilities (1,495)Non-current provisions (895)
29,467 0
(II) Net capital contributed upon restructure, for non-reciprocal transfers of net assets after 1 July 2002 (designated as Contributions by Owners in TI 955).
The activities formerly reported under the Western Australian Building Management Authority (WABMA)have now been transferred to the Department effective 1 July 2002. Only the servicing of the loans for capital and for the Peel Health Campus are retained by WABMA.
Equity represents the residual interest in the net assets of the Department. The Government holds the equity interest in the Department on behalf of the community. The assets revaluation reserve represents that portion of equity resulting from revaluation of non-current assets.
(I) Capital Contributions have been designated as contributions by owners and are credited directly to equity in the Statement of Financial Position.
60

DEPARTMENT OF HOUSING AND WORKSNOTES TO THE FINANCIAL STATEMENTS
FOR THE YEAR ENDED 30 JUNE 2003
2003 2002$000 $000
ReservesAsset revaluation reserve (I):Properties 8,699 0 Closing balance 8,699 0
Accumulated surplus/(deficiency)Opening balance 128,115 0 Change in net assets after restructuring 6,075 128,115 Closing balance 134,190 128,115
(I) The asset revaluation reserve is used to record increments and decrements on the revaluation of non-current assets, as described in accounting policy note 2(h).
(III) During the year properties were disposed by transferring them to the Department of Land Administration to facilitate their sale on behalf of government.
61
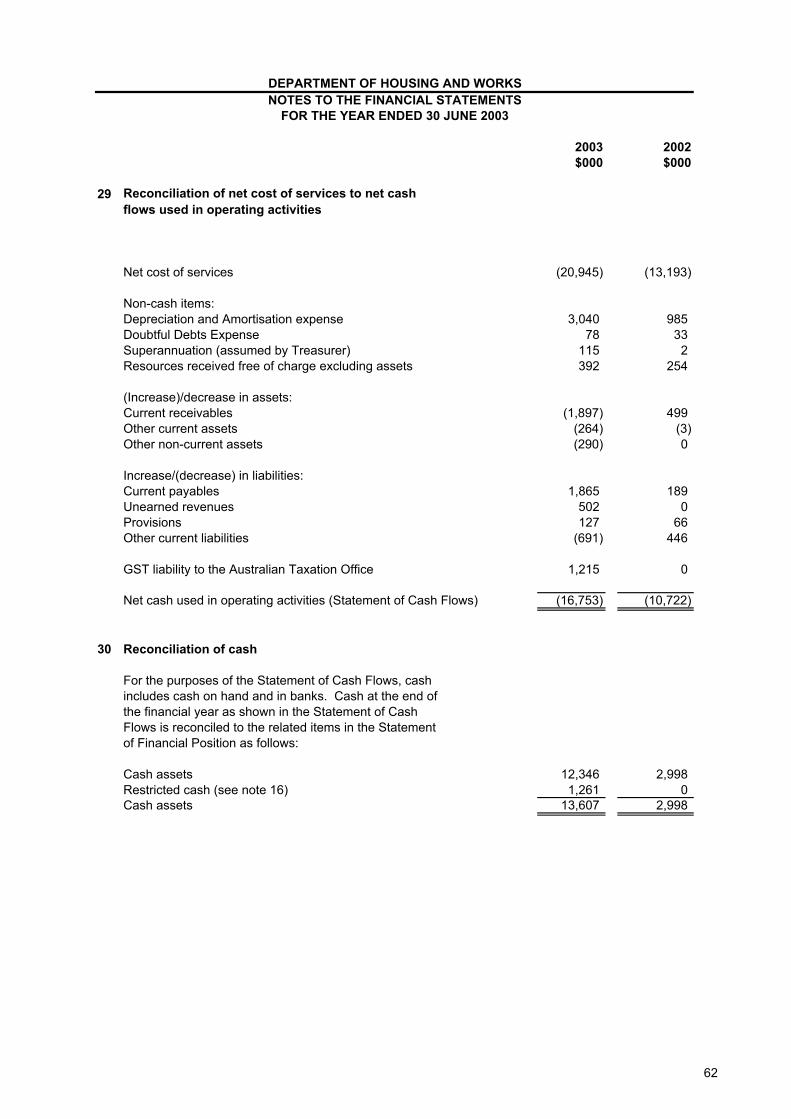
DEPARTMENT OF HOUSING AND WORKSNOTES TO THE FINANCIAL STATEMENTS
FOR THE YEAR ENDED 30 JUNE 2003
2003 2002$000 $000
29
Net cost of services (20,945) (13,193)
Non-cash items:Depreciation and Amortisation expense 3,040 985 Doubtful Debts Expense 78 33 Superannuation (assumed by Treasurer) 115 2 Resources received free of charge excluding assets 392 254
(Increase)/decrease in assets:Current receivables (1,897) 499 Other current assets (264) (3)Other non-current assets (290) 0
Increase/(decrease) in liabilities:Current payables 1,865 189 Unearned revenues 502 0 Provisions 127 66 Other current liabilities (691) 446
GST liability to the Australian Taxation Office 1,215 0
Net cash used in operating activities (Statement of Cash Flows) (16,753) (10,722)
30 Reconciliation of cash
Cash assets 12,346 2,998 Restricted cash (see note 16) 1,261 0 Cash assets 13,607 2,998
Reconciliation of net cost of services to net cash flows used in operating activities
For the purposes of the Statement of Cash Flows, cash includes cash on hand and in banks. Cash at the end of the financial year as shown in the Statement of Cash Flows is reconciled to the related items in the Statement of Financial Position as follows:
62
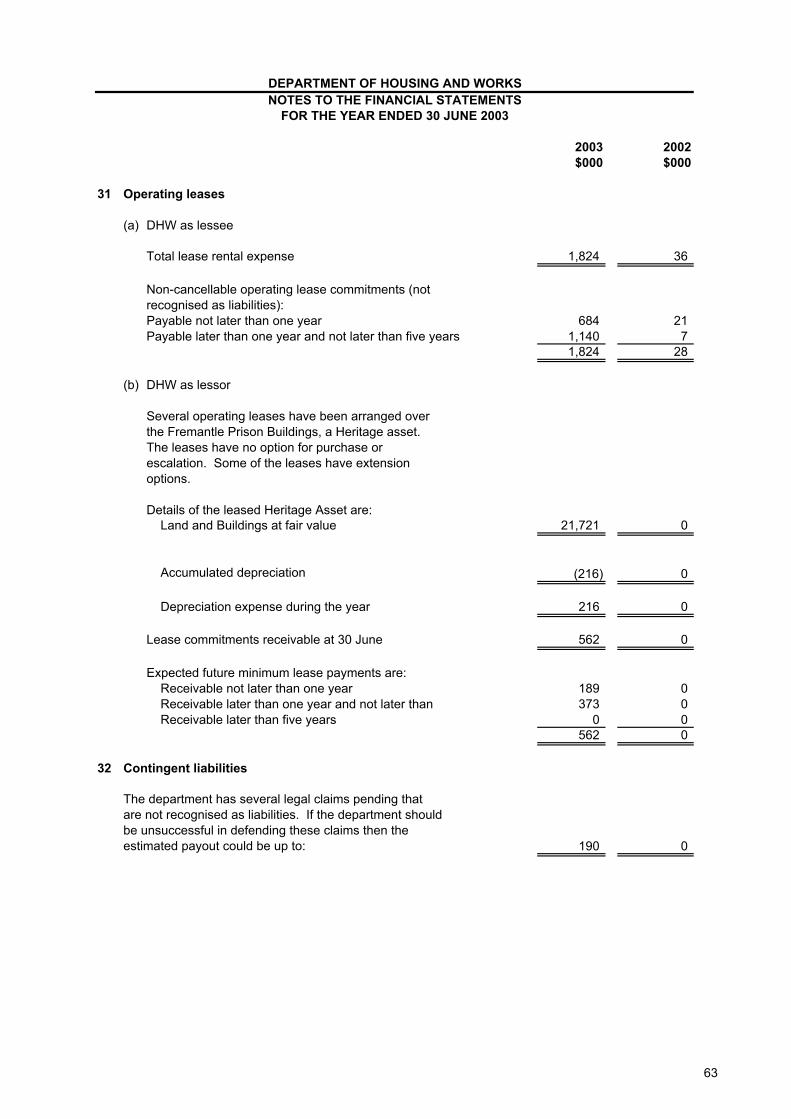
DEPARTMENT OF HOUSING AND WORKSNOTES TO THE FINANCIAL STATEMENTS
FOR THE YEAR ENDED 30 JUNE 2003
2003 2002$000 $000
31 Operating leases
(a) DHW as lessee
Total lease rental expense 1,824 36
Payable not later than one year 684 21 Payable later than one year and not later than five years 1,140 7
1,824 28
(b) DHW as lessor
21,721 0
Accumulated depreciation (216) 0
216 0
562 0
189 0 373 0
0 0 562 0
32 Contingent liabilities
190 0
Lease commitments receivable at 30 June
Depreciation expense during the year
Details of the leased Heritage Asset are:
Non-cancellable operating lease commitments (not recognised as liabilities):
The department has several legal claims pending that are not recognised as liabilities. If the department should be unsuccessful in defending these claims then the estimated payout could be up to:
Expected future minimum lease payments are:
Receivable later than one year and not later than
Several operating leases have been arranged over the Fremantle Prison Buildings, a Heritage asset.The leases have no option for purchase or escalation. Some of the leases have extension options.
Receivable not later than one year
Receivable later than five years
Land and Buildings at fair value
63

DEPARTMENT OF HOUSING AND WORKSNOTES TO THE FINANCIAL STATEMENTS
FOR THE YEAR ENDED 30 JUNE 2003
33 Financial Instruments
(a) Interest Rate Risk Exposure
The following table details the Department's exposure to interest rate risk at the reporting date :
Weighted Variable Less 1 to 5 More Non- TotalAverage Interest Than 1 Years than 5 InterestEffective Rate Year Years BearingInterest
Rate2003 % $000 $000 $000 $000 $000 $000
Financial Assets
Cash assets 4.89 12,346 12,346Restricted cash 4.89 1,570 1,570Receivables 5,170 5,170
13,916 0 0 0 5,170 19,086
Financial Liabilities
Payables 3,441 3,441Finance lease 0liabilities 6.04 3,590 4,079 7,669
0 3,590 4,079 0 3,441 11,110
2002
Financial assets 3,017 3,017Financial liabilities 214 3,020 7,669 10,903
(b) Credit risk exposure
MaturityFixed Interest Rate
The carrying amount of financial assets recorded in the financial statements, net of any provisions for losses, represents the Department's maximum exposure to credit risk without taking account of the value of any collateral or other security obtained.
64
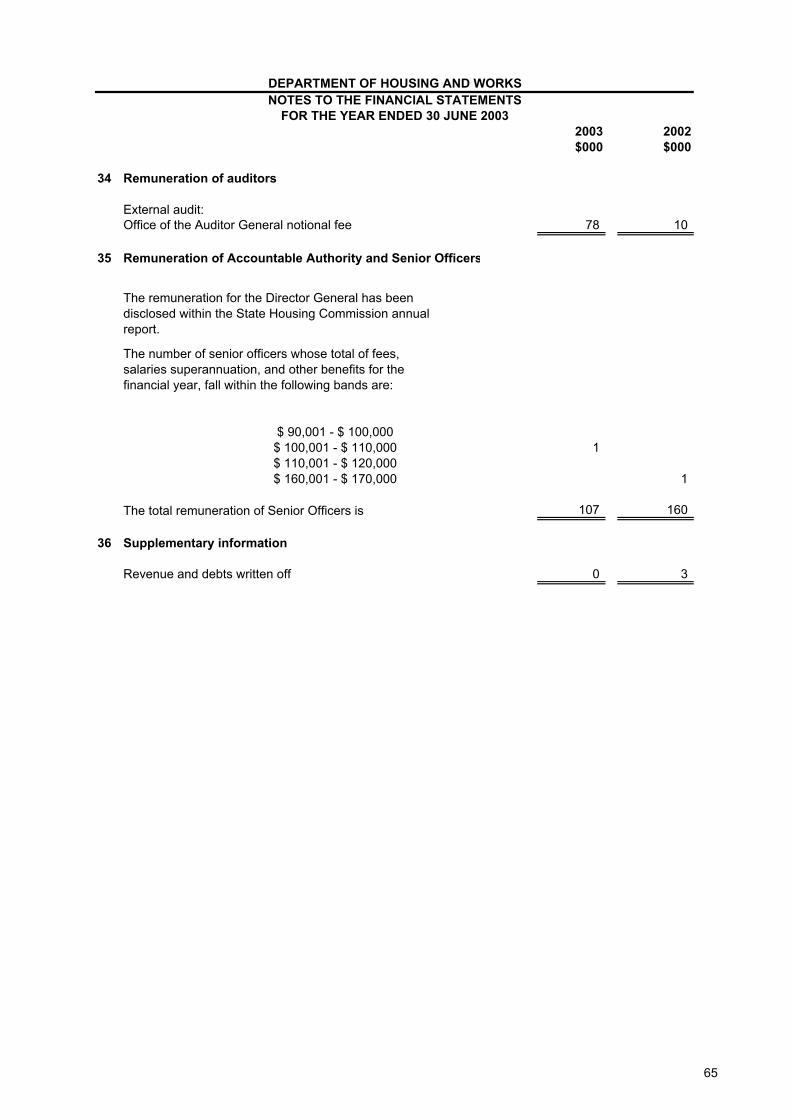
DEPARTMENT OF HOUSING AND WORKSNOTES TO THE FINANCIAL STATEMENTS
FOR THE YEAR ENDED 30 JUNE 20032003 2002$000 $000
34 Remuneration of auditors
External audit:Office of the Auditor General notional fee 78 10
35 Remuneration of Accountable Authority and Senior Officers
1
1
The total remuneration of Senior Officers is 107 160
36 Supplementary information
Revenue and debts written off 0 3
$ 90,001 - $ 100,000
$ 160,001 - $ 170,000
The remuneration for the Director General has been disclosed within the State Housing Commission annual report.
The number of senior officers whose total of fees, salaries superannuation, and other benefits for the financial year, fall within the following bands are:
$ 100,001 - $ 110,000$ 110,001 - $ 120,000
65
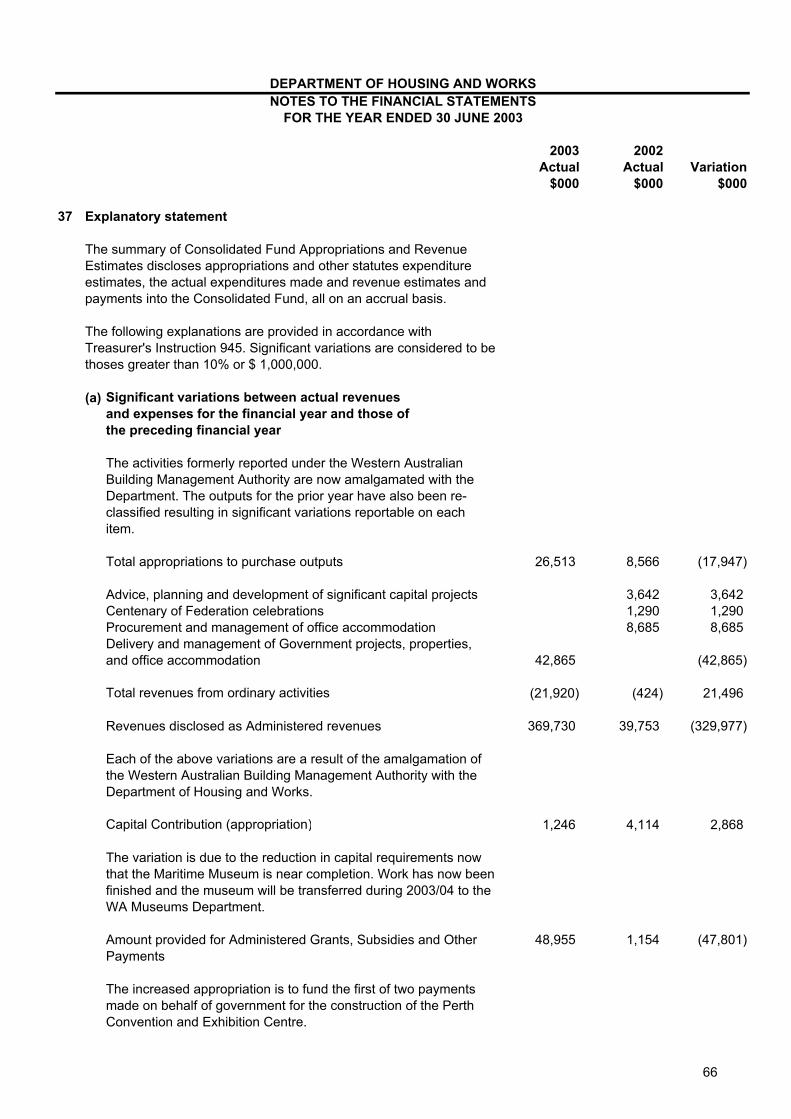
DEPARTMENT OF HOUSING AND WORKSNOTES TO THE FINANCIAL STATEMENTS
FOR THE YEAR ENDED 30 JUNE 2003
2003 2002Actual Actual Variation
$000 $000 $000
37 Explanatory statement
(a) Significant variations between actual revenuesand expenses for the financial year and those ofthe preceding financial year
Total appropriations to purchase outputs 26,513 8,566 (17,947)
Advice, planning and development of significant capital projects 3,642 3,642 Centenary of Federation celebrations 1,290 1,290 Procurement and management of office accommodation 8,685 8,685
42,865 (42,865)
Total revenues from ordinary activities (21,920) (424) 21,496
Revenues disclosed as Administered revenues 369,730 39,753 (329,977)
Capital Contribution (appropriation) 1,246 4,114 2,868
48,955 1,154 (47,801)
The variation is due to the reduction in capital requirements now that the Maritime Museum is near completion. Work has now been finished and the museum will be transferred during 2003/04 to the WA Museums Department.
The summary of Consolidated Fund Appropriations and Revenue Estimates discloses appropriations and other statutes expenditure estimates, the actual expenditures made and revenue estimates and payments into the Consolidated Fund, all on an accrual basis.
Each of the above variations are a result of the amalgamation of the Western Australian Building Management Authority with the Department of Housing and Works.
Amount provided for Administered Grants, Subsidies and Other Payments
The increased appropriation is to fund the first of two payments made on behalf of government for the construction of the Perth Convention and Exhibition Centre.
The following explanations are provided in accordance with Treasurer's Instruction 945. Significant variations are considered to be thoses greater than 10% or $ 1,000,000.
The activities formerly reported under the Western Australian Building Management Authority are now amalgamated with the Department. The outputs for the prior year have also been re-classified resulting in significant variations reportable on each item.
Delivery and management of Government projects, properties, and office accommodation
66
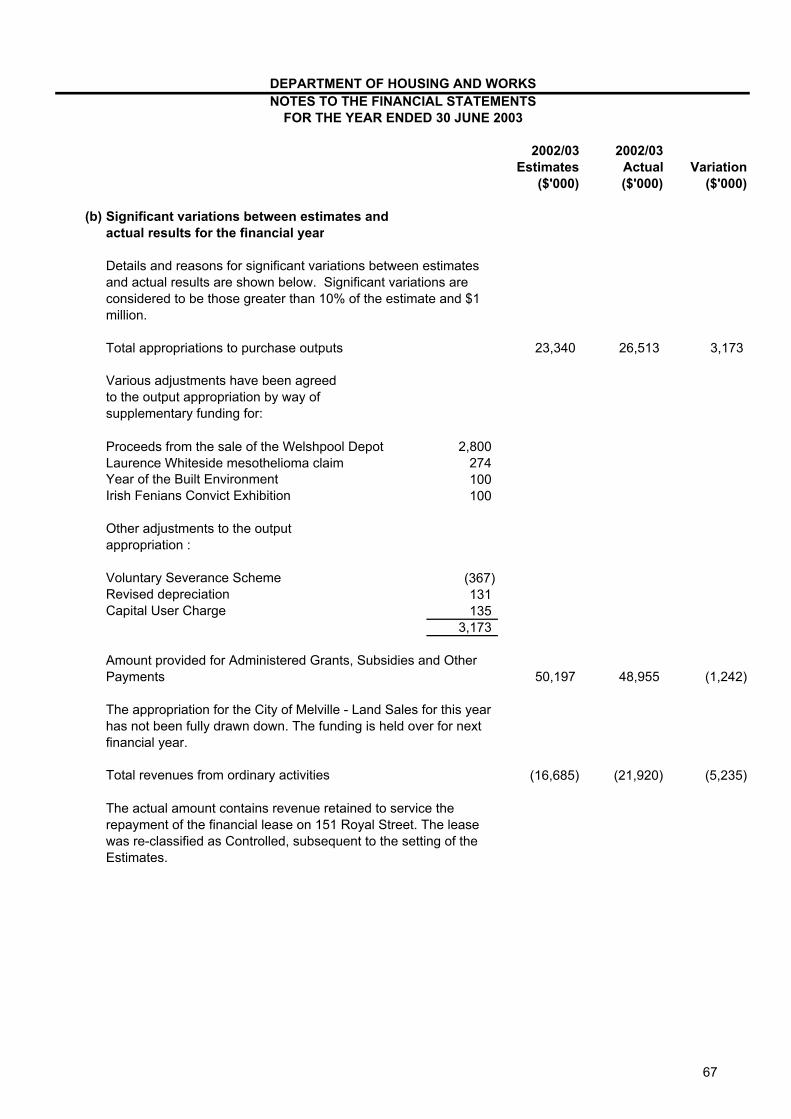
DEPARTMENT OF HOUSING AND WORKSNOTES TO THE FINANCIAL STATEMENTS
FOR THE YEAR ENDED 30 JUNE 2003
2002/03 2002/03Estimates Actual Variation
($'000) ($'000) ($'000)
(b) Significant variations between estimates andactual results for the financial year
Total appropriations to purchase outputs 23,340 26,513 3,173
Various adjustments have been agreed to the output appropriation by way of supplementary funding for:
Proceeds from the sale of the Welshpool Depot 2,800 Laurence Whiteside mesothelioma claim 274 Year of the Built Environment 100Irish Fenians Convict Exhibition 100
Other adjustments to the output appropriation :
Voluntary Severance Scheme (367)Revised depreciation 131Capital User Charge 135
3,173
50,197 48,955 (1,242)
Total revenues from ordinary activities (16,685) (21,920) (5,235)
Details and reasons for significant variations between estimates and actual results are shown below. Significant variations are considered to be those greater than 10% of the estimate and $1 million.
The actual amount contains revenue retained to service the repayment of the financial lease on 151 Royal Street. The lease was re-classified as Controlled, subsequent to the setting of the Estimates.
Amount provided for Administered Grants, Subsidies and Other Payments
The appropriation for the City of Melville - Land Sales for this year has not been fully drawn down. The funding is held over for next financial year.
67

2003 2002$000 $000
38 Administered expenses and revenues
ExpensesGrants expense for capital purposes 47,550 1,199 Depreciation 264 262 Accommodation - Lease rents 83,529 34,009 Managed contracts expenses 276,706 Payments to government 9,590 5,057
Total administered expenses 417,639 40,527
RevenuesManaged contracts revenue 278,002 Rent 91,728 39,736 Other 17
Total administered revenues 369,730 39,753
Revenues from GovernmentAppropriations 48,955 1,154
Total revenues from government 48,955 1,154
Administered assets and liabilities
Current assets Cash assets 14,169 6,032 Receivables 25,453 4,716 Other 39 644
Total current assets 39,661 11,392
Non-current assetsProperties at valuation 16,231 15,267 Work in progress 32,799 29,603
Total non-current assets 49,030 44,870
Total administered assets 88,691 56,262
Current liabilitiesPayables 7,285 205 Treasurer's advance 7,000 7,000 Other liabilities 22,279 641
Total managed contracts liabilities 36,564 7,846
Total net assets 52,127 48,416
Administered net assets transferred from WABMA (see note 28).Current assets 26,403 29,723 Non-current assets 204 29,246 current liabilities (25,616) (13,439)
991 45,530
DEPARTMENT OF HOUSING AND WORKSNotes to the Financial Statements
30 JUNE 2003
68

70
Contents
Western Australian Building Management Authority………………………………………………71
Performance Indicators……………………………………………………………………………….73
Financial Statements………………………………………………………………………………….76

71
Statement of Compliance
WESTERN AUSTRALIAN BUILDING MANAGEMENT AUTHORITY
Hon Nick Griffiths LLB MLC Minister for Housing and Works; Racing and Gaming; Government Enterprises; Land Information
I am pleased to submit for your information and presentation to Parliament, the annual report of the Western Australian Building Management Authority for the financial year ending 30 June 2003.
The annual report has been prepared in accordance with the provisions of the Financial Administration and Audit Act 1985 and other relevant written laws of the State of Western Australia.
GREG JOYCE
Director General Department of Housing and Works
72
About the Western Australian Building Management Authority
The Western Australian Building Management Authority was established under the PublicWorks Act 1902 as a body corporate. The Authority was responsible for servicing borrowings dating from the 1984-85 Capital Works Program and the 1996 borrowings for construction of the Peel Health Campus.
The Authority consists of the residual borrowings resulting from the amalgamation of the former Ministry of Housing and the Department of Contract and Management Services. Statutory requirements related to staffing and compliance with statutory reporting requirements as well as the Public Sector Standards and Codes have been integrated into the Department of Housing and Works’ annual report.

AUDITOR GENERAL
4th Floor Dumas House 2 Havelock Street West Perth 6005 Western Australia Tel: 08 9222 7500 Fax: 08 9322 5664
INDEPENDENT AUDIT OPINION
To the Parliament of Western Australia
WESTERN AUSTRALIAN BUILDING MANAGEMENT AUTHORITY PERFORMANCE INDICATORS FOR THE YEAR ENDED JUNE 30, 2003
Audit Opinion In my opinion, the key effectiveness and efficiency performance indicators of the Western Australian Building Management Authority are relevant and appropriate to help users assess the Authority’s performance and fairly represent the indicated performance for the year ended June 30, 2003.
Scope The Accountable Authority’s Role The Accountable Authority is responsible for developing and maintaining proper records and systems for preparing performance indicators.
The performance indicators consist of key indicators of efficiency and effectiveness.
Summary of my Role As required by the Financial Administration and Audit Act 1985, I have independently audited the performance indicators to express an opinion on them. This was done by looking at a sample of the evidence.
An audit does not guarantee that every amount and disclosure in the performance indicators is error free, nor does it examine all evidence and every transaction. However, my audit procedures should identify errors or omissions significant enough to adversely affect the decisions of users of the performance indicators.
D D R PEARSON AUDITOR GENERAL September 25, 2003

74
WESTERN AUSTRALIAN BUILDING MANAGEMENT AUTHORITY CERTIFICATION OF PERFORMANCE INDICATORS
FOR THE YEAR ENDED 30 JUNE 2003
I hereby certify that the performance indicators are based on proper records, are relevant and appropriate for assisting users to assess the Western Australian Building Management Authority's performance, and fairly represent the performance of the Authority for the financial year ended 30 June 2003.
GREG JOYCE ACCOUNTABLE AUTHORITYDate: 29 August 2003

75
WESTERN AUSTRALIAN BUILDING MANAGEMENT AUTHORITY PERFORMANCE INDICATORS 2002/2003
Outcome: Value for money in the management of WABMA borrowings.
The Western Australian Building Management Authority (WABMA) is a body corporate established under the Public Works Act 1902. WABMA is responsible for servicing borrowings dating from the 1984/85 Capital Works Program and the 1996 borrowings for construction of the Peel Health Campus.
The previous output measures of the WABMA were transferred to the Department of Housing and Works (DHW) on 1 July 2002, as the Department was responsible for the procurement of the Government’s building works for 2002/03.
The Peel Health Campus loan repayment, that is a cost to WABMA, has a revenue payment from the Health Department to balance the cost. The loan repayment has no effect on the cost of producing DHW services and therefore zero cost is included in calculating DHW efficiency indicators. Similarly, the costs of servicing borrowings made during the period 1984 to 1987, to fund the State capital works building program are excluded. These costs were covered by a direct appropriation from Treasury.
WABMA Output Measures
Measure Actual for 2002/2003
Target for 2002/2003
QuantityValue of WABMA borrowings managed for Peel Health Campus loan and 1984/87 WATC borrowings, at zero administrative cost.
$22,341,326 $22,341,326
QualityCompleteness of loan repayment transactions for WABMA.
100% 100%
TimelinessTimeliness of loan repayment transactions for WABMA. 100% 100%
CostOverall cost of management of WABMA borrowings. $0 $0
The Auditor General does not audit the output measures in the shaded section.
The total value of WABMA borrowings were managed completely and in a timely manner for zero cost to the Western Australian Building Management Authority. These output measures indicate that the management of the WABMA borrowings for Peel Health Campus loan and 1984/87 WATC borrowings, provided value for money.

AUDITOR GENERAL
4th Floor Dumas House 2 Havelock Street West Perth 6005 Western Australia Tel: 08 9222 7500 Fax: 08 9322 5664
INDEPENDENT AUDIT OPINION
To the Parliament of Western Australia
WESTERN AUSTRALIAN BUILDING MANAGEMENT AUTHORITY FINANCIAL STATEMENTS FOR THE YEAR ENDED JUNE 30, 2003
Audit Opinion In my opinion,
(i) the controls exercised by the Western Australian Building Management Authority provide reasonable assurance that the receipt, expenditure and investment of moneys, the acquisition and disposal of property, and the incurring of liabilities have been in accordance with legislative provisions; and
(ii) the financial statements are based on proper accounts and present fairly in accordance with applicable Accounting Standards and other mandatory professional reporting requirements in Australia and the Treasurer’s Instructions, the financial position of the Authority at June 30, 2003 and its financial performance and cash flows for the year ended on that date.
Scope The Accountable Authority’s Role The Accountable Authority is responsible for keeping proper accounts and maintaining adequate systems of internal control, preparing the financial statements, and complying with the Financial Administration and Audit Act 1985 (the Act) and other relevant written law.
The financial statements consist of the Statement of Financial Performance, Statement of Financial Position, Statement of Cash Flows and the Notes to the Financial Statements.
Summary of my Role As required by the Act, I have independently audited the accounts and financial statements to express an opinion on the controls and financial statements. This was done by looking at a sample of the evidence.
An audit does not guarantee that every amount and disclosure in the financial statements is error free. The term “reasonable assurance” recognises that an audit does not examine all evidence and every transaction. However, my audit procedures should identify errors or omissions significant enough to adversely affect the decisions of users of the financial statements.
D D R PEARSON AUDITOR GENERAL September 25, 2003
77
WESTERN AUSTRALIAN BUILDING MANAGEMENT AUTHORITY CERTIFICATION OF FINANCIAL STATEMENTS
FOR THE YEAR ENDED 30 JUNE 2003
The accompanying financial statement of the Western Australian Building Management Authority have been prepared in compliance with the provision of the Financial Administration and Audit Act 1985 from proper accounts and records to present fairly the financial transactions for the financial year ending 30 June 2003 and the financial position as at 30 June 2003.
At the date of signing we are not aware of any circumstances which would render any particulars included in the financial statements misleading or inaccurate.
R C Grantham Principal Accounting Officer 29 August 2003
G Joyce Accountable Authority29 August 2003

WESTERN AUSTRALIAN BUILDING MANAGEMENT AUTHORITYSTATEMENT OF FINANCIAL PERFORMANCE
FOR THE YEAR ENDED 30 JUNE 2003
Note2003 2002$000 $000
COST OF SERVICES
Expenses from ordinary activitiesEmployee expenses 2 0 11,954 Borrowing costs expense 3 13,587 15,013 Supplies and services 4 22 4,308 Depreciation and amortisation expense 5 0 365 Administration expenses 0 1,066 Accommodation expenses 0 1,824 Doubtful debts expense 0 90
Total cost of services 13,609 34,620
Revenues from ordinary activitiesRevenue from operating activitiesGoods and Services Revenue 6 0 12,996 Interest revenue 7 5,046 5,117
Revenue from non-operating activitiesProfit/(loss) on revaluation of investment property 0 100 Other revenues from ordinary activities 8 0 150
Total revenues from ordinary activities 5,046 18,363
NET COST OF SERVICES 8,563 16,257
REVENUES FROM STATE GOVERNMENT 9Output Appropriation 10,142 16,540 Liabilities assumed by the Treasurer 0 870 Assets assumed/(transferred) 0 (819)Resources received free of charge 22 47
Total revenues from State Government 10,164 16,638
CHANGE IN NET ASSETS 1,601 381
1,601 381
Total changes in equity other than those resulting from transactions with WA State Government as owners
The Statement of Financial Performance should be read in conjunction with the accompanying notes. 78

WESTERN AUSTRALIAN BUILDING MANAGEMENT AUTHORITYSTATEMENT OF FINANCIAL POSITION
AS AT 30 JUNE 2003
Note2003 2002$000 $000
Current assetsCash assets 11 1,095 4,520 Restricted cash assets 12 0 1,261 Receivables 13 0 3,343 Leases receivable 14 1,471 1,347 Investment property 15 0 2,800 Amounts receivable for outputs 19 0 25 Other assets 16 0 226 Total current assets 2,566 13,522
Non-current assetsLeases receivable 14 47,667 49,076 Amounts receivable for outputs 19 0 283 Property, plant and equipment and vehicles 17 0 1,038 Heritage properties 18 0 5,923 Total non-current assets 47,667 56,320
TOTAL ASSETS 50,233 69,842
Current liabilities
Payables 20 2,317 4,125 Interest bearing liabilities 21 8,887 8,508 Provisions 22 0 2,003 Unearned revenues 23 1,696 1,931 Other liabilities 24 0 1,494 Total current liabilities 12,900 18,061
Non-current liabilities
Interest bearing liabilities 21 144,211 153,099 Provisions 22 0 895 Total non-current liabilities 144,211 153,994
Total liabilities 157,111 172,055
NET ASSETS (106,878) (102,213)
Equity 25
Contributed equity (17,547) 5,059 Reserves 0 3,511 Accumulated surplus/(deficiency) (89,331) (110,783)
TOTAL EQUITY (106,878) (102,213)
The Statement of Financial Position should be read in conjunction with the accompanying notes. 79

WESTERN AUSTRALIAN BUILDING MANAGEMENT AUTHORITYSTATEMENT OF CASH FLOWS
FOR THE YEAR ENDED 30 JUNE 2003
Note 2003 2002$000 $000
CASH FLOWS FROM STATE GOVERNMENTOutput appropriations 10,142 16,232 Capital contributions 7,066 5,059 Net cash provided by State Government 17,208 21,291
Utilised as follows:CASH FLOWS FROM OPERATING ACTIVITIESPaymentsEmployee costs 0 (11,191)Supplies and services 0 (4,371)Borrowing Costs (13,833) (15,038)GST payments on purchases (including managed contracts) 0 (31,047)GST payments to the taxation authority 0 (2,024)Other payments 0 (2,920)
ReceiptsSale of goods and services 0 12,232 Interest received 4,943 5,008 GST receipts on sales (including managed contracts) 0 32,419 GST receipts from the taxation authority 0 1,270 Other receipts 0 18 Net cash provided by/(used in) operating activities 26 (8,890) (15,644)
CASH FLOWS FROM INVESTING ACTIVITIESPurchase of non-current physical assets 0 (73)Net cash provided by/(used in) investing activities 0 (73)
CASH FLOWS FROM FINANCING ACTIVITIESProceeds from borrowings 1,285 1,221 Repayment of borrowings (8,508) (8,709)Net cash provided by/(used in) financing activities (7,223) (7,488)
Net increase (decrease) in cash held 1,095 (1,914)
Cash assets at the beginning of the financial year 5,781 6,434
Cash assets transferred from/(to) other sources (5,781) 1,261
CASH ASSETS AT THE END OF THE FINANCIAL YEAR 27 1,095 5,781
The Statement of Cash Flows should be read in conjunction with the accompanying notes. 80

81
WESTERN AUSTRALIAN BUILDING MANAGEMENT AUTHORITY NOTES TO THE FINANCIAL STATEMENTS
FOR THE YEAR ENDED 30 JUNE 2003
1. Significant accounting policies
The following accounting policies have been adopted by the Western Australian Building Management Authority (WABMA) in the preparation of the financial statements. Unless otherwise stated these policies are consistent with those adopted in the previous year.
General Statement
The financial statements constitute a general purpose financial report which has been prepared in accordance with Accounting Standards, Statements of Accounting Concepts and other authoritative pronouncements of the Australian Accounting Standards Board, and Urgent Issues Group (UIG) Consensus Views as applied by the Treasurer's Instructions. Several of these are modified by the Treasurer's Instructions to vary application, disclosure, format and wording. The Financial Administration and Audit Act and the Treasurer's Instructions are legislative provisions governing the preparation of financial statements and take precedence over Accounting Standards, Statements of Accounting Concepts and other authoritative pronouncements of the Australian Accounting Standards Board, and UIG Consensus Views. The modifications are intended to fulfill the requirements of general application to the public sector, together with the need for greater disclosure and also to satisfy accountability requirements.
If any such modification has a material or significant financial effect upon the reported results, details of that modification and where practicable, the resulting financial effect, are disclosed in individual notes to these financial statements.
Basis of Accounting
The statements have been prepared on the accrual basis of accounting using the historical cost convention, except for certain assets and liabilities which, as noted, are measured at fair value.
(a) Output Appropriations Output Appropriations are recognised as revenues in the period in which WABMA gains
control of the appropriated funds. WABMA gains control of appropriated funds at the time those funds are deposited into WABMA’s bank account or credited to the holding account held at the Department of Treasury and Finance.
(b) Contributed Equity
Under UIG 38 “Contributions by Owners Made to Wholly-Owned Public Sector Entities“ transfers in the nature of equity contributions must be designated by the Government (owners) as contributions by owners (at the time of, or prior to transfer) before such transfers can be recognised as equity contributions in the financial statements. Capital contributions (appropriations) have been designated as contributions by owners and have been credited directly to Contributed Equity in the Statement of Financial Position. Capital appropriations which are repayable to the Treasurer are recognised as liabilities.
(c) Cash
For the purpose of the Statement of Cash Flows, cash includes cash assets and restricted cash assets. These include short-term deposits that are readily convertible to cash on hand and are subject to insignificant risk of changes in value.
82
WESTERN AUSTRALIAN BUILDING MANAGEMENT AUTHORITY NOTES TO THE FINANCIAL STATEMENTS
FOR THE YEAR ENDED 30 JUNE 2003
(d) Lease receivable
WABMA completed construction of the Peel Health Campus in 1998-99. WABMA funded the project from borrowings through the Western Australian Treasury Corporation. Borrowing costs associated with the construction of Peel Health Campus were capitalised during the construction period.
The fully operational Peel Health Campus is leased to a private health services provider. WABMA reports this asset as a lease receivable.
The Department of Treasury and Finance ultimately intends to take over this lease receivable.
(e) Payables
The amount shown in the Statement of Financial Position as payables relates to the accrued interest on the repayment of borrowings to WATC.
(See Note 21).
(f) Interest bearing liabilities
Borrowings arranged through the Western Australian Treasury Corporation (WATC) were to meet funding for Capital Works programs (1984-87 financial years) and to meet funding for construction of the Peel Health campus.
The 1984 –87 borrowings were initially matched in the statement of financial position with building assets that WABMA had procured. These buildings are no longer controlled by WABMA and were written-back in the 1995-96 financial year resulting in an abnormal loss of $ 156 million in that year. WABMA is now carrying an equity deficit that is diminishing each year as the borrowing is repaid.
The Peel Health Campus borrowings were restructured on 15 June 2001 by agreement between WABMA and WATC. No change to WABMA’s liability for the Peel Health campus borrowings occurred. The loan repayment schedule and the maturity date were altered to better match with the primary revenue stream associated with the leasing of Peel Health Campus (note 1d).
Borrowings are initially recognised at the amount of net proceeds received. Borrowings are then treated as a monetary liability measured at the present value of the cash flows associated with their service and eventual repayment. Such value is determined by discounting the cash flows at the rate of interest implicit in the original agreement.
Premiums and discounts associated with raising the borrowings are amortised over the terms of the borrowings.
Interest is payable at nominated times throughout the year and is accrued for the period between the last payment date and the end of the financial year.
Net fair value is determined on a current risk adjusted market rates basis.
The Department of Treasury and Finance ultimately intends to take over both of these facilities.

83
WESTERN AUSTRALIAN BUILDING MANAGEMENT AUTHORITY NOTES TO THE FINANCIAL STATEMENTS
FOR THE YEAR ENDED 30 JUNE 2003
(g) Leases
WABMA, as a lessor, has entered into a finance lease for the use of the Peel Health campus facility. WABMA’s rights and obligations under finance leases, which are leases that effectively transfer to the lessee substantially all of the risks and benefits incident to ownership of the leased items, are initially recognised as a lease receivable asset equal to the cost of constructing Peel Health Campus (see note 14). The lease receivable asset is allocated between current and non-current components. The finance revenue resulting from the lease is allocated between interest revenue and reduction of the lease receivable, according to the interest rate implicit in the lease.
(h) Revenue Recognition
Revenue comprises interest revenue only.
Interest is recognised progressively based on the interest rate implicit in the finance lease.
(i) Comparative Figures
Comparative figures are, where appropriate, reclassified so as to be comparable with the figures presented in the current financial year.
The functions previously reported under the Western Australian Building Management Authority, except for the loan portfolio, have now been transferred to the Department of Housing and Works. There are significant differences between the current year amounts and the comparatives shown.
(j) Rounding of amounts
Amounts in the financial statements have been rounded to the nearest thousand dollars, or in certain cases, to the nearest dollar.
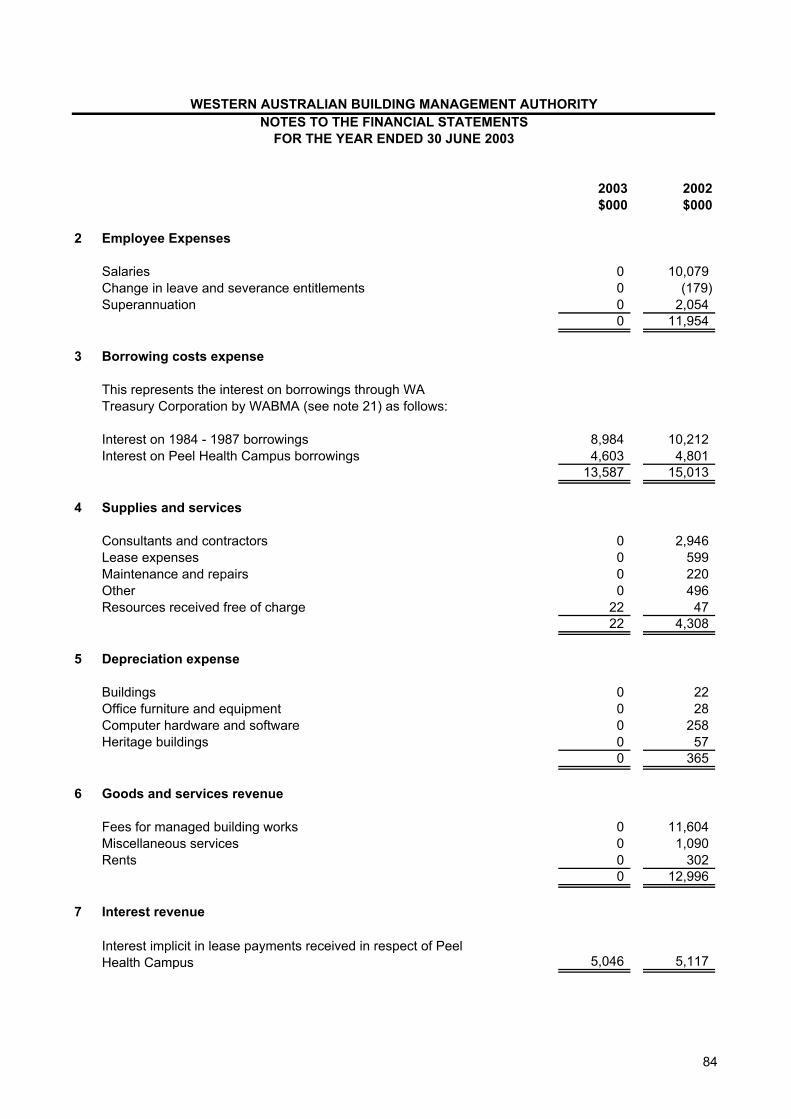
2003 2002$000 $000
2 Employee Expenses
Salaries 0 10,079 Change in leave and severance entitlements 0 (179)Superannuation 0 2,054
0 11,954
3 Borrowing costs expense
Interest on 1984 - 1987 borrowings 8,984 10,212 Interest on Peel Health Campus borrowings 4,603 4,801
13,587 15,013
4 Supplies and services
Consultants and contractors 0 2,946 Lease expenses 0 599 Maintenance and repairs 0 220 Other 0 496 Resources received free of charge 22 47
22 4,308
5 Depreciation expense
Buildings 0 22 Office furniture and equipment 0 28 Computer hardware and software 0 258 Heritage buildings 0 57
0 365
6 Goods and services revenue
Fees for managed building works 0 11,604 Miscellaneous services 0 1,090 Rents 0 302
0 12,996
7 Interest revenue
5,046 5,117
This represents the interest on borrowings through WA Treasury Corporation by WABMA (see note 21) as follows:
Interest implicit in lease payments received in respect of Peel Health Campus
WESTERN AUSTRALIAN BUILDING MANAGEMENT AUTHORITYNOTES TO THE FINANCIAL STATEMENTS
FOR THE YEAR ENDED 30 JUNE 2003
84
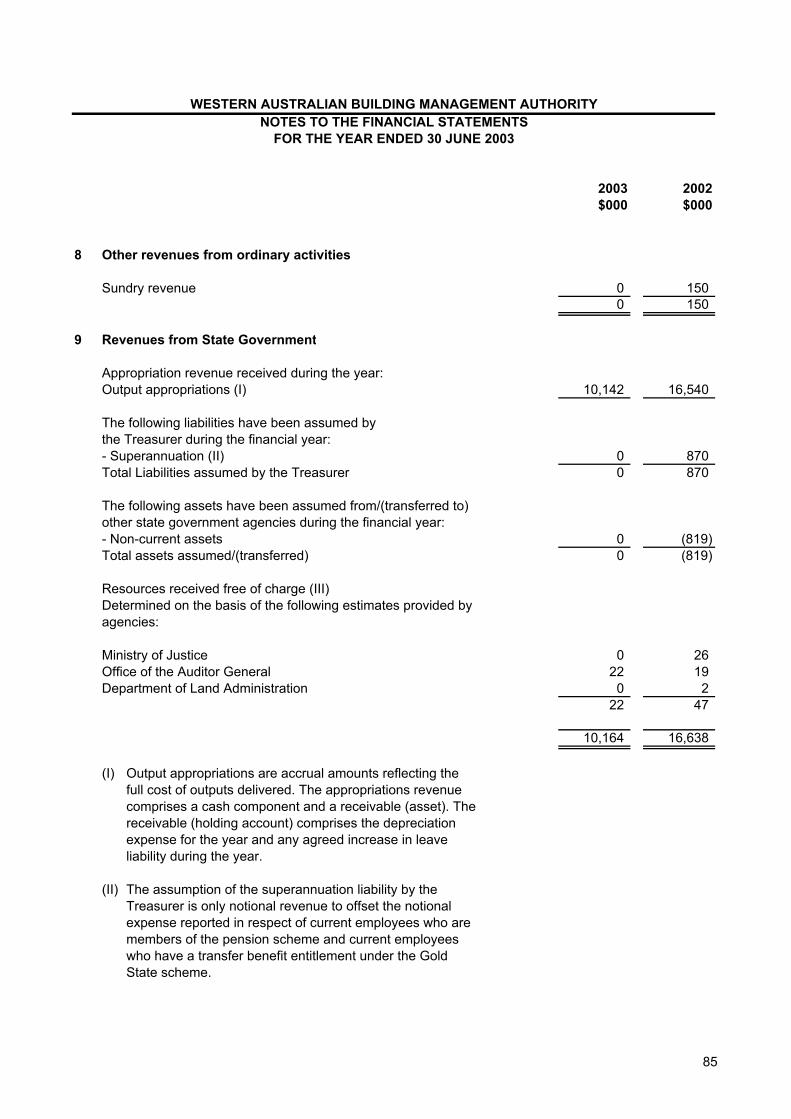
2003 2002$000 $000
WESTERN AUSTRALIAN BUILDING MANAGEMENT AUTHORITYNOTES TO THE FINANCIAL STATEMENTS
FOR THE YEAR ENDED 30 JUNE 2003
8 Other revenues from ordinary activities
Sundry revenue 0 150 0 150
9 Revenues from State Government
Appropriation revenue received during the year:Output appropriations (I) 10,142 16,540
- Superannuation (II) 0 870 Total Liabilities assumed by the Treasurer 0 870
- Non-current assets 0 (819)Total assets assumed/(transferred) 0 (819)
Resources received free of charge (III)
Ministry of Justice 0 26 Office of the Auditor General 22 19 Department of Land Administration 0 2
22 47
10,164 16,638
(I)
(II)
The following liabilities have been assumed by the Treasurer during the financial year:
The following assets have been assumed from/(transferred to) other state government agencies during the financial year:
Determined on the basis of the following estimates provided by agencies:
Output appropriations are accrual amounts reflecting the full cost of outputs delivered. The appropriations revenue comprises a cash component and a receivable (asset). The receivable (holding account) comprises the depreciation expense for the year and any agreed increase in leave liability during the year.
The assumption of the superannuation liability by the Treasurer is only notional revenue to offset the notional expense reported in respect of current employees who are members of the pension scheme and current employees who have a transfer benefit entitlement under the Gold State scheme.
85

2003 2002$000 $000
WESTERN AUSTRALIAN BUILDING MANAGEMENT AUTHORITYNOTES TO THE FINANCIAL STATEMENTS
FOR THE YEAR ENDED 30 JUNE 2003
(III)
10 Assets and liabilities
11 Cash assets
Cash held at Commonwealth Bank of Australia 1,095 4,512 Cash on hand 0 8
1,095 4,520
12 Restricted Cash 0 1,261
13 Receivables
Accounts receivable for goods and services supplied 0 1,722 GST receivable from clients 0 1,719 Less: Provision for doubtful debts 0 (98)
0 3,343
Where assets or services have been received free of charge or for nominal consideration, the authority recognises revenues equivalent to the fair value of the assets and/or the fair value of those services that can be reliably determined and which would have been purchased if not donated, and those fair values shall be recognised as assets or expenses, as applicable.
The assets and liabilities previously reported under the Western Australian Building Management Authority have been transferred to the Department of Housing and Works as at 1 July 2002. WABMA retains only the loans transactions for the Peel Campus receivable and the repayment of the WATC loans.
Cash held at the Commonwealth Bank of Australia is in a sub-account of the Government of Western Australia Bank Account. WABMA receives no interest on the balance.
The cash is restricted to the payment to the Department of Treasury and Finance for CAMS share of the Commonwealth Bank account used by WABMA and CAMS prior to the "Machinery of Government" restructure.
86
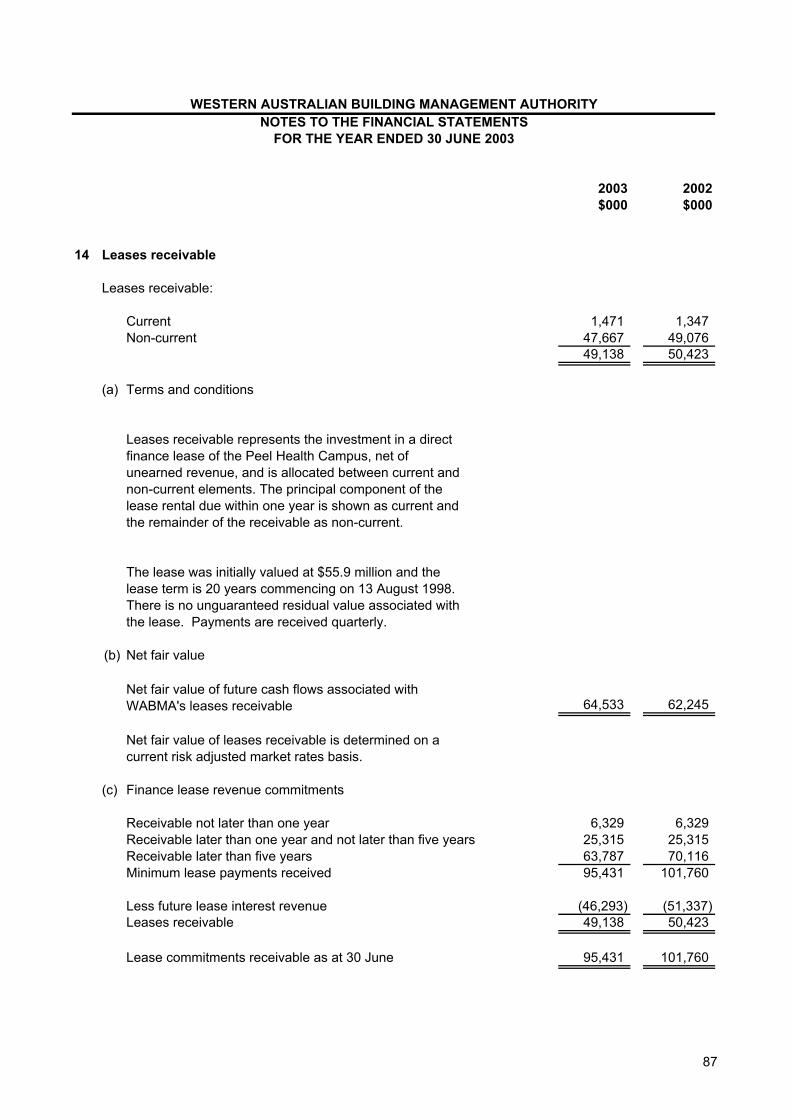
2003 2002$000 $000
WESTERN AUSTRALIAN BUILDING MANAGEMENT AUTHORITYNOTES TO THE FINANCIAL STATEMENTS
FOR THE YEAR ENDED 30 JUNE 2003
14 Leases receivable
Leases receivable:
Current 1,471 1,347 Non-current 47,667 49,076
49,138 50,423
(a) Terms and conditions
(b) Net fair value
64,533 62,245
(c)
6,329 6,329 Receivable later than one year and not later than five years 25,315 25,315
63,787 70,116 95,431 101,760
(46,293) (51,337)49,138 50,423
95,431 101,760
Leases receivable represents the investment in a direct finance lease of the Peel Health Campus, net of unearned revenue, and is allocated between current and non-current elements. The principal component of the lease rental due within one year is shown as current and the remainder of the receivable as non-current.
The lease was initially valued at $55.9 million and the lease term is 20 years commencing on 13 August 1998.There is no unguaranteed residual value associated with the lease. Payments are received quarterly.
Net fair value of future cash flows associated with WABMA's leases receivable
Net fair value of leases receivable is determined on a current risk adjusted market rates basis.
Finance lease revenue commitments
Receivable not later than one year
Receivable later than five yearsMinimum lease payments received
Less future lease interest revenueLeases receivable
Lease commitments receivable as at 30 June
87

2003 2002$000 $000
WESTERN AUSTRALIAN BUILDING MANAGEMENT AUTHORITYNOTES TO THE FINANCIAL STATEMENTS
FOR THE YEAR ENDED 30 JUNE 2003
15 Investment property
Freehold land at fair value 0 2,300 Buildings at fair value 0 500
0 2,800
16 Other current assets
Accrued revenues 0 223 Workers compensation claims 0 3
0 226
17 Property, plant and equipment
Freehold land at fair value 0 154
Buildings at fair value 0 221 Less: Accumulated depreciation 0 (44)
0 177
Office furniture and equipment at fair value 0 138 Less: Accumulated depreciation 0 (44)
0 94
Computer hardware and software at cost 0 1,262 Less: Accumulated depreciation 0 (649)
0 613
Total of property, plant and equipment 0 1,038
18 Heritage assets
Land at fair value 0 319
Buildings at fair value 0 5,718 Less: Accumulated depreciation 0 (114)
0 5,604
Total heritage assets 0 5,923
88

2003 2002$000 $000
WESTERN AUSTRALIAN BUILDING MANAGEMENT AUTHORITYNOTES TO THE FINANCIAL STATEMENTS
FOR THE YEAR ENDED 30 JUNE 2003
19 Amounts receivable for outputs
Current 0 25 Non-current 0 283
0 308
20 Payables
Accrued interest 2,317 2,563 GST payable to the Australian Taxation Office 0 694 Supplies and services 0 414 Administration expenses 0 65 GST payable on supplies 0 368 Accommodation expenses 0 21
2,317 4,125
21 Interest-bearing liabilities
1984 - 1987 borrowings 285,074 285,074 Less: Repayments of borrowings (184,173) (177,273)
100,901 107,801
Peel Health Campus borrowings 55,500 55,500 Add: Unamortised premium 331 341 Less: Repayments of borrowings (3,634) (2,035)
52,197 53,806
Total borrowings through WA Treasury Corporation 153,098 161,607
Current 8,887 8,508 Non-current 144,211 153,099
153,098 161,607
This asset represents the non-cash component of output appropriations. It is restricted in that it can only be used for asset replacement or payment of leave liability.
WABMA has two separate borrowings through the WA Treasury Corporation:
89

2003 2002$000 $000
WESTERN AUSTRALIAN BUILDING MANAGEMENT AUTHORITYNOTES TO THE FINANCIAL STATEMENTS
FOR THE YEAR ENDED 30 JUNE 2003
(i) Significant Terms and Conditions1984 - 1987 borrowings Peel borrowings
Nature of borrowings debt portfolio
Composition short and long stock lines single loan contractFace valuePremium n/aDate of maturityInterest rate variableInterest repayment schedule quarterly quarterlyCapital repayment schedule quarterly fixed amounts quarterly fixed amountsRepricing dates monthly n/aGuaranteed by the Treasurer yes yesReadily traded on organised markets yes no
(ii) Interest Rate Risk Exposure
Fixed interest rate maturities1 year or less 41,008 43,078 1 to 5 years 40,746 42,062 Over 5 years 19,147 22,661 Total borrowings with interest rate risk 100,901 107,801
The weighted average effective interest rates are:
2003 2002% %
1984 - 1987 borrowings: 8.28 8.96Peel Health Campus borrowings: 9.05 9.05
(iii) Net Fair Values
1984 - 1987 borrowings: Carrying amount 100,901 107,801 Net fair value 108,698 116,059
Peel Health Campus borrowings: Carrying amount 52,197 53,806 Net fair value 64,676 62,649
fixed principal and interest repayments
$285,074,300 $55,500,000 $422,910
15/10/2017 15/08/20188.7562%
WABMA's exposure to interest rate risk and repricing maturities on its borrowings as at 30 June 2003 are:
90
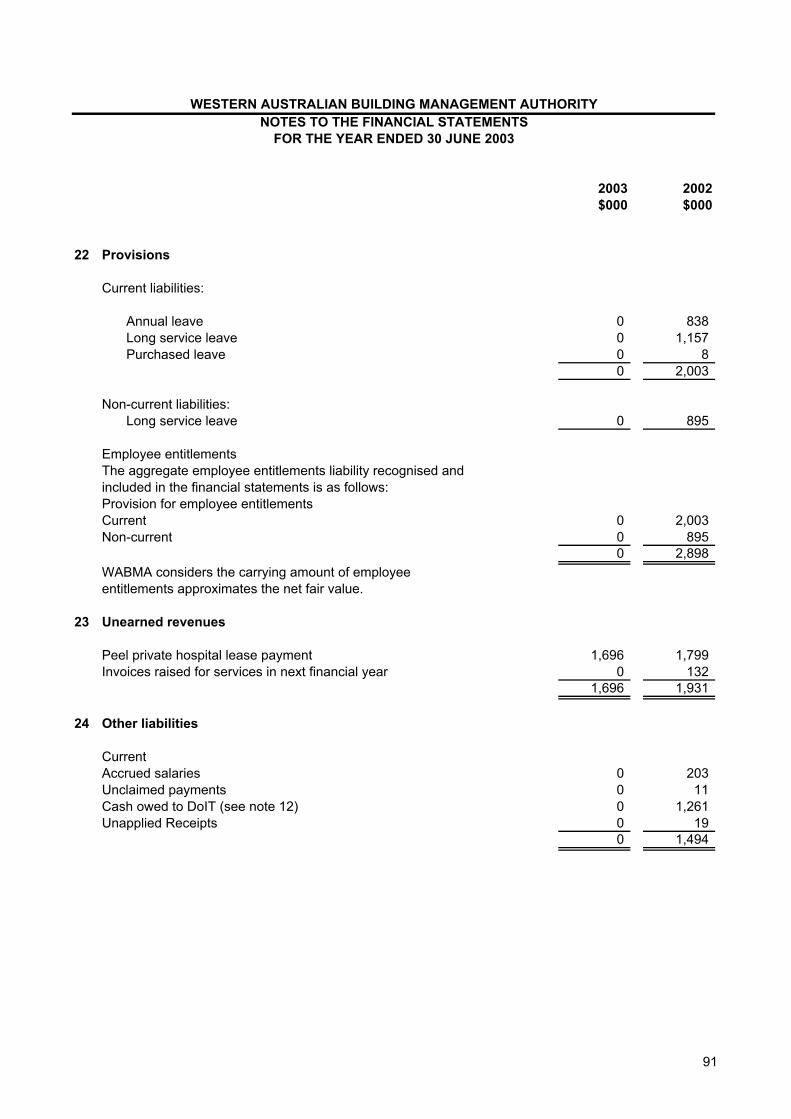
2003 2002$000 $000
WESTERN AUSTRALIAN BUILDING MANAGEMENT AUTHORITYNOTES TO THE FINANCIAL STATEMENTS
FOR THE YEAR ENDED 30 JUNE 2003
22 Provisions
Current liabilities:
Annual leave 0 838 Long service leave 0 1,157 Purchased leave 0 8
0 2,003
Non-current liabilities:Long service leave 0 895
Employee entitlements
Provision for employee entitlementsCurrent 0 2,003 Non-current 0 895
0 2,898
23 Unearned revenues
Peel private hospital lease payment 1,696 1,799 Invoices raised for services in next financial year 0 132
1,696 1,931
24 Other liabilities
CurrentAccrued salaries 0 203 Unclaimed payments 0 11 Cash owed to DoIT (see note 12) 0 1,261 Unapplied Receipts 0 19
0 1,494
The aggregate employee entitlements liability recognised and included in the financial statements is as follows:
WABMA considers the carrying amount of employee entitlements approximates the net fair value.
91
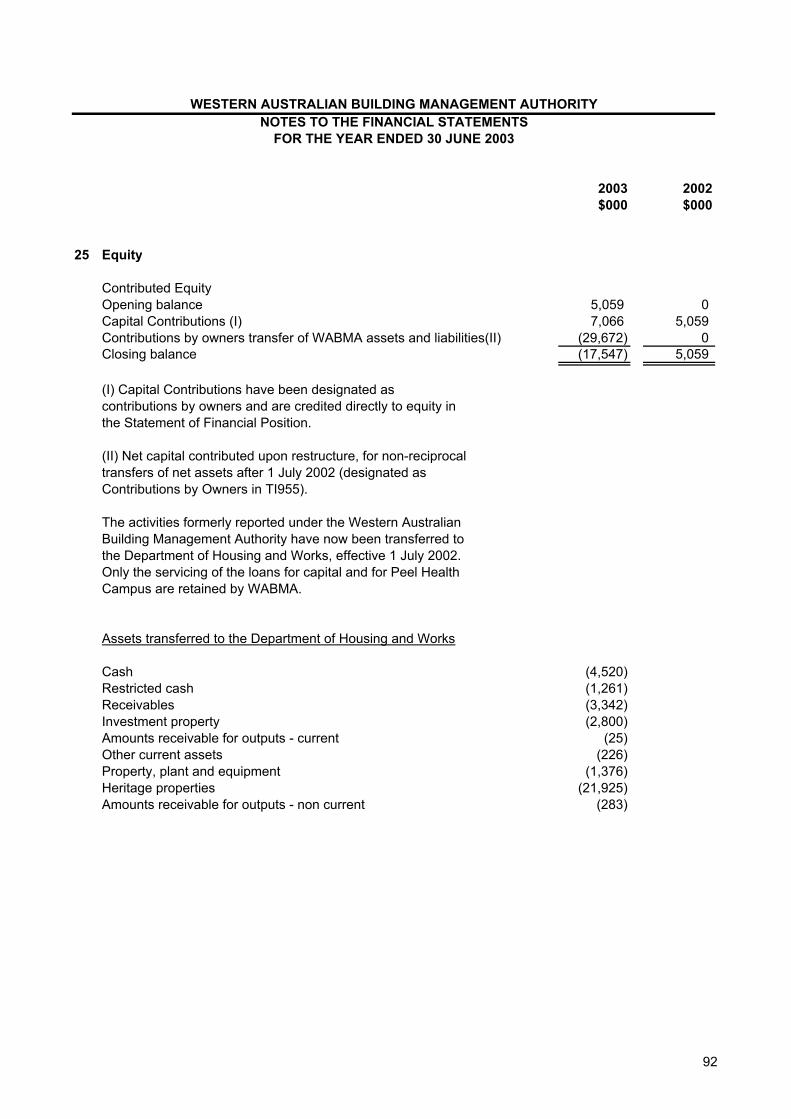
2003 2002$000 $000
WESTERN AUSTRALIAN BUILDING MANAGEMENT AUTHORITYNOTES TO THE FINANCIAL STATEMENTS
FOR THE YEAR ENDED 30 JUNE 2003
25 Equity
Contributed EquityOpening balance 5,059 0 Capital Contributions (I) 7,066 5,059 Contributions by owners transfer of WABMA assets and liabilities(II) (29,672) 0 Closing balance (17,547) 5,059
Assets transferred to the Department of Housing and Works
Cash (4,520)Restricted cash (1,261)Receivables (3,342)Investment property (2,800)Amounts receivable for outputs - current (25)Other current assets (226)Property, plant and equipment (1,376)Heritage properties (21,925)Amounts receivable for outputs - non current (283)
(I) Capital Contributions have been designated as contributions by owners and are credited directly to equity in the Statement of Financial Position.
(II) Net capital contributed upon restructure, for non-reciprocal transfers of net assets after 1 July 2002 (designated as Contributions by Owners in TI955).
The activities formerly reported under the Western Australian Building Management Authority have now been transferred to the Department of Housing and Works, effective 1 July 2002. Only the servicing of the loans for capital and for Peel Health Campus are retained by WABMA.
92
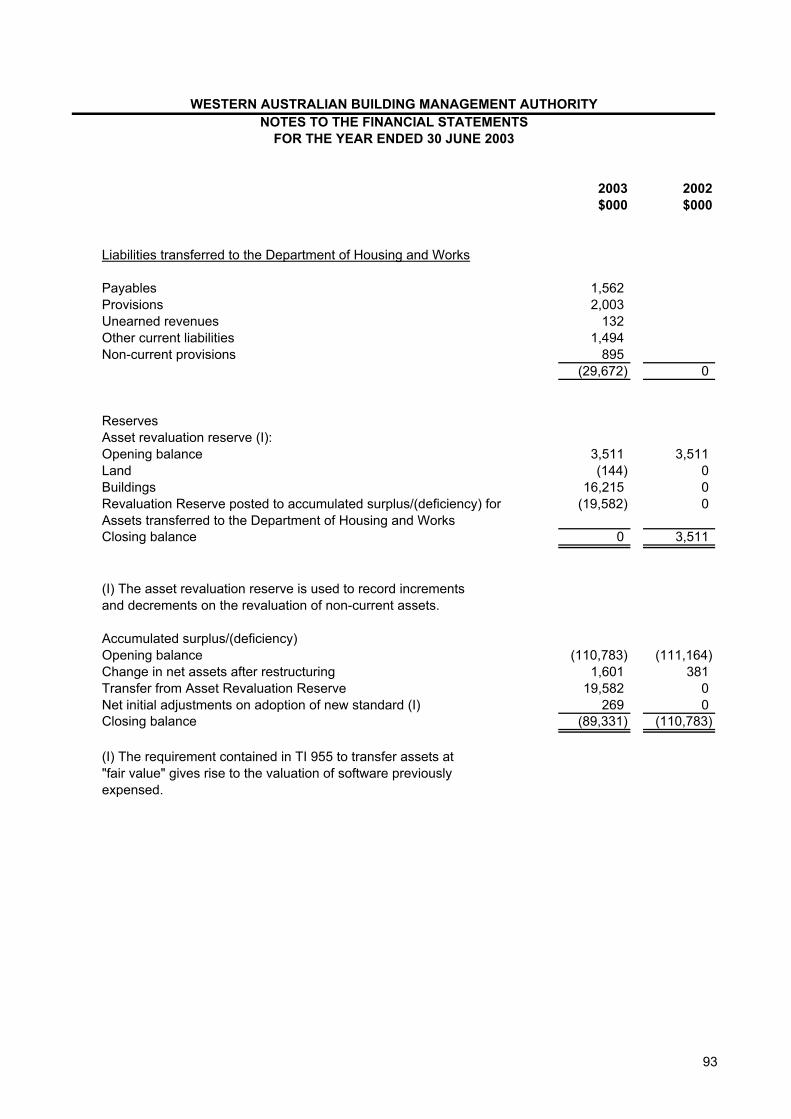
2003 2002$000 $000
WESTERN AUSTRALIAN BUILDING MANAGEMENT AUTHORITYNOTES TO THE FINANCIAL STATEMENTS
FOR THE YEAR ENDED 30 JUNE 2003
Liabilities transferred to the Department of Housing and Works
Payables 1,562Provisions 2,003Unearned revenues 132 Other current liabilities 1,494 Non-current provisions 895
(29,672) 0
ReservesAsset revaluation reserve (I):Opening balance 3,511 3,511 Land (144) 0 Buildings 16,215 0
(19,582) 0
Closing balance 0 3,511
Accumulated surplus/(deficiency)Opening balance (110,783) (111,164)Change in net assets after restructuring 1,601 381 Transfer from Asset Revaluation Reserve 19,582 0 Net initial adjustments on adoption of new standard (I) 269 0 Closing balance (89,331) (110,783)
Revaluation Reserve posted to accumulated surplus/(deficiency) for Assets transferred to the Department of Housing and Works
(I) The asset revaluation reserve is used to record increments and decrements on the revaluation of non-current assets.
(I) The requirement contained in TI 955 to transfer assets at "fair value" gives rise to the valuation of software previously expensed.
93
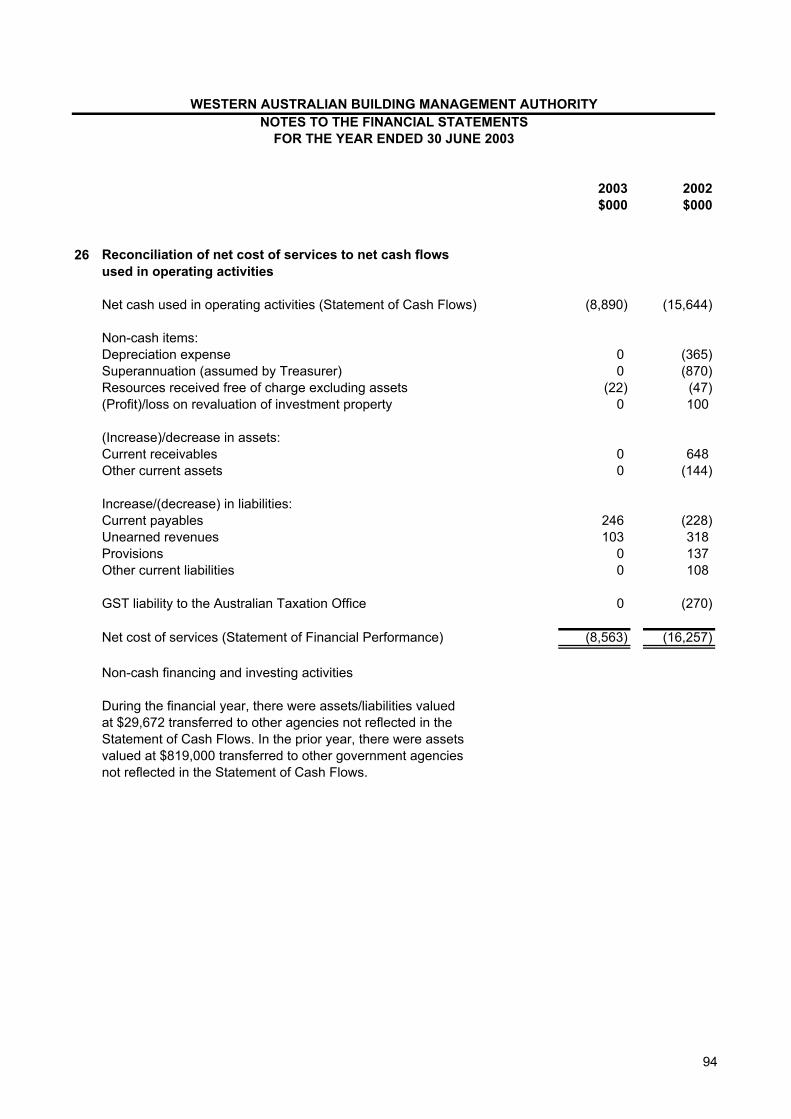
2003 2002$000 $000
WESTERN AUSTRALIAN BUILDING MANAGEMENT AUTHORITYNOTES TO THE FINANCIAL STATEMENTS
FOR THE YEAR ENDED 30 JUNE 2003
26
Net cash used in operating activities (Statement of Cash Flows) (8,890) (15,644)
Non-cash items:Depreciation expense 0 (365)Superannuation (assumed by Treasurer) 0 (870)Resources received free of charge excluding assets (22) (47)(Profit)/loss on revaluation of investment property 0 100
(Increase)/decrease in assets:Current receivables 0 648 Other current assets 0 (144)
Increase/(decrease) in liabilities:Current payables 246 (228)Unearned revenues 103 318 Provisions 0 137 Other current liabilities 0 108
GST liability to the Australian Taxation Office 0 (270)
Net cost of services (Statement of Financial Performance) (8,563) (16,257)
Non-cash financing and investing activities
Reconciliation of net cost of services to net cash flows used in operating activities
During the financial year, there were assets/liabilities valued at $29,672 transferred to other agencies not reflected in the Statement of Cash Flows. In the prior year, there were assets valued at $819,000 transferred to other government agencies not reflected in the Statement of Cash Flows.
94

2003 2002$000 $000
WESTERN AUSTRALIAN BUILDING MANAGEMENT AUTHORITYNOTES TO THE FINANCIAL STATEMENTS
FOR THE YEAR ENDED 30 JUNE 2003
27 Reconciliation of cash
Cash assets 1,095 4,520 Restricted cash (see note 12) 0 1,261 Cash assets 1,095 5,781
28 Financing facilities
Treasurer's Advance Account:Total line of credit available 0 25,000 Amount of credit unused 0 25,000
29 Operating leases
(a) WABMA as lessee
Total lease rental expense 0 2,092
Payable not later than one year 0 693 Payable later than one year and not later than five years 0 1,027 Payable later than five years 0 113
0 1,833
For the purposes of the Statement of Cash Flows, cash includes cash on hand and in banks. Cash at the end of the financial year as shown in the Statement of Cash Flows is reconciled to the related items in the Statement of Financial Position as follows:
WABMA has the power under section 9C(1)(b) of the Public Works Act 1902 to borrow money to carry out its functions.Details of WABMA's borrowings are shown at note 21. These borrowings are fully drawn and will continue to their maturity dates.
Non-cancellable operating lease commitments (not recognised as liabilities):
95

2003 2002$000 $000
WESTERN AUSTRALIAN BUILDING MANAGEMENT AUTHORITYNOTES TO THE FINANCIAL STATEMENTS
FOR THE YEAR ENDED 30 JUNE 2003
(b) WABMA as lessor
0 5,770
Accumulated depreciation 0 112
0 56
0 517
0 171 0 346 0 517
30 Financial instruments
(a) Interest rate risk exposure
(b) Credit risk exposure
Details of the leased Heritage Asset are: Land and Buildings at fair value
WABMA has an exposure to interest rate risk on its borrowings as disclosed in note 21. WABMA has no exposure to interest rate risk on its other financial assets and liabilities.
The carrying amount of financial assets recorded in the financial statements, net of any provisions for losses, represents WABMA's maximum exposure to credit risk without taking account of the value of any collateral or other security obtained.
The carrying amount of leases receivable represents WABMA's maximum credit risk exposure to a single debtor.
Receivable later than one year and not later than five
Depreciation expense during the year
Lease commitments receivable at 30 June
Expected future minimum lease payments are: Receivable not later than one year
Several operating leases have been arranged over the Fremantle Prison Buildings, a Heritage asset. The leases have no option for purchase or escalation. Some of the leases have extension options.
96

2003 2002$000 $000
WESTERN AUSTRALIAN BUILDING MANAGEMENT AUTHORITYNOTES TO THE FINANCIAL STATEMENTS
FOR THE YEAR ENDED 30 JUNE 2003
31 Remuneration of auditors
External audit:Office of the Auditor General notional fee 22 19
32 Remuneration of Accountable Authority and Senior Officers
2003 2002$150,001 - $160,000 0 0 $170,001 - $180,000 0 0
0 0
2003 2002 $90,001 - $100,000 0 0 $100,001 - $110,000 0 0 $110,001 - $120,000 0 1
The total remuneration of Senior Officers is 0 117
33 Supplementary information
Revenue and debts written off 0 3
The number of Senior Officers other than members of the Accountable Authority whose total of fees, salaries and other benefits received, or due and receivable, for the financial year falls within each band of income is:
The number of members of the Accountable Authority whose total of fees, salaries and other benefits received, or due and receivable, for the financial year falls within each band of income is:
The total remuneration of the members of the Accountable Authority is
97
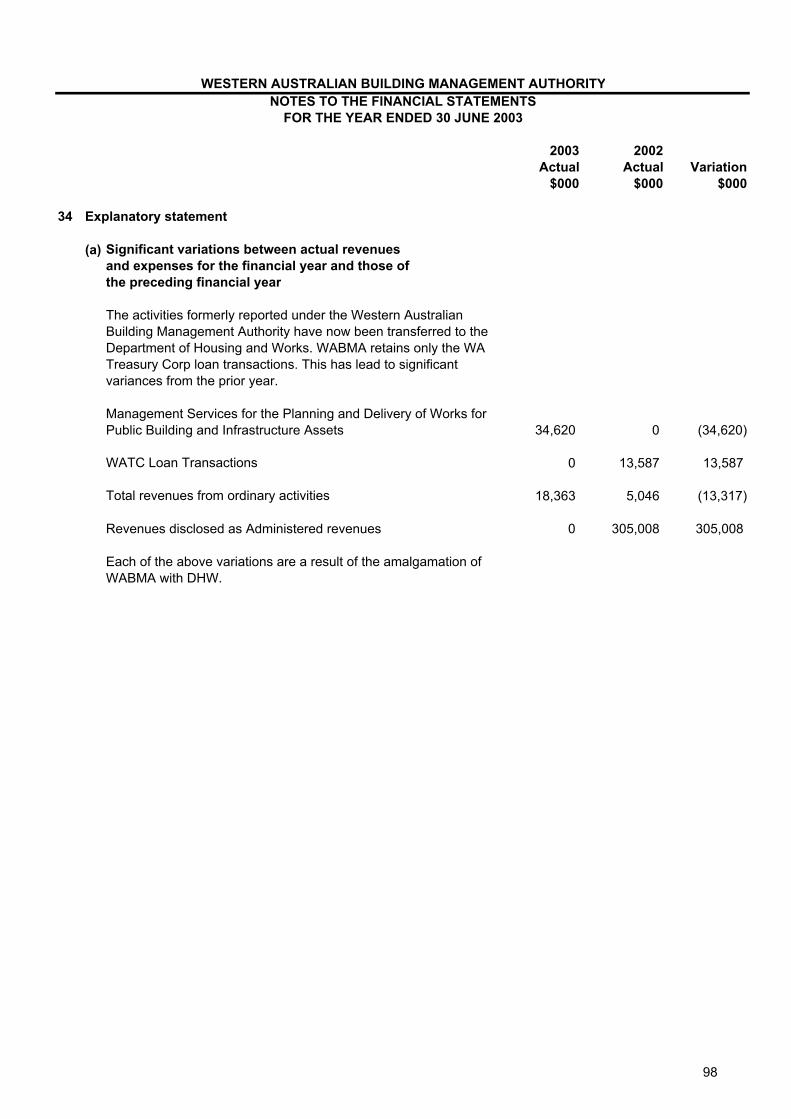
WESTERN AUSTRALIAN BUILDING MANAGEMENT AUTHORITYNOTES TO THE FINANCIAL STATEMENTS
FOR THE YEAR ENDED 30 JUNE 2003
2003 2002Actual Actual Variation
$000 $000 $000
34 Explanatory statement
(a) Significant variations between actual revenuesand expenses for the financial year and those ofthe preceding financial year
34,620 0 (34,620)
WATC Loan Transactions 0 13,587 13,587
Total revenues from ordinary activities 18,363 5,046 (13,317)
Revenues disclosed as Administered revenues 0 305,008 305,008
The activities formerly reported under the Western Australian Building Management Authority have now been transferred to the Department of Housing and Works. WABMA retains only the WA Treasury Corp loan transactions. This has lead to significant variances from the prior year.
Management Services for the Planning and Delivery of Works for Public Building and Infrastructure Assets
Each of the above variations are a result of the amalgamation of WABMA with DHW.
98

Contact Details
Department of Housing and Works 99 Plain Street East Perth 6004
Phone: (08) 9222 4666
Fax: (08) 9221 1388
Toll Free: 1800 093 325
E-mail: [email protected]: www.dhw.wa.gov.au