department of housing and urban … of housing and urban development working capital fund for...
TRANSCRIPT
DEPARTMENT OF HOUSING AND URBAN DEVELOPMENT
WORKING CAPITAL FUND
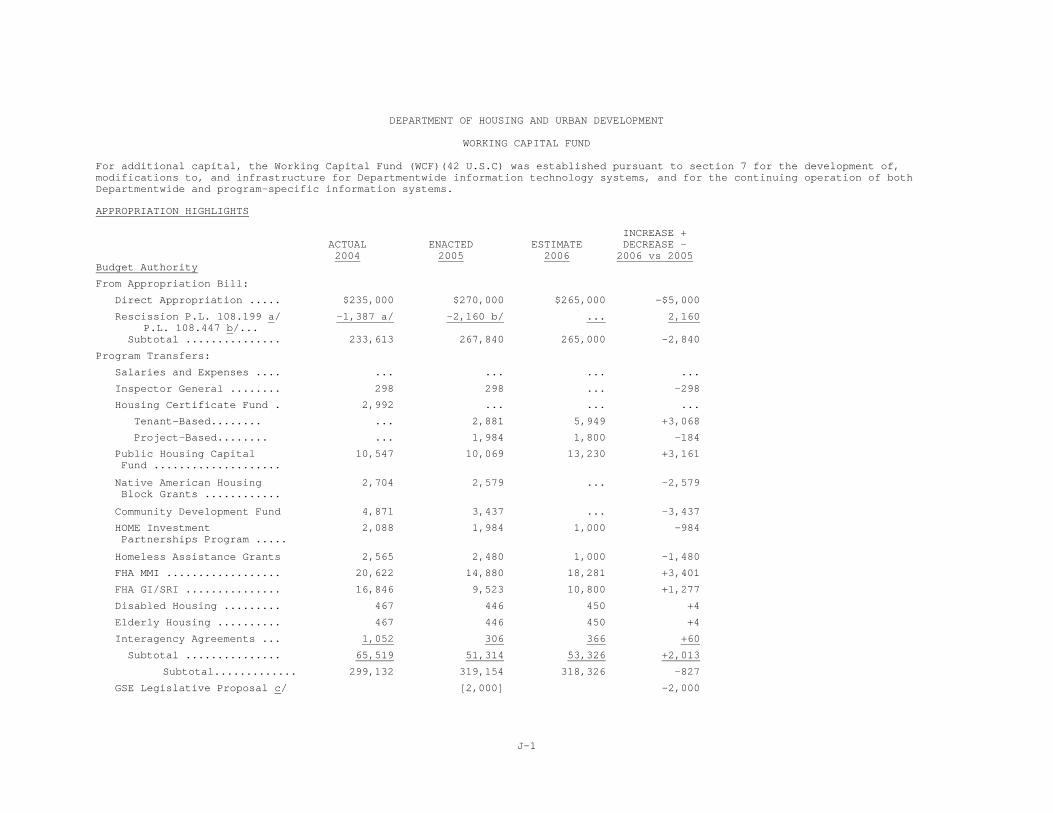
For additional capital, the Working Capital Fund (WCF)(42 U.S.C) was established pursuant to section 7 for the development of, modifications to, and infrastructure for Departmentwide information technology systems, and for the continuing operation of both Departmentwide and program-specific information systems.
APPROPRIATION HIGHLIGHTS
ACTUAL 2004
ENACTED 2005
ESTIMATE 2006
INCREASE + DECREASE -
2006 vs 2005Budget Authority
From Appropriation Bill:
Direct Appropriation ..... $235,000 $270,000 $265,000 -$5,000
Rescission P.L. 108.199 a/ P.L. 108.447 b/...
-1,387 a/ -2,160 b/ ... 2,160
Subtotal ............... 233,613 267,840 265,000 -2,840
Program Transfers:
Salaries and Expenses .... ... ... ... ...
Inspector General ........ 298 298 ... -298
Housing Certificate Fund . 2,992 ... ... ...
Tenant-Based........ ... 2,881 5,949 +3,068
Project-Based........ ... 1,984 1,800 -184
Public Housing Capital Fund ....................
10,547 10,069 13,230 +3,161
Native American Housing Block Grants ............
2,704 2,579 ... -2,579
Community Development Fund 4,871 3,437 ... -3,437
HOME Investment Partnerships Program .....
2,088 1,984 1,000 -984
Homeless Assistance Grants 2,565 2,480 1,000 -1,480
FHA MMI .................. 20,622 14,880 18,281 +3,401
FHA GI/SRI ............... 16,846 9,523 10,800 +1,277
Disabled Housing ......... 467 446 450 +4
Elderly Housing .......... 467 446 450 +4
Interagency Agreements ... 1,052 306 366 +60
Subtotal ............... 65,519 51,314 53,326 +2,013
Subtotal............. 299,132 319,154 318,326 -827
GSE Legislative Proposal c/ [2,000] -2,000
J-1

Working Capital Fund
ACTUAL 2004
ENACTED 2005
ESTIMATE 2006
INCREASE + DECREASE -
2006 vs 2005
Unobligated Balances (rounded)
Unobligated Balance: SOY . $119,190 $32,231 $16,385 -$15,846
New Budget Authority ..... 299,132 319,153 318,326 -827
Recovery: Prior Year Obl . 5,934 12,000 12,000 ...
Unobligated Balance Exp. -1,000 ... ... ...
New Obligations .......... -391,025 -347,000 -319,000 28,000
Subtotal ............... 32,231 16,385 27,711 +11,326
Outlays (net) ............ 212,000 387,000 264,000 -123,000
a/ Rescissions of .59% pursuant to P.L. 108-199. b/ Rescissions of .80% pursuant to Consolidated Appropriations Act, 2005, P.L. 108-447. c/ Upon enactment of the proposal announced by the Secretary of Housing and Urban Development (HUD) and the Department of Treasury on
September 10, 2003, it is expected that the cost of HUD’s responsibilities would be assessed on the Government-Sponsored Enterprises (GSEs) Fannie Mae and Freddie Mac. These responsibilities include the establishment and enforcement of affordable housing goals for the GSEs, ensuring GSE compliance with fair housing laws, and providing consultation to the safety and soundness regulator on the GSE’s new activities.
STAFFING
ACTUAL 2004
ENACTED 2005
ESTIMATE
2006
INCREASE + DECREASE -
2006 vs 2005
Full-Time Equivalents......... 373 350 350 ...
SUMMARY OF BUDGET REQUEST
The fiscal year 2006 WCF request for HUD is $318.3 million; comprised of $265.0 million in direct budget authority and $53.3 million in reimbursable authority transfers from HUD program areas. The direct appropriation is a 2 percent decrease from the fiscal year 2005 level of $319 million. The transfers increased by $2 million over the fiscal year 2005 level of $51.3 million. As a result of the award of HUD’s new infrastructure contracts, $12 million was recaptured from the prior HIIPS Infrastructure contract and will be used for infrastructure activities under the new contract.
The WCF is comprised of information technology (IT) projects that support the Department’s objectives of: increasing homeownership, promoting decent affordable housing, strengthening communities, ensuring equal opportunities in housing, embracing high standards of ethics, management and accountability, and promoting participation of community and faith-based and community organizations. IT is deeply embedded in virtually all Departmental business functions, processes, and activities. Planned IT development activities will allow HUD to support implementation of the Presidential Management Agenda, adapt to changing business and user requirements, address
J-2
Working Capital Fund
Government Accountability Office and Inspector General findings, support governmentwide eGovernment initiatives, and comply with legislative requirements, such as the Government Paperwork Elimination Act (GPEA), the Government Performance and Results Act (GPRA), the Section 504 and 508 accessibility requirements, Federal Financial Management Improvement Act (FFMIA), and the Government Information Security Reform Act (GISRA).
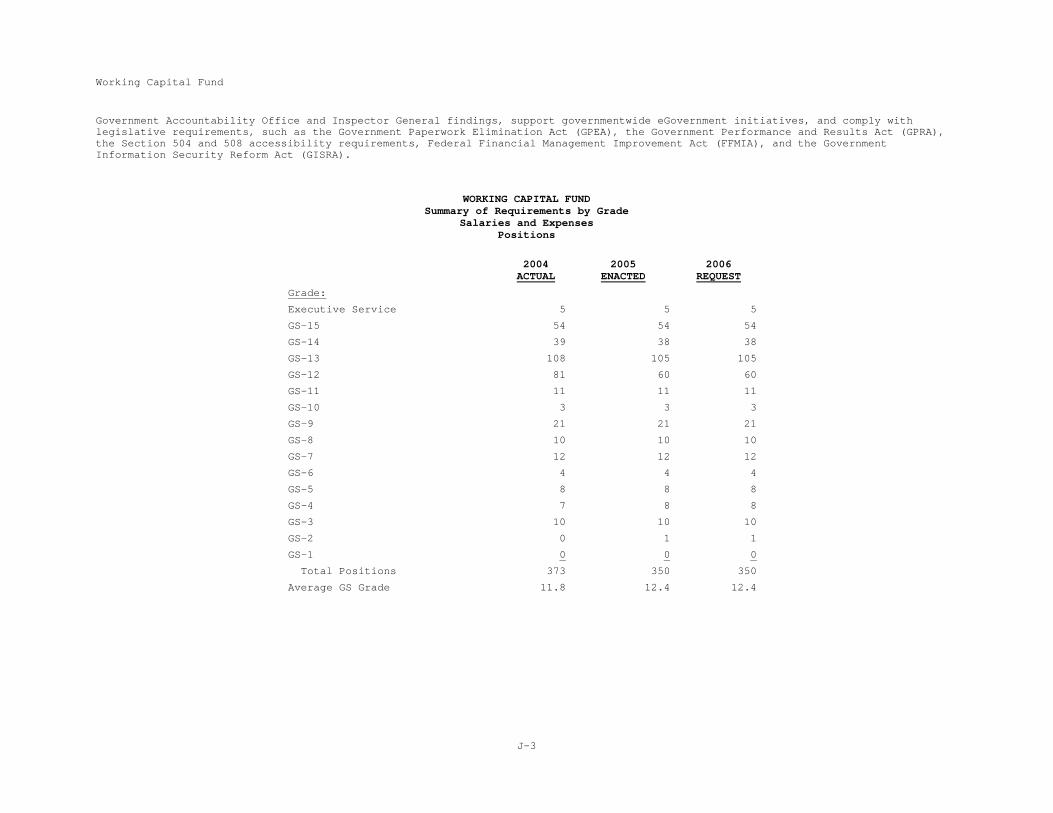
WORKING CAPITAL FUND Summary of Requirements by Grade
Salaries and Expenses Positions
2004
ACTUAL2005
ENACTED2006
REQUEST
Grade:
Executive Service 5 5 5
GS-15 54 54 54
GS-14 39 38 38
GS-13 108 105 105
GS-12 81 60 60
GS-11 11 11 11
GS-10 3 3 3
GS-9 21 21 21
GS-8 10 10 10
GS-7 12 12 12
GS-6 4 4 4
GS-5 8 8 8
GS-4 7 8 8
GS-3 10 10 10
GS-2 0 1 1
GS-1 0 0 0
Total Positions 373 350 350
Average GS Grade 11.8 12.4 12.4
J-3
Working Capital Fund
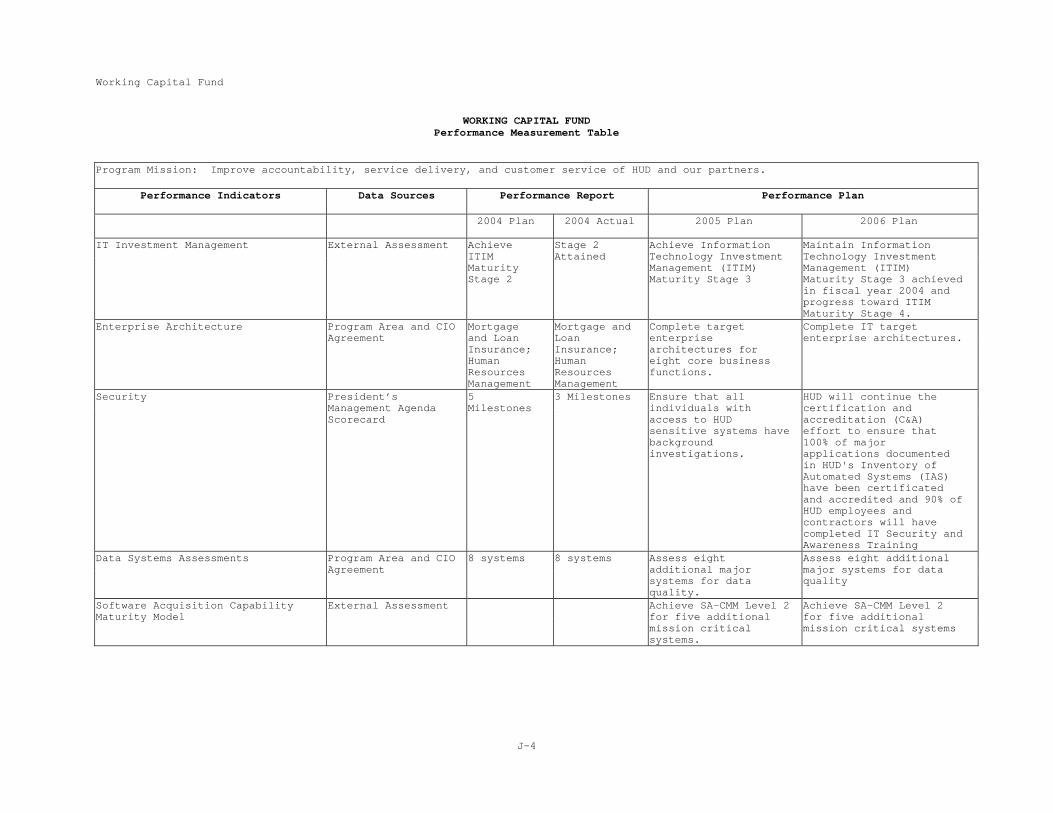
WORKING CAPITAL FUND Performance Measurement Table
Program Mission: Improve accountability, service delivery, and customer service of HUD and our partners.
Performance Indicators Data Sources Performance Report Performance Plan
2004 Plan 2004 Actual 2005 Plan 2006 Plan
IT Investment Management External Assessment Achieve ITIM Maturity Stage 2
Stage 2 Attained
Achieve Information Technology Investment Management (ITIM) Maturity Stage 3
Maintain Information Technology Investment Management (ITIM) Maturity Stage 3 achieved in fiscal year 2004 and progress toward ITIM Maturity Stage 4.
Enterprise Architecture Program Area and CIO Agreement
Mortgage and Loan Insurance; Human Resources Management
Mortgage and Loan Insurance; Human Resources Management
Complete target enterprise architectures for eight core business functions.
Complete IT target enterprise architectures.
Security President’sManagement Agenda Scorecard
5 Milestones
3 Milestones Ensure that all individuals with access to HUD sensitive systems have background investigations.
HUD will continue the certification and accreditation (C&A) effort to ensure that 100% of major applications documented in HUD's Inventory of Automated Systems (IAS) have been certificated and accredited and 90% of HUD employees and contractors will have completed IT Security and Awareness Training
Data Systems Assessments Program Area and CIO Agreement
8 systems 8 systems Assess eight additional major systems for data quality.
Assess eight additional major systems for data quality
Software Acquisition Capability Maturity Model
External Assessment Achieve SA-CMM Level 2 for five additional mission critical systems.
Achieve SA-CMM Level 2 for five additional mission critical systems
J-4

Working Capital Fund
IT Investment Management: Implement ITIM Maturity Framework to improve the selection and management of HUD's IT portfolio and to ensure that the Department's portfolio of IT projects adequately addresses HUD's business and workforce needs. This process has 5 levels. Five is the highest level of achievement. Indicator: ITIM maturity level. Enterprise Architecture: Provide strategic IT blueprint of HUD systems from the business, application, data, and technology perspectives. Utilize this tool to guide the IT Investment Management process. Indicator: Target architecture completed. Security: Reduce risks and vulnerabilities through an effective critical infrastructure protection program for HUD's information and computing systems. Indicator: Computer security program milestones. Data Systems Assessments: Conduct systematic, independent assessments of the quality of mission critical data within the Department. Indicator: Additional mission critical data systems that have been independently, systematically assessed. Software Acquisition Capability Maturity Model: Improve the maturity of software acquisition processes in terms of an evolutionary path from ad hoc to mature. This process has five levels. Five is the highest level of achievement. Indicator: ITIM maturity level. EXPLANATION OF PERFORMANCE
IT Investment Management
HUD’s established rigorous Capital Planning and Investment Control (CPIC) process ensures that the Department's portfolio of IT projects adequately addresses HUD's business strategies and is managed to achieve the expected benefits in accordance with accurate and complete cost, schedule, technical, and performance baselines. In addition to selecting an optimal portfolio of IT projects or investments, HUD monitors and controls its investments to ensure success. Control mechanisms have been established to minimize the likelihood of project failure or excessive cost and schedule overruns.
All investment decisions are based on cost, benefit, and risk assessments or driven by legislative mandates or other external drivers. Investment performance is measured regularly to ensure that all investments contribute to the overall strategic business plan of the agency. The CPIC process at HUD is a dynamic process. HUD’s portfolio of IT investments is actively managed to ensure that resources are allocated to the mix of projects that will support the achievement of business goals. The portfolio composition and funding allocations are reviewed quarterly. Active portfolio management ensures that the Department is able to address changing business needs, emergent departmental requirements (legislation, regulations, guidance, court orders, etc.), and project performance considerations in a timely manner.
Enterprise Architecture
The Enterprise Architecture (EA) describes the current and planned design of the Department's business, information and technology. It is an information set that depicts the business activities, the information and data necessary to conduct the business activities, and the technologies necessary to support business operations. An EA enables HUD to clearly see and confirm what is intuitively known about the organization and its inner-workings.
As business conditions, priorities, and technologies change, the HUD CPIC process allows for frequent portfolio reviews and alterations that are subsequently reflected in the architecture. The EA is being used to drive investment decision making by ensuring that initiatives align with the business of the Department, by means of data and technical standards, analysis of redundancies and identification of opportunities. HUD’s CPIC process has integrated essential information from the EA as projects are selected, controlled, and evaluated. The Department also has developed EA and IT standards to ensure the interoperability, compatibility and shared usage of technology resources. The architecture and standards provide a foundation for building HUD’s IT applications and infrastructure, and are designed to ensure that information can be transferred between different networks, or different hardware and software systems, with accuracy, reliability and security. The standards provide for interoperability across a range of disparate
J-5

Working Capital Fund
systems. This approach is both proactive and valuable in creating a stronger framework for aligning IT strategy and day-to-day activities with the overall business strategy.
Security
The Department also benefits from a mature security program provided under the IT Security Policy Compliance and Operations initiative. A primary protection for HUD is assuring that only authorized users are granted access to important application systems, a security feature that is maintained throughout the lifecycle of each HUD system. Such protection is ensured by periodic security reviews, and periodic updates of security plans that delineate the security features of HUD systems. A second major benefit is that it addresses GISRA reporting requirements through security self-assessments, developing and reporting on an overall HUD security plan, and providing a 5-year plan for security. A third benefit is that this initiative provides for a periodic security review by an independent entity; therefore, security problems and shortcomings are revealed and addressed by HUD management.
Data Quality Assessments
The Enterprise Data Management (EDM) Framework and Data Quality Improvement Program (DQIP) facilitates a HUD-wide data management practice that enables the quality, availability, and integration of the Department's data. Key components of the EDM practice are data architecture, data stewardship, and data standards and data quality. The EDM practice directly supports a key HUD enterprise architecture principle:
Information is an enterprise asset, leveraged across the information value chain, to improve performance, support decision-making and enable accurate reporting.
EDM/DQ primarily provides for the systematic, independent assessment of the quality of mission critical data at the Department. HUD plans to systematically assess all mission critical data in all HUD mission critical data systems for quality and implement corrective mechanisms to ensure high quality mission critical data. This will enable the Department, in program areas and in IT service areas, to reduce the amount of time and cost devoted to “scrap and rework,” by “doing it right” instead of “doing it over.”
Software Acquisition Capability Maturity Model The Software Acquisition (SA) Capability Maturity Model (CMM) describes the principles and practices underlying software acquisition process maturity. It is intended to help HUD improve the maturity of its software acquisition processes in terms of an evolutionary path from ad hoc, chaotic processes to mature, disciplined software acquisition processes. The focus is on identifying key process areas and the exemplary practices that may comprise a disciplined software acquisition process. The maturity framework provided by SA-CMM establishes a context in which:
• Practices can be repeated, if an activity isn’t repeated, there is no reason to improve it. There are policies, procedures, and practices that commit the Department to implementing and performing consistently.
• Best practices can be rapidly transferred across program areas. Practices are defined sufficiently to allow for transfer across project boundaries, thus providing some standardization for the Department.
• Variations in performing best practices are reduced. Quantitative objectives are established for tasks; and measures are established, taken, and maintained to form a baseline from which an assessment is possible.
• Practices are continuously improved to enhance capability (optimizing).
J-6
Estimate 2004
Estimate 2005
Estimate 2006
Increase + Decrease -
2006 vs 2005
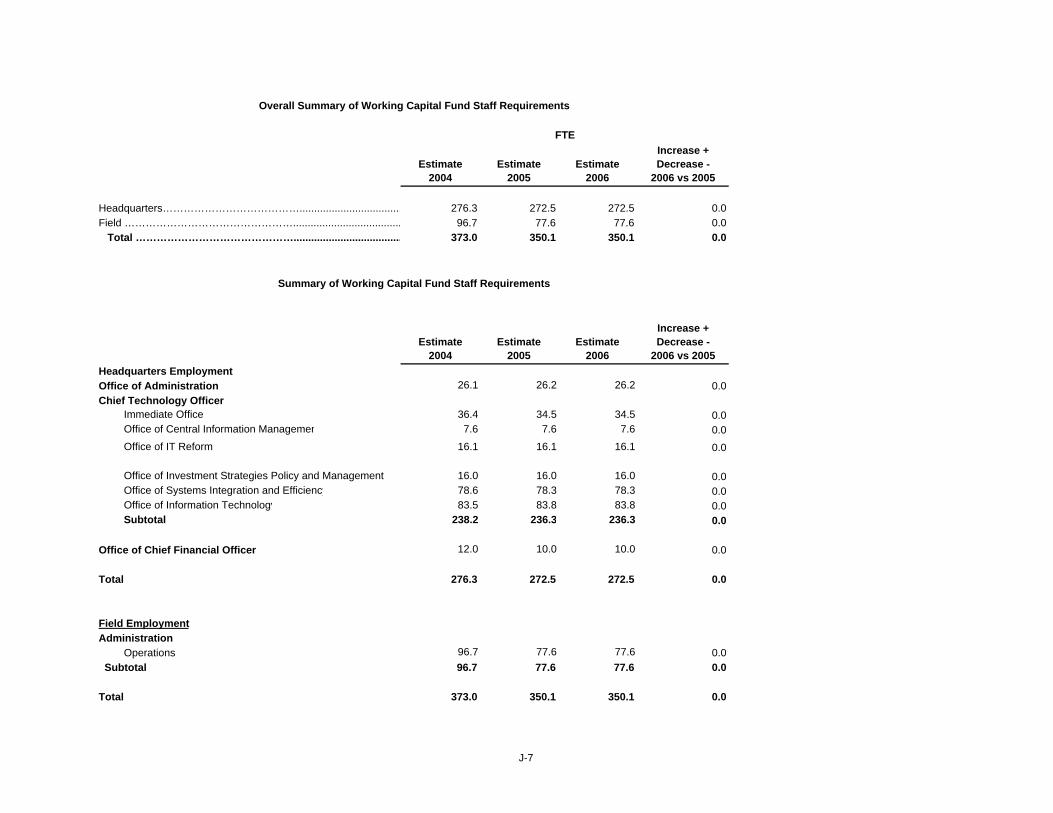
Headquarters…………………………………................................... 276.3 272.5 272.5 0.0Field …………………………………………..................................... 96.7 77.6 77.6 0.0 Total ………………………………………..................................... 373.0 350.1 350.1 0.0
Summary of Working Capital Fund Staff Requirements
Estimate 2004
Estimate 2005
Estimate 2006
Increase + Decrease -
2006 vs 2005Headquarters EmploymentOffice of Administration 26.1 26.2 26.2 0.0Chief Technology Officer
Immediate Office 36.4 34.5 34.5 0.0Office of Central Information Managemen 7.6 7.6 7.6 0.0Office of IT Reform 16.1 16.1 16.1 0.0
Office of Investment Strategies Policy and Management 16.0 16.0 16.0 0.0Office of Systems Integration and Efficiency 78.6 78.3 78.3 0.0Office of Information Technology 83.5 83.8 83.8 0.0Subtotal 238.2 236.3 236.3 0.0
Office of Chief Financial Officer 12.0 10.0 10.0 0.0
Total 276.3 272.5 272.5 0.0
Field EmploymentAdministration
Operations 96.7 77.6 77.6 0.0 Subtotal 96.7 77.6 77.6 0.0
Total 373.0 350.1 350.1 0.0
Overall Summary of Working Capital Fund Staff Requirements
FTE
J-7
Workload GuidelineWorkload Indicator
Projected Accomplish-
ment
Projected Unit Cost
(Hrs) FTE
Underfunded Workload/ Allocation
Projected Accomplish-
ment
Projected Unit Cost
(Hrs) FTE
Underfunded Workload/ Allocation
Projected Accomplish-
ment
Projected Unit Cost
(Hrs) FTEChief Information Officer
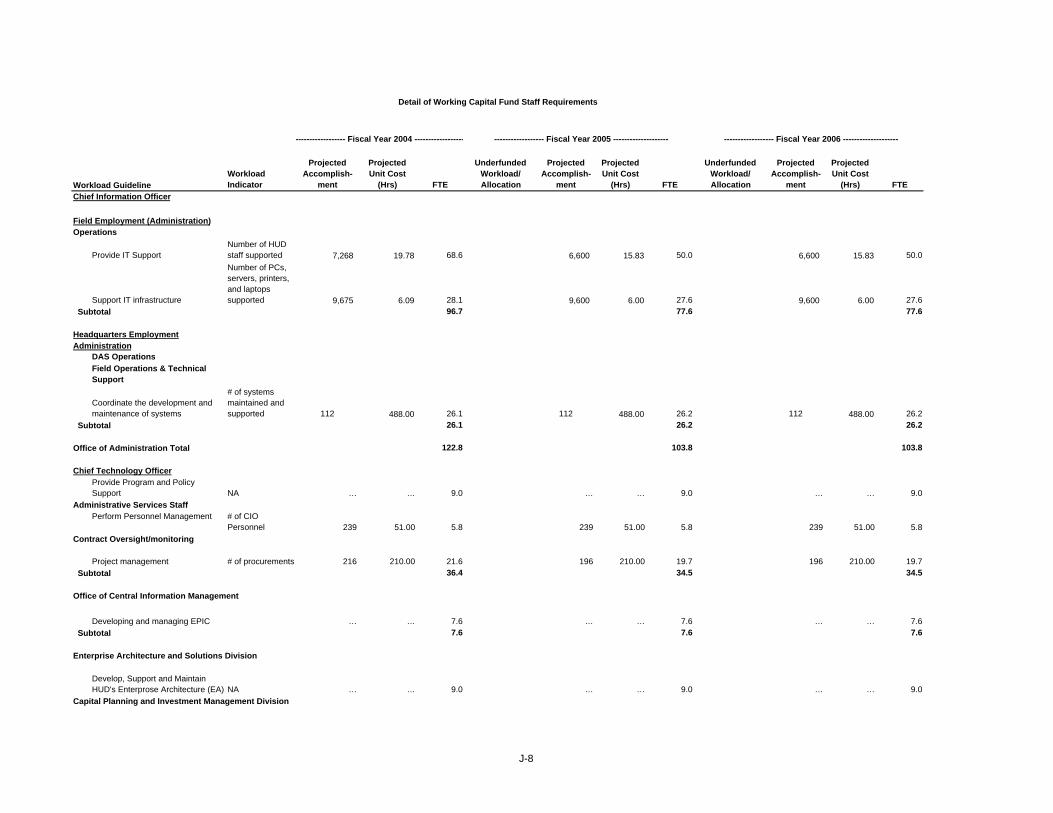
Field Employment (Administration)Operations
Provide IT SupportNumber of HUD staff supported 7,268 19.78 68.6 6,600 15.83 50.0 6,600 15.83 50.0
Support IT infrastructure
Number of PCs, servers, printers, and laptops supported 9,675 6.09 28.1 9,600 6.00 27.6 9,600 6.00 27.6
Subtotal 96.7 77.6 77.6
Headquarters EmploymentAdministration
DAS OperationsField Operations & Technical Support
Coordinate the development and maintenance of systems
# of systems maintained and supported 112 488.00 26.1 112 488.00 26.2 112 488.00 26.2
Subtotal 26.1 26.2 26.2
Office of Administration Total 122.8 103.8 103.8
Chief Technology OfficerProvide Program and Policy Support NA … … 9.0 … … 9.0 … … 9.0
Administrative Services StaffPerform Personnel Management # of CIO
Personnel 239 51.00 5.8 239 51.00 5.8 239 51.00 5.8Contract Oversight/monitoring
Project management # of procurements 216 210.00 21.6 196 210.00 19.7 196 210.00 19.7 Subtotal 36.4 34.5 34.5
Office of Central Information Management
Developing and managing EPIC … … 7.6 … … 7.6 … … 7.6 Subtotal 7.6 7.6 7.6
Enterprise Architecture and Solutions Division
Develop, Support and Maintain HUD's Enterprose Architecture (EA) NA … … 9.0 … … 9.0 … … 9.0
Capital Planning and Investment Management Division
------------------ Fiscal Year 2004 ------------------ ------------------ Fiscal Year 2005 -------------------- ------------------ Fiscal Year 2006 --------------------
Detail of Working Capital Fund Staff Requirements
J-8

Workload GuidelineWorkload Indicator
Projected Accomplish-
ment
Projected Unit Cost
(Hrs) FTE
Underfunded Workload/ Allocation
Projected Accomplish-
ment
Projected Unit Cost
(Hrs) FTE
Underfunded Workload/ Allocation
Projected Accomplish-
ment
Projected Unit Cost
(Hrs) FTE
------------------ Fiscal Year 2004 ------------------ ------------------ Fiscal Year 2005 -------------------- ------------------ Fiscal Year 2006 --------------------
Support, Develop and Report on the IT Portfolios Within HUD
# of Projects Over $5 Million Per Fiscal Year 21 707.00 7.1 21 707.00 7.1 21 707.00 7.1
Subtotal 16.1 16.1 16.1
Office of Investment Strategies Policy and ManagementEstablish and Implement an IT/IRM Policy and Governance Department-wide to Ensure Legislative Compliance NA … … 16.0 … … 16.0 … … 16.0
Subtotal 16.0 16.0 16.0
Office of Systems Integration and Efficiency
Develop and Manage Critical Infrastructure Protection Assurance
# of IT Systems/Applications 160 130.50 10.0 160 130.50 10.0 160 130.50 10.0
BPR and Systems Integration# of reviews conducted 55 58.00 1.5 55 58.00 1.5 55 58.00 1.5
Configuration management
# of components requiring conf mgmt 248 6.00 0.7 248 6.00 0.7 248 6.00 0.7
Coordinate the development and maintenance of systems
# of systems maintained and supported 246 566.00 66.4 244 566.00 66.1 244 566.00 66.1
Subtotal 78.6 78.3 78.3
Office of Information TechnologyImmediate Office
Provide Program and Policy Support NA … … 5.8 … … 5.8 … … 5.8
5.8 5.8 5.8
Computer Services, Operations, and Maintenance GroupCustomer Services Division
Provide customer services to IT users
# of customers supported 14,000 4.00 26.7 14,000 4.00 26.8 14,000 4.00 26.8
Telecom Processing DivisionManage LAN, WAN, Internet, and Intranet services number of servers 516.00 32.00 7.9 516.00 32.00 7.9 516.00 32.00 7.9
Provide Group Video Conferencing# of group video conf units 69.00 5.00 0.2 69.00 5.00 0.2 69.00 5.00 0.2
Manage Technical Support and Network Infrastructure for FTS2001 (Federal Telecommunications System Contract) number of circuits 217 5.00 0.5 217 5.00 0.5 217 5.00 0.5
Subtotal 8.6 8.6 8.6
J-9

Workload GuidelineWorkload Indicator
Projected Accomplish-
ment
Projected Unit Cost
(Hrs) FTE
Underfunded Workload/ Allocation
Projected Accomplish-
ment
Projected Unit Cost
(Hrs) FTE
Underfunded Workload/ Allocation
Projected Accomplish-
ment
Projected Unit Cost
(Hrs) FTE
------------------ Fiscal Year 2004 ------------------ ------------------ Fiscal Year 2005 -------------------- ------------------ Fiscal Year 2006 --------------------
Departmental Platform and Processing Division
Manage Client Servers and Lotus Notes Applications Environment
# of Lotus Note Accounts Supported 14,000 0.70 4.7 14,000 0.70 4.7 14,000 0.70 4.7
Manage Production Systems Environment
# of Application Systems Supported 160 90.00 6.9 160 90.00 6.9 160 90.00 6.9
Subtotal 11.6 11.6 11.6
Systems Engineering, Oversight and Performance Management DivisionProvide Systems Development Standards, Guidance and Technical Assistance to the Development Community
# of Systems Supported 259 65.00 8.0 259 65.00 8.1 259 65.00 8.1
Subtotal 8.0 8.1 8.1
Systems Integrity and Quality Assurnace Division
Operate Test Center
# of Applications, Plus COTS, That Go Through the Test Center 484 20.00 4.6 484 20.00 4.6 484 20.00 4.6
Provide security operations and consultant services
# of customer accounts processed 29,420 1.20 16.8 29,420 1.20 16.9 29,420 1.20 16.9
Provide automated change control management
# of Applications, Plus COTS, That Go Through the Test Center 270 11.00 1.4 270 11.00 1.4 270 11.00 1.4
Subtotal 22.8 22.9 22.9
Subtotal OIT 83.5 83.8 83.8
Chief Technology Officer Total 238.2 236.3 236.3
J-10
Workload GuidelineWorkload Indicator
Projected Accomplish-
ment
Projected Unit Cost
(Hrs) FTE
Underfunded Workload/ Allocation
Projected Accomplish-
ment
Projected Unit Cost
(Hrs) FTE
Underfunded Workload/ Allocation
Projected Accomplish-
ment
Projected Unit Cost
(Hrs) FTE
------------------ Fiscal Year 2004 ------------------ ------------------ Fiscal Year 2005 -------------------- ------------------ Fiscal Year 2006 --------------------
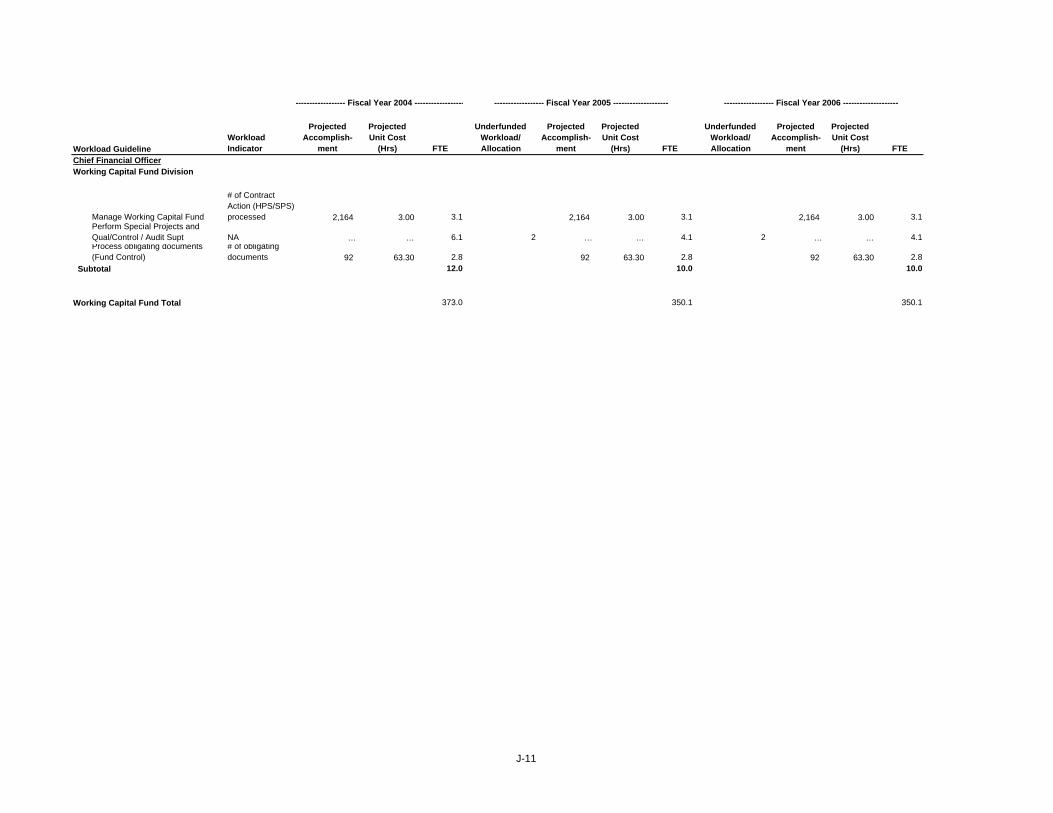
Chief Financial OfficerWorking Capital Fund Division
Manage Working Capital Fund
# of Contract Action (HPS/SPS) processed 2,164 3.00 3.1 2,164 3.00 3.1 2,164 3.00 3.1
Perform Special Projects and Qual/Control / Audit Supt NA … … 6.1 2 … … 4.1 2 … … 4.1Process obligating documents (Fund Control)
# of obligating documents 92 63.30 2.8 92 63.30 2.8 92 63.30 2.8
Subtotal 12.0 10.0 10.0
Working Capital Fund Total 373.0 350.1 350.1
J-11

Working Capital Fund
EMPLOYMENT EXPLANATION OF CHANGES FROM 2005 BUDGET ESTIMATE TO 2006 ESTIMATE The Working Capital Fund (WCF) Division’s FTE level of 350 FTE for fiscal year 2006 shows no change with the fiscal year 2005 FTE level, but is a 30 FTE reduction from the requirements identified by the recently completed Resources Estimation and Allocation Process (REAP) Study. The FTE numbers requested for each office represent an effort to staff each component of WCF as close to their identified REAP requirement as possible. The 30 FTE reduction cuts the Field Operations by 29 percent from the identified REAP requirement. However, it is expected that the new infrastructure contract will provide the services formerly provided by these FTE resources.
J-12 12