department of health: progress in improving stroke care ... · department of health progress in...
TRANSCRIPT
Department of Health
Progress in improving stroke care
RepoRt by tHe ComptRolleR anD auDitoR GeneRal
HC 291 SeSSion 2009–2010
3 FebRuaRy 2010

The National Audit Office scrutinises public spending on behalf of
Parliament. The Comptroller and Auditor General, Amyas Morse, is an
Officer of the House of Commons. He is the head of the National Audit
Office which employs some 900 staff. He and the National Audit Office
are totally independent of Government. He certifies the accounts of all
Government departments and a wide range of other public sector bodies;
and he has statutory authority to report to Parliament on the economy,
efficiency and effectiveness with which departments and other bodies
have used their resources. Our work leads to savings and other efficiency
gains worth many millions of pounds: at least £9 for every £1 spent
running the Office.
Our vision is to help the nation spend wisely.
We promote the highest standards in financial management and reporting, the proper conduct of public business and beneficial change in the provision of public services.
Ordered by the House of Commons to be printed on 1 February 2010
Report by the Comptroller and auditor General HC 291 Session 2009–2010 3 February 2010
London: The Stationery Office £14.35
This report has been prepared under section 6 of the National Audit Act 1983 for presentation to the House of Commons in accordance with Section 9 of the Act.
Amyas Morse Comptroller and Auditor General
National Audit Office
29 January 2010
Department of Health
Progress in improving stroke care

Stroke is one of the top three causes of death and the largest cause of adult disability in England, and costs the NHS over £3 billion a year.
© National Audit Office 2010
The text of this document may be reproduced free of charge in any format or medium providing that it is reproduced accurately and not in a misleading context.
The material must be acknowledged as National Audit Office copyright and the document title specified. Where third party material has been identified, permission from the respective copyright holder must be sought.
Printed in the UK for the Stationery Office Limited on behalf of the Controller of Her Majesty’s Stationery OfficeP002346666 02/10 77240

Contents
Summary 4
Part One The framework for providing stroke care 13
Part TwoTreating stroke patients 21
Part ThreeSupporting stroke survivors and preventing strokes 31
Appendix OneMethodology 42
Appendix TwoProgress against PAC recommendations 43
The National Audit Office study team consisted of:
Alex Scharaschkin, William Palmer, Omer Saka, Cait Turvey Roe and Candida Owusu-Apenten under the direction of Karen Taylor
Additional assistance was provided by Gurj Shergill, Dan Ward, Rosie Buckley, Sandip Odedra and Tereza Lanitis
This report can be found on the National Audit Office website at www.nao.org.uk/stroke2010
For further information about the National Audit Office please contact:
National Audit Office Press Office 157-197 Buckingham Palace Road Victoria London SW1W 9SP
Tel: 020 7798 7400
Email: [email protected]
4 Summary Progress in improving stroke care
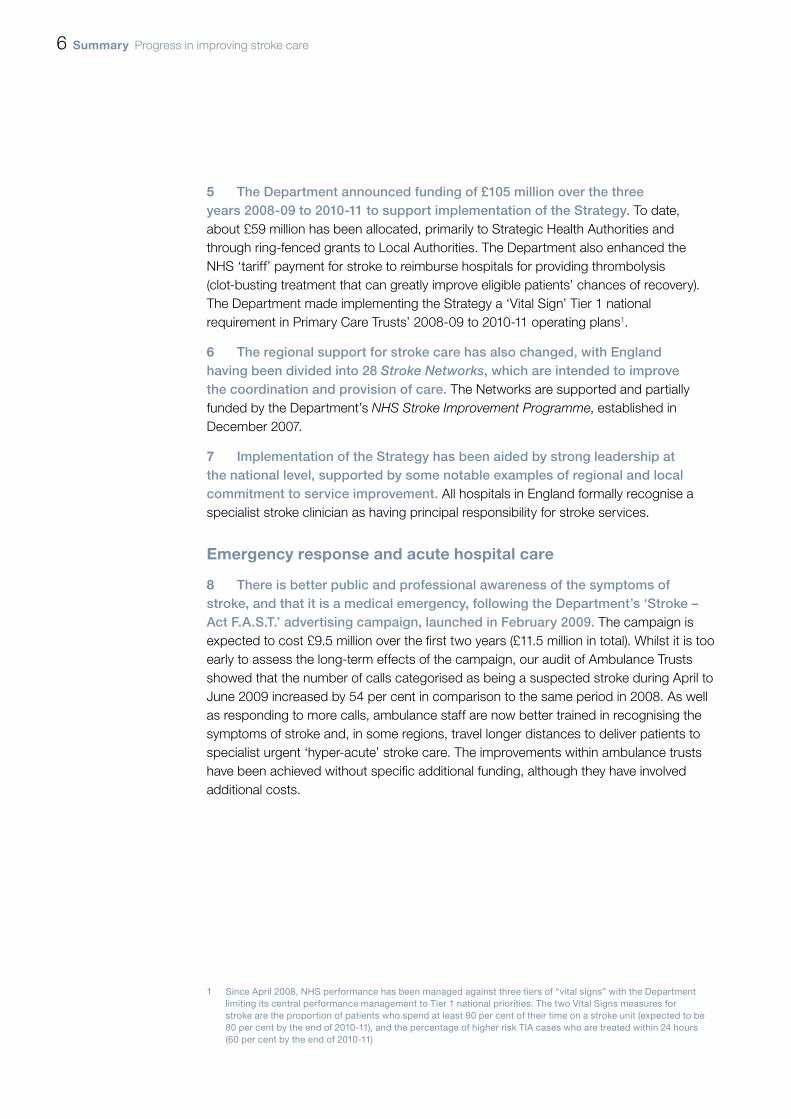
Figure 1Background on stroke
What Stroke is
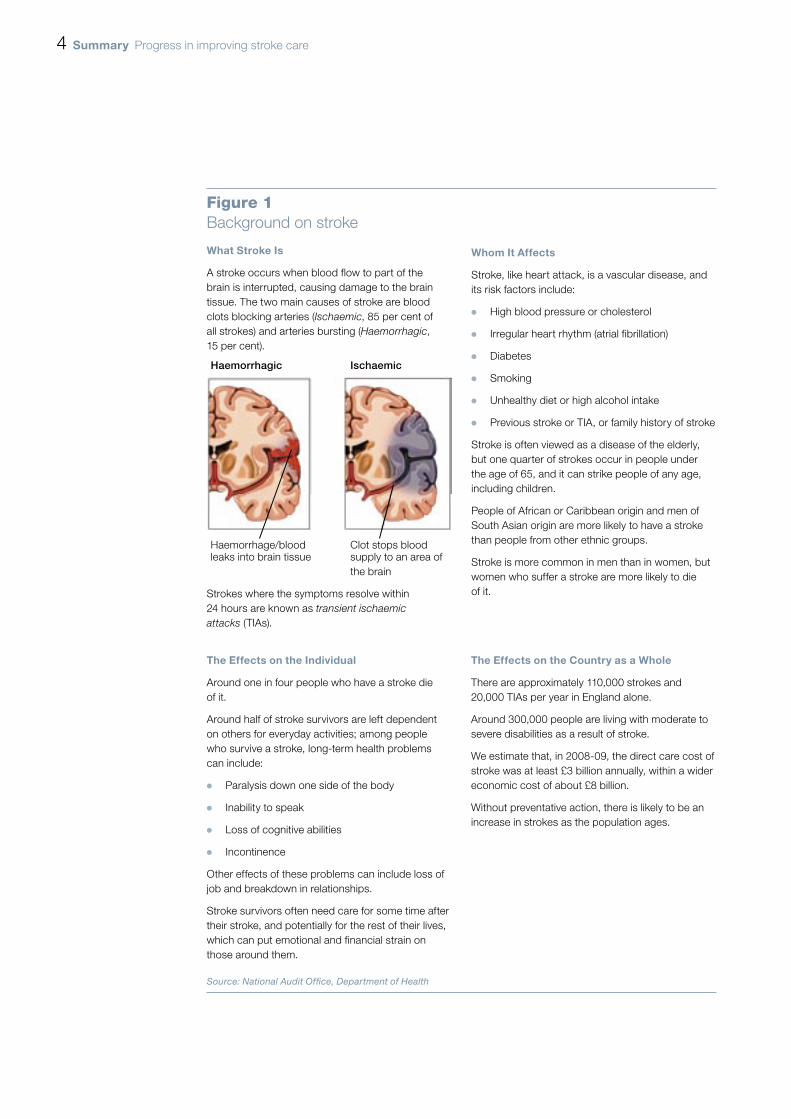
A stroke occurs when blood flow to part of the brain is interrupted, causing damage to the brain tissue. The two main causes of stroke are blood clots blocking arteries (Ischaemic, 85 per cent of all strokes) and arteries bursting (Haemorrhagic, 15 per cent).
Haemorrhagic Ischaemic
Haemorrhage/blood Clot stops bloodleaks into brain tissue supply to an area of the brain
Strokes where the symptoms resolve within 24 hours are known as transient ischaemic attacks (TIAs).
Whom it affects
Stroke, like heart attack, is a vascular disease, and its risk factors include:
High blood pressure or cholesterol ¬
Irregular heart rhythm (atrial fibrillation) ¬
Diabetes ¬
Smoking ¬
Unhealthy diet or high alcohol intake ¬
Previous stroke or TIA, or family history of stroke ¬
Stroke is often viewed as a disease of the elderly, but one quarter of strokes occur in people under the age of 65, and it can strike people of any age, including children.
People of African or Caribbean origin and men of South Asian origin are more likely to have a stroke than people from other ethnic groups.
Stroke is more common in men than in women, but women who suffer a stroke are more likely to die of it.
the effects on the individual
Around one in four people who have a stroke die of it.
Around half of stroke survivors are left dependent on others for everyday activities; among people who survive a stroke, long-term health problems can include:
Paralysis down one side of the body ¬
Inability to speak ¬
Loss of cognitive abilities ¬
Incontinence ¬
Other effects of these problems can include loss of job and breakdown in relationships.
Stroke survivors often need care for some time after their stroke, and potentially for the rest of their lives, which can put emotional and financial strain on those around them.
the effects on the Country as a Whole
There are approximately 110,000 strokes and 20,000 TIAs per year in England alone.
Around 300,000 people are living with moderate to severe disabilities as a result of stroke.
We estimate that, in 2008-09, the direct care cost of stroke was at least £3 billion annually, within a wider economic cost of about £8 billion.
Without preventative action, there is likely to be an increase in strokes as the population ages.
Source: National Audit Offi ce, Department of Health
Progress in improving stroke care Summary 5
Summary
Introduction
Stroke is one of the top three causes of death and the largest cause of adult 1 disability in England, and costs the NHS over £3 billion a year. In November 2005 we published Reducing brain damage: faster access to better stroke care, which concluded that historically stroke had had a low priority within the NHS as it was seen as an inevitable risk of growing old, and that medical and technological developments which could improve patient outcomes were not being implemented widely. We identified considerable variations in the efficiency and effectiveness of treatment, and scope for potential savings as the result of more efficient practices.
Our report formed the basis of a hearing of the Committee of Public Accounts, 2 whose report in June 2006 concluded that the human and economic costs of stroke could be reduced by re-organising services and using existing capacity more wisely. The Committee made a number of recommendations for the Department of Health (the Department) and NHS organisations, and asked us to report back on progress in improving stroke care.
This report sets out our evaluation of how stroke care has changed over the last 3 four years, the extent to which these changes have improved the value for money of stroke care provision nationally, and the risks and issues to be managed to ensure that stroke care services continue to improve in future. Our methodology – which included commissioning a census of all hospitals, a survey of 760 stroke patients and carers, and building an economic model of stroke services – is summarised in Appendix One.
What has changed since we reported on stroke in 2005?
There has been a major change in the Department’s approach to stroke care 4 since our previous report. In December 2007 it published the National Stroke Strategy (the Strategy), which represents a comprehensive response to the concerns raised by the Committee of Public Accounts (summarised in Appendix Two). The Strategy defines markers for high-quality stroke care, and sets out actions and progress measures for achieving the vision over a ten-year period.
6 Summary Progress in improving stroke care
The Department announced funding of £105 million over the three 5 years 2008-09 to 2010-11 to support implementation of the Strategy. To date, about £59 million has been allocated, primarily to Strategic Health Authorities and through ring-fenced grants to Local Authorities. The Department also enhanced the NHS ‘tariff’ payment for stroke to reimburse hospitals for providing thrombolysis (clot-busting treatment that can greatly improve eligible patients’ chances of recovery). The Department made implementing the Strategy a ‘Vital Sign’ Tier 1 national requirement in Primary Care Trusts’ 2008-09 to 2010-11 operating plans1.
The regional support for stroke care has also changed, with England 6 having been divided into 28 Stroke Networks, which are intended to improve the coordination and provision of care. The Networks are supported and partially funded by the Department’s NHS Stroke Improvement Programme, established in December 2007.
Implementation of the Strategy has been aided by strong leadership at 7 the national level, supported by some notable examples of regional and local commitment to service improvement. All hospitals in England formally recognise a specialist stroke clinician as having principal responsibility for stroke services.
emergency response and acute hospital care
There is better public and professional awareness of the symptoms of 8 stroke, and that it is a medical emergency, following the Department’s ‘Stroke – Act F.A.S.T.’ advertising campaign, launched in February 2009. The campaign is expected to cost £9.5 million over the first two years (£11.5 million in total). Whilst it is too early to assess the long-term effects of the campaign, our audit of Ambulance Trusts showed that the number of calls categorised as being a suspected stroke during April to June 2009 increased by 54 per cent in comparison to the same period in 2008. As well as responding to more calls, ambulance staff are now better trained in recognising the symptoms of stroke and, in some regions, travel longer distances to deliver patients to specialist urgent ‘hyper-acute’ stroke care. The improvements within ambulance trusts have been achieved without specific additional funding, although they have involved additional costs.
1 Since April 2008, NHS performance has been managed against three tiers of “vital signs” with the Department limiting its central performance management to Tier 1 national priorities. The two Vital Signs measures for stroke are the proportion of patients who spend at least 90 per cent of their time on a stroke unit (expected to be 80 per cent by the end of 2010-11), and the percentage of higher risk TIA cases who are treated within 24 hours (60 per cent by the end of 2010-11)
Progress in improving stroke care Summary 7
Acute care is being reorganised within hospitals to deliver the key elements 9 of care that are known to improve outcomes. There have been measurable improvements since 2006, including the adoption of new technologies, but there is still room for further improvement.
National Institute for Health and Clinical Excellence (NICE) guidance recommends ¬¬
immediate admission to a specialist stroke unit to optimise outcomes. All relevant hospitals in England now have such a unit, and the proportion meeting key clinical requirements has risen to 82 per cent in 2009 from 73 per cent in 2008. The proportion of stroke patients who spend more than 90 per cent of their hospital stay on a stroke unit has increased from 51 per cent in 2006 to 59 per cent in 2008. However, in 2008, only 17 per cent of stroke patients reached the stroke unit within four hours of their arrival at hospital.
Brain imaging¬¬ to diagnose the type of stroke is critical for stroke patients and the Strategy recommends that access to scans and, where clinically appropriate, thrombolysis should be available to appropriate patients, 24 hours a day, seven days a week. By 2008 all hospitals provided access to scans, with 59 per cent of applicable patients in England given a brain scan within 24 hours, an increase from 42 per cent in 2006. Access at weekends and evenings is significantly more limited. In 2006, fewer than one in five trusts offered access to thrombolysis for at least part of the week; in 2009, two-thirds did so. The overall number of patients receiving thrombolysis more than doubled between 2007-08 to 2008-09.
Acute stroke services are currently funded via the Payment by Results tariff 10 of around £4,000 per patient episode. Most of the service reorganisation within hospitals has been achieved without additional funding per episode, apart from the uplift in April 2008 of about £800 per patient thrombolysed.
As well as reorganising stroke care within individual hospitals, the Strategy 11 requires Strategic Health Authorities to consider how best to reconfigure services to optimise access to specialist care. Whilst rural and urban areas will require different solutions, progress in reconfiguring services varies considerably across the country. The Greater Manchester and London areas have developed business cases that set out the costs and benefits of reconfiguring their services and are some way along the path to implementing these plans. Some hospitals in rural areas are now using new technologies to address geographical barriers, for example using telemedicine to enable doctors to make diagnoses and interpret scans whilst off-site.
8 Summary Progress in improving stroke care
Rehabilitation, post-hospital support and meeting longer-term care needs
Improvements in acute care are not yet matched by progress in delivering 12 more effective post-hospital support for stroke survivors, where there are barriers to joint working between the health service, social care and other services such as benefits and employment support. Patients and carers also lack good information about the services they may need and how to access them on discharge from hospital, as well as on how to prevent further strokes. Only half of stroke survivors in our survey said they were given advice on further stroke prevention on leaving hospital, and only a quarter were given information about the benefits system.
Community-based stroke-specialist rehabilitation teams, such as 13 Early Supported Discharge teams, can provide better and potentially more cost-effective outcomes than exclusively hospital-based rehabilitation for stroke patients with moderate disabilities, but currently only 36 per cent of hospitals have such teams, and there is confusion about how to fund them within the stroke tariff.
The Strategy indicates that stroke survivors should be reviewed at six weeks and 14 six months after their stroke, and annually thereafter. However, in 2008, 30 per cent of patients were not given a follow-up appointment within six weeks of discharge from hospital. Commissioners and providers are unclear how, and in which setting, the annual review process should be implemented, and what are its objectives. This is compounded by a lack of accepted outcome measures to assess the quality of long term care for stroke survivors. At least one-third of stroke patients have depression at some stage after their stroke, yet psychological support was rated the least satisfactory service in long-term care in our patient survey, with only 24 per cent of respondents rating it as good or very good.
The Department has allocated £30 million to Local Authorities to improve 15 post-hospital support for stroke survivors over two years. This has been predominantly used to increase support services commissioned from voluntary organisations. The largest national stroke charity, the Stroke Association, estimates that once their current level of services reaches full capacity, one in two eligible patients will be able to access them, compared with one in five in 2005. It is, however, difficult to assess the cost-effectiveness of long term care provision because of a lack of outcome measures and agreed standards for resourcing such services.
While the Strategy highlights the need to provide training to frontline staff 16 and those within a wider range of organisations that come into contact with stroke survivors, there are still shortcomings within some areas. For example, at least a quarter of people in residential nursing care have had a stroke, yet there is no requirement for care home staff to have training in the identification, communication, mobility and other needs of residents who have had a stroke.

Progress in improving stroke care Summary 9
prevention of stroke
The best way of reducing the human and economic costs of stroke is through 17 prevention. Stroke prevention continues to present a challenge, although improvements have been made through more targeted prescribing of statins. GPs’ levels of treatment for risk factors for stroke, such as high blood pressure and high cholesterol, have not changed since our previous report. However, GP treatment data does not include patients who are not on GPs’ registers. The Department estimates that GPs’ registers only include around 56 per cent of the total number of people with hypertension. In 2009 the Department launched the NHS Health Checks programme, a unified approach to prevention of all vascular disease, including stroke, and is now rolling it out.
Even after having a stroke, one in five people in our survey were not aware 18 that lack of exercise increased their risk of a further stroke, rising to around two in five of respondents for diabetes and atrial fibrillation (irregular heart rhythm). Guidance suggests appropriate treatment (anti-coagulation) of all people with recognised atrial fibrillation would prevent around 4,500 strokes, and 3,000 deaths per year, and do so highly cost-effectively. NICE recommends treatment with warfarin, but in 2008 only 24 per cent of stroke patients with atrial fibrillation were discharged from hospital on this treatment.
There is increased, and more properly risk-based, provision for diagnosis 19 and treatment of transient ischaemic attacks (TIAs). These indicate that the person is at significantly raised risk of having a stroke and therefore require rapid further investigation. Ninety-five per cent of trusts now offer a specialist neurovascular clinic for assessment and treatment of TIA, with the median number of clinics rising from one to three per week over the past two years. The cost of these clinics can be outweighed by their benefits in terms of prevented strokes, with one model of rapid TIA referral and treatment delivering potential savings of around £600 per patient assessed and treated2.
Value for money conclusion
The Department’s approach of developing a national stroke strategy underpinned 20 by national and local leadership, national tier 1 performance indicators, clinical audit data, a national stroke tariff and £105 million seed corn funding, has increased the priority given to stroke care. Early indications are that implementation of the strategy is also starting to deliver improved levels of service and improved outcomes. Our modelling of the likely changes in patient outcomes resulting from the changes in service organisation suggests that, since 2006, stroke patients’ chances of dying within ten years have reduced by an estimated 4 percentage points (from 71 to 67 per cent).
2 Luengo-Fernandez R, Gray AM, Rothwell PM (2009) Lancet Neurol. 8(3):235-43.
10 Summary Progress in improving stroke care
Improved patient outcomes from reductions in death and disability can be 21 quantified in terms of ‘quality-adjusted life years’ (QALYs). We estimate that the average number of QALYs per patient has increased to 2.5 from 2.3, for an increase in average per-patient cost of seven per cent in real terms (to £24,900 from £23,300). This represents an incremental cost-effectiveness ratio of £5,500 per QALY, well below the standard benchmark for assessing cost-effectiveness in healthcare of £20,000 to £30,000 per QALY gained. Moreover, there have been improvements in prevention of first and subsequent strokes, and a start has been made on delivering better post-hospital and longer term care. Hence we conclude that the actions taken by the Department since 2006 have, to date, improved value for money.
Notwithstanding these improvements, we have identified a number of significant 22 issues that still need to be addressed across the whole patient pathway and which will require the Department and the NHS to work in partnership with Local Authorities and the third sector, if the value-for-money gains achieved so far are to be sustained and the further improvements envisaged in the Strategy are to be delivered. A good practice guide, including case examples of how some of these challenges are being met locally, is available on our website at www.nao.org.uk/publications, and we commend the adoption of such good practice more widely.
Recommendations
issue: There are clear economic and patient benefits in having a fast emergency response and early access to stroke units. However, the extent to which services have been reconfigured to improve access to emergency stroke care varies considerably across the country. Some areas with the most developed service configurations have highlighted that this level of service provision may require additional investment and, as such, efforts to reconfigure services are complicated by the increasingly challenging economic climate.
Strategic Health Authorities a need to undertake, and keep under review, robust cost-benefit analyses to identify the optimum organisation of acute stroke services that balance current affordability against longer term cost-effectiveness.
The b Department of Health should consider whether ambulance trusts should use measures such as call-to-hospital time, as a way of evaluating the effectiveness of the emergency response to stroke. Primary Care Trusts, as part of their contracts with hospitals, should ensure that both individual and aggregated patient outcome data is fed back to ambulance trusts, to enable them to benchmark their performance and identify areas for improvement.
Primary Care Trusts c should require hospitals whose audit results indicate patients are not being admitted to stroke units quickly enough to demonstrate that their triage protocols minimise inappropriate stroke admissions to medical assessment units, and that stroke patients are not unnecessarily being treated on non-specialist wards as a result of poor bed management.
Progress in improving stroke care Summary 11
Strategic Health Authoritiesd should agree with their Primary Care Trusts a stroke action plan and timeline for all hospitals who are failing to achieve the expected level on their Vital Sign stroke indicators, as part of their review of quality metrics. Strategic Health Authorities, working with the Stroke Networks should agree with Primary Care Trusts whether they should operate sanctions or a reward based approach to boost compliance with the defined quality measures.
As part of the work in developing ae Best Practice Tariff for stroke, the Department of Health should review all levers within the tariff payment structure to ensure that it rewards cost-effective practices in the treatment of both strokes and TIAs.
issue: Improvements in acute care are not yet matched by progress in delivering more effective post hospital support for stroke survivors and their carers. There is a need for better joint working between health and social care, community care and care homes and other services including benefits and employment services.
The f Stroke Improvement Programme should collate and disseminate to all Stroke Networks examples of good practice in providing information to patients and carers to help them navigate the health, social care and benefits systems. Primary Care Trusts should contractually require stroke care providers to give comprehensive discharge summaries to all patients, and check that this has happened by 2012.
Stroke Networks g should work with local organisations to ensure that community-based stroke-specialist rehabilitation is available for all appropriate patients. This may involve setting out local standards for rehabilitation services based on Joint Strategic Needs Assessments, and clarifying between Primary Care Trusts and Local Authorities how services will be funded and provided. The Department of Health should provide practical guidance on how the tariff can support greater provision of community rehabilitation teams.
Theh Department of Health should work with the Stroke Improvement Programme and other stakeholders to develop, by 2012, a set of indicators of high-quality long-term stroke care, for example drawing on recent work on patient-reported outcome measures and evaluations of the Expert Patients Programme. This work should also focus on fully realising the Strategy’s requirements relating to the involvement of stroke survivors and carers in service development and review. In parallel, it should refresh the longer term care aspects of the Strategy, to develop more measurable quality markers, and set specific milestones for improvement in these areas over the next five years.
12 Summary Progress in improving stroke care
Local Authorities i and NHS organisations must begin planning, if they have not already done so, how they will sustain support services, and hence deliver value for money when the additional funding for stroke ceases after 2010-11. The Department of Health should evaluate the effectiveness of the Local Authority stroke grants during 2010-11, and Strategic Health Authorities and Stroke Networks should assist Primary Care Trusts and Local Authorities to commission appropriate longer term support services for stroke survivors and carers, building on this evidence and the priorities outlined in their Joint Strategic Needs Assessments.
Thej Department of Health should work with Skills for Care, the employer-led authority on the training needs of social care staff, to develop a programme of stroke training for care home staff, based on the stroke-specific education framework developed by the UK Forum for Stroke Training. This should develop options for integrating stroke-care qualifications and inductions into existing training frameworks. Given the prevalence of stroke survivors in care homes, the Care Quality Commission should check that the specific needs of this group of residents are being met.
issue: Preventing strokes requires a joined-up approach from a range of organisations, to target those at risk and provide them with appropriate treatment, education and information.
As part of their ‘local vision’ responses to the NHS Next Stage Review, k Strategic Health Authorities should, working with Primary Care Trusts and Stroke Networks, develop and implement strategies for managing atrial fibrillation. NICE should review whether the indicators in the Quality and Outcomes Framework for General Practitioners are supporting the delivery of its current atrial fibrillation guidance, and its guidance on recommended blood pressure and cholesterol levels.
We reiterate the recommendation made in our 2005 report that the l Department of Health should refer explicitly to stroke in relevant public health campaigns to ensure that the public and the NHS benefit by preventing more strokes.

Progress in improving stroke care part one 13
Part One
The framework for providing stroke care
This section of the report outlines how the priority, organisational structure, and 1.1 funding of stroke care has changed since our last report. Part 2 evaluates the changes in acute care and Part 3 assesses long-term care and prevention.
Funding and organising services
Stroke patients require urgent access to hospital care, including a brain scan 1.2 as soon as possible to determine the type of stroke and relevant treatment. They should spend their time in hospital in a specialist stroke unit, under the care of a multi-disciplinary team trained in dealing with needs such as difficulties with swallowing, speech and communication, and mobility. Rehabilitation should start in hospital, and may continue after discharge, and ongoing support may be required. Figure 2 overleaf summarises the stroke care pathway.
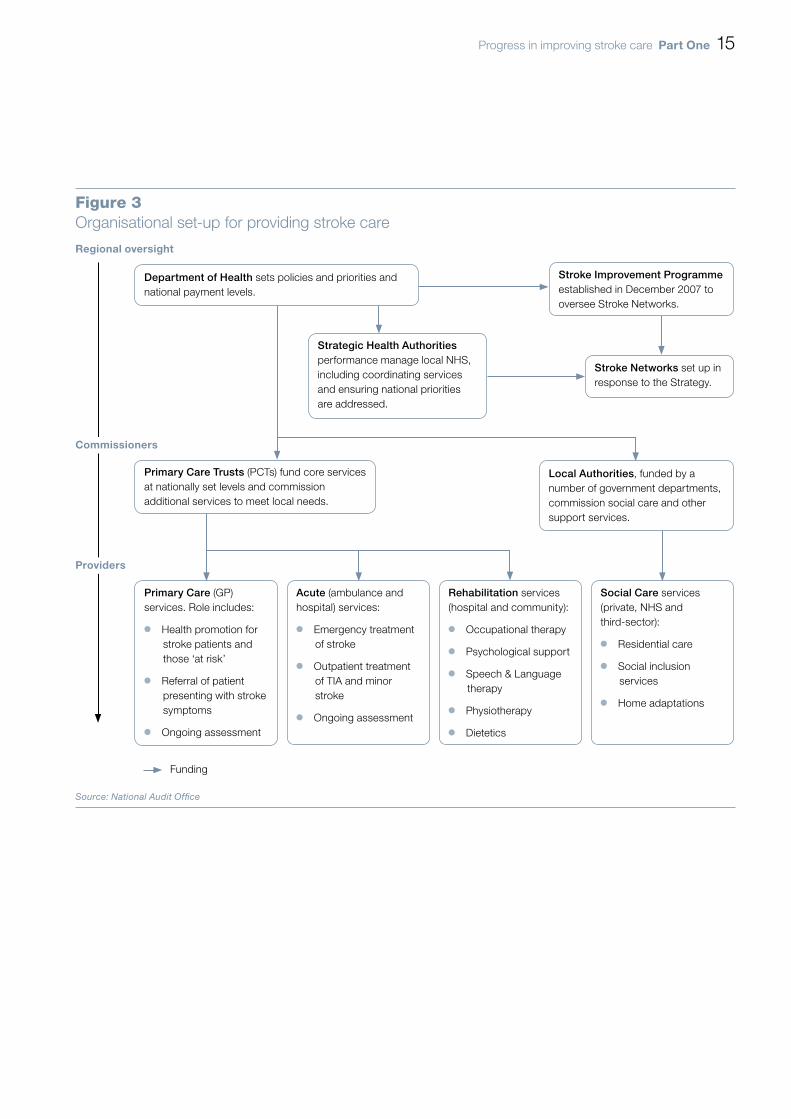
The organisational set-up for providing stroke care is shown in 1.3 Figure 3 on page 15. We estimate that, in 2008-09 terms, the direct health and social care cost of stroke within this organisational and funding framework is at least £3 billion annually, within a wider economic cost (including, for example, benefits payments and lost economic productivity) of about £8 billion.

14 part one Progress in improving stroke care
Figure 2Stroke care pathway – ‘time lost is brain lost’
First contact (e.g. GP or 999 call) should do FAST1 test. The patient goes as soon as possible to specialist stroke unit (either directly or via A&E).
CT scan as soon as possible to determine the type of stroke and whether patient is eligible for thrombolysis.
The patient should spend the rest of their time in hospital on a stroke unit – where a multi-disciplinary team work with them to support recovery (e.g. doctor, nurses, physiotherapist, occupational therapist, dietician, social worker).
On leaving hospital – rehabilitation may be continued in the community, and further support may be necessary (housing, adaptations to the home, personal care etc.)
Home with ongoing rehabilitation package, including assessment and social care
Intensive monitoring on stroke unit
Intensive rehabilitation
Community based-specialist rehab unit
999 call Category A response
CT brain scan
Thrombolysis (if needed)
Stroke
Less than three hours
Rapid one-stop service with imaging
Operation to unblock neck arteries (if required)
Management of vascular risk
Transient Ischaemic Attack2
Approximately one in six TIAs2 will have a stroke within three months
Less than 24 hours(or less than one week for lower risk cases)
Less than two weeks
Source: Department of Health adapted by National Audit Offi ce
noteS1 FAST test is used for identifying strokes.
2 Transient Ischaemic Attack (TIA) – like a stroke, but the symptoms resolve within 24 hours.
Progress in improving stroke care part one 15
Figure 3Organisational set-up for providing stroke care
Regional oversight
Primary Care (GP) services. Role includes:
Health promotion for ¬¬
stroke patients and those ‘at risk’
Referral of patient ¬¬
presenting with stroke symptoms
Ongoing assessment¬¬
Acute (ambulance and hospital) services:
Emergency treatment ¬¬
of stroke
Outpatient treatment¬¬
of TIA and minor stroke
Ongoing assessment¬¬
Rehabilitation services (hospital and community):
Occupational therapy¬¬
Psychological support¬¬
Speech & Language ¬¬
therapy
Physiotherapy¬¬
Dietetics¬¬
Social Care services (private, NHS and third-sector):
Residential care¬¬
Social inclusion ¬¬
services
Home adaptations¬¬
Commissioners
providers
Funding
Source: National Audit Offi ce
Department of Health sets policies and priorities and national payment levels.
Stroke Improvement Programme established in December 2007 to oversee Stroke Networks.
Strategic Health Authorities performance manage local NHS, including coordinating services and ensuring national priorities are addressed.
Stroke Networks set up in response to the Strategy.
Primary Care Trusts (PCTs) fund core services at nationally set levels and commission additional services to meet local needs.
Local Authorities, funded by a number of government departments, commission social care and other support services.

16 part one Progress in improving stroke care
England is now covered by 28 1.4 Stroke Networks. These Networks were established in 2008-09 as part of the Strategy, on the model of existing networks for other major diseases such as cancer and coronary heart disease, to facilitate joint working in providing stroke care. In most areas they have merged with existing cardiac networks to cover general cardio-vascular care.
Networks receive funding from Strategic Health Authorities of around £3 million 1.5 each year (an average of £107,000 per Network) with some additional funding and support from the Stroke Improvement Programme, part of the wider NHS Improvement Programme established by the Department in December 2007. Some Networks also receive further contributions from local Primary Care Trusts to fund specific initiatives. The Department has also established a Stroke Research Network, which aims to enhance and stimulate stroke research.
The Stroke Improvement Programme carried out an audit of Networks in 1.6 September 2009 to review their progress in meeting the specifications in the Strategy and, therefore, to tailor the Programme’s supportive work in the future. The audit found that most Networks are addressing all relevant requirements of the strategy. The areas requiring most development are in: fully engaging social care staff and services; supporting improvement in post-acute services; and, in some cases, further developing the involvement of stroke survivors and carers in service improvement and commissioning.
the funding allocated to deliver the Strategy
In our 2005 report we concluded that the NHS could improve stroke care by using 1.7 existing capacity more wisely. The Strategy aims to deliver better outcomes for patients and sustainable value-for-money improvements through more effective ways of working within existing funding.
Most of the service reconfiguration within hospitals to date has been achieved 1.8 without additional funding per patient episode, apart from the uplift of about £800 for those patients who are thrombolysed. For example, more patients are now receiving timely brain scanning and more stroke-specific and resource-intensive acute care (see Part 2). There have also been efficiency gains in outpatient care, for example in the organisation of TIA clinics (Case example 1, p30).
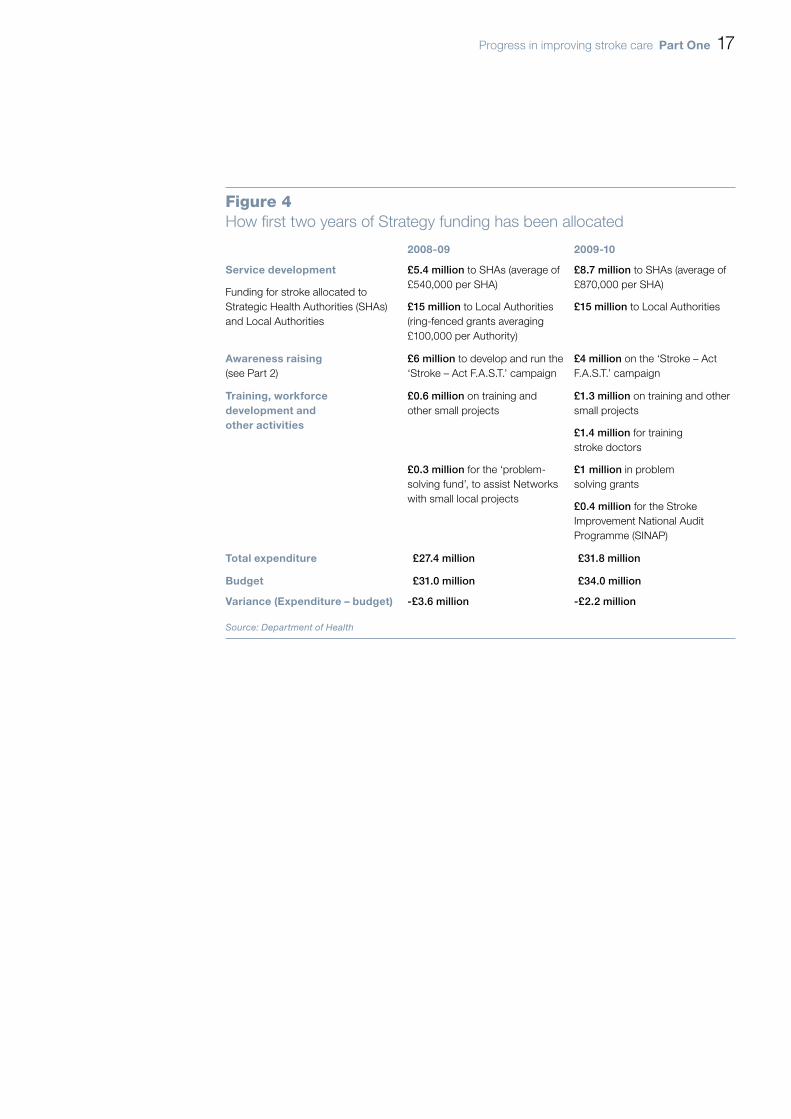
In launching the strategy in December 2007, the Department announced 1.9 additional expenditure of £105 million over three years from 2008-09 to stimulate service development. To date, about £59 million of this additional funding has been allocated (Figure 4).
Progress in improving stroke care part one 17
Figure 4How fi rst two years of Strategy funding has been allocated
2008-09 2009-10
Service development
Funding for stroke allocated to Strategic Health Authorities (SHAs) and Local Authorities
£5.4 million to SHAs (average of £540,000 per SHA)
£15 million to Local Authorities (ring-fenced grants averaging £100,000 per Authority)
£8.7 million to SHAs (average of £870,000 per SHA)
£15 million to Local Authorities
awareness raising(see Part 2)
£6 million to develop and run the ‘Stroke – Act F.A.S.T.’ campaign
£4 million on the ‘Stroke – Act F.A.S.T.’ campaign
training, workforce development and other activities
£0.6 million on training and other small projects
£0.3 million for the ‘problem-solving fund’, to assist Networks with small local projects
£1.3 million on training and other small projects
£1.4 million for training stroke doctors
£1 million in problem solving grants
£0.4 million for the Stroke Improvement National Audit Programme (SINAP)
total expenditure £27.4 million £31.8 million
budget £31.0 million £34.0 million
Variance (expenditure – budget) -£3.6 million -£2.2 million
Source: Department of Health

18 part one Progress in improving stroke care
What has been delivered for the additional funding?
Half of the ten Strategic Health Authorities have used some of the funding to 1.10 support Primary Care Trusts’ (PCTs’) moves towards making thrombolysis available to all eligible patients, through investment in equipment and developing telemedicine programmes that allow, for example, doctors to make diagnoses and interpret scans whilst off site. Four have funded training programmes for staff involved in stroke care, and four have improved local information systems. Figure 5 sets out some of the ways Strategic Health Authorities have used their stroke money.
Figure 5Regional progress on reforming Stroke Services
North East has increased working capacity, 24/7 access to radiology, and better speech and language support.
North West has introduced a new hyper-acute service configuration for Greater Manchester in 2009 at a cost of £2.8 million per year. Improvements made in early diagnosis and access to acute services. Yorkshire and Humber‘s review of the care
pathway is ongoing. Two clinical leads have been appointed and thrombolysis established.
East Midlands has recently introduced a pilot telemedicine programme to improve access to thrombolysis.
East of England has increased access to TIA clinics and provides 24/7 thrombolysis across 11 units. Improvements made in data collection and validation.
London is introducing a major service reconfiguration of hyper-acute care units, costed at £23 million annually, and due to commence in April 2010.
South East Coastal has improved access to TIA clinics and 24/7 thrombolysis. Funding has been used to provide equipment and training.
South Central has developed telemedicine and community rehabilitation.
South West has evaluated all stages of the pathway. A peer-review of skills mix and patient flow was conducted in 2009. Neuro-intensivist care was also introduced in North Bristol and Plymouth.
West Midlands has introduced 24/7 access to the hyper-acute services in Coventry, and a further four hyper-acute units provide care within the region.
Source: National Audit Office
NOTEMain improvements are those self-reported by the Strategic Health Authorities.
Progress in improving stroke care part one 19
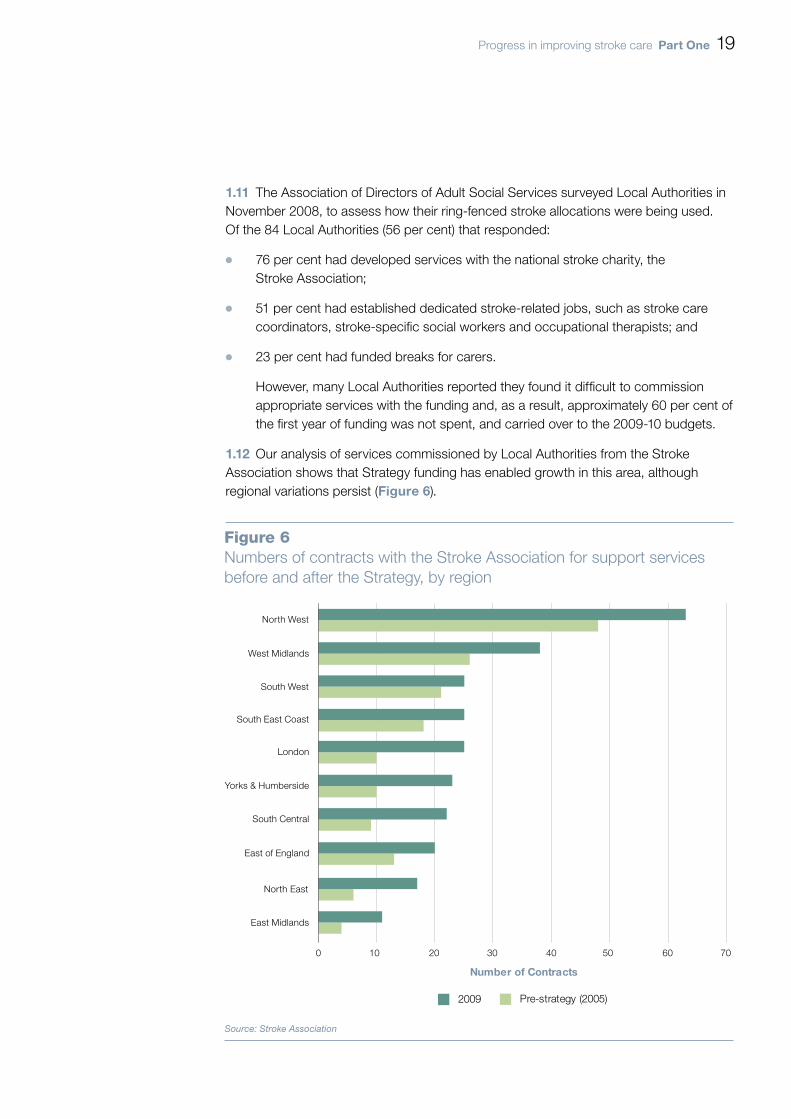
The Association of Directors of Adult Social Services surveyed Local Authorities in 1.11 November 2008, to assess how their ring-fenced stroke allocations were being used. Of the 84 Local Authorities (56 per cent) that responded:
76 per cent had developed services with the national stroke charity, the ¬¬
Stroke Association;
51 per cent had established dedicated stroke-related jobs, such as stroke care ¬¬
coordinators, stroke-specific social workers and occupational therapists; and
23 per cent had funded breaks for carers.¬¬
However, many Local Authorities reported they found it difficult to commission appropriate services with the funding and, as a result, approximately 60 per cent of the first year of funding was not spent, and carried over to the 2009-10 budgets.
Our analysis of services commissioned by Local Authorities from the Stroke 1.12 Association shows that Strategy funding has enabled growth in this area, although regional variations persist (Figure 6).
Figure 6Numbers of contracts with the Stroke Association for support services before and after the Strategy, by region
Source: Stroke Association
0 10 20 30 40 50 60 70
North West
Yorks & Humberside
North East
East Midlands
West Midlands
South West
South Central
South East Coast
East of England
London
Number of Contracts
2009 Pre-strategy (2005)

20 part one Progress in improving stroke care
Commissioning better stroke care
Following our 2005 report, the Department developed a toolkit to help improve 1.13 PCTs’ commissioning of stroke services (ASSET 1 and 2). However, we could not find evidence that it is being widely used by commissioners and, while the Department has recently updated the data underpinning the toolkit, we found it still contained some errors. In June 2009, Ministers approved a continuous data collection programme of the first 72 hours of stroke care, the Stroke Improvement National Audit Programme (SINAP), which if extended to other areas of the pathway has the potential to provide greater detail and link data between care settings.
The Strategy outlined the need to implement existing guidance on ‘unbundling’ 1.14 the national (Payment by Results) tariff for inpatient stroke care into ‘acute’ and ‘rehabilitation’ elements. Through unbundling, the tariff can be used to help fund specialist rehabilitation, such as either early supported discharge schemes, whereby patients’ hospital stays are reduced and more rehabilitation takes place in their residential settings, or stroke rehabilitation units. However, very few areas are using unbundling, and, moreover, clinical guidance suggests that rehabilitation should start immediately, rather than commencing after a few days of acute care. The Department is developing a Best Practice Tariff for stroke which aims to assist commissioners in incentivising good practice in acute care from 2010-11, with further guidance for rehabilitation services not expected until 2011-12.
A systemic barrier to improving person-centred stroke care is lack of effective joint 1.15 working between agencies. Bridging the ‘language gap’ between health and social care services is key. The former tend to categorise care provision by medical condition, and the latter by type of support needs (so that, for example, some Local Authorities told us that it was unusual to be asked to commission stroke-specific services, rather than, say, services to support communication or mobility difficulties). Only a quarter of respondents to our survey who experienced their first stroke in 2005 or later rated the level of coordination between health and social care services as good or very good in the longer term.

Progress in improving stroke care part two 21
Part Two
Treating stroke patients
awareness of the symptoms of stroke
Stroke is a medical emergency. Treatments such as thrombolysis, which can 2.1 in some cases represent the difference between being severely disabled for life and making an almost complete recovery, can only be administered within a few hours of the onset of symptoms. It is therefore vital that the general public, and health professionals such as GPs and telephone advice line nurses, are able to recognise the symptoms of stroke and know to call for an ambulance. Our modelling confirms the importance of people recognising stroke as a medical emergency and acting accordingly, estimating a 10 per cent reduction in the average time between onset of symptoms and calling an ambulance alone could allow an additional 200 patients to be thrombolysed each year.
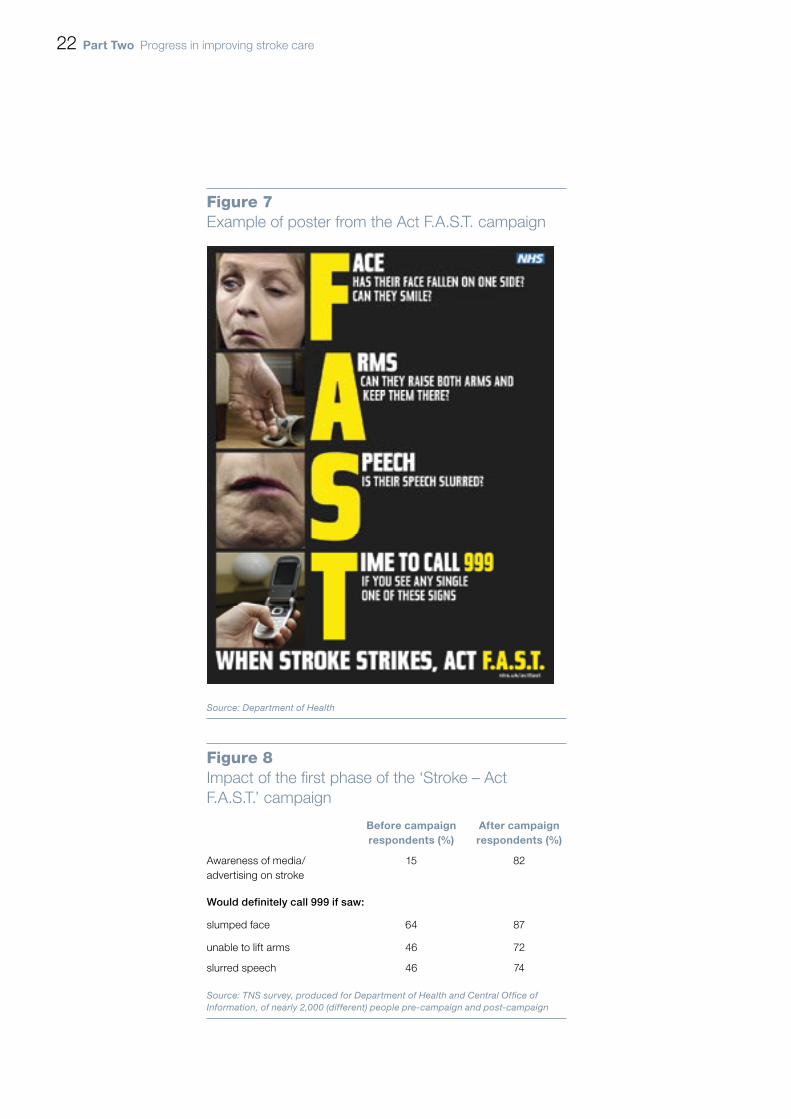
The Committee of Public Accounts recommended that the Department should 2.2 run an awareness campaign for stroke, focusing on its symptoms and the fact that it requires a 999 response. In February 2009 the Department launched its ‘Stroke – Act F.A.S.T.’ media campaign (Figure 7 overleaf), with a second phase of advertising in November 2009.
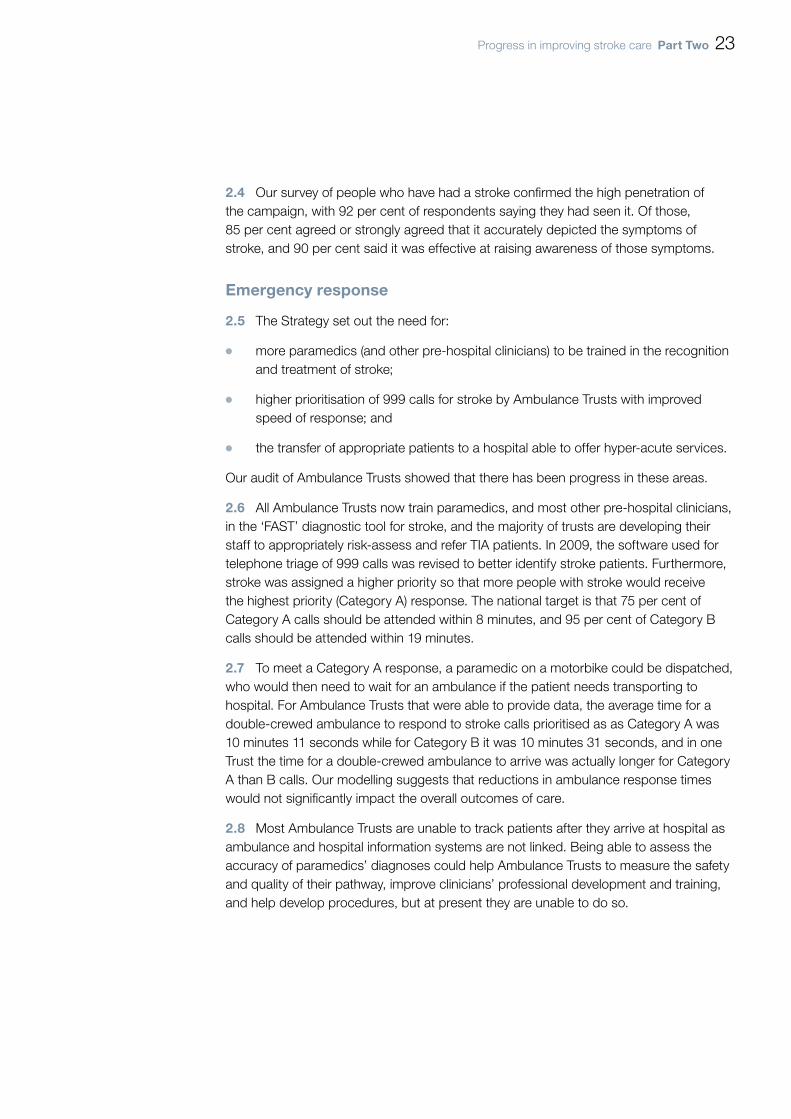
Initial indications are that the campaign has been highly successful (2.3 Figure 8 overleaf). Our audit of Ambulance Trusts showed that, for the four trusts whose data was comparable between 2008 and 2009, the number of stroke calls for the April to June period increased by 54 per cent to 10,922 from 7,079. An audit in one NHS Trust providing hyper-acute care showed the number of patients presenting within three hours having a stroke during the six-month period January to June had increased by 171 per cent between 2008 and 2009.
22 part two Progress in improving stroke care
Figure 7Example of poster from the Act F.A.S.T. campaign
Source: Department of Health
Figure 8Impact of the fi rst phase of the ‘Stroke – Act F.A.S.T.’ campaign
before campaignrespondents (%)
after campaignrespondents (%)
Awareness of media/ advertising on stroke
15 82
Would definitely call 999 if saw:
slumped face 64 87
unable to lift arms 46 72
slurred speech 46 74
Source: TNS survey, produced for Department of Health and Central Offi ce of Information, of nearly 2,000 (different) people pre-campaign and post-campaign
Progress in improving stroke care part two 23
Our survey of people who have had a stroke confirmed the high penetration of 2.4 the campaign, with 92 per cent of respondents saying they had seen it. Of those, 85 per cent agreed or strongly agreed that it accurately depicted the symptoms of stroke, and 90 per cent said it was effective at raising awareness of those symptoms.
emergency response
The Strategy set out the need for:2.5
more paramedics (and other pre-hospital clinicians) to be trained in the recognition ¬¬
and treatment of stroke;
higher prioritisation of 999 calls for stroke by Ambulance Trusts with improved ¬¬
speed of response; and
the transfer of appropriate patients to a hospital able to offer hyper-acute services. ¬¬
Our audit of Ambulance Trusts showed that there has been progress in these areas.
All Ambulance Trusts now train paramedics, and most other pre-hospital clinicians, 2.6 in the ‘FAST’ diagnostic tool for stroke, and the majority of trusts are developing their staff to appropriately risk-assess and refer TIA patients. In 2009, the software used for telephone triage of 999 calls was revised to better identify stroke patients. Furthermore, stroke was assigned a higher priority so that more people with stroke would receive the highest priority (Category A) response. The national target is that 75 per cent of Category A calls should be attended within 8 minutes, and 95 per cent of Category B calls should be attended within 19 minutes.
To meet a Category A response, a paramedic on a motorbike could be dispatched, 2.7 who would then need to wait for an ambulance if the patient needs transporting to hospital. For Ambulance Trusts that were able to provide data, the average time for a double-crewed ambulance to respond to stroke calls prioritised as as Category A was 10 minutes 11 seconds while for Category B it was 10 minutes 31 seconds, and in one Trust the time for a double-crewed ambulance to arrive was actually longer for Category A than B calls. Our modelling suggests that reductions in ambulance response times would not significantly impact the overall outcomes of care.
Most Ambulance Trusts are unable to track patients after they arrive at hospital as 2.8 ambulance and hospital information systems are not linked. Being able to assess the accuracy of paramedics’ diagnoses could help Ambulance Trusts to measure the safety and quality of their pathway, improve clinicians’ professional development and training, and help develop procedures, but at present they are unable to do so.

24 part two Progress in improving stroke care
acute hospital care
Urgent stroke care
Stroke patients need to be taken directly to a stroke unit capable of providing 2.9 hyper-acute stroke care. While more areas now have agreed pathways for urgent stroke care, not all of these units provide 24 hour hyper-acute stroke services.
In some regions, such as Greater Manchester and London, the ambulance service 2.10 can take patients directly to designated hyper-acute stroke services, which can mean that stroke patients are not always taken to the nearest hospital. This approach may not be appropriate for all regions, such as those with geographically dispersed populations and hospitals. In 2009, nearly three-quarters (72 per cent) of hospitals had arrangements with their ambulance service to transfer patients directly, compared with 16 per cent at the time of our previous report; and five per cent of sites had arrangements so that their hospital could be by-passed. Ambulance Trusts, however, report that some pathways lack clarity, including the exact timings when some non-24 hour units will accept patients and where patients may have to travel across local boundaries.
Access to a brain scan, which can reveal whether the patient is suitable for 2.11 thrombolysis, has also improved. In 2008, an estimated 59 per cent of applicable patients in England were given a brain scan within 24 hours, an increase from 42 per cent in 2006: but only one in five of those patients for whom the time of onset and scan were known had their scan within three hours of their stroke.
In April 2009, 71 per cent of hospital sites in England offered thrombolysis to stroke 2.12 patients compared to 18 per cent in 2006. The total number of patients thrombolysed in 2008-09 was more than a two-fold increase compared to the previous year – with an estimated additional 1,000 patients receiving this treatment – and approximately five-times higher than in 2006-07.
Despite these improvements in access to hyper-acute stroke care, there remain 2.13 issues with provision during evenings, nights and weekends. The proportion of patients receiving urgent scans at night and weekends is considerably lower and, by April 2009, only one in four sites provided thrombolysis at these times.
New technologies can assist in overcoming geographical or staffing constraints. A 2.14 quarter of hospitals now use telemedicine for radiology and there are now seven stroke units that report using remote video linkage for clinical assessment.
Progress in improving stroke care part two 25
Access to Stroke Units
Patients treated on specialist stroke units are more likely to survive, have fewer 2.15 complications and regain independence. Hospitals provide specialist inpatient stroke services in a number of different configurations:
acute stroke units, to provide assessment, treatment and monitoring after any ¬¬
hyper-acute care;
rehabilitation stroke units, to aid recovery; and ¬¬
combined stroke units, which provide both acute and rehabilitation care. ¬¬
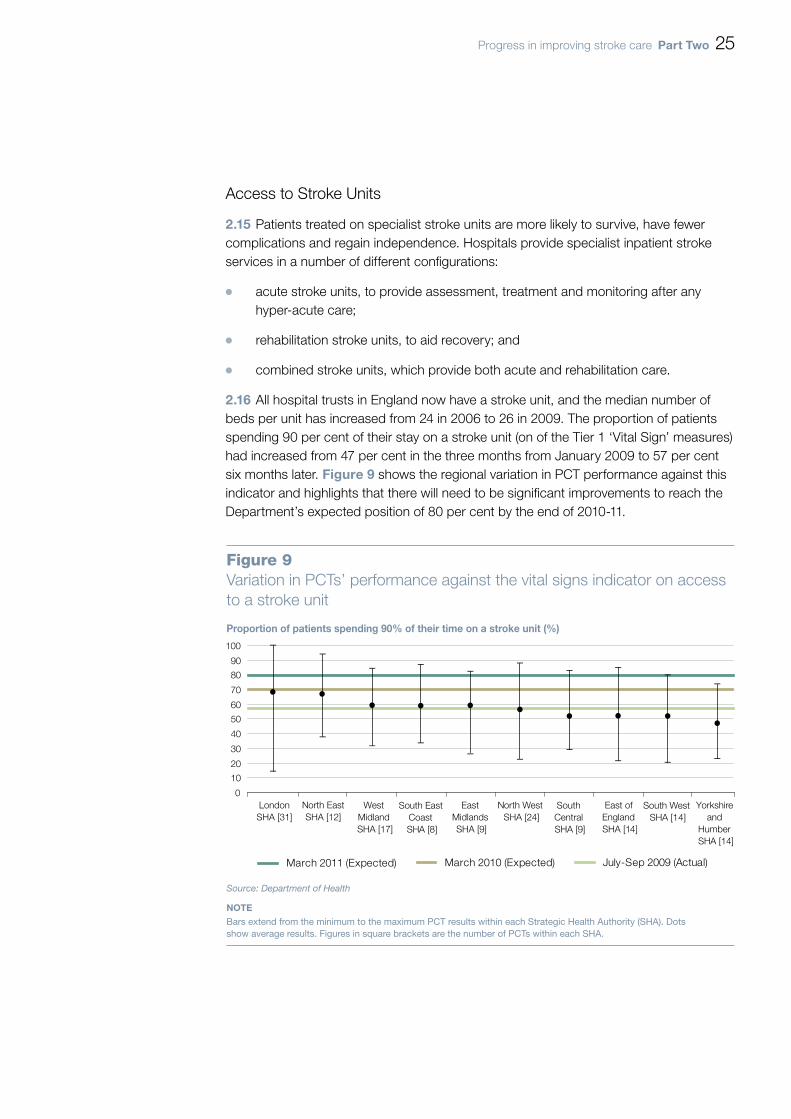
All hospital trusts in England now have a stroke unit, and the median number of 2.16 beds per unit has increased from 24 in 2006 to 26 in 2009. The proportion of patients spending 90 per cent of their stay on a stroke unit (on of the Tier 1 ‘Vital Sign’ measures) had increased from 47 per cent in the three months from January 2009 to 57 per cent six months later. Figure 9 shows the regional variation in PCT performance against this indicator and highlights that there will need to be significant improvements to reach the Department’s expected position of 80 per cent by the end of 2010-11.
Figure 9Variation in PCTs’ performance against the vital signs indicator on access to a stroke unit
Proportion of patients spending 90% of their time on a stroke unit (%)
Source: Department of Health
NOTEBars extend from the minimum to the maximum PCT results within each Strategic Health Authority (SHA). Dots show average results. Figures in square brackets are the number of PCTs within each SHA.
0
10
20
30
40
50
60
70
80
90
100
LondonSHA [31]
North EastSHA [12]
West Midland SHA [17]
South East Coast SHA [8]
East Midlands SHA [9]
North West SHA [24]
South Central SHA [9]
East of England SHA [14]
South West SHA [14]
Yorkshire and
Humber SHA [14]
March 2011 (Expected) March 2010 (Expected) July-Sep 2009 (Actual)
26 part two Progress in improving stroke care
NICE guidance states that patients should be admitted directly to a stroke unit. 2.17 In 2008, only 17 per cent of stroke patients were admitted to a stroke unit within four hours of their arrival in A&E, even though 98 per cent of all patients met the target of being admitted and then transferred or discharged from A&E within this timeframe. While almost three-quarters of hospitals report having a policy to admit patients directly onto a stroke unit, a similar proportion states that the Medical Assessment Unit is the most likely initial destination for stroke patients. We were told that this discrepancy was due to:
hospitals failing to follow their own guidelines; ¬¬
shortcomings in the bed management of stroke units; ¬¬
a persisting belief amongst some healthcare professional that some stroke patients ¬¬
do not benefit from being admitted to a stroke unit.
lack of training within A&E and Medical Assessment Units for recognising the ¬¬
symptoms of stroke; and
issues with the triage systems used in some A&E departments which may not be ¬¬
categorising stroke patients as urgent.
In 2009, 30 per cent of stroke units providing rehabilitation excluded patients with 2.18 ‘no rehabilitation potential’, a practice described by the Royal College of Physicians as “unacceptable”.
Staffing and standard of stroke units
The number of stroke consultant sessions in England has doubled from a median 2.19 of five per week per hospital site in 2006 to 10 in 2009. However, this equates to 0.9 whole-time equivalent consultants per 250,000 population: below the minimum level of two per 250,000 recommended by the British Association of Stroke Physicians (BASP). The Department has allocated £1.95 million for funding an additional 30 stroke registrar training places from 2009, and to develop and deliver training in leadership skills for stroke practitioners.
There has also been an increase in the numbers of some of the other professionals 2.20 involved in the multidisciplinary stroke unit teams Figure 10, although they remain below suggested minimum levels of staffing in some cases. In particular, there remains only limited clinical psychological support.

Progress in improving stroke care part two 27
Staffing shortfalls in areas such as clinical psychology and speech and language 2.21 therapy can be partially addressed by training other members of the stroke team to undertake appropriate tasks in these areas. For example, the clinical guidelines suggest that initial swallow screening and assessment for depression can be undertaken by any trained healthcare professional instead of a speech and language therapist and clinical psychologist, respectively.
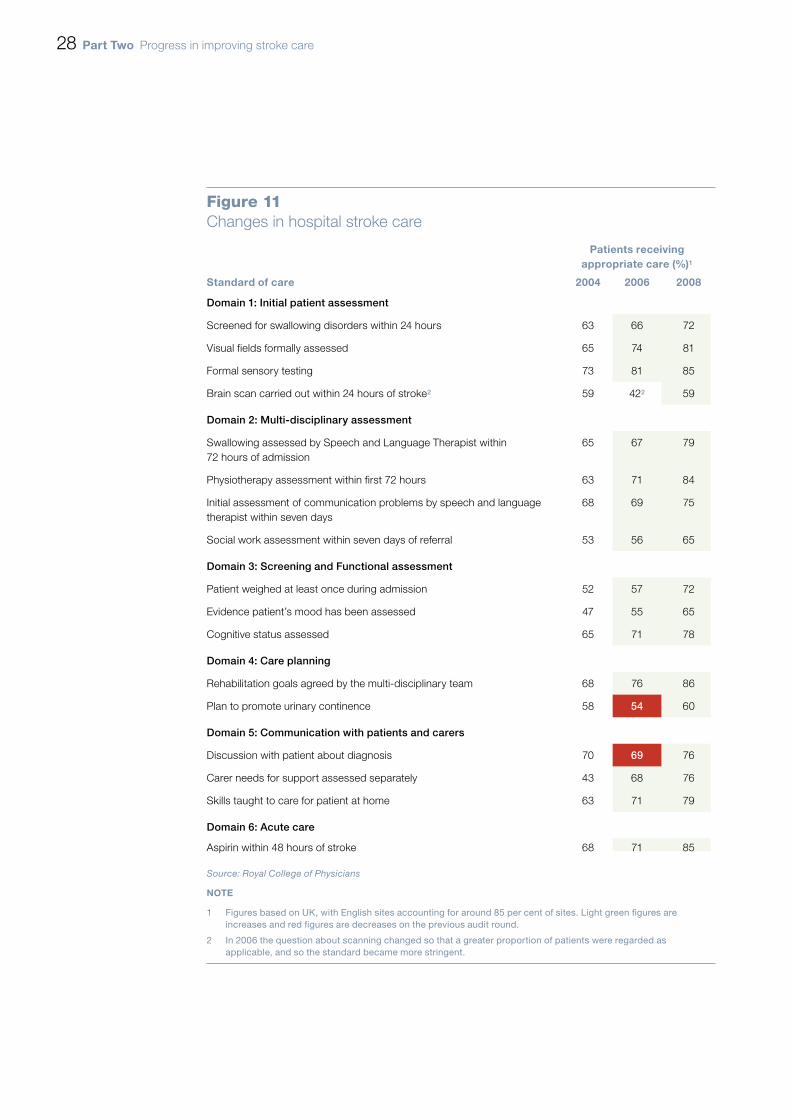
Overall, there have been improvements across key domains of quality in acute 2.22 and rehabilitative care over the last four years, as shown in Figure 11 overleaf. However, there is still variation between hospitals, and some of the levels of care remain unacceptably low, such as 40 per cent of patients with incontinence not having a plan for management.
Figure 10Number of staff on stroke units (whole-time equivalents per 10 beds)
actual staffinglevels in england
(median)
Strategystaffing
assumptions
minimum recommended
level
April 2006 April 2009 Department of Health (2007)
Australia(2008)
Nurses (trained)1 3.3 3.3 – –
Junior doctors 0.5 0.7 0.752 –
Physiotherapy 1.3 1.3 1.53 1-2
Occupational therapy 1.0 1.1 0.63 1-1.5
Speech and Language Therapists
0.3 0.4 0.8 0.6-1.2
Dietetics 0.1 0.2 – 0.3-0.5
Clinical psychology 0.0 0.0 0.4 0.3-0.5
Source: National Audit Offi ce analysis of Royal College of Physicians; Healthcare for London, Acute Stroke Service Designation October 2008; National Stroke Foundation (Australia), Acute Stroke Services Framework 2008
noteS1 Relates to number of staff on duty at a particular time per 10 bed unit. The Strategy staffi ng assumptions were
based on an establishment level of 7 whole-time equivalents per 10 beds which cannot be directly converted to the number of staff on duty at a particular time.
2 The Department’s level is for Senior House Offi cers (a subset of Junior Doctors) only.
3 The Department’s fi gures for Physiotherapy and Occupational therapy include assistant-level professionals.
28 part two Progress in improving stroke care
Figure 11Changes in hospital stroke care
patients receiving appropriate care (%)1
Standard of care 2004 2006 2008
Domain 1: Initial patient assessment
Screened for swallowing disorders within 24 hours 63 66 72
Visual fields formally assessed 65 74 81
Formal sensory testing 73 81 85
Brain scan carried out within 24 hours of stroke2 59 422 59
Domain 2: Multi-disciplinary assessment
Swallowing assessed by Speech and Language Therapist within 72 hours of admission
65 67 79
Physiotherapy assessment within first 72 hours 63 71 84
Initial assessment of communication problems by speech and language therapist within seven days
68 69 75
Social work assessment within seven days of referral 53 56 65
Domain 3: Screening and Functional assessment
Patient weighed at least once during admission 52 57 72
Evidence patient’s mood has been assessed 47 55 65
Cognitive status assessed 65 71 78
Domain 4: Care planning
Rehabilitation goals agreed by the multi-disciplinary team 68 76 86
Plan to promote urinary continence 58 54 60
Domain 5: Communication with patients and carers
Discussion with patient about diagnosis 70 69 76
Carer needs for support assessed separately 43 68 76
Skills taught to care for patient at home 63 71 79
Domain 6: Acute care
Aspirin within 48 hours of stroke 68 71 85
Source: Royal College of Physicians
note
1 Figures based on UK, with English sites accounting for around 85 per cent of sites. Light green fi gures are increases and red fi gures are decreases on the previous audit round .
2 In 2006 the question about scanning changed so that a greater proportion of patients were regarded as applicable, and so the standard became more stringent.
Progress in improving stroke care part two 29
Our patient survey suggested improvements in perceptions of hospital care, with 2.23 56 per cent of patients who had their stroke from 2005 onwards rating this aspect of care as good or very good, compared with 51 per cent of respondents who had their stroke before 2005.
Community rehabilitation
Community rehabilitation services provide rehabilitative therapies outside of the 2.24 hospital setting. One recommended model for rehabilitation, Early Supported Discharge, involves discharging some stroke patients with mild or moderate levels of disability into the care of a specialist multi-disciplinary team based in the community.
There has been an increase in the proportion of hospitals in England offering Early 2.25 Supported Discharge, from 21 per cent of sites in 2006 to 36 per cent in 2009. There remains significant variability over the make-up of such services and the maximum length of time they provide therapies.
Early Supported Discharge can reduce long-term dependency and admission 2.26 to institutional care as well as releasing hospital beds by reducing length-of-stays (the average for stroke patients has fallen from 25.4 days in 2006 to 23.7 days in 2008). Our modelling suggests that increasing the availability of Early Supported Discharge from its current level – equating to around 20 per cent of patients – to a more optimal level of 43 per cent of patients, with all stroke units providing Early Supported Discharge, would be cost-effective over a ten-year timeframe, costing about £5,800 per QALY gained.
TIA treatment
Transient Ischaemic Attacks (TIAs), which have the same signs as stroke but where 2.27 symptoms resolve within 24 hours, require a different treatment pathway. The Strategy recommends that all patients should be assessed by a specialist and treated within 24 hours or seven days, depending on their risk of a potentially preventable full stroke.
Since our 2005 report, the 2.28 ABCD2 diagnostic tool for TIA has been developed and introduced, which enables those TIA patients at higher risk of stroke to be identified and referred to specialist services. Health professionals told us that the use of this tool within ambulance and GP services remains variable.
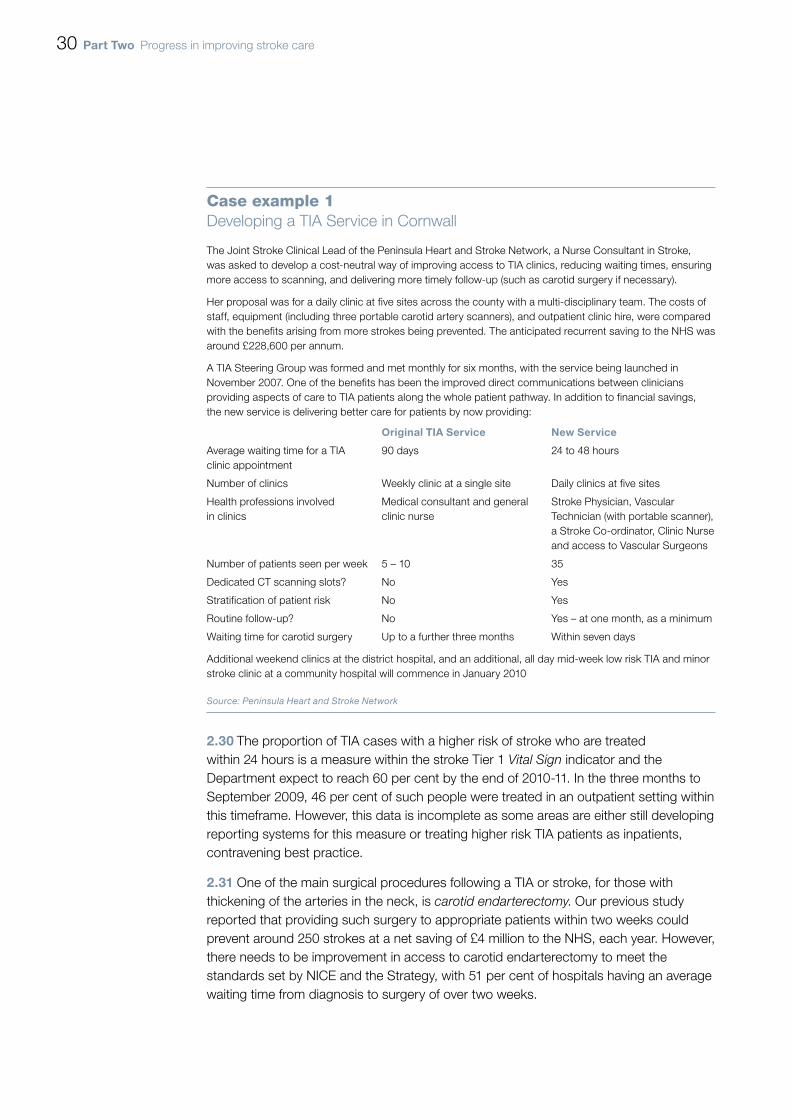
By April 2009, 95 per cent of acute trusts offered a neurovascular clinic that 2.29 could provide specialist assessment of TIA, an increase from 78 per cent since 2006. The average waiting time for an appointment has fallen from 12 days in 2006 to six days in 2009. For higher risk patients, 60 per cent of sites had systems to enable patients to be seen and investigated, and treatment to be initiated within 24 hours of referral. Better-organised TIA services can result in efficiency improvements, as shown in Case example 1 overleaf.
30 part two Progress in improving stroke care
The proportion of TIA cases with a higher risk of stroke who are treated 2.30 within 24 hours is a measure within the stroke Tier 1 Vital Sign indicator and the Department expect to reach 60 per cent by the end of 2010-11. In the three months to September 2009, 46 per cent of such people were treated in an outpatient setting within this timeframe. However, this data is incomplete as some areas are either still developing reporting systems for this measure or treating higher risk TIA patients as inpatients, contravening best practice.
One of the main surgical procedures following a TIA or stroke, for those with 2.31 thickening of the arteries in the neck, is carotid endarterectomy. Our previous study reported that providing such surgery to appropriate patients within two weeks could prevent around 250 strokes at a net saving of £4 million to the NHS, each year. However, there needs to be improvement in access to carotid endarterectomy to meet the standards set by NICE and the Strategy, with 51 per cent of hospitals having an average waiting time from diagnosis to surgery of over two weeks.
Case example 1Developing a TIA Service in Cornwall
The Joint Stroke Clinical Lead of the Peninsula Heart and Stroke Network, a Nurse Consultant in Stroke, was asked to develop a cost-neutral way of improving access to TIA clinics, reducing waiting times, ensuring more access to scanning, and delivering more timely follow-up (such as carotid surgery if necessary).
Her proposal was for a daily clinic at five sites across the county with a multi-disciplinary team. The costs of staff, equipment (including three portable carotid artery scanners), and outpatient clinic hire, were compared with the benefits arising from more strokes being prevented. The anticipated recurrent saving to the NHS was around £228,600 per annum.
A TIA Steering Group was formed and met monthly for six months, with the service being launched in November 2007. One of the benefits has been the improved direct communications between clinicians providing aspects of care to TIA patients along the whole patient pathway. In addition to financial savings, the new service is delivering better care for patients by now providing:
original tia Service new Service
Average waiting time for a TIA clinic appointment
90 days 24 to 48 hours
Number of clinics Weekly clinic at a single site Daily clinics at five sites
Health professions involved in clinics
Medical consultant and general clinic nurse
Stroke Physician, Vascular Technician (with portable scanner), a Stroke Co-ordinator, Clinic Nurse and access to Vascular Surgeons
Number of patients seen per week 5 – 10 35
Dedicated CT scanning slots? No Yes
Stratification of patient risk No Yes
Routine follow-up? No Yes – at one month, as a minimum
Waiting time for carotid surgery Up to a further three months Within seven days
Additional weekend clinics at the district hospital, and an additional, all day mid-week low risk TIA and minor stroke clinic at a community hospital will commence in January 2010
Source: Peninsula Heart and Stroke Network
Progress in improving stroke care part three 31
Part Three
Supporting stroke survivors and preventing strokes
the importance of post-hospital stroke care
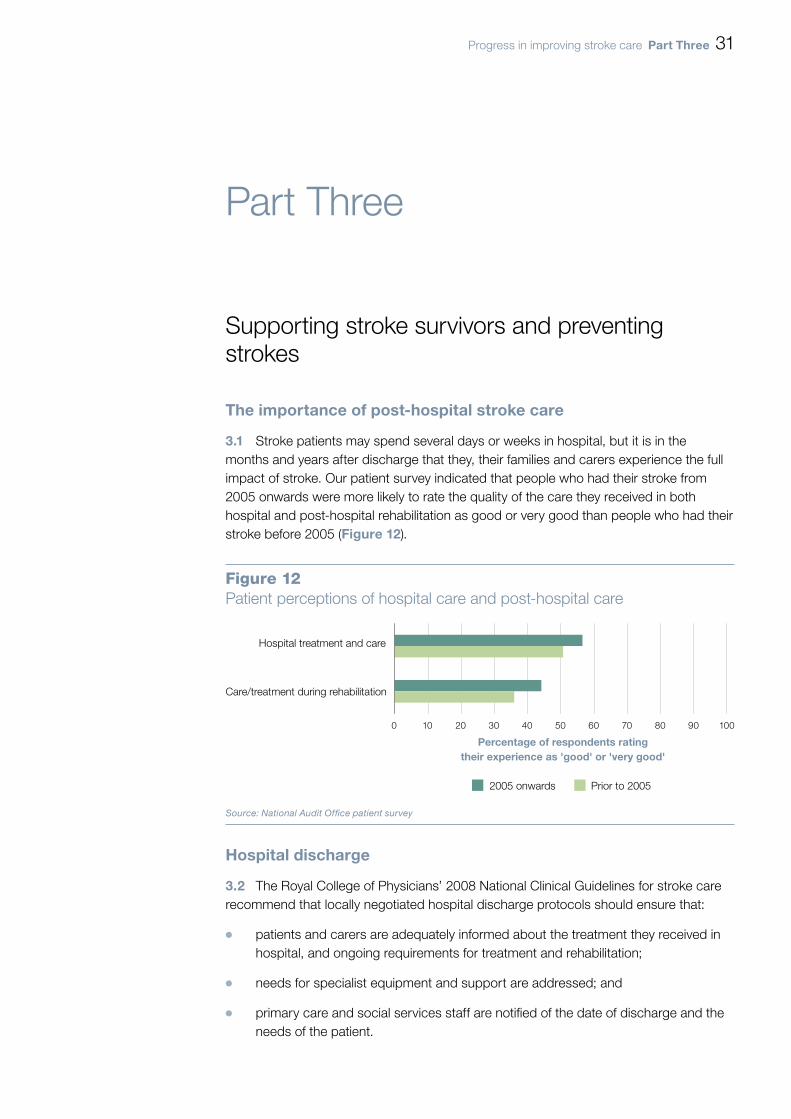
Stroke patients may spend several days or weeks in hospital, but it is in the 3.1 months and years after discharge that they, their families and carers experience the full impact of stroke. Our patient survey indicated that people who had their stroke from 2005 onwards were more likely to rate the quality of the care they received in both hospital and post-hospital rehabilitation as good or very good than people who had their stroke before 2005 (Figure 12).
Hospital discharge
The Royal College of Physicians’ 2008 National Clinical Guidelines for stroke care 3.2 recommend that locally negotiated hospital discharge protocols should ensure that:
patients and carers are adequately informed about the treatment they received in ¬¬
hospital, and ongoing requirements for treatment and rehabilitation;
needs for specialist equipment and support are addressed; and¬¬
primary care and social services staff are notified of the date of discharge and the ¬¬
needs of the patient.
Figure 12Patient perceptions of hospital care and post-hospital care
Hospital treatment and care
Care/treatment during rehabilitation
0 10 20 30 40 50 60 70 80 90 100
2005 onwards Prior to 2005
Percentage of respondents ratingtheir experience as 'good' or 'very good'
Source: National Audit Office patient survey

32 part three Progress in improving stroke care
Hospital discharge summaries include information on the type of hospital treatment 3.3 administered and the progress made. In 2009, however, nearly one-third of patients were not given their discharge summaries, and only two-thirds of hospitals had a policy of giving patients a named contact upon transfer of care from the hospital to the community. Moreover, our survey shows that, while there is a general increase in satisfaction from respondents who had their stroke prior to 2005 compared with those that had theirs since, patients still do not feel that they were informed effectively about many post-hospital needs (Figure 13).
Figure 13Information received on discharge (percentage of patients and carers)
0 10 20 30 40 50 60
Source: National Audit Office patient survey
Advice on where to obtain care from the private sector
Contact details about transport (rural areas)
24-hour helpline
Contact details for carers to get support/training
Information about the benefits system
Contact details of the nearest stroke support group
Advice following a social service assessment
Advice and guidance about practical matters
Advice on diet and nutrition
Contact details of the care/rehabilitation team
Advice on further stroke prevention
2005 onwards Prior to 2005
Percentage
Progress in improving stroke care part three 33
ongoing monitoring and support of stroke patients after discharge
The Strategy states that patients should be offered a review of their health and 3.4 social care status and secondary prevention needs within six weeks of discharge, and again within six months after leaving hospital. This should be followed by an annual health and social care check, providing access to further specialist review, advice, information, support and rehabilitation where required.
The Royal College of Physicians’ 2008 clinical stroke audit found that 30 per cent 3.5 of patients were not given a follow-up appointment within six weeks of discharge from hospital. Almost a third of respondents to our patient survey who had their stroke from 2005 onwards said they had to wait more than five weeks to see a rehabilitation worker, with 14 per cent saying they waited more than 12 weeks.
We found variations in approaches to these reviews and a lack of clarity about 3.6 who should lead them, their objectives, where they are recorded, the role of patients’ GPs in the reviews, and how they were implemented. There is no data available on the proportion of patients who have had six-month and annual follow-up appointments.
An important part of the ongoing monitoring and support of stroke patients after 3.7 discharge is prevention of further vascular events. Once a person has an acute stroke, the risk of having another event within the next five years is between 30 and 40 per cent, and given that the risk of a second TIA or stroke may be as high as 20 per cent within the first week of an event, secondary prevention should start as soon as possible.
GPs play an important part in secondary prevention, and data from the 3.8 Quality and Outcomes Framework (QOF), which rewards GP practices performance against a range of measures and accounts for about 15 per cent of practices’ income, shows that – for the areas covered within the Framework – more stroke patients are receiving preventative services such as blood pressure and cholesterol control within the primary care setting than at the time of our previous report (Figure 14 overleaf).
However, more needs to be done to ensure that stroke survivors and their carers 3.9 know how to reduce their risk of further strokes. One in five respondents to our patient survey were not aware that lack of exercise increased their risk of stroke, rising to over a third (37 per cent) of respondents regarding diabetes and 44 per cent for atrial fibrillation.

34 part three Progress in improving stroke care
longer term care and support
There is a lack of research-based evidence on the benefits and costs of clinical 3.10 and other support for long-term stroke care. The National Clinical Guidelines include more than 400 recommendations, but only 16 cover the care given to patients more than six months after the stroke. In particular, clinical evidence on the effectiveness of rehabilitative therapies a year or more after a stroke is lacking. One of the top three suggestions for improving outcomes from stroke care that patients and carers in our survey made was to provide physiotherapy for longer after a stroke; but commissioners told us that there was insufficient evidence available to them to be able to conclude on the relative benefits and costs of, for example, longer term provision of speech and language therapy, occupational therapy or physiotherapy.
Figure 14GP performance on QOF stroke indicators
Average proportion of points received per practice (%)
70
75
80
85
90
95
100
2004-05 2005-06 2006-07 2007-08 2008-09
Stroke Indicator 2 (2004-06) & 11 (2006-08) & 13 (2008-)
Stroke Indicator 4 (2004-06)
Stroke Indicator 6
Stroke Indicator 7
Stroke Indicator 8
Stroke Indicator 9 (2004-06) & 12 (2006-09)
Source: Department of Health
NOTEThe indicators relate to, for example, the referral of patients for further investigation scanning (indicator 2/11/13), and management of blood pressure (6) and cholesterol (7 and 8). Further details are included in our online methodology, available at: www.nao.org.uk/publications.
Progress in improving stroke care part three 35
Patients’ views on the quality of longer-term care services were variable 3.11 (Figure 15 overleaf). At least one-third of stroke patients are subject to depression at some stage after their stroke. Yet as Figure 15 shows, psychological support was rated the least satisfactory service in long-term care, with only 24 per cent of respondents rating it as good or very good.
In our 2005 report we recommended that the Department should work more 3.12 closely with the voluntary sector to improve long-term support and service provision. Many Local Authorities have now used their stroke grants to commission stroke support services from the voluntary sector. For example, Local Authorities had 268 contracts with the Stroke Association, to provide information, advice and support to stroke survivors, families and carers in 2009 compared with 164 in 2005 (Figure 16 overleaf). The Stroke Association estimates that in 2005, one in five stroke patients were referred to their services, but at current levels, one in every two eligible patients were able to access them.
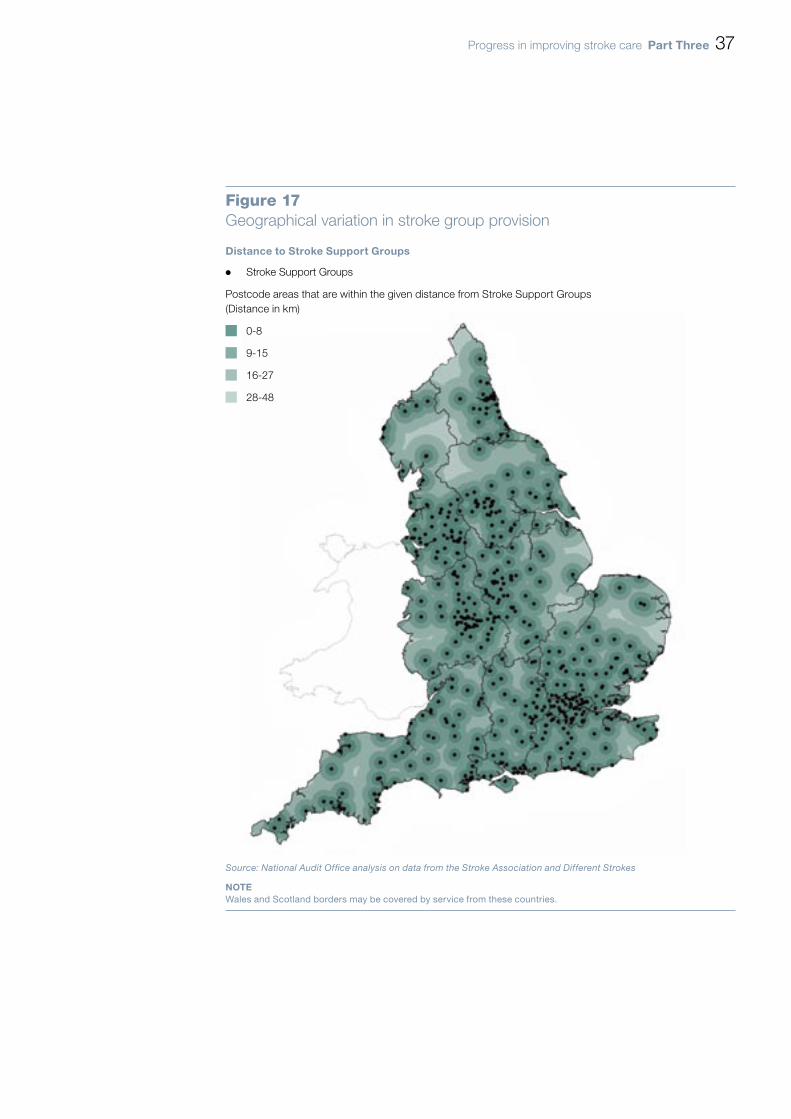
Such access may not be uniform across the country, however. Many patients 3.13 have severe mobility issues after a stroke, and are unable to travel to long term support services independently. This can pose particular problems in more rural areas, where distances are greater and it can be more difficult to recruit volunteers and staff. Figure 17 on page 37 shows that people living in the North and East of the country, in particular, still have limited access to stroke support groups. There are approximately 660,000 households, including 390,000 in rural areas, further than 20 km (as the crow flies) from a stroke support group3.
3 Excluding those households within 20km of the Welsh and Scottish borders.

36 part three Progress in improving stroke care
Figure 16Change in the number of Stroke Association contracts in England before and after the Strategy by type
Source: Stroke Association
0 50 100 150 200 250 300
Other
Prevention
Information, Advice & Support
Back to Life
Communication Support
Long-term support
Total
Number of Contracts
2009 Pre-strategy
Figure 15How patients rate longer-term care services
0 10 20 30 40 50 60 70 80 90 100
Percentage
Personal care support in my home [278]
Ongoing physiotherapy [307]
Ongoing speech therapy [206]
Out-patient appointments with the strokedoctor [405]
Help returning to work [96]
Psychological support [172]
Very good Good Fair Poor Very poor
Regular monitoring to prevent further strokes [470 respondents]
Regular review of my personal care plan witha social care provider/stroke coordinator [260]
Source: National Audit Office patient survey
Progress in improving stroke care part three 37
Figure 17Geographical variation in stroke group provision
Distance to Stroke Support Groups
¬ Stroke Support Groups
Postcode areas that are within the given distance from Stroke Support Groups (Distance in km)
0-8
9-15
16-27
28-48
Source: National Audit Office analysis on data from the Stroke Association and Different Strokes
noteWales and Scotland borders may be covered by service from these countries.
38 part three Progress in improving stroke care
Carers
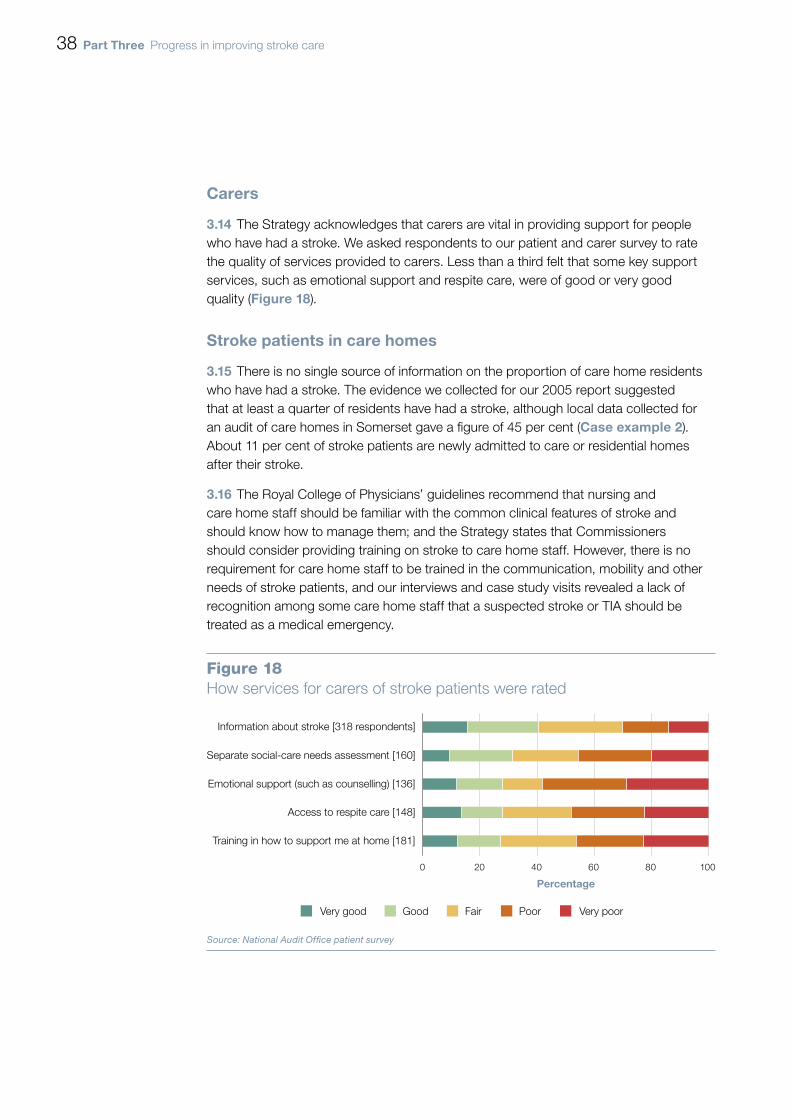
The Strategy acknowledges that carers are vital in providing support for people 3.14 who have had a stroke. We asked respondents to our patient and carer survey to rate the quality of services provided to carers. Less than a third felt that some key support services, such as emotional support and respite care, were of good or very good quality (Figure 18).
Stroke patients in care homes
There is no single source of information on the proportion of care home residents 3.15 who have had a stroke. The evidence we collected for our 2005 report suggested that at least a quarter of residents have had a stroke, although local data collected for an audit of care homes in Somerset gave a figure of 45 per cent (Case example 2). About 11 per cent of stroke patients are newly admitted to care or residential homes after their stroke.
The Royal College of Physicians’ guidelines recommend that nursing and 3.16 care home staff should be familiar with the common clinical features of stroke and should know how to manage them; and the Strategy states that Commissioners should consider providing training on stroke to care home staff. However, there is no requirement for care home staff to be trained in the communication, mobility and other needs of stroke patients, and our interviews and case study visits revealed a lack of recognition among some care home staff that a suspected stroke or TIA should be treated as a medical emergency.
Figure 18How services for carers of stroke patients were rated
0 20 40 60 80 100
Percentage
Very good Good Fair Poor Very poor
Source: National Audit Office patient survey
Information about stroke [318 respondents]
Separate social-care needs assessment [160]
Emotional support (such as counselling) [136]
Access to respite care [148]
Training in how to support me at home [181]
Progress in improving stroke care part three 39
preventing more strokes
The best way of improving the value for money of stroke care is by preventing 3.17 strokes from occurring. Reducing stroke incidence requires managing the risk factors common to all vascular disease (stroke, diabetes, heart and kidney disease), including high blood pressure and cholesterol, smoking, unhealthy diet and lack of exercise. In March 2009 the Department announced a unified approach to the prevention of vascular disease through the introduction of the NHS Health Checks where everyone aged between 40 and 74 will be risk-assessed and, where appropriate, given information, access to services and treatment. Full rollout of the programme is expected by 2012-13, subject to the next spending review.
GPs play an important role in managing key risk factors associated with stroke. 3.18 The Quality and Outcomes Framework rewards general practices for managing blood pressure, obesity, cholesterol levels and providing advice on smoking cessation. Figure 19 overleaf shows that, since our previous report, GPs’ management of high blood pressure (hypertension) and atrial fibrillation within the Framework remains steady. However, this data does not include patients who are not on GPs’ registers, with the Department estimating that, for instance, GP registers only include around 56 per cent of the total estimated number of people with hypertension.
Case example 2Improving stroke care in nursing homes in Somerset PCT
An audit of care homes in the area showed 45 per cent of 457 residents included had had a stroke. A spot-check conducted in a particular care home revealed that no member of staff had received any stroke-specific training, and staff were unable to meet basic stroke specific needs, such as: management of pain; management of swallowing and communication problems; and identification of risk factors for stroke.
In response, the PCT’s Stroke Coordinator initiated a rolling programme of visits to each of the registered care homes, carrying out periodic reviews for newly-admitted stroke survivors, six weeks and six months after admission, with yearly reviews carried out for all stroke patients. These reviews usually involved a member of a newly formed community multidisciplinary team. The Coordinator also ran support and training sessions for care home staff on appropriate stroke care practices. Further, Somerset PCT organised stroke training sessions and the opportunity for some staff to spend time in acute stroke units to observe good practice first hand.
A survey of nursing home matrons conducted in January 2007 found that all responders believed the stroke coordinator:
enabled patients to receive more effective treatment and specialist care; ¬¬
was a useful resource about care and treatment of stroke patients; and¬¬
had improved links between Somerset PCT stroke service and the private sector.¬¬
Source: Somerset PCT
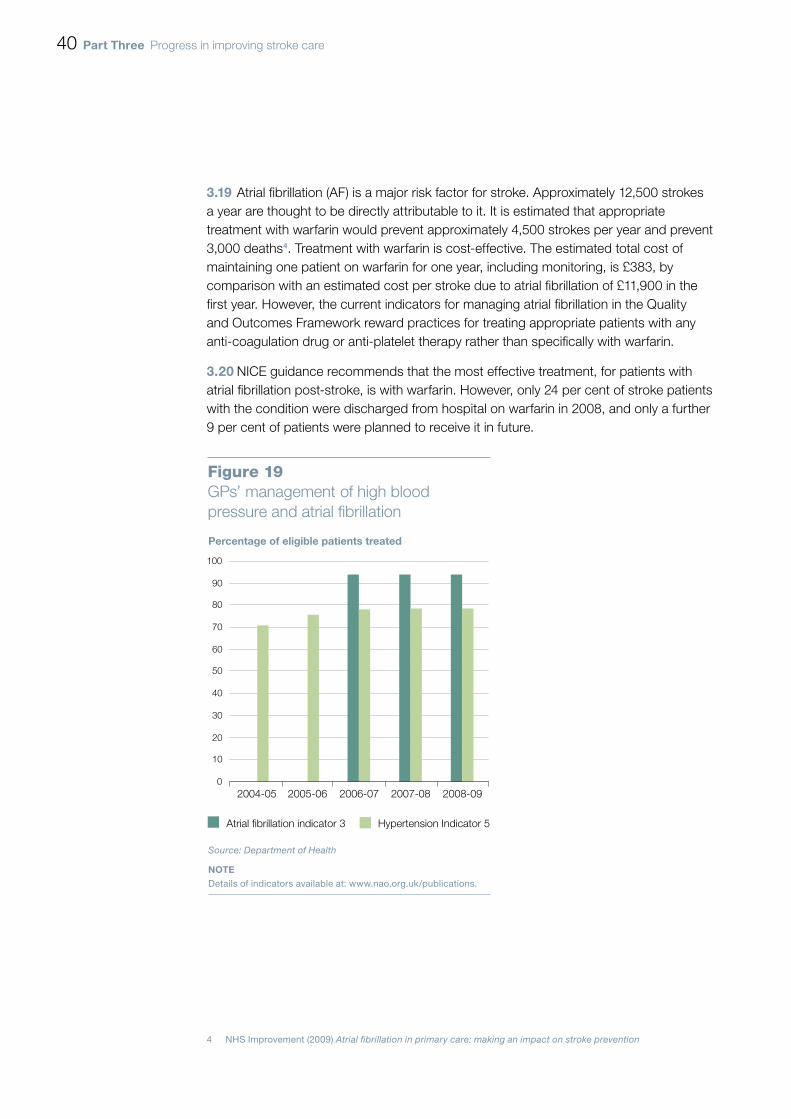
40 part three Progress in improving stroke care
Atrial fibrillation (AF) is a major risk factor for stroke. Approximately 12,500 strokes 3.19 a year are thought to be directly attributable to it. It is estimated that appropriate treatment with warfarin would prevent approximately 4,500 strokes per year and prevent 3,000 deaths4. Treatment with warfarin is cost-effective. The estimated total cost of maintaining one patient on warfarin for one year, including monitoring, is £383, by comparison with an estimated cost per stroke due to atrial fibrillation of £11,900 in the first year. However, the current indicators for managing atrial fibrillation in the Quality and Outcomes Framework reward practices for treating appropriate patients with any anti-coagulation drug or anti-platelet therapy rather than specifically with warfarin.
NICE guidance recommends that the most effective treatment, for patients with 3.20 atrial fibrillation post-stroke, is with warfarin. However, only 24 per cent of stroke patients with the condition were discharged from hospital on warfarin in 2008, and only a further 9 per cent of patients were planned to receive it in future.
4 NHS Improvement (2009) Atrial fibrillation in primary care: making an impact on stroke prevention
Figure 19GPs’ management of high blood pressure and atrial fibrillation
Source: Department of Health
NOTE Details of indicators available at: www.nao.org.uk/publications.
0
10
20
30
40
50
60
70
80
90
100
2004-05 2005-06 2006-07 2007-08 2008-09
Percentage of eligible patients treated
Atrial fibrillation indicator 3 Hypertension Indicator 5

Progress in improving stroke care part three 41
There are also differences between the benchmark figures for optimal blood 3.21 pressure and cholesterol levels quoted in current NICE guidance and those in the Framework. These differences may arise in part because there are necessarily differences between what is recommended as best practice for treating individual patients, and what is appropriate, realistic and measurable for a population of patients. NICE now has responsibility for recommending evidence-based indicators for the Framework, and could therefore review whether these are in step with current guidance.
We identified some successful examples of local initiatives using opportunistic 3.22 screening to identify people with high blood pressure and atrial fibrillation. This work has historically been the responsibility of primary care services, but opportunistic screening is increasingly being supported by other organisations such as ambulance trusts and charities through, for example, the national Know your Blood Pressure day.

42 appendix one Progress in improving stroke care
Appendix One
Methodology
The main elements of our fieldwork, which took place between April and October 2009, are summarised 1 below. A more detailed methodology is available at: www.nao.org.uk/publications
method Description
Review of existing documents We reviewed key policy documents, academic research, and clinical guidelines.
Structured interviews and data collection from ambulance trusts1
Structured telephone interviews with all 12 NHS Ambulance Trusts in England. Supplementary data was collected from 11 of the respondents.
Structured interviews and data collection from Strategic Health Authorities (SHAs)1
Semi-structured interviews and data collection from all ten SHAs in England.
Audit of hospital trusts (National Sentinel Stroke Audit)1
We commissioned the Royal College of Physicians to re-run their biennial survey of organisational aspects of stroke care in 2009. All 188 hospital sites in England responded. We also ran additional analyses on the clinical data collected in 2008.
Patient experience survey1 We commissioned Patient View to collect information on stroke patients’ experiences. An initial questionnaire was sent out to 46 patient groups with a second survey completed by 760 stroke patients and carers in England.
Case studies We visited stroke services in London, Manchester, the North East and South West. Stakeholders interviewed included PCTs, SHAs, Local Authority commissioners, stroke patients and their carers, third sector support services and healthcare professionals. We also interviewed other stakeholders across England.
Review of services and contracts from thirdsector providers
We collected data on services supplied by the Stroke Association and other third sector organisations across the country.
Economic modelling1 We developed a discrete-event simulation model of the stroke pathway to assess the extent to which changes in provision affect costs and outcomes.
The value of the improvements in reduced death and disability can be quantified in terms of the number of ‘quality-adjusted life years’ (QALYs) added to each patient. The cost-effectiveness can then be calculated by dividing the additional cost (£) of providing these services by the total number of QALYs gained. We informed our overall value for money conclusion by comparing our calculation of cost-effectiveness to the standard benchmark (of £20,000 to £30,000 per QALY), with lower numbers representing better value for money.
Survey of Stroke Networks The Stroke Improvement Programme ran a survey of all Stroke Networks to determine the progress they had made against their objectives set out in the Strategy. The full report from the audit will be published on the Stroke Improvement Programme website: www.improvement.nhs.uk/stroke.
1 Separate reports on these methods are available on our website, at www.nao.org.uk/publications

Progress in improving stroke care appendix two 43
Appendix Two
Progress against PAC recommendations
main public accounts Committee Recommendations progress made to date
The Department of Health (the Department) should work with the Healthcare Commission and the Royal College of Physicians to develop benchmarks for stroke care – for example, the proportion of suspected stroke patients receiving a brain scan within three hours, or the proportion of stroke patients being treated on a stroke unit.
The proportion of patients who spend at least 90 per cent of their time on a stroke unit (expected to be 80 per cent by end of 2010-11) and the percentage of higher risk TIA cases who are treated within 24 hours (60 per cent by end of 2010-11) are now a Tier 1 Vital Sign in the NHS Operating Framework (paragraph 5).
All suspected stroke patients should be scanned as soon as possible after arrival at the acute hospital, ideally within three hours, and none should wait more than 24 hours for a scan. All Accident and Emergency and Radiology departments should have protocols in place for the rapid admittance and referral for scanning of stroke patients.
Currently 57 per cent of stroke patients are scanned within 24 hours; and only 17 per cent of stroke patients are admitted to a stroke unit within four hours of arrival at hospital (paragraphs 9, 2.11 and 2.12). The National Institute for Health and Clinical Excellence now recommends that stroke patients should be scanned immediately, for urgent cases, or within a maximum of 24 hours after onset.
The limited number of health professionals with training in stroke is a barrier to providing high quality acute care and rehabilitation. Future workforce planning targets should enable the NHS to move to a position where there are as many stroke consultants per patient as heart disease consultants per patient.
There has been some progress in improving staffing levels for stroke care (paragraphs 2.19-2.21), although recommended levels have not yet been reached. The Department has allocated £1.95 million to fund an additional 30 stroke registrar training posts from 2009 onwards (paragraph 2.19).
The Department should train stroke consultants to interpret scans and make immediate treatment decisions. It should also continue to develop its telemedicine programme so that, by 2007, staff managing stroke patients can access neuro-radiological expertise remotely.
Extra training has been made available for stroke consultants to interpret scans. A quarter of hospitals now use telemedicine for radiology and seven units use remote video linkage for clinical assessment, however few areas have formally commissioned arrangements (paragraph 2.14).
The Department needs to communicate clear guidelines for an acceptable stroke unit and Primary Care Trusts should deliver acute stroke care through stroke units that meet these guidelines. The Department should set challenging targets to improve the proportion of patients treated on a stroke unit.
The Vital Signs stroke unit measure requires PCTs to publish benchmark information on the proportion of stroke patients spending at least 90 per cent of their time on a stroke unit (paragraph 5).
All providers of primary and secondary care should have protocols in place for the referral of suspected or confirmed TIA patients. The indicator in the Quality and Outcome Framework for assessing GP practices performance which states "referral for a scan" should be amended to reflect the time bound element in the above protocol.
Risk-scoring for TIAs has been introduced, and the proportion of higher risk TIAs referred within 24 hours is a Tier 1 Vital Sign. There is scope for better alignment of the Quality and Outcomes Framework and official stroke guidelines (paragraph 3.21).
TIA patients with diagnosed stenosis should not have to wait longer than 14 days after their TIA for surgery.
Currently more than 51 per cent of sites have an average waiting time from diagnosis to surgery of over two weeks (paragraph 2.31).

44 appendix two Progress in improving stroke care
main public accounts Committee Recommendations progress made to date
The Department should run an awareness campaign for stroke, focusing on its symptoms and the fact that it is a medical emergency requiring a 999 response. It should consider particularly how to engage with groups at higher risk of stroke, such as people of Afro-Caribbean and South Asian ethnicity.
The Department has developed and run the ‘Stroke – Act F.A.S.T.’ campaign, which has successfully raised awareness of the symptoms of stroke and has led to an increase in the number of stroke-related 999 calls (paragraphs 2.2-2.4).
The Department should improve the provision of information to stroke carers. Community services should be improved. The Department should take into account the needs of stroke survivors who live on their own, and may be particularly vulnerable to being overlooked by health and social care services.
Further work is required to improve information provision (paragraphs 3.2-3.7).
The Department should evaluate the merits of Early Supported Discharge initiatives and other ways of improving access to therapies, and promote the early adoption of those that can be shown to reduce hospital stay and improve patients’ chance of recovery.
There has been an increase in the proportion of hospitals in England offering Early Supported Discharge services (paragraph 2.25), although there is scope for further improvement here (paragraph 2.26).

Design and Production byNAO Marketing & Communications TeamDP Ref: 008974-001
This report has been printed on Consort 155 and contains material sourced from responsibly managed and sustainable forests certified in accordance with FSC (Forest Stewardship Council).
The wood pulp is totally recyclable and acid-free. Our printers also have full ISO 14001 environmental accreditation this ensures that they have effective procedures in place to manage waste and practices that may affect the environment.
002825

Published by TSO (The Stationery Office) and available from:
online www.tsoshop.co.uk
mail, telephone, Fax & e-mail TSO PO Box 29, Norwich, NR3 1GN Telephone orders/General enquiries: 0870 600 5522 Order through the Parliamentary Hotline Lo-Call 0845 7 023474 Fax orders: 0870 600 5533 E-mail: [email protected] Textphone: 0870 240 3701
The Parliamentary Bookshop 12 Bridge Street, Parliament Square, London SW1A 2JX Telephone orders/General enquiries 020 7219 3890 Fax orders: 020 7219 3866 Email: [email protected] Internet: http//www.bookshop.parliament.uk
tSo@blackwell and other accredited agents Customers can also order publications from:
tSo ireland 16 Arthur Street, Belfast BT1 4GD 028 9023 8451 Fax 028 9023 5401
9 780102 963441
ISBN 978-0-10-296344-1
£14.35