department of economics - university of leicester · · 2011-10-25for her constructive and...
TRANSCRIPT

DEPARTMENT OF ECONOMICS
DOES THE CHINESE BANKING SYSTEM
PROMOTE THE GROWTH OF FIRMS?
Panicos O. Demetriades, University of Leicester, UK Jun Du, Aston University, UK
Sourafel Girma, University of Nottingham, UK Chenggang Xu, LSE and Hong Kong University of Science & Technology
Working Paper No. 08/6 February 2008

Does the Chinese Banking System Promote the Growth of Firms?∗
By
Panicos O. Demetriades University of Leicester
Jun Du Aston University Sourafel Girma
University of Nottingham Chenggang Xu
LSE and Hong Kong University of Science and Technology
Abstract
Using a large panel dataset of Chinese manufacturing enterprises during 1999-2005, which accounts for over 90% of China’s industrial output, and robust econometric procedures we show that the Chinese banking system has helped to support the growth of both firm value added and TFP. We find that access to bank loans is positively correlated with future value added and TFP growth. We also find that firms with access to bank loans tend to grow faster in regions with greater banking sector development. While the effects of bank loans on firm growth are more pronounced in the case of purely private-owned and foreign firms, they are positive and statistically significant even in the case of state-owned and collectively-owned firms. We show that excluding loss-making firms from the sample does not change the qualitative nature of our results.
JEL classification: E44, O53
Keywords: Chinese banking system development, value added and TFP growth, panel dataset.
4 February 2008
∗ We acknowledge financial support from the ESRC under the World Economy and Finance Research Programme (Award RES-156-25-0009). We have benefited from comments participants at the “Finance and Development” conference at the London School of Economics, 26-28 June 2007. Special thanks to our discussant, Sonja Fagernas, for her constructive and thorough comments and to Badi Baltagi and Stijn Claessens for their helpful suggestions in the earlier stages of this work.

1. Introduction China offers a most interesting and possibly unique setting in which to examine
the relationship between finance and growth, utilising firm-level data, for (at
least) three compelling reasons, which are as follows:
(i) China is one of the most important and fastest-growing economies in
the world. Almost 30 years of rapid economic growth – in itself an
unprecedented phenomenon - has transformed China from an
agricultural economy to the factory of the world; from a closed
economy into the world’s largest exporter of textiles, toys, laptop
computers, cell phones, digital cameras, etc. and the 2nd largest FDI
recipient country. As a result, China now has the largest volume of
foreign reserves in the world, as well as one of the largest banks (the
ICBC). Therefore, examining the role played by the finance-growth
mechanism within China is interesting in its own right and could
therefore make a useful contribution to the finance-growth literature.
(ii) The Chinese banking system has been dominated by state-owned
banks and is widely regarded of very poor quality by international
standards (e.g. Allen et al, 2005). The mainstream view in the
literature is that government-owned banks are inefficient and
motivated by political objectives.1 China’s banking sector has
accumulated huge amounts of bad loans, not least because one of its
major responsibilities has been the bailing out of financially
distressed state owned enterprises. Furthermore, it has been argued
that the Chinese banking sector is regionally segmented, that
financial resources are not mobile and that they are allocated
inefficiently (Young, 2001; Boyreau-Debray and Wei, 2005). Allen et al
(2005) have, therefore, argued that because of its inefficient banking
system, China represents an important counter example to the
apparent consensus that a well-developed financial system is
1 See, however, Andrianova et al ( 2008) for a critique of this view.
1

necessary for growth.2 Based on this view, one might therefore
expect that the finance-growth mechanism would be weak, if present
at all, in the case of China. Allen et al (2005) in fact ascribe Chinese
economic growth to informal financial channels than the formal,
state-dominated, financial system.3
(iii) Increased data availability over recent years means that finance-
growth type questions can now be examined using very large micro
data sets. In this paper we utilise a very large micro panel data set
that spans the entire Chinese manufacturing industry which contains
detailed information on firms' sources of financing. Our dataset
includes 1.3 million observations that cover the period 1999-2005; by
2005 a quarter million firms are included. The firms in our sample
account for nearly 90% of total industrial output in China.4
This paper, therefore, utilises a very large micro dataset of Chinese firms to
examine the contribution of bank finance to the growth of firm value added and
total factor productivity, controlling for firm characteristics and ownership
structure. The results of our investigation are therefore likely to have important
policy implications, not only for China but also for other developing and
transition economies in which state-owned banks and enterprises are
prominent.
Our main finding is that, contrary to what might be expected from a state-
dominated, inefficient banking system, the finance-growth mechanism in China
has been alive and kicking. Specifically, we find that access to bank loans is
2 For recent surveys of the finance and growth literature see Demetriades and Andrianova (2005) and Levine (2003). 3There is, however, a parallel literature which explains how China’s regional decentralization contributed to the success of Chinese economic reforms and thus to economic growth (e.g. Qian and Xu, 1993). Theoretical arguments and empirical evidence have been provided that regional decentralization created incentive conditions for regional competition which fosters regional economic growth (Maskin, Qian and Xu, 2000; Li and Zhou, 2006). Moreover, it is argued that Chinese regional decentralization creates conditions for experimenting reform policies. This contributes substantially to the success of reforms and growth (Qian, Roland and Xu, 2006). 4 For comparison purposes it should be noted that Allen et al (2005) use a dataset of 1100 listed firms during the period 1992-2000.
2

positively correlated with future value added and TFP growth. Moreover, we
find that firms with access to bank loans tend to grow faster in regions with
greater banking sector development. While the effects of bank loans on firm
growth are more pronounced in the case of privately owned and foreign firms,
they are positive and statistically significant even in the case of state-owned and
collectively- owned firms. Our findings - which challenge the Allen et al (2005)
view on the role of the Chinese banking system - are nevertheless broadly
consistent with the findings of a recent macro-econometric study by Rousseau
and Xiao (2007); these authors provide evidence using aggregate data and time-
series econometric methods which suggests that banking sector development
during 1995-2005 played a central role in China’s economic growth during that
period.
The paper is organised as follows. Section 2 describes the dataset and variable
construction. Section 3 presents the econometric methodology and the
empirical model. Section 4 presents the empirical results while section 5
summarises and concludes.
2. Data and variable construction
The main source of our data is the Annual Report of Industrial Enterprise
Statistics compiled by the National Bureau of Statistics (NBS) of China (various
issues), covering the population of Chinese state-owned manufacturing
enterprises and non-state-owned enterprises with annual turnover of more than
5 million RMB Yuan (about $620,000). The sample accounts for nearly 90% of
total industrial output.5 The dataset, which we have collected for the period
1999-2005, contains detailed information on output, assets, sources of finance,
exports, sales, value added, employment, wages, R&D expenditure, product
innovation and employee training outlay, as well as ownership structure,
industry affiliation, and geographical location.6 Other data sources include
5 This figure is calculated using China Statistics Yearbook (various issues). 6 The data are deflated using industry-specific ex-factory price indices obtained from China Statistical Yearbook (2000-2003).
3

China Statistical Yearbook, China Fixed Asset Statistical Yearbook and China
Financial Statistics.
We provide detailed information on the dataset structure in Appendix 1 Tables
A1-A3. Table A1 presents the frequency distribution of firms during the sample
period, showing that the number of firms almost doubled during the sample
period. Tables A2 and A3 show the industrial classification and geographical
distribution of firms, respectively, confirming that the dataset exhibits
reasonable sectoral and geographical balance.
2.1 Classification of firm ownership type
Officially, firm ownership type in China is classified according to the
Regulation of the People’s Republic of China on the Management of
Registration of Corporate Enterprises. This classification has been questioned
recently (e.g. Dollar and Shang-Jin Wei, 2007), given ownership changes among
Chinese enterprises in various forms have happened during the reform years.
We therefore create our own, data driven, ownership classification utilising the
rich information provided in the dataset, which includes the share of equity
capital contributed by the state, collective investors, domestic private and
foreign investors. Specifically, we classify firms as state owned enterprises
(SOE) if the share of state capital in total equity is 50% or higher; collectively
owned enterprises (COE) if the share of collective capital in total equity is 50%
or higher; foreign owned enterprises (FOR) if the share of foreign capital (incl.
capital from Hong Kong, Macau, and Taiwan and foreign countries) is 50% or
higher; domestic private enterprises (Private): all remaining enterprises. The
latter group is further classified into three sub-types:
(i) Private with state capital (Private_state): if the share of state capital is
greater than zero (but less than 50%);
(ii) Private with foreign capital (Private_for): if the share of foreign
capital is greater than zero (but less than 50%);
4

(iii) Pure private (PPrivate): the rest of the firms (i.e. those without state
or foreign capital).
The dataset structure in terms of firm’s ownership is summarized in Appendix
Table A4. Private firms represent 62% of the sample; of these, pure private
firms constitute more than half the sample (54.2%). There are only a relatively
small number of private firms with state capital (1.6%) and a somewhat larger
number of private firms with foreign capital (6.5%). SOEs represent 11.7% of
the sample during the entire period, but this average figure masks a declining
trend reflecting privatisation of state owned firms.7 The remaining two
categories are COEs, which account for 12.40% of the sample, and foreign
invested firms, which represent 16.0% of the sample; the majority of foreign
invested firms are owned by Hong Kong, Macau and Taiwanese investors.
2.2 Variable construction and summary statistics
Table 1 provides the summary statistics of the variables used in the estimations
for the overall sample and also by ownership type. The total factor productivity
(TFP) measure is estimated following the methodology of Levinsohn and Petrin
(2003), which is outlined in Appendix 2. This approach has been widely applied
in recent literature because of its advantage of being able to control for the
simultaneity between firm’s choice of input levels and unobserved productivity
shocks by using firm’s intermediate inputs (such as raw materials or electricity)
as proxies. For all firms, the average TFP growth reaches 8.5% over the sample
period, with a high standard deviation indicating large heterogeneity among
firms8. There is an on average 12.4% of industrial value added growth over the
period 1999-2005, again with the highest growth among pure private domestic
firms, followed by foreign firms. The high standard deviations suggest a
substantial variation among firms. The average firm age is approximately 10
7 The percentage of SOEs has dropped through time from 28% in 1999 to 6% in 2005. 8 Note that we have adopted the improved capital stock measurement suggested by Jefferson et al (2000), at the price of losing one year observations. As such, the calculated TFP is the average growth rate of the TFP over 2000-2005.
5

years, with loss-makers being older on average, 14 years. The average firm size
in the sample, measured as the logarithm of total employment, is 4.907 (equal to
297 employees). We measure firm’s access to formal finance by the logarithm of
the amount of bank loans obtained by the end of each period. The average level
of bank loans is 1.004 (equal to RMB Yuan 2,481,300, or approximately
US$300,000). The average level of equity finance is 3.596 (equal to RMB Yuan
16,027,000, or approximately US$1,931,000). There are several indicators at 3-
digit SIC industry level used in our analysis. Exit rate at industry is the
percentage of firm exit in each year. On average the exit rate among Chinese
firms is 17.6% over the period of 1999-2005. PRIVY, measured by regional
aggregate bank loans issued to private sector over regional GDP, is to capture
the degree of regional financial development. It is proved to be a reasonable
measure by previous finance-growth literature (see Levine 2005).
3. Econometric Methodology
In order to evaluate the extent to which the Chinese banking system promotes
firm growth, we specify an empirical model in which access to formal finance
can influence firm performance over and above non-financial factors such as
firm age, size, industry etc. Specifically, our model is as follows.
itittijitititit DEQUITYFDBANKBANKXY εβββββ +++++′= −−− 51,4013121 )*( (1)
The dependent variable Yit represents either total factor productivity or value
added growth for firm i at time t. BANK it-1 denotes the stock of bank loan
liabilities of firm i outstanding at time t-1; EQUITYit-1 denotes the total amount
of equity finance invested in firm i at time t-1. Xit is a vector of control
covariates, Dit is a vector of dummies, including various fixed effects, and εit is a
random error term.
Entering equity finance alongside bank loans in the empirical model helps to
ensure robustness in that the estimated coefficient is more likely to capture the
effect of bank loans, as opposed to the effect of another omitted formal finance
6
channel, with which bank finance may be correlated.9 Moreover, it allows a
comparison of the differential impact of bank and equity finance, which can
provide additional insights into the finance-growth nexus within China.
Both finance variables are lagged by one period to control for potential
endogeneity. Bank loans or equity finance may be correlated with unobserved
shocks to firm performance, hence using contemporaneous values may result in
biased estimates. By making the finance variables predetermined, one potential
source of bias is therefore removed. However, even if the estimated coefficients
turn out to be positive, it does not follow that the correlation between bank
loans and firm performance can be interpreted causally i.e. getting a bank loan
isn’t necessarily the reason why a firm grows faster. Indeed, economic analysis
suggests that even if banks are able to pick winners – i.e. firms with profitable
opportunities – through effective screening of loans applicants, it does not mean
that the bank loans they provide cause them to grow faster. Bank loans simply
enable firms to exploit profitable opportunities. Whether causal or not, a
positive correlation between (lagged) bank loans and firm performance would
suggest that Chinese banks are carrying out their screening function effectively.
Hence, if such a positive correlation is found, we could legitimately conclude
that Chinese banks are at the very least supporting or facilitating the growth of
firms.
We shed more light on the finance growth nexus in China, by interacting BANK
with an indicator of initial financial development in the region in which a firm
is based (FDj0, where j represents the region). This allows us to examine
whether regional financial development mediates the growth enhancing effects
of access to bank finance. The finance and growth literature suggests that the
impact of banks on firm performance is likely to be larger in more financially
developed countries (and consequently regions). This is because banks are more
likely to have greater expertise in monitoring and screening loan applicants in
more financially developed countries (or regions), hence they would channel
9 The qualitative nature of the results is unaltered even if we exclude equity finance.
7

loans into the more productive firms. Consequently, if this term is found to be
positive and significant, it would suggest that the standard finance and growth
mechanism is operational within China. We use the initial level of financial
development to address possible reverse causality between regional financial
development and firm performance. It is not impossible that some regions may
become more financially developed because they have a large number of fast
growing firms. By using the initial level of the financial development indicator,
which is interacted with lagged bank loans, we are avoiding any
contemporaneous correlation between this composite variable and unobserved
shocks to firm performance.
Besides equity finance, the empirical model includes a vector of other control
covariates, Xit, hypothesised to impact on firm growth. These controls include
linear and squared terms of (initial) firm size and age. They also include the
initial level of TFP or value added which is included to capture convergence; a
negative coefficient would indicate that a part of firm growth in value added
represents catch-up from a low initial value. Hence, we expect this term to be
negative. The vector Dit consists of a full set of firm ownership, industry and
regional dummies, since it is important to control for the possibility that these
fixed characteristics affect firm performance. In addition it also includes time
dummies, to remove the effects of temporal shocks that affect all firms, as well
as time dummies interacted with region dummies to remove the possible
influence of any regional fixed effects that vary with time, such as changing
regional economic policies.
Since the growth variable is only observed for firms that have survived, it is
important to correct for selection bias due to firms’ survival. A popular method
for correcting selectivity bias is to apply the technique due to Heckman (1976).
However, this technique is not appropriate in panel data models like ours – see
Equation (2). Wooldridge (1995) shows that in such cases, Heckman’s method
leads to inconsistent estimates and proposes more appropriate methods for
testing and correcting for sample selection bias in these models. We therefore
utilise Wooldridge’s techniques to test for and correct the selectivity bias that
8

may arise due to firms’ survival in our data set. The variables we include in the
selection equations are quadratic terms of size and age, productivity, industry
concentration and industry entry and exit rate. These are standard variables
used in the firm survival literature (e.g. Dunne and Hughes, 1994 and Mata et
al., 1995).
The Wooldridge estimator starts by estimating for each time period t=1, 2, …T
the selection equation by standard probit. Next, it obtains the inverse Mills
ratio for surviving firms, say , and defines the matrix of inverse Mills ratios,
say , as
itλ̂
itΛ ( )00ˆ00 itit λ=Λ . The selection bias corrected estimates can
then be obtained by estimating the baseline model (Equation 1) augmented
with the matrix of inverse Mils ratios (the correction terms). That is
itititjitititit DFDBANKBANKXY εγββββ +Λ++++′= −− 4013121 )*( . (2)
A test for the joint significance of the correction terms provides a test for sample
selectivity.
To summarise, our empirical strategy is robust to a wide range of possible
econometric issues that may arise when using panel data sets of the type we are
using in this paper. Specifically, we have taken steps to address (i) possible bias
due to sample selection relating to firm survival, (ii) potential endogeneity of
regressors through the use of lagged finance and by controlling for various
fixed effects, including any time varying regional factors, (iii) potential
endogeneity problems related to the measurement of TFP via the Levinsohn
and Petrin (2003) method (see Section 2.2.).
4. Empirical Results
The main empirical results are presented in Tables 2-5. Tables 2 and 3 contain
the estimates of the determinants of TFP growth while Tables 4 and 5 contain
the estimates of the determinants of value added growth. Tables 3 and 5
include the interaction term between regional financial development and bank
loans in the list of regressors while tables 2 and 4 do not.
9

We first examine the results in Table 2. To start with, the selection test in all
columns validates the use of the Wooldridge estimation method. Column (1),
which contains the overall results, shows that ownership matters for TFP
growth, with all ownership types having higher TFP growth than the
benchmark group, which corresponds to state-owned firms. This is certainly a
very plausible result, given that state owned firms are unlikely to be at the
forefront of innovation. What is a little surprising is that the highest group in
terms of TFP growth are not foreign firms but pure private (domestic) firms,
followed by collectively owned enterprises and private (domestic) firms with
some foreign capital. The initial level of TFP enters with a negative and
significant coefficient, suggesting convergence is taking place, albeit at a fairly
slow speed – its coefficient is -0.14. The other controls enter with plausible
coefficients. Access to bank loans enters with a positive, albeit small, coefficient
that is highly significant, while equity finance enters with a substantially higher
positive coefficient that is also highly significant. Columns (2)-(7) in the same
table contain the results for different ownership types. Both bank loans and
equity finance have positive and highly significant coefficients for all ownership
types. Both finance variables have the highest coefficients in the case of foreign
owned firms, followed by pure private (domestic) firms. Bank loans have the
smallest coefficients in the case of private firms with state capital followed by
collectives and state owned firms. These results suggest that the finance-
growth mechanism works better in the case of privately owned firms but it is
not absent even in the case of state owned firms.
The results in Table 3 are similar to those in Table 2, except for the coefficient of
bank loans which is now much lower and is no longer significant for all
ownership types. However, the newly introduced interaction term is positive
and highly significant throughout Table 3. Taken together, these results
suggest that the Chinese banking system has a positive influence on TFP
growth and that on the effects of bank loans are amplified by the state of
regional financial development. Firms with identical characteristics, including
the same access to bank loans, will grow faster if they are located in regions that
10

are more financially developed. Given that this effect is over and above any
(time-varying) regional effects, we can conclude that it is not simply capturing
changes in regional economic policies. Conversely, the positive and significant
coefficient of this interaction term also suggests that regional financial
development has a bigger positive impact on TFP growth in those firms that
borrow more from banks.
Tables 4 and 5 repeat the same exercise as Tables 2 and 3 but with firm value
added growth as the dependent variable instead of TFP growth. Controlling for
initial industrial value added level, the conclusions that can be drawn by
examining the estimated coefficients are broadly very similar to those that can
be drawn from Tables 2 and 3. The interaction term now enters with
substantially higher coefficients relative to the corresponding terms in Table 3,
suggests that regional financial development has quantitatively larger effects on
firm value-added growth than on TFP growth.
The results in Tables 2-5 provide very clear evidence that even in the overall
sample, which includes state-owned enterprises, the finance-growth
mechanism in China is both alive and kicking. Importantly, our evidence
suggests that the growth-finance mechanism in China does not merely reflect
the effects of financial development on capital accumulation – financial
development seems to have a positive effect on TFP growth.
Loss making enterprises and the finance-growth mechanism
Tables 6 and 7 report the results of re-estimating our main model after
removing loss-making firms from the sample. Loss making enterprises
represent 14% of firms in our sample, and 27% of state-owned firms. It may be
argued that bank lending to loss-making enterprises, particularly state-owned
ones, is politically motivated, since state-owned banks, which dominate China’s
banking system, may be required by the government to keep alive firms that
serve political objectives. If this were true, it would undermine banks’ ability to
finance productive enterprises and we would therefore expect to see higher
11

coefficients on the bank loan variable and its interaction with regional financial
development if loss-making enterprises were removed from the sample. On the
other hand, if lending to loss making enterprises is dictated by economic
criteria, particularly the future prospects of these firms, removing these firms
from the sample should not alter the results very much. This is because loss-
making firms that receive bank loans would be the ones whose future prospects
are bright, as it would not make any commercial sense for banks to make loans
to loss-making firms who are unlikely to be able to repay the loans in the future.
Tables 6 and 7 show that in the overall sample, the coefficient on bank loans is
somewhat higher than the corresponding one in Tables 3 and 5, respectively.
This change is, however, non-negligible only in the industrial value added
comparison where the coefficient on bank loans rises from 0.0026 to 0.0042, with
the increase being slightly more than two standard errors. The coefficient of
bank loans becomes significantly positive for pure private domestic firms in
Table 7 in comparison to Table 5, suggesting profit-making firms benefit from
bank loans; for SOE and private with state capital, the coefficients remain
insignificant but are more positive; while profit-making foreign firms have
higher significantly positive coefficients. The coefficients of the interaction term
of bank loans and financial development show a minor. Thus, it appears that
excluding loss-making firms from the sample increases the direct effect of bank
loans on industrial value added growth but mitigates their effect through
regional financial development. Interestingly, this overall result does not reflect
changes in the coefficient of bank loans for state owned enterprises, but the
coefficients on collectives and private firms. By removing loss making
enterprises from the sample, this coefficient switches from insignificant to
significant in the cases of collective enterprises and pure private (domestic)
firms. Once again the coefficient of the interaction term declines but remains
significant in the case of all ownership types.
We can, therefore, conclude that removing loss-making enterprises from the
sample does not alter the qualitative nature of the results very much at all.
These findings seem to tentatively suggest that politically motivated lending to
12

loss making firms in China is not as widespread as it is perhaps believed to be.
In order to explore this issue in more depth, we ran the TFP growth regressions
on loss making firms alone.10 In the overall sample, the effect of both bank
loans and the interaction term remains positive and significant, suggesting that
the banking system continues to have a positive impact even on loss making
firms. However, the results by type of ownership show that this effect varies
widely between private and state-owned enterprises. The relevant coefficients
are positive and significant at the 1 per cent level for pure private firms and
foreign owned firms; they are positive and significant at the 5 per cent level for
collectives. When it comes to state-owned enterprises, the effect of bank loans
is significant only at the 10 per cent level while the interaction term is not
significant. Finally, when it comes to private firms with some state capital, both
the relevant coefficients are insignificant. These results seem to suggest that
banks may be able to turn around loss-making firms as long as they are not
wholly or partially government owned. Thus, there appears to be some
evidence to suggest that lending to loss-making enterprises in which the
government has an ownership stake may indeed be politically driven. Aside
from these firms, however, our findings on all other types of firms suggest that
the finance and growth mechanism in China is operating reasonably well,
notwithstanding the close ties between banks and political authorities.
5. Concluding Remarks
Our empirical results suggest that the view that China’s banking system has
been an idle or even disruptive participant in the process of Chinese economic
growth is not supported by the empirical evidence. Our paper certainly adds to
the growing body of evidence which suggests that in fact the Chinese banking
system played a central role in supporting economic growth (see also Rousseau
and Xiao, 2007). We believe this is not only an interesting finding but also a
comforting one. It is clearly interesting to confirm that the finance-growth
10 These results are not reported in a separate table to save space.
13

mechanism is present, even in a country with state dominated banks; this result
casts further doubt on the critics of government ownership of banks (see also
Andrianova et al, 2008). It is very comforting because the silent implication of
the view that Chinese economic growth had nothing to do with China’s banks
suggests that Chinese economic growth could have been even higher had the
banking system been more supportive. This is certainly an implication that is
not only hard to swallow, given the very high growth rates already achieved,
but also a disturbing one for the world economy: could it have coped with even
higher growth rates in China?
Our empirical findings, robust as they may be, raise an important question that
warrants further investigation: what is the mechanism that helps to ensure that
a state-dominated banking system chooses to finance productive privately
owned firms? We believe the answer to this question may be found by
examining the role of regional governments in Chinese economic growth and
the links of these governments with regional banks. There is already an
important literature which emphasises the contributing role played by China’s
regional decentralization to the success of Chinese economic reforms and thus
to Chinese economic growth (e.g. Qian and Xu, 1993; Maskin, Qian and Xu,
2000; Li and Zhou, 2006; Qian, Roland and Xu, 2006). What remains to be
explored in future research are the precise linkages between regional
governments and regional banks and their implications for the lending
behaviour of banks.
References
Allen, F., J. Qian, and M. Qian (2002) “Law, Finance and Economic Growth in China”, Journal of Financial Economics, 77 (2005), 57-116.
Andrianova, S., P. Demetriades and A. Shortland (2008) “Government Ownership of Banks, Institutions and Financial Development, Journal of Development Economics, 85 (2008), 218-252.
Boyreau-Debray, G. and S-J Wei (2005) “Pitfalls of a State-Dominated Financial System: the Case of China”, NBER Working Paper 11214.
14
Dollar, D. and S-J Wei (2007) “Das (Wasted) Kapital: Firm Ownership and Investment Efficiency in China” , IMF Working Paper WP/07/09. Dunne, P. and A. Hughes (1994) “Age, Size, Growth and Survival: UK Companies in the 1980s”, The Journal of Industrial Economics 42, 115–139
Heckman, J. (1976) “The Common Structure of Statistical Models of Truncation, Sample Selection and Limited Dependent Variables and a Simple Estimator for Such Models, Annals of Economic and Social Measurement 5 , 475–492.
Levinsohn, J. and A. Petrin (2003) “Estimating Production Functions Using Inputs to Control for Unobservable”, Review of Economic Studies, 70 (2), 317-41.
Li, H. and L. Zhou (2005) “Political Turnover and Economic Performance: The Incentive Role of Personnel Control in China”, Journal of Public Economics, 89, 1743-1762. Lin, J. and Z. Liu (2000), “Fiscal Decentralization and Economic Growth in China”, Economic Development and Cultural Change, 49(1), 1-22.
Maskin, E. Y. Qian and C. Xu (2000) “Incentives, Information, and Organizational Form”, Review of Economic Studies, 67(2), 359-378.
Mata, J., P. Portugal and P. Guimaraes (1995) “The Survival of New Plants: Start-up Conditions and Post-entry Evolution”, International Journal of Industrial Organisation, 13, 459–481.
Qian, Y., G. Roland and C. Xu (2006) “Coordination and Experimentation in M-Form and U-Form Organizations”, Journal of Political Economy, 114 (2), 366-402.
Qian, Y. and C. Xu (1993) “Why China's Economic Reforms Differ: The M-form Hierarchy and Entry/Expansion of the Non-State Sector”, The Economics of Transition, 1(2), 135-170.
Rousseau, P.L. and S. Xiao (2007) “Banks, Stock Markets, and China’s Great Leap Forward”, Emerging Markets Review, 8, 206-217.
Wooldridge, J.M. (1995), “Selection Corrections for Panel Data Models Under Conditional Mean Independence Assumptions”, Journal of Econometrics, 68, 115-132.
Young, A. (2001), “The Razor’s Edge: Distortion and Incremental Reform in the People’s Republic of China”, Quarterly Journal of Economics, 115 (4), 1091-1035.
15

Appendix 1: Dataset structure Table A1: By year year Freq. Percent 1999 116,902 10.01 2000 125,210 10.72 2001 140,985 12.07 2002 152,419 13.05 2003 169,447 14.51 2004 236,413 20.24 2005 226,400 19.39 Total 1,167,776 100
Table A2: By 2-digit SIC industrial classification 2-digit sic industry Freq. Percent 13-Food Processing 67,842 5.81 14-Food Production 28,768 2.46 15-Beverage Industry 20,079 1.72 16-Tabacco Industry 1,594 0.14 17-Textile Industry 101,583 8.7 18-Garments and Other Fibre Products 58,700 5.03 19-Leather, Furs, Down and Related Products 28,373 2.43 20-Timber Processing 22,860 1.96 21-Furniture Manufacturing 13,179 1.13 22-Papermaking and Paper Products 36,546 3.13 23-Printing and Record Medium Reproduction 26,656 2.28
24-Cultural, Educational and Sports Goods 15,263 1.31 25-Petroleum Refining and Coking 8,474 0.73 26-Raw Chemical Materials and Chemical Products
85,816 7.35
27-Medical products 24,727 2.12 28-Chemical Fibre 5,955 0.51 29-Rubber Products 13,967 1.2 30-Plastic Products 54,445 4.66 31-Nonmetal Mineral Products 104,809 8.98 32-Smelting and Pressing of Ferrous Metals 27,375 2.34 33-Smelting and Pressing of Nonferrous Metals
20,910 1.79
34-Metal Products 63,332 5.42 35-Ordinary Machinery 86,415 7.4 36-Special Purposes Equipment 48,087 4.12 37-Transport Equipment 53,764 4.6 39-Other Electronic Equipment 69,192 5.93 40-Electrical Equipment and Machinery 36,201 3.1 41-Electronic and communication appliances 16,382 1.4 42-Meters and office appliances 26,482 2.27 Total 1,167,776 100
16

Table A3: By province Region Freq. Percent 11- Beijing 28,562 2.45 12- Tianjing 26,610 2.28 13- Hebei 45,695 3.91 14- Shanxi 14,772 1.26 15- Neimenggu 6,700 0.57 21- Liaonign 39,445 3.38 22- Jilin 9,594 0.82 23- Heilongjiang
13,478 1.15
31- Shanghai 71,099 6.09 32- Jiangshu 161,446 13.83 33- Zhejiang 165,630 14.18 34- Anhui 24,126 2.07 35- Fujian 46,308 3.97 36- Jiangxi 17,999 1.54 37- Shandong 103,964 8.90 41- Henan 55,475 4.75 42- Hubei 36,434 3.12 43- Hunan 31,366 2.69 44- Guangdong 155,574 13.32 45- Guangxi 15,517 1.33 46- Hainan 2,395 0.21 50- Chongqin 12,380 1.06 51- Sichuan 29,926 2.56 52- Guizhou 9,186 0.79 53- Yunnan 9,382 0.80 54- Xizang 1,023 0.09 61- Shaanxi 12,404 1.06 62- Ganshu 11,373 0.97 63- Qinghai 1,558 0.13 64- Ningxia 2,409 0.21 65- Xinjiang 5,946 0.51 Total 1,167,776 100.00 Table A4: By ownership defined according to capital structure Ownership Freq. Percent State-owned enterprises (SOE) 141,123 12.08 Collective enterprises (COE) 146,147 12.51 Private enterprises: 725,293 62.11 -Domestic private enterprises (Private_state) 28,463 2.44 -Pure Private (PPrviate) 632,607 54.17 -Private with foreign capital (Private_for) 64,223 5.50 Foreign invested enterprises (FOR) 155,213 13.29 Total 1,167,776 100.00
17

Appendix 2: TFP estimation method The total factor productivity (TFP) measure is estimated following the
methodology of Levinsohn and Petrin (2003). The advantage of this method lies
in controlling for the simultaneity between firm’s choice of input levels and
unobserved productivity shocks by using firm’s intermediate inputs (such as
raw materials or electricity) as proxies.
Assuming a Cobb-Douglas production function for firm i at time t is:
ititittitl
itititkitlit
mklkly
εφβεωβββ
++≡++++=
),(0
where y is log of value added, which is sales net intermediate inputs (m), l is
labour input and k is capital input, and ),(),( 0 ititititkitittt mkkk ωββωφφ ++=≡
is an unknown function of capital and intermediate inputs. tφ is strictly
increasing in the productivity shock , so that it can be inverted and one can
write
itω
),( itittit kmωω = for some function tω . Levinshon and Petrin (2003)
approximate ),( ititt mkφ by a third order polynomial in k and m,
and obtain and estimate of
sit
j s
jitjs mk∑∑
=
3
0
3
δ
lβ and tφ (up to the intercept) via OLS. This
constitutes the first stage of the estimation procedure. At the second stage the
elasticity of capital kβ is defined as the solution to
, where ( )2
*ˆmin* ∑∑ −−−
i tititkitlit kly
k
ϖβββ
itϖ is a nonparametric approximation
[ 1| −ititE ]ωω . Since the estimators involve two stages the calculations of the
covariance matrix of the parameters must allow for the variation due to all of
the estimators in the two stages. Levinshon and Petrin (2003) note that the
derivation of the analytical covariance matrix is quite involved, and suggest the
bootstrapping procedure to estimate standard errors. In this study 200
bootstrap replications are performed. Once consistent estimates of the input
elasticities are derived, the log of productivity can be obtained as
. itkitlitit kly ββω ˆˆˆ −−=
18

19
The data of industrial value-added and intermediate input are deflated by ex-
factory price indices published in the Chinese Statistical Yearbook (1999-2006).
The fixed assets data are deflated by fixed asset price indices published in the
China Fixed Asset Statistical Yearbook and Chinese Statistical Yearbook (1999-
2006). The estimation has been conducted by 2-digit SIC industry categories.

20
Table 1: Summary statistics All enterprises (1) SOE (2) COE Private (6)Foreign Variables (3)Private with
state capital (4)Pure
domestic private
(5)Private with foreign capital
mean sd mean sd mean sd mean sd mean sd mean sd mean sd TFP level 1.549 2.209 0.970 3.073 1.518 1.957 1.562 1.949 1.631 1.965 1.724 1.825 1.736 2.446 Growth of TFP (gTFP) 0.085 0.637 0.004 0.737 0.039 0.631 0.051 0.633 0.117 0.600 0.081 0.600 0.098 0.676 Industrial value-added level (log term) 3.871 1.393 3.463 2.020 3.743 1.192 4.631 1.664 3.791 1.202 4.351 1.344 4.345 1.355 Growth of industrial value-added (gIVA) 0.124 0.74 -0.001 0.828 0.057 0.691 0.068 0.685 0.165 0.725 0.116 0.687 0.139 0.777 BANK, log of bank loans 1.004 1.72 1.910 2.187 1.131 1.653 2.010 2.300 0.846 1.552 0.958 1.770 0.576 1.460 Equity, log of equity finance 3.596 1.596 3.603 1.916 3.155 1.338 4.902 1.784 3.243 1.394 4.260 1.397 4.646 1.447 Size (log of total employment) 4.907 1.124 5.043 1.492 4.775 1.022 5.490 1.273 4.618 1.004 5.101 1.074 5.126 1.113 Age 10.299 11.065 21.929 17.014 13.499 11.304 13.842 13.565 7.827 8.596 7.960 5.934 7.107 3.996 Exit rate at 3-digit SIC industry level 0.176 0.054 0.247 0.235 0.244 0.235 0.260 0.258 0.385 0.359 0.322 0.321 0.356 0.349 PRIVY, financial development indicator, regional aggregate bank loans to private sector over regional GDP in 1999.
0.008 0.006 0.006 0.004 0.006 0.005 0.007 0.005 0.008 0.007 0.009 0.007 0.008 0.005
Percentage of observations (%) 100 - 12.08 12.51 2.44 54.17 5.50 13.29

Table 2: Access to bank loans and firm TFP growth
(1) overall (2) SOE (3) COE Private (7)Foreign Dependent variable: TFP
growth (4)Private
with state capital
(5)Pure private
(6)Private with foreign capital
Finance variable BANK loans(t-1) 0.0108*** 0.00944*** 0.00852*** 0.00654** 0.0100*** 0.0139*** 0.0143*** (0.00048) (0.0018) (0.0014) (0.0027) (0.00092) (0.0018) (0.0022) Equity finance(t-1) 0.0391*** 0.0367*** 0.0174*** 0.0483*** 0.0407*** 0.0311*** 0.0561*** (0.00080) (0.0032) (0.0027) (0.0057) (0.0012) (0.0042) (0.0028) Control Initial size -0.0226*** 0.0445*** -0.0658*** -0.0113 -0.0227*** -0.0206 -0.0923*** (0.0071) (0.017) (0.016) (0.034) (0.0085) (0.027) (0.013) (Initial size)2 0.0494 -0.349** 0.200 -0.122 0.0268 0.0576 0.678*** (0.067) (0.15) (0.16) (0.30) (0.089) (0.24) (0.15) Age 0.0959*** 0.0634** 0.166*** 0.0675 0.132*** -0.00277 -0.163*** (0.012) (0.032) (0.020) (0.050) (0.012) (0.036) (0.054) Age2 -0.714*** -0.411 -1.538*** 0.305 -1.255*** 2.094*** 4.469*** (0.17) (0.57) (0.39) (0.95) (0.22) (0.73) (1.12) Initial TFP level -0.136*** -0.123*** -0.153*** -0.122*** -0.145*** -0.145*** -0.148*** (0.0021) (0.0039) (0.0050) (0.0091) (0.0027) (0.0058) (0.0069) Ownership dummy COE 0.0862*** (0.0044) Private with state capital
0.0694***
(0.0078) Pure domestic private
0.107***
(0.0042) Private with foreign capital
0.0872***
(0.0053) Foreign 0.0801*** (0.0052) Constant 0.0172 -0.203*** 0.0230 -0.160 0.0329 -0.0825 0.666*** (0.052) (0.059) (0.073) (0.13) (0.054) (0.099) (0.21) Observations 436564 54240 60253 12671 217561 28848 62991 R2 0.11 0.06 0.10 0.08 0.14 0.13 0.11
Selection bias correction
chi2(5) = 4743.37;
Prob>chi2 =0.0000
chi2(5) = 1291.36;
Prob>chi2 =0.0000
chi2(5) =1723.13; Prob>chi2
=0.0000
chi2(5) = 352.31;
Prob>chi2 =0.0000
chi2(5) = 2861.16;
Prob>chi2 =0.0000
chi2(5) = 1456.83;
Prob>chi2 =0.0000
chi2(5) = 874.49;
Prob>chi2 =0.0000
Note 1: The estimator adopted is the selection and endogeneity correction method by Wooldridge (1995). The procedure is to estimate a two-stage model, in which the first stage estimates a sample selection model of firm survival to obtain a yearly selection mechanism, and the second stage includes the estimated selection mechanism to correct for unobserved simultaneneity. The reported joint significance of yearly selection mechanism variables validates the adoption of the method. Note 2: All estimations include a full set of regional, industrial and year dummy variables. Interaction of yearly dummies and regional dummies are also included to capture time-variant regional policy differences. Note 3: Bootstrapped standard errors are reported in parentheses,*** p<0.01, ** p<0.05, * p<0.1.
21

Table 3: Access to bank loans, TFP growth and regional financial development
(1) overall (2) SOE (3) COE Private (7)Foreign Dependent variable: TFP
growth (4)Private
with state capital
(5)Pure private
(6)Private with foreign capital
Finance variable BANK loans(t-1) 0.00410*** 0.00541*** 0.00118 0.00188 0.00331*** 0.00674*** 0.00735*** (0.00063) (0.0020) (0.0018) (0.0037) (0.00088) (0.0024) (0.0021) Ln(BANK)(t-1)* PRIVY1999
1.160***
0.649**
1.475***
0.682*
1.149***
1.153***
1.328***
(0.049) (0.29) (0.24) (0.38) (0.072) (0.17) (0.22) Equity finance(t-1) 0.0389*** 0.0359*** 0.0179*** 0.0489*** 0.0399*** 0.0301*** 0.0556*** (0.0010) (0.0033) (0.0025) (0.0053) (0.0013) (0.0037) (0.0025) Control Initial size -0.0305*** 0.0361** -0.0758*** -0.0213 -0.0259*** -0.0226 -0.0918*** (0.0062) (0.014) (0.016) (0.031) (0.0078) (0.024) (0.017) (Initial size)2 0.110* -0.292** 0.283* -0.0447 0.0532 0.0714 0.670*** (0.062) (0.13) (0.17) (0.28) (0.079) (0.22) (0.19) Age 0.102*** 0.0712*** 0.170*** 0.0772* 0.131*** -0.000977 -0.161*** (0.011) (0.027) (0.019) (0.045) (0.013) (0.034) (0.044) Age2 -0.812*** -0.554 -1.574*** 0.159 -1.222*** 2.093*** 4.449*** (0.17) (0.46) (0.38) (0.85) (0.23) (0.73) (0.92) Initial TFP level -0.136*** -0.124*** -0.156*** -0.122*** -0.146*** -0.147*** -0.148***
(0.0021) (0.0046) (0.0041) (0.010) (0.0028) (0.0057) (0.0055) Ownership dummy
COE 0.0843*** (0.0048) Private with state capital
0.0691***
(0.0073) Pure private 0.105*** (0.0040) Private with foreign capital
0.0877***
(0.0050) Foreign 0.0820*** (0.0051) Constant -0.0699 -0.228*** -0.0461 -0.189 0.0424 -0.0772 0.660*** (0.053) (0.067) (0.056) (0.13) (0.062) (0.099) (0.21) Observations 436564 54240 60253 12671 217561 28848 62991 R2 0.11 0.05 0.09 0.07 0.14 0.13 0.11
Selection bias correction
chi2(5) = 5248.72;
Prob>chi2 =0.0000
chi2(5) = 1328.54;
Prob>chi2 =0.0000
chi2(5) =1934.19; Prob>chi2
=0.0000
chi2(5) = 652.37;
Prob>chi2 =0.0000
chi2(5) = 3001.90;
Prob>chi2 =0.0000
chi2(5) = 1625.07;
Prob>chi2 =0.0000
chi2(5) = 974.36;
Prob>chi2 =0.0000
Note 1: The estimator adopted is the selection and endogeneity correction method by Wooldridge (1995). The procedure is to estimate a two-stage model, in which the first stage estimates a sample selection model of firm survival to obtain a yearly selection mechanism, and the second stage includes the estimated selection mechanism to correct for unobserved simultaneneity. The reported joint significance of yearly selection mechanism variables validates the adoption of the method. Note 2: All estimations include a full set of regional, industrial and year dummy variables. Interaction of yearly dummies and regional dummies are also included to capture time-variant regional policy differences. Note 3: Bootstrapped standard errors are reported in parentheses,*** p<0.01, ** p<0.05, * p<0.1.
22

Table 4: Access to bank loans and firm IVA growth
(1) overall (2) SOE (3) COE Private (7)Foreign Dependent variable: IVA
growth (4)Private
with state capital
(5)Pure domestic private
(6)Private with foreign capital
Finance variable BANK loans(t-1) 0.0133*** 0.00795*** 0.0114*** 0.00318 0.0134*** 0.0171*** 0.0175*** (0.00047) (0.0017) (0.0014) (0.0024) (0.00079) (0.0020) (0.0018) Equity finance(t-1) 0.0662*** 0.0471*** 0.0257*** 0.0638*** 0.0736*** 0.0642*** 0.0822*** (0.00085) (0.0026) (0.0024) (0.0058) (0.0014) (0.0043) (0.0027) Control Initial size -0.0287*** 0.0522*** -0.130*** -0.0311 -0.0271*** -0.0442** -0.0894*** (0.0053) (0.014) (0.016) (0.035) (0.0085) (0.021) (0.013) (Initial size)2 0.605*** -0.236* 0.957*** 0.144 0.815*** 0.730*** 1.141*** (0.056) (0.14) (0.17) (0.31) (0.091) (0.20) (0.14) Age -0.0425*** -0.0335 0.108*** -0.0190 -0.0107 -0.205*** -0.677*** (0.0087) (0.029) (0.021) (0.043) (0.012) (0.040) (0.049) Age2 1.806*** 1.193** -0.385 1.913** 1.570*** 6.015*** 16.11*** (0.13) (0.52) (0.40) (0.79) (0.20) (0.87) (1.05) Initial IVA level -0.241*** -0.148*** -0.193*** -0.143*** -0.302*** -0.234*** -0.241***
(0.0018) (0.0038) (0.0037) (0.010) (0.0028) (0.0056) (0.0049) Ownership dummy COE 0.146*** (0.0044) Private with state capital
0.127***
(0.0052) Pure private
0.168***
(0.0039) Private with foreign capital
0.166***
(0.0054) Foreign 0.148*** (0.0041) Constant -0.580*** -0.755*** -0.545*** -0.680*** -0.397*** -0.483*** 0.498** (0.039) (0.072) (0.065) (0.13) (0.060) (0.099) (0.20) Observations 640657 68159 79481 15920 350854 38635 87608 R2 0.15 0.06 0.11 0.08 0.20 0.15 0.15
Selection bias correction
chi2(5) = 2523.29;
Prob>chi2 =0.0000
chi2(5) = 929.88;
Prob>chi2 =0.0000
chi2(5) = 398.58;
Prob>chi2 =0.0000
chi2(5) = 1289.48;
Prob>chi2 =0.0000
chi2(5) = 869.23;
Prob>chi2 =0.0000
chi2(5) = 1373.27;
Prob>chi2 =0.0000
chi2(5) = 1307.58;
Prob>chi2 =0.0000
Note 1: The estimator adopted is the selection and endogeneity correction method by Wooldridge (1995). The procedure is to estimate a two-stage model, in which the first stage estimates a sample selection model of firm survival to obtain a yearly selection mechanism, and the second stage includes the estimated selection mechanism to correct for unobserved simultaneneity. The reported joint significance of yearly selection mechanism variables validates the adoption of the method. Note 2: All estimations include a full set of regional, industrial and year dummy variables. Interaction of yearly dummies and regional dummies are also included to capture time-variant regional policy differences. Note 3: Bootstrapped standard errors are reported in parentheses,*** p<0.01, ** p<0.05, * p<0.1.
23

Table 5: Access to bank loans, IVA growth and regional financial development
(1) overall (2) SOE (3) COE Private (7)Foreign Dependent variable: IVA
growth (4)Private
with state capital
(5)Pure domestic private
(6)Private with foreign capital
Finance variable BANK loans(t-1) 0.00262*** 0.00302 0.00339 -0.00226 0.00144 0.00586*** 0.00559*** (0.00062) (0.0022) (0.0022) (0.0031) (0.00099) (0.0022) (0.0019) Ln(BANK)(t-1)* PRIVY1999
1.985*** 0.998*** 1.733*** 1.004*** 2.141*** 1.813*** 2.319***
(0.049) (0.23) (0.27) (0.31) (0.081) (0.17) (0.27) Equity finance(t-1) 0.0650*** 0.0469*** 0.0250*** 0.0635*** 0.0721*** 0.0626*** 0.0812*** (0.00079) (0.0026) (0.0019) (0.0060) (0.0012) (0.0034) (0.0027) Control Initial size -0.0316*** 0.0496*** -0.132*** -0.0330 -0.0304*** -0.0461** -0.0883*** (0.0054) (0.016) (0.017) (0.037) (0.0088) (0.021) (0.013) (Initial size)2 0.628*** -0.220 0.968*** 0.156 0.840*** 0.740*** 1.124*** (0.059) (0.14) (0.17) (0.31) (0.099) (0.20) (0.17) Age -0.0407*** -0.0326 0.110*** -0.0180 -0.0103 -0.203*** -0.671*** (0.0099) (0.027) (0.020) (0.050) (0.012) (0.031) (0.044) Age2 1.801*** 1.186** -0.414 1.911** 1.607*** 6.044*** 16.04*** (0.14) (0.49) (0.37) (0.91) (0.21) (0.67) (0.84) Initial IVA level -0.242*** -0.148*** -0.193*** -0.144*** -0.303*** -0.236*** -0.242***
(0.0021) (0.0054) (0.0039) (0.0084) (0.0023) (0.0065) (0.0048) Ownership dummy COE 0.147*** (0.0037) Private with state capital
0.126***
(0.0057) Pure private 0.169*** (0.0034) Private with foreign capital
0.167***
(0.0038) Foreign 0.151*** (0.0043) Constant -0.583*** -0.755*** -0.550*** -0.680*** -0.396*** -0.486*** 0.479** (0.052) (0.067) (0.053) (0.12) (0.055) (0.076) (0.21) Observations 640657 68159 79481 15920 350854 38635 87608 R2 0.16 0.06 0.11 0.08 0.20 0.16 0.15
Selection bias correction
chi2(5) = 2809.11;
Prob>chi2 =0.0000
chi2(5) = 1026.03;
Prob>chi2 =0.0000
chi2(5) = 708.23;
Prob>chi2 =0.0000
chi2(5) = 1387.58;
Prob>chi2 =0.0000
chi2(5) = 1024.51;
Prob>chi2 =0.0000
chi2(5) = 1409.21;
Prob>chi2 =0.0000
chi2(5) = 1327.78;
Prob>chi2 =0.0000
Note 1: The estimator adopted is the selection and endogeneity correction method by Wooldridge (1995). The procedure is to estimate a two-stage model, in which the first stage estimates a sample selection model of firm survival to obtain a yearly selection mechanism, and the second stage includes the estimated selection mechanism to correct for unobserved simultaneneity. The reported joint significance of yearly selection mechanism variables validates the adoption of the method. Note 2: All estimations include a full set of regional, industrial and year dummy variables. Interaction of yearly dummies and regional dummies are also included to capture time-variant regional policy differences. Note 3: Bootstrapped standard errors are reported in parentheses,*** p<0.01, ** p<0.05, * p<0.1.
24
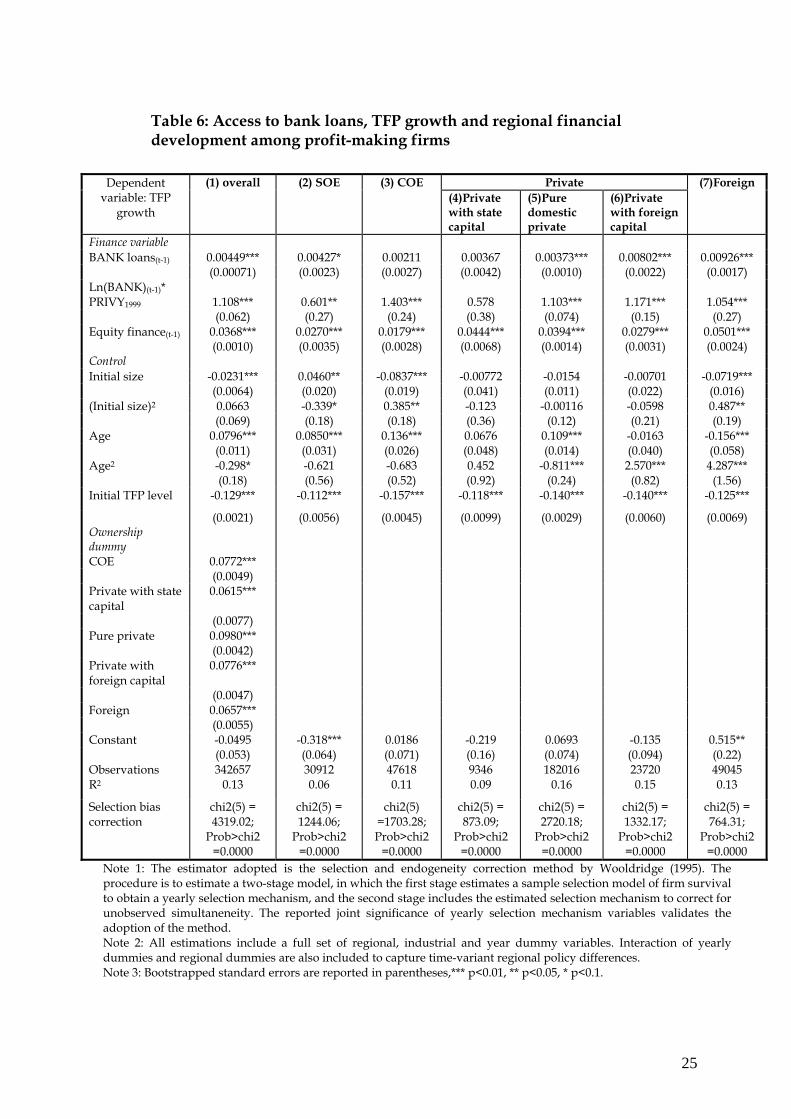
Table 6: Access to bank loans, TFP growth and regional financial development among profit-making firms
(1) overall (2) SOE (3) COE Private (7)Foreign Dependent variable: TFP
growth (4)Private
with state capital
(5)Pure domestic private
(6)Private with foreign capital
Finance variable BANK loans(t-1) 0.00449*** 0.00427* 0.00211 0.00367 0.00373*** 0.00802*** 0.00926*** (0.00071) (0.0023) (0.0027) (0.0042) (0.0010) (0.0022) (0.0017) Ln(BANK)(t-1)* PRIVY1999
1.108***
0.601**
1.403***
0.578
1.103***
1.171***
1.054***
(0.062) (0.27) (0.24) (0.38) (0.074) (0.15) (0.27) Equity finance(t-1) 0.0368*** 0.0270*** 0.0179*** 0.0444*** 0.0394*** 0.0279*** 0.0501*** (0.0010) (0.0035) (0.0028) (0.0068) (0.0014) (0.0031) (0.0024) Control Initial size -0.0231*** 0.0460** -0.0837*** -0.00772 -0.0154 -0.00701 -0.0719*** (0.0064) (0.020) (0.019) (0.041) (0.011) (0.022) (0.016) (Initial size)2 0.0663 -0.339* 0.385** -0.123 -0.00116 -0.0598 0.487** (0.069) (0.18) (0.18) (0.36) (0.12) (0.21) (0.19) Age 0.0796*** 0.0850*** 0.136*** 0.0676 0.109*** -0.0163 -0.156*** (0.011) (0.031) (0.026) (0.048) (0.014) (0.040) (0.058) Age2 -0.298* -0.621 -0.683 0.452 -0.811*** 2.570*** 4.287*** (0.18) (0.56) (0.52) (0.92) (0.24) (0.82) (1.56) Initial TFP level -0.129*** -0.112*** -0.157*** -0.118*** -0.140*** -0.140*** -0.125***
(0.0021) (0.0056) (0.0045) (0.0099) (0.0029) (0.0060) (0.0069) Ownership dummy
COE 0.0772*** (0.0049) Private with state capital
0.0615***
(0.0077) Pure private 0.0980*** (0.0042) Private with foreign capital
0.0776***
(0.0047) Foreign 0.0657*** (0.0055) Constant -0.0495 -0.318*** 0.0186 -0.219 0.0693 -0.135 0.515** (0.053) (0.064) (0.071) (0.16) (0.074) (0.094) (0.22) Observations 342657 30912 47618 9346 182016 23720 49045 R2 0.13 0.06 0.11 0.09 0.16 0.15 0.13
Selection bias correction
chi2(5) = 4319.02;
Prob>chi2 =0.0000
chi2(5) = 1244.06;
Prob>chi2 =0.0000
chi2(5) =1703.28; Prob>chi2
=0.0000
chi2(5) = 873.09;
Prob>chi2 =0.0000
chi2(5) = 2720.18;
Prob>chi2 =0.0000
chi2(5) = 1332.17;
Prob>chi2 =0.0000
chi2(5) = 764.31;
Prob>chi2 =0.0000
Note 1: The estimator adopted is the selection and endogeneity correction method by Wooldridge (1995). The procedure is to estimate a two-stage model, in which the first stage estimates a sample selection model of firm survival to obtain a yearly selection mechanism, and the second stage includes the estimated selection mechanism to correct for unobserved simultaneneity. The reported joint significance of yearly selection mechanism variables validates the adoption of the method. Note 2: All estimations include a full set of regional, industrial and year dummy variables. Interaction of yearly dummies and regional dummies are also included to capture time-variant regional policy differences. Note 3: Bootstrapped standard errors are reported in parentheses,*** p<0.01, ** p<0.05, * p<0.1.
25

Table 7: Access to bank loans, IVA growth and regional financial development among profit-making firms
(1) overall (2) SOE (3) COE Private (7)Foreign Dependent variable: IVA
growth (4)Private
with state capital
(5)Pure private
(6)Private with foreign capital
Finance variable BANK loans(t-1) 0.00420*** 0.00363 0.00552** 0.00169 0.00334*** 0.00669*** 0.00781*** (0.00065) (0.0027) (0.0023) (0.0041) (0.00098) (0.0022) (0.0023) Ln(BANK)(t-1)* PRIVY1999
1.879*** 0.806** 1.617*** 0.852* 2.032*** 1.785*** 1.955***
(0.064) (0.32) (0.21) (0.44) (0.083) (0.16) (0.26) Equity finance(t-1) 0.0639*** 0.0466*** 0.0245*** 0.0565*** 0.0709*** 0.0574*** 0.0726*** (0.00084) (0.0036) (0.0028) (0.0064) (0.0013) (0.0041) (0.0025)
Control Initial size -0.0256*** 0.0795*** -0.122*** -0.0143 -0.0293*** -0.0247 -0.0664*** (0.0059) (0.021) (0.018) (0.042) (0.0073) (0.020) (0.016) (Initial size)2 0.623*** -0.367* 0.911*** 0.0291 0.891*** 0.538*** 0.874*** (0.065) (0.19) (0.18) (0.36) (0.081) (0.20) (0.17) Age -0.0421*** 0.0177 0.0834*** -0.00635 -0.0191* -0.182*** -0.606*** (0.0094) (0.030) (0.019) (0.054) (0.011) (0.037) (0.049) Age2 2.088*** 0.414 0.388 1.919* 1.916*** 5.866*** 14.66*** (0.15) (0.53) (0.38) (0.98) (0.21) (0.78) (1.10) Initial IVA level -0.241*** -0.152*** -0.192*** -0.138*** -0.297*** -0.218*** -0.212*** (0.0015) (0.0059) (0.0050) (0.011) (0.0028) (0.0070) (0.0065) Ownership dummy COE 0.127*** (0.0045) Private with state capital
0.112***
(0.0064) Pure domestic private
0.150***
(0.0042) Private with foreign capital
0.145***
(0.0052) Foreign 0.124*** (0.0048) Constant -0.545*** -0.856*** -0.552*** -0.754*** -0.350*** -0.561*** 0.355 (0.047) (0.084) (0.063) (0.15) (0.058) (0.089) (0.23) Observations 502321 38599 62636 11615 291850 31222 66399 R2 0.16 0.07 0.12 0.10 0.21 0.15 0.15
Selection bias correction
chi2(5) = 2612.83;
Prob>chi2 =0.0000
chi2(5) = 996.17;
Prob>chi2 =0.0000
chi2(5) = 928.63;
Prob>chi2 =0.0000
chi2(5) = 1239.27;
Prob>chi2 =0.0000
chi2(5) = 954.17;
Prob>chi2 =0.0000
chi2(5) = 1738.15;
Prob>chi2 =0.0000
chi2(5) = 1184.28;
Prob>chi2 =0.0000
Note 1: The estimator adopted is the selection and endogeneity correction method by Wooldridge (1995). The procedure is to estimate a two-stage model, in which the first stage estimates a sample selection model of firm survival to obtain a yearly selection mechanism, and the second stage includes the estimated selection mechanism to correct for unobserved simultaneneity. The reported joint significance of yearly selection mechanism variables validates the adoption of the method. Note 2: All estimations include a full set of regional, industrial and year dummy variables. Interaction of yearly dummies and regional dummies are also included to capture time-variant regional policy differences. Note 3: Bootstrapped standard errors are reported in parentheses,*** p<0.01, ** p<0.05, * p<0.1.
26