department of defense competition report for fy 2013 · the department of defense ... fy 2013...
TRANSCRIPT

Department of Defense
Competition Report
For FY 2013

DoD Competition Report for Fiscal Year 2013
2
I. Competition Trends The Department of Defense (DoD) total dollars obligated decreased from $361 Billion (B) in Fiscal Year (FY) 2012 to $308 B in FY 2013, representing a 15% drop in total obligations for the year. The overall competition rate remained at 57% to match the prior year as well as the ten year average competition rate. During the ten year period the competition rate has ranged from a high of 61% in FY 2009 to a low of 52% in FY 2004. The competitive dollars obligated decreased from $206 B in FY 2012 to $175 B in FY 2013 and non-competitive dollars obligated decreased from $155 B to $133 B. Chart 1 below represents the ten year trend for competitive and non-competitive dollars obligated.1
Chart 1 – DoD Dollars Competed and Not Competed ($ in Billions)
Overall Competition Table 1 on the following page summarizes competition achievements for the Department and Components. The competition rates for the Components vary depending upon the mission and type of product or service being procured. The 1 The source of FY 2004-2012 data is the DoD Competition Report from FPDS-NG, dated March 18, 2013. The FY 2013 data is from DoD Competition Report, dated January 29, 2014. In FY 2008, the Army mistakenly obligated approximately $13B on a contract and then corrected the mistake via a de-obligation modification in FY 2009. Chart 1 represents the corrected dollar amounts for FY 2008 and FY 2009.
$-
$50
$100
$150
$200
$250
$300
$350
$400
2004 2005 2006 2007 2008 2009 2010 2011 2012 2013
Billi
ons
10 Year Competition Trend Data - DoD Obligations
Total Competed ($B)
Total Not Competed ($B)
52% 56%
57%
59% 60% 61%
60% 58% 57%
57%
Fiscal Year

DoD Competition Report for Fiscal Year 2013
3
competition report tracks obligation and actions based on data from Federal Procurement Data System – Next Generation (FPDS-NG). The report also tracks whether fair opportunity is provided at the order level and only counts orders as competed if fair opportunity is provided to more accurately capture competition achievements on orders under multiple award contracts (MACs) and federal supply schedules (FSS). Based on this methodology, the table below illustrates how the level of competition varied by Component in FY 2013.2
Table 1 – FY 2013 Overall Competition Report by DoD Component
In FY 2013, $175 B was competitively obligated for an overall competition rate of 57% ($175 B/$308 B). Despite the drop in total obligations, the competition rate remained consistent with the FY 2012 rate and ten year average noted earlier. The level of competition achieved by contracting organizations varies widely based upon the mission and type of supply or service being procured. Generally, those contracting organizations whose mission/function includes installation and/or depot level 2 The source is the FPDS Competition Report from January 29, 2014. Figures contained in the Military Department’s and Defense Agency’s Competition Reports vary if the Competition Report was run on any other day since FPDS is a dynamic system. The Defense Commissary Agency’s competed dollar amount excludes obligations of “brand name commercial items” authorized for resale that are not subject to competition. The Defense Contract Management Agency’s (DCMA) total and competed dollar amounts reflect contract administration office obligations/de-obligations in support of other components. The DCMA Procurement Centers achieved a competition rate of 63%.
Contracting Agency Total Dollars Competed Dollars% Competed
Dollars% Competed Dollar Goal
DEPT OF THE ARMY 87,295,807,563$ 57,469,056,740$ 66% 65%DEPT OF THE NAVY 93,560,985,370$ 38,253,994,996$ 41% 47%DEPT OF THE AIR FORCE 55,163,102,673$ 22,437,445,341$ 41% 38%DEFENSE LOGISTICS AGENCY 33,792,794,869$ 27,683,624,572$ 82% 86%DEFENSE ADVANCED RESEARCH PROJECTS AGENCY 686,282,493$ 633,546,405$ 92% 90%DEFENSE COMMISSARY AGENCY 1,476,646,768$ 1,309,550,430$ 89% 90%DEFENSE CONTRACT MGMT AGENCY (See Footnote 2) 59,188,501$ 3,665,245$ 63% 68%DEFENSE FINANCE AND ACCOUNTING SERVICE 140,334,408$ 118,488,988$ 84% 61%DEFENSE HUMAN RESOURCES ACTIVITY 228,439,081$ 121,266,753$ 53% 61%DEFENSE INFORMATION SYSTEMS AGENCY 4,650,584,061$ 3,671,633,377$ 79% 85%DEFENSE MEDIA ACTIVITY 96,892,037$ 75,716,486$ 78% 82%DEFENSE MICROELECTRONICS ACTIVITY 520,230,344$ 509,598,744$ 98% 89%DEFENSE SECURITY COOPERATION AGENCY 60,172,027$ 43,118,531$ 72% 84%DEFENSE SECURITY SERVICE 79,439,134$ 69,532,962$ 88% 92%DEFENSE THREAT REDUCTION AGENCY 921,892,940$ 787,400,561$ 85% 86%DEPT OF DEFENSE EDUCATION ACTIVITY 246,830,149$ 212,442,976$ 86% 86%JOINT IMPROVISED EXPLOSIVE DEVICE DEFEAT ORG. 72,924,170$ 39,111,481$ 54% 33%MISSILE DEFENSE AGENCY 7,645,352,625$ 2,238,466,446$ 29% 63%TRICARE MANAGEMENT ACTIVITY 12,100,451,655$ 10,888,626,725$ 90% 93%U.S. SPECIAL OPERATIONS COMMAND 2,479,480,821$ 1,860,678,109$ 75% 75%USTRANSCOM 5,456,801,818$ 5,400,956,523$ 99% 98%WASHINGTON HEADQUARTERS SERVICES 1,197,242,554$ 721,988,631$ 60% 73%
Total 307,931,876,059$ 174,549,911,023$ 57% 60%

DoD Competition Report for Fiscal Year 2013
4
maintenance services are better suited to competition and achieve the higher competition rates. This is also true for contracting organizations heavily involved in services, commercial and construction procurements. The competitive percentages are lower in organizations that buy major systems, (including weapons, automated information systems and Foreign Military Sales), specialized equipment, spares and upgrades that may need to be purchased from the original equipment manufacturer (OEM) or supplier. These programs may require sole source extensions of contracts that were originally competed because the programs have moved past the stage in their lifecycle where competition is economically viable. These sole source extensions are made in accordance with long-standing laws and regulations that recognize one responsible source. Consistent with the above, the non-competitive obligations are the result of high dollar sole source acquisitions where there is not a competitive market due to the lack of technical data packages and proprietary data rights for mature and aging aircraft programs like the F-22, C-17, and satellite programs like the Advanced Extremely High Frequency (AEHF), Evolved Expendable Launch Vehicle (EELV), and Space-Based Infrared System (SBIRS). The Navy’s non-competitive obligations increased due to continued investments and increased production quantities for the F-35 and P-8 aircraft as well as construction of CVN-79. Foreign Military Sales (FMS) procurements for aircraft continued to be a significant driver of non-competitive contracts for the Air Force, and the Missile Defense Agency experienced a significant increase in FMS procurements for components of the Ballistic Missile Defense System. The competition rate above is based on dollar obligations. However, if based on contract actions, the competition rate increased from 85% in FY 2012 to 97% in FY 2013, reflecting continued improvement in competition for lower dollar value contract actions. Effective Competition The Department continues to track effective competition, which was a measure of competition under the Under Secretary of Defense for Acquisition, Technology and Logistics (USD (AT&L’s)) Better Buying Power (BBP) Initiative. The measure tracks acquisitions using competitive procedures in which only one offer is received. Defense Procurement and Acquisition Policy (DPAP), in coordination with Defense Manpower Data Center (DMDC), used the standard report “Competitive Procedures, with Only One Offer” to measure contract obligations where competition was sought but only one offer received.

DoD Competition Report for Fiscal Year 2013
5
As noted previously, the Department’s “Total Competed Dollars” decreased to $175 B in FY 2013 with approximately $152 B in “Effective Competed Dollars” and $23 B in “Only One Offer Competed Dollars” resulting in an “Effective” competition rate of 87%. This is a 2% increase over FY 2012 which demonstrates continued improvement under USD (AT&L’s) BBP Initiative for promoting competition. Table 2 below provides a summary of the effective competition achievements for the Department and each Component in FY 2013.3
Table 2 – FY 2013 Effective Competition Report by DoD Component
Number of Offers The Department also analyzed of the number of offers received on competitive awards compared to civilian agencies. The “number of offers” is used in conjunction with the “Effective Competition” report described above to provide more detail on the number of offers received under solicitations using competitive procedures. Chart 2 provides a comparative analysis between DoD and civilian agencies on the number of offers received under competitive solicitations based on dollars obligated in the FPDS. 3 The source is the FPDS Competed with Only One Offer Report run on January 29, 2014. Figures contained in the Military Department’s and Defense Agency’s Reports may vary if the Competed with One Offer Report was run on any other day since FPDS is a dynamic system. The DCMA dollar amounts reflect obligations/de-obligations for contract administration office in support of other components. The DCMA Procurement Centers achieved an effective competition rate of 55%.
Contracting AgencyTotal Competed
DollarsOnly One Offer
Competed DollarsEffective
Competed Dollars
% Effective Dollars
CompetedDEPT OF THE ARMY 57,469,056,740$ 8,069,378,380$ 49,399,678,359$ 86%DEPT OF THE NAVY 38,253,994,996$ 6,678,862,592$ 31,575,132,405$ 83%DEPT OF THE AIR FORCE 22,437,445,341$ 3,263,825,970$ 19,173,619,370$ 85%DEFENSE LOGISTICS AGENCY 27,683,624,572$ 2,181,139,677$ 25,502,484,896$ 92%DEFENSE ADVANCED RESEARCH PROJECTS AGENCY 633,546,405$ 35,548,178$ 597,998,227$ 94%DEFENSE COMMISSARY AGENCY 1,309,550,430$ 12,723,605$ 1,296,826,824$ 99%DEFENSE CONTRACT MANAGEMENT AGENCY (See Footnote 3) 3,665,245$ (56,036,912)$ 59,702,157$ 55%DEFENSE FINANCE AND ACCOUNTING SERVICE 118,488,988$ 32,620,230$ 85,868,758$ 72%DEFENSE HUMAN RESOURCES ACTIVITY 121,266,753$ 15,109,013$ 106,157,741$ 88%DEFENSE INFORMATION SYSTEMS AGENCY 3,671,633,377$ 864,495,785$ 2,807,137,592$ 76%DEFENSE MEDIA ACTIVITY 75,716,486$ 6,729,300$ 68,987,186$ 91%DEFENSE MICROELECTRONICS ACTIVITY 509,598,744$ 498,460,913$ 11,137,831$ 2%DEFENSE SECURITY COOPERATION AGENCY 43,118,531$ 7,924,412$ 35,194,119$ 82%DEFENSE SECURITY SERVICE 69,532,962$ 3,391,404$ 66,141,558$ 95%DEFENSE THREAT REDUCTION AGENCY 787,400,561$ 86,210,749$ 701,189,811$ 89%DEPT OF DEFENSE EDUCATION ACTIVITY 212,442,976$ 36,595,047$ 175,847,929$ 83%JOINT IMPROVISED EXPLOSIVE DEVICE DEFEAT ORGANIZATION 39,111,481$ 224,896$ 38,886,586$ 99%MISSILE DEFENSE AGENCY 2,238,466,446$ 495,730,215$ 1,742,736,230$ 78%TRICARE MANAGEMENT ACTIVITY 10,888,626,725$ 27,430,934$ 10,861,195,791$ 100%U.S. SPECIAL OPERATIONS COMMAND 1,860,678,109$ 88,786,651$ 1,771,891,458$ 95%USTRANSCOM 5,400,956,523$ 157,840,012$ 5,243,116,511$ 97%WASHINGTON HEADQUARTERS SERVICES 721,988,631$ 141,554,164$ 580,434,467$ 80%
Total 174,549,911,023$ 22,648,545,218$ 151,901,365,805$ 87%

DoD Competition Report for Fiscal Year 2013
6
Chart 2 – Number of Offers on Competitive Award Dollars4
The percentage breakout of offers/bids are comparable except for “single bid” obligations which are 13% of obligations for DoD compared to 18% for the civilian agencies, and two bids obligations which are 28% of obligations for DoD compared to just 20% for Civilian Agencies. The DoD share of single bid obligations at 13% reflects a two percent drop from 15% in FY 2012 and continued improvement in effective competition. Fair Opportunity Federal Acquisition Regulation (FAR) 16.505(b)(1) requires fair opportunity be provided for each delivery/task order issued under multiple award contracts (MAC), except for limited circumstances that require a written determination justifying the exception. The determinations for exceptions to fair opportunity require the same level of approval as non-competitive justification and approval (J&A) documents. The Department began tracking this element of competition in FY 2009, and continues to report on fair opportunity using the FPDS-NG, Fair Opportunity Workflow under the Competition Report. Chart 3 illustrates the fair opportunity trend for DoD from FY 2011 through FY 2013. Consistent with the decrease in total competed obligations, the total dollars subject to fair opportunity decreased from $60 B in
4 Source of data is FPDS as of March 24, 2013. The “0” bids represent BOAs, BPAs, FSS, and GWACs contract actions that do not report number of offers and are included in the zero bid category.
0%
13%
28%59%
DoD1%
18%
20%62%
Civilian
0 Bids 1 Bids 2 Bids 3+Bids

DoD Competition Report for Fiscal Year 2013
7
FY 2012 to $50 B in FY 2013, yet the rate of fair opportunity competition increased slightly from 89% to 91%.5
Chart 3 – FY 2011 to FY2013 Fair Opportunity Trend Data
In addition to the Fair Opportunity Workflow in the Competition Report, Defense Manpower Data Center (DMDC) provides an adhoc report that identifies the extent of fair opportunity achievement by the various types of MACs. Specifically, whether a DoD order is placed against a DoD awarded multiple award task or delivery order contract, GSA Federal Supply Schedule (FSS), Government-wide Acquisition Contract (GWAC), or a multiple award task or delivery order contract awarded by another non-DoD activity. Table 3 summarizes DoD fair opportunity achievements for FY 2013 based on the type of multiple award contract6. 5 The source for the FY 2011, 2012, and 2013 fair opportunity statistics are the FPDS-NG Competition Reports utilizing the fair opportunity workflow “frozen data” as of January 6, 2012, January 14, 2013, and January 29, 2014 respectively. 6 Source of data is FPDS-NG as of February 10, 2014.
88%
89%
91%
$0
$10
$20
$30
$40
$50
$60
$70
FY 2011 FY 2012 FY 2013
Bill
ions
Orders under Multiple Award Contracts
Fair Opportunity Given Exceptions to Fair Opportunity

DoD Competition Report for Fiscal Year 2013
8
Table 3 – Fair Opportunity by Type of Multiple Award Contract
As noted above, the extent of fair opportunity competition achieved increased slightly to 91% in FY 2013 with a 2% increase in fair opportunity for DoD MACs, which comprise 85% of the Department’s MAC task/delivery order obligations. GSA FSS and GWAC both saw slight increases in the percent of fair opportunity given, while the total obligations for each category decreased. Non-Competitive Obligations The competition report includes a summary of the non-competitive obligations from FY 2013. Table 4 reflects total dollars obligated, total dollars competed, null values for extent competed and total dollars not competed. The total dollars not competed decreased $21.2 B from $154.5 B in FY 2012 to $133.3 B in FY 2013. The report shows non-competed “orders with exceptions to fair opportunity” decreased $2.1 B from $6.8 B in FY 2012 to $4.7 B in FY 2013. Non-competitive contract obligations authorized by Justification and Approval (J&A) authority decreased $19 B from $147.7 B in FY 2012 to $128.7 B in FY 2013. The percentage breakout for the non-competitive FAR based J&A exceptions remained consistent with previous years. The majority (77.8%) of non-competitive dollars obligated were under FAR 6.302-1 “Only One Source.” As noted in the overall competition section above, many of the non-competitive contract obligations are for weapon systems and specialized equipment that are important investments in support of our national security strategy. These programs may have been originally competed, but now require sole-source contract extensions because the programs have moved past the stage in their program lifecycle where competition is economically viable. The Department continues to take steps to increase competition for major systems by introducing competition during the sustainment phase of a product’s life cycle through the use of open systems and open architectures.
Total ObligationsUnder MACs DoD MACs GSA FSS GWAC
Non-DoD MACs
Obligations 50,210,123,137$ 42,671,150,255$ 5,235,193,264$ 1,864,703,983$ 439,075,635$ % of Total Order Obligations 100% 85% 10% 4% 1%Fair Opportunity Given 45,546,768,060$ 39,602,256,632$ 3,929,863,117$ 1,612,817,553$ 401,830,759$ % of Fair Opportunity Given (Obligations)by Type of Multiple Award Contract 91% 93% 75% 86% 92%

DoD Competition Report for Fiscal Year 2013
9
Table 4 – Non-Competitive Details7
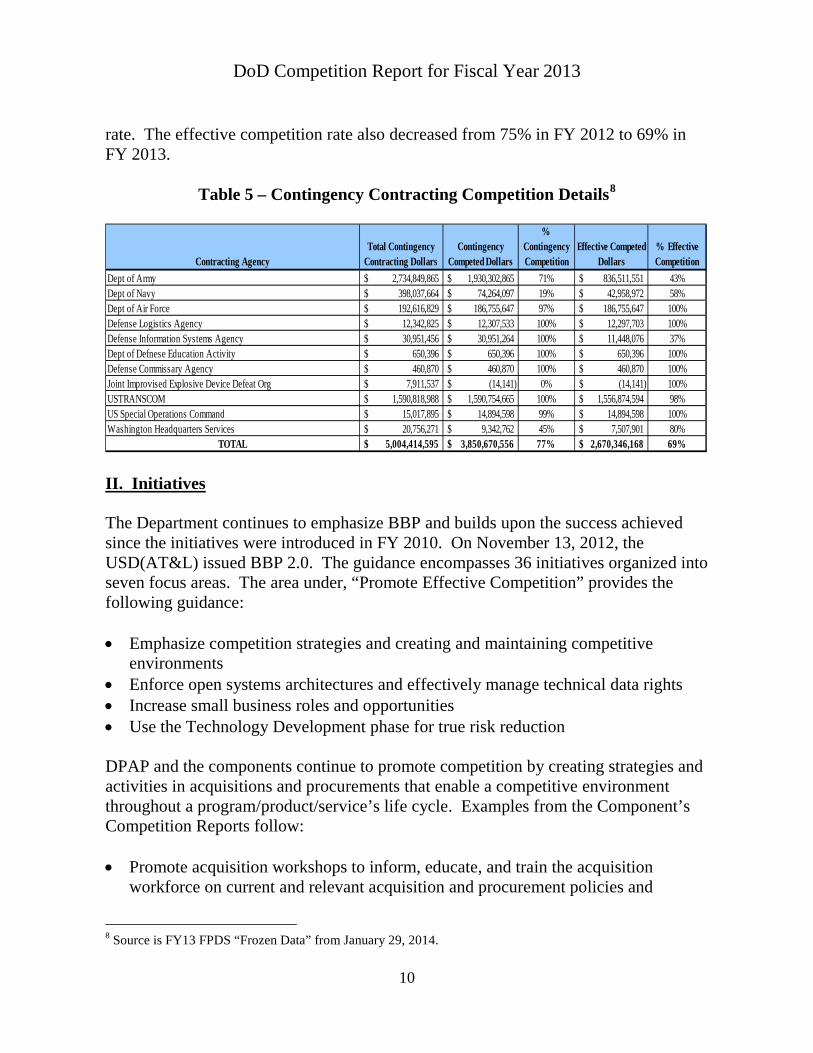
The non-competitive dollars obligated under the next highest J&A authority was for contracts awarded under FAR 6.302-4 “International Agreements,” representing contracts awarded on behalf of a foreign government (i.e., Foreign Military Sales) decreased $2.9 B from $12.0 B in FY 2012 to $9.1 B in 2013. The remaining J&A authorities either decreased slightly or remained constant with the FY 2012 values, with the exception of FAR 6.302-7 “Public Interest,” which increased from $.3 B in FY 2012 to $.6 B in FY 2013. Contingency Contracting DPAP continued to track competition for actions in support of Operation Enduring Freedom (OEF), as established under Section 844 (a) of the FY 2012 National Defense Authorization Act. Table 5 summarizes the Department and Component level contingency contracting dollars obligated, competed and effective competed dollars obligated, and the resulting competition rates for FY 2013. The total contingency contracting dollars decreased from $9.3 B in FY 2012 to $5.0 B in FY 2013, a reduction of $4.3 B consistent with reduce actions in support of OEF. The contingency contracting competition rate decreased from 87% in FY 2012 to 77% in FY 2013, based on a 10% drop in the Army’s contingency contracting competition
7 Source is FY13 FPDS “Frozen Data” from January 29, 2014.
Total Dollars Obligated $ 307,931,876,060 % of Total
DollarsTotal Dollars Competed 174,549,911,023$ 56.7%Null Values and Report Delta 17,637,485$ 0.0%Total Dollars Not Competed 133,364,327,552$ 43.3% Orders with an Exception to Fair Opportunity 4,664,073,748$ 3.5% 1.5% Contract Actions Authorized by J&A Authority 128,700,253,804$ 96.5% 41.8%
Breakout of Various J&A Authorities% of
J&A Authorities% of Total
Dollars FAR 6.302-1 "Only One Source" 100,167,004,525$ 77.8% 32.5% FAR 6.302-2 "Urgency" 2,110,122,803$ 1.6% 0.7% FAR 6.302-3 "Mobilization, Essential R&D" 2,169,985,920$ 1.7% 0.7% FAR 6.302-4 "International Agreement" 9,088,227,456$ 7.1% 3.0% FAR 6.302-5 "Authorized or Required by Statute" 8,598,406,361$ 6.7% 2.8% FAR 6.302-6 "National Security" 3,602,143,523$ 2.8% 1.2% FAR 6.302-7 "Public Interest" 591,060,589$ 0.5% 0.2% Not Competed Using SAP 2,134,566,791$ 1.7% 0.7% Null value for reason not competed 238,735,836$ 0.2% 0.1%
Total 128,700,253,804$ 100.0% 41.8%
DoD Competition Report for Fiscal Year 2013
10
rate. The effective competition rate also decreased from 75% in FY 2012 to 69% in FY 2013.
Table 5 – Contingency Contracting Competition Details8
II. Initiatives The Department continues to emphasize BBP and builds upon the success achieved since the initiatives were introduced in FY 2010. On November 13, 2012, the USD(AT&L) issued BBP 2.0. The guidance encompasses 36 initiatives organized into seven focus areas. The area under, “Promote Effective Competition” provides the following guidance: • Emphasize competition strategies and creating and maintaining competitive
environments • Enforce open systems architectures and effectively manage technical data rights • Increase small business roles and opportunities • Use the Technology Development phase for true risk reduction DPAP and the components continue to promote competition by creating strategies and activities in acquisitions and procurements that enable a competitive environment throughout a program/product/service’s life cycle. Examples from the Component’s Competition Reports follow: • Promote acquisition workshops to inform, educate, and train the acquisition
workforce on current and relevant acquisition and procurement policies and
8 Source is FY13 FPDS “Frozen Data” from January 29, 2014.
Contracting AgencyTotal Contingency
Contracting DollarsContingency
Competed Dollars
% Contingency Competition
Effective Competed Dollars
% Effective Competition
Dept of Army 2,734,849,865$ 1,930,302,865$ 71% 836,511,551$ 43%Dept of Navy 398,037,664$ 74,264,097$ 19% 42,958,972$ 58%Dept of Air Force 192,616,829$ 186,755,647$ 97% 186,755,647$ 100%Defense Logistics Agency 12,342,825$ 12,307,533$ 100% 12,297,703$ 100%Defense Information Systems Agency 30,951,456$ 30,951,264$ 100% 11,448,076$ 37%Dept of Defnese Education Activity 650,396$ 650,396$ 100% 650,396$ 100%Defense Commissary Agency 460,870$ 460,870$ 100% 460,870$ 100%Joint Improvised Explosive Device Defeat Org 7,911,537$ (14,141)$ 0% (14,141)$ 100%USTRANSCOM 1,590,818,988$ 1,590,754,665$ 100% 1,556,874,594$ 98%US Special Operations Command 15,017,895$ 14,894,598$ 99% 14,894,598$ 100%Washington Headquarters Services 20,756,271$ 9,342,762$ 45% 7,507,901$ 80%
TOTAL 5,004,414,595$ 3,850,670,556$ 77% 2,670,346,168$ 69%

DoD Competition Report for Fiscal Year 2013
11
procedures to create/enhance awareness of Federal and DoD procurement trends, issues and challenges;
• Emphasize competition in small business subcontracting and technology development efforts under the Small Business Innovative Research Program;
• Train non-acquisition professionals to ensure performance work statements are clearly written and not overly restrictive with metrics that favor the incumbent contractor;
• Continued education of requirements organizations in writing functional, outcome-based requirements statements for requirements;
• Utilize contract action boards to review market research for sources and quality and level of competition;
• Consider component level breakout of weapon systems acquisitions where applicable and elements of services acquisition that can be broken out to enhance the degree of competition on “parts of the whole”;
• Challenge brand name or military unique specifications to minimize non-competitive contract awards;
• Require that all Justification and Approval (J&A) packages include copies of the predecessor J&A as a reference document for each J&A approved at a level higher than the Contracting Officer;
• Introduce Better Buying Tool, which provides techniques and tools to implement Better Buying Power 2.0 and enhance competition by addressing all of the BBP 2.0 factors and sub-factors and provides 80 techniques to enhance competition in all phases;
• Continue use of Request for Information (RFI) on large dollar, complex procurements in order to enhance likelihood of receiving multiple offers;
• Develop an automated tool called Matching Acquisition Strategies to Industry Capabilities (MASIC) to reduce direct material costs by attracting more suppliers;
• Utilization of Supply Assurance through Multisource Contracting clause, which provides avenue for unqualified sources to become qualified through limited production;
• Implement use of second source option Contract Line Item Numbers (CLINs) within competitions to require prime contractor to qualify another vendor for components for future competitions;
• Use of Service Requirements Review Boards to validate service requirements early in the process to improve use of performance based contracting, avoid duplication of services, and provide increased opportunity for competition and small business participation;
• Increase leadership oversight on “bridge” contracts to minimize use and ensure adequate steps are taken to award follow-on competitive using predictive scheduling tools;
DoD Competition Report for Fiscal Year 2013
12
• Continue focus on ensuring accuracy of data reported in the Federal Procurement Data System;
• Continue Peer Reviews and Program Management Reviews to encourage more competition and continuous process improvement;
• Brief Acquisition Executives on competition metrics achievements; • Monitor competition performance on a monthly basis, via agency metric that track
agency and supply chain competition against the goals, and provided updates during monthly metrics reviews and senior levels in the component;
• Create tool for actions that require a J&A for other than full and open competition to track and report on plans to advance competition;
• Conduct Industry Days for services acquisitions to share information and foster better communication with industry to expand the “industrial base” for upcoming acquisitions;
• Develop and employ forecasting tools to identify upcoming acquisitions early enough in the process to effect change and maximize competition;
• Form market intelligence teams to analyze the private and public sectors to discover potential strategic sourcing and breakout opportunities to increase competition;
• Require annual competition training and encourage the use of the Defense Acquisition University (DAU) CLC 055 Course - Competition Requirements for DoD Acquisition for contracting and acquisition personnel.
III. Barriers to Competition As noted above, the Department continues making efforts to improve competition. Aside from the product/service mix discussed in Section I, the Component’s Competition Reports provide additional impediments to competition, some of which are summarized below: • Reduction in new starts and major programs and reliance upon non-competitive
follow-on procurements for mature systems and aging weapon systems; • Technical data packages that do not state requirements in terms of functions to be
performed, performance required, or essential physical characteristics; • High Dollar directed source Foreign Military Sales (FMS) procurements using the
exception at FAR 6.302-4 International Agreement; • Approval process and substantial investment/testing required for alternate sources
for critical items and maintenance capability; • Classified Requirements using the exception at FAR 6.302-6 National Security; • Non-competitive and limited/single source actions in support of socio-economic
programs under FAR Parts 8 and 19;

DoD Competition Report for Fiscal Year 2013
13
• Unique/critical mission or technical requirements with proprietary rights for items developed at private expense for legacy systems, software, telecommunications/satellite equipment and services;
• Budget austerity makes it difficult to identify funding for the purchase of technical data package;
• Extended Continuing Resolutions necessitating sole source “bridge” contracts to avoid program disruptions.
IV. Recommendation to the Defense Acquisition Executive As the DoD Competition Advocate, the Director, DPAP works with Component Competition Advocates throughout the year to emphasize competition and review metrics results. DPAP and DMDC partner with Component Competition Advocates to enable visibility and assist in the analysis of overall, effective and contingency competition as well as fair opportunity achievements. System of Accountability In FY 2013, the Department used the competition report in FPDS-NG to track overall competition statistics. The Department uses the same report to track fair opportunity competition on task/delivery orders under multiple award contracts. As described in the Effective Competition section previously, DPAP uses the FPDS-NG report entitled “Competitive but Only One Offer” to track and report effective competition for the Department and Components in FY 2013. The Number of Offers and Contingency Contracting information are based on Ad Hoc FPDS reports. Collectively these reports are used to track competition and to prepare the annual competition reports. DOD Competition Goals In FY 2013, the Department’s overall competition rate of 57% fell short of the goal of 60%. As noted previously, the military departments drive the Department’s competitively awarded dollar obligations, and the reduction in obligations and increases in non-competitive contact obligations are the primary source for the shortfall. Barriers to competition from non-competitive procurements for major systems, foreign military sales, statutory requirements, and limited new starts of programs in the current budget environment are expected to continue in FY 2014. For FY 2014, the Department’s overall competition goal was set at 58% and the effective competition goal at 88.8%. The overall competition goals for the components were calculated by incorporating a two percent improvement over the FY 2013 achievements; components that achieved a FY 2013 rate greater than 90% to

DoD Competition Report for Fiscal Year 2013
14
maintain the rate. The components FY 2014 effective competition goals remained the same as the FY 2013 goals. The contingency contracting goals match the component’s overall and effective competition rates. Recommendation The USD (AT&L) continues to focus on the importance of increased competition. The rollout of BBP 2.0 policies and initiatives highlight the Under Secretary’s commitment to improving the Department’s Overall and Effective Competition rates. Attachments: Army Report Department of the Navy Report Air Force Report Defense Logistics Agency Report


1
DEPARTMENT OF THE NAVY
FISCAL YEAR 2013 COMPETITION REPORT
In accordance with the Director, Defense Procurement and Acquisition Policy
(DPAP) Memorandum dated January 6, 2014, the Deputy Assistant Secretary of the Navy
(Acquisition and Procurement) (DASN (AP)), as the Competition Advocate General for
the Department of the Navy (DON), hereby submits the DON Competition Report for
Fiscal Year (FY) 2013.
The Department of the Navy continues pursuing the Secretary’s governing
principles for Navy and Marine Corps acquisition, which entail improving capability
delivered to the fleet with a clear focus on affordability while minding the health of the
industrial base. During FY 2013, the DON successfully continued its quest for
significant improvements in effective competition on several fronts with improved
producibility of designs, increasing use and application of open architecture solutions,
effective application of should cost techniques and appropriate incentives for cost
reductions, and increasing use of service contract review boards as cornerstones.
Additionally, we continue strengthening our workforce core competencies in technical,
program management, quality assurance, contracting and cost estimating.
This foundation led to successful acquisitions in our ship, aircraft and weapon
system programs during FY 2013 as well in acquisitions across the DON for other
hardware, services, construction, maintenance and repair. For example within our Naval
Sea Systems Command (NAVSEA), the Air & Missile Defense Radar (AMDR) program
successfully conducted phased competitive prototyping that result in Engineering
Manufacturing and Development (EMD) competitive offers including a higher
percentage of Commercial Off The Shelf (COTS) components. The DON implemented
the use of second source option Contract Line Item Numbers (CLINs) within
competitions to require a prime contractor to qualify another vendor for components for
future competitions and inclusion of data rights buy-out options within competitive
evaluations. The DON illustrated this by the inclusion of Data Items and Provisioned
Items Order (PIO) with options for EMD within the initial Request for Proposals (RFP).
Additionally, DON has successfully converted several of its requirements that have been
sole source for many years to full and open competition, many of which stemmed from
NAVSEA’s Program Executive Office (PEO) for Integrated Warfare Systems (IWS),
including: 1) MK 41 Vertical Launch System (VLS) Launcher Production; (2) VLS
Canisters and, Associated Equipment in support of the U.S. Navy and NATO
SEASPARROW Missile Consortium requirements; and, (3) Surface Electronic Warfare
Improvement Program Block 3 Preliminary Design, Low Rate Initial Production (LRIP)

2
and Engineering Services. Among our aircraft programs in conjunction with these efforts
the DON has successfully competed 737 commercial common spare parts from the
Boeing P-8A LRIP IV production contract. In early FY2013 the DON formed a
Requirements Review Working Group, a multi-functional team comprised of contracts,
program office personnel, and several Research Development Testing and Evaluation
(RDT&E) and Fleet customers. The Working Group determined that although the
Government property currently installed on the contractor aircraft was desired, the need
for it was not certain because the RDT&E customers were unable to validate the
requirements in the upcoming contract. Thus the requirement for contractor aircraft to be
outfitted with Government property was removed from the follow-on requirement,
eliminating a condition that had historically negatively impacted competition.
In FY 2013 the DON continued to drive open competition by conducting
aggressive market research, including several informative and well-attended Industry
Days. In conjunction with this effort, the DON aggressively employed the use of Federal
Business Opportunities (FedBizOpps) website and in-depth analysis of current market
conditions and intelligence that resulted in an overall net increase in full and open
competition. As a result, the previous sole source contracts have been converted into a
full and open competition for small aircraft maintenance requirement(s), and a
competitive small business set-aside for the propeller aircraft requirement. Award is
anticipated in FY14. On the weapon systems front, the DON issued a competitive
commercial item Request for Quote (RFQ) for an electro-optical and infrared
collimator and LASER measurement device for use in the FA-18/EA-18G Advanced
Weapons Laboratory. Use of simplified procedures under FAR 13.5 resulted in multiple
competitive quotes. Additionally, the DON is conducting a robust competition for: (1)
The Long Range Land Attack Projectile (LRLAP) to include LRIP, PIO, and Engineering
Services that will be delivered to DDG 1000/1001/1002 to support the MK 51 Advanced
Gun System; (2) AEGIS Combat System Engineering Agent (CSEA) requirements
supporting the AEGIS combat and weapon systems on DDG 51 and CG 47 ships; (3)
Ship Self Defense Systems (SSDS) CSEA Requirements; (4) Ship Integration and Test
(SI&T) requirements supporting the AEGIS combat and weapon systems on DDG 51 and
CG 47 class ships; and (5) Cooperative Engagement Capability (CEC) including the
Common Array Block Family of Antennas and CEC Production Requirements.
In the Services arena, the DON’s Director for Services Acquisition continues
pursuing improved tradecraft in services, including increased competitive opportunities in
the services portfolio. During FY 2013, the DON continued a trend seen in FY 2012 by
awarding increased numbers of Multiple Award Contracts for services, which establishes
a foundation for improved fair opportunity competition through the award of competitive
task and delivery orders. Additionally, Service Requirements Review Boards
implemented across the DON are validating services requirements early in the process to
improve use of performance based contracting, avoid duplication of services within the
DON, and to provide increased opportunity for small business and increased competition.
Lastly, DON continued to execute the Health Assessment process whereby a thorough
3
review of command level processes for contract administration and requirements
generation were reviewed for best practices and areas of improvement.
The DON’s electronic Purchase Request Procedures and DON Source Selection
Guide instituted guidance for Service Contracts via performance-based requirements.
Service contracts were reviewed to ensure requirements were not restrictive, and that
statements of work (SOWs) contained performance standards and objectives instead of
directing the manner of performance. Members of the DON Competition Advocate and
Director for Services Staff are proactively engaged with Department of Defense (DOD)
level panels sharing best practices and lessons learned, and seeking improvements in
effective competition.
DON Competition Achievement
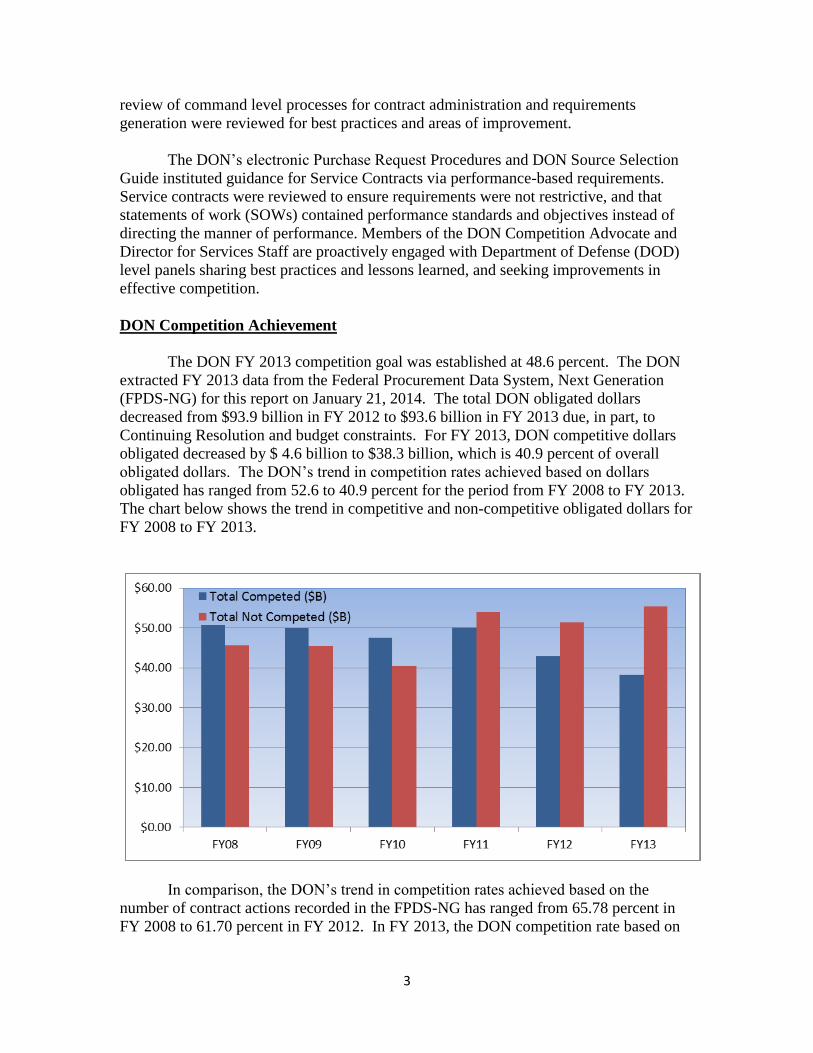
The DON FY 2013 competition goal was established at 48.6 percent. The DON
extracted FY 2013 data from the Federal Procurement Data System, Next Generation
(FPDS-NG) for this report on January 21, 2014. The total DON obligated dollars
decreased from $93.9 billion in FY 2012 to $93.6 billion in FY 2013 due, in part, to
Continuing Resolution and budget constraints. For FY 2013, DON competitive dollars
obligated decreased by $ 4.6 billion to $38.3 billion, which is 40.9 percent of overall
obligated dollars. The DON’s trend in competition rates achieved based on dollars
obligated has ranged from 52.6 to 40.9 percent for the period from FY 2008 to FY 2013.
The chart below shows the trend in competitive and non-competitive obligated dollars for
FY 2008 to FY 2013.
In comparison, the DON’s trend in competition rates achieved based on the
number of contract actions recorded in the FPDS-NG has ranged from 65.78 percent in
FY 2008 to 61.70 percent in FY 2012. In FY 2013, the DON competition rate based on

4
number of contract actions was 61.1 percent based on 290,687 total actions recorded.
The chart below shows the trend in rate for competitive and non-competitive actions for
FY 2008 to FY 2013.
In accordance with the January 6, 2014 DPAP guidance, the DON’s FY 2014
goal for overall competition was established at 41.7 percent and reflects a .8 percent
increase over the DON’s FY 2013 achieved rate based on dollars obligated.
Additionally, the DON’s FY 2014 goal for effective competition was established at 87.3
percent and reflects a 4.9 percent improvement over the FY 2013 achieved rate based on
competed dollars obligated. The DON is committed to improving competitive and small
business opportunities, and continues to improve competitive opportunity through open
architecture solutions and improved tradecraft in services. However, the continued
investment and increasing production quantities for F-35 and P-8A aircraft will continue
to negatively affect the DON’s competition rate in FY 2014. The FY 2013 obligations
for construction of the CVN 79 are coded as a non-competitive action, which also
ultimately lead to a negative effect on DON’s competition rate in FY 2013. Furthermore,
the anticipated total obligations for service contracts in FY 2014 will continue to decrease
which is likely to adversely impact the overall competition percentage.
In past Competition Reports, the DON has reported on the trend in fair
opportunity in task and delivery order contracts under multiple award contracts. The
table below illustrates the DON rate achieved for fair opportunity from FY 2010 through
FY 2013.
FY 2010 FY 2011 FY 2012 FY 2013
84% 87% 88% 89%

5
In keeping with initiatives to improve real competition (i.e., cases where more
than one offer was received), FY 2013 is the third year where goals for ‘effective
competition’ were measured. The DON’s goal for effective competition in FY 2013 was
established at 87.3 percent of competed dollars obligated, an 8 percent increase over the
FY 2012 achieved rate of 79.4 percent. The table below shows the DON rate achieved
for effective competition from FY 2011 through FY 2013.
FY 2011 FY 2012 FY 2013
77.7% 79.4% 82.5%
The DON has consistently improved its effective competition rate over the last
three years, with FY 2013 yielding an improvement of 2.9 percent. The DON is
committed to increasing competition where possible and to obtaining improvements in
real competition, including effective competition at the task or delivery order level. The
trend in DON toward increased numbers of multiple award contracts is establishing a
foundation for improvements in fair opportunity and effective competition at the task or
delivery order level. Additionally, the DON achieved an overall competition rate of 20.3
percent in FY 2013 for contingency contracting actions in support of Operation Enduring
Freedom (OEF).
The Federal Acquisition Regulation (FAR), Subpart 6.5 Competition Advocates,
requires agency and procuring activity competition advocates to promote competition and
improve competitive opportunity across their portfolio of acquisitions; and, to provide
oversight of competition in the contracting operations of the agency. As a result, the
DON’s Competition Advocate requires each of its major Commands to assess and submit
their achievements on an annual basis in accordance with the reporting requirement at
FAR 6.502, duties and responsibilities. A summary of the results and actions taken
follows.
Opportunities and actions taken, including any new initiatives, to acquire
Commercial Items (CI) to meet the needs of the agency:
The DON contracting competency continues to screen incoming requirements to
maximize the use of commercial contracts. Contracting Officers continue to release
Requests for Information (RFIs) and Sources Sought notices in FedBizOpps in search of
commercially available items that meet customer requirements. A few of the many
examples cited in Command reports are below.
NAVSEA headquarters and field activities continued to use General Services
Administration’s (GSA) "e-Buy" and FedBid reverse auction sites to increase commercial
item contracting. Several offices held industry days, interchange meetings and pre-
solicitation conferences to communicate requirements and ensure understanding to
maximize the use of commercial items. This has enabled the development of a catalog of
vendors for use in commercial item market research. The NAVSEA competency

6
regularly uses GSA Advantage, GSA “e-Buy”, and Enterprise Software Initiative (ESI) to
further increase commercial competition.
The Military Sealift Command (MSC) increased reliance on market surveys and
continues to increase pre-solicitation engagements with industry using events like
“Industry Days” and draft RFP for commercial items, to broaden the pool of potential
offerors. These focused exchanges helped identify restrictive non-mandatory
DoD/Government requirements which could be transitioned into less restrictive
commercial standards. MSC also refined its distribution network requirement
commodities contracts so they were aligned with commercial practices.
Naval Air Warfare Center Aircraft Division (NAWCAD) Lakehurst successfully
used reverse auctions for competing non-complex commercial items. The reverse auction
process enables the procuring activity to publicize its requirements where multiple sellers
are able to offer bids on the contract. The sellers are able to view the current low offer as
the auction progresses and then make a business decision whether to submit a lower
offer. According to DOD's "Guidelines for Creating and Maintaining a Competitive
Environment for Supplies and Services in the Department of Defense (October 2013)"
implementing Better Buying Power (BBP) 2.0, reverse auctions are an excellent method
of strategic sourcing and ensure that the Government is receiving fair and reasonable
pricing. Reverse auctions are appropriate when the requirements are well-defined and
most beneficial for commodities or non-complex services. Marine Corps Field
Contracting System (MCFCS) offices utilize a variety of enterprise-level contracting
vehicles to acquire commercial supplies and services to include the Naval Supply
Systems Command (NAVSUP) Global Business Solutions (GBS) contract for temporary
labor, Government Wide Acquisition Contracts (GWAC) from the National Institute of
Health’s NITAAC, NASA’s Solutions for Enterprise-Wide Procurement (SEWP),the
Army’s Computer Hardware, Enterprise Software and Solutions (CHESS) and GSA’s
STARS II contracts. Marine Corps Installations (MCI) West has implemented the use of
FedBid, a reverse auction site, which allows for a streamlined processing of Bids and
increased competition.
Opportunities and actions taken, including any new initiatives to achieve/increase
full and open competition in the contracting operation of the agency:
The DON is committed to leveraging competition and has challenged its program
managers to increase competition in their respective portfolios. All of the DON
commands note the use of Industry Days and Long Range Acquisition Forecasts as useful
tools to foster and increase competition. A few of the many examples cited in Command
reports are below.
The Space and Naval Warfare Systems Command (SPAWAR) has successfully
continued their initiatives to increase the use of Multiple Award Contracts (MACs) and
improve effective competition. For example, SPAWAR Systems Center (SSC) Atlantic

7
successfully awarded twenty-four (24) competitive capability-focused Pillar Contracts,
six (6) to large business and eighteen (18) as small business MACs.
MSC awarded multiple Indefinite Delivery, Indefinite Quantity (IDIQ) contracts
for voyage repair support on the US West Coast and Hawaii. These contract vehicles will
allow MSC to more efficiently support minor ship repairs, leverage a competitive base of
skilled contractors, and reduce the need to limit competition through individual open
market procurements in emergent situations.
The Office of Naval Research (ONR) uses Broad Agency Announcements, Small
Business Innovative Research (SBIR)/Small Business Technology Transfer Research
(STTR) solicitations, and the Seaport-e portal extensively for 90 percent of ONR’s
requirements.
MCFCS works closely with customers early in the acquisition cycle to remove
restrictive specifications that hamper competition and conducts market research to
maximize sourcing and promote competition. In addition, SPAWAR has taken numerous
steps to improving the acquisition of products and services, through the implementation
of Better Buying Power initiatives, such as effectively managing technical data rights and
emphasizing the importance of competitive strategies.
NAVSUP has created/maintained competitive strategies and environments in the
following major areas: Strategic Sourcing (e.g., wireless, GBS contracts require each
order to be competed among the MAC holders), Seaport-e services (task orders competed
among the MAC holders; sole source orders are not allowed on the program), and
Reverse Auctions (utilize an on-line website with thousands of registered vendors that
compete for each requirement). In each of these areas, competition is an integral element
in the process.
The DON has implemented an enterprise-wide Services Requirement Review
Board (SRRB) process designed to review and validate requirements, increase
competition and increase small business opportunities and participation.
MSC has expanded use of the Seaport-e IDIQ vehicle for a variety of services
acquisitions, encouraging participation from vendors, which had previously not
participated in MSC procurements. To the maximum extent practicable and in
conformance with DOD policy, MSC continued to shift existing single award IDIQ
contracts to multiple award IDIQ contracts.
NAVSEA cites several examples where competition is being achieved for items
that have been sole source for many years Due to open architecture efforts and the
purchase of competitive data packages the following requirements are currently in
various stages of competition: AEGIS Combat Systems Engineering Agent, the Ship
Integration and Test requirements, MK 41 Vertical Launch System (VLS) Launcher
Production, VLS Canisters and Associated Equipment, and Ship Self Defense Systems

8
(SSDS) CSEA Requirements. NAVSEA HQ commenced piloting a contracting strategy
for surface ship maintenance, repair and modernization requirements that utilizes a
Multiple Award Contract-Multi Order (MAC-MO) contracting strategy. This approach
evolved from the current Multi-Ship/Multi-Option (MSMO) contracting strategy to drive
increased price competition while maintaining flexibility and responsiveness for the
Surface Navy. Unlike the current cost-type MSMO contracts which facilitate sole source
negotiations during execution, the MAC-MO competes CNO availabilities and
Continuous Maintenance Availabilities (CMAVs) as Fixed-Price Delivery Orders with
award based on a combination of price and non-price factors. NAVSEA is exploring
opportunities to leverage lessons learned out of the MAC-MO to continue to increase
price competition across the surface ship maintenance, repair and modernization
portfolio, to maximize competition and use of fixed-price type contracts. This strategy is
expected to improve cost, schedule & quality performance while maintaining flexibility
& responsiveness.
Actions taken to challenge requirements that are not stated in terms of functions to
be performed, performance required or essential physical characteristics. New
initiatives to ensure requirements are stated in terms of functions to be performed,
performance required or essential physical characteristics.
All of the DON commands routinely work with the requiring activities and
program offices during the acquisition planning phase to ensure requirements are clearly
defined and not overly restrictive. Most of the commands cited use of a formal
acquisition team body to review requirements and ensure they are stated in performance
based terms; and, have put in place tools and guide books to enable their acquisition
teams to better prepare performance based actions. The commands cite formalization of
a Procurement Planning Strategy Meeting (PPSM) or similar meeting early in the
procurement cycle as an initiative that has helped better define requirements in
performance based terms. A few of the many examples cited in Command reports are
below.
NAVSEA, via the institution of a PPSM in FY11, continues to emphasize
requirements review and discussions pursuant to performance-based statements of work
early in the acquisition strategy process, allowing Contracting Officers the ability to
challenge, at the beginning of the acquisition process, any non-performance-based
statements of work. NAVSEA continues to emphasize performance-based statements of
work in the intern boot camp and Contracting Officer Representative (COR) training
programs. Guidance documents, checklists and templates continue to be utilized and
updated as necessary to stay current and relevant. In FY 2013 NAVSEA enhanced the
current milestone process by adding milestones events to the front-end of the plan that
would be executed well before purchase request submission. These milestones will
address schedule and strategy, and include a read-through session of the requirements
definition documents. The current milestone plan starts with an Acquisition Plan
followed by submittal of a purchase request. The additional milestones will allow time to
challenge requirements, address performance based requirements, and challenge

9
mandatory requirements that may be restrictive to competition. This extended milestone
plan is expected for rollout in FY 2014.
The Naval Air Systems Command (NAVAIR) used a culmination of two
processes to thoroughly vet and challenge requirements, which include: (1) The
Procurement Planning Conferences and Agreements, these are a useful tool in early
challenge of requirements that are not stated in terms of functions to be performed,
performance required or essential physical characteristics. Secondly, the RFP Peer
Reviews and Legal Review Boards offer additional opportunities to challenge
requirements that are not stated in terms of functions to be performed, performance
required or essential physical characteristics. In addition, MSC procurement teams are
actively working to minimize requirements that may restrict the development of
innovative solutions from industry. Specifically, while ship operations and charters often
have very specific requirements related to vessel capabilities, where possible, use of
specific platforms are being challenged and broader characteristics for ship type are being
employed. As an example, after reviewing historical utilization rates, the MSC
procurement team was able to demonstrate to the Third Marine Expeditionary Force that
the vessel speed requirement desired was limiting the number of contractual solutions to
meet their mission and driving up cost.
Any condition or action that has the effect of unnecessarily restricting the
acquisition of commercial items or competition in the contract actions of the agency.
Any barriers to the acquisition of Commercial Items or Competition that remain:
As with past years, DON commands note challenges in introducing competition
for fielded systems because of the lack of necessary technical data and/or data rights.
DON recognizes these challenges and remains committed to working toward reducing or
eliminating these barriers to competition. Some commands cite Congressional Earmarks
directed to a specific source and direction of a foreign government under the Foreign
Military Sales (FMS) program as unnecessarily restrictive. Contractor teaming
arrangements sometimes limit competition unexpectedly.
The DON commands and program offices continue seeking breakout
opportunities and resolution of data rights issues in order to foster increased competition.
NAVAIR demonstrated this on various contract actions that were broken out from
large business into smaller actions; these pending Small Business Set-asides provide
additional competition regarding t h e installation of the Electronic Propeller Control
System (EPCS) and Engine Instruments Display System (EDIS) into Legacy KC-130T
aircraft with award in early FY2014.

10
Other ways in which the agency has emphasized the acquisition of Commercial
Items and Competition in areas such as acquisition training and research.
The DON commands continue using formal and informal training for the
contracting and requirements communities to ensure focus on competitive and small
business opportunities. Several of the DON commands have established contracts
competency training on a recurring basis, including structured ‘boot camp’ training for
trainees and interns; and, training focused on improving competencies in market research,
commercial item acquisition, pricing and cost estimating, performance based contracting,
source selection and evaluation, open systems, and quality assurance and surveillance.
Awareness training, specifically DAU course CLC-055, on current competition
policy and guidance, the benefits of competition, and opportunities to increase
competition in Government acquisitions remains mandatory for program managers,
program executive officers, logistics managers, and contracting personnel. The DON has
implemented additional refresher training for CORs to improve quality assurance and
surveillance. Additionally, DON commands continue to provide training in use of
improved tools for procurement document preparers.
The MCFCS uses an active vendor outreach program, administered by Small
Business Specialists, to increase competition and identify sources for purchase of
commercially available items.
MARCORSYSCOM’s Procurement Performance Management Assessment
Program (PPMAP) is an effective process for ensuring that acquisition personnel are
acquiring commercial items to the fullest extent as a PPMAP special interest item.
NAVSEA continues to utilize agency guidance, training, DAU Service
Acquisition Mall (SAM) site, checklists and policy updates.
Initiatives that ensure task and delivery orders over $1,000,000 issued under
multiple award contracts are properly planned, issued, and comply with FAR 8.405
and 16.505.
As with past reports, the DON commands have established review procedures
during the pre and post solicitation stages as well as the pre-award stage to ensure task
and delivery orders over $1M issued under multiple award contracts are properly
planned, issued, and comply with FAR Subparts 8.405 and 16.505. The Commands who
use task and delivery order contracts are using Peer Reviews and/or Contract Review
Boards to provide insight and guidance to improve multiple award contracts and fair
opportunity competitions. Command Competition Advocates and Office of Small
Business Programs representatives are engaged early in procurements to ensure
compliance with current regulations and policies for task/delivery order competitions
under multiple award contracts with emphasis on fair opportunity, requirements
description, evaluation factors, and basis of award.

11
MSC maximizes competition under all of its MAC contracts and GSA’s Federal
Supply Schedules (FSS) orders by planning for task/delivery orders early, issuing
advance notices, similar to synopses, which allows a longer period for companies to
respond to a Request for Quote; closely examining the Performance Work Statement to
ensure it is not restricting competition; and holding pre-quote conference calls with all
the multiple award contractors as a group to share information in order to help increase
competition.
All NAVSUP multiple award contract holders are afforded the opportunity to
compete on all task orders issued under NAVSUP MACs unless one of the four
exceptions identified in FAR 16.505 (b)(2) apply and is properly justified in accordance
with DFARS 216.505-70(b) and FAR 8.405-6. As an example, Navy activities continue
to place competitively procured delivery and task orders against the NAVSUP Fleet
Logistic Center (FLC) San Diego Global Business Solutions (GBS) contract.
SPAWAR’s SSC Atlantic used Seaport “O” portal to conduct a majority of the in-
house multiple competitions, which is a more efficient means of conducting task order
competitions and provides increased visibility into competition metrics, efficiency data,
etc.
NAVSEA continues using Seaport-e to competitively award multiple award
contracts for services under FAR 16.505. Advance notices of procurements give Seaport-
e partners more time to become familiar with individual requirements; more time to form
partnerships, teams and alliances with other Seaport-e contractors; and more time to put
together complete and accurate proposals. All of these factors have had the effect of
enhancing the competitive environment.
SPAWAR awarded eighteen (18) Small Business MACs. Each Task Order will
be competed to increase competition with a total potential contract value for the six
Pillars in excess of one billion dollars.
The DON has expanded the use of Seaport-e where task orders are competed and
provide fair opportunity to all offerors in the appropriate zone. Additionally, the
Commands report that GSA orders are placed through the e-Buy, electronic quote system,
and provided fair opportunity when awarding orders against the FSS contracts through
GSA. Requirements are posted to e-Buy for competition among the GSA/FSS holders to
maximize competition.
Summary and Conclusion
During FY 2013, the DON successfully improved competition across our
portfolio of acquisitions and worked across DON and Industry to better understand what
our systems, hardware and services should cost in order to make every dollar count while
minding the health of the industrial base. Additionally, we continue reviewing the

12
requirements in our major non-competitive acquisitions for opportunities to introduce
competition, for example, by breaking out each component; advances in open
architecture solutions and securing data rights in order to increase future competition.
In FY 2013 The DON illustrated its commitment to AT&L’s BBP 2.0 as
demonstrated by (1) Bringing better cost estimates to the table early and often in the
requirements definition process; (2) Guarding against exquisite solutions and
requirements creep; (3) Compressing the seemingly ever-increasing time it takes to
advance a weapon system from development, and design, through build and test and
deploying; (4) Increasing our focus on operating and support cost early in design; (5)
Working with industry to improve producibility of our designs; (6) Working across
government and industry to incorporate open system architecture; (7) Providing stability
through predictable workload and, where appropriate, long term contracts; (8)
Understanding what our weapon systems should cost, and implementing cost controls to
ensure that number is realized; (9) Leveraging competition; (10) Employing fixed price
contracts; and (11) Incentivizing capital improvements that result in further cost
reductions.
Also during FY 2013, the DON Commands continued to place greater scrutiny on
the requirements and practices for acquiring services with increased emphasis on early
engagement to ensure performance based work descriptions, small business opportunity
and improvement in effective competition. The DON Commands continued moving
away from single award task and delivery order contracts where possible and replacing
them with multiple award contracts. These initiatives help establish a foundation for
continuing improvement in fair opportunity and effective competition. The DON is
committed on continuing our efforts to bring stability to our major programs, continuing
to leverage multiyear and block buy procurements across destroyers, the Aegis Weapon
System, the Littoral Combat Ship, the VIRGINIA, The Super Hornet, Romeo and Sierra
helicopters, and now the Advanced Hawkeye programs.
DON will continue to leverage competition for innovation and affordability.
Competition this past year across the destroyer program, Next Generation Jammer, Next
Generation Enterprise Network, the Aegis Combat System Engineering Agent, and the
Air & Missile Defense Radar yielded significant savings, to affordably deliver needed
capability in the face of budget constraints and sequestration.

AIR FORCE COMPETITION REPORT
FISCAL YEAR 2013
January 2014
2
INTRODUCTION In accordance with the Office of the Under Secretary of Defense (Acquisition, Technology & Logistics (OUSD (AT&L))/Defense Procurement and Acquisition Policy (DPAP) memo dated 06 January 2014, Request for Fiscal Year 2013 Competition Report and Establishment of FY2014 Competition Goals, and Headquarters Air Force (HAF) Mission Directive (MD) 1-10, SAF/AQC, as the Air Force Competition Advocate General, submits the Air Force (AF) Competition Report for Fiscal Year 2013 (FY13). This report discusses AF efforts to achieve its FY13 overall competition goal of 37.9% and effective competition goal of 95.2%. The AF acknowledges, as requested, the FY14 actual competition goal of 41.5%, a 2% increase from FY13 actual rate, and the AF FY14 Effective Competition goal of 95.2%, which is unchanged from the FY13 goal. Despite the increase in the AF competition rate in FY13, it is undeniable that Sequestration had a significant impact on AF contracting in FY13. Most of the AF acquisition community was furloughed in the summer of FY13, reducing available contracting hours by the 48 furlough hours and also the normal end of fiscal year overtime hours. The reduced hours was paired with the increased contracting effort required to adjust contracts to reflect reduced funding. Each table in this report shows a significant reduction of obligations since FY12. Sequestration cuts could have resulted in a disproportional reduction in competitive actions, or may have triggered an increase in non-competitive actions as a secondary effect from reduced contracting hours available. This report cannot identify the extent that Sequestration impacted the data. COMPETITION EFFORTS All Major Commands (MAJCOMs), Direct Reporting Units (DRUs), and Field Operating Agencies (FOAs) (hereafter referred to as Commands) are designated as procuring activities in AF Federal Acquisition Regulation Supplement (AFFARS) section 5306.501, and are required to have a competition advocate. The Air Force is in compliance with this requirement. Competition advocates are responsible for the competition and commercial advocacy program within their respective organizations. They promote and support full and open competition and commercial practices in acquisition programs managed by their Commander or associated Program Executive Officers (PEOs). AF Policy Directive 63-3 and AFFARS Mandatory Procedure MP5306.50 require competition advocates to improve overall competitive performance, including effective competition, and to increase the use of commercial practices by overcoming barriers, such as overly restrictive requirements, policies, procedures, and/or decisions that restrict competition and/or commercial practices. Competition advocates identify potential opportunities for full and open competition and effective competition as well as commercial opportunities by participating in acquisition strategy planning through forums such as the Acquisition Strategy Panel (ASP) process, coordination on
3
or approving Justification and Approval (J&A) documents, reviewing acquisition planning (AP) documents, and approving exceptions to fair opportunity. The AF continues to pursue competition by engaging competition advocates early in the acquisition process, utilizing FedBizOpps to ensure widest dissemination of contract opportunities and program information to business and industry, even when its use is not mandated. In addition, the AF is engaged in a collaborative and structured strategic sourcing process whereby spend analysis is utilized to make business decisions about acquiring commodities and services more efficiently and effectively. The AF awards multiple-award, indefinite-delivery/indefinite-quantity (IDIQ) contracts where appropriate; emphasizes robust market research; challenges overly restrictive requirements; uses industry days, sources sought notices, and requests for information to convey general and specific program needs to increase industry participation and feedback, and to identify additional sources of supply. Furthermore, the AF works very closely with the small business community, including small business specialists early and often during the acquisition planning process to identify opportunities for small businesses in addition to participation in small business trade fairs and outreach events.
Competition Advocates throughout the Air Force have instituted a number of initiatives to implement the requirements of the Competition Advocate program to scrutinize and challenge requests for single-source or non-commercial items, and to identify potential competition or commercial conversion opportunities through component breakout during J&A and AP document reviews. Air Force Space Command (AFSPC) takes a hard line against sole source bridge contracts caused by inadequate planning. After customer notification that no bridge contracts would be awarded due to inadequate planning, the policy was enforced by allowing breaks in service until the follow on contract was awarded. Pacific Air Forces (PACAF) Late to Need policy targets timely RFPs as a critical contracting step and applies penalties for missed deadlines. Several organizations, including Air Force Reserve Command (AFRC) and AFSPC’s 45 CONS have targeted sole source 8(a) conversions to competitive 8(a) contracts to help move their competition rate. AFRC reduced their sole source 8(a) awards by 84% and 45 CONS attributes 77% of their increase in competition dollars to this conversion. While these increases by themselves will not move the Air Force competition rate, the cumulative effect of incremental changes in behavior can move the competition needle at all organizational levels.
Air Force Competition Advocates ensure that program requirements are stated in the least restrictive terms to permit effective competition and utilization of commercial practices. The AF relies on cross-functional teams during the acquisition planning process to challenge requirements that are not stated in terms of the functions to be performed, performance required, or essential physical characteristics. PACAF uses their Early Strategy and Issues Sessions to ensure early multifunctional engagement in contract planning. Air Force District of Washington (AFDW) uses their multi-functional teams of contracting, small business and quality assurance experts to review requirements for competition and small business awards. By unbundling
4
proprietary software from one services contract and a single unique skill requirement from another, both contracts were converted to competitive awards. The Air Force continues to develop new tools to support competition. Air Force Materiel Command (AFMC) developed and deployed the Service Predictive Scheduling Tool (PST) which projects required milestone dates for services acquisitions in excess of $100M. The projections are based on the required start date or the end date of the predecessor contract. The tool provides action and due date visibility to the requirements community ensuring that they meet their program dates. Comprehensive use of the tool ensured that AFMC did not award any bridge service contracts in FY13. Several organizations have begun using the tool for service contracts below $100M. One of the responsibilities of the Competition Advocate is ensure market research demonstrates that competitive and commercial opportunities were considered. Air Force Competition advocates use a variety of techniques and tools to ensure that the have robust market research. AFRC uses the Long Range Acquisition Estimate (LRAE) tool to identify upcoming acquisitions early enough in the process to effect change. The acquisition team comprised of the customer, program manager, acquisition program manager, contracting, small business specialist and competition advocate is convened to review the requirement, do extensive market research and develop a sources sought synopsis. The LRAE early identification of requirements supercharges the effects of market research by increasing the possibility of implementing change into the procurement process. Several AF offices focus on long range targets for competition change. AFDW targets follow-on contracts more than five years out to ensure adequate time for market research and enable movement to competitive strategies. Air Force Special Operations Command (AFSOC) engages the long range plans office to collaborate on requirements gap analysis. Teams collaborate on a daily or weekly basis to move contracts into a competitive environment. Competition Advocates promote source development programs which assist potential sources with identifying business opportunities and becoming qualified sources. They work with government and industry alike to investigate and eliminate barriers to competition, to promote the acquisition of commercial items. Like most AF contracting organizations, Air Education and Training Command (AETC) and, 386 ECONS, an ACC subordinate organization, provide training during Industry Day. The 386 ECONS FedBizOps training paid off when contractors applied their new knowledge to respond to a sources sought synopsis, turning that requirement competitive.
The engagement of the requirements community is critical for competition success. The Air Force starts that engagement with education. AFDW provides training to their requirements and resource management community twice a year. AFMC has a robust Acquisition Training Webinar program for the entire Air Force acquisition workforce. Over 6,300 AF acquisition personnel received training from AFMC on five competition webinars in FY13.

5
Air Force Commands often have teams engaged in market intelligence activities to analyze the market and reveal details of who is buying and who is selling similar requirements within both the Government and Industry, how they are doing so, and if there is a potential for effective strategic sourcing or breakout opportunities to increase competition. Potential markets are engaged via pre-solicitation outreach events such as trade shows and conferences, site visits and Industry Days to exchange information with new and existing suppliers and to obtain industry perspective during the acquisition planning phase. AFDW personnel routinely attend local Match-Making and Small Business Summits within the commuting area to identify new sources. They have participated in meetings with industry through forums sponsored by the city of Baltimore, Joint Base Andrews, American Legion, U.S. Women’s Chamber of Commerce, as well as meetings with Senator Cardin’s staff and several small business groups. The A-10 program office reports that due to extensive market research (to include Industry Days, Capabilities Briefings, Early Industry Involvement, and effective Acquisition Planning) they are able to maintain a competition rate of over 90% in FY13. With Sequestration, the ability to travel to engage industry has been severely limited. However, with creativity, our teams have identified local opportunities to ensure that the forward progress in engaging with industry to enhance competition continues. Each meeting with industry provides the opportunity to reach out to many businesses and increases the probability of finding competitive matches. The current budget environment has radically impacted the ability of organizations to travel outside their local commuting areas to participate in regional gatherings, but has enhanced the creativity of organizations to seek out more local opportunities to engage with the business communities.
FY13: COMPETITION THE DATA
The AF pulled FY13 data for this report from FPDS on 8 December 2013 using the standard competition report, ad hoc reports, and the “Competitive Procedures, but Only One Offer Report,” to report on “effective competition”.
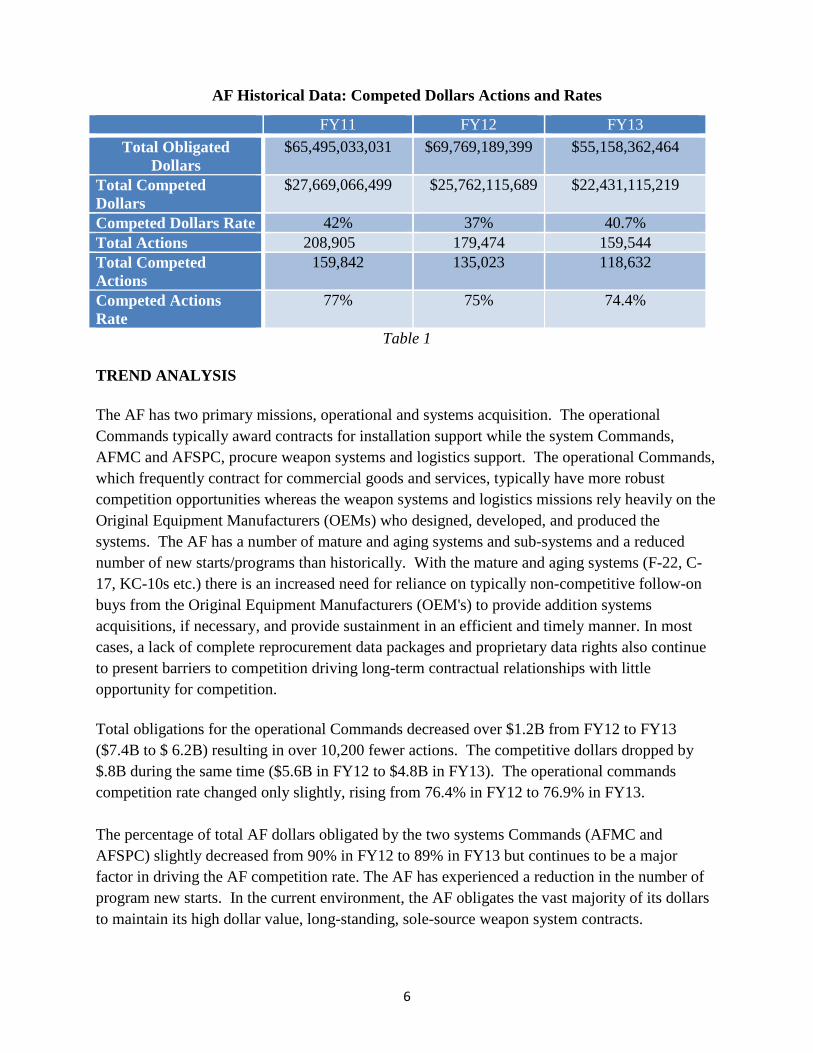
The AF finished the year with a competition rate of 40.7% as compared to the DPAP assigned FY13 competition goal of 37.9%. The AF was assigned an effective competition goal of 95.2%, and achieved a rate of 85.5% as compared to an 87% achievement in FY12. Table 1 below shows the decrease in total actions and spend that the Air Force has experienced in the past three years. The AF trend typically follows the path of AFMC, which represents over 75% of the total AF contracting spend. While the impact of AFMC (and to a lesser extent AFSPC) historically drives the direction of the AF slope, the cumulative effect of the operational commands’ success moved the competition needle enough to ensure the AF success in exceeding the FY13 goal.
6
AF Historical Data: Competed Dollars Actions and Rates
Table 1 TREND ANALYSIS
The AF has two primary missions, operational and systems acquisition. The operational Commands typically award contracts for installation support while the system Commands, AFMC and AFSPC, procure weapon systems and logistics support. The operational Commands, which frequently contract for commercial goods and services, typically have more robust competition opportunities whereas the weapon systems and logistics missions rely heavily on the Original Equipment Manufacturers (OEMs) who designed, developed, and produced the systems. The AF has a number of mature and aging systems and sub-systems and a reduced number of new starts/programs than historically. With the mature and aging systems (F-22, C-17, KC-10s etc.) there is an increased need for reliance on typically non-competitive follow-on buys from the Original Equipment Manufacturers (OEM's) to provide addition systems acquisitions, if necessary, and provide sustainment in an efficient and timely manner. In most cases, a lack of complete reprocurement data packages and proprietary data rights also continue to present barriers to competition driving long-term contractual relationships with little opportunity for competition.
Total obligations for the operational Commands decreased over $1.2B from FY12 to FY13 ($7.4B to $ 6.2B) resulting in over 10,200 fewer actions. The competitive dollars dropped by $.8B during the same time ($5.6B in FY12 to $4.8B in FY13). The operational commands competition rate changed only slightly, rising from 76.4% in FY12 to 76.9% in FY13. The percentage of total AF dollars obligated by the two systems Commands (AFMC and AFSPC) slightly decreased from 90% in FY12 to 89% in FY13 but continues to be a major factor in driving the AF competition rate. The AF has experienced a reduction in the number of program new starts. In the current environment, the AF obligates the vast majority of its dollars to maintain its high dollar value, long-standing, sole-source weapon system contracts.
FY11 FY12 FY13 Total Obligated
Dollars $65,495,033,031 $69,769,189,399 $55,158,362,464
Total Competed Dollars
$27,669,066,499 $25,762,115,689 $22,431,115,219
Competed Dollars Rate 42% 37% 40.7% Total Actions 208,905 179,474 159,544 Total Competed Actions
159,842 135,023 118,632
Competed Actions Rate
77% 75% 74.4%

7
FY13 Competition Goals and Achievement
COMMAND SHARE TOTAL AF DOLLARS
PERCENTAGE OF TOTAL AF
DOLLARS
PERCENTAGE Of TOTAL AF COMPETED DOLLARS
FY13 COMPETITION
GOAL
FY13 ACTUAL
RATE
ACC $1,552,289,171 2.8% 5.8% 88% 83.6% AETC $1,231,931,880 2.2% 3.8% 77% 69.8% AFDW $332,130,706 .6% 1.1% 76% 77.3% AFGSC $206,646,491 .4% .7% 70% 71.5% AFISRA $248,513,885 .5% .8% 73% 72.5% AFMC $41,596,743,487 75.4% 65.9% 33% 35.5% AFOTEC $7,769,132 0.1% .1% 81% 100% AFRC $197,605,129 .4% .8% 84% 90% AFSOC $149,840,098 .3% .5% 78% 79.8% AFSPC $7,378,244,090 13.4% 12.9% 38% 39.3% AMC $803,716,737 1.5% 2.7% 72% 74.1% PACAF $889,685,881 1.6% 2.7% 64% 67.6% USAFA $196,438,757 .4% .7% 70% 84% USAFE $366,807,014 .7% 1.5% 96% 93.6%
Table 2 As illustrated in Table 2, ten commands met or exceeded their assigned competition goals. As evidenced by the percentage of total AF dollars obligated by command, the dollars expended by AFMC and AFSPC drive the overall AF competition trend, but the cumulative effect of the competition successes of the smaller commands can have a cumulative impact to support AF success in meeting the competition goal. BARRIERS TO COMPETITION While stressing increased competition, the AF continues to experience significant barriers to competition. Single source actions in support of socio-economic programs, the reduction in new starts and major programs, and the reliance upon noncompetitive follow-on procurements for mature systems continue to be major factors in reduced opportunities for competition. Since the AF’s performance is primarily impacted by AFSPC and AFMC, this section focuses predominantly on the barriers faced by these two commands. The AF is aggressively exploring new opportunities for competition to include reviewing competitive acquisition strategies for potential component breakouts and generating Business Case Analyses to support decisions regarding the acquisition of data rights. Delving into market intelligence is leading to better defined requirements and a broader understanding of the market relating to the requirement, and more effective strategic sourcing. The Air Force Competition Advocates take necessary action to meet or exceed assigned competition goals to the maximum extent possible by identifying and monitoring actions to

8
remove obstacles to competition and commercial practices through advocacy, awareness, and oversight. Significant barriers to competition exist for satellite systems; once initial production contract(s) are awarded, follow-on contracts are issued on a sole source basis due to lack of procurement data to procure additional satellites. Many of our satellites are long past the life expectancy anticipated at the time of contract award. Technical data was not acquired at award due to the anticipated short life expectancies. Cost and lead time to procure secure data communication satellites, time to build and launch acquired satellites and budget driven pressures often forced extension of satellite schedules. However, the life expectancy of satellites has turned out to be significantly longer than anticipated resulting in an unanticipated duration of sole source procurements. AFSPC continually seeks strategies to eliminate barriers to competition; however, the nature of the cyber and launch mission dictates the use of specific vendors. The industrial base for procuring and sustaining satellites, launch vehicles, and satellite/launch support hardware/software/services is extremely limited. Past decisions concerning the purchase of data rights has restricted opportunities for competition. The six contracts awarded in FY13 for the Evolved Expendable Launch Vehicle (EELV) program accounted for $1.2B in non-competed dollars. Contracts in support of Advanced Extremely High Frequency (AEHF) Satellite Program, Federally Funded Research and Development Contract to The Aerospace Corporation and Space-Based Infrared System (SBIRS) space vehicle production lots accounted for another $2.2B in AFSPC’s non-competitive awards. Although not all-inclusive, these account for 76% of AFSPC’s noncompetitive obligations. These noncompetitive actions will continue to affect AFSPC’s competition rate in FY14 and beyond as these complex systems move to full production. As the commercial space industry continues to evolve and expand, and as the philosophical shift to procure data rights takes hold, opportunities to increase competitive acquisitions in space assets have potential to improve.
Space and Missile Command (SMC) is making progress in introducing competition back into the EELV program. The AF has an approved New Entrant Certification Guide outlining the requirements new entrants must meet to be eligible to compete for 14 launch services available for competition between FY15-17 if new entrants have been certified. The AF anticipates additional vendors will be certified before the FY15 competition.
AFMC continues to aggressively convey the philosophy that competition is the rule, not the exception. AFMC exceeded their competition goal this year by 2.5% despite the large dollar single-source acquisitions in support of mature and aging systems for which there is no commercial market or suppliers due to proprietary data rights and lack of technical/re-procurement data packages (F-22, C-17, etc). Foreign Military Sales (FMS) contracts continue to be a significant portion of the AFMC obligations, contributing to their inability to achieve higher levels of competition. FMS contract awards, established by International Agreement and funded by a foreign source, accounted for 21% of all AFMC obligations for FY13. FMS

9
accounted for 29% of AFMC’s non-competed obligations. Although other organizations have FMS actions, AFMC is responsible for 96.8% of all of the AF’s FMS obligations.
The current fiscal environment presents a competition dichotomy. At a time when the potential cost savings resulting from competition is critical to meeting budget constraints, identifying funding for the purchase of technical data is difficult. However, the AF continues to pursue opportunities for acquiring the technical and data rights for its major systems and subsystems from OEMs with upfront planning and budgeting for component breakout and competition of major subsystems. AFMC has actively engaged data rights experts within the legal community to investigate and explore data rights issues for specific acquisitions with notable results.
For example, the Data Rights Team (DRT) at LCMC Wright-Patterson continues to assess past and current data assertions made by the OEM's to ensure the Government's rights are preserved and the appropriate data is delivered. A number of AFMC organizations have had success in obtaining data rights and converting sole source awards to competitive. AFMC reports that the Eglin follow-on Joint Programmable Fuze (JPF) contract was competitively awarded to provide fuze systems and spares for USAF and FMS customers. At the current quantity of 23,629 units, the unit price savings of $160 resulted in $3.78M in competitive cost savings. The Air Force Nuclear Weapons Center (AFNWC) data rights resolution on the ICBM Prime Integration Contract (IPIC) with Northrop Grumman led to the successful competition of the Integration Support Contract (ISC). The KC-46 office is also aggressively pursuing data rights. A joint KC-46 SPO - Boeing Summit was held to achieve a mutual agreement on the level of data rights included in the contract. The data rights are central to the USAF strategic plan for organic maintenance of the KC-46 in future years. The F-16 office successfully negotiated unlimited data rights for the Technical Data Package (TDP) for the Service Life Extension Program (SLEP) Contract. This data package with Unlimited Rights will support a competitive Production and Installation (Phase III of Legacy SLEP) on F-16 Block 40/42 and Block 50/52 aircraft.
In FY13, the C-130 Division at Robins AFB successfully broke out and competed the following contracts: Crashworthy Seat, Armor, Electronic Propeller Control System, C-130 A&AS Support, Modular Aerial Spray System, and the Afghan AF C-130H CLS. The total amount of these contracts is $189,969,000.
Through Market Research, PACAF identified that the operations portion of the Misawa/Osan/Kunsan/Kadena Instrumentation Training System (MOKKITS) contract can be performed by multiple contractors, whereas only the incumbent can perform the sustainment maintenance on the pods. PACAF has progressed in separating the operations and sustainment and plans to award a competitive operations contract in FY14.
While funded by U.S. appropriated funds, PACAF’s Master Labor Contract (MLC), mandated by post-World War II International Agreement, has an annual obligation between $175M-$180M, 20% of PACAF’s total annual obligations. The MLC transfers the civilian personnel costs for Japanese nationals working for the U.S. Forces. Since there is no expiration for the

10
agreement, PACAF competition rates will continue to be impacted by this agreement for the foreseeable future. International agreements continue to negatively impact AFSPC’s competition rate. The $100M Base Maintenance Contract for Thule AFB, Greenland, continues to impact AFSPCs total not competed dollars. By international agreement, only Danish or Greenlandic firms may be awarded contract work in support of Thule AFB, located 750 miles above the Artic Circle. AFSPC issued a 36 month warning order of an expiring service contract. This allowed sufficient time to execute comprehensive market research resulting in the identification of multiple potential vendors. After over 30 years of sole source awards, it is anticipated that the next contract action will be competitive. Through early requirements identification and robust market research, we can continue our progress in improving our competition rate. Even with ongoing efforts to remove barriers and increase competition, the dollars obligated against weapon systems, subsystems, and FMS programs represent such a large portion of AFMC, and AF, obligations it drives the competition rate down regardless of competition progress in other areas. Even the purchase of data rights will not result in significant increases in competition for that program until the program is in sustainment, which can be decades in the future. It is the intent of the AF to continue to explore innovative solutions to enhance competition and to ensure that the AF pursues the goal of establishing a robust competitive environment that engages the requirements and contracting community into a team that continually strives to identify additional contracts that can be converted to competitive awards.

11
AF Significant Barriers to Competition
FY11 FY12 FY13 Total Dollars $65,495,033,031 $69,769,189,399 $55,158,361,464 Total Not Competed Dollars $37,638,220,407 $43,829,256,601 $32,727,247,245 Percentage of Total Not Competed Dollars to Total Dollars 57% 63% 59.3%
Other Than Full and Open Competition Authorities Only One Source (FAR 6.302-1) $27,597,289,550 $25,991,820,181 $17,932,767,904 Urgency (FAR 6.302-2) $2,274,009,218 $1,116,073,259 $772,314,776 Industrial Mobilization (FAR 6.302-3) $609,328,430 $993,874,526 $871,015,772 International Agreement (FAR 6.302-4) $1,879,871,981 $9,472,158,267 $8,752,775,218
Authorized or Required by Statute (FAR 6.302-5) $1,391,161,968 $1,324,915,775 $982,986,397
National Security (FAR 6.302-6) $2,428,069,148 $3,452,105,490 $3,365,342,088 Public Interest (FAR 6.302-7) $0 $2,434,695 $1,560 Reason Not Competed – Simplified Acquisition Procedures or Null $85,743,582 $186,106,387 $207,716,874
Total Not Competed Excl. Total Exception Dollars to Fair Opportunity*
$36,265,473,877 $42,539,488,580 $29,598,124,322
Table 3 *See Table 6 for additional breakout of Exception Dollars to Fair Opportunity TASK AND DELIVERY ORDERS GREATER THAN $1M The AF properly plans, issues, and complies with FAR Parts 8.405 and 16.505 for task and delivery orders over $1M. All multiple award contract holders are afforded the opportunity to compete on all task and delivery orders issued unless one of the exceptions applies. Contracting activities follow established procedures in the acquisition planning phase to ensure compliance. In addition, the AF performs both pre-award reviews and post-award inspections; the latter via Staff Assistance Visits and Unit Compliance Inspections. These inspections emphasize fair opportunity, requirements description, evaluation factors and basis for award. THE DATA The AF pulled FY13 data from FPDS on 13 Jan 2014. Table 4 illustrates the FY13 results for task and delivery orders issued over $1M, and shows a 25% decrease from FY12 to FY13, while the total obligations declined 21% over the same period.
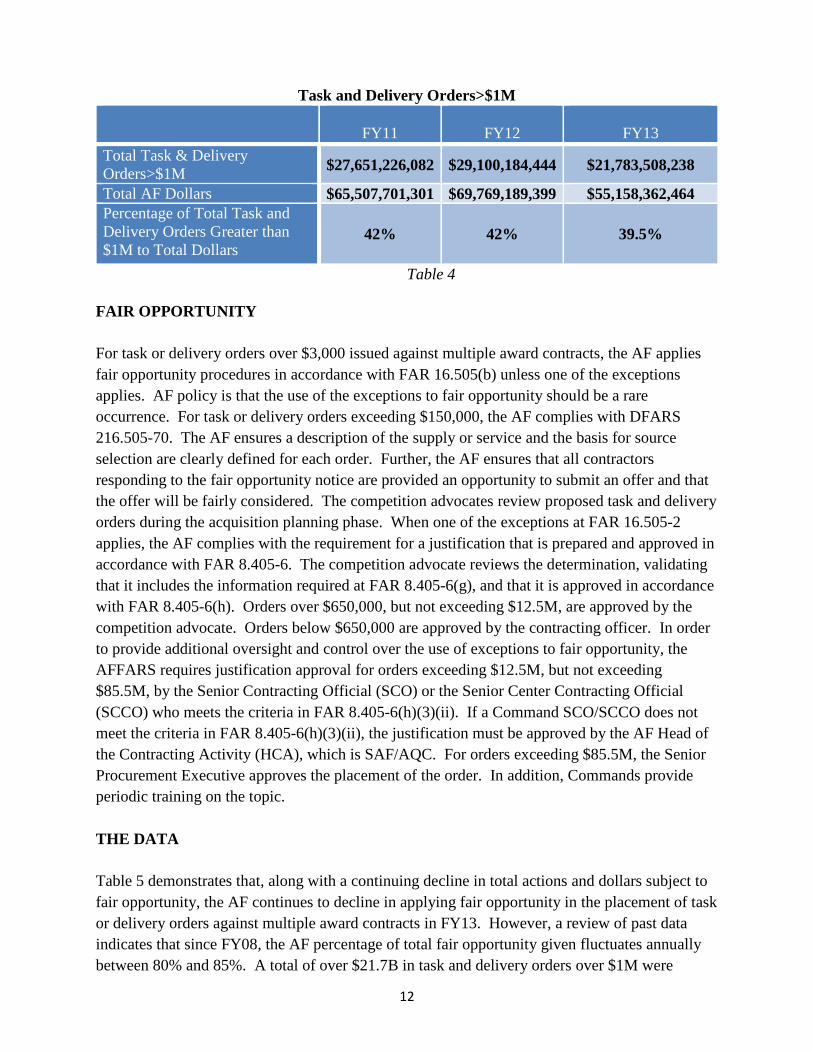
12
Task and Delivery Orders>$1M
FY11
FY12
FY13 Total Task & Delivery Orders>$1M $27,651,226,082 $29,100,184,444 $21,783,508,238
Total AF Dollars $65,507,701,301 $69,769,189,399 $55,158,362,464 Percentage of Total Task and Delivery Orders Greater than $1M to Total Dollars
42% 42% 39.5%
Table 4 FAIR OPPORTUNITY For task or delivery orders over $3,000 issued against multiple award contracts, the AF applies fair opportunity procedures in accordance with FAR 16.505(b) unless one of the exceptions applies. AF policy is that the use of the exceptions to fair opportunity should be a rare occurrence. For task or delivery orders exceeding $150,000, the AF complies with DFARS 216.505-70. The AF ensures a description of the supply or service and the basis for source selection are clearly defined for each order. Further, the AF ensures that all contractors responding to the fair opportunity notice are provided an opportunity to submit an offer and that the offer will be fairly considered. The competition advocates review proposed task and delivery orders during the acquisition planning phase. When one of the exceptions at FAR 16.505-2 applies, the AF complies with the requirement for a justification that is prepared and approved in accordance with FAR 8.405-6. The competition advocate reviews the determination, validating that it includes the information required at FAR 8.405-6(g), and that it is approved in accordance with FAR 8.405-6(h). Orders over $650,000, but not exceeding $12.5M, are approved by the competition advocate. Orders below $650,000 are approved by the contracting officer. In order to provide additional oversight and control over the use of exceptions to fair opportunity, the AFFARS requires justification approval for orders exceeding $12.5M, but not exceeding $85.5M, by the Senior Contracting Official (SCO) or the Senior Center Contracting Official (SCCO) who meets the criteria in FAR 8.405-6(h)(3)(ii). If a Command SCO/SCCO does not meet the criteria in FAR 8.405-6(h)(3)(ii), the justification must be approved by the AF Head of the Contracting Activity (HCA), which is SAF/AQC. For orders exceeding $85.5M, the Senior Procurement Executive approves the placement of the order. In addition, Commands provide periodic training on the topic. THE DATA Table 5 demonstrates that, along with a continuing decline in total actions and dollars subject to fair opportunity, the AF continues to decline in applying fair opportunity in the placement of task or delivery orders against multiple award contracts in FY13. However, a review of past data indicates that since FY08, the AF percentage of total fair opportunity given fluctuates annually between 80% and 85%. A total of over $21.7B in task and delivery orders over $1M were
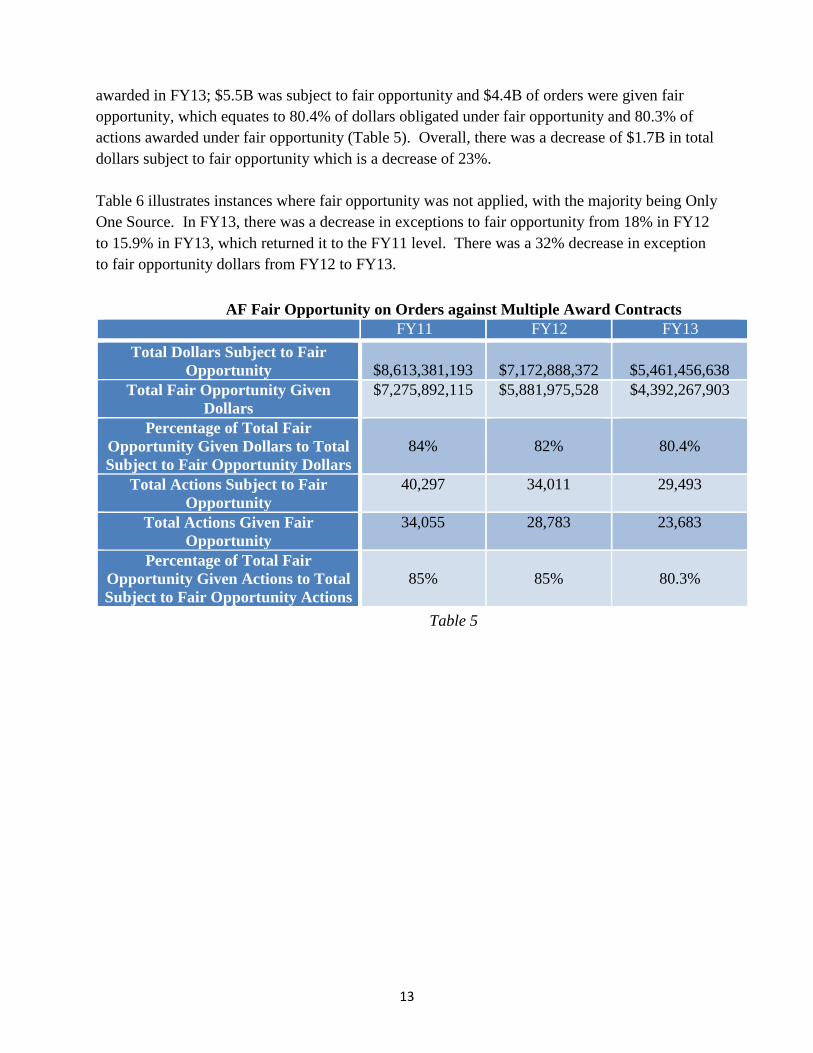
13
awarded in FY13; $5.5B was subject to fair opportunity and $4.4B of orders were given fair opportunity, which equates to 80.4% of dollars obligated under fair opportunity and 80.3% of actions awarded under fair opportunity (Table 5). Overall, there was a decrease of $1.7B in total dollars subject to fair opportunity which is a decrease of 23%. Table 6 illustrates instances where fair opportunity was not applied, with the majority being Only One Source. In FY13, there was a decrease in exceptions to fair opportunity from 18% in FY12 to 15.9% in FY13, which returned it to the FY11 level. There was a 32% decrease in exception to fair opportunity dollars from FY12 to FY13.
AF Fair Opportunity on Orders against Multiple Award Contracts FY11 FY12 FY13
Total Dollars Subject to Fair Opportunity
$8,613,381,193
$7,172,888,372
$5,461,456,638
Total Fair Opportunity Given Dollars
$7,275,892,115 $5,881,975,528 $4,392,267,903
Percentage of Total Fair Opportunity Given Dollars to Total Subject to Fair Opportunity Dollars
84%
82%
80.4%
Total Actions Subject to Fair Opportunity
40,297 34,011 29,493
Total Actions Given Fair Opportunity
34,055 28,783 23,683
Percentage of Total Fair Opportunity Given Actions to Total Subject to Fair Opportunity Actions
85%
85%
80.3%
Table 5

14
Exceptions to Fair Opportunity on Task or Delivery Orders
FY11 FY12 FY13 Total Exception Dollars to
Fair Opportunity 1,338,249,730 1,289,768,021 $866,350,134
Urgency (FAR 8.405-6(b)(3) or 16.505(b)(2)(i) Actions 67,832,636 50,485,351 $53,263,182
Only One Source Other (FAR 8.405 6(b)(1) or 16.505(b)(2)(ii)
Dollars 557,452,756 460,813,413 $422,729,680
Follow-on Delivery Order to Competitive Initial Order (FAR
8.405(b)(2) or 16.505(b)(2)(iii))Actions
468,625,779 476,727,081 $218,880,076
Minimum Guarantee (FAR 16.505(b)(2)(iv)) Actions 126,772,484 174,416,148 $56,445,670
Other Statutory Authority 117,566,075 127,326,029 $110,186,255
Percentage of Total Fair Opportunity Exception Dollars to
Total Subject to Fair Opportunity Dollars
16% 18% 15.9%
Table 6
TREND ANALYSIS: Most of the MAJCOMs reported declines in the Fair Opportunity given over the past three years. However, AFGSC noted that they have been able to increase their competitive opportunities by establishing procedures to closely review all orders in excess of $10,000 on a weekly basis using EZ query. AFRC experienced a 42% decline in task and delivery order value in FY13 and also experienced a decline in exceptions to fair opportunity. USAFA noted that the reductions in total fair opportunity given that they experienced was related to utilization of statutory authority exceptions. ACC experienced a significant increase in Follow-on Delivery Orders in FY13. While evaluating their numbers they identified $6.2M in Contract Action Report coding errors which is being corrected Several AF organizations are experiencing declines in the use of the urgency exception. ACC reduced their urgency exceptions from $1M in FY11 to zero in FY13. AFDW has not used an urgency exception since FY11 and reduced their Only One Source from $9.3M to $2.4M since FY11. AFRC had a 98% decrease in urgency exceptions from FY11 to FY12, but experienced a slight increase in FY13. AFSPC also showed a marked decrease in urgency exceptions of $1.4B, however they have had a $26M increase in Only One Source during that period.

15
COMPETITION AND EFFECTIVE COMPETITION GOALS AF contracting underwent reorganization when the Air Force Installation Contracting Agency (AFICA) achieved Initial Operating Capability on 1 October 2013. The Enterprise Sourcing Group (ESG) of AFMC was redesignated a component of AFICA which also comprises the contracting staffs at eight supported MAJCOMs and five above-wing specialized execution units. This new construct will allow AF contracting to continue to meet our MAJCOM mission while absorbing substantial manpower cuts. AFICA is headquartered at Wright-Patterson AFB, Ohio but operates as a virtual organization across multiple locations. While this changes the reporting structure for the MAJCOMs, each of the MAJCOMs will continue to have a Competition Advocate that reports directly to the AF Competition Advocate General in that capacity. Two changes directly affect the current competition structure for the FY14 annual report. The re-designation relocating ESG to AFICA headquarters affects the FY13 AFMC competition rate as it applies to establishment of the FY14 goals. The ESG FY13 competition rates will become the AFICA baseline rates, and the ESG data will be removed from the AFMC FY13 data establishing a new AFMC baseline. Space and Missile Command was also removed from AFSPC, requiring the establishment of new baselines by extracting the SMC data from AFSPC’s. The FY13 achieved rates in Table 7 (actual competition) and Table 8 (effective competition) reflect the organizational structure in effect in FY13. The adjusted FY13 results reflecting the FY14 organizational structure and the correlated FY14 Goals are shown in Table 9. The same methodology was generally applied in developing the remaining Commands goals as was used by DPAP in establishing AF goals. All Commands were given the same Effective Competition rate as that applied to the AF, since success in achieving the Effective Competition rate is not correlated to the nature of the items acquired. Rates achieved in excess of 90% have not been increased in the goals. AFOTEC’s FY13 rate was inflated due to deobligations of non-competitive action rather than contract awards, and does not reflect a reasonable FY14 goal, so their FY14 goal was reduced to 90%.
Within the major programs with little opportunity for competition, the AF will continue to focus on subsystem competition opportunities. Further, the AF will continue to embrace multiple-award IDIQ structures with on-ramps to continue and enhance the competitive environment, while ensuring data rights are claimed that will, at a minimum, enable competitive sustainment arrangements. For existing sole-source sustainment programs, the AF will examine opportunities to challenge contractor claims to proprietary data and assert government rights where possible in order to enable subsequent competitions.
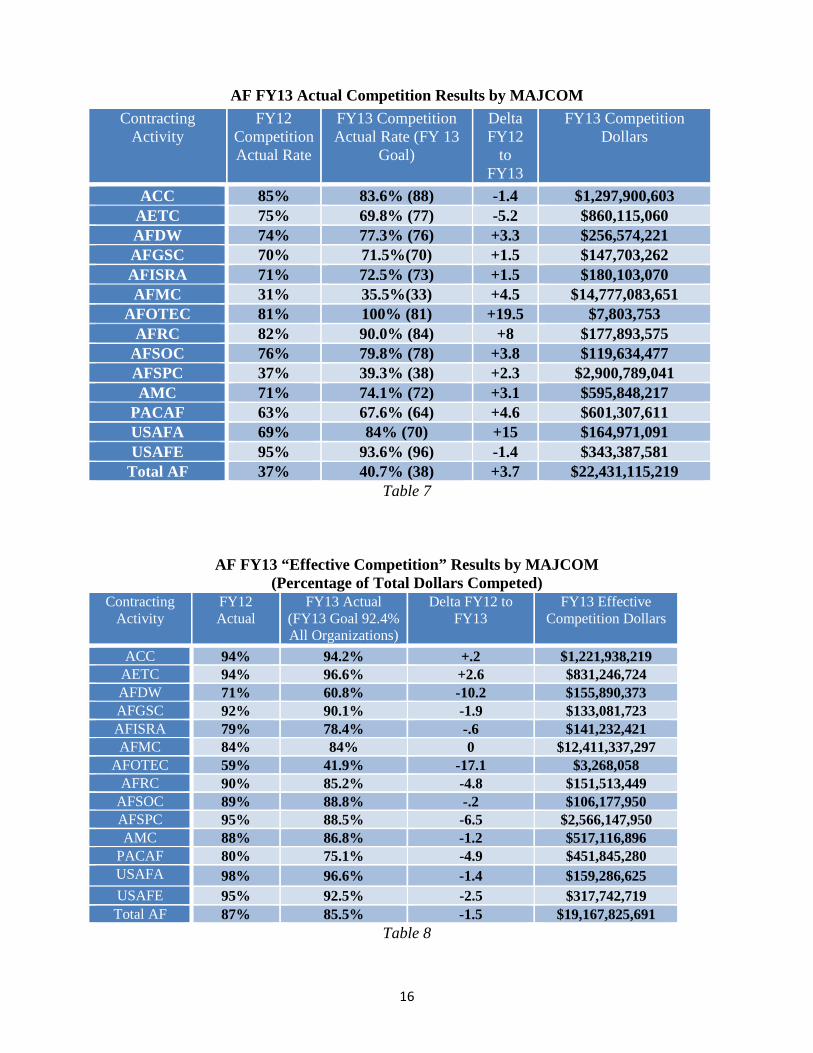
16
AF FY13 Actual Competition Results by MAJCOM
Table 7
AF FY13 “Effective Competition” Results by MAJCOM
(Percentage of Total Dollars Competed) Contracting
Activity FY12 Actual
FY13 Actual (FY13 Goal 92.4% All Organizations)
Delta FY12 to FY13
FY13 Effective Competition Dollars
ACC 94% 94.2% +.2 $1,221,938,219 AETC 94% 96.6% +2.6 $831,246,724 AFDW 71% 60.8% -10.2 $155,890,373 AFGSC 92% 90.1% -1.9 $133,081,723 AFISRA 79% 78.4% -.6 $141,232,421 AFMC 84% 84% 0 $12,411,337,297
AFOTEC 59% 41.9% -17.1 $3,268,058 AFRC 90% 85.2% -4.8 $151,513,449
AFSOC 89% 88.8% -.2 $106,177,950 AFSPC 95% 88.5% -6.5 $2,566,147,950 AMC 88% 86.8% -1.2 $517,116,896
PACAF 80% 75.1% -4.9 $451,845,280 USAFA 98% 96.6% -1.4 $159,286,625 USAFE 95% 92.5% -2.5 $317,742,719 Total AF 87% 85.5% -1.5 $19,167,825,691
Table 8
Contracting Activity
FY12 Competition Actual Rate
FY13 Competition Actual Rate (FY 13
Goal)
Delta FY12
to FY13
FY13 Competition Dollars
ACC 85% 83.6% (88) -1.4 $1,297,900,603 AETC 75% 69.8% (77) -5.2 $860,115,060 AFDW 74% 77.3% (76) +3.3 $256,574,221 AFGSC 70% 71.5%(70) +1.5 $147,703,262 AFISRA 71% 72.5% (73) +1.5 $180,103,070 AFMC 31% 35.5%(33) +4.5 $14,777,083,651
AFOTEC 81% 100% (81) +19.5 $7,803,753 AFRC 82% 90.0% (84) +8 $177,893,575
AFSOC 76% 79.8% (78) +3.8 $119,634,477 AFSPC 37% 39.3% (38) +2.3 $2,900,789,041 AMC 71% 74.1% (72) +3.1 $595,848,217
PACAF 63% 67.6% (64) +4.6 $601,307,611 USAFA 69% 84% (70) +15 $164,971,091 USAFE 95% 93.6% (96) -1.4 $343,387,581
Total AF 37% 40.7% (38) +3.7 $22,431,115,219

17
FY14 AF MAJCOM COMPETION AND EFFECTIVE COMPETITION GOALS
Table 9
* This table shows the FY13 rates re-allocated according to the FY14 restructured organizations. During FY12, major programs were reorganized for life-cycle management into PEO portfolios. FY14 competition goals have been allocated by PEO, using FY13 baseline data (Table 10 and Table 11).
FY13 Competition Actual Rate (Adjusted)*
FY14 Competition
Goals
FY13 Effective Competition Rate
(Adjusted)*
FY14 Effective Competition
Goals
ACC 83.6% 85.3% 94% 95.2% AETC 69.8% 71.2% 96.6% 95.2% AFDW 77.3% 78.8% 60.8% 95.2% AFGSC 71.5% 72.9% 90.1% 95.2%
AFICA (was ESG) 96.4% 96.4% 70.9% 95.2% AFISRA 72.5% 73.4% 78.4% 95.2%
AFMC w/o ESG 31.3% 31.9% 86.7% 95.2% AFOTEC 100.5% 90% 41.9% 95.2%
AFRC 90.0% 90% 85.2% 95.2% AFSOC 79.8% 81.4% 85.2% 95.2%
AFSPC w/o SMC 77.6% 79.2% 96.1% 95.2% AMC 74.1% 75.6% 86.7% 95.2%
PACAF 67.6% 69% 75.2% 95.2% SMC 34% 34.7% 86.2% 95.2%
USAFA 84% 85.7% 96.5% 95.2% USAFE 93.6% 93.6% 92.5% 95.2%
Total AF 40.7% 41.5% 85.5% 95.2%
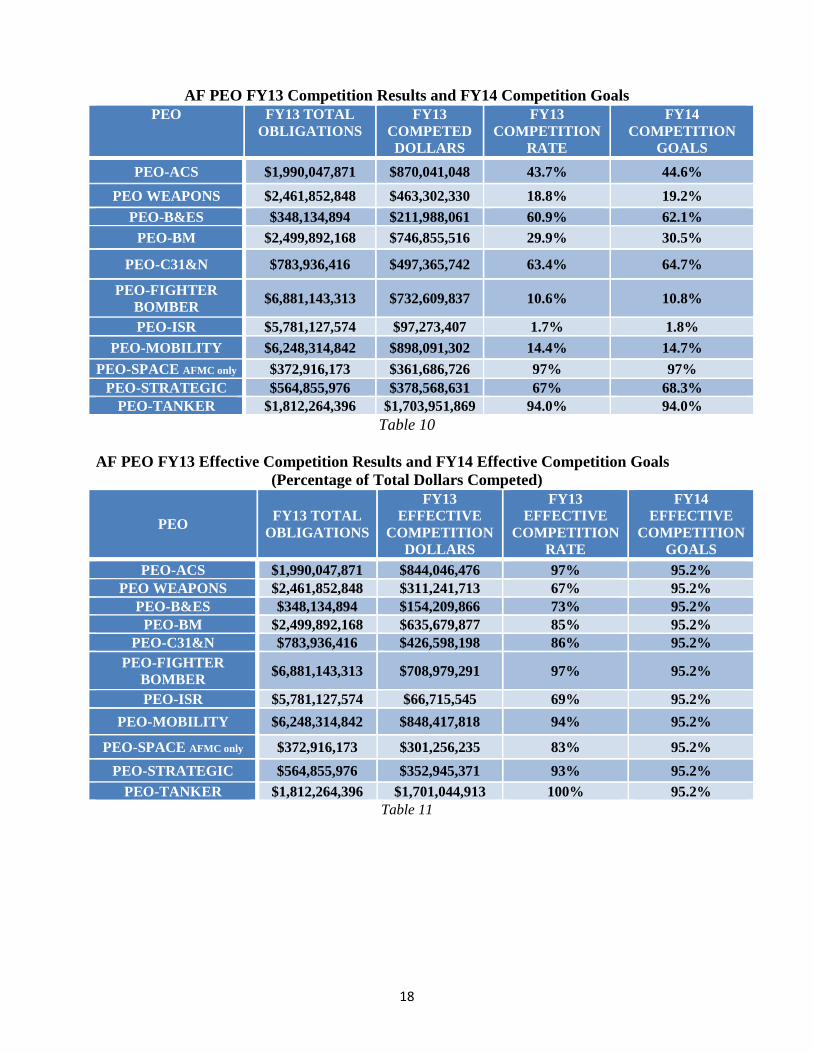
18
AF PEO FY13 Competition Results and FY14 Competition Goals PEO FY13 TOTAL
OBLIGATIONS FY13
COMPETED DOLLARS
FY13 COMPETITION
RATE
FY14 COMPETITION
GOALS PEO-ACS $1,990,047,871 $870,041,048 43.7% 44.6%
PEO WEAPONS $2,461,852,848 $463,302,330 18.8% 19.2% PEO-B&ES $348,134,894 $211,988,061 60.9% 62.1%
PEO-BM $2,499,892,168 $746,855,516 29.9% 30.5%
PEO-C31&N $783,936,416 $497,365,742 63.4% 64.7%
PEO-FIGHTER BOMBER $6,881,143,313 $732,609,837 10.6% 10.8%
PEO-ISR $5,781,127,574 $97,273,407 1.7% 1.8% PEO-MOBILITY $6,248,314,842 $898,091,302 14.4% 14.7%
PEO-SPACE AFMC only $372,916,173 $361,686,726 97% 97% PEO-STRATEGIC $564,855,976 $378,568,631 67% 68.3%
PEO-TANKER $1,812,264,396 $1,703,951,869 94.0% 94.0% Table 10
AF PEO FY13 Effective Competition Results and FY14 Effective Competition Goals
(Percentage of Total Dollars Competed)
PEO FY13 TOTAL OBLIGATIONS
FY13 EFFECTIVE
COMPETITION DOLLARS
FY13 EFFECTIVE
COMPETITION RATE
FY14 EFFECTIVE
COMPETITION GOALS
PEO-ACS $1,990,047,871 $844,046,476 97% 95.2% PEO WEAPONS $2,461,852,848 $311,241,713 67% 95.2%
PEO-B&ES $348,134,894 $154,209,866 73% 95.2% PEO-BM $2,499,892,168 $635,679,877 85% 95.2%
PEO-C31&N $783,936,416 $426,598,198 86% 95.2% PEO-FIGHTER
BOMBER $6,881,143,313 $708,979,291 97% 95.2%
PEO-ISR $5,781,127,574 $66,715,545 69% 95.2% PEO-MOBILITY $6,248,314,842 $848,417,818 94% 95.2%
PEO-SPACE AFMC only $372,916,173 $301,256,235 83% 95.2% PEO-STRATEGIC $564,855,976 $352,945,371 93% 95.2%
PEO-TANKER $1,812,264,396 $1,701,044,913 100% 95.2% Table 11

19
MAXIMIZING SMALL BUSINESS OPPORTUNITIES The AF fully supports all SBA socio-economic programs, as well as the Ability-One program. Small businesses account for the vast majority of contract work performed in the operational commands; however, the AF continues to seek opportunities to increase small business participation in other mission areas. In addition to reviewing all acquisitions greater than $10,000 and making recommendations regarding the use of small businesses, Small Business Specialists at the local and Command levels participate on Acquisition Strategy Panels to provide small businesses input into acquisition strategies. AF Small Business Specialists also work with small businesses to provide training at vendor fairs and other outreach events on how to conduct business with the Government to expand the vendor base. Leveraging DoD’s “MaxPrac” tool, the AF maintains an enhanced tool to assist in identifying small business opportunities. Information in this tool may be used as an early indicator of small business capabilities in the marketplace based on a five-year spend history by NAICS/PSC code. The AF Small Business Office, SAF/SB, implemented an AF Small Business Improvement Plan in February 2012. The plan has three goals: 1) partner with key stakeholders to deliver the right prime and subcontract small business solutions to accomplish the AF mission; 2) partner with key stakeholders to develop Better Buying Power (BBP) strategies that maximize small business opportunities to provide solutions to AF mission challenges; and, 3) develop and maintain a small business professional workforce and operational environment, ensuring compliance with all applicable laws and regulations. The results of this plan are reviewed quarterly and adjusted as necessary to provide for maximum practicable opportunity for small business participation. In FY13 the AF established a multi-functional Small Business Tiger Team to address declining small business numbers. Additionally, they have been working on the development of a new electronic tool to provide better long range planning capability. Product Service Codes: The AF continues to look for innovative ways to improve competition and small business participation in all Product Service Codes (PSC) to include the specific Knowledge Based Services, Electronic and Communications Services, and Facility Related Services portfolio groups reflected in Table 9. Prime contracts are being systematically reviewed for potential awards to small business in FY14, specifically in the areas of engineering, professional and facility support services. To ensure the AF has an accurate accounting of its service contract obligations, the AF plans to standardize alignment of Element of Expense/Investment Codes (EEICs) to specific PSCs. This will help AF identify where they are spending their valuable resources, and facilitate management of these obligations by PSC. AFPEO/CM’s Air Force Instruction (AFI) 63-138 addresses the acquisition of services and standardized processes across the entire AF and to help mission owners become more demanding customers. Further, the AFI defines overall services management oversight responsibilities including requirements reviews,
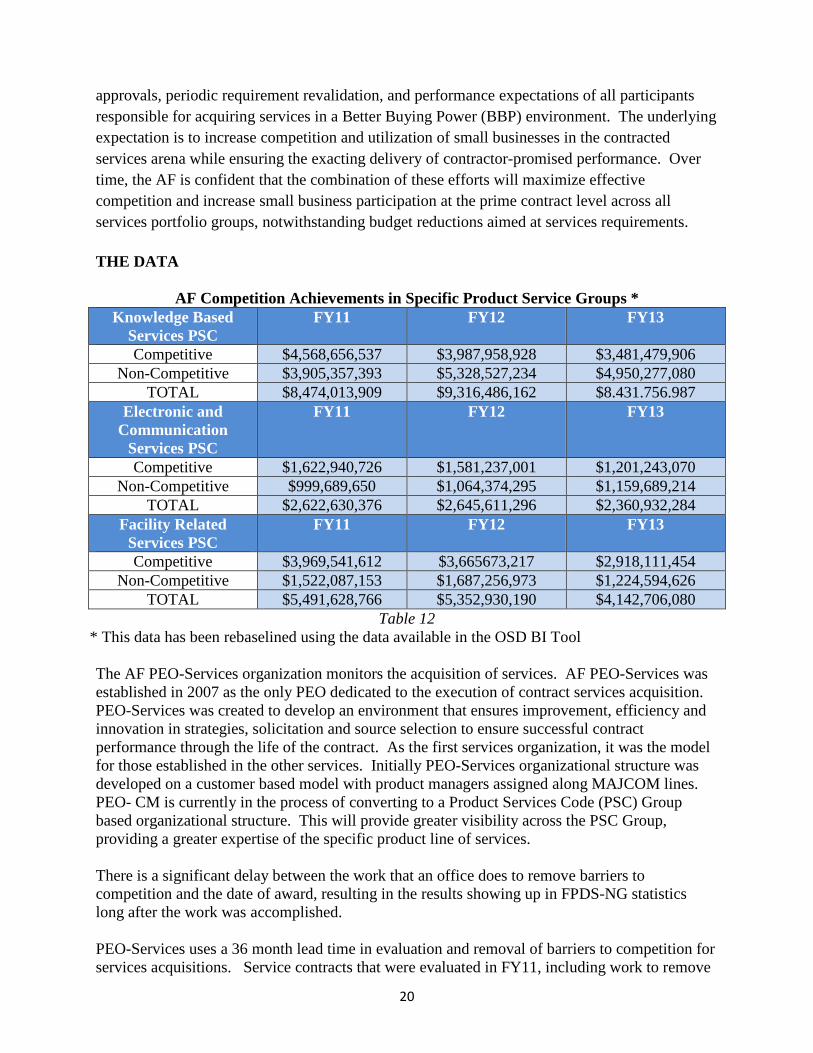
20
approvals, periodic requirement revalidation, and performance expectations of all participants responsible for acquiring services in a Better Buying Power (BBP) environment. The underlying expectation is to increase competition and utilization of small businesses in the contracted services arena while ensuring the exacting delivery of contractor-promised performance. Over time, the AF is confident that the combination of these efforts will maximize effective competition and increase small business participation at the prime contract level across all services portfolio groups, notwithstanding budget reductions aimed at services requirements.
THE DATA
AF Competition Achievements in Specific Product Service Groups *
Knowledge Based Services PSC
FY11 FY12 FY13
Competitive $4,568,656,537 $3,987,958,928 $3,481,479,906 Non-Competitive $3,905,357,393 $5,328,527,234 $4,950,277,080
TOTAL $8,474,013,909 $9,316,486,162 $8.431.756.987 Electronic and
Communication Services PSC
FY11 FY12 FY13
Competitive $1,622,940,726 $1,581,237,001 $1,201,243,070 Non-Competitive $999,689,650 $1,064,374,295 $1,159,689,214
TOTAL $2,622,630,376 $2,645,611,296 $2,360,932,284 Facility Related
Services PSC FY11 FY12 FY13
Competitive $3,969,541,612 $3,665673,217 $2,918,111,454 Non-Competitive $1,522,087,153 $1,687,256,973 $1,224,594,626
TOTAL $5,491,628,766 $5,352,930,190 $4,142,706,080 Table 12
* This data has been rebaselined using the data available in the OSD BI Tool The AF PEO-Services organization monitors the acquisition of services. AF PEO-Services was established in 2007 as the only PEO dedicated to the execution of contract services acquisition. PEO-Services was created to develop an environment that ensures improvement, efficiency and innovation in strategies, solicitation and source selection to ensure successful contract performance through the life of the contract. As the first services organization, it was the model for those established in the other services. Initially PEO-Services organizational structure was developed on a customer based model with product managers assigned along MAJCOM lines. PEO- CM is currently in the process of converting to a Product Services Code (PSC) Group based organizational structure. This will provide greater visibility across the PSC Group, providing a greater expertise of the specific product line of services. There is a significant delay between the work that an office does to remove barriers to competition and the date of award, resulting in the results showing up in FPDS-NG statistics long after the work was accomplished. PEO-Services uses a 36 month lead time in evaluation and removal of barriers to competition for services acquisitions. Service contracts that were evaluated in FY11, including work to remove

21
barriers, will generally not be awarded until FY14 or even FY15. There is rarely an immediate correlation between work that is done to enhance competition, and a change to the competition profile of the service. It takes a significant number of contract dollars moving from non-competitive to competitive before rates change. Only a change to the competition status of a major program could alter a rate by itself, and the removal of barriers, such as the purchase of technical data, generally will not result in competitive awards until the program moves to sustainment which may be years. OPERATION ENDURING FREEDOM (OEF) The AF competed 100% of all contingency contract actions in FY13 and fully expects this trend to continue. The reduction in OEF obligations is significant due to the drawdown in Afghanistan. That trend is expected to continue as well. AF Operation Enduring Freedom FY12 FY13 Total AF OEF Dollars $284,736,733 $192,616,829 Total AF OEF Competed Dollars $279,031,453 $192,616,829 AF OEF Percentage of Competed Dollars (Competition Rate)
98% 100%
Table 13
Better Buying Power 2.0 Promote Effective Competition
The Air Force took a number of steps forward in promoting effective competition in response to the issuance of Better Buying Power 2.0. A complete documentation review was accomplished to ensure that competition is considered at each acquisition decision. A number of additional actions were taken throughout the Air Force.
The Competition Advocate General issued a policy memorandum on 15 April 2013 requiring that all Justification and Approval (J&A) packages include copies of the predecessor J&A as a reference document for each J&A approved at a level higher than the Contracting Officer. The inclusion of the prior J&A provides the approver the opportunity to understand barriers that existed for prior competition; identifies previous actions to remove barriers to competition; provides necessary information to the approver to determine if the identified actions had been accomplished; and ensures that the current J&A addresses any deficiencies in removing barriers to competition and may provide an incentive to more effective planning. No data is available on the results from this change since only a handful of J&As have reached the level of the Competition Advocate General since the memo was signed.
The Air Force issued an integrated Air Force Instruction (AFI) 63-101/20-101, Integrated Life Cycle Management, which provides implementing guidance for DoDI 5000.02 Operation of the Defense Acquisition System and consolidates systems engineering, product support and program management into a single integrated life cycle management document. The document

22
establishes requirements to ensure competition, or the option for competition, at both the prime and subcontract levels. It also encourages the use of open system architecture to enable competition upgrades and the acquisition of technical data packages, periodic competition for subsystem upgrades and the licensing of additional suppliers to enhance competition. The creation of a life cycle approach to programs supports competition improvements. Early decisions to use open system architecture or to acquire data rights support continued opportunities for competition throughout the program life-cycle.
Accurate reporting of competition data in Federal Procurement Data System- Next Generation is critical to ensure accuracy of data obtained from the system. Inaccurate coding can result in an under reporting of competition and effective competition actions and dollars. The Air Force Competition Advocate General issued a memo on 22 April 2013 mandating that all Air Force personnel responsible for the coding of Contract Actions Reports complete updated FPDS-NG training.
The Air Force Materiel Command (AFMC) developed the Air Force Better Buying Tool, which was launched in January 2013. The tool provides techniques and tools to implement Better Buying Power 2.0 and enhance competition. It addresses all of the BBP 2.0 factors and sub-factors and provides 80 techniques to enhance competition in all phases.
The Air Force Competition Tool has been extensively modified to enable its use for competition planning and tracking, and results in extensive information on the status of the Air Force Competition Program.
All Better Buying Power 2.0 actions are closely monitored by Air Force senior leadership until completion. Status slides for all open actions are updated and provided to leadership weekly and the status is briefed monthly. Deep dive briefings on all actions were provided on all tasks, and will continue to be provided until closeout approval is granted.
SUMMARY The AF exceeded its FY13 overall competition goal of 37.9%, achieving a rate of 40.7%. The AF is fully committed to the Competition and Commercial Advocacy Program, the use of full and open and effective competition. The AF competition program is innovative and vibrant, continually seeking opportunities to compete, or to enhance competition further, whether in CONUS or in our contracting offices throughout the world. AF contracting professionals at every level remain engaged and cognizant of the current policies and procedures to affect the optimum end result. Commands will continue to stress with their customers that competition is the standard and any proposed single-source action will be highly scrutinized, balanced with efforts to also meet small business/socio-economic program goals which are legitimate competing interests. FY14 will be another extremely challenging year for the AF with further cuts to manpower and budgets anticipated. Contracting Airmen will continue to strive to be the best and most effective in enhancing competition as they do in all aspects of

23
contracting. By understanding that work done today may take years to result in significant increases to the competition rate, the AF will continue to strive to create the most robust competition advocate program within the Department of Defense.