department of defence · applying human engineering to the development and acquisition of military...
TRANSCRIPT

AD-A246 354AR.-YSTM 15 6 354t... AR-006-650
DEPARTMENT OF DEFENCE
DEFENCE SCIENCE AND TECHNOLOGY ORGANISATION
AERONAUTICAL RESEARCH LABORATORY
MELBOURNE, VICTORIA
Aircraft Systems Technical Memorandum 150
AIRCREW TASKS AND COGNITIVE COMPLEXITY
DTICFEB26 1O92, by
D J.G. MANTON
P.K. HUGHES
P~ublic 7n• - ;. 1--- , "•" •
djutfitlution isunhlln, .
Approved for public release
© COMMONWEALTH OF AUSTRALIA 1991
NOVEMBER 1991
92-045049• 2• 9 •t • I.' tilllllllilll

This work is copyright. Apart from any fair dealing for the purpose ofstudy, research, criticism or review, as permitted under the CopyrightAct, no part may be reproduced by any process without writtenpermission. Copyright is the responsibility of the Director Publishingand Marketing, AGPS. Enquiries should be directed to the Manager,AGPS Press, Australian Government Publishing Service, GPO Box 84,CANBERRA ACT 2601.

AR-(X)6-650
DEPARTMENT OF DEFENCEDEFENCE SCIENCE AND TECHNOLOGY ORGANISATION
AERONAUTICAL RESEARCH LABORATORY
Aircraft Systems Technical Memorandum 150
AIRCREW TASKS AND COGNITIVE COMPLEXITY
by
J.G, MANTON
P.K. HUGHES
SUMMARY
There is an increasing demand for Human Factors Engineering of aircrew tasksduring the design and development of future aircraft cockpits and aircrew workstations. Theextensive data-hase of experimental research literature on human performance is of marginalvalue in aiding the design process, This paper outlines several techniques associated withthe analysis and description of aircrew activities for use in prospective studies of aircrewtask design. The techniques of protocol analysis, eye-movement monitoring and taskanalysis, amongst others, are reviewed. The underlying issue of cognitive complexity in themanagetnent of aircrew interfaces is addressed.
DSTOMEL8OURNE
© COMMONWEALTH OF AUSTRALIA 1991
This is a written version of a presentation made at the Silver Jubilee Conference ofThe Australian Psychological Society, 23-28 September 1990 held at The University ofMelbourne, Victoria,
POSTAL ADDRESS: Director, Aeronautical Research Laboratory506 Lorimer Street, Fishermens Bend 3207Victoria Australia

CONTENTS
PAGE NO
I. INTRODUCTIO N ................................... I
2. P-3C ORION HUMAN FACTORS ........................ 2
3. S-70B-2 SEAHAW K ................................. .6
4. PHYSIOLOGICAL MEASURES OF WORKLOAD .............. 11
5. D ISCUSSIO N ..................................... 16
6. ACKNOWLEDGEMENTS ............................. 16
7, REFERENCES .................................... 16
DISTRIBUTION LIST
DOCUMENT CONTROL DATA
NTIS (iY.A & j.
MISI
By lI
A-, .......

i. INTRODUCTION
In the context of Australia s defence policy, which emphasizes self reliance. are requirementls for ourmilitary aircraft to perfonr tasks that are unique to our sphere of military interest. Adaptation ofairframes, engines, avionics and weapon systems from our overseas suppliers to meet theserequirements emphasizes the need to maintain and develop a technology and research base in HumanFactors Engineering (HFE) for aircrew systems. There are numerous HFE techniques for airerewsystems design that are applicable to the prc-design phase of equipment procurement. Application ofthese methods at this early stage of the procurement cycle is critical if human factors considerationsare to have an effective impact on the eventual interface configurations.
A major requirement of HFE practice during the earliest stages of system specification is theapplication of methods which can identify design problems and indicate design ,,olutions. Severaltools are available for the representation of job and task variables which can demonstrate the imp;ict ofdifferent aircrew interface options. This paper outlines some of the work that is being carried nutt inaircrew task analysis, workload modelling and performance research in Support of aircrew system.,sHFE at Aeronautical Research Laboratory.
1.1 Human Factors Engineering
Topmiller (1981) suggerted that the difficulties of integrating HFE design guidelines into the systemsdesign process during the 1950s and the early 60s were a function of the methods and background ofthe practitioners at that time. State-of-the-art human factors was based on an expensive experimentalapproach where specific problems were studied in controlled environments and the results may ormay not have had implications for the variables critical to the design issues being addressed.Development of the digital computer and the use of system simulation and operations researchmethods provided the facilities for the integration of HIFE into the design process. Thesedevelopments were typified by the Siegel and Wolf (1969) 2-operator, computer simulation model
The continuing development of computer based modelling and design tools underscores therequirement to inclhde a systematic process for implementing HFE in systems design (Copas et al.,1985). The US Army's Human Engineering Laboratory has referenced 189, mostly computer based,HFE tools and te.i',,,iques to aid the designer (Carlow and Associates, 1988). However, it should notbe presumed that there is an extensive body of HFE practitioners who know how to use thesetechniques or have an idea of their utility in a design environment. Recent developments in the USand Europe include the adoption of standards which specify the requirement for implementing HFEprocesses in the design and acquisition of new systems. These developments are based on the USDepartment of Defense's specification, MIL-I-1-46855B (1984) which defines the requirements forapplying human engineering to the development and acquisition of military systems, equipment anndfacilities. Draft Air Standard 10/143B (1988) has been produced by the Air StandardizationCoordinating Committee (ASCC) which is a fve-power defence committee concerned withinteroperability of military aircraft systems. This standard has been taken as a model for the 1989draft NATO standard on the application of human engineering to advanced aircrew systems. Thepurpose of these standards is to standardize methods for including HFE procedures within theacquisition process. These procedural specifications have been devised because of the consistentfinding that HFE techniques are not being applied during the system development phase (Beevis,1987).
Implementation of these procedural statements and requirements requires practitioners well versed inthe HFE tradition. However the tradition is spread thinly across the world among a few advocates.While the scientific human performance research literature has been systematically catalogued in thecommendable Engineering Data Compendium (Boff and Lincoln, 1988) its utility for advocatingdesign solutions is, in our experience, limited. Research data from laboratory based science is, inmost instances, not applicable to real world job design (see Reisner, 1988; Whiteside and Wixon,1988).
A balance between the scientific approach, constrained by hypothesis and measurement requirements,and the analysis of aircrew behaviour in operational contexts is necessary. The objective is to generate

sufficient information and knowledge so that models can be used to represent the expected cognitiveand behavioural task demands of aircrew interacting with different avionics system configurations.The approach to modelling needs to be an eclectic one, embracing or recnuiting theoretical points ofview and utilizing operations research data from the various perspectives of psychology, operationsrcearch, linguistics, sociology and computer science. The cognitive engineering approach advocatedby Norman (1988) is an attempt to synthesize these various contributions in order to generate designoptions and solutions.
1.2 Task Analysis and Cognitive Worklond
There ,rce several methods available for the analysis and simulation of aircrew performance andcognitive workload (see Beevis, 1989). The task analytic and the task simulation approaches involvea description, in task analytic terms, of aircrew activities and the sequence of activities over tire.These models, based on heuristic assumptions of cognitive workload, can indicate areas of interfacedesign which might lie beyond the performance limits of aircrew. Criteria of acceptable andunacceptable cognitive workload limits have been developed from theoretical points of view,empirical findings and the opinions of subject matter experts.
The modelling regime requires research support in two principal areas. The first requirement is for atheory of action which dcescribes the selection of task combinations used by an operator. The secondrequircment is for a methoc of determining the amount of effort or cognitive complexity involved inperforming the tasks,
Suchman's (1987) theory of action emphasizes that on-going behaviour is directed by the localinteractions with the environment and plans are resources that guide, rather than control, taskactivities. The representational approach and formalisms of Kitajima (1989) and Barnard (1987)consider the situational aspects for the description of operator activities. The representations lendthemselves to assessment of actions in terms of the complexity of the cognitive requirements and acost in terms of energy units. Cypher (1986) discusses the requirement to organize activities into asingle stream of performed actions. This 'linearizing' requires a significant portion of our 'mentalenergies'. The situational approach to operator behaviour is an attempt to overcome the more rigidpreconceptions and perceived inadequacies of operator behaviour embodied in approaches such as theGOMS (Goals, Operators, Methods and Selection rules) formalism (Card, Moran and Newell,1983).
The work discussed in this symposium paper deals with attempts to implement the task analytic andsimulation approaches to aircrew HFE and also to describe some of our research concerned withaircrew behaviour. This work is progressing in two general areas: aircrew workload and activitydescription in current military aircraft, and research on the physiological methods of workloadassessment. The overall aim is to develop and use techniques of HFE that will predict aircrewbehaviour and performance capability and indicate requirements and design solutions for theengineering of interface devices that will make the best use of aircrew cognitive capability.
2. P-3C ORION HUMAN FACTORS
The Royal Australian Air Force (RAAF) operates the P-3C Orion aircraft in the Long Range MaritimePatrol (LRMP) function. Although the P-3C configuration is very close to that used by the US Navy.the RAAF operate this aircraft in a more diverse set of missions than their American counterparts. Theaircraft may need to be modernized later this decade and there is some chance that an indigenouslyspecified tactical avionics fit may be considered.
In support of a project to define the requirements for a modernized or new LRMP aircraft it isdesirable for human factors aspects o1 crew functions to be considered. Current work involves adescription of aircrew tasks and console configurations in the cabin of the aircraft. This work hastaken the form of task activity, verbal protocol and a questionnaire analysis.
2.1 Aircrcw Activity Analysis
A preliminary study was conducted to collect data on P-3C aircrew activities. The aim of this studywas to gather data on the frequency and sequential dependencies of aircrew interactions with the
2

various interfaces in the aircraft. The technique used was the same as that described by Christensen(1949) and required observers to watch and record activities that aircrew performed duringoperational duty. In the present study the method involved the compilation of a list of categories ofaircrew activity so that an observer could recognise what activity was being performed. Data werecollected at 10 second intervals by observers standing near the Tactical Officer (TACCO),Navigator/Communicator (NAV/COM) and the Sensor Station 3 (SS3) positions. (SS3 operates mostof the above water sensor systems.) Categories of activity were written down using a code associatedwith either the part of the console the operator was interacting with (for example changing switchsettings on the upper panel or typing on a keyboard) or other activities such as talking over theintercommunications system (ICS), consulting manuals, writing in a log book etc. Selection of anappropriate time interval at which to note down crew activities is dependent on the nature of theactivitic:• being observed and the ability of the observer to make an accurate record. In a work-upexercise in the simulator it was determined that one observation every 10 seconds appeared areasonahle and sustainable rate over protracted periods.
X2 Non specificXl Porthole
P6 SOMS Flight manualP4 DOwn log
P3 IntelligenceP1 Quick referenceV4 Verbal (Direct informal)
(n V3 Verbal (Direc• formal)1-.U V2 • Verbal (ICS informal)
V1 I =-Verbal (ICS formal)D2 Tracker ballL5 Centre keyset(sloping panel)
M6 ARO (alpha/numeric readout)M4 Delete da'aM3 " - . MPD (main display)M2 Weapons preset
0 5 10 15 20 25 30
Percentage of Total Observations
Figure 1. Activity analysis of the TACCO over a 20 minute period,
Successive observations were noted down as a time series of coded activities. One of the majoradvantages with this type of data collection was the speed with which data could be collected,analysed and reported.
Data were collected during two anti-submarine warfare sorties after the aircraft arrived on task. FigureI is an example of the type of data that were collected from the TACCO's station over a 20 minuteperiod of observation. It was apparent that during high workload segments of the sorties the aircrewwere interacting with three or four different components of their consoles in an observation interval.This implies that the data were not sampled frequently enough to reflect continuous airerew activityand it was therefore difficult to analyse the sequential dependency of coded observations. In somesegments of the sorties there were protracted periods of low flying with steep turns and turbulence.During these periods the observers (and some crew) succumbed, in varying degrees, to air sickness.Although Christensen suggested that an experienced observer could cope with making an observationat the rate of one every two and a half seconds, an inhospitable flying environment may makes thismethod of data collection impractical. An alternative method of data collktion such as an audio andvideo record, which can be analysed in the laboratory at a later time, may be more suitable. A flight-worthy fixture for mounting video cameras and recorders has been designed and tested and is in thefinal stages of gaining approval for flying.
3

2.2 Verbal Protocol Analysis
The ICS carries the verbal communications between alrcrew and supplements information transmittedelectronically from screen to screen and via hand signals. The internal layout of the P-3C is such thatthe TACCO is physically isola:ed from the pilots and the other members of the crew except theNAV/COM, who sits across the aisle (see Figure 2). The ICS communications record is a rich sourceof infomation conoerning crew coordination and maintenance of situational awareness and aircrewverbal interaction has been used as a source of data in several studies. Foushee, Lauber, Bactge andAcomb (1986) studied aircrew fatigue and found that crews who had been flying togetherimmediately before the study communicated more and had better ratings of performance compared tocrews who were well rested before the study and had no recent operating experience together. Kankiand Foushce (1989) later analysed the verbal protocols of the fatigued and non-fatigued groups and
Engineer NAV/COM SS3 SEM Lookouts
PIOT 12 Trew
P TS TS Indicate link probabilities
Surveillance scrials ol less than 0.02
Engineer NAV/COM SS3 SEM Lookouts
SPILOTS TACCO Rdo $
S. ... Indicate link prob~bibitesot less than 0.02
Weapon firing serials
Figure 2. Link diagram of the proportion of verbal interactions between crewmembers during surveillance and weapon firing serials in the P-3C .aircraft.
.04

detemtined that the low error (fatigued) group demonstrated a more homogeneous pattern of c;aptain-first officer interactions con pared to the high error group. Operating in a military tactical environmentwith a large crew involves a different type of verba., interaction compared to routine transportoperations. However the format and pattern of communication in facilitating crew performance is anissue that should be considered when designing a new aircraft and avionics configuration.
There has been a strong subjective asse,,snient by aircrew with experience in both the B and Cversion of the aircraft that the P-3B configuration, where the crew in the cabin were all seated in arow facing the side of the aircraft, was much better for crew coordination. Our current analysis of P-3C aircrew verbal interaction is an attempt to relate the pattern of communications with preferencesfor a particular spatial layout of aircrew stations. At this stage of the project the proportion of verbalinteractions between aircrew has been determined during a surface contact plotting exercise andduring an air to surface weapon firing segment of a single sortie. Figuie 2 shows the linkprobabilities between the crew positions and shows the differences in verbal communication patternbetween the surveillance and the weapon firing stages.
Further analysis of verbal protocols during other mission types will be conducted to determine boththe flow of control (see Figure 3) and changes in the link configurations. Flow of control in thisinstance refers to a convention of indenting coded protocol utterances to indicate that an utterance isrelated to the subject matter of a previous utterance. Grouping of utterances in this way can give anindication of the general topic, or focus, of discussion and the flow and connections betweenutterances. An example of flow of control analysis from SHAPA, a protocol analysis tool (Sandersonet al., 1989) is presented in Figure 3. This style of representation analysis is being investigated todetermine the relationship between topics raised on the ICS over time. Analysis ot the task functionsthat verbal utterances support in terms of information flows and situational awareness will also beassessed using various categories of utterances based on the speech act coding scheme of Kanki andFoushee (1989) with some additional categories added.
2.3 Questionnaire Analysis
A questionnaire was used to determine the functional boundaries between the different aircrewpositions in the P-3C. Groups of ten aircrew who between them held a current qualification as P-3CPilot, TACCO, NAV/COM or SEM were asked to consider which were the five most importantfactors for them to carry out their jobs in the aircraft. Respondents filled out the questionnaire for fourof the major mission types of the aircraft.
Analysis of the data was dependent on the development of a set of categories against which responsescould be classified. This exercise, conducted by two analysts, revealed II major categories with alarge number of sub-categories. The major categories of the classification scheme (see Figure 4)reflects a high-level functional taxonomy of aircrew jobs across mission types. Analysis of the kinds
Ltnce ENCODED VERBAL PROTOCOL TO-FROM
I COOR) DEXTERNAL (RADt)I, CONTACr) NAVCOM-TACCO2 COORD EXTERNAL (RADtOCONTAC-I) TACCO-NAVCOM3 ACKNOWLEDGEMENT (2) NAVCOM-TACCO4 COORD EXTERNAL (RADIO, FREQUENCY) TACCO-NAVCOM5 COORD EXTERNAL(RADIO. FREQUENCY) NAVCOM.TACCO6. ACKNOWLEDGEMENT (5) TACCO-NAVCOM7 COORD EXT'ERNAL (RADIO, FREQUENCY) TACCO.PtLOT18 CONTACT (ESM, TARGE 1t) TACCO-SS39 ACKNOWLEDGEMENT (8) SS3-TACCOI0 FLIGtrrPATH (tEIGtrT, REDUCE) PILwr-TACCOI ! ACKNOWLEDGEMENT(to) TACCO-PtLOTt2 CONTACICTV(ESM. LOSTTAROET 1) TACCO-SS313 ACKNOWLEDGEMENT(IO) SS3-TACCO
Figure 3. Indicates a flow of control style analysis based on the predicateand argument structure provided by the protocol analysis tool SHAPA.
5

of specific tasks within categories revealed little overlap in job boundaries because the tasks werehighly specific to the aircrew position. One category of response not included in the figure was thatconcerning equipment. Aircrew sometimes took the opportunity in the questionnaire to point out thetype of equipment they would like in order to do their job. This category was very different fromthose which pointed out what was important for them in doing their job.
0 0.00
0 109o.0.0
Figure 4. Proportion of responses within functional category for each of theoperator groups.
Figure 4 indicates the frequency with which aircrew, in the four categories surveyed, mentionedtopics in the classifications listed in the figure. A comparison across these classifications indicates therelative importance of the topic to the job performed. The data indicate that both the TACCO andNAV/COM deal with external coordination. This is reflected in the NAVCOM's tasks which involvemanagement of the radios and data links and the TACCO's responsibility to his tasking agency, e.g.Maritime Headquarters. A m.jor aspect of the NAV/COM's job is the management of the navigationsystems in the aircraft concerned with the flightpath, The SEM is mostly concerned with themanagement of the personnel operating the aircraft's systems and making sure that the systems areoperating efficiently given the physical and tactical environment. Other data have been used todetermine how the relative importance of these function categories change over different missiontypes.
3. S-70B-2 SEAi-IAWK
The S-70B-2 Seahawk helicopter is currently being deiv'.red to the Royal Australian Navy (RAN).Thý aircraft is designed to provide anti-submarine protection for ships and provide targetinginformation for anti-surface ship actions. The aircraft has been developed to a unique RANspecification and will undergo a period of test aid evaluation over the next 18 months. The aim of the
6

current study is to determine the mental workload of the Pilot, TACCO and Sensor Operator(SENSO) wi:h a view to assessing an optimum distribution of tasks between them if additionalweapons and sensor-s are fitted to the aircraft in the future. In order to assess whether the currentthree-man crew will operate additional subsystems effectively calls for a prospectivc analysis basedon the workings of the current aircrew-aircraft system. However, because the aircraft is not yet inoperational service, there is little empirical data on which to base a prospective analysis.
3.1 Mission and Task Analysis
A mission analysis is a graphic and verbal description of the phases in a mission that the system isintended to u :ertake (Meister, 1986). Specifically for this study, the phases of an anti-submarinesonic were compiled by subject matter experts from tile Fleet Air Arn and the expected activities ofaircrew within each pThase were described. From this top level description several operationalsequence diagrams (Geer, 1981 ) were developed. An operational sequence diagram (OSD)represents expected aircrew activities and the associated interfaces against a mission time line.
Therc are two essential eiements in cognitive workload prediction and task simulation. An e.sinmtic u lthe atte ntional demand or cognitive ý. orkload associ.,ed with the task is required and also sonicestimate of the length of time a task will take to com ,lete, Tasks identified in the preparation of theOSDs can be assigned attentional demand values based on judgements by subject matter experts oranalysts. McCrackrn and Aldrich (1984) developed an approach for estinating cognitive workload inanny helicopter operations. They used four semantically labelled, ordinal scales which covered thevisual (V), auditory (A), cognitive (C) and psychomotor (P) aspects of a task. These have beensubsequently re-iscd to interval .icales using a paired comparisons survey procedure and subjectmatter experts. Additional scales have been developed (Aldrich, Szabo and Bierbaum, 1989) attd therepertoire of sc des available now includes visual, either unaided or with night vision goggles,auditory, kinesthetic, cognitive and psychomotor attributes.
Estimates of the length of time that aircrew would take to ,omplete tasks are currently based onestitiates derived from the analysis of video records of aircrew interacting with the two principaltactical avionic interfaces, the Multi-Function Keyset (MFK) and the Tactical Display Unit (TDU).The data were collected on a benchton configuration of the avionic interfaces at a software supportfacility for the aircraft while two aircrew were 'talked through' the phases of the sortie.
The MFK consists of a special purpose keyboard and an eight-line alphanumeric display whichallows interaction with the information in the tactical database. When characters are typed into theinterface they are shown in a scratchpad at the bottom of the screen and entered into the appropriateline of the page ott display by pressing an adjacent line select key. The data derived from videorecords of MFK activity included the frequency of key presses, line selects, page slews, p•utses andhesitations during completion of a particular task. After the data were square-root transfonned, astepwise regression revealed 79.0% of the variance (F(3,35), p<0.001) could be accounted for by thefollowing equation:
Time (s) = 1.98 + 0.268 'lkey presses + 1.1 19x/pauses + 0.933",page slews.
Estimates of the number of keypress and slews can be generated from the OSD activitydescriptionsiThe number of pauses was estimated from its relationship to the number of line selectactions. Even thouglh the bivariate correlations with the other variables was low, a regressioneqJuation which accounted for a significant proportion of the variance (p<00.5) was produced by astep-wise procedure where the number of pauses could be predicted from the number of line selectactions. This latter equation can be used to generate a value for the number of pauses in the 'time-to-complete' equation (see above).
Data for the TDU were different from those for the MFK. The TDU, as used in the data collection forthe TACCO position, presents a graphic plot of the position of tactical features in plan view.Changing the range scale or setting up fly-to points etc is achieved by manipulating a special purpose,static, three-button mouse-type device. Cursor position is manipulated using a force sensingtransducer operated by the thumb of the right hand. Analysis indicated that the total time to completc
7
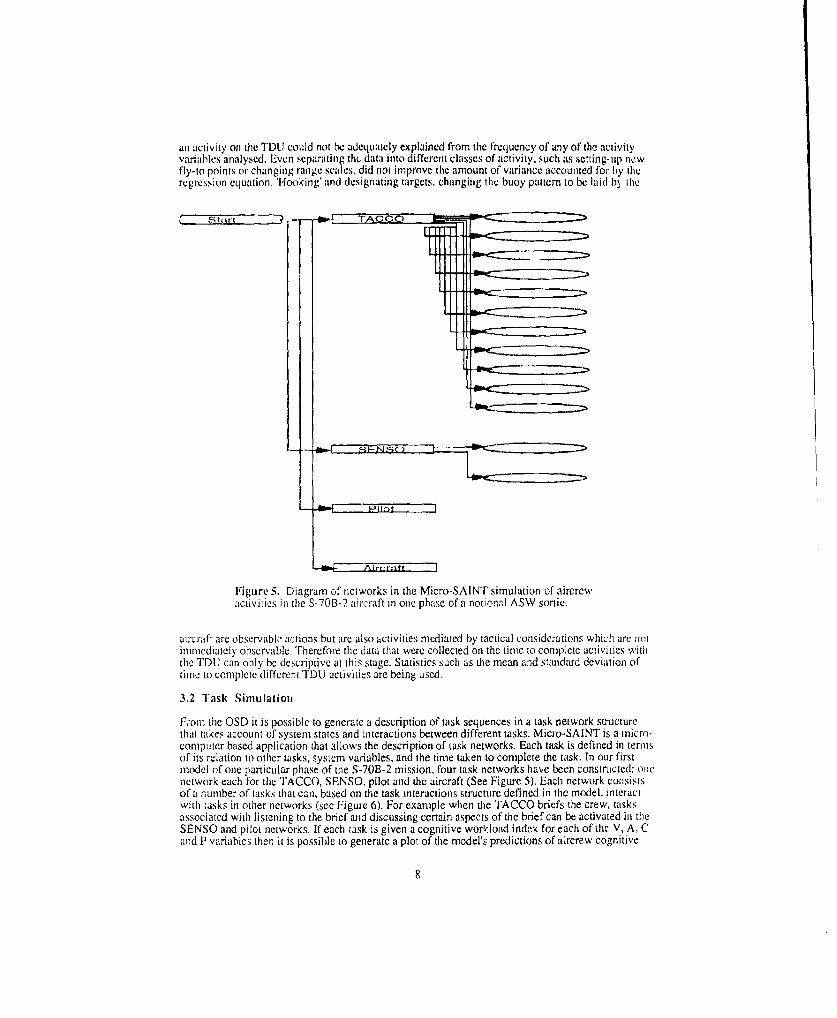
an activity oit the TDU could not be adequately explained from the frequency of any of the activityvariahles analysed. Even separating thL data into different classes of activity, such as setting-up newfly-to points or changing range scales, did not improve the amount of variance accounted for by theregression equation. 'Hooking' and dcsignating targets, changing the buoy pattern to be laid b3 the
Start - - TAQGO -
Figure 5. Diagram of networks in the Micro-SAINT simulation of aircrewactivities in the S-70B-2 aircraft in one phase ofa notional ASW sortie.
aircraft are observable actions but are also activities mediated by tactical considerations which arc notimmediately observable. Therefore the data that were collected on the time to complete activities withthe TDU can only be descriptive at this stage. Statistics such as the mean and standard deviation oftitne to complete different TDU activities are being used.
3.2 Task Simulation
From the OSD it is possible to generate a description of task sequences in a task network structurethat takes account of system states and interactions between different tasks. Micro-SAINT is a micro-computer based application that allows the description of task networks. Each task is defined in termsof its relation to other tasks, system variables, and the time taken to complete the task. In our firstmodel of one particular phase of the S-70B-2 mission, four task networks have been constnicted: onenetwork each for the TACCO, SENSO, pilot and the aircraft (See Figure 5). Each network consistsof a number of tasks that can, based on the task interactions structure defined in the model, interactwith tasks in other networks (see Figure 6). For example when the TACCO briefs the crew, tasksassociated with listening to the brief and discussing certain aspects of the brief can be activated in theSENSO and pilot networks. If each task is given a cognitive workload index for each of the V, A, Cand P variables then it is possible to generate a plot of the model's predictions of aircrew cognitive
8

workhl. od agitiin t :1 timei-line: of' the mission (see Figure 7). This form of workload representation canhe used to gain sqome idea of the peritxds off high workload that might he experienced by aircrew inlut[Lre sysme to confi gurations and the workload implications if new task's arz a'jded to the networks.
Mlost of the task analytic and simulation modelling approaches to aircrew workload (see Beevis,lQ89't embhrace the con1cepts of Wickens's multiple resource theory ( Wickens, 1984), However theway in which criteria have been applied for acceptable and unacceptable workload are based onsub 'jective ;oscssmntcns of what appears reasonable and heuristics based on the theoreticalpropositions. The acceptahle. marginal and unacceptable criteria shown in F-igures 7 are defined in)ternis (of the competing demands of concurrent tasks for a single resource and are generated from aresource conflict matrix (Lysaght ct al., 1989). Thev conflict matrix generally indicates that 'f twotasks compete for the same resource then the task will be acceptable when the sumn of ratings is belowk:1 vailic of 8, marginal to at value of 10I and uinacceptahle above this value. Further rules have been[lCVCloltcLd ito tke account of crosstalk b,,tween the VAC and P variables during the perfonnance ofiwo concuirrent tasks,. [-or example, il'a task receives an itnacceptahie score on one variable the task ismimccertathle. if thrree variables, receive marginal scores the situatton is unacceptable etc. These rulesftor (Icil ný %ith resourLce conf1ýlc and cros~stalk interfecrence have not yet been implemented in Out-
-Task
-interaction withanother network
Figure 6. Diagratm of tasks in the TACCO network indicating interactionswithi other networks in the model. T]he table at the bottom of t~he figureniduicatte% the value of the selected variables, in this ease V, A, C and P, duringan antmiation of the network in Micro-SAINT.
9

20-
16-Uacpal
12.
8-
4.
28 AUDITORY1LU-
o 12.
Marcgina[LUB0 Acceptable
4
0
z28 _____LU ICOGNITIVE]
4 16LU Unacceptable
12-
28
16-Uacpal
12-
0 200 400 600 800
TIME(secunds)
Figure 7. Pilot attentional demand (V,A,C & P) values for tasks associatedw~ith a Micro-SAINT simulation of one phase of an ASW sortie.
10

4. PHYSIOLOGICAL MEASURES OF WORKLOAD
Operator mental workload is an important, though notoriously difficult concept to define andmeasure. It can however be regarded as a "hypothetical construct intended to capture limitations onthe operator's information processing apparatus as these are viewed from the perspective of someassigned task" (Gopher and Donchin, 1986). In an attempt to measure the interaction between taskdemands, operator effort and performance criteria (which presumably are the factors that contribute toworkload) researchers have called upon many different performance, subjective, secondary task andphysiological methodologies.
Physiological indices of mental workload are based on the assumption that bodily states vary in acharacteristic way with what a person is doing and are an attempt to uncover the underlying orcomponent processes involved in performing a task. A physiological index may also be regarded as aconcomitant variable which accurately reflects an underlying processes.
In order that physiological measures reflect meaningful task parameters it is important that they areinterpreted within the context of an accurate task analysis or task taxonomy. The relationship betweena physiological meitric and ta!;k demand is an essential requirement to validate the particular measureand to interpret physiological changes under different task conditions. Unfortunately there are anumber of ambiguous findings in the literature in which a physiological variable does not vary in theexpected manner according to changes in sabjective or performance workload (eg Wierwille andConner, 1983). If workload is a multidimensional aspect of task performance, as this suggests, thenit is not surprising that no single metric will be diagnostic of all task conditions. It may be that there isno direct relationship between the physiological index and mental workload or that the modelunderlying the change in physiological status is untenable. Arousal theory models generally assutnethat increased physiological activation is associated with increased levels of arousal and heightenedperformance. This has been found to be an inaccurate description of many complex, real world taskswhere generalized physiological activation does not correlate with subjective and primary taskperfornance measLires of workload (Wilson and O'Donnell, 1988). More recent resource models andcognitive-energetical models postulate several resource pools associated with specific input/outputmodalites, stages and codes of processing. A complete description of task workload therefore callsfor a battery of workload estimation techniques which assess component attributes of a task.
As part of an overall workload assessment battery, we currently use eye movement and cardiacresponse monitoring as promising physiological indices of workload. Eye movement behaviour is anindex of the workload associated with visual inspection and cardiac responses reflect the cognitiveeffort associated with task perforniance.The following paragraphs briefly describe the background tothese techniques and give two examples of the application of these techniques.
4.1 Eyve movement behaviour
Voluntary saccadic eye movements result in the sequential orientation of an observer's eyes todifferent parts of the visual field and have two major functions. Firstly, they serve to orientate thefovea with a desired stimulus location in the visual field. Secondly, saccadic eye movements changethe orientation of visual attention to different regions of the visual world. Eye movement behaviour,or more importantly the temporal and spatial distributions of fixations between successive saccadicmovements, is an overt and selective mechanism for obtaining visual information from differentregions of an extended visual display. If fixations reflect in some way the intake of visual informationnecessary to perfonm a task, then their spatial and temporal distribution might reasonably be expectedto reflect the visual workload associated with that task (Hughes, 1989).
Fixation behaviour can be conveniently described in termas of the following spatial and temporalvariables.
I. The spatial distribution of fixations on stimuli indicates which visual information wasneeded to perfornm the task. Informative, dynamic, salient, ambiguous, novel or degradedstimuli are more frequently fixated than stimuli of lesser importance. Stimuli not fixatedmay be a result of non-informativeness or load shedding due to excessive workload. Apoor mental model of the environment may lead to an expansive pattern of fixations incontrast to a more orderly and les3 expansive scan pattern of an experienced observer. The
11
I

order of fixating different stimuli describes the relationship between different stimuli andindicates the manner in which the observer's mental model of the display is developed.
2. The duration of an individual fixation indicates the difficulty or level of accuracy ofextracting information from a visual stimulus, Long fixation durations may also reflect therequirerni to maintain fixation somewhere in the visual field under low workloadconditions.
Eye movement behaviour is determined by both non-visual (cognitive or subject related) and visualfactors. In a complex task display it is possible to manipulate the visual format (clutter, complexity,contrast, colour or any other dimensional property) of stimuli or the total number and locatirn ofstinmuli. There are also many different reasons and requirements for inspecting a visual displayranging from active search for unknown target stimuli to monitoring one or more displays in asupervisory control paradigm. Any of these factors, together with possible interactions betweenfactors and over-riding individual subject differences, will determine the particular eye movement andfixation behaviour. The problem, when attempting to use eye movement behaviour as a metric ofworkload to compare systems that differ along at least one of the above dimensions, is that eyemovemncnt behaviour has low diagnosticity in identifying the precise cause of a particular workloadlevel. Instead, eye movement behaviour should be regarded as a relatively global index of bothperceptual and central-processing aspects of workload (O'Donnell and Eggeineier, 1986).
4.2 Example of eye movement research
We are currently studying eye movement behaviour during inspection of coloured and monochromeElectronic Flight Information System (EFIS) displays to determine whether there is any advantage ofhaving redundantly colour c•oded information. The task given to subjects was to maintain fixationoutside a Horizontal Situation Indicator (HSI) display, then search for the active waypoint in thedisplay, report the altitude and predicted ground speed, then again fixate outside the display. Theactive wa,'point in these displays is normally the one closest to the aircraft symbol and is thereforedistinguished from other, more distant waypoints, by a spatial code. In colour EFIS displays thisspatial code is augmented with redundant colour coding so that the active waypoint and its associatedalphanumeric label is coloured magenta whereas other waypoint information is white, Inmonochrome EFIS displays the active waypoint can be distinguished from other waypoints only bythe spatial code. We also used displays which differed in terms of the amount of displayedinfornation, Low information content displays contained aircraft track and waypoint information towhich navaid and database waypoint information was added for high information content displays.
Figures 8 to 11 show some preliminary data from a subject performing the search and verbalizationtask with 12 different colour displays (for each information level) compared to 12 monochrome butotherwise equivalent displays, Figure 8 shows the total time of all fixations (gaze duration) associatedwith searching and reading the waypoint information, There is a clear benefit of reduced search andacquisition time for the colour condition but only when the display was relatively cluttered. In simpledisplays there was no performance difference between the two kinds of display. Figure 9 indicatesthat fewer fixations were required to acquire the information in the colour condition compared to themonochrome condition for both simple and complex displays but that the difference was largest forthe high complexity condition. Figure 10 shows that longest average fixation duration occurred forcolour compared to monochrome displays, The slower rate of changing fixatiou on low complexitycolourcd displays was brought about by a greater frequency of fixations in monochrome displayseven though the colour and monochrome displays were inspected for an equivalent duration, Anentirely different strategy of a longer inspection time and greater number of fixations in the complexmonochrome condition brought about the relatively slower fixation rate for complex coloureddisplays.
The shorter mean fixation duration on monochrome displays suggests more efficient informationacquisition behaviour compared to inspection of colour displays. However, closer examination ofindividual scanpaths and the spatial distribution of fixations shows that different eye movementstrategies were used and that average duration is a misleading description of the strategic aspects ofvisual acquisition. For colour displays the subject usually acquired the relevant alphanumericinformation on the first fixation in the display. The saccadic eye movement preceding this initialfixation on the waypoint information was about 8 degrees and indicates that the peripheral colour
12

information was used to dircct subsequent fixations. In contrast to this strategy there were an averagcof more than two fixations bcfore thc alphanumeric information was fixated in the monochromedisplays. In this case the spiltial location could not be accurately designated using peripheral visionprior to the first saccade but required active search. It could be concluded that the generation of one ormore intervening fixations prior to target acquisition is a less efficient strategy than a single, welldirected saccade.
2.5.- 3.0
2.0 2.5
S2.0C 1.5:
S 1.5
1.0.
o 3 1.0
0.5 onwhr ore 0.5 Mo~c
0.0 Colr_ __Clo
Low High 00 Low Hi'ghtIflormatlon level Informatlon level.
Figure 8. Average gaze duration to acqUire Figure 9. Average nurnbcr of fixations toactive waypoint information. acquire active waypoint inform-iation.
1.42
S 1.0.
C.2________________________
S0.8.2
g 01.8 1.5
0.4. a 0
02 -.--a Monloc rome ~ 0
0.0. 11111 ColorHi Kgh Other Final Other Final
Information level. Colour Monochrome
Figure 10. Average fixation duration. Figure 11. Box plot diagram of fixationduration for final fixation on waypointinformation and all other fixations. Thelimits of each box are the 25th and 75thpercentiles and the median is shown bya horizontal line. End points show the10th and 90th percentiles.
13

Fi:,ations can therefore be categorized as either the final fixation on the target stimuLua or a previousfixation. Because subjects were required to perform the task as quickly and as accurately as possibleit can be assumed that final fixations were primarily associated with extraction of waypointinformation and previous fixations associated with search for the waypoint information. Figure I Ishows the median fixation duration of initial fixations in the monochrome condition was shorter thanthe final target fixation and implies that less decision making or cognitive effort was associated withthese exploratory 'search' fixations. On the other hand there is no evidence for this distinction in thecase of colour displays. Furthermore the median duration of final fixations was similar for the colourand monochrome displays which is evidence for a similar extent of cognitive or processing effort.
If oculomotor effort, or even cognitive effort associated with programming eye movements andfixations is equated with the number of eye movements made then these results indicate that moreeffort was required to search and acquire information P'nm the monochrome display. This conclusionis particularly important in the case of simple displays when there was no performance difference interms of search time between colour and monochrome displays.
4.3 Cardiac responses
The most frequently used physiological workload measures are those derived from the cardiac signal.Two commonly used measures are average heart rate expressed in beats per unit time interval andsinus arrhythmia or inter-beat interval variance expressed in terms of a power spectrum or standarddeviation. Autonomic control of heart rate is influenced by nany factors including thermoregulation,respiration, motoi activity, emotional and cognitive factors but it is possible to isolate cardiacresponses due to cognitive processes by appropriate analysis techniques. Many previous studies haveshown that low variability and high rate is associated with increased levels of cognitive workload andeffort. The weak correlation between heart rate and variability (-0.4) suggests that the two measuresmay reflect different aspects of workload and physiological activity (Lysaught ct al., 1989).
Example of cardiac responses
Figure 12 shows the variation of mean heart rate and standard deviation of inter-beat interval of a pilotduring part of a VFR flight from Moorabbin to Tasmania. Recordings of each cardiac interbeatinterval began as soon as the pilot strapped into his seat and continued until the memory of therecording device was filled with data. Average heart rate was detemined for each consecutive minuteof the flight. Heait rate variability was defined as the standard deviation of inter-beat intervals duringeach minute epoch. Adverse weather conditions including low cloud, rain anid a low altitude freezinglevel required the pilot to make several important decisions during the flight. The critical periods offlight associated with decision-making and the resultant changes in altitude are labelled in Figure 12and refer to the following description of activities.
I .Take-off.2. Descent from planned cruise altitude to below the low cloud base because of icing conditions.3. Decision to climb to cruise altitude.4. Decision to climb through a developing 'hole' in cloud layer.5. Descent due to cloud tops being too high, and icing conditions inside clouds.
These critical periods are in contrast to the final half of the flight when flying at the planned cruisealtitude in clear weather conditions.
It is evident from Figure 12 that each of these five critical periods of flight were associated withelevated nieait heart rate. Although the inter-beat standard deviation trace shows considerablevariability in the latter stages of the flight, the periods of high average rate are generally alsoassociated with minimum levels of inter-beat variability. Superimposed on the minute-to-minutechanges in these two variables is a gradual reduction in heart rate and increase in variability over theduration of the flight.
14

8
L 6
*4
< 2
0
S120
110 Heart rate1_0 100 -V
Ego- 1 2 3 4 5
0.10T 0.08 V
0,06 20,04
a I V A11Inter-beat stan~dard dieviation 0.0)2 _u)
0 10 20 30 40 50 60 70 80 90 100
Time min.
Figure 12. Aircraft altitude, pilot's avarage heart rate and standard deviation of inter-beat interval during flight. The numbered flight segments are described in the text.
The microstructure of task demands, the second to second cognitive and decision-making processesand hence pilot effort associated with these task components is missing from Figure 12 because of therelatively course time sampling period. Nevertheless, gross changes in task conditions associatedwith take-off and other altitude changes are clearly evident in the heart rate and to a lesser extent in thesinus arrhythmia traces.
A more refined analysis of heart rate variability in which the cardiac event series is described in termsof its power spectral density is capable of distinguishing the blood pressure, respiratory andthermoregulatory components of the cardiac state. Mulder and his colleagues (Aasman et al,, 1987;see also Meshkati, 1988) have found that decreased spectral power in the blood pressure regulatoryband between 0.06 and 0.14 Hz reflects increased levels o0 cognitive effort. The underlyingphysiological mechanism which determines inter-beat interval is a complex function of spontaneoussinoatrial node activity and opposing sympathetic/parasympathetic activity and is partly mediatedthrough aortic blood pressure changes oscillating with a natural frequency of 0.1 Hz (Mulder, 1979).
Spectral power in the interval series in Figure 12 was estimated in the following way. Firstly thecardiac event series was fitted by a cubic spline interpolation and sampled at 200 ms intervals. Thisregularly sampled series was then low pass filtered with a cut-off frequency of 2,5 Hz and the powerbetween 0 and 0.6 Hz estimated by a Fourier Transform with a bandwidth of 0.01 Hz. Figure 13shows the resulting power spectral density during a 200 s period centred around takeoff and a 200 speriod of uneventful level flight. There is a clear suppression of power in the 0.07 to 0,14 bandduring take-off reflecting a reduction in interbeat variability and increased level of cognitive effort.
15

0.20
? 0.15
0.10C1
C)Cruise
0 0.05C-
0.000.0 0.1 0.2 0.3
Frequency Hz
Figure 13. Power spectral density of the cardiac event series.
5. DISCUSSION
The next stage in our research programme is to integrate the measurement of aircrew activity acrossthe domains of eye movements, cardiac responses, activity or task analysis, situation analysis. andverbal protocol analysis, Each one of these measurement domains will have an impact on a notionalindex of aircrew workload. Whether this index is in temis of the empirically derived VACP ratings orin terms of measured values from data derived from an operational environment remains to be seen.The value of the McCraken and Aldrich approach and the other theoretical points of view on taskanalytic and simulation paradigms is in the implementation of workload theory parameters. Validationof these parameters in real world environments is the next critical stage in our HFE technologydevelopment. The single most pressing need, from our point of view, is to be able to represent theunobservable contributory factors to cognitive workload. It appears that some representation of thememory loads, implicated by analysis of an interaction protocol and a production rule grammar ofinterface responses could generate useful indices of cognitive workload,
6. ACKNOWLEDGEMENTS
The authors wish to acknowledge the assistance of Elizabeth Grey. Helen Kieboom, DominicDrumm, DWvid Creed and Caroline Ford in .he preparation of this paper.
7. REFERENCES
Aasman J., Mulder G. and Mulder L. J. M. (1987). Operator effort and the measurement of heart-rate variability. Human Factors, 29, 161-170.
Air Standardisation Coordination Committee. (1987). Draft Air Standard 10/143B, Guidelines for theapplication of human engineering to advanced aircrew systems. Washington DC: ASCC WorkingParty 10.
Aldrich, T.B., Szabo, S.M. and Bierbaum, C.R. (1989). The development and application of modelsto predict operator workload during system design. In G.R. McMillan, D. Beevis, E. Salas, M.H.Strub, R. Sutton and L. van Breda (Eds), Applications of performance models to system design.New York: Plenum.
Barnard, P.J. (1988). Cognitive resources and the learning of human-computer dialogs. In J.M.Carroll (Ed), Interfacing thought. Cambridge, Massachusetts: MIT Press.
16

Beevis, D. (1987). Erperience in the integration of human engineering effort with avionics systemsdevelopment. AGARD Conference Proceedings, AGARD-CP-417. Neuilly sur Seine, France:AGARD.
Beevis, D. (1989) Introduction: task allocation and workload analysis models. In G.R. McMillan, D.Bcevis, 11. Salas, M.H. Strub, R. Sutton and L. van Breda (Eds), Applications of performancemodels to system design. New York: Plenum.
Boff, K.R. and Lincoln, J.E. (1988), Engineering Data Compendium. Wright-Patterson Air ForceBase, Ohio: Harry G. Armstrong Aerospace Medical Research Laboratory.
Card, S.K., Moran, T.P. and Newell, A. (1983). The psychology of human-computer interaction.Hillsdalc: Earlbaum.
Carlow Associates Inc. (1988), Composite tools survey results, HyperText document. AberdeenProving Ground, Maryland: Human Engineering Laboratory.
Christensen, J.M. (1949). A method for the analysis of complex activities arid its application to thejob of the arctic aerial navigator. Mechanical Engineering, 71, 11-16.
Copas, C.V., Triggs. T.J. and Manton. J.C. (1985). Human factors in command-and-controlsystem procurement. Human Factors Report HFR - 15, Melbourne: Monash University lHumanFactors Group.
Cypher. A. (1986). The structure of users' activities. In D. A. Norman and S.W. Draper (Eds), Usercentered systcns design, Hillsdale: Earlbaum.
Department of Defense. (1984). Military Specification - Human Engineering Requirements forMilitary Systems, Equipment and Facilities, MIL-H-468558. Washington, DC: Author.
Foushec, C.H., Lauber, J.K., Baetge, M.M. and Acomb, D.B. (1986). Crew factors in flightoperations: II. The operational significance of exposure to short-haul air transport operations. NASA"Technicad Memorandum 88322. Ames Research Center: National Aeronautics and SpaceAdministration.
Geer, C.W. (1981). Human engineering procedures guide. AFAMRL-TR-81-35. Wright-PattersonAir Force Base, Ohio: Air Force Aerospace Medical Research Laboratory.
Gopher, D. and Donchin, E. (1986). Workload- an examination of the concept. In K. R. Boff, t..Kaufman and J. P. Thomas (Eds), Handbook of perception and hunan perormance, Volume II.Cognitive Processes and Performance (pp 41.1-41.49). New York: Wiley.
Hughes, P. K. (1989). Operator eye movement behaviour and visual workload in aircraft andvehicles. In Proceedings of the 25th Annual Conference of the Ergonomics Society of Australia (pp97-105). Melbourne: Ergonomics Society of Australia.
Kanki, B.G, and Foushee, H.C. (1989). Communication as a process mediator of aircrewpertforance. Aviation, Space, and Environmental Medicine, 60, 402-410.
Kitajima, M. (1989). A formal representation system for the human-computer interaction process.International JoUrnal of Man-Machine Studies, 30, 669-696,
Lysaght, R. J., Hill, S. G., Dick, A. 0,, Plamondon, B. D., Linton, P. M., Wierwille, W. W.,Zaklad, A. L., Bittner, A. C. and Wherry, R. J. (1989). Operator workload: comprehensive reviewand evaluation of operator workload methodologies. Technical Report 851. Alexandria,VA: UnitedStates Army Research Institute for the Behavioral and Social Sciences.
McCracken, J.H. and Aldrich, T.B. (1984). Analysis of selected LHX mission functions:implications for operator workload and system automation goals. Technical Note AS 1479-024-84. Ft
17

Rucker, Alabama: Army Research lnstitutc.
Meister, D. (1986), Human/factors testing and evaluation. New York: Elsevier.
Meshkati N. (1988). 1-1=r rate variability and mental workload assessment. In P. A. Hancock andN. Mcshkati (Eds), Human Mental Workload. Amsterdam: North Holland.
Mulder G. (1979). Sinus arrhythmia and mental workload. In N. Moray (Ed), A1en tal work load. Its/theory and mnea~surement. New York: Plenum.
Norman. D.A. (1988). Cognitive engineering -cognitive science. In Carroll, J.M. (Ed),JInterfacingthought. Cambridge, Massachusetts: MIT Press.
O'Donnell, R. D. and Eggemeler, F. T. (1986). Workload assessment methodology. ]It K. R. lBoff,L. Kaufman and J. P. Thomats (E~ds). I-I andhook qa/perception a~nd human performance, Volume l/,cognitive proresses and pcefriruance (pp 42.1 -42.49). New York: Wiley.
*lopmnillcr , D.A. (198 1). Methods: past approaches, current trends and future requirements. InMoraal, J. and Kraiss, K.-F, (Eds), Alanneds.ystems design; melhods, equipment, and applications.New York: Plenumi.
Reisner, P. (1988). HCI, what is it and what research is needed~ln J.M. Carroll (Ed), Interfacingthought. Catmhridge, Massachusetts: MIT Press,
Sanderson, P., Jamecs, J.M. and Scidler, K.S. (1989). SIIAPA: an interactive software environmentfor protocol analysis, ErJgonomnics, 32, 1271-1302.
S iegel, A. 1. and Wolf, J. J. (1969). Man-machine simulation modeis. New York: Wiley.
Suchnian, L.A. (1987). Plans and situated actions, Cambridge UK: Cambridge University Press.
Wickens, C.D. (1984). The multiple resources model of human performance: implications for displaydesign. In human factors considerations in high performance aircraft, AGARD-CP-17 1. Neuilly surSeine: NATO/AGARD.
Whiteside, J. and Wixon, D. (1988). Improving human-computer interaction - a quest for cognitivescience. In J.M. Carroll (Ed), Interfacing thought. Cambridge. Massachusetts: MITfPress.
Wierwille, W. W. and Conner, S. A. (1983). Evaluation of twenty workload assessment measuresusing a psychotnotor task in a miotion-base aircraft simulation. Human Factors, 25, 1-16.
Wilson, G. F. and O'Donnell, R. D. (1988). Measurement of operator workload with theneuropsychological workload test battery. In P. A. Hancock and N. Meshkati (Eds), Human mentalworkload. Amsterdam: North-Holland.
18

DISTRIBUTION
AUSTRALIA
D2epautment of Defense
Defence Central
Chief Defence ScientistAS, Science Corporate Management ) shared copyFAS Science PolicyDirector, Departmental PublicationsCounsellor, Defenme Science, London (Doc Data sheet only)Counsellor, Defence Science, Washington (Doc Data sheet only)S.A. to Thailand MRD (l)oc Data sheet only)S.A. to the DRC (Kuala Lumpur) (Doc Data sheet only)Scientific Adviser, Defence CentralOIC TRS, Defence Central LibraryDocument Exchange Centre, DSTIC (8 copies)Defence Intelligence OrganisationLibrarian H Block, Victoria Barracks, Melbourne (Doc Data sheet only)Director General - Army Development (NSO) (4 copies)Defence Industry and Materiel Policy, FAS
Aeronautical Roe s¢ •rc Lhairn.rDirectorLibraryChief Aircraft Systems DivisionAuthors: J.G. Manton
P.K. Hughes
Materials Research LaboratoryDirector/Library
Defence Science & Technology Organisation - SalisburyLibrary
wSRMaritime Systems Division (Sydney)
Navy OfficeNavy Scientific AdviserAircraft Maintenance and Flight Trials UnitRAN Tactical School, LibraryDirector of Aircraft Engineering - NavyDirector of Naval Air WarfareDirector of Naval ArchitectureNaval Support Command
Superintendent, Naval Aircraft LogisticsDirectorate of Aviation Projects - NavyDirector of Naval Supply - Aviation & Major ProjectsDirector of Psychology - NavyNAS Nowra
Air Warfare Systems CentreSITU 816 SQN

Armnyoffic.Scientific Adviser - ArmyDirector of Psychology - ArmyEngineering Development Establishment LibraryDirector of Aviation, Army Aviation CentreUS Army Research, Development and Standardisation Group (3 copies)
Air Force OfficeAir Force Scientific AdviserAircraft Research and Development Unit
Scientific Flight GroupLibrary
OC, AHQ Air CommandDirector General Air Warfare Plar s & PolicyDirector Air WarfareDirector of Psychology - Air ForceAHQ (SMAINTSO)HQ Logistics Command (DGELS)RAAF Institute of Aviation Medicine
H-1 ADFDirector General Force Development (Air)
DepammeniofAd ministrative SeryicesBureau of Meteorology, Library
DesamnAent of Transport & CommunicationLibrary
Statutory and State Authorities and IndustryAero-Space Technologies Australia, Systems Division LibrarianAnsett Airlines of Australia, LibraryAustralian Airlines, LibraryQantas Airways LimitedCivil Aviation AuthorityHawker de Havilland Aust Pty Ltd, Victoria, LibraryHawker de Havill.nd Aust Pty Ltd, Bankstown, LibraryBHP, Melbourne Research LaboratoriesBP Australia Ltd, Library
Universities andCollegesLaTrobe
Library
MonashHargrave Library
NewcastleProfessor R. Telfer, Institute of Aviation
NSWLibrary, Australian Defence Force Academy

RMITLibraryMr M.L. Scott, Aerospace Engineering
INDIANational Aeronautical Laboratory, Information Centre
NEW ZEALANDDefence Scientific Establishment, LibraryRNZAFTransport Ministry. Airworthiness Branch, Library
U niversitiesCanterbury
Library
SWEDENAeronautical Research Institute, LibrarySwedish National Defense Research Institute (FOA)
UNITED KINGDOMMinistry of Defence, Research, Materials and CollaborationCAARC, SecretaryDefence Research Agency (Aerospace)
Farnborough, LibraryRAF Institute of Aviation MedicineArmy Personnel Research EstablishmentCommonwealth Air Transport Council SecretariatBritish Library, Document Supply CentreBritish Aerospace
Kingston-upon-Thames, Library
Universities and ColleesCranfield Inst. of Technology
Library
Imperial CollegeAeronautics Library
UNITED STATES OF AMERICANASA Scientific and Technical Information FacilityBoeing Commercial AirplanesUnited Technologies Corporation, LibraryLockheed Missiles and Space CompanyLockheed GeorgiaMcDonnell Aircraft Company, LibraryNondestructive Testing Information Analysis Center
SPARES (10 COPIES)
TOTAL (108 COPIES)

A L 14 9 D E;PA R T rN T O ' D "'EI) N C E P A IE C I LA IC • M O N
DOCUMENT CONTROL DATA UNCLASSIIDPNIVACY MA•KUNO
1. AR•,•IjM-EN Ib &WAWSAM.WNArNMIE 2. -OCUMECDA'I 3. TASKNNUMBER
AR-006-650 ARL.SYS-TM-150 1991 DST 90/022
4. 7TrLE" 6 5 U I CIRCLAOIYICA71ON 6. NO PArMIM
AIRCREW TASKS AND MACE AA ol"M11"- CtS,•1CA^no.
COGNITIVE COMPLEXITY I N CLON LE SI, R.r [!. CONK 10 20RrS'.•ilTYCJ (N. UNCIALS'IFS) [13 I
IDA'1AME rT TTYr AIIwACT 36
ft AI-TI 10A1O14 P. IUWNANADLINGIOCUWMNO INUCIMONS
J.G. MANTONP.K. HUGHES Not applicable
10 COIlJ'ORAIt AT~ n loll A.%lD A,•lTIO ii I I. OmI.CE/IKv ilON 1-SI 10N'IIIFO.
AERONAUTICAL RESEARCH LABORATORY sPO.soR -
506 LORIMER STREET SECUvRIT
FISHERMENS BEND VIC 3207 DOWNGRADING
AARHOVAL- . CSYL)
12. ••CONI)AIY IIST.IIIIL'1OS tOy tilS LocUMIEN"n
Approved for public release
OVE16,AS ENQlHU lIt: OF SI ELM STA S I)D UMITA1IOSS SI IOUU) M1e MIbI•RED -1711tROUGI I lD'lTC. ADMININWI1VATtI. SERIVICCS U•RACII.
I:PANRT'lEr OF DEFE:NCE. AV7AC l' PARR WEST OFFICES. ACT 5t401
I I.. 1111S l"TOUMl;NII MAY LIEI AS'OI!Na.[ D IN CATA1JJCUIES ANTI AWARENEWSI SERVICES AVAILRAIBU 1 ....
No limitations
13bI CITATI<.'OR~n 1101f-.IlIJRJ'OSIS II:.. CASORI
AK.OIP.CEMSEIl MAY 111] UNLRES-DTICIEI) OR AS FOR 13.
14 DECRIMOILS 15. DI5cATsU1O•.Er
H luman factors enginecring Eye movcmcnts CATEGoRES
Aircrcw performance CockpiL;Flight crews 2302Task analysis
II6 ALLSTIRAC,ý
There is an increasing demandfor Human Factors Engineering of aircrew tasks during the design anddevelopment of fuiure aircraft cockpits and aircrew workstations. The extensive data-base of experimentalresearch literature on human performance is of marginal value in aiding the design process. This paperoutlines several techniques associated with the analysis and description of aircrew activities for use inprospective studies of aircrew task design. The techniques of protocol analysis, eye-movement monitoringand task analysis, amwngsl others, are reviewed. The underlying issue of cognitive complexity in themanagement of aircrew interfaces is addressed.

UNCLASSIFID
PM4ACY MAMMOO
7111 It ~ir kltlIII ;%I110 IECOU) WOMIlON WIICII 11% 14YUIHED UJY~ltE E~rAIIUIMETPOU'rF flOWWNUSE ftfWIIICII WILL NM'
IAIW11LA(4 R0SB
II IM1IfiIIV
AERONAUTICAL RESEARCH LABORATORY, MELBOURNE
Aircratt Syswross Technical 13.73 ol", 204IlNIL~nuranduIm 5
'17 LIIAI%.LNSI LMl;\-r riuRF Is
1I3 IEIIA.II~tI~lI SHQ'k~