department of coastal sciences, the university of southern mississippi, department of physiological...
TRANSCRIPT

Department of Coastal Sciences, The University of Southern Mississippi, Department of Physiological Sciences , University of Florida
R82945801
IMPACTS OF CHRONIC AND CYCLIC HYPOXIA ON GENE EXPRESSION AND REPRODUCTION IN GRASS SHRIMP, PALAEMONETES PUGIO
Marius Brouwer; Nancy Brown-Peterson; Thea
Brouwer; Steve Manning; Tiandao Li; Nancy Denslow
Aquatic Research Consortium (ARC)Aquatic Research Consortium (ARC)

Objectives Grass Shrimp Hypoxia Objectives Grass Shrimp Hypoxia ProjectProject
Clone hypoxia (chronic and intermittent)-Clone hypoxia (chronic and intermittent)-responsive genes using subtractive responsive genes using subtractive hybridization and use clones to construct hybridization and use clones to construct macroarraysmacroarrays
Use the gene arrays to identify hypoxia-Use the gene arrays to identify hypoxia-responsive genes in grass shrimp in controlled responsive genes in grass shrimp in controlled laboratory experimentslaboratory experiments
Identify hypoxia-responsive reproductive Identify hypoxia-responsive reproductive parameters in laboratory experiments – needed parameters in laboratory experiments – needed to scale up to the population levelto scale up to the population level
Evaluate laboratory-derived parameters in Evaluate laboratory-derived parameters in field-collected grass shrimpfield-collected grass shrimp

Composition Gene Array. Will be Expanded with Cyclic DO
Responsive Genes
mitochondrial rRNA
Protein Synthesis-Folding
Protein degradation
Lipid metabolism/Vitellogenin
ATP synthesis-Electron transport
Oxygen transport/sensing
Carbohydrate metabolism
Contraction-Cytoskeleton
Heme-Fe metabolism
Antioxidant defense
Coagulation/Immune Function
Miscellaneous **
*
*
*

2 3 4 5 6 7 8 9 10
B
C
D
E
F
G
H
I
J
K
L
Hif Hcy Hcy Hcy Hcy
pepck
actin
Hsp70c 16kDa Hsp70PPI Hsp70 L13 L5
S6 L31 L27 S2 L21 L3 EF2 L6 S20
S14 CathL Apep CathC Cprot Crus Apep
ACoA ACoA Vtg Alip Chor Vtg
CcOx cytb Asyn CcOx Asyn CcOx
Amyl
Perl gbp Chit SugT
tub 16SrRNA
trop haembp
fer cSOD
Sp 2 Sp 3 Spike 3
hist
cuti odc
odc
mt1
Hybridized with RNA from 1.5 ppm DO 4 d grass shrimp
Cell myosin
mSOD
Macroarray Membrane LayoutMacroarray Membrane Layout

Gene Expression Studies
• Chronic hypoxia - laboratory
• Cyclic Hypoxia - laboratory
• Cyclic hypoxia - field studies

D a y 3 1 . 5 p p m - F S 0 1 9
- 6
- 4
- 2
0
2
4
6
D a y 7 1 . 5 p p m - F S 0 1 9
- 6
- 4
- 2
0
2
4
6
D a y 1 4 1 . 5 p p m - F S 0 1 9
- 6
- 4
- 2
0
2
4
6
Lo
g(b
as
e2)
Hyp
ox
ic/N
orm
ox
icL
og
(ba
se2
) H
ypo
xic
/No
rmo
xic
Lo
g(b
as
e2)
Hyp
ox
ic/N
orm
ox
ic

Changes in Gene Expression in Grass Shrimp Maintained in 1.5 ppm DO for 3 Days Relative to Same Day Normoxic Controls
0.1
1
10
100
rpro
t S
20
AT
PS
ynth
ase
d
AT
PS
ynth
ase
f
HE
MO
CY
AN
IN
hem
ocy
anin
hem
ocy
anin
4
tro
po
nin
C
ferr
itin
Fo
ld C
han
ge
(No
rmo
xic/
Hyp
oxi
c)
Changes in Gene Expression in Grass Shrimp Maintained in Cyclic DO for 3 Days Relative to Normoxic Controls
0.01
0.1
1
10
100
1000
HSP 70 mMnSOD
Fo
ld C
ha
ng
e (
Hy
po
xic
/No
rmo
xic
)
ChronicHypoxiaDay 3
Cyclic HypoxiaDay 3

ChronicHypoxiaDay 7
CyclicHypoxiaDay 7
Changes in Gene Expression in Grass Shrimp in Response to 7 Days Hypoxia (1.5 ppm DO) Relative to Normoxic Controls
0
2
4
6
8
16S rRNA Ccox I Heme BP ferritin
Fold
Cha
nge
(Hyp
oxic
/Nor
mox
ic)
Changes in Gene Expression in Grass Shrimp Maintained in Cyclic DO for 7 Days Relative to Normoxic Controls
0.01
0.1
1
10
rprot S2 rprot S14 CrustapainAcylCoA DH sterolreductase
ATP Synthased
PEPcarboxykinase
Fo
ld C
ha
ng
e (
Hy
po
xic
/No
rmo
xic
)

AcylCoA dehydrogenase
PEP Carboxykinase
TCA CYCLE
Phosphoenol Pyruvate Glucose Cyclic DO
Gluconeogenesis
fatty acid oxidation
Cyclic DO
GTP
GDP + CO2

CyclicHypoxiaDay 14
Chronic HypoxiaDay 14
Changes in Gene Expression In Grass Shrimp Maintained in 1.5 ppm DO for 14 Days Relative to Normoxic Controls
0.001
0.01
0.1
1
10
16SrRNA
rprot S6 fert env Ccox III cytochrb
Ccox 1 PmAV ferritin
Fo
ld C
ha
ng
e (
Hy
po
xii
c/N
orm
ox
ic)
Changes in Gene Expression in Grass Shrimp Kept in Cyclic DO for 14 Days Relative to Normoxic Controls
0
20
40
60
80
100
Vitellogenin-1 apolipoprotein A-I Cuticle protein
Fo
ld C
ha
ng
e (
Hy
po
xic
/No
rmo
xic
)

Conclusions
Chronic hypoxia induces time and dose-dependent changes in gene expression in grass shrimp
Intermittent diurnal hypoxia induces changes in gene expression that are distinct from the chronic hypoxia signal

Conclusion - Continued Mitochondrial genome-encoded 16S
rRNA, cytochrome b and cytochrome c oxidase subunits I and III
Nuclear-encoded mitochondrial proteins (ATP synthase subunits) and
Oxygen transport proteins (Hemocyanin subunits) appear to be robust molecular indicators of chronic hypoxia (1.5 ppm DO) exposure

Conclusion- continued
Mitochondrial MnSOD is a potential indicator of short-term cyclic DO
AcylCoA dehydrogenase and PEP carboxykinase may be useful as indicators of moderate length cyclic DO exposure

Gene expression profiles of grass shrimp form normoxic and hypoxic
field sites

WeeksBayMobile BayMobile Bay
EastEast BayBay
GarconPoint
EPA-EPA-GEDGED
EscambiaEscambiaBayBay
Mobile Bay Sampling SitesMobile Bay Sampling SitesSampled 2004, 2005Sampled 2004, 2005
Pensacola Bay Sampling SitesPensacola Bay Sampling SitesSampled 2002, 2003, 2004, 2005Sampled 2002, 2003, 2004, 2005

Marsh Creek Cyclic Hypoxic Site - August 2004
0.01
0.1
1
10
16S
rR
NA
Cat
hep
sin
L
tryp
sin
Cru
stap
ain
cyto
chro
me
b
AT
P S
ynth
d
Cco
x III
Cco
x I
hae
mo
cyan
in I
HE
MO
CY
AN
IN
hem
ocy
anin
hem
ocy
anin
4
per
luci
n
PE
Pca
rbo
xyki
nas
e
gly
cog
enin
hem
e B
P
ferr
itin
Gln
rep
eat
pro
teinF
old
Ch
ang
e (M
arsh
Cre
ek/C
on
tro
ls)
Normalized to alpha tubulin
GP1 Normoxic Site - August 2004
1
10
Cysteine proteinase trypsin Vitellogenin-2
Fo
ld C
ha
ng
e (
GP
1/C
on
tro
ls) Normalized to alpha tubulin
0
2
4
6
8
10
12
14
16
18
7/31/20041300
8/1/20040215
8/1/20041515
8/2/20040415
8/2/20041715
8/3/20040615
8/3/20041915
8/4/20040815
8/4/20042115
8/5/20041015
8/5/20042315
Date and Time
Diss
olve
d Ox
ygen
(ppm
) and
Sa
linity
(ppt
)
DO mg/L
Salinity
0
5
10
15
20
25
4-Aug 5-Aug 5-Aug 6-Aug 6-Aug 7-Aug 7-Aug 8-Aug 9-Aug 9-Aug10-Aug10-Aug11-Aug
Date and Time
Disso
lved O
xyge
n (mg
/L) an
d Sa
linity
(ppt)
DO Conc mg/L
Salinity ppt
Pensacola Bay, August 2004Pensacola Bay, August 2004
Water QualityWater Quality Gene Expression Relative to Normoxic ControlsGene Expression Relative to Normoxic Controls

Gene Expression Relative to Normoxic ControlsGene Expression Relative to Normoxic Controls
Similar across years and Similar across years and sites for cyclic hypoxia!sites for cyclic hypoxia!
Marsh Pond Cyclic Hypoxic Site--September 2002
0.01
0.1
1
10
100
Vit
ello
ge
nin
-1
AT
P S
yn
th d
AT
P S
yn
th f
HIF
HE
MO
CY
AN
IN
he
mo
cy
an
in
he
mo
cy
an
in 4
PE
Pc
arb
ox
yk
ina
se
ch
itin
as
e
su
ga
r tr
an
sp
ort
er
tro
po
nin
I
OD
C a
nti
zy
me
Gln
re
pe
at
pro
tein
Fo
ld C
ha
ng
e (
Hy
po
xic
/No
rmo
xic
)
Normalized to alpha tubulin
Marsh Creek Cyclic Hypoxic Site - August 2004
0.01
0.1
1
10
16S
rRN
A
Cat
heps
in L
tryp
sin
Cru
stap
ain
cyto
chro
me
b
ATP
Syn
th d
Cco
x III
Cco
x I
haem
ocya
nin
I
HEM
OC
YAN
IN
hem
ocya
nin
hem
ocya
nin
4
perlu
cin
PEP
carb
oxyk
inas
e
glyc
ogen
in
hem
e B
P
ferr
itin
Gln
repe
atpr
otei
nFold
Cha
nge
(Mar
sh C
reek
/Con
trol
s) Normalized to alpha tubulin
Weeks Creek Cyclic Hypoxic Site - September 2004
0.01
0.1
1
10
HS
P 7
0C
HS
P 7
0
rpro
t L
31
tryp
sin
AcC
oA
BP
Vtg
2
AT
P S
ynt
d
HIF
HE
MO
CY
AN
IN
hem
ocy
anin
hem
ocy
anin
4
amyl
ase
I
amyl
ase
pre
pro
pro
tein
PE
Pca
rbo
xyki
nas
esu
gar
tran
spo
rter
Fo
ld C
han
ge
(Wee
ks C
reek
/Co
ntr
ols
) Normalized to alpha tubulin
Marsh Pond Cyclic Hypoxic Site--September 2002
0.01
0.1
1
10
100
Vit
ello
ge
nin
-1
AT
P S
yn
th d
AT
P S
yn
th f
HIF
HE
MO
CY
AN
IN
he
mo
cy
an
in
he
mo
cy
an
in 4
PE
Pc
arb
ox
yk
ina
se
ch
itin
as
e
su
ga
r tr
an
sp
ort
er
tro
po
nin
I
OD
C a
nti
zy
me
Gln
re
pe
at
pro
tein
Fo
ld C
ha
ng
e (
Hy
po
xic
/No
rmo
xic
)
Normalized to alpha tubulin

Seasonal Change/Recovery in Gene ExpressionSeasonal Change/Recovery in Gene Expression
Marsh Pond September 2002
0.01
0.1
1
10
100
Vit
ello
ge
nin
-1
AT
P S
yn
th d
AT
P S
yn
th f
HIF
HE
MO
CY
AN
IN
he
mo
cy
an
in
he
mo
cy
an
in 4
PE
Pc
arb
ox
yk
ina
se
ch
itin
as
e
su
ga
r tr
an
sp
ort
er
tro
po
nin
I
OD
C a
nti
zy
me
Gln
re
pe
at
pro
tein
Fo
ld C
ha
ng
e (
Hy
po
xic
/No
rmo
xic
)
Normalized to alpha tubulin
Marsh Pond November 2002
0.01
0.1
1
10
Cy
s p
rote
ase
try
psin
Vit
ell
og
en
in-2
Cc
ox 1
hem
ocyan
in
PE
P
carb
oxykin
as
e
cellu
lar
myo
sin
acti
n
hem
e B
P
Fo
ld C
han
ge (
Mars
h P
on
d/C
on
tro
ls)
Normalized to alpha tubulin
p=
0.0
9
Weeks Creek - September 2004
0.01
0.1
1
10
HS
P 7
0C
HS
P 7
0
rpro
t L
31
try
ps
in
Ac
Co
A B
P
Vtg
2
AT
P S
yn
t d
HIF
HE
MO
CY
AN
IN
he
mo
cy
an
in
he
mo
cy
an
in
4
am
yla
se
I
am
yla
se
pre
pro
pro
tein
PE
Pc
arb
ox
yk
ina
se
su
ga
rtr
an
sp
ort
erFo
ld C
han
ge
(Wee
ks C
reek
/Co
ntr
ols
)
Normalized to alpha tubulin
Weeks Creek - November 2004
0.01
0.1
1
10
16S
rR
NA
EF
-2
Cys
pro
teas
e
tryp
sin
fert
en
v
Vtg
2
cyto
ch
rom
eb Cco
x II
I
AT
P S
ynt f
Cco
x I
HIF
hae
mo
cyan
inI
amyl
ase
I
glu
can
BP
glu
cosi
da
se
hem
e B
P
ferr
itin
OD
Can
tizym
eG
ln r
epea
tp
rote
in
Fo
ld C
ha
ng
e (
We
ek
s C
ree
k/C
on
tro
ls)
Normalized to tubulin

Summary Field Gene Expression
Grass shrimp exposed to cyclic hypoxia in the field show distinct changes in gene expression profiles, not observed in shrimp from normoxic control sites
1. Downregulation of mitochondrial gene transcription similar to changes induced by chronic 1.5 ppm DO exposures in the lab
2. Downregulation of hemocyanin transcription in late summer, not observed in lab exposures, but indicative of anaerobic metabolism
3. Return to aerobic, oxidative metabolism in late fall

New Directions Construction of 700 gene array (with cyclic-DO sensitive genes)
has been completed (Tiandoa Li)
Cyclic DO library contains many genes that are involved in sulfur redox metabolism and (possibly) in controlling cysteine and glutathione levels – a classic response to oxidative stress
Proteomics studies on mitochondrial protein expression (protein fractionation in 2 dimensions and MS) have been initiated

Reproductive Studies: Ecologically
Important Parameters
• chronic hypoxia • cyclic DO• Field

Female Oxygen Exposure
HH NN HN
Re
lati
ve
Fe
cu
nd
ity
0
200
400
600
800
1000
1200
A
BB
2-3 ppm DO
1.5 ppm DO
P = 0.003
P = 0.027
P = 0.010
HH NN HN0
200
400
600
800
1000
1200
A
B BR
elat
ive
Fec
un
dit
y
Hypoxia Increases Relative Fecundity

Hypoxia (2.5 ppm) Increases Time Interval Between Brood Production
0
5
10
15
20
25
30
Brood 1 Brood 2
Day
s to
Eg
g P
rod
uct
ion
Hypoxia
Normoxia
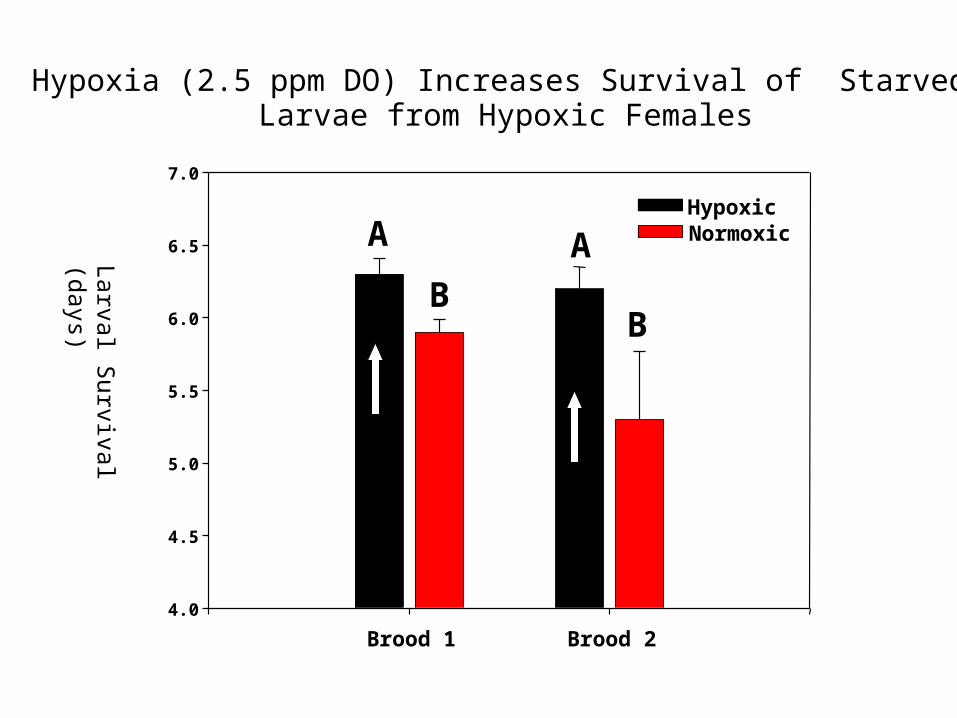
Hypoxia (2.5 ppm DO) Increases Survival of Starved Larvae from Hypoxic Females
Brood 1 Brood 2
4.0
4.5
5.0
5.5
6.0
6.5
7.0
Hypoxic Normoxic A A
BB
Larv
al S
urvi
val (
days
)

Effects of Cyclic Hypoxia (1.5 8 ppm DO) on Grass Effects of Cyclic Hypoxia (1.5 8 ppm DO) on Grass Shrimp Reproduction: Laboratory ExperimentsShrimp Reproduction: Laboratory Experiments
HH HN NN
Day
s to
Eg
g P
rod
uct
ion
0
10
20
30
HH HN NN0
5
10
15
20
25
Treatment
HH HN NN0
5
10
15
20
First Brood
Second Brood
Third Brood
A
B B
A
B
C
D
D
E
F
E,F
Interbrood Interval in Cyclic Hypoxic
HH HN NN
Rel
ati
ve
Fec
un
dit
y (#
eg
gs/
g)
0
100
200
300
400
500
600
Treatment
HH HN NN0
100
200
300
400
500
600
First Brood
Second Brood
A
A,B
B
Relative Fecundity in Cyclic Hypoxia

Population Growth RatesChronic Hypoxia
Brood Number
Brood 1 Brood 2
La
mb
da
1.0
1.2
1.4
1.6
1.8Hypoxic Normoxic
Population Growth RatesCyclic Hypoxia
Brood Number
Brood 1 Brood 2
La
mb
da
1.0
1.2
1.4
1.6
1.8HH HN NN
Cyclic DO decreasesestimated populationgrowth rate
(in an aquarium)

Conclusions
Chronic hypoxia stimulates production of more and “healthier” eggs and increases time interval between broods
Intermittent diurnal hypoxia decreases fecundity and increases time interval between broods
Hypoxia (chronic and intermittent) may have population-level impacts on grass shrimp

StationStation % Egged% Egged Ratio M:FRatio M:F
WCWC 18.2%18.2% 1:11:1
WBMWBM 44.9%44.9% 1.3:11.3:1
Weeks Bay, July 2004Weeks Bay, July 2004
StationStation % Egged% Egged Ratio M:FRatio M:F
GP1GP1 75.8%75.8% 1.1:11.1:1
MCMC 45.8%45.8% 1.5:11.5:1
MPMP 29.5%29.5% 1.25:11.25:1
Pensacola Bay, August 2004Pensacola Bay, August 2004
Reproduction of Grass Shrimp in the FieldReproduction of Grass Shrimp in the Field
SiteWC WBM
Re
lati
ve
Fe
cu
nd
ity
(#
eg
gs
/g)
0
200
400
600
800
1000
SiteGP1 MP MC
Re
lati
ve F
ec
un
dit
y (
# e
gg
s/g
)
0
200
400
600
800
1000
1200
1400
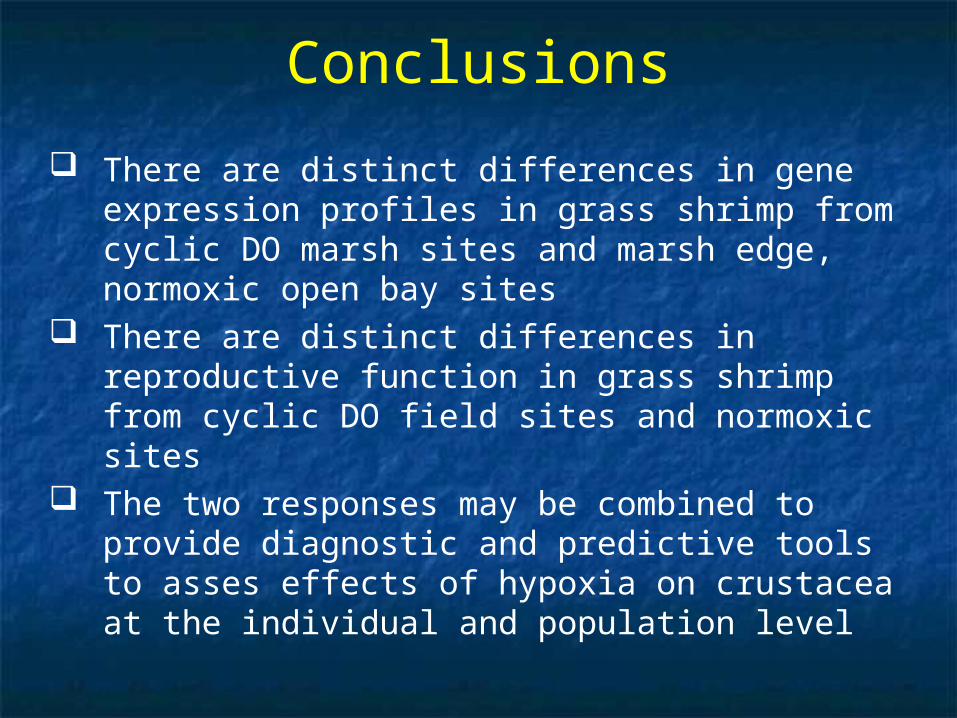
Conclusions
There are distinct differences in gene expression profiles in grass shrimp from cyclic DO marsh sites and marsh edge, normoxic open bay sites
There are distinct differences in reproductive function in grass shrimp from cyclic DO field sites and normoxic sites
The two responses may be combined to provide diagnostic and predictive tools to asses effects of hypoxia on crustacea at the individual and population level

Thanks to students and staff
and NOAA and EPA

Normalized to Median Intensity - log base 2 transformed
y = 0.9554x - 0.399
R2 = 0.9326
-4.0
-3.0
-2.0
-1.0
0.0
1.0
2.0
3.0
4.0
5.0
6.0
-3.0 -2.0 -1.0 0.0 1.0 2.0 3.0 4.0 5.0 6.0 7.0
Membrane 76
Mem
bran
e 78
Variability Due to Experimental Error is Small

Comparison Mean Normalized Gene Intensities of Normoxic Control Shrimp from Two Experiments
y = 0.8866x - 0.1122
R2 = 0.7971
-10.0
-8.0
-6.0
-4.0
-2.0
0.0
2.0
4.0
6.0
-10.0 -8.0 -6.0 -4.0 -2.0 0.0 2.0 4.0 6.0
Mean FS019 (n=33)
Me
an
FS
00
1 (
n=
21
)
Variability of Gene Expression Levels Among Shrimp is Modest
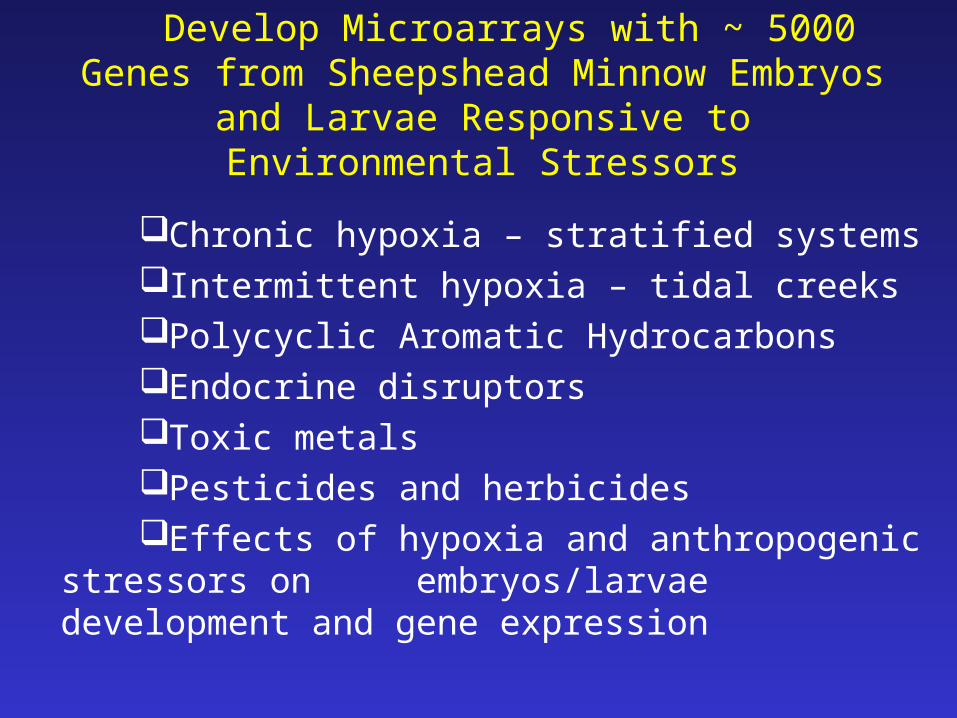
Develop Microarrays with ~ 5000 Genes from Sheepshead Minnow Embryos and
Larvae Responsive to Environmental Stressors
Chronic hypoxia – stratified systemsIntermittent hypoxia – tidal creeksPolycyclic Aromatic HydrocarbonsEndocrine disruptors Toxic metalsPesticides and herbicidesEffects of hypoxia and anthropogenic stressors on
embryos/larvae development and gene expression