department for environment, food and rural affairs annual
TRANSCRIPT

HC 30
Department for Environment, Food and
Rural Affairs
Annual Report and Accounts 2014–15


HC 30
Department for Environment, Food and
Rural Affairs
Annual Report and Accounts
2014–15 (For the year ended 31 March 2015)
Accounts presented to the House of Commons pursuant to Section 6(4) of the Government Resources and Accounts Act 2000
Annual Report presented to the House of Commons by Command of Her Majesty
Ordered by the House of Commons to be printed 13 July 2015
This is part of a series of departmental publications which, along with the Main Estimates 2015–16 and the document Public Expenditure: Statistical Analyses 2015, present the Government’s Outturn for 2014–15 and planned expenditure for 2015–16.
© Crown copyright 2015
This publication is licensed under the terms of the Open Government Licence v3.0 except where otherwise stated. To view this licence, visit nationalarchives.gov.uk/doc/open-government-licence/version/3 or write to the Information Policy Team, The National Archives, Kew, London TW9 4DU, or email: [email protected].
Where we have identified any third party copyright information you will need to obtain permission from the copyright holders concerned.
This publication is available at www.gov.uk/government/publications
Any enquiries regarding this publication should be sent to us at [email protected]
Print ISBN 9781474122092 Web ISBN 9781474122108
ID P002737235 07/15 50635 19585
Printed on paper containing 75% recycled fibre content minimum
Printed in the UK by the Williams Lea Group on behalf of the Controller of Her Majesty’s Stationery Office

Department for Environment, Food and Rural Affairs Annual Report and Accounts 2014–15 Foreword by the Secretary of State
i
Foreword by the Secretary of State for Environment, Food and Rural Affairs
Elizabeth Truss
The core purposes of Defra are to support economic growth by promoting a thriving and internationally successful food and farming sector, to improve the natural environment and to provide security to homes and businesses against the threats of flooding and animal and plant disease.
The Department made significant progress during 2014–15, opening more than 100 new food and drink export markets during the year. It also approved local partners’ proposals for the first 17 Food Enterprise Zones, which will bring growth to local food economies. Defra staff carried out a programme of streamlining and improving environmental guidance and regulations, bringing direct improvements
to the competitiveness of business, both in food and farming and in the wider economy.
The Department repaired and improved flood defences following the damage caused in the winter of 2013–14. It also made significant advances in the government’s long-term strategy to rid the country of bovine TB; essential for safeguarding the future of our beef and dairy industries. Defra responded promptly and effectively to avian influenza outbreaks, while further upgrading its ability to do so in the future.
And last autumn, the Department launched the first national strategy to support bees and the other pollinating insects which play a vital role in food production and the health and beauty of the British countryside.
You will read in this report how the Department has focused on these priorities while at the same time making great strides in the way it works towards becoming one of the most flexible, forward-thinking and responsive in Whitehall, constantly improving the value for money it provides for the taxpayer.
I am greatly honoured to be returning to Defra as part of the new government and to have the chance to take the Department’s priorities forward.
This government has an ambitious agenda for improving Britain and I am proud that Defra is at the heart of it.

Department for Environment, Food and Rural Affairs Annual Report and Accounts 2014–15 Foreword by the Permanent Secretary
ii
Foreword by the Permanent Secretary of the Department for Environment, Food and Rural Affairs
Bronwyn Hill
In the final year of the five year Parliament, Defra delivered its priorities for a healthy environment which underpins a healthy economy. I am immensely proud of our achievements, reflecting work with our wider network and with organisations and individuals up and down the country.
We have supported and promoted food and farming; taken swift action to protect the country from animal and plant health disease; repaired flood defences and produced a long term strategy to protect more homes and businesses from flooding in future. Reflecting the huge significance of the country’s food and drink exports to our economy, we have opened up new markets for UK food and drink
and appointed our first Agriculture and Food Counsellor to China.
Negotiation of reforms to the Common Agricultural Policy (CAP) has been a significant challenge. We made detailed implementing decisions and introduced new IT systems to deliver the schemes in England, working across Defra to integrate policy and operations more effectively. We took advantage of the extension of the EU deadline for applications to 15 June, and have invested significant resources in the RPA to help farmers meet the deadline. Making rural payments and further simplification of the CAP will continue to be top priorities for the Department in 2015–16 and beyond.
We made significant progress on other major projects, including flood defences, the Thames Tideway Tunnel and on work with the insurance industry to implement the new flood insurance scheme set out in the Water Act 2014. We made good progress on regulatory reform. Over the last three years, Defra has delivered over 650 reforms; reduced the demand for data by about 20 percent and simplified and reduced guidance by around 80 percent.
We have delivered government priorities with fewer resources, made significant efficiencies and secured value for money. We have developed capability for the future by strengthening our network leadership and developing a ‘one business’ approach that is more customer focused, flexible and responsive. We will need to accelerate the move to a new operating model in the next five years; including using the opportunities that the digital world offers across our services.
I would like to pay tribute to all our people, in the Department and across our wider Network, for their hard work and dedication to public service. I would also like to take this opportunity to thank our four Non–Executive Directors who have worked closely with Defra through the last Parliament. I shall be leaving Defra this summer after four years that have been both challenging and enjoyable. Arrangements are well advanced to appoint my successor and for a smooth transition.

Department for Environment, Food and Rural Affairs Annual Report and Accounts 2014–15 Contents
1
Contents
Foreword by the Secretary of State for Environment, Food and Rural Affairs i�Foreword by the Permanent Secretary of the Department for Environment, Food and Rural Affairs ii�Chapter 1 – Strategic Report: Our Organisation 3�
Our Priorities 3�Our Operating Structure 3�Our Delivery Partners 6�Defra’s Network Bodies 2014–15 8�Civil Service Reform 9�Risk Management 10�
Chapter 2 – Strategic Report: Our Performance 11�Government Major Projects Portfolio 14�Input and Impact Indicators 15�Performance on Sustainable Development 15�Adapting to Climate Change 17�Rural Proofing 17�Better Regulation 18�Open Data 19�
Chapter 3 – Strategic Report: Financial Overview 20�Financial Summary 20�Consolidated Statement of Financial Position 22�Other Information 22�
Chapter 4 – Directors Report: Staff and Remuneration 25�Our Ministers and Senior Staff 25�People and Culture 25�Remuneration Report 30�
Chapter 5 – Directors’ Report: Corporate Information 38�Chapter 6 – Non–Executive Directors’ Report 43�Chapter 7 – The Accounts 46�
Statement of Accounting Officer's Responsibilities 46�Governance Statement 47�The Certificate of the Comptroller and Auditor General to the House of Commons 54�The Report of the Comptroller and Auditor General to the House of Commons 56�Statement of Parliamentary Supply 59�Consolidated Statement of Comprehensive Net Expenditure 68�Consolidated Statement of Financial Position 69�Consolidated Statement of Cash Flows 70�Consolidated Statement of Changes in Taxpayers’ Equity 71�
Chapter 8 – Notes to the Departmental Accounts 77�

Department for Environment, Food and Rural Affairs Annual Report and Accounts 2014–15 Contents
2
1� Statement of Accounting Policies 77�2� Statement of Operating Costs by Operating Segment 84�3� Staff Numbers and Related Costs 85�4� Other Administration Costs 88�5� Programme Costs 89�6� Income 90�7� Property, Plant and Equipment (PPE) 92�8� Intangible Assets 97�9� Impairments 98�10�Financial Commitments 98�11�Financial Instruments 101�12�Investments 103�13�Cash and Cash Equivalents 103�14�Trade Receivables, Financial and Other Assets 104�15�Trade Payables and Other Current Liabilities 105�16�Provisions for Liabilities and Charges 106�17�Pension Liabilities 108�18�Contingent Liabilities and Contingent Assets 119�19�Losses and Special Payments 121�20�Related Party Transactions 122�21�Events After the Reporting Period 122�22�Prior Period Adjustments 122�23�Entities within the Departmental Boundary 123�24�Entities outside the Departmental Boundary 124�
Annex 1: Input and Impact Indicators 126�Annex 2: Core Tables 2014–15 133�Annex 3: Commentary on Sustainable Performance 147�

Department for Environment, Food and Rural Affairs Annual Report and Accounts 2014–15 Chapter 1 – Strategic Report: Our Organisation
3
Chapter 1 – Strategic Report: Our Organisation
Our Priorities Defra’s Business Plan for 2013–15 was published in June 2013. It set out the principal actions that Defra planned to implement the Government’s priorities. This Annual Report and Accounts (ARA) reports performance against those actions. Defra’s priorities were as follows:
• leading the world in food and farming;
• protecting our country from floods and animal and plant diseases;
• improving the environment; and
• championing the countryside and improving rural service.
The Government’s top priority of economic growth underpins activities undertaken to deliver these priorities.
Our Operating Structure The governance structure of the Department is illustrated below.

Department for Environment, Food and Rural Affairs Annual Report and Accounts 2014–15 Chapter 1 – Strategic Report: Our Organisation
4
The Defra Board
Provides collective strategic and corporate leadership to the Department with Board meetings held quarterly.
Our Board Membership
The Ministerial Team
From July 2014 Until July 2014 Rt Hon Elizabeth Truss MP Secretary of State
Rt Hon Owen Paterson MP Secretary of State
George Eustice MP Parliamentary Under-Secretary of State for Farming, Food and the Marine Environment
George Eustice MP Parliamentary Under-Secretary of State for Farming, Food and the Marine Environment
Lord de Mauley Parliamentary Under-Secretary of State for Natural Environment and Science
Lord de Mauley Parliamentary Under-Secretary of State for Natural Environment and Science
Dan Rogerson MP Parliamentary Under-Secretary of State for Water, Forestry, Rural Affairs and Resource Management
Dan Rogerson MP Parliamentary Under-Secretary of State for Water, Forestry, Rural Affairs and Resource Management
Following the May 2015 election, Dan Rogerson and Lord de Mauley left the Department. Rory Stewart became Parliamentary Under-Secretary of State for Environment and Rural Affairs and Lord Gardiner became Defra spokesman in the House of Lords. Also, George Eustice became Minister of State for Farming, Food and the Marine Environment.
Board Executives
Bronwyn Hill Permanent Secretary, has responsibility for the overall organisation, management and staffing of the Department.
Betsy Bassis Director General (DG) Chief Operating Officer (from 22 September 2014). The role has also been filled in 2014–15 by • Dave Webster (Interim: 21 July – 21 September 2014) • During the period 1 – 20 July the DGCOO role was covered by the senior executive team • Ian Trenholm (until 30 June 2014)
Nick Joicey DG Strategy, International and Biosecurity
Peter Unwin DG Policy Delivery
Professor Ian Boyd The Chief Scientific Adviser
Alastair Bridges Director, Finance and Performance

Department for Environment, Food and Rural Affairs Annual Report and Accounts 2014–15 Chapter 1 – Strategic Report: Our Organisation
5
Board Non–Executive Directors (NEDs)
Four NEDs bring external experience and expertise to the Department through the Board and its sub-committees as follows:
Iain Ferguson Lead Non–Executive Director Chair of the Nominations Committee
Paul Rew Non–Executive Director Chair of the Audit and Risk Committee
Catherine Doran Non–Executive Director
Sir Tony Hawkhead Non–Executive Director
The Defra Board has two sub-committees.
• The Audit and Risk Committee is a non–executive sub-committee. It supports and advises the Defra Board and the Accounting Officer on issues of risk, control, governance and other related matters. It is chaired by Paul Rew and comprises independent members (including one other Defra Board NED). It meets approximately five times each year.
• The Nominations Committee scrutinises incentives and rewards for executive board members and the senior civil service and succession planning for NEDs, other Defra Board members and other key appointments. It is chaired by the Lead NED, with the Permanent Secretary, the Director of Human Resources and the Head of Talent Management. It meets approximately quarterly.
The Network Executive Committee has high-level oversight of the operational running of the Department and cross-network issues. Since January 2015 the membership is:
• Permanent Secretary; • DG Chief Operating Officer; • DG Strategy, International and Biosecurity; • DG Policy Delivery; • DG Chief Veterinary Officer; • Chief Scientific Adviser; • Director, Finance and Performance; • CEO Rural Payment Agency; • CEO Animal and Plant Health Agency; • CEO Environment Agency; and • CEO Natural England.
Following the extension of the Executive Committee in January 2015 to include the four Chief Executives, we are reviewing the governance structure supporting it. For most of the financial year, the Network Executive Committee was supported by four panels, set out below.
• The Risk Panel focused on strategic risk, risk appetite and risk processes.
• The Finance Panel focused on business plans and scrutiny of business cases.
• The Operations Panel focused on optimisation of business processes and expansion of digital facilities.

Department for Environment, Food and Rural Affairs Annual Report and Accounts 2014–15 Chapter 1 – Strategic Report: Our Organisation
6
• The People Panel focused on workforce planning, people strategy and the framework to develop capability and capacity.
Our Delivery Partners The delivery of Defra’s policies is largely delegated to our Network Bodies, comprising our Executive Agencies, Non–Departmental Public Bodies (NDPBs) and other public bodies, and through working with local government, the voluntary sector and other organisations.
Defra’s Executive Agencies operate within a framework of direct accountability to the Department and to ministers, who remain accountable for their overall performance. They are part of the Department; the Chief Executive Officer (CEO) is appointed as the Accounting Officer for each agency.
All five Executive Agencies have a business plan measurable against key performance indicators and framework agreements. The DG Chief Operating Officer acts as the Corporate Owner in relation to all of the Executive Agencies, providing line management for the Chief Executives (with the exception of the CEO of Rural Payments Agency where, from September 2014, line management responsibility transferred to the Permanent Secretary), holding them to account for performance measured against targets and agency internal processes, and taking a longer term strategic view of the agencies’ interaction with Defra.
The governance and performance management of the Executive Agencies is supported by review of the agencies’ performance which is reported quarterly to the Defra Board. A Defra director with a policy interest in a particular agency’s business takes on the role of corporate customer, ensuring that all policy customer interests are represented effectively, including working closely with the Devolved Administrations. Each agency has a management board, which is chaired by a NED and includes other NEDs and the agency senior team. A Defra official is also a member of the each Executive Agencies’ management board, bringing an understanding of Defra and wider government policy to the agency.
Defra’s main Executive NDPBs have been established through legislation, which specifies each NDPB’s purpose and functions, what powers are invested in it, and how it should be financed. Each has its own independent board, chairman and executive management team, with the CEO designated as the Accounting Officer for that organisation. NDPBs are not under day-to-day ministerial control, but ministers agree funding and key objectives for each NDPB and hold them to account. The larger NDPBs provide quarterly performance reports to the Defra Board.
The delivery network map on the following page shows Defra’s Network Bodies.
Each Executive Agency and NDPB publishes its own ARA. A list of these bodies can be found in Note 23 and further information can be found on their websites.
The Future of Fera
The Secretary of State for Environment, Food and Rural Affairs announced on 1 May 2014 that Defra was launching a procurement exercise to find a joint venture (JV) partner for the Food and Environment Research Agency (Fera).
The decision to seek a JV partner followed an extensive amount of work looking at Fera’s business model, and a range of alternative options. A business case produced in early 2014 indicated that a commercial JV was most likely to be the best solution for Defra to continue to secure sustainable access to the services provided by Fera, in an affordable and value for money way. The JV presented an opportunity for Fera to develop further as a science organisation, offering its services and capabilities to a wider range of customers.
Following a successful competitive procurement exercise, the Secretary of State announced on 11 February 2015 that Capita had been chosen as the JV partner for Fera. Contracts were signed between Defra and Capita on 11 March 2015 and on 31 March 2015 all Fera staff and assets in scope for the new JV transferred in to Fera Science Limited (FSL).
Department for Environment, Food and Rural Affairs Annual Report and Accounts 2014–15 Chapter 1 – Strategic Report: Our Organisation
7
Capita is committing over £10m investment into FSL and has secured a further £4.5m of investment from Newcastle University (Capita’s strategic science partner), with FSL agreeing to invest an equivalent amount, to create a new joint research institute between the University and FSL. Capita paid Defra £20m to acquire 75 percent of the shares of FSL, with Defra retaining the other 25 percent.
FSL will operate in the private sector. The Department’s Chief Scientific Advisor and the DG for Strategy, International and Biosecurity will be NEDs on the Board of the JV. A 10 year long term service agreement has been put in place for the provision of scientific services by FSL to government. Through the provision of services to government under this agreement FSL is obliged to continue to pursue public interest objectives and develop its science capability. A range of key performance indicators have been agreed to ensure the quality of both the service delivery and science capability are maintained. Defra will retain ownership of the Sand Hutton site, with FSL having signed a 10 year lease to use the majority of the site.
Defra has ensured that the skills and knowledge that Fera provided in supporting government will be retained in FSL through the agreements reached between Defra and FSL. Bringing together Fera’s world leading capability with Capita’s commercial expertise and Newcastle University’s academic standing creates an opportunity for the new business going forward.

Dep
artm
ent f
or E
nviro
nmen
t, Fo
od a
nd R
ural
Affa
irs
An
nual
Rep
ort a
nd A
ccou
nts
2014
–15
Cha
pter
1 –
Stra
tegi
c R
epor
t: O
ur O
rgan
isat
ion
8
Def
ra’s
Net
wor
k B
odie
s 20
14–1
5
Cor
e D
epar
tmen
t1
APH
A2
–An
imal
and
Pl
ant H
ealth
A
genc
y
Cef
as–
Cen
trefo
r Env
ironm
ent,
Fish
erie
s an
d A
quac
ultu
reSc
ienc
e O
ther
Ex
ecut
ive
ND
PBs
4
Levy
Boa
rds
Exec
utiv
e A
genc
ies
Non
–Dep
artm
enta
l Pub
lic B
odie
s
RPA
–R
ural
P
aym
ents
Age
ncy
VMD
–Ve
terin
ary
Med
icin
esD
irect
orat
eFera
3–
Food
an
d En
viro
nmen
t R
esea
rch
Agen
cy
Advi
sory
ND
PBs
EA –
Env
ironm
ent
Age
ncy
NE
–N
atur
alEn
glan
d RB
G K
ew –
Roy
al B
otan
ic
Gar
dens
Kew
Cov
ent G
arde
n M
arke
t Aut
horit
y6
NPA
–N
atio
nal
Par
k A
utho
ritie
s5
FC –
Fore
stry
C
omm
issi
on(N
on-m
inis
teria
l D
epar
tmen
t)
WR
AP –
Was
te
and
Res
ourc
es
Actio
n Pr
ogra
mm
e
MM
O –
Mar
ine
Man
agem
ent
Org
anis
atio
n
Ofw
at –
Wat
er S
ervi
ces
Reg
ulat
ion
Auth
ority
(Non
-min
iste
rial
Dep
artm
ent)
Oth
ers
Larg
er o
nes
nam
ed
1. T
he C
ore
Dep
artm
ent a
lso
has
a nu
mbe
r of e
xper
t com
mitt
ees
whi
ch p
rovi
de e
vide
nce
and
info
rmat
ion
to h
elp
info
rm p
olic
y.
2. L
aunc
hed
on 1
Oct
ober
201
4, fo
rmer
ly k
now
n as
the
Ani
mal
Hea
lth a
nd V
eter
inar
y La
bora
torie
s A
genc
y.3.
Fro
m 3
1 M
arch
201
5 Fe
ra c
ease
d to
be
a go
vern
men
t age
ncy.
4.
Oth
er E
xecu
tive
ND
PBs
- Con
sum
er C
ounc
il fo
r Wat
er (C
CW
), Jo
int N
atur
e C
onse
rvat
ion
Com
mitt
ee (J
NC
C),
Nat
iona
l For
est C
ompa
ny (N
FC).
5.
Nat
iona
l Par
k A
utho
ritie
s ar
e au
tono
mou
s bo
dies
, mod
elle
d he
avily
on
loca
l aut
horit
y lin
es. D
efra
is th
e m
ain
fund
er a
nd a
lso
appo
ints
som
e m
embe
rs to
thei
r boa
rds.
6.
A P
ublic
Cor
pora
tion.

Department for Environment, Food and Rural Affairs Annual Report and Accounts 2014–15 Chapter 1 – Strategic Report: Our Organisation
9
Civil Service Reform Civil Service Reform is a key part of the Government’s drive to reform public services. The Reform Plan identifies changes needed across the Civil Service, with key actions. Defra’s plans were set out in its Departmental Improvement Plan (DIP) in March 20141.
Defra’s DIP is committed to developing a 'one business' view of how Defra, its Executive Agencies, NDPBs and other bodies operate together to deliver for our customers and stakeholders. To put customers and stakeholders at the heart of what we do, the vision focuses more clearly on outcomes, with more flexible systems and processes, to inspire and motivate people to do a good job. This approach is being taken forward through a portfolio of workstreams to enable the Defra Network to increasingly operate as ‘one business’, developing more efficient and innovative ways of working.
Key milestones in implementing reform in 2014–15 include the creation of a new Network Corporate Services Directorate. The Directorate, launched on 1 October 2014, aims to deliver corporate services in a new, streamlined way, whilst improving systems and processes and releasing cash by reducing duplication.
Defra also launched a combined Animal and Plant Health Agency on 1 October 2014 to deliver animal and plant health more effectively. This new agency brings together the former Animal Health and Veterinary Laboratory Agency and the inspectorate functions of Fera. It joins up work on plant and animal pests and diseases, and increases our resilience and flexibility to respond to emergencies.
As part of the Government’s digital exemplar initiative, Defra is working with RPA, NE, FC and the Government Digital Service on a new system, the Common Agricultural Policy Delivery (CAPD) System, to make rural payments from December 2015. An update on progress can be found in the Governance Statement in Chapter 7.
As part of the wider public sector reform, Defra conducts triennial reviews on its NDPBs. The purpose of a triennial review is to provide a robust challenge to the continuing need for the NDPB and to check whether its functions and form are appropriate.
Defra completed and published three triennial reviews in 2014–15. The triennial review of MMO, published on 11 March 2015, concluded that the functions of the MMO are necessary and should continue to be delivered by an NDPB, and that the MMO remains the right body to deliver them. The Review made some recommendations which are being addressed. The MMO will publish an action plan and report on progress to ministers in the summer of 2015.
The triennial reviews of the Defra Science Advisory Council (SAC) and the Advisory Committee on Releases to the Environment (ACRE) were published on 26 March 2015. The SAC review concluded that an advisory NPDB is the most appropriate form to deliver SAC’s functions, as it is the only model which can deliver independent scientific advice to support and challenge the Department with the right governance, and level of expertise.
The ACRE review concluded that the Committee is important in underpinning the Government’s policy of ensuring that genetically modified technology is used in a safe and responsible way and therefore it is necessary for its functions to continue. The review concluded that ACRE is effective; delivers a high quality service and, following consideration of alternative models, it remains appropriate for ACRE to remain as an advisory NDPB.
Additionally, the triennial review of the Gangmasters Licensing Agency was released in April 2014 and, as a result, responsibility for the Agency moved from Defra to the Home Office on 9 April 2014 under a machinery of government change. The full reports of Defra’s triennial reviews can be found on the GOV.UK website.
1 https://www.gov.uk/government/publications/defra-improvement-plan

Department for Environment, Food and Rural Affairs Annual Report and Accounts 2014–15 Chapter 1 – Strategic Report: Our Organisation
10
Risk Management Defra is responsible for managing risks to the public and the wider national interest, and managing risks to delivering its own business objectives. The first category requires Defra to assess the risks within complex environmental systems. Some of these have a strong emergency response component, where Defra has a lead-department role (e.g. for flooding and animal or plant disease outbreaks). Many have important elements that are outside the Department’s direct control, and therefore rely on Defra’s ability to influence decision makers, stakeholders and partners or to handle scientific uncertainty or gaps in evidence. The second category requires Defra to assess and manage the risks to the delivery of its business priorities, its budget and its reputation, across all the organisations in the Defra Network.
The Defra Board is responsible for the Department’s overall approach to risk and for the systems and processes in place to manage or mitigate the level of risk borne by Defra. The Board leads on strategic risk, and reviews Defra’s top risks as part of its regular review of management information. Given the diverse nature and range of Defra’s risks, the Board has not developed a departmental statement of risk appetite, but indicates its risk tolerance by agreeing target levels of risk for each strategic risk and by setting the strategic framework for the main policy, delivery, corporate and commercial decisions.
The Defra Risk Panel supports the Defra Board and the Network Executive Committee in their oversight of Defra’s top risks. The Risk Panel reviewed Defra’s strategic risks and risk management processes in 2014–15 and produced a new strategic risk portfolio. This was adopted by the Board in June 2014. The portfolio includes a range of policy delivery risks (such as CAP implementation), natural/hazard risks (such as antimicrobial resistance), operational risks (such as Health and Safety) and risks with major financial consequences (such as the Thames Tideway Tunnel). The Risk Panel has oversight of Defra’s inputs to the National Risk Assessment (NRA), and has overseen Defra’s input to NRA 2014. Defra’s capability to respond to NRA risks is now embedded within the assessment and monitoring of strategic risk.
The Defra Audit and Risk Committee has reviewed a number of operational delivery risks, including: CAPD; IT risk and cyber threat; the Fera JV; the move to a Single Operating Platform (for Finance, HR and procurement); and the management of major outsourced contracts.
The responsibility for the management of a number of Defra’s top risks is delegated to Executive Agencies and NDPBs, where much of Defra’s operational, financial and reputational risks lie. Chief Executives of Network Bodies are responsible for ensuring that effective approaches to risk management are in place locally, and provide regular performance reports to the Defra Board. In the case of Executive NDPBs and FC (a Non–Ministerial Department), independent boards hold the Executive to account for their performance, including their management of risk.

Department for Environment, Food and Rural Affairs Annual Report and Accounts 2014–15 Chapter 2 – Strategic Report: Our Performance
11
Chapter 2 – Strategic Report: Our Performance Defra’s Business Plan for 2013–15 sets out the Department’s strategic priorities and objectives. It was refreshed in August 2014. 59 actions have been completed, 8 are in progress and 3 are overdue in relation to 2014–15 activities.
This section highlights Defra’s achievements in 2014–15 and covers Business Plan actions and other significant activities. The references in the text correspond to the actions as listed on the Number 10 transparency website2.
Quarter 1: April – June 2014
Primary legislation to encourage responsible dog ownership became law through the Anti-social Behaviour, Crime and Policing Act 2014 (action 3.2.i).
The Water Act received Royal Assent and implementation got underway – reforming the water industry to make it more innovative and responsive to customers (e.g. introducing retail competition for non-households from April 2017) (action 2.7.i).
A Tree Health Management Plan for England was published. This sets out how government and a wide range of other partners are tackling current outbreaks (e.g. Chalara, Phytophthora and Oak Processionary Moth) and will manage future threats to tree health in England (action 4.1.ii).
Defra published a comprehensive strategy to achieve bovine TB (bTB) free status in England by 2038. This includes continuing to strengthen cattle movement controls, a grant-funded scheme for badger vaccination projects in the ‘edge area’ at the frontier of the disease, and the introduction of bespoke biosecurity advice for farmers in the areas where badger culling is taking place (action 3.1.iii).
The delivery model for the Thames Tideway Tunnel was finalised (action 2.5.i).
Quarter 2: July – September 2014
A summary of responses to a call for evidence on how a charge for single-use plastic carrier bags could work in England was published (action 2.2.vi).
Phase one of a Small Business Research Initiative on developing better biodegradable bags was completed. One project is being taken forward in the demonstration phase (for completion by November 2017) (action 2.2.vii).
Defra committed £98m of Rural Development Programme for England (RDPE) funding against the £100m planned under the Rural Economy Growth Review (action 1.3.i).
Thames Tideway Tunnel development consent was granted (action 2.5.i).
Defra put in place a plan for the procurement of food and catering services by the public sector. This sets out a new, voluntary approach to support opportunities for British grown produce and food within the public procurement market.
The government and the Environment Agency (EA) announced a joint Waste Crime Action Plan; a programme of actions to reduce waste crime and poor performance at a small proportion of waste management sites.
2 http://transparency.number10.gov.uk/business-plan/10

Department for Environment, Food and Rural Affairs Annual Report and Accounts 2014–15 Chapter 2 – Strategic Report: Our Performance
12
Quarter 3: October – December 2014
Environmental guidance for the public was revised so that it is simple, clear and easy to find on GOV.UK (action 2.9.i).
As a result of Defra engagement at the EU level, progress was made on moving towards a more effective and proportionate EU regulatory framework for genetic modification and nanomaterials (action 1.4.i).
By October 2014 all of the assets that were damaged during the winter storms had been restored to pre-winter 2013–14 standards on a permanent or temporary basis. Through this combination of permanent works and temporary arrangements, no communities were at greater risk going into winter 2014–15 than they were going into winter 2013–14 (action 2.14.ii).
A six-year programme of over 1,400 schemes to improve flood and coastal erosion defence was announced in the Autumn Statement. This will run from 2015 to 2021 and reduce the risk to at least another 300,000 households (action 2.12.vii).
As part of the bTB Strategy, the second year of the four-year badger culls was carried out with improvements based on lessons learned from the 2013 culls and the Independent Expert Panel’s recommendations (action 3.1.iv).
A second consultation on proposals to improve Local Air Quality Management in England was published on GOV.UK. (action 2.2.iv).
The Government completed its implementation of the Flood and Water Management Act 2010 by announcing changes to planning policy to promote the take up and maintenance of sustainable drainage systems (action 2.12.iv). These came into effect on 6 April 2015.
The new Food Crime Unit in the Food Standards Agency was operational at the end of 2014.
A cross-government Food Integrity and Food Crime Ministerial Group was set up.
A review of the UK Plant Health Risk Register was completed and work to implement the recommendations started.
Quarter 4: January – March 2015
The roll-out of the Sheep Movements Database was completed, helping to simplify livestock movement and reduce burdens on local authorities. E-reporting and the extension of sheep electronic identification to the slaughter lamb population are now in place (action 1.7.ii).
Regulations came into force to require compulsory microchipping of all dogs in England from April 2016 (action 3.2.i).
Defra invested £40m of its International Climate Fund allocation in the BioCarbon fund for projects in Indonesia and Zambia. These projects will reduce deforestation, help avoid biodiversity loss and support low carbon agriculture (action 2.4.i).
The target of planting 1 million new trees in England’s towns, cities and neighbourhoods was achieved (action 2.11.ii).
Following approval of the RDPE by the European Commission, three new schemes opened. Applications were invited for initial parts of the Countryside Stewardship Scheme (woodland grants, water capital grants, and

Department for Environment, Food and Rural Affairs Annual Report and Accounts 2014–15 Chapter 2 – Strategic Report: Our Performance
13
facilitation funding); grants were offered to farmers and foresters, including for new technology, under the Countryside Productivity Scheme; and under the Growth Programme applications for grants to develop rural businesses or food processing were invited in five Local Enterprise Partnership Areas (action 1.3.iii).
Decisions were made on grants under the £1m Air Quality Grant Programme to 24 local authorities to improve air quality, with a focus on those places exceeding nitrogen dioxide limits (action 2.2.v).
The Deregulation Act 2015 replaced criminal sanctions for householders putting waste out incorrectly with a ‘harm to local amenity’ test for civil sanctions, to deal with behaviour that makes life difficult for neighbours and damages the quality of the local area. These provisions will come into force on 15 June 2015 (action 2.6.ii).
Secondary legislation requiring retailers to charge a minimum of 5p for single-use plastic bags was made and will come into effect in October 2015 (action 2.2.viii).
A programme of investment between April 2011 and March 2015 led to over 177,000 homes having better protection from the risk of flooding and coastal erosion (action 2.12.i).
EA met its target to save 15 percent savings in its flood defence capital procurement by 2015 (action 2.12.vi).
A new partnership funding system for flood and coastal risk management has led to an increasing number of partners contributing to projects and devolved more power to local people (action 2.12.ii).
A range of activities have been put in place to implement the findings of the Pitt Review. These have improved flood defences and, through the National Planning Policy Framework, are designed to prevent inappropriate development in areas of high flood risk (action 2.12.iii).
A range of schemes were put in place to support those affected by flooding in the winter of 2013–14. By March 2015:
• Local authorities have claimed from Defra over £11.5m of grant payments made to homeowners and businesses affected by flooding during 2013–14 as part of the Repair and Renew Grant scheme. The funds provided assistance to develop additional flood resilience or resistance measures in homes and businesses (action 2.12.viii).
• The Farming Recovery Fund supported over 400 farmers affected by the severe flooding of winter 2013–14. £5.14m in grants was awarded through RDPE to restore agricultural land and bring it back into production as quickly as possible (action 2.14.i).
• European Fisheries Fund measures were used to help fishermen affected by the 2013–14 winter storms. Over £400,000 has been awarded to 124 fishermen to help replace lost pots and damaged fishing gear (action 2.14.iii).
Defra provided grants to 17 local authorities for the establishment of new Food Enterprise Zones, following a competition. The zones are designed to boost local growth and opportunities for food businesses.
During 2014–15 Defra negotiated the opening of over 100 new markets for animals and animal products. Exports of animals and animal products to non–EU markets grew by 10 percent from £1.415bn in 2013 to £1.560bn in 2014. Ministers led negotiations and trade promotion missions to the USA and China, and the first ever Agriculture and Food Counsellor was appointed in the British Embassy in Beijing.
The Water Act 2014 gave powers to deliver affordable flood insurance to those at highest risk of flooding. Defra and the Association of British Insurers have worked closely on the development of Flood Re, a not-for profit re-insurance company, that will be owned and managed by the insurance industry. Defra laid secondary legislation on 19 March 2015, and facilitated releases of domestic property tax (council tax) during the period.

Department for Environment, Food and Rural Affairs Annual Report and Accounts 2014–15 Chapter 2 – Strategic Report: Our Performance
14
State Aid approval was received on 29 January 2015. The Flood Re Executive Team continues to develop Flood Re’s organisation, systems and application to the financial regulators, as well as working with the insurance industry which also needs to develop its systems.
Business Plan actions overdue as of April 2015
SRP Detail Due Note 2.3.iv Negotiate and implement an EU regulation
on access to genetic resources and the sharing of benefits from their utilisation, to enable the UK’s ratification of the Nagoya Protocol.
Oct-14 Negotiation of EU Regulation 511/2014 concluded in 2014 and negotiation of supplementary EU Regulations commenced in February 2015. Defra laid a statutory instrument (SI) in March 2015 to provide for the enforcement of Regulation 511/2014, in time to meet the deadline of 11 June 2015 set out in Article 11 of that Regulation. The UK SI provides the basis for the UK to be able to ratify the Nagoya Protocol once the EU Regulation and associated Implementing Acts enter into force in October 2015.
2.13.i Announce and publish the Governance of National Parks (England) and the Broads draft Bill.
Mar-14 No decisions have been made on the future of this coalition proposal.
3.3.i Introduce secondary legislation to implement the EU rules on ensuring the welfare of animals when they are slaughtered in England.
Jan-14 Defra ministers revoked the new domestic regulations on the grounds that further consideration was required.
All slaughterhouses need to comply with the directly applicable EU Regulation and national rules which remain in place.
Government Major Projects Portfolio Defra manages a portfolio of major commercial projects totalling over £3bn in government whole life project costs. These projects deliver major infrastructure; information and communications technology (e.g. Common Agricultural Policy payment systems); and major procurement, outsourcing or joint ventures (e.g. shared services). The portfolio comprises those projects which exceed Departmental Expenditure Limits or other HM Treasury controls and thus require HM Treasury approval at each business case stage. The Defra Board receives quarterly reports on this portfolio.
This portfolio includes Defra’s three projects that form part of the Government Major Projects Portfolio. These are overseen by the Major Projects Authority, requiring quarterly reporting and a particularly robust assurance regime.
• Thames Estuary Asset Management 2100 Programme (led by EA): The procurement process to identify a private sector partner to deliver a 10-year programme of capital flood risk management works for London and the Thames Estuary was completed in September 2014. The chosen partner is CH2M Hill. Contracts were signed on 4 November 2014 and the programme is now in the delivery phase. This programme is a pathfinder within EA’s procurement strategy, providing a different way of delivering larger capital projects with significant efficiency gains.
• Thames Tideway Tunnel (led by Thames Water Utilities Ltd.): The project was specified in June 2014 and the Development Consent Order approved in September 2014. The procurement of the infrastructure provider by Thames Water continues following the Invitation to Negotiate on 7 October 2014. Preferred bidders for the main works contracts were announced on 27 February 2015. The project remains on track for construction contracts to be signed later in 2015 and construction to commence in 2016.

Department for Environment, Food and Rural Affairs Annual Report and Accounts 2014–15 Chapter 2 – Strategic Report: Our Performance
15
• Common Agricultural Policy Delivery (CAPD) Programme: The project was rated at Amber/Red in September 2014, reflecting the inherent high level of risk due to the nature of this digital exemplar programme, coupled with a review of the programme delivery approach by the senior responsible owner (SRO) (in summer 2014). A new SRO was appointed (October 2014) and additional senior and specialist resource from the Government Digital Service was brought in to enhance the application of the Agile delivery model used by the programme. The scope and timelines for deliverables were thoroughly reviewed to better align with business needs which mitigated some of the risk in delivery.
However, at the beginning of 2015 the programme encountered significant challenges in delivering to time and quality some of the key IT functionality required for a fully digital by default service. Launch of the Pillar 1 Basic Payments Scheme (BPS) in April 2015 using the online portal mapping capability was considered too high risk and a contingency plan was invoked to allow customers to submit their BPS claims in 2015 through a number of other channels after registering on the online service. A similar approach is being developed for Pillar 2 Countryside Stewardship applications in 2015.
More information is included in the Governance Statement in Chapter 7.
Information on each project is published annually through the Major Projects Authority3.
Input and Impact Indicators Details of input and impact indicators can be found in Annex 1.
Performance on Sustainable Development Overview of Defra’s Sustainable Development (SD) Role
Defra has driven progress on the Government SD Vision4 by embedding SD in government systems and procedures; advising other government departments (OGDs) on building SD into policies, operations and procurement; by supporting them through capability-building; and through its own schemes and activities.
SD In Defra
SD is at the heart of Defra’s work, supporting the government vision through its departmental priorities. All Defra policies are developed using SD principles and how this is done is detailed in the rest of this section, with more detailed sections on our lead role in Climate Change Adaptation and Rural Proofing government policies.
Defra’s Decision Making and SD
Sound evidence is essential for developing robust policies using SD principles. Multidisciplinary evidence and analysis specialists are embedded in Defra policy teams to ensure that evidence is properly considered and used in policy development. Defra’s policy development cycle includes SD as an essential assurance mechanism and the Department seeks to improve its capability to evaluate policies from a multidisciplinary perspective; integrating all three pillars of sustainability. For example, Defra is co-funding a new complex evaluations centre, to develop innovative methodologies to help evaluate and understand the impacts of policies in complex systems where economic, environmental and social factors interact.
Overview of SD in Defra Operations and Procurement
Full details of Defra’s action plan and performance on the Green Government Commitments5 (GGC) can be found in Annex 3, including an overview of the Sustainable Operations and Procurement Strategy.
3 https://www.gov.uk/government/publications/major-projects-authority-annual-report-2014 4 http://sd.defra.gov.uk/gov/vision/ 5 https://www.gov.uk/government/publications/greening-government-commitments-targets/greening-government-commitment-targets

Department for Environment, Food and Rural Affairs Annual Report and Accounts 2014–15 Chapter 2 – Strategic Report: Our Performance
16
Defra Procurement
Defra Network Procurement will continue to promote sustainable procurement in the Core Department, Natural England, Animal and Plant Health Agency and the Marine Management Organisation. It engages and seeks to influence procurement practice on a number of key sustainability issues including, consideration of the Public Services (Social Value) Act and the Public Sector Equality Duty and the Small Medium Enterprise (SME) Agenda.
A percentage of Defra’s expenditure is contracted through pan-government frameworks managed by the Crown Commercial Services (CCS). Defra works with CCS to promote the use of sustainable procurement within these frameworks.
Where Defra Network Procurement leads on procurements over £10,000, at the strategy stage a sustainability appraisal is undertaken and Government Buying Standards applied, where possible.
Small and Medium Enterprise Contracts
Defra is also working toward the achievement of the Government’s target that 25 percent of expenditure goes to SMEs by the end of 2014–15. Actions taken to achieve this include holding supplier events for specific procurement requirements. Publication of the 2013–14 SME information can be found online6.
Defra Support for Mainstreaming SD Across Government
Natural Value
Defra leads for Government on innovative work to apply the value of nature in decision-making across government. Actions include further developing the evidence base, working with the Office for National Statistics to develop experimental national natural capital accounts (published May 2014) and embedding assessment of the value of nature in the Department’s Impact Assessment training.
Defra has invested in research, such as the National Ecosystem Assessment Follow-On Project (published June 2014), to provide improved evidence and tools to inform decision-making and funded 12 Nature Improvement Areas that are working at the landscape scale to create and restore priority habitats with multiple benefits to society. Defra also supported the Natural Capital Committee, an independent committee established to advise Government on the sustainable use of England's natural capital. The Committee produced its third State of Natural Capital Report in January 2015, recommending development of a strategy and 25-year plan for natural capital.
Other Actions to Mainstream SD Across Government
• Leading the cross-Whitehall SD Group, sharing knowledge and resources with OGDs; leading Group sessions on valuing nature in decision-making; identifying opportunities to improve SD mainstreaming, planning and reporting; and engaging individual departments on specific issues.
• Training OGDs to incorporate SD in departmental Annual Reports and Accounts.
• Research on how well SD and environmental guidance is incorporated in impact assessments, highlighting good practice and improvement needed. Defra is working with OGDs to take forward the report conclusions.
• Developing a summary note on taking account of SD and the value of nature in government decision-making to build capability.
• Launching ‘Introduction to SD’ e-learning module on the Civil Service Learning website, available to all civil servants. This has received highly positive feedback.
6 https://www.gov.uk/government/publications/central-government-spend-with-smes-2013-to-2014

Department for Environment, Food and Rural Affairs Annual Report and Accounts 2014–15 Chapter 2 – Strategic Report: Our Performance
17
SD Stakeholder Engagement
• News on SD in government is provided through Defra’s Sustainability Twitter account with nearly 4,800 followers.
• Working with the National Audit Office and OGDs to advise on, support and follow up Environmental Audit Committee reviews of how well sustainability development is being mainstreamed in Government decision-making, policies, operations and procurement.
Defra Actions to Support Sustainable Operations and Procurement in Government
• Contributing to the Government Operations and Procurement Practitioners’ Forum, sharing best practice and advising OGDs on GGC reporting requirements.
• Analysing cross-government performance against the GGCs and advised the Home Affairs (GGC) Cabinet Sub-Committee to drive stronger delivery of the framework, which ends in 2015.
• Developing tools to deliver sustainable procurement, e.g. work with Peter Bonfield OBE to produce a toolkit including a balanced scorecard to reward excellence in food and catering, endorsed by the Prime Minister; developing government buying standards for procurement, including furniture, food and catering standards, vehicles and ICT.
• Implementing the Energy Efficiency Directive Article 6 requirements on standards for energy-using products, through a procurement policy note issued by Cabinet Office.
• Working with the Cabinet Office to collect information on supply chain impacts.
• Devising a sustainable procurement programme with OGDs and the wider public sector through CCS and Defra-led Sustainable Procurement Working Group.
Adapting to Climate Change Following the publication of the National Adaptation Programme Report, in July 2013, Defra continued to:
• work with other departments and a wide range of partners including businesses, councils and non-governmental, voluntary sector and charitable organisations to help them implement their actions from the NAP and take the risks posed by climate change into account within their policies and activities;
• implement the Defra-owned portion of the 371 actions in the National Adaptation Programme;
• support 110 organisations from key sectors (such as water, transport and energy) to report voluntarily on how they are addressing climate risks; and
• work on the Second Climate Change Risk Assessment, due for publication in January 2017. The Adaptation Sub-Committee of the Committee on Climate Change is leading on the synthesis of available evidence into an evidence report, which will be published in July 2016.
Defra also confirmed funding for 2015–16 for the Climate Ready Support Service for England, led by EA, which is helping a range of sectors, including business, local government, and the built environment, adapt to climate change.
Rural Proofing Lord Cameron’s review of Rural Proofing Implementation was published on 30 January 2015 and recommended a shift from Defra providing advice to other departments to supporting them to mainstream rural evidence into their policy making processes. Government is considering the recommendations made in Lord Cameron’s report.
In 2014–15, Defra worked closely with OGDs to support their rural proofing activity to reflect the needs and interests of rural businesses and communities. Key examples include the following.

Department for Environment, Food and Rural Affairs Annual Report and Accounts 2014–15 Chapter 2 – Strategic Report: Our Performance
18
• Working with the Department for Culture, Media and Sport (DCMS) and Broadband Delivery UK (BDUK) on the DCMS led £780m superfast rollout programme which will provide 95 percent of UK premises with access to superfast broadband by the end of 2017. Defra activity under the Rural Community Broadband Fund concentrated on 5 community projects.
• Improving mobile services across the UK with DCMS and BDUK to improve rural mobile services through planning reforms, and the £150m Mobile Infrastructure Project. The Government agreed a deal with mobile telephone network operators guaranteeing coverage to 90 percent of UK landmass by 2017.
• LEADER, a mandatory part of RDPE, is a delivery mechanism where delegated powers are given to Local Action Groups to deliver funding against local priorities identified within their Local Development Strategy. In England’s 2014–20 Programme a total budget of £138m has been allocated to 80 approved Local Action Groups 7 with a requirement for groups to spend 70 percent on creating jobs and growth.
• Following discussions at the time of last year’s settlement, Defra and the Department for Communities and Local Government agreed to jointly fund and manage a project to investigate if additional costs were associated with providing services in rural areas. As a result, the overall rural funding element of the Local Government Funding Settlement 2015–16 was increased from £11.5m to £15.5m.
• In November 2014 the Department for Transport secured £25m to provide hundreds of new minibuses to community transport operators in rural communities. Smaller operators and those who help out in rural areas will be favoured in the scheme. This is a direct result of the work the Rural Communities Policy Unit has done with the Department for Transport to help them better understand the needs of rural communities.
• The new £8m ‘Total Transport Pilot Fund’ enables local authorities in England to bid for resources to implement a cross-sector approach to the delivery of supported public transport services in their area. Defra worked with the Department for Transport to ensure that proposals from rural local authorities, and those representing rural areas, were looked at favourably during the bidding process.
• DCMS commissioned William Sieghart to produce an independent report on the structure and role of public libraries in England. Defra ensured inclusion of Defra/Arts Council’s report ‘Rural library services in England: exploring recent changes and possible futures’. The Sieghart Report now recognises important rural issues, such as digital services, and the contribution that libraries are making to rural communities.
Better Regulation Defra made a significant contribution to the Government’s commitment to reduce the overall burden of regulation by the end of the Parliament. These reforms will reduce regulatory costs to business arising from Defra’s legislation, or other regulatory activity, by around £300m per year.
650 legislative reforms have been made under the Red Tape Challenge Initiative which reduce the number of regulations in force by more than 20 percent compared to May 2010 and improve the remainder.
Under the Government’s ‘One-in, One-out’ and ‘One-in, Two-out’ systems Defra has reduced the annual cost to business of domestic regulation by £168m since January 2011. Further detail is provided by the 9th Statement of Regulation8.
As well as improving legislation, Defra and its regulator network are transforming all their guidance to make it simpler, quicker and clearer to follow. Defra and its regulator network have reduced all their guidance by more than 70,000 pages, a reduction of over 80 percent. Guidance is only being produced where government is uniquely placed to do so and content is being designed specifically around the needs of users.
7 https://www.gov.uk/rural-development-programme-for-england-leader-funding 8 https://www.gov.uk/government/uploads/system/uploads/attachment_data/file/397237/bis-14-p96b-ninth-statement-of-new-regulations-
better-regulation-executive.pdf

Department for Environment, Food and Rural Affairs Annual Report and Accounts 2014–15 Chapter 2 – Strategic Report: Our Performance
19
Defra’s formal consultations are now undertaken using the digital online consultation tool ‘Citizen Space’. This makes it simpler for policy officials to conduct consultations and for stakeholders to respond. Defra also launched an internal training programme to encourage policy officials to follow best practice on consultation.
Defra has continued to minimise regulatory burdens arising from EU measures under negotiation, or emerging as proposals, in line with the Government’s Guiding Principles for EU legislation. Examples of successful negotiations include:
• EU agreement on plastic bags, with each member state now able to do what works best in its own circumstances; and
• implementing rules for mandatory country of origin labelling of fresh and frozen meat to ensure that the rules do not interfere too much with established practice and are not burdensome for food businesses to operate.
Open Data Defra and its Network Bodies have published more than 1,000 datasets relating to their corporate activities, the environment and agriculture that can be easily found and re-used by businesses and citizens. Defra also leads on implementation of the EU INSPIRE Directive which is enabling the publication of many more geographic datasets by UK public sector bodies. Defra has also helped the Cabinet Office provide tools for public bodies to publish their data through data.gov.uk.
Defra prioritises the data sets to be made publically available and in 2014–15 these included flood data, published by Defra and EA, with wide interest and subsequent use by business, developers and community groups.
The Defra Network have successfully used funding from the Cabinet Office and the Department for Business, Innovation and Skills ‘open data funds’ to support specific projects to increase the public availability of data. This included a joint project with the Open Data Institute to develop an 'open data maturity model' tool to enable organisations to assess their effectiveness at publishing and consuming open data.

Department for Environment, Food and Rural Affairs Annual Report and Accounts 2014–15 Chapter 3 – Strategic Report: Financial Overview
20
Chapter 3 – Strategic Report: Financial Overview
Financial Summary The Statement of Parliamentary Supply shows that Defra’s total Voted funding for the 2014–15 financial year was £2,866m. This consisted of £2,570m in Departmental Expenditure Limits (DEL), £281m in Annually Managed Expenditure (AME) and £15m outside of the Department’s budgetary boundary.
DEL is the budget total, issued by HM Treasury on behalf of Parliament, that Defra uses to fund its strategic objectives, including an allowance for the consumption of assets over time (depreciation). Budgets within these totals are issued to business units across the Defra Network to fund ministerial outcomes.
Defra’s Resource DEL Budget includes the administrative costs of running Core Defra and its Network Bodies and programme spend on operational services including waste, animal disease, health and welfare, natural environment and floods. Defra’s gross spending in the economy is twice the size that its DEL Budget would suggest because Defra’s Resource DEL Budget includes payments made, mainly to farmers, in respect of Common Agricultural Policy (CAP) and rural development schemes, net of income received from the European Commission (EC).
Defra’s income is primarily received from the EC in relation to the CAP which totals £3.1bn, including £1.1bn which is paid to the Devolved Administrations. Other sources of income include fees, levies and licences payable to some of our Network Bodies. Further information can be found in Note 6.1 along with the relevant bodies’ accounts.
Defra’s resource AME Budget is used largely to record movements in provisions, primarily for the CAP disallowance provision, EA pension funds, and some impairments. This explains the unusual pattern of movements in Resource AME reported in Annex 2. The resource costs of the Levy Funded Bodies, net of levy and other income, are also included within Resource AME..
Defra’s Capital Budget covers Core Defra and its Network Bodies and includes expenditure on fixed assets, net of sales, and the payment of capital grants.
The final area of Defra funding, called Non Budget, is used to account for expenditure and income relating to CAP payments on behalf of the Devolved Administrations and Prior Period Adjustments.
Outturn Against Control Totals
The Department’s final Outturn against the budgets within its control was £2,545m in DEL and £80m in AME. This was an underspend of £25m in DEL (1 percent) and £201m in AME. Within this, there was:
• a £12m underspend against Resource DEL; and
• a £13m underspend against Capital DEL.
The underspend of £201m against AME budgets was due to the following items.
• £133m of this relates to disallowance. £60m relates to the Single Payment Scheme for 2012 and 2013 where, following late notifications from the EC this has gone straight to a DEL accrual. £63m related to the 2012–14 Fruit and Vegetable Trader Schemes, Cross Compliance and Debt Management, where the actual provisions required depend on information from the findings of EC audits. As no EC audit has been carried out for these scheme years, the provisions incorporated in budget plans at the beginning of the financial year, which were based on the best available information at the time, were not required. The balance relates to exchange rate movements between December and March resulted in a lower than forecast provision being required.

Department for Environment, Food and Rural Affairs Annual Report and Accounts 2014–15 Chapter 3 – Strategic Report: Financial Overview
21
• £48m underspend against property impairments of the Animal and Plant Health Agency (APHA) Weybridge site; the valuation which informed the budgeted level of impairment was subject to further review and led to the lower level of impairment.
• £23m underspend related to a potential Judicial Review outcome which was not required in 2014–15.
• £38m underspend against a provision for the South West Water subsidy which, at the time of the Supplementary Estimate, was still subject to confirmation of the correct accounting treatment.
• £38m overspend relating to the creation of the Foot and Mouth Disease (FMD) Burial Sites provision (see Chapter 8, Note 16.6).
• The remaining overspend of £3m represented small net under and over spends across other portfolios.
The underspend of £9m against Non Budget, expenditure outside of the Department’s budgetary boundary, primarily reflected an underspend against the EC funded schemes in the devolved administrations and was mainly exchange rate differences.
Financial Management
The Department has continued to make good progress with delivering the savings and reforms set out in the 2010 Spending Review (SR10). Compared to the SR10 baseline (2010–11) set by HM Treasury, DEL expenditure in 2014–15 was £568m lower, a reduction of 18 percent in nominal terms. Within this, Administration expenditure was £279m lower, a reduction of 36 percent in nominal terms.
Continuous improvements in financial management contributed to an Outturn of around 99 percent of the Resource DEL Budget. In addition to this, the Department was also able to achieve the following.
• Following the winter floods in 2014, urgent work was required within EA to repair damaged defences and keep homes protected. To enable this work to be carried out, the Department reprioritised budgets and allocated an additional £100m in 2014–15 to EA.
• Defra supported the rural economy with £1,546m in CAP scheme expenditure for schemes in England plus £538m for rural development schemes with improvements in performance.
• An above target of 97 percent of the 2015 SPS claims were paid by the end of December 2014 with the March 2015 target being achieved in January 2015; and
• The Department successfully mitigated the foreign exchange risks associated with the operation of the EC schemes by entering into a hedging contract for the Euro amount of the EU funding.
• The Department spent 98 percent of its Capital DEL Budget. This was achieved by rigorous prioritisation of investment, largely in vital infrastructure projects to protect communities at risk of flood and coastal erosion. The Capital Budget has also contributed to essential maintenance of Defra’s estate, improvement to our science laboratories and ICT-related business change programmes.
Net Cash Requirement
Defra’s Outturn against its Estimate for the 2014–15 Net Cash Requirement (NCR) is an underspend of £178m. This represents the closing bank balances for Core Defra and its Executive Agencies, adjusted for Consolidated Fund Extra Receipts. A prudent estimate has to be taken when calculating the NCR to mitigate the risk of any of these entities going overdrawn. The majority of the unspent balances are held within the Government Banking Service, therefore ensuring good value for the Exchequer as a whole and ensuring the Debt Management Office has access to the funds.
The variance is due to the following.

Department for Environment, Food and Rural Affairs Annual Report and Accounts 2014–15 Chapter 3 – Strategic Report: Financial Overview
22
• £82m underspend in the Rural Payment Agency’s (RPA) Euro account. In March 2015 RPA received advances of €64m from the EC in respect of the English Rural Development 2014–2020 programme. The EC provides these advances when new programmes are approved; however, the timing for this approval was not known at the time of the Supplementary Estimate, which is the last point at which the Department can change its NCR.
• £96m underspend across Core Defra and the Executive Agencies.
Consolidated Statement of Financial Position Over the 2014–15 financial year, Defra’s total assets less liabilities decreased by £29m.
• Non–current assets increased by a net £53m over the year, with a number of net additions and revaluations across the Network (including flood defences, IT assets and Kew’s heritage assets), along with an investment in Fera Science Limited as part of a joint venture with Capita. This was partially offset by total depreciation, amortisation and impairment charged in year on non–current assets. The impairment mainly related to re-classifying Sand Hutton site to an investment property.
• Current assets increased by £119m, mainly due to an increase in trade and other receivables of £176m, where accrued income relating to EU funding is £102m higher, offset by a decrease in cash balances of £81m.
• Current liabilities decreased by £23m. Trade and other payables decreased by £10m, mainly due to a decrease in the Consolidated Fund creditor of £97m and a decrease in the EU other payables of £94m offset by an increase in accruals and deferred income of £210m.
• Non-current liabilities increased by £224m, with the main movement being due to a £191m increase in the long term net pension liability. This was mainly due changes in assumptions used by the actuaries to calculate future liabilities, partially offset by return on assets, in the EA Active pension Scheme. Further details are included in Chapter 8, Note 17.
Other Information This section covers other key financial information.
EC Disallowance
Disallowance arises as a result of financial corrections applied by the EC where the EC takes the view that EC regulations for payments funded through European schemes, including the CAP, have not been applied correctly. The financial correction typically materialises as a deduction by the EC from a UK claim for reimbursement under European schemes – in essence, a penalty.
Disallowance is accounted for in Defra’s Accounts in three stages.
• Stage 1: Money is initially set aside for disallowance (via a provision) when there is sufficient evidence, following an EC audit, that a penalty is likely, but not certain, to be incurred in a future accounting period. These amounts are held on the Statement of Financial Position (SoFP) as current liabilities (provisions).
• Stage 2: Disallowance penalties are confirmed in the Accounts (via an 'accrual') when the proposed disallowance has been formally communicated to the Department by the EC and will not be contested. These amounts, typically unwinding a previous provision, are held on the SoFP as current liabilities (accruals). Both Stage 1 and Stage 2 transactions result in charges to Resource (either AME or DEL), and are therefore charged to the Statement of Comprehensive Net Expenditure (SoCNE), as shown in the following table ‘Charges to the SoCNE for EC Disallowance’.
• Stage 3: Disallowance penalties are finally transacted when the EC decides to deduct the owed amount from a claim for reimbursement under European schemes made by the UK, typically some time after the penalty has been confirmed (and therefore accrued). Stage 3 payments are accounted for purely through

Department for Environment, Food and Rural Affairs Annual Report and Accounts 2014–15 Chapter 3 – Strategic Report: Financial Overview
23
the SoFP, exchanging a current liability (accrual) for a current asset (cash) and so are not shown on the SoCNE.
• The creation of an accrual at stage 2 may be skipped, and occasionally transactions can move from provision to payment within the same financial year, these transactions would still impact on the DEL budget and pass through the SoCNE. The Balances from the SoFP for EC Disallowance table shows the accumulation over time of Stage 1, 2 and 3 transactions in Defra’s Accounts.
Charges to the SoCNE for EC Disallowance
2014–15£m DEL AME Total
Stage 1: Allowance created in-year for anticipated liabilities due in over 12 months’ time (provisions) - 18 18
Stage 2: Provisions unwound in-year for liabilities expected to materialise within 12 months (accruals) 28 (28) -
Stage 2: New accruals where no previous provision existed1 62 - 62
Gross charge 90 (10) 80
Write back in previous accrual/provision (credit)1 (9) (9) (18)
Net charge 81 (19) 62
During 2014–15 Defra made gross charges to the SoCNE of £80m (2013–14, £6m, this was low due to no new provision being required in 2013–14) for disallowance, of which £90m (2013–14, £42m) was classified as accruals. Adjusting for a £18m (2013–14, £24m) credit to previous accruals/provisions, the net charge to the SoCNE in respect of disallowance was £62m (2013–14, £18m credit).
Balances from the SoFP for EC Disallowance
£m Total as at 31 March
2015 2014–15 2013–14 2012–13 Up to
2011–12
Stage 1: Provisions outstanding at year end on SoFP2 65 65 84 133 125
Stage 2: Accruals outstanding at year end on SoFP3 167 167 89 165 187
Stage 3: Cash payments made to EC4 410 3 105 24 278
Cumulative total for disallowance as at 31 March 2015 642
1. Note 5, Core Department EC disallowance. 2. Note 16, Core Department disallowance closing balance at 31 March. 3. Note 15, as part of the Core Department accruals and deferred income £568m (2013–14, restated £335m). 4. The Statement of Changes in Taxpayers Equity, Core Department as part of the funding to Executive Agencies £277m (2013–14, restated £208m).
Defra’s Accounts have included cumulative transactions for disallowance penalties totalling £642m. Of this total, £410m has been paid to the EC over time (Stage 3), £167m remains accrued for future liabilities and is awaiting deduction by the EC (Stage 2), and £65m remains in provisions for possible future deductions pending resolution of confirmed liability. Further information can be found in Chapter 8, Note 16 and Note 16.3.

Department for Environment, Food and Rural Affairs Annual Report and Accounts 2014–15 Chapter 3 – Strategic Report: Financial Overview
24
Reconciliation of Net Resource Expenditure between Estimates, Budgets and Accounts
This reconciliation can be found in SoPS 3.1.
Investment Management Strategy
Assets that are no longer required for the Department’s activities are sold in accordance with the principles of HM Treasury’s Managing Public Money.
Contingent Liabilities
An analysis of contingent liabilities disclosed under International Accounting Standard (IAS) 37 and contingent assets is given in Notes 18.1 and 18.2.
Defra has entered into a number of agreements resulting in remote contingent liabilities that are disclosed in Note 18.3 under parliamentary reporting requirements. These are outside the scope of IAS 37 since the possibility of a transfer of economic benefit in settlement is too remote.
Core Tables
The Core Tables can be found in Annex 2.
Quarterly Data Summary (QDS)
The QDS provides a summary of the headline spend of the Core Department by quarter to give the public an understanding of how the Department utilises its funds. Each quarter is published online on the Government Interrogating Spending Tool9 (GIST). The Quarter 4 2014–15 QDS data is due to be published in late summer 2015.
Arm's Length Bodies which receive over £100m of government funding also publish QDS data. In the Network, EA, NE, RPA and APHA have QDS data published on the GIST website.
Bronwyn Hill 7 July 2015 Accounting Officer for the Department for Environment, Food and Rural Affairs
9 http://www.gist.cabinetoffice.gov.uk/index.html

Department for Environment, Food and Rural Affairs Annual Report and Accounts 2014–15 Chapter 4 – Directors Report: Staff and Remuneration
25
Chapter 4 – Directors Report: Staff and Remuneration
Our Ministers and Senior Staff Details of our ministers and senior staff can be found in Chapter 1.
People and Culture Recruitment Practice
The Civil Service Order in Council 1995 sets out the legal basis for Defra’s recruitment policies and practice. The Civil Service Commissioners’ Principles for Recruitment and the Recruitment Code are mandatory and must be followed when any post is opened to competition from outside the Civil Service.
During the reporting period, the freeze on recruitment into the Civil Service resulted in Defra continuing with an approval process requiring DG approval to recruit externally into critical business and/or frontline posts.
Diversity and Employment of Disabled People
In 2014 we refreshed Defra’s Diversity Strategy to reflect the priorities in the Civil Service Talent Action Plan. Good progress is being made on actions to ensure Defra is able to recruit, retain and enable employees from a diverse range of backgrounds to develop and progress on merit. These include actions to promote opportunities for employees with protected characteristics, based on clear business evidence of under-representation at the appropriate progression level. One example is the Positive Action Pathway, a programme for ethnic minority and disabled staff which has now been extended to include lesbian, gay, bisexual and transgender staff in all grades from Administrative Assistant to Grade 6. This development programme aims to equip participants with the skills and confidence to realise their full potential and assist with career progression. The following table shows the number of Core Defra and Executive Agency staff who are on the scheme. N/A indicates the scheme for that grade cohort was not open to LGBT staff because at that stage there was no evidence of under representation.
Grade Disabled Participants Ethnic Minority Participants Lesbian, Gay, Bisexual and Transgender Participants
AA/AO 4 4 N/A EO 5 4 N/A HEO/SEO 2 6 N/A G6/7 1 1 4
Defra published a refreshed Public Sector Equality Duty Report in November 2014 which includes customer objectives and supporting action plans.
Defra continues to strengthen relationships with its staff networks, all of which are now supported by a senior champion. These are the Lesbian, Gay and Bisexual, Transgender and Asexual Network, the Ethnic Minority Network, the Work Life Balance Network, the Womens' Network, Break the Stigma (mental health network) and Disnet (a disability network). Break the Stigma won the Defra Diversity and Equality Team Awards in 2015 for the work it does providing support and information on mental health. The Womens’ Network has held various workshops and events to support and engage with women at all grades.
The Department operates the ‘Two Ticks’ disability symbol in recruitment and employment. ‘Two Ticks’ is a commitment to guarantee an interview to any candidate who has disclosed a disability, as defined under the Equality Act 2010, and meets the minimum (essential eligibility) criteria for the post. Comprehensive guidance on making reasonable adjustments at work and supporting disabled employees is provided to managers. All line managers are required to complete unconscious bias training which was introduced in September 2013. Disability leave enables disabled employees to take paid time off work for assessment, treatment and rehabilitation.

Department for Environment, Food and Rural Affairs Annual Report and Accounts 2014–15 Chapter 4 – Directors Report: Staff and Remuneration
26
Gender and Defra
Defra continues to monitor the makeup of its workforce by gender which is described in the table below. During recruitment and selection processes applications are anonymised up until the interview stage; interview panel members are required to undertake unconscious bias training; and single gender selection panels are allowed by exception only.
Gender Split Male Female
Senior officials on the Defra Board1 4 2
Ministers 3 1
Non–Executive Directors 3 1 Management staff (Senior Civil Service grade or equivalent) for the Departmental Group2 (excluding senior officials on the Defra Board)
195 102
All other staff for the Departmental Group 11,604 10,524
Total 11,809 10,630
1. Peter Unwin left Defra on 31 March 2015. As of 1 April 2015 there are 3 male senior officials on the Defra Board and 3 female. 2. Departmental Group includes Core Defra, the 5 Executive Agencies (up to 31 March 2015) and 9 Non–Departmental Public Bodies (NDPBs). Figures are by headcount.
Wellbeing and Managing Attendance
A corporate strategy for managing attendance is in place in Defra to support employee recruitment and retention, which involves closely monitoring sickness absence, conducting return-to-work interviews, providing advice from occupational health professionals, and providing counselling and other advisory services through an employee assistance programme. A wellbeing programme has been implemented which emphasises links between physical and mental health and aims to help employees to look after their personal wellbeing. Specific activities in the last 12 months include workshops on resilience, mindfulness, and mental health awareness. A health kiosk visited 15 Defra sites and various awareness events such as Dementia Friends and cancer awareness sessions have been offered, as well as an active, staff led sports and social programme.
For the Department and its Executive Agencies, an average of 4.8 working days per employee was lost to sickness absence during the year to 31 March 2015, compared with 5.0 days in the year to 31 March 2014. There has been a reduction in the number of working days lost per employee since 2009–10, when it was 7.8 days.

Department for Environment, Food and Rural Affairs Annual Report and Accounts 2014–15 Chapter 4 – Directors Report: Staff and Remuneration
27
Defra demonstrated its commitment to the Corporate Social Responsibility Agenda by providing information on opportunities to take up volunteering. Defra employees are offered one day special leave with pay each year to use their skills to help others by volunteering individually, or as part of a team, for a non–profit making organisation which serves the public. Reservists are allowed 15 days paid special leave a year to participate in training, and Defra is actively promoting enlistment across the Core Department, its Executive Agencies, and its Network Bodies. Defra sent a delegation to the Reserve Experience Event in Whitehall in January 2015, are promoting the upcoming Civil Service Live event in Birmingham in June 2015, and is working with the Ministry of Defence and other departments to arrange and participate in other regional events. The baseline number of reserves in Defra and its Executive Agencies on 1 April 2014 was 0.16 percent.
Off-Payroll Appointments
Information on senior off-payroll engagements is set out in the following table. Off-payroll means anyone who is working for the Department or a Network Body but is not paying PAYE (Pay As You Earn) or National Insurance via the departmental payroll, i.e. working for Defra but not a civil servant.
Off-payroll engagements as of 31 March 2015, for more than £220 per day and that last for longer than six months
Core Department Executive Agencies NDPBs Non-
MinisterialDefra APHA Fera RPA EA Kew FC
Number of existing engagements as of 31 March 2015
64 8 3 33 88 5 10 211
Of which:Number that have existed for less than one year at time of reporting
27 8 2 12 36 2 4 91
Number that have existed for between one and two years at time of reporting
30 0 1 15 10 1 0 57
Number that have existed for between two and three years at time of reporting
6 0 0 6 10 0 2 24
Number that have existed for between three and four years at time of reporting
0 0 0 0 15 0 1 16
Number that have existed for four or more years at time of reporting
1 0 0 0 17 2 3 23
Total
1. Network Bodies not listed in the table above provided a nil return. 2. All existing off-payroll engagements, outlined above, have at some point been subject to a risk-based assessment as to whether assurance needs to be sought that the individual is paying the right amount of tax and, where necessary, that assurance has been sought.

Department for Environment, Food and Rural Affairs Annual Report and Accounts 2014–15 Chapter 4 – Directors Report: Staff and Remuneration
28
New off-payroll engagements, or those that reached six months in duration, between 1 April 2014 and 31 March 2015, for more than £220 per day and that last for longer than six months
Core Department
Non-Ministerial
Defra APHA Fera RPA EA Kew NE FCNumber of new engagements, or those that reached six months in duration, between 1 April 2014 and 31 March 2015
31 8 4 15 37 5 1 4 105
Number of the above which include contractual clauses giving the department the right to request assurance in relation to income tax and National Insurance obligations
31 8 4 15 37 5 1 01 101
Number for whom assurance has been requested 212 8 4 15 37 5 1 4 95
Of which:Number for whom assurance has been requested and received 18 8 4 15 37 4 1 4 91
Number for whom assurance has been requested but not received3 3 0 0 0 0 1 0 0 4
Number that have been terminated as a result of assurance not being received 0 0 0 0 0 0 0 0 0
Executive Agencies NDPBs Total
Network Bodies not listed in the table above provided a nil return. 1. Contractors are based in Edinburgh. A Scottish Government framework is in place, but, as at 31 March 2015, this had not been updated to include contractual clauses allowing the Forestry Commission to seek tax assurances. However, all contractors were advised that they could not be used unless they provided evidence and all agreed to comply. A new framework started on 13 April 2015 which contains the appropriate clauses. 2. As at 31 March 2015, the remaining ten workers had not been in the organisation for six months. 3. Three workers from the Core Department and one worker from Kew were referred to HMRC after leaving the Department at the end of their contracts without providing adequate assurance.
Off-payroll engagements of board members and/or senior officials with significant financial responsibility between 1 April 2014 and 31 March 2015
Number of off-payroll engagements of board members and/or senior officials with significant financial responsibility, during the financial
year1
Total number of individuals both on payroll and off-payroll that have been deemed 'board members
and/or senior officials with significant financial responsibility',
during the financial year. This figure should include both on-payroll and
off-payroll engagements.
Core Department Defra 0 12APHA 0 12Cefas 0 13Fera 22 12RPA 0 19VMD 0 6
AHDB 0 24CCW 0 13EA 0 17
JNCC 0 11Kew 0 9MMO 0 14
NE 0 7NFC 0 7SFIA 0 13
Non-Ministerial FC 0 15
Executive Agencies
NDPBs
1. Senior Officials with significant financial responsibility are defined as all board level executives, non–executive directors and finance directors. 2. The appointments of two senior officials with significant financial responsibility did not exceed six months. One was Fera’s interim Commercial Director and the other was Fera’s Director of Operations. Interim appointments were required due to the unique circumstances Fera was in at the time, with a Joint Venture coming into effect from 31 March 2015. Due to this Joint Venture, Fera was unable to recruit permanent employees to these critical roles and was therefore required to use interim staff.

Department for Environment, Food and Rural Affairs Annual Report and Accounts 2014–15 Chapter 4 – Directors Report: Staff and Remuneration
29
People Survey
The Department and its Executive Agencies participated in the Civil Service People Survey in October 2014. The summary results are provided in the table below.
The engagement index, which measures the extent to which employees are motivated to contribute to the overall success and performance of their organisation, increased by 2 percentage points to 54 percent for the Core Department and 51 percent for the Core Department and Agencies. On leadership and managing change the Core Department’s score rose by 3 percentage points to 38 percent, still below the Civil Service benchmark. Leadership and managing change will continue to be an area of specific focus for the 2015 engagement plan.
Defra is committed to improving leadership of change and increasing staff engagement though a range of actions including strongly promoting and embedding the Civil Service Leadership Statement, 360° reporting, a senior leaders question time, talent reviews, the Defra Capability Plan, the Annual Skills Review, quarterly Core Defra senior civil servant leadership events and local plans aimed at addressing local engagement issues.
This summary includes the results for 2014 and shows the trend when compared with the 2013 survey.
2014 Changes from 2013
% Core Department
Core Department
and Agencies
Civil Service
Core Department
Core Department
and Agencies
Civil Service
Response Rate 87 73 77 0 - 1 - 1
Employee Engagement Index 54 51 59 +2 + 2 + 1
Leading and Managing Change 38 35 43 + 3 0 0
My Work 77 72 75 + 1 0 + 1 Organisational Objectives and Purpose
78 74 83 + 1 + 2 + 1
My Manager 70 64 67 + 2 0 0
My Team 82 78 79 0 + 1 0
Learning and Development 52 45 49 + 7 + 13 + 2
Inclusion and Fair Treatment 77 71 75 + 1 + 1 + 1
Resources and Workload 74 70 74 + 2 + 1 0
Pay and Benefits 26 26 28 - 5 - 2 - 1
1. The Core Department and the Core Department and Agencies have seen improvements or no change compared with 2013 in all areas of engagement with the exception of Pay and Benefits. 2. In 2014, the Core Department was above the Civil Service benchmark in the following areas: My Work, Learning and Development, Inclusion and Fair Treatment, My Manager and My Team. 3. Two of Defra’s Executive Agencies, Cefas and VMD, have performed particularly well with overall engagement index scores of 61 percent and 65 percent respectively. 4. Full information of all Defra’s engagement scores, including Executive Agencies, can be found online10.
10 https://www.gov.uk/government/publications/civil-service-people-survey-2014-results

Department for Environment, Food and Rural Affairs Annual Report and Accounts 2014–15 Chapter 4 – Directors Report: Staff and Remuneration
30
Human Rights Disclosure
There has not been any successful litigation against Defra alleging a breach of the Human Rights Act 1998. All Defra primary legislation has had a ministerial certificate under section 19 Human Rights Act 1998 certifying the legislation to be compatible with human rights, and all Defra statutory instruments subject to the affirmative procedure have included a statement of compatibility with the European Convention on Human Rights. No Parliamentary Committee has adversely reported any Defra legislation for breach of the Human Rights Act 1998.
Consultancy and Temporary Staff Expenditure
The table below shows the total consultancy and temporary staff expenditure incurred by the Defra Network.
£000 Core Department
Core Department
and AgenciesDepartmental
GroupCore
Department
RestatedCore
Department and Agencies
Restated
Departmental Group
Consultancy expenditure 9,283 10,309 24,349 9,740 10,119 32,105 Temporary staff expenditure 12,020 27,359 40,759 6,201 22,158 32,761 Total 21,303 37,668 65,108 15,941 32,277 64,866
2014-15 2013-14
Core Defra expenditure on temporary staff has increased significantly due to the CAP Delivery Programme. The bulk of the remaining spend across the Network on consultancy and temporary staff is incurred by the EA, where consultants are engaged when it is better value for money to do so on specific projects where specialised skills are required. EA projects span a very large range of skill requirements and include unplanned work such as responding to flooding incidents.
Remuneration Report Remuneration Policy
The remuneration of the Senior Civil Service (SCS) is set by the Prime Minister following independent advice from the Senior Salaries Review Body (SSRB). The Cabinet Office advises the Department in March or April each year of the Government’s response to the SSRB recommendations and produces guidance for departments to follow.
Defra develops its SCS Reward Strategy within the Cabinet Office Framework, ensuring that the overall pay awards for the SCS are within the cost ceiling allowed.
Members of the SCS, excluding the Permanent Secretary, are eligible to be considered for individual levels of bonus as non–pensionable, non–consolidated variable pay (NCVP), based on their performance. NCVP is paid in the financial year after that in which it was earned. During 2014–15, NCVP for 2013–14 performance was paid to approximately 25 percent of the SCS and was capped at £11,000 for Deputy Directors, £13,000 for Directors and £15,000 for Directors General. NCVP values, informed by each individual’s appraisal grade, were paid within Cabinet Office guidelines.
The Permanent Secretary is eligible to be considered for a NCVP bonus award measured against achievement of objectives, which for performance in 2013–14 was subject to a maximum of £17,500. Such awards are made by the Permanent Secretaries’ Remuneration Committee, which comprises the Chairman of the SSRB (who acts as Chair), two other members of the SSRB, the Cabinet Secretary and the Permanent Secretary of HM Treasury.
Ministerial salaries are determined by the Cabinet Office, under the Ministerial and Other Salaries Act 1997.

Department for Environment, Food and Rural Affairs Annual Report and Accounts 2014–15 Chapter 4 – Directors Report: Staff and Remuneration
31
Service Contracts
The Constitutional Reform and Governance Act 2010 requires Civil Service appointments to be made on merit, on the basis of fair and open competition. The recruitment principles published by the Civil Service Commission specify the circumstances when appointments may be made otherwise.
Unless otherwise stated below, the officials covered by this report hold appointments which are open ended. Early termination, other than for misconduct, would result in the individual receiving compensation as set out in the Civil Service Compensation Scheme.
Further information about the work of the Civil Service Commissioners can be found on the Civil Service Commission website11. All senior officials on the Defra Board are on permanent Civil Service contracts, with the exception of Professor Ian Boyd who is on a fixed term contract until 29 August 2017.
Remuneration (Including Salary) and Pension Entitlements (Audited)
The following sections provide details of the remuneration and pension interests of the ministers and Defra Board members who were employees of the Department, during 2014–15. The following tables in the Remuneration Report have been subject to audit.
Ministers
2014-15 2013-14 2014-15 2013-14 2014-15 2013-14
Salary SalaryPension
Benefits**Pension
Benefits** Total Total £ £ £ £ £ £
Rt Hon Elizabeth Truss MP 47,066* - 16,000 - 63,066 -(from 15 July 2014)
George Eustice MP 22,375 11,148* 8,000 4,000 30,375 15,148
Dan Rogerson MP 22,375 11,148* 8,000 4,000 30,375 15,148
Lord de Mauley 105,076 105,076 24,000 25,000 129,076 130,076
Ministers who have served during 2014-15 but were not in post as at 31 March 2015 were:
Rt Hon Owen Paterson MP 19,598* 68,169 6,000 25,000 25,598 93,169
(until 15 July 2014)
*Full year equivalent salary for Ministers who served part year with Defra:
2014-15 2013-14£ £
Rt Hon Owen Paterson MP 67,505 - Rt Hon Elizabeth Truss MP 67,505 - George Eustice MP - 23,039 Dan Rogerson MP - 23,039
** The value of pension benefits accrued during the year is calculated as (the real increasing in pension multiplied by 20) less (the contributions made by the individual). The real increase excludes increases due to inflation or any increase or decrease due to a transfer of pension rights. Ministers’ Pensions are disclosed to the nearest £000.
11http://civilservicecommission.independent.gov.uk/about-us/

Department for Environment, Food and Rural Affairs Annual Report and Accounts 2014–15 Chapter 4 – Directors Report: Staff and Remuneration
32
Ministerial Salaries
In May 2010, the Government announced that it would impose a ministerial pay freeze for the lifetime of the Parliament. As a result ministers reduced their ministerial salary to ensure that they did not benefit from a 1 percent salary increase awarded to MPs.
Senior Officials
2014-15 2013-14 2014-15 2013-14 2014-15 2013-14 2014-15 2013-14
Salary SalaryBonus
PaymentsBonus
PaymentsPension Benefits
**Pension Benefits Total Total
£000 £000 £000 £000 £000 £000 £000 £000Bronwyn Hill 160 - 165 160 - 165 - - 19 13 180 - 185 170 - 175 Permanent Secretary
Peter Unwin 130 - 135 130 - 135 10 - 15 10 - 15 - 7 145 -150 150 - 155 Director General
Professor Ian Boyd 95 - 100 95 - 100 - - 37 39 135 - 140 135 - 140 Director General
Nick Joicey 105 - 110 20 - 25* - - 55 13 160 -165 30 - 35 Director General
Alastair Bridges 85 - 90 15 - 20* - - 16 2 100 -105 20 - 25 Finance Director
Betsy Bassis 70 - 75* - - - 11 - 80 - 85 -Director General (from 22 September 2014)
Senior Officials who have served during 2014-15 but were not in post as at 31 March 2015 were:
Ian Trenholm 35 - 40* 140 - 145 - - 30 55 65 - 70 195 - 200 Director General (until 30 June 2014)
David Webster 20 - 25* - - - 3 - 25 - 30 - Interim Director General (from 21 July 2014 until 21 September 2014)
*Full year equivalent salary for part year officials were: 2014-15 2013-14
£000 £000Ian Trenholm 140 - 145 - Betsy Bassis 135 - 140 - David Webster 120 - 125 -Alastair Bridges - 85 - 90Nick Joicey - 105 - 110
**Some prior year pension benefits figures have been changed by the pension provider and may differ from those published in the 2013–14 ARA.
Benefits in Kind
The monetary value of benefits in kind covers any benefits provided by the Department and treated by HM Revenue and Customs as a taxable emolument. No senior officials were in receipt of any benefits in kind during 2014–15 (2013–14, £Nil).
Salary
Salary includes gross salary, overtime, reserved rights to London weighting or London allowances, recruitment and retention allowances, private office allowances and any other allowance to the extent that it is subject to UK taxation.
This report is based on accrued payments made by the Department and thus recorded in these accounts. In respect of ministers in the House of Commons, departments bear only the cost of the additional ministerial remuneration; the salary for their services as an MP (£66,396 from 1 April 2013, £67,060 from 1 April 2014) and various allowances to which they are entitled are borne centrally. However, the arrangement for ministers

Department for Environment, Food and Rural Affairs Annual Report and Accounts 2014–15 Chapter 4 – Directors Report: Staff and Remuneration
33
in the House of Lords is different in that they do not receive a salary but rather an additional remuneration, which cannot be quantified separately from their ministerial salaries. This total remuneration, as well as the allowances to which they are entitled, is paid by the Department and is therefore shown in full in the figures above.
The information given above relates to the Permanent Secretary and senior managers of the Core Department. Equivalent information relating to the Executive Agencies and Non–Departmental Public Bodies (NDPBs) consolidated into the Departmental Accounts is given in their separate Annual Report and Accounts (ARA).
Bonuses
Bonuses are based on performance levels attained and are made as part of the appraisal process. The bonuses reported in 2014–15 relate to performance in 2013–14 and the comparative bonuses reported for 2013–14 relate to the performance in 2012–13.
Non–Executive Directors 2014-15 2013-14
Fees Entitlement
Fees Paid*
Benefits in Kind
Fees Entitlement
Fees Paid*
Benefits in Kind
£ £ £ £ £ £
Iain Ferguson 20,000 20,000 1,200 20,000 20,000 1,451
Catherine Doran 15,000 7,500 - 15,000 18,750 -
Sir Tony Hawkhead 15,000 15,000 364 15,000 15,000 2,422
Paul Rew 20,000 20,000 548 20,000 20,000 500
* Differences between the entitlements and amounts paid arise due to timing of claims. Where the amount paid exceeds the entitlement for the year, this relates to fees for previous periods.
All Non–Executive Directors who served during 2014–15 were in post as at 31 March 2015.
Pay Multiples
Reporting bodies are required to disclose the relationship between the remuneration of the highest paid director in their organisation and the median remuneration of the organisation’s workforce. Total remuneration includes salary, non–consolidated performance-related pay and benefits in kind. It does not include severance payments, employer pension contributions and the CETV of pensions.
In accordance with HM Treasury guidance, the median pay calculation is limited to employees of the Core Department and Executive Agencies and does not include employees of the NDPBs. The calculation is based on the annualised, full–time equivalent of staff in post as at the reporting date. Similarly, following HM Treasury guidance, the scope of the highest paid director is limited to the Core Department.
The banded remuneration of the highest paid director in Core Defra in the financial year 2014–15 was £160,000–£165,000 (2013–14, £160,000–165,000). This was 5.6 times (2013–14, 5.8 times) the median remuneration of the workforce, which was £29,185 (2013–14, £28,016). The change in the median salary can mainly be attributed to the application of the annual pay award in 2014.
The banded remuneration for staff in Core Defra and the Executive Agencies ranged from £5,000–£10,000 to £160,000–£165,000 (2013–14, £5,000–£10,000 to £210,000–£215,000). The employees receiving the lowest pay in the pay range are employed as apprentices by one of Defra’s Executive Agencies. In 2014–15, no employees (2013–14, 3) received remuneration in excess of the highest paid director.

Department for Environment, Food and Rural Affairs Annual Report and Accounts 2014–15 Chapter 4 – Directors Report: Staff and Remuneration
34
Total remuneration includes salary, non–consolidated performance-related pay and benefits in kind. It does not include severance payments, employer pension contributions and the cash equivalent transfer value of pensions.
Pension Benefits
Ministers
Accrued Pension at Pension Age as
at 31 March 2015
Real Increase in Pension at
Pension Age*CETV at 31 March 2015
*CETV at 31 March 2014
Real Increase in CETV
£000 £000 £000 £000 £000Rt Hon Elizabeth Truss MP 0 - 5 0 - 2.5 22 10 2(from 15 July 2014)
George Eustice MP 0 - 5 0 - 2.5 9 3 3
Dan Rogerson MP 0 - 5 0 - 2.5 8 3 2
Lord de Mauley 5 - 10 0 - 2.5 130 100 17
Ministers who have served during 2014-15, but were not in post as at 31 March 2015 were:
Rt Hon Owen Paterson MP 5 - 10 0 - 2.5 111 100 4 (until 15 July 2014)*Start and end date of CETV is 31 March or date of joining or leaving the Defra Board.
Ministerial Pensions
Pension benefits for ministers are provided by the Parliamentary Contributory Pension Fund (PCPF). The scheme is established under statute (the regulations are set out in Statutory Instrument SI 1993 No 3253, as amended).
Those ministers who are MPs may accrue an MP's pension under the PCPF (details of which are not included in this report). The accrual rate has been 1/40th since 15 July 2002 (or 5 July 2001 for those that chose to backdate the change) but ministers, in common with all other members of the PCPF, can opt for a 1/50th accrual rate for a lower rate of employee contribution. An additional 1/60th accrual rate option (backdated to 1 April 2008) was introduced from 1 January 2010.
Benefits for ministers are payable at the same time as MPs’ benefits become payable under the PCPF or, for those who are not MPs, on retirement from ministerial office from age 65. Pensions are revalued annually in line with pensions increase legislation. From 1 April 2014 members pay contributions between 8.4 percent and 17.9 percent, depending on their level of seniority and chosen accrual rate.
The accrued pension quoted is the pension the minister is entitled to receive when they reach 65, or immediately on ceasing to be an active member of the scheme if they are already 65.
In line with reforms to other public service pension schemes, it is intended to reform the Ministerial Pension Scheme in 2015. The new scheme will be a career average pension scheme, have an accrual rate of 1.775 percent, revaluation based on the change in process, a normal pension age equal to state pension age and a member contribution rate of 11.1 percent.

Department for Environment, Food and Rural Affairs Annual Report and Accounts 2014–15 Chapter 4 – Directors Report: Staff and Remuneration
35
Senior Officials
Accrued Pension as at 31 March 2015 and
Related Lump Sum
Real Increase in Pension and
Related Lump Sum at Pension
Age*CETV at 31 March 2015
*CETV at 31 March 2014
Real Increase in
CETV
Employer Contribution to
Partnership Pension Account
£000 £000 £000 £000 £000 Nearest £100Bronwyn Hill 65 - 70 0 - 2.5 1,344 1,262 14 - Permanent Secretary plus 205 - 210
lump sum plus 2.5 - 5lump sum
Peter Unwin** - - - - - - Director General
Professor Ian Boyd 5 - 10 0 - 2.5 87 51 24 - Director General no lump sum no lump sum
Nick Joicey 20 - 25 2.5 - 5 356 304 32 - Director General plus 70 - 75
lump sum plus 7.5 - 10
lump sum
Alastair Bridges 25 - 30 0 - 2.5 502 466 11 - Finance Director plus 85 - 90
lump sum plus 2.5 - 5lump sum
Betsy Bassis - - - - - 10,700 Director General (from 22 September 2014)
Senior Officials who have served during 2014-15, but were not in post as at 31 March 2015 were:
Ian Trenholm 60 - 65 0 - 2.5 663 643 15 - Director General no lump sum no lump sum
David Webster 65 - 70 0 - 2.5 1,015 1,010 2 - Interim Director General no lump sum no lump sum(from 21 July 2014 to 21 September 2014)
*Start and end date of Cash Equivalent Transfer Value (CETV) is 31 March or date of joining or leaving the Defra Board. **Peter Unwin chose not to be covered by the Civil Service pension arrangements during the reporting year. The actuarial factors used to calculate CETVs were changed in 2014–15. The CETVs at 31 March 2014 and 31 March 2015 have both been calculated using the new factors for consistency.
Civil Service Pensions
Pension benefits are provided through the Civil Service pension arrangements. From 30 July 2007, civil servants may be in one of four defined benefit schemes: either a final salary scheme (Classic, Premium or Classic Plus); or a whole career scheme (Nuvos). These statutory arrangements are unfunded with the cost of benefits met by monies voted by Parliament each year. Pensions payable under Classic, Premium, Classic Plus and Nuvos are increased annually in line with pensions increase legislation. Members joining from October 2002 may opt for either the appropriate defined benefit arrangement or a ‘money purchase’ stakeholder pension with an employer contribution (partnership pension account).
Employee contributions are salary-related and range between 1.5 percent and 6.85 percent of pensionable earnings for Classic and 3.5 percent and 8.85 percent for Premium, Classic Plus and Nuvos. Benefits in Classic accrue at the rate of 1/80th of final pensionable earnings for each year of service. In addition, a lump sum equivalent to three years’ initial pension is payable on retirement. For Premium, benefits accrue at the rate of 1/60th of final pensionable earnings for each year of service. Unlike Classic, there is no automatic lump sum. Classic Plus is essentially a hybrid with benefits for service before 1 October 2002 calculated broadly as per Classic and benefits for service from October 2002 worked out as in Premium. In Nuvos, a member builds up a pension based on pensionable earnings during their period of scheme membership. At the end of the scheme year (31 March), the member’s earned pension account is credited with 2.3 percent of their pensionable earnings in that scheme year and the accrued pension is uprated in line with Pensions Increase Legislation. In

Department for Environment, Food and Rural Affairs Annual Report and Accounts 2014–15 Chapter 4 – Directors Report: Staff and Remuneration
36
all cases members may opt to give up (commute) pension for a lump sum up to the limits set by the Finance Act 2004.
The Partnership Pension Account is a stakeholder pension arrangement. The employer makes a basic contribution of between 3 percent and 12.5 percent (depending on the age of the member) into a stakeholder pension product chosen by the employee from a panel of three providers. The employee does not have to contribute, but where they do make contributions, the employer will match these up to a limit of 3 percent of pensionable salary (in addition to the employer’s basic contribution). Employers also contribute a further 0.8 percent of pensionable salary to cover the cost of centrally–provided risk benefit cover (death in service and ill health retirement).
The accrued pension quoted is the pension the member is entitled to receive when they reach pension age, or immediately on ceasing to be an active member of the scheme if they are already at or over pension age. Pension age is 60 for members of Classic, Premium and Classic Plus and 65 for members of Nuvos. Further details about the Civil Service pension arrangements can be found on the Civil Service Website12.
New career average pension arrangements have been introduced from 1 April 2015 and the majority of Classic, Premium, Classic Plus and Nuvos members have joined the new scheme. Further details of this new scheme are available on the civil service pensions website13.
Cash Equivalent Transfer Values (CETV)
A CETV is the actuarially–assessed capitalised value of the pension scheme benefits accrued by a member at a particular point in time. The benefits valued are the member’s accrued benefits and any contingent spouse’s pension payable from the scheme. A CETV is a payment made by a pension scheme or arrangement to secure pension benefits in another pension scheme or arrangement when the member leaves a scheme and chooses to transfer the pension benefits they have accrued in their former scheme. The pension figures shown relate to the benefits that the individual has accrued as a consequence of their total membership of the pension scheme, not just their service in a senior capacity to which disclosure applies.
CETVs are calculated in accordance with The Occupational Pension Schemes (Transfer Values) (Amendment) Regulations 2008 and do not take account of any actual or potential reduction to benefits resulting from Lifetime Allowance Tax which may be due when pension benefits are taken.
In relation to the senior officials on the Defra Board, the CETV figures include the value of any pension benefit in another scheme or arrangement which the individual has transferred to the Civil Service pension arrangements. They also include any additional pension benefit accrued to the member as a result of their buying additional pension benefits at their own cost.
Real Increase in CETV
For the senior officials on the Defra Board, this reflects the increase in CETV that is funded by the employer. It does not include the increase in accrued pension due to inflation or contributions paid by the employee (including the value of any benefits transferred from another pension scheme or arrangement) and uses common market valuation factors for the start and end of the period.
For ministers, this is the element of the increase in accrued pension funded by the Exchequer. It excludes increases due to inflation and contributions paid by the minister. It is worked out using common market valuation factors for the start and end of the period.
12 http://www.civilservice.gov.uk/pensions 13 http://www.civilservicepensionscheme.org.uk/members/the-new-pension-scheme-alpha/

Department for Environment, Food and Rural Affairs Annual Report and Accounts 2014–15 Chapter 4 – Directors Report: Staff and Remuneration
37
Bronwyn Hill 7 July 2015 Accounting Officer for the Department for Environment, Food and Rural Affairs

Department for Environment, Food and Rural Affairs Annual Report and Accounts 2014–15 Chapter 5 – Director’s Report: Corporate Information
38
Chapter 5 – Directors’ Report: Corporate Information Pension Liabilities
Details of pension liabilities can be found in Note 17 to the Accounts.
Conflicts of Interest
Details of procedures in relation to conflicts of interest can be found in the Governance Statement (Chapter 7).
Auditor
The Comptroller and Auditor General is the auditor for the Department’s Annual Report and Accounts (ARA). The Core Department and the Network Bodies did not purchase any non–audit services from their auditors.
The Accounting Officer has taken all reasonable steps to make herself aware of any relevant audit information and to ensure that the auditor is aware of that information.
Charging and Cost Allocation Policies
As a public sector information holder, Defra has complied with the cost allocation and charging requirements set out in HM Treasury.
Charities Act
Section 70 of the Charities Act sets out a power for ministers to give financial assistance to charitable, benevolent or philanthropic institutions. Defra and its Network Bodies are required to report to Parliament annually any financial assistance given to any charitable institution under the Charities Act. For 2014–15 no such payments were made by Defra or its Network Bodies (2013–14, £Nil).
Financial Position Risks
The main financial risks relate to the administration of the Rural Payment Agency’s (RPA) scheme payments. For further details see Note 11.
Events after the Reporting Period
Details of the events after the reporting period are included within Note 21.
Personal Data Related Incidents
The Defra Network Security and Information Assurance Groups14 work to identify and address information risks, and to promote good and consistent practice. Defra and its Network Bodies monitor the use of removable media devices on Defra laptop computers to protect information. Web blocking and monitoring is in place to block access to undesirable and potentially harmful sites. The Department regularly tests the robustness of the Information and Communications Technology (ICT) Network and annually conducts a code of compliance exercise enabling Defra’s continued connection to the Public Services Network. Mandatory staff training was carried out to improve understanding of the correct information handling procedures and all staff are required to undertake the online Responsible for Information Training Package. Defra’s approach recognises that the vast majority of information handled by the Department is not classified or sensitive, and that our information is held
14 The Defra Network Security and Information Assurance Groups include the Core Department, RPA, Environment Agency (EA), Marine Management Organisation (MMO), Natural England (NE), Animal and Plant Health Agency (APHA), Centre for Environment, Fisheries and Aquaculture Science (Cefas), Food and Environment Research Agency (Fera) and Veterinary Medicines Directorate (VMD).

Department for Environment, Food and Rural Affairs Annual Report and Accounts 2014–15 Chapter 5 – Director’s Report: Corporate Information
39
in a number of different systems across the Network. Defra complies with Her Majesty’s Government information assurance standards and the requirements of the Security Policy Framework.
All government departments are required to publish information about any serious data related incidents, which have to be reported to the Information Commissioner.
Summary of Protected Personal Data Related Incidents Formally Reported to the Information Commissioner’s Office (ICO) by the Core Department and Executive Agencies in 2014–15Date of incident (month)
Nature of incident Nature of data involved
Number of people potentially affected
Notification steps
April 2014 Data used to validate incident response training was unintentionally copied to an unencrypted hard disc drive (HDD). The HDD was lost from a secure APHA office. It is believed to have been disposed of with redundant equipment.
Name, address, postcode, map reference, telephone and a Defra reference number. The records date from 2003 to 2011.
22,569 The data was not current and contained no sensitive information. As there was also no evidence that unauthorised access to the data had taken place, the data subjects were not notified of the loss. The loss was notified to the ICO within 4 working days. Having reviewed the case, the ICO offered advice and decided to take no further action.
Furtheraction on information risk
As an immediate consequence of the incident, unencrypted HDDs were removed from the equipment available from our official IT provider. All staff were reminded of their responsibilities when handling personal data. As a result of the ICO’s advice, unencrypted USB sticks are also no longer available for purchase from Defra’s official supplier.
There was one incident reported to the Information Commissioner by the Forestry Commission (FC). Further information can be found in FC’s ARA.
Incidents recorded centrally within the Department that were deemed by the Data Controller not to fall within the criteria for reporting to the Information Commissioner’s Office are set out in the following table. Small, localised incidents are not recorded centrally. The table below includes the Core Department, Executive Agencies, NDPBs and FC.
Summary of Other Protected Personal Data Related Incidents In 2014–15Category Nature of Incident Total
I Loss of inadequately protected electronic equipment, devices or paper documents from secured government premises 5
II Loss of inadequately protected electronic equipment, devices or paper documents from outside secured government premises 18
III Insecure disposal of inadequately protected electronic equipment, devices or paper documents 0
IV Unauthorised disclosure 9
V Other 1

Department for Environment, Food and Rural Affairs Annual Report and Accounts 2014–15 Chapter 5 – Director’s Report: Corporate Information
40
Health and Safety Reporting
The information for 2014–15 below relates to Core Defra only. The Executive Agencies, NDPBs and FC have their own reporting arrangements, which are detailed in their individual ARAs. Further information can be found in the Governance Statement (Chapter 7).
Reactive Statistic Measurement 2014–15
Reportable incidents (including over 7 days)
Number of incidents reported under Reporting of Diseases and Dangerous Occurrences Regulations (RIDDOR)
0
Lost time accidents (those which are not reportable)
Number of injuries that lead to inability to perform normal work activities for between 1 and 7 days 1
Minor/first aid accidents (all other injuries/ill health not captured above)
Accident with minor injuries that require first aid/no other treatment 21
Total Accidents 22
Near miss incidents (no injury) Incidents defined as potential accidents, uncontrolled hazards, unsafe acts etc., but resulting in no injury or ill health
27
Full time equivalents as at 31 March 2015
Core Defra 2,006
Incident rate per 100,000 employees Reportable incidents/no. of staff x 100,000 n/a
Lost time frequency rate Lost time or medical treatment accidents/hours worked x 1,000,000 0.02
Defra is committed to providing safe conditions of work and has effective management controls in place to ensure the safety, health and wellbeing of employees and others who may be affected by its activities. In order to learn from accidents or near misses, Defra encourages employees to report incidents regardless of the severity or resulting injury. All incidents are reviewed to identify any potential trends or patterns to inform future priorities for improvement.
No incidents were required to be reported to the Health and Safety Executive under RIDDOR, and only one accident resulted in any lost time. Reports due to inadequate workspace set up or poor posture have diminished due to floor walks, reminders and advanced ergonomic assessment processes being available. There has been an overall decrease in actual accidents but an increase in near miss reporting giving a healthier ratio of near misses per employee. This indicates a change to a more positive reporting culture.
The top three causes of accidents in 2014–15 were ‘slips/trips/falls’, ‘contact with a fixed or stationary object’ and ‘collision with people/objects’.
Complaints to the Parliamentary and Health Service Ombudsman (PHSO)
Complaints are received and dealt with at three levels within the Department.
• Level one – at the point where the problem occurred.
• Level two – at a senior level within the relevant business unit.
• Level three – by the Service Standards Complaints Adjudicator.

Department for Environment, Food and Rural Affairs Annual Report and Accounts 2014–15 Chapter 5 – Director’s Report: Corporate Information
41
Most complaints are resolved at levels one and two. Complainants who remain dissatisfied after level three can take their complaint to the Ombudsman.
Core Defra’s complaints procedure can be found online15. Each Defra Network Body has its own complaints procedures which can be viewed on its website.
Between April and December 2014, 75 complaints were made to the PHSO relating to the Defra Network. Please see the breakdown below, provided by PHSO. Data between January and March 2015 will not be available until later in 2015.
Complaints about the Core Department and its Network Bodies between 1 April 2014 and 31 December 2014
Organisation Enquiries received
Complaints assessed
Complaints resolved through
intervention
Complaints accepted for investigation
Investigations upheld or
partly upheld Investigations
not upheld
APHA 2 0 0 0 0 0
CCW 11 3 0 1 0 2
Core Defra1 9 1 0 0 1 0
EA 24 6 0 2 2 0
FC 3 0 0 0 0 0
MMO 2 0 0 0 0 0
NE 13 5 0 4 0 2
RPA 11 2 0 2 5 2
Total 75 17 0 9 8 6
Please note the above figures are preliminary and may alter in the final PHSO report. Investigations of some complaints may have begun in the previous reporting period and concluded in the reporting period above. 1. The Defra enquiries received figure includes the Drinking Water Inspectorate.
Public Appointments for Network Bodies
In 2014–15, the Department made 99 public appointments (76 new appointments and 23 reappointments) regulated by the Office of the Commissioner for Public Appointments across 20 public bodies.
Defra has three chair roles which are subject to pre-appointment scrutiny by the Environment, Food and Rural Affairs Select Committee. These are: the Chair of NE, the Chair of EA and the Chair of the Water Services Regulation Authority.
Research and Development
In 2014–15 Core Defra spent £123m on evidence. Of this, some £71m was for research and development commissioned by the Core Department. Defra’s Network Bodies directly commissioned an additional £37m of research and development in 2014–15.
Core departmental investment maintained a balanced portfolio of evidence for policy, aligned to ministerial priorities. Core analysis and research directly informed policy delivery and operations, supporting effective outcomes from policies. Key areas of spend involved animal health (such as scientific services for national
15 https://www.gov.uk/government/organisations/department-for-environment-food-rural-affairs/about/complaints-procedure

Department for Environment, Food and Rural Affairs Annual Report and Accounts 2014–15 Chapter 5 – Director’s Report: Corporate Information
42
emergencies and animal disease outbreaks); plant health (research on plant pests and diseases, and biosecurity monitoring to meet statutory requirements); marine (for instance, science to underpin Marine Protected Areas and implementation of the Marine Framework Directive); agriculture (including support for innovation in key sectors of the economy such as the agri-food sector); and waste and air quality (for example, identification of further practical and cost effective measures to meet recycling and air quality targets).
Defra published its Evidence Strategy in June 201416. This strategy covers Defra and its Network of Executive Agencies and NDPBs. It sets out the Department’s evidence priorities and the scope of co-operation within the Network and with external providers to maximise access to evidence.
Bronwyn Hill 7 July 2015 Accounting Officer for the Department for Environment, Food and Rural Affairs
16 https://www.gov.uk/government/publications/evidence-strategy-for-defra-and-its-network

Department for Environment, Food and Rural Affairs Annual Report and Accounts 2014–15 Chapter 6 – Non–Executive Director’s Report
43
Chapter 6 – Non–Executive Directors’ Report Context
The last year has again been very busy for the Defra team, with a number of major issues requiring significant input throughout the year, many of which had originated in the previous year. For example, the aftermath of the severe floods from the winter of 2013–14 drove activity around repair and maintenance including the administration of the Repair and Renew Grant scheme and led to continued intensive discussions with the insurance industry on setting up Flood-Re. In addition, year 2 of the pilot badger cull has been carried out in Somerset and Gloucestershire, Common Agricultural Policy (CAP) negotiations reached an outcome, the Water Bill was published and enacted, Government has responded to the Elliot report into horsemeat adulteration and a new Food Crime unit is now operational. Hard won progress has been made on the complex and challenging Common Agricultural Policy Delivery (CAPD) project although much still needs to be done. There were a number of animal/bird health challenges through the year, all of which were successfully controlled and contained.
There have been a number of Board changes in the year, the current Secretary of State was appointed in July 2014. The DG Chief Operating Officer (DGCOO), was appointed in September 2014 and a new DG Policy Delivery, was appointed in March 2015. Within the Department there were a number of director and deputy-director changes. New executive appointments are of a high calibre but it will take time for them to become fully effective. The Non-Executive (NED) team has remained in place throughout the year which we believe has provided valuable continuity and institutional memory.
We are grateful for the engagement and support from people across the Defra network which allows us to make a useful contribution to the work of the Board and Department.
Strategic Clarity of the Department
There has been encouraging progress with the key ‘One Business’ programme in the last few months. This work is to develop a future business model that is more strategic, flexible and resilient by bringing together structures, systems and processes across the Department and its wider network to deliver a better customer experience at a lower cost. The NEDs have had the opportunity to contribute to this work and to offer support and challenge to the senior team.
Organisationally, the recent expansion of the senior executive body to become the Network Executive Committee, incorporating the CEOs of the four main network bodies, is a significant development in the delivery of the ‘One Business’ agenda. The re-alignment of responsibilities at DG level introduced last year has proved to be effective and has simplified accountability and reporting.
Commercial and Financial Capability
We commented last year that the commercial resources of the Department were highly stretched and the situation has continued through this year. There are a number of very challenging commercial projects which demand high levels of business acumen and where there are significant longer term risks and challenges; these include inter-alia, the Thames Tideway Tunnel, the Fera joint venture and the CAPD project. We have provided independent NED input on these projects but are aware that the in-house commercial resource relies on a very few key people, together with the experience of senior officials leading key projects. We know that the Executive Directors recognise the importance of strengthening the commercial capability and the new DGCOO is leading on this for the Department, working with Crown Commercial Services.
The Finance Team has been effective through the year in providing timely and accurate information and there is a continuing good relationship with the Department ARC.

Department for Environment, Food and Rural Affairs Annual Report and Accounts 2014–15 Chapter 6 – Non–Executive Director’s Report
44
Management of Talented People
There has again been a modest improvement in the Engagement Index. The HR Director, appointed last year, is taking a very active role in building internal communications but, as is well known, initiatives in this area take time to feed through to the survey. The development of a ’Vision and Purpose’ statement for Defra will be of great value in building alignment and engagement.
The Nominations Committee, chaired by the Lead NED, has maintained an overview of talent development within the Department and of talent flows into and out of Defra. There has been good progress on talent development and it is pleasing to note that the recently appointed DG Policy Delivery, was promoted from a director post in Defra.
Focus on Results and Implementation
There is a strong focus throughout Defra on meeting operating budget commitments and again this year the final Outturn is within budget. Achieving this outcome requires close and open cooperation across the network; the recent creation of the Network Executive Committee will build further cohesion in this area.
Good progress has been made on the majority of the major projects. However, the CAPD project has faced a number of significant challenges during the year. It is a very complex, challenging and ambitious project with a number of inter-dependent strands of activity and a very tight timetable. One of the key objectives of CAPD is to give farmers direct online access and the ability to modify their own farm data; this strand of the programme is supported by the Government Digital Service (GDS) as a prime example of their ‘digital by default’ strategy. Success in initiatives of this type will be vital in allowing Defra to meet future budget targets and provide improved customer service. Unfortunately, it has not been possible to implement the farmer direct access facility within the required timetable and for 2015–16 a variation of the previous paper based data entry system will be used for applications. Achieving the planned service and benefits from the CAPD project within agreed budget levels must be a key objective for Defra in the next year.
Quality of Management Information
The Board pack has recently been reviewed and updated. The presentation focuses more clearly on the major issues and highlights areas of variance. Back-up information is easily available to allow ‘drilling down’ on areas of particular interest. Introduction of reports by the Permanent Secretary and the DGs into the pack is a welcome innovation.
As mentioned already there is a strong focus on meeting budget commitments across the Defra network and the management information system supports this.
There has been good progress through the year on creating data sets which can be cut in different ways, eg by project, by programme, by supplier etc. There is still work to be done in being able to relate input expenditure to desired outcomes.
Impact of the Board in 2014–15 and Board Effectiveness Reviews
There have been fewer and shorter Board meetings in 2014–15 than in previous years. Due to pressures on ministerial diaries, attendance has declined. The Board Away Day was cancelled as it clashed with a ministerial re-shuffle. The relationship between the NEDs and the Executive Directors has matured and deepened with both team and individual sessions being held regularly. As in previous years a significant amount of our activity was outside formal Board meetings and included, inter-alia, chairing the Audit and Risk and Nomination Committees, attending major project boards (CAPD, Thames Tideway Tunnel, etc), selection panel membership and providing independent input and mentoring as requested.

Department for Environment, Food and Rural Affairs Annual Report and Accounts 2014–15 Chapter 6 – Non–Executive Director’s Report
45
Following last year’s thorough Board Effectiveness Review, we agreed to do a ‘light-touch’ review this year recognising that we are in year four of the Board cycle and that the Board has several new members. The ‘light-touch’ review was carried out by the Lead NED and focused principally on reviewing progress against the agreed actions from the previous report. The conclusion from this year’s review recognised that whilst the Board made little progress against the agreed action plan, it did remain effective with strengthening engagement between the NEDs and Executive Directors. The reduced frequency of meetings has presented real challenges in maintaining Board cohesion and in ensuring timely discussions on major matters. We would like to look again at Board meeting frequency and timing.
Our conclusion after four years of experience is that the ‘Enhanced Departmental Board model’ has proved to be effective and that its effectiveness correlates directly with all Board members achieving an even and consistent level of engagement.
Iain Ferguson Catherine Doran Tony Hawkhead Paul Rew

Department for Environment, Food and Rural Affairs Annual Report and Accounts 2014–15 Chapter 7 – The Accounts
46
Chapter 7 – The Accounts
Statement of Accounting Officer's Responsibilities Under the Government Resources and Accounts Act 2000 (GRAA), HM Treasury has directed the Department for Environment, Food and Rural Affairs to prepare, for each financial year, consolidated resource accounts detailing the resources acquired, held or disposed of, and the use of resources, during the year by the Department (inclusive of its Executive Agencies) and its sponsored Non–Departmental Public Bodies (NDPBs) designated by order made under the GRAA by Statutory Instrument 2014 no. 531 (together known as the ‘Departmental Group’, consisting of the Department and sponsored bodies listed at Note 23 to the Accounts). The Accounts are prepared on an accruals basis and must give a true and fair view of the state of affairs of the Department and the Departmental Group and of the net resource Outturn, application of resources, changes in taxpayers’ equity and cash flows of the Departmental Group for the financial year.
In preparing the Accounts, the Accounting Officer of the Department is required to comply with the requirements of the Government Financial Reporting Manual and in particular to:
• observe the Accounts Direction issued by HM Treasury, including the relevant accounting and disclosure requirements, and apply suitable accounting policies on a consistent basis;
• ensure that the Department has in place appropriate and reliable systems and procedures to carry out the consolidation process;
• make judgements and estimates on a reasonable basis, including those judgements involved in consolidating the accounting information provided by NDPBs;
• state whether applicable accounting standards as set out in the Government Financial Reporting Manualhave been followed, and disclose and explain any material departures in the Accounts; and
• prepare the Accounts on a going concern basis.
HM Treasury has appointed the Permanent Head of the Department as Accounting Officer of the Department for Environment, Food and Rural Affairs. In addition, HM Treasury has appointed an additional Accounting Officer to be accountable for those parts of the Department’s Accounts relating to the Forestry Commission. This appointment does not detract from the Head of Department’s overall responsibility as Accounting Officer for the Department’s Accounts.
The Accounting Officer of the Department has appointed the Chief Executives of the Executive Agencies and sponsored NDPBs as accounting officers of those bodies. The Accounting Officer of the Department is responsible for ensuring that appropriate systems and controls are in place to ensure that any grants that the Department makes to its sponsored bodies are applied for the purposes intended and that such expenditure and the other income and expenditure of the sponsored bodies are properly accounted for, for the purposes of consolidation within the Resource Accounts. Under their terms of appointment, the accounting officers of the sponsored bodies are accountable for the use, including the regularity and propriety, of the grants received and the other income and expenditure of the sponsored bodies.
The responsibilities of an accounting officer, including responsibility for the propriety and regularity of the public finances for which they are answerable, for keeping proper records and for safeguarding the assets of the Department or NDPB for which they are responsible, are set out in Managing Public Money published by HM Treasury.

Department for Environment, Food and Rural Affairs Annual Report and Accounts 2014–15 Chapter 7 – The Accounts
47
Governance Statement This Statement evaluates for the financial year 2014–15 the effectiveness of the Department’s governance arrangements, risk management, and the system of internal control and stewardship of resources. The Statement also reflects the effectiveness of governance arrangements in the Network Bodies17 who deliver many of Defra’s policies and services.
The Department and the Network Bodies have continued to maintain sound governance and internal controls over the last twelve months. Overall, the governance structures and processes, risk management and internal controls within the Defra group including the Network Bodies sponsored by the Department were effective, as confirmed by assurance and audit findings included in this Governance Statement.
Governance Arrangements Governance Structures
Board membership changes in 2014–15 reflect the appointment of a new Secretary of State from July 2014, and a new Director General Chief Operating Officer from September 2014.
The Defra Board met quarterly during 2014–15. Members attended all meetings with the following exceptions: Owen Paterson, Secretary of State, June 2014; Elizabeth Truss, Secretary of State, March 2015; George Eustice, Parliamentary Under-Secretary of State, December 2014, March 2015; Dan Rogerson, Parliamentary Under-Secretary of State, June and December 2014, March 2015; Lord de Mauley, Parliamentary Under- Secretary of State, September 2014; Peter Unwin, Director General, September 2014; Iain Ferguson, Non-Executive Director (NED), September 2014; Catherine Doran, NED, June and September 2014; and Tony Hawkhead, NED, March 2015.
The Board has two sub-committees, the Audit and Risk Committee and the Nomination Committee. During 2014–15 the Audit and Risk Committee’s (ARC) work included scrutiny of the Department’s Annual Report and Accounts; internal and external audit arrangements and results; the Department’s approach to strategic risk and specific strategic risks. In 2014–15 the Nominations Committee considered senior appointments, the Defra Senior Civil Service pay award, review of talent management and succession planning for Non-Executive Directors and Senior Civil Servants.
The Network Executive Committee has high-level oversight of the operational running of the Department and cross-network issues. The membership of the previous Executive Committee was extended from January 2015 to include the CEOs from EA, NE, RPA and APHA.
Quality of Information used by the Board
A management information (MI) pack is provided for each Defra Board meeting which covers operational performance of the Department and its Network. The pack reports on the current and projected financial performance, strategic and major legal risks and performance across the Department and in the main Network Bodies, including all the Executive Agencies, the larger NDPBs and the Forestry Commission. The MI pack is subject to a process of continuous improvement and a review in November 2014 resulted in a revised pack from December 2014. This covers a Group Financial report (including Fraud and Error), a Business Performance report covering strategic risk, commercial projects and contracts; a performance report for each Director General Group in the Department and for each of the main Network Bodies from its CEO. There is a Key Performance Indicators summary showing progress against business plans, the 10 Point Growth plan, Quarterly Data Summaries, human resources, legal risk and complaints.
17 References to Network Bodies refer collectively to Defra’s Executive Agencies, Non–Departmental Public Bodies (NDPBs), Public Corporations and Non-Ministerial Department.

Department for Environment, Food and Rural Affairs Annual Report and Accounts 2014–15 Chapter 7 – The Accounts
48
The Performance of the Board
The Board Effectiveness review carried out by the Lead NED in March 2015 concluded that the Board was broadly effective. It recognised areas of progress in the confidence of the Board in the financial data it receives; support provided by NEDs to the business and their input to challenge groups; improvements made to the Management Information reports; and the work of the Board’s sub-committees. A number of areas for further development were identified: the Board will be looking at long-term planning, strategy, risks, frequency and duration of meetings including better aligning of Board agenda items to priorities.
Compliance with ‘Corporate Governance Code’
Defra is in full compliance with the good practice requirements of the ‘Corporate Governance Code’ for central government departments, except for one area. The Code stipulates that the Nominations Committee should advise on and scrutinise the Department’s implementation of corporate governance policy. However, Defra’s Board have asked the ARC to take on oversight of governance, as they feel the ARC is better placed to take on this responsibility.
Conflicts of Interest
Defra has in place procedures that follow the requirements of the ‘Corporate Governance Code’ to handle conflicts of interest for all Board members. Board members are required on appointment to complete a form listing interests which could emerge as a conflict of interest. There is a standing agenda item at the start of every Board meeting on declarations of interest. Board papers are not circulated to Board members who have declared a specific conflict of interest. Board members with a specific conflict of interest leave the meeting during discussion of that item. A conflict of interest register is maintained for Board members, and during 2014–15 two conflicts of interest were identified and managed in line with these procedures, relating to the Thames Tideway Tunnel project and to the River Thames Flood Alleviation Scheme (Dachet to Teddington).
Governance of Network Bodies
The major organisations that make up the Defra Network are shown in the diagram in Chapter 1. Their governance arrangements, including how they are held to account for their performance by Ministers and the Department, are described in Chapter 1.
Each of the Network Bodies produces its own governance statement in its Annual Report and Accounts. These statements have been reviewed and confirm that governance, risk management and internal controls were generally effective across the Network, and the bodies will address any issues where these are identified. Significant issues are discussed below. The Network Bodies’ governance statements are supported by the Audit Report and Opinions of the Heads of Internal Audit (HIA) for each Network Body and by Defra’s Group Chief Internal Auditor’s Opinion which confirms that governance and controls were effective in most respects.
The Department is actively assessing options to ensure it has the right capabilities in future from its science and operational agencies. Major changes were announced at the end of April 2014. The inspectorate functions of the Food and Environment Research Agency (Fera) (Bee Inspectorate, the Plant Health and Seeds Inspectorate, and the GM Inspectorate) together with the Plant Variety and Seeds Group joined the Animal Health and Veterinary Laboratories Agency (AHVLA) to form a merged agency from October 2014 called the Animal and Plant Health Agency (APHA). APHA will maintain and enhance our operational effectiveness, flexibility and emergency response capability and be better placed to respond to the challenges ahead.
On 31 March 2015, Defra transferred the remainder of Fera to Fera Science Ltd (FSL), and sold 75 percent of the equity in FSL to Capita plc. This has established a new joint venture in the private sector for Fera’s science work. This investment will enable FSL to continue to provide services that are critical in supporting the government’s response to plant health risks and improve Fera’s ability to develop its growing commercial activities.

Department for Environment, Food and Rural Affairs Annual Report and Accounts 2014–15 Chapter 7 – The Accounts
49
The new Network Corporate Services directorate was launched on 1 October 2014 and aims to deliver corporate services in a new, streamlined way, whilst improving systems and processes and releasing cash by reducing duplication. Since its creation, the Directorate brought together five network organisations for Estates and four for Procurement and ICT services. Network Corporate Services continues to evolve, reorganise work, and integrate teams to focus on key priorities. This has included ICT forming a separate Digital, Data and Technology Services directorate and the addition of Commercial functions and Knowledge and Information Management functions to Network Corporate Services.
Local Government
The Department provides a number of grants to local authorities, for example for flood prevention or waste recycling work. In accordance with the Government’s policy, these grants are not ring-fenced. However, there is a robust audit process in place for such funds through the accountability requirements placed on local authorities.
The Department for Communities and Local Government’s Accounting Officer provides the assurance that a core framework is in place that requires local authorities to act with regularity, propriety and value for money in the use of these resources. Within this core framework, local authorities are responsible and accountable for the legal use of funds, and every local authority has a responsibility to make arrangements for the proper administration of their financial affairs and to ensure that one of their officers has responsibility for the administration of those affairs. A system of legal duties requires councillors to spend money with regularity and propriety. Local authorities are also required to have an annual external audit, and the certification of authorities’ annual accounts by the auditor provides general assurance that the totality of their expenditure is within their legal powers. Local authority auditors also assess whether authorities have used their resources effectively. As well as the accountability provided through this core framework, specific Defra grants are often provided in recognition of a statutory obligation on local authorities to perform a function or provide a service. These accountability arrangements are explained in more detail in Defra’s ‘Accountability Systems Statement’18.
Risk Management Defra’s risk management processes are described in Chapter 1 and the Department believes they are effective.
The Network Executive Committee and the Risk Panel have systematically reviewed risk assessments and risk management plans for twenty risks in Defra’s strategic risk portfolio. The portfolio was formally adopted by the Board in June 2014 and monitoring information has been provided at subsequent Board meetings. Defra’s emergency management arrangements have been activated to help us respond effectively to two notifiable exotic animal disease outbreaks (of avian influenza in November 2014 and February 2015).
The Department is responsible within government for 3 projects that form part of the Government’s Major Projects Portfolio: Thames Estuary Asset Management 2100 (led by the Environment Agency); Thames Tideway Tunnel (led by Thames Water Utilities Ltd.); and the Common Agricultural Policy Delivery (CAPD) Programme (led by Defra). These expose Defra to a complex mix of commercial and delivery risks and have been considered by the Board and the Executive Committee during the year. More information about these projects is provided later in this Statement.
During 2014–15 the main improvement in risk handling involved a radical overhaul of our approach to the escalation and assessment of biosecurity risk. We have introduced one common methodology for risk assessment across the Defra Network, enabling the very different types of biosecurity risk (animal disease, plant disease, aquatic disease and risks from invasive non-native species) to be assessed relative to each other and actions agreed. A monthly biosecurity meeting, involving Defra Ministers and senior officials, with the relevant experts, including the Chief Veterinary Officer, Chief Plant Health Officer and Chief Scientific Adviser, now provides improved strategic oversight of biosecurity risk.
18 https://www.gov.uk/government/organisations/department-for-environment-food-rural-affairs

Department for Environment, Food and Rural Affairs Annual Report and Accounts 2014–15 Chapter 7 – The Accounts
50
Stewardship of Resources The system of internal control which has been in place in Defra for the year ended 31 March 2015 and up to the date of approval of the Annual Report and Accounts, accords with HM Treasury guidance19, and has been effective. This conclusion is informed by the work of internal and external auditors, and by executive managers within the Department who have responsibility for the development and maintenance of the internal control framework and who provide a formal annual assurance statement on the system of internal control and report areas of weakness.
The Department’s financial performance is described in Chapter 3. During 2014–15 the Department has delivered an ambitious set of Structural Reform Plan actions, reduced its public expenditure and managed its budgets effectively within the voted limits set for it by Parliament. The Department spent 98 percent of its Capital DEL Budget. This was achieved by rigorous prioritisation of investment, largely in vital infrastructure projects to protect communities against the risks of flood and coastal erosion. The Capital Budget has also contributed to essential maintenance of Defra’s estate, improvement to our science laboratories and ICT related business change programmes. The Department has continued to make good progress with delivering the savings and reforms set out in the 2010 Spending Review (SR10). Compared to the SR10 baseline (2010–11) set by HM Treasury, DEL expenditure in 2014–15 was £568m lower, which is a reduction of 18 percent in nominal terms, including 36 percent on Administration expenditure. The Department has continued to work to ensure that its financial management activity and capability supports wider decision making.
Defra has continued to maintain capability in the Department and its Network Bodies in business planning and performance management so that resources are allocated effectively to deliver outcomes the Department is seeking, and to ensure value for money.
Internal Audit Opinion Our Group Chief Internal Auditor has confirmed in his Assurance Opinion for 2014–15, that he is able to provide moderate assurance that the Defra group including the network of bodies sponsored by the Department had adequate and effective risk management, control and governance processes in operation in respect of the year ending 31 March 2015. His Assurance Opinion for the CAP Delivery programme, however, was limited and this is covered in more detail below under ‘Significant Issues’.
Governance and Control Issues Ministerial Direction
Secondary legislation has been laid in Parliament to establish the Flood Re scheme to help ensure households at high risk of flooding can obtain affordable flood insurance. Defra’s analysis of Flood Re is that, although a desirable policy, the costs of the scheme are expected to outweigh the quantifiable economic benefits achieved. However, it is recognised that other social and economic factors are not fully reflected in the strict value for money calculation, particularly the impact on individuals and the wider housing market of uncertainty about the availability and affordability of insurance. A Ministerial Direction has been sought and received from the Secretary of State to proceed with the policy of Flood Re.
Whistleblowing
Defra is committed to high standards of integrity, honesty and professionalism in all that it does. These standards are reinforced by our Ways of Working Statement, and we encourage our employees to use the whistleblowing procedures to raise concerns about a past, present or imminent wrongdoing within Defra or conflicts with the Civil Service Code. The Department implemented the Civil Service Employee Policy (CSEP) model policy in January 2013 across Core Defra and its Executive Agencies. This has been regularly refreshed, in line with CSEP recommendations.
19 HM Treasury’s Managing Public Money available online at https://www.gov.uk/government/publications/managing-public-money

Department for Environment, Food and Rural Affairs Annual Report and Accounts 2014–15 Chapter 7 – The Accounts
51
Mechanisms were established at the launch of the policy to ensure that all cases in Core Defra and the Executive Agencies are reported to a central point. We subsequently asked Non–Departmental Public Bodies in November 2014 to amend their procedures to inform the Department of any whistleblowing cases they received. This brought together a streamlined process for raising a concern.
The Department’s policy was updated in December 2014 to take account of the changes made by CSEP to reflect the PAC recommendations. The National Audit Office has assessed Defra’s whistleblowing procedures as satisfactory or better in the NAO Investigation Report ‘Government Whistleblowing Policies (January 2014)’ 20.
Information Management
Defra and its Network Bodies continue to take a proportionate approach to the management of security risks in line with the low volume of sensitive and personal information handled. Information assurance (IA) returns during 2014–15 indicate that there has been some further improvement in IA maturity overall. There was one significant data loss reported during 2014–15, a personal data related incident which is recorded in more detail in Chapter 5.
Government Major Projects Portfolio
Details of Defra’s major projects are in Chapter 2. In terms of governance, the Department has continued to strengthen the assurance, approvals and reporting regime around its major projects, by including additional checks at project inception and prior to business case approval, in particular:
• Project Validation Review: This takes place at project initiation to test project rationale, the proposed delivery framework and that appropriate capability and capacity is resourced from the outset;
• ‘Red Team’ review of business cases by subject experts provides independent assurance against key Accounting Officer tests that the business case is fit to proceed; and
• Quarterly reporting to the Defra Board on our portfolio of major projects and contracts.
Business Critical models
Defra continues to implement the recommendations of the 2013 Macpherson Review of business critical models and their quality assurance. Defra were active contributors to the production of the Analytical Quality Assurance guide published in March 2015 and have promoted its use across the Defra Network. We are using the guidance as part of a consistent framework for assurance of evidence across the Defra Network. A list of all business critical models21 used within the Department and its Network Bodies will be publicly available from September 2015. Each business critical model has a senior responsible owner who is responsible for effective quality assurance.
Business Continuity Plans
Business Continuity Plans are in place and there have been exercises to test them. The Defra Executive Committee held an exercise in September 2014. Further work is being done to develop a fully co-ordinated approach across the Network.
Facilities Management
Facilities Management (FM) Services are provided by a third party contractor. The Department, all 5 Executive Agencies and Natural England are now into the sixth year of a fifteen year contract. Since the start of the contract, there have been a number of efforts to improve service including a contract negotiation in 2012 that was designed to address inconsistencies in the original contract, deliver savings and improve contract
20 http://www.nao.org.uk/report/government-whistleblowing-policies/ 21 https://www.gov.uk/government/uploads/system/uploads/attachment_data/file/328628/defra-business-critical-models-ara-2014.pdf

Department for Environment, Food and Rural Affairs Annual Report and Accounts 2014–15 Chapter 7 – The Accounts
52
management through updated key performance indicators and a much tougher remedy regime. The adoption of recommendations arising from Internal Audit reviews and a National Audit Office investigation into management of the FM contract has assisted the improvement in performance. The completion of an audit of the cost statement for year 3 of the contract has identified that overpayments have been made against the target price set for the first three years of the contract. A financial settlement has been made by the Facilities Management supplier.
Health and Safety
In previous years, FM issues have been raised by Executive Agencies. The Audit and Risk Committee and the Group Chief Internal Auditor have drawn attention to concerns about the quality of service provided by the Department’s Facilities Management supplier. The impact of poor service has been felt most in the laboratory-based agencies, and has been a particular concern in respect of health and safety. While work is still needed to ensure an acceptable standard of service is delivered, the Group Chief Internal Auditor has observed improvements in the management and monitoring of the contract by the centralised Defra Estates function over the course of the year. However, more remains to be done particularly at Fera’s Sand Hutton site where aspects of the Facilities Management supplier’s performance remain inadequate. An internal audit report identified significant control weaknesses that need to be addressed and which pose risks to the health and safety, operational reliability and biosecurity. These issues are being tackled and actions agreed are being implemented.
Health and Safety at the Animal and Plant Health Agency (APHA) was strengthened during 2014–15 with 4 Biorisk Advisors joining the agency. In 2014–15, AHVLA (now part of APHA) was subject to a Crown Prohibition Notice by the Health and Safety Executive (HSE) as a consequence of having no validated certification for the decontamination of one laboratory. This did not present a risk to staff or the public. It did require the closure of the laboratory for several weeks which caused delay in producing bovine TB test results and informing farmers about restrictions on cattle movements. Actions have been taken to ensure this does not happen again.
Shared Services Connected Limited
Steria Limited and the Cabinet Office launched a joint venture company, Shared Services Connected Limited (SSCL), in November 2013 as part of the Government’s Next Generation Shared Services programme. SSCL was formed with staff delivering a range of shared services transferring from 3 initiating organisations, (Department for Work and Pensions, Department for Environment, Food and Rural Affairs and the Environment Agency (EA)) under the Transfer of Undertakings Protection of Employment (TUPE) regulations, to SSCL. We have liaised with the Crown Oversight Function about the provision and scope of assurance available on SSCL’s controls and performance, and in addition to key performance indicator results, we are able to take assurance from the audit conducted by independent auditors which provides reasonable assurance that the overall process controls have been suitably designed and have operated effectively. For certain specific issues including Fraud and Error and data security, aspects of assurance provided by internal audit were limited, and we are following up to ensure that actions needed have been taken.
Single Operating Platform
The Single Operating Platform (SOP) is a complex Cabinet Office coordinated ICT change programme. The focus of the initiative is to upgrade the existing Oracle platform and associated systems for HR, Finance and Procurement in Defra and other participating government departments. The Single Operating Platform is being developed through the Cabinet Office selected technology partner SSCL, supported by Fujitsu. Defra is leading the SOP for the Department, Executive Agencies and some NDPB’s and the Department for Energy and Climate Change. The Environment Agency will also be moving to the SOP and are planning to do so at the end of July 2015. The SOP is designed to reduce cost, enhance efficiencies and drive converged ways of working for all participating customers across Government.
SSCL failed to provide a technical solution and delivery plan for SOP implementation that Defra was happy to approve, and subsequently Defra placed SSCL into formal rectification. Following extensive joint effort, SSCL have now provided a solution and implementation date that are acceptable to Defra. The agreed solution focuses on a phased approach to rolling out the functionality included in the SOP, which will allow Defra time to

Department for Environment, Food and Rural Affairs Annual Report and Accounts 2014–15 Chapter 7 – The Accounts
53
manage the required business change activity without disrupting our daily operations. The initial phase is now contractually set to go live on 30 November 2015, with all delivery to be completed no later than 30 November 2016.
Significant Issues Disallowance
Disallowance penalties are imposed by the European Commission as a result of problems with the administration of EU schemes including those under the CAP. More detailed background on these penalties is set out in Chapter 3. For 2014–15, the Department have accepted and accrued £90m (gross) of disallowance penalties. The Comptroller and Auditor General has qualified his opinion on the regularity of Defra’s Accounts because of the recognition of these disallowance penalties.
CAP Delivery Programme
Implementation of new CAP schemes started in 2014–15. The initial releases of the Rural Payments and the finance systems were delivered on schedule in July 2014 and just over 81,000 business registrations were completed through an on line process, by 31 March 2015. However, a decision was taken in mid-March 2015 to switch for this year (2015) from online applications by farmers for the new Basic Payment Scheme (BPS) to the use of established forms and processes to complete their claims. The online portal will continue to be developed for use in later years. Impairment costs of £5.2m have been incurred mainly because of technical issues or the decision not to use a number of IT features developed for operation in the year ending 31 March 2015.
The decision in March was taken by Defra and RPA working closely together because there were performance problems with the new online interface in particular in relation to checking and amending land details, and doubts about whether these issues could be resolved in time for the EU claims deadline in May. The European Commission subsequently offered Member States some flexibility by extending the deadline for claims to 15 June, which has been taken up in England. By that date 85,526 farmers had submitted their BPS applications. The RPA is contacting customers who are eligible to apply but have not yet submitted their claim.
The Agency has the resources it needs to input farmers’ claims onto the system so that it will be able to make payments to farmers from the start of the EU payment window in December 2015.
Introduction of the new CAP schemes is being taken forward by the CAP Delivery programme. Our Group Chief Internal Auditor has identified that during 2014–15 there were deficiencies in the overall governance of this programme. The consequences of this included some key decisions on design and delivery taken outside of the agreed programme governance without a clear trail to show the full consideration of the financial and business impacts. From January 2015, the SRO was required to report actions to address these issues to the Executive Committee. Since then we have continued to strengthen the governance of the programme and clarify the control ownership, including through the appointment in May of a single SRO with overall responsibility for delivery of the programme and for management of the budget.
Bronwyn Hill 7 July 2015 Accounting Officer for the Department for Environment, Food and Rural Affairs

Department for Environment, Food and Rural Affairs Annual Report and Accounts 2014–15 Chapter 7 – The Accounts
54
The Certificate of the Comptroller and Auditor General to the House of Commons
I certify that I have audited the financial statements of the Department for Environment, Food and Rural Affairs and of its Departmental Group for the year ended 31 March 2015 under the Government Resources and Accounts Act 2000. The Department consists of the Core Department and its Agencies. The Departmental Group consists of the Department and the bodies designated for inclusion under the Government Resources and Accounts Act 2000 (Estimates and Accounts) Order 2014. The financial statements comprise: the Department’s and Departmental Group’s Statements of Comprehensive Net Expenditure, Financial Position, Cash Flows, Changes in Taxpayers’ Equity; and the related notes. I have also audited the Statement of Parliamentary Supply and the related notes. These financial statements have been prepared under the accounting policies set out within them. I have also audited the information in the Remuneration Report that is described in that report as having been audited.
Respective Responsibilities of the Accounting Officer and Auditor
As explained more fully in the Statement of Accounting Officer’s Responsibilities, the Accounting Officer is responsible for the preparation of the financial statements and for being satisfied that they give a true and fair view. My responsibility is to audit, certify and report on the financial statements in accordance with the Government Resources and Accounts Act 2000. I conducted my audit in accordance with International Standards on Auditing (UK and Ireland). Those standards require me and my staff to comply with the Auditing Practices Board’s Ethical Standards for Auditors.
Scope of the Audit of the Financial Statements
An audit involves obtaining evidence about the amounts and disclosures in the financial statements sufficient to give reasonable assurance that the financial statements are free from material misstatement, whether caused by fraud or error. This includes an assessment of: whether the accounting policies are appropriate to the Department’s and the Departmental Group’s circumstances and have been consistently applied and adequately disclosed; the reasonableness of significant accounting estimates made by the Accounting Officer; and the overall presentation of the financial statements. In addition I read all the financial and non-financial information in the Annual Report to identify material inconsistencies with the audited financial statements and to identify any information that is apparently materially incorrect based on, or materially inconsistent with, the knowledge acquired by me in the course of performing the audit. If I become aware of any apparent material misstatements or inconsistencies I consider the implications for my certificate.
I am required to obtain evidence sufficient to give reasonable assurance that the Statement of Parliamentary Supply properly presents the Outturn against voted Parliamentary control totals and that those totals have not been exceeded. The voted Parliamentary control totals are Departmental Expenditure Limits (Resource and Capital), Annually Managed Expenditure (Resource and Capital), Non-Budget (Resource) and Net Cash Requirement. I am also required to obtain evidence sufficient to give reasonable assurance that the expenditure and income recorded in the financial statements have been applied to the purposes intended by Parliament and the financial transactions recorded in the financial statements conform to the authorities which govern them.
Basis for Qualified Opinion on Regularity
The European Commission has confirmed disallowance penalties of £90m. These disallowance penalties represent a material loss to the UK Exchequer. I consider that this loss falls outside of Parliament’s intentions in relation to proper administration of European funding and is therefore irregular.
Qualified Opinion on Regularity
In my opinion, except for the confirmed disallowance penalties described in the basis for qualified opinion on regularity paragraph, in all material respects:

Department for Environment, Food and Rural Affairs Annual Report and Accounts 2014–15 Chapter 7 – The Accounts
55
• the Statement of Parliamentary Supply properly presents the Outturn against voted Parliamentary control totals for the year ended 31 March 2015 and shows that those totals have not been exceeded; and
• the expenditure and income recorded in the financial statements have been applied to the purposes intended by Parliament and the financial transactions recorded in the financial statements conform to the authorities which govern them.
Opinion on Financial Statements
In my opinion:
• the financial statements give a true and fair view of the state of the Department’s and the Departmental Group’s affairs as at 31 March 2015 and of the Department’s net operating cost and Departmental Group’s net operating cost for the year then ended; and
• the financial statements have been properly prepared in accordance with the Government Resources and Accounts Act 2000 and HM Treasury directions issued thereunder.
Opinion on Other Matters
In my opinion:
• the part of the Remuneration Report to be audited has been properly prepared in accordance with HM Treasury directions made under the Government Resources and Accounts Act 2000; and
• the information given in the Strategic Report and Directors’ Report for the financial year for which the financial statements are prepared is consistent with the financial statements.
Matters on Which I Report by Exception
I have nothing to report in respect of the following matters which I report to you if, in my opinion:
• adequate accounting records have not been kept or returns adequate for my audit have not been received from branches not visited by my staff; or
• the financial statements and the part of the Remuneration Report to be audited are not in agreement with the accounting records and returns; or
• I have not received all of the information and explanations I require for my audit; or
• the Governance Statement does not reflect compliance with HM Treasury’s guidance.
Sir Amyas C E Morse 9 July 2015 Comptroller and Auditor General National Audit Office 157–197 Buckingham Palace Road Victoria, London SW1W 9SP

Department for Environment, Food and Rural Affairs Annual Report and Accounts 2014–15 Chapter 7 – The Accounts
56
The Report of the Comptroller and Auditor General to the House of Commons Introduction
The Department for Environment, Food and Rural Affairs (the Department) develops and implements policy relating to the environment, food and rural issues. It is also responsible for negotiating European agricultural and rural policy and related funding on behalf of the UK. The Department receives funding from the European Commission (the Commission) to deliver the Common Agricultural Policy (CAP) and other initiatives - some £3.1bn in 2014–15 (2013–14 £3.4bn). CAP schemes covering 2007–13 are winding down, with new CAP schemes for 2014–20 commencing during the 2014–15 financial year.
Purpose of This Report
This report explains the nature of the Department’s disallowance qualification. It looks at the progress the Department has made in addressing the issues encountered when implementing the previous CAP (CAP 2007–13) that give rise to this qualification. I have also set out an overview of the actions being taken by the Department to manage future risks in the context of significant CAP reforms (CAP 2014–20). Further information is provided in my report ‘Managing disallowance risk’ (HC 306).
Qualified Opinion on Regularity - Financial Penalties Arising from Commission-Funded Schemes
Until 2011–12, I qualified my audit opinion on regularity as a result of material financial penalties incurred by the Department and accrued in the financial statements. The requirement to pay financial penalties (’disallowance’), where Commission-funded scheme regulations are not correctly applied, results in a loss to the UK Exchequer that is recognised within the financial statements of the Department. This loss is outside Parliament’s intentions in relation to the proper administration of European funding and is therefore considered irregular. I did not qualify my audit opinion on regularity for 2012–13 and 2013–14 as penalties accrued in year were not considered to be material. In 2014–15, penalties accrued in year, at £90m, returned to material levels. I have therefore qualified my opinion on regularity on the 2014–15 financial statements.
Financial Penalties Reported to 2014–15
Financial penalties are incurred when the Commission takes the view that the detailed scheme regulations have not been applied correctly in processing Commission-funded transactions. These penalties are deducted from the Department’s future funding from the Commission and are known as disallowance.
Due to the nature of disallowance, penalties are not incurred in the financial year of scheme payments, but in subsequent years once the Commission has completed its reviews. As the process of Commission reviews progresses the likelihood of disallowance penalties becomes known and is reflected in the financial statements. I qualify my regularity opinion on the accounts when disallowance penalties are confirmed and therefore reasonably certain. In practice this is when the Commission has notified a penalty which the Department will not contest. This is the same point at which the Department reflects the likely disallowance in the financial statements as an accrual. The value of penalties accrued in 2014–15, and deemed irregular expenditure, is £90m (2013–14: £42m). This comprises 2010 to 2013 Single Payment Scheme penalties. I consider this to be material in the context of the £6.3bn of expenditure recognised in the Department’s financial statements and the £3.1bn of Commission-funded expenditure managed by the Department.
The Department also includes a provision in its financial statements for disallowance penalties which are probable but not yet confirmed. The Department’s 2014–15 financial statements include a provision for £65m in respect of estimated future disallowance penalties (2013–14: £84m). These penalties remain subject to challenge and so are not yet sufficiently certain to be accrued. This mainly relates to 2014 Single Payment Scheme penalties and cross compliance scheme audits relating to years 2010 to 2012, for which the Department currently expects financial correction of around £30m and £22m respectively.
Department for Environment, Food and Rural Affairs Annual Report and Accounts 2014–15 Chapter 7 – The Accounts
57
The total cumulative value of disallowance penalties recognised in the Department’s financial statements to 31 March 2015 is £642m, which relates to the 2007–13 Single Payment Scheme, a number of smaller 2007–13 schemes and pre-2007 predecessor schemes. CAP 2014–20 schemes have not yet been subject to review by the Commission, and so levels of likely disallowance are not known.
Future Financial Penalties
For historic scheme expenditure which the Commission is yet to review, the Department is not able to reliably estimate the disallowance penalties that may arise and, therefore, no liability is included in the financial statements. The Department’s current expectation is that disallowance penalties incurred for schemes under the CAP 2007–13, which has now drawn to a close, will be fully calculated and settled by 2019–20. The Commission has recently announced that it intends to complete all of its audits within two years of the end of a scheme year. There is therefore a risk of a bunching effect as outstanding cases of CAP 2007–13 reach conclusion, while new cases from CAP 2014–20 are concluded more quickly.
Managing Disallowance Risk
I have considered the Department’s management of disallowance risk throughout the CAP 2007–13 in my report ‘Managing disallowance risk’ (HC 306), published in July 2015. This report provides further information about what the CAP is, how the Department administers it in the UK and how disallowance penalties arise. It also considers the underlying causes of disallowance in England, future disallowance risk and how the Department manages this risk.
The Department and the Rural Payments Agency have made good progress over the last year in their approach to disallowance. They have strengthened governance across organisations administering the CAP, improved understanding of the key drivers of disallowance, developed systems and processes to manage disallowance risk, adopted a more proactive approach with the Commission, and improved management information. Nevertheless, there are persistent problems, chief of which has been deficiencies in mapping capabilities. The Commission has recently introduced new mapping requirements and controls in the current CAP and increased its focus on mapping issues. The Department is addressing this by exploring options for additional investment to reduce disallowance risk.
Common Agricultural Policy Reforms
The problems experienced by the Department in implementing CAP 2007–13 reforms undoubtedly contributed to the level of disallowance penalties incurred. The Commission recently reformed the CAP, with the majority of the new regulations coming into force from 2015. The Department has been working with its agencies and other delivery bodies to ensure that the new schemes are successfully delivered. The Department considers CAP 2014–20 to be more complex and subject to more stringent control requirements than CAP 2007–13.
The Department established the CAP delivery programme (the programme) to deliver CAP 2014–20. The programme incorporates the procurement, development and implementation of new systems. Delivery of the programme is critical to the successful provision of CAP reform: to correctly apply scheme regulations to pay claimants accurately and efficiently; and to minimise disallowance penalties going forward.
The programme is currently behind schedule and despite good progress on registrations, customers experienced issues with the initial release of the online service, in particular the portal and land mapping functionality. As at 31 March 2015, the total IT expenditure under the Programme was £97.6m, of which £69m was capitalised, against an overall forecast for the life of the project of £155m set out in the original Full Business Case. As a result of the issues identified, the Department has written-off £5.2m of this capitalised expenditure, with a review of the Programme’s business case and delivery model underway.
It is clear that the Department still has much to do to address the ongoing issues and to ensure it delivers value for money in its implementation of CAP reform. I will be looking at this issue again as part of a value for money report on CAP reform and the Programme, which I intend to publish in 2016.

Department for Environment, Food and Rural Affairs Annual Report and Accounts 2014–15 Chapter 7 – The Accounts
58
Sir Amyas C E Morse 9 July 2015 Comptroller and Auditor General National Audit Office 157–197 Buckingham Palace Road Victoria, London SW1W 9SP

Department for Environment, Food and Rural Affairs Annual Report and Accounts 2014–15 Chapter 7 – The Accounts
59
Statement of Parliamentary Supply In addition to the primary statements prepared under International Financial Reporting Standards (IFRS), the Government Financial Reporting Manual (FReM) requires Defra to prepare a Statement of Parliamentary Supply (SoPS) and supporting notes to show Resource Outturn against the Supply Estimate presented to Parliament, in respect of each budgetary control limit.
Summary of Resource and Capital Outturn 2014–15 The table below includes the results for the Core Department, Executive Agencies, Forestry Commission and Non–Departmental Public Bodies (NDPBs).
2014-15 2013-14
Note Estimate
Voted Outturn
Voted
Voted Outturn
Compared With
Estimate: Saving/
(Excess) Outturn
Total £000 £000 £000 £000
Departmental Expenditure Limit Resource SoPS 2.1 1,918,930 1,906,615 12,315 1,951,279 Capital SoPS 2.2 651,307 638,011 13,296 482,330
Annually Managed Expenditure Resource SoPS 2.1 278,215 77,998 200,217 (94,479) Capital SoPS 2.2 3,000 1,637 1,363 (743)Total 2,851,452 2,624,261 227,191 2,338,387
Non Budget Non Budget SoPS 2.1 15,000 5,724 9,276 113,281 Total 2,866,452 2,629,985 236,467 2,451,668
Total Resource SoPS 3.1 2,197,145 1,984,613 212,532 1,856,800 Total Capital SoPS 2.2 654,307 639,648 14,659 481,587 Total Non Budget SoPS 3.1 15,000 5,724 9,276 113,281 Total 2,866,452 2,629,985 236,467 2,451,668
The 2014–15 figures above are voted totals subject to Parliamentary control. In addition, although not a separate voted limit, any breach of the Administration Budget will also result in an excess vote.
There was no non–voted provision in the Estimate and no non–voted expenditure was incurred.
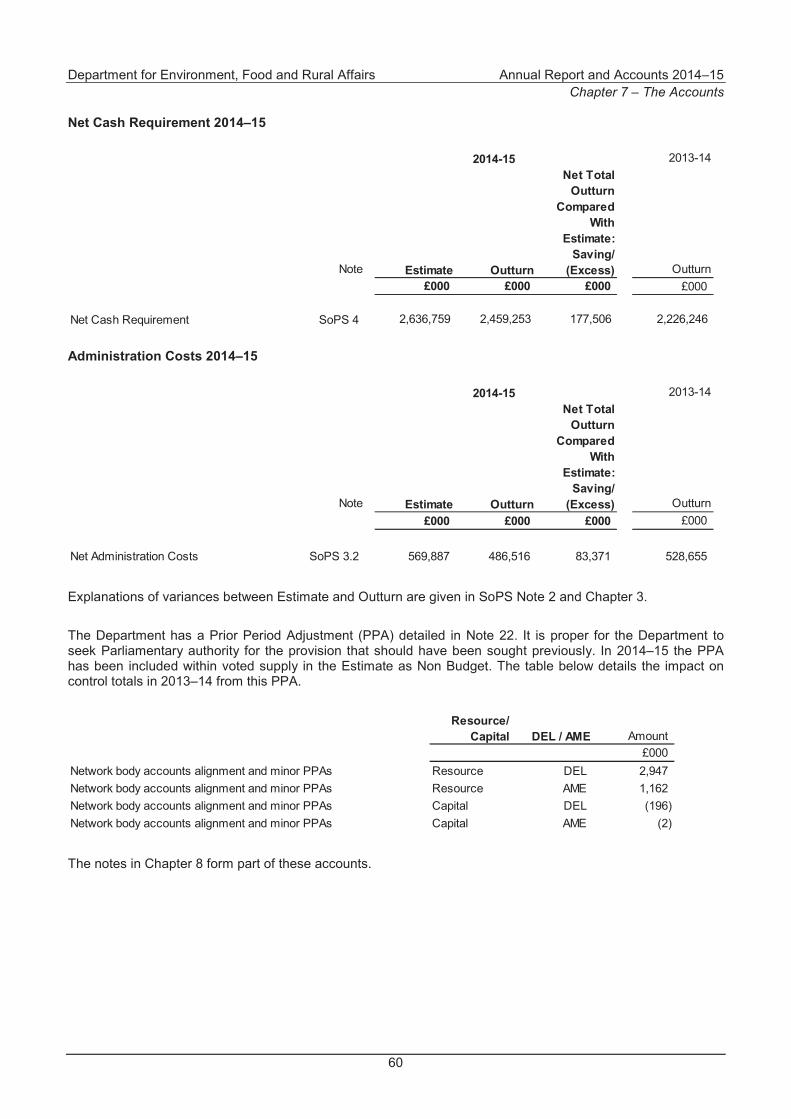
Department for Environment, Food and Rural Affairs Annual Report and Accounts 2014–15 Chapter 7 – The Accounts
60
Net Cash Requirement 2014–15
2014-15 2013-14
Note Estimate Outturn
Net Total Outturn
Compared With
Estimate: Saving/
(Excess) Outturn £000 £000 £000 £000
Net Cash Requirement SoPS 4 2,636,759 2,459,253 177,506 2,226,246
Administration Costs 2014–15
2014-15 2013-14
Note Estimate Outturn
Net Total Outturn
Compared With
Estimate: Saving/
(Excess) Outturn £000 £000 £000 £000
Net Administration Costs SoPS 3.2 569,887 486,516 83,371 528,655
Explanations of variances between Estimate and Outturn are given in SoPS Note 2 and Chapter 3.
The Department has a Prior Period Adjustment (PPA) detailed in Note 22. It is proper for the Department to seek Parliamentary authority for the provision that should have been sought previously. In 2014–15 the PPA has been included within voted supply in the Estimate as Non Budget. The table below details the impact on control totals in 2013–14 from this PPA.
Resource/ Capital DEL / AME Amount
£000Network body accounts alignment and minor PPAs Resource DEL 2,947 Network body accounts alignment and minor PPAs Resource AME 1,162 Network body accounts alignment and minor PPAs Capital DEL (196)Network body accounts alignment and minor PPAs Capital AME (2)
The notes in Chapter 8 form part of these accounts.
Department for Environment, Food and Rural Affairs Annual Report and Accounts 2014–15 Chapter 7 – The Accounts
61
Notes to the Departmental Accounts (SoPS) SoPS 1 Statement of Accounting Policies
The FReM requires the Department to prepare an additional primary statement. The SoPS and supporting notes show Outturn against Estimate in terms of the net resource requirement and net cash requirement. These have been prepared in accordance with the 2014–15 FReM issued by HM Treasury. The SoPS accounting policies are consistent with the requirements set out in the 2014–15 Consolidated Budgeting Guidance and Supply Estimates Guidance Manual.
SoPS 1.1 Accounting Convention
The SoPS and supporting notes have been prepared consistently with HM Treasury budgetary control and supply Estimates. These are compiled on a consistent basis to National Accounts. Estimates comply with the European System of Accounts (ESA95), the accounting basis for all National Accounts in the EU.
The SoPS is a parliamentary accounting statement and consequently has different objectives to the IFRS based financial statements. The budgeting system supports the achievement of macro-economic stability by ensuring that public expenditure is controlled, with relevant parliamentary authority, in support of the Government’s fiscal framework. The system provides incentives to departments to manage spending well so as to provide high quality public services that offer value for money to the taxpayer.
SoPS 1.2 Comparison between SoPS and the IFRS based Financial Statements
Many transactions are treated in the same way in National Accounts and IFRS based financial statements, but there are some significant differences. A reconciliation between the two is provided in the SoPS Note 3.
SoPS 1.3 Private Finance Initiatives (PFIs) and other Service Concession Arrangements
PFIs are determined using control tests, but are recorded in budgets on the balance of risks and rewards of ownership on a National Accounts basis. This has led to different treatments of the asset on the Statement of Financial Position, which is on-balance sheet for the financial accounts and off-balance sheet for budgets. The SoPS does not include additions or disposals of assets or repayment of the imputed loan in Capital. Annual payments under the PFI contract, the unitary charge, include service charges, interest charged on the loan and depreciation of the asset. These are all included in the Statement of Comprehensive Net Expenditure (SoCNE), together with any adjustments to the asset value, but only the service charge is included in the SoPS and hence the difference is included in the reconciliation within SoPS Note 3.
Please also see Note 1.6.2 of the financial accounts accounting policy.
SoPS 1.4 Capital Grants
Grant expenditure and income used for capital purposes are treated as Capital (Departmental Expenditure Limit (DEL)) items in the SoPS. In the IFRS based financial statements, there is no distinction between capital grants and other grants, and they are both included as expenditure in the SoCNE.
SoPS 1.5 Capital Works Expensed in Year
Capital works expensed in year are included in the SoPS under Capital (DEL) but are included in the IFRS based financial statements as resource expenditure in the SoCNE.
Please also see Note 1.16 of the financial accounts accounting policy.

Department for Environment, Food and Rural Affairs Annual Report and Accounts 2014–15 Chapter 7 – The Accounts
62
SoPS 1.6 Prior Period Adjustments
PPAs resulting from an error in previous recording, or from an accounting policy change initiated by the Department, are included in the SoPS in the current year, as they need to be voted by Parliament, whereas in the IFRS based financial statements they are treated as adjustments to previous years. PPAs resulting from a change in accounting policy brought in by a new or modified accounting standard are not included in Estimates, so there is no misalignment.
SoPS 1.7 Provisions – Administration and Programme Expenditure
Provisions recognised as expenditure in the IFRS based financial statements are not recognised for National Accounts purposes until the actual accrued liability is recognised or cash is paid. In order to meet the requirements of both, adjustments are made in the SoPS across Annually Managed Expenditure (AME) and DEL control totals, which do not affect the SoCNE. As the Administration control total is a sub-category of DEL, Administration and Programme expenditure reported in the SoPS is different from that reported in the IFRS based financial statements.
SoPS 1.8 Elimination of Intercompany Transactions
In the IFRS based financial statements, intercompany income and expenditure is eliminated where it is recognised. As per HM Treasury guidance, the majority of Defra’s Executive Agencies, and a small amount of NDPB expenditure, are classed as Administration, but the expenditure incurred by the Core Department on the intercompany transactions is classified as Programme. This means that the Core Department Programme expenditure and Network Body Administration income is eliminated, leaving the expenditure showing as Administration expenditure in the SoCNE.
In the Estimate and Budget, expenditure is shown as Programme in the SoPS, as per HM Treasury guidance.
Therefore, a misalignment exists between the SoCNE and the required budgetary treatment in the SoPS. In order to realign this, an adjustment is recognised in SoPS Note 2 and 3.2 to reclassify the amount from Administration to Programme, in line with the Estimate.
SoPS 1.9 Consolidated Fund Income
Consolidated Fund Extra Receipts (CFERs) relate to operating income in the IFRS based financial statements payable to the Consolidated Fund. As this type of income is not allowed to be retained by the Department, it is excluded from the SoPS (see SoPS Note 5).

Dep
artm
ent f
or E
nviro
nmen
t, Fo
od a
nd R
ural
Affa
irs
An
nual
Rep
ort a
nd A
ccou
nts
2014
–15
Cha
pter
7 –
The
Acc
ount
s
63
SoPS
2 -
Net
Out
turn
SoPS
2.1
- A
naly
sis
of N
et R
esou
rce
Out
turn
by
Sect
ion
2013
-14
Estim
ate
Out
turn
£000
£000
£000
£000
£000
£000
£000
£000
£000
£000
£000
Spen
ding
in D
epar
tmen
tal E
xpen
ditu
re L
imits
(DEL
)Vo
ted
Supp
ort a
nd d
evel
op B
ritis
h fa
rmin
g15
1,83
2
(27,
830)
124,
002
1,
759,
660
(1
,576
,383
)18
3,27
7
30
7,27
9
30
0,30
8
(6
,971
)26
8
243,
019
Help
to e
nhan
ce th
e en
viro
nmen
t and
bio
dive
rsity
57,8
83
(2
5,43
9)32
,444
790,
070
(497
,102
)29
2,96
8
32
5,41
2
33
2,30
8
6,
896
1,64
5
39
9,93
7
Su
ppor
t a s
trong
and
sus
tain
able
gre
en e
cono
my
10,7
03
(1
)10
,702
110,
657
-
11
0,65
7
12
1,35
9
14
2,24
8
20
,889
3,
449
134,
227
Prep
are
for a
nd m
anag
e ris
k fro
m a
nim
al a
nd p
lant
dis
ease
s68
,231
(61,
180)
7,05
1
244,
666
(20,
715)
223,
951
231,
002
234,
076
3,07
4
4,
247
225,
733
Prep
are
for a
nd m
anag
e ris
k fro
m e
nviro
nmen
tal e
mer
genc
ies
2,37
6
(10)
2,36
6
23,5
46
(29)
23,5
17
25,8
83
28,1
15
2,23
2
2,
417
23,8
86
Dep
artm
enta
l ope
ratin
g co
sts
111,
024
(9
,419
)10
1,60
5
34,5
84
(10,
672)
23,9
12
125,
517
119,
660
(5,8
57)
-
138,
646
Supp
ort a
nd d
evel
op B
ritis
h fa
rmin
g (A
LB)(n
et)
-
-
-
-
-
-
-
-
-
-
735
He
lp to
enh
ance
the
envi
ronm
ent a
nd b
iodi
vers
ity (A
LB)(
net)
138,
543
-
13
8,54
3
290,
186
-
29
0,18
6
42
8,72
9
43
0,16
1
1,
432
289
47
9,57
2
Pr
epar
e fo
r and
man
age
risk
from
env
ironm
enta
l em
erge
ncie
s (A
LB)(
net)
69,8
03
-
69
,803
271,
631
-
27
1,63
1
34
1,43
4
33
2,05
4
(9
,380
)-
30
5,52
4
To
tal
610,
395
(1
23,8
79)
486,
516
3,
525,
000
(2
,104
,901
)1,
420,
099
1,
906,
615
1,
918,
930
12
,315
12
,315
1,95
1,27
9
Spen
ding
in A
nnua
lly M
anag
ed E
xpen
ditu
re L
imits
(AM
E)Vo
ted
Supp
ort a
nd d
evel
op B
ritis
h fa
rmin
g-
-
-
1,
307
-
1,
307
1,30
7
11
5,03
2
11
3,72
5
11
3,72
5
(54,
362)
Help
to e
nhan
ce th
e en
viro
nmen
t and
bio
dive
rsity
-
-
-
(42,
997)
-
(4
2,99
7)(4
2,99
7)(1
,061
)41
,936
41
,936
(81,
806)
Supp
ort a
stro
ng a
nd s
usta
inab
le g
reen
eco
nom
y-
-
-
(1
,000
)-
(1,0
00)
(1,0
00)
-
1,
000
1,00
0
1,
000
Prep
are
for a
nd m
anag
e ris
k fro
m a
nim
al a
nd p
lant
dis
ease
s-
-
-
2,
579
-
2,
579
2,57
9
54
,465
51
,886
43
,438
10,2
52
Prep
are
for a
nd m
anag
e ris
k fro
m e
nviro
nmen
tal e
mer
genc
ies
-
-
-
-
-
-
-
118
11
8
118
-
Dep
artm
enta
l ope
ratin
g co
sts
-
-
-
123,
245
-
12
3,24
5
12
3,24
5
11
6,35
2
(6
,893
)-
6,
390
Supp
ort a
nd d
evel
op B
ritis
h fa
rmin
g (A
LB)(n
et)
-
-
-
459
-
459
45
9
17
(442
)-
2,
149
Help
to e
nhan
ce th
e en
viro
nmen
t and
bio
dive
rsity
(ALB
)(ne
t)-
-
-
(1
8,25
4)-
(18,
254)
(18,
254)
(48,
452)
(30,
198)
-
(4,3
87)
Prep
are
for a
nd m
anag
e ris
k fro
m e
nviro
nmen
tal e
mer
genc
ies
(ALB
)(ne
t)-
-
-
12
,659
-
12,6
59
12,6
59
41,7
44
29,0
85
-
26,2
85
Tota
l-
-
-
77
,998
-
77,9
98
77,9
98
278,
215
200,
217
200,
217
(9
4,47
9)
Net T
otal
Inco
me
Net
Gro
ssIn
com
eN
etN
et T
otal
Net
Tot
al
Com
pare
d to
Est
imat
e
Net
Tot
al
Com
pare
d to
Es
timat
e Ad
just
ed fo
r Vi
rem
ents
1G
ross
Out
turn
Out
turn
20
14-1
5
Adm
inis
trat
ion
Pro
gram
me
Tota
l
1. V
irem
ent r
eallo
cate
s un
ders
pend
s on
one
par
t of t
he E
stim
ate
to c
over
ove
rspe
nds
on a
noth
er p
art o
f the
Est
imat
e.

Dep
artm
ent f
or E
nviro
nmen
t, Fo
od a
nd R
ural
Affa
irs
An
nual
Rep
ort a
nd A
ccou
nts
2014
–15
Cha
pter
7 –
The
Acc
ount
s
64
SoPS
2.1
- A
naly
sis
of N
et R
esou
rce
Out
turn
by
Sect
ion
cont
inue
d
2013
-14
Estim
ate
Out
turn
£000
£000
£000
£000
£000
£000
£000
£000
£000
£000
£000
Spen
ding
in N
on B
udge
t Exp
endi
ture
Lim
itsSu
ppor
t and
dev
elop
Brit
ish
farm
ing
-
-
-
1,07
9,04
6
(1,0
77,2
33)
1,81
3
1,
813
10,0
00
8,18
7
8,
187
(419
)Pr
ior P
erio
d Ad
just
men
ts-
-
-
3,
911
-
3,
911
3,91
1
5,
000
1,08
9
1,
089
113,
700
Tota
l-
-
-
1,
082,
957
(1
,077
,233
)5,
724
5,72
4
15
,000
9,
276
9,27
6
11
3,28
1
Res
ourc
e O
uttu
rn61
0,39
5
(123
,879
)48
6,51
6
4,68
5,95
5
(3,1
82,1
34)
1,50
3,82
1
1,99
0,33
7
2,21
2,14
5
221,
808
221,
808
1,
970,
081
Ne
tted
off e
xpen
ditu
re: A
LB in
com
e49
7
(4
97)
-
504,
734
(504
,734
)-
-
Ne
tted
off e
xpen
ditu
re: O
ther
76
(7
6)-
3
(3)
-
-
Inte
rcom
pan y
tran
sact
ions
222
2,46
5
-
222,
465
(2
22,4
65)
-
(2
22,4
65)
-
C
apita
l gra
nts
-
-
-
224,
262
(23,
193)
201,
069
201,
069
Prov
isio
ns a
djus
tmen
t(1
,454
)-
(1
,454
)1,
454
-
1,
454
-
C
apita
l wor
ks e
xpen
sed
in y
ear
-
-
-
277,
509
-
27
7,50
9
27
7,50
9
Pr
ior P
erio
d Ad
just
men
t-
-
-
(3
,911
)-
(3,9
11)
(3,9
11)
Oth
er a
djus
tmen
ts1,
374
(9
,616
)(8
,242
)-
-
-
(8,2
42)
Net
Ope
ratin
g C
ost
833,
353
(1
34,0
68)
699,
285
5,
467,
541
(3
,710
,064
)1,
757,
477
2,
456,
762
Net
Tot
al
Com
pare
d to
Est
imat
e
Net
Tot
al
Com
pare
d to
Es
timat
e Ad
just
ed fo
r Vi
rem
ents
1G
ross
Inco
me
Out
turn
O
uttu
rn20
14-1
5
Adm
inis
trat
ion
Pro
gram
me
Tota
lN
et T
otal
Net
Gro
ssIn
com
eN
etNe
t Tot
al
1. V
irem
ent r
eallo
cate
s un
ders
pend
s on
one
par
t of t
he E
stim
ate
to c
over
ove
rspe
nds
on a
noth
er p
art o
f the
Est
imat
e.
2. T
he in
terc
ompa
ny tr
ansa
ctio
ns a
djus
tmen
t is
need
ed d
ue to
the
diffe
ring
met
hods
of e
limin
atin
g in
terc
ompa
ny tr
ansa
ctio
ns in
the
Estim
ate
and
Bud
get c
ompa
red
to th
e A
RA
. Fur
ther
info
rmat
ion
can
be fo
und
in S
oPS
Not
e 1.
8.
Det
aile
d ex
plan
atio
ns o
f sig
nific
ant v
aria
nces
bet
wee
n Es
timat
e an
d N
et R
esou
rce
Out
turn
are
sho
wn
in C
hapt
er 3
.

Department for Environment, Food and Rural Affairs Annual Report and Accounts 2014–15 Chapter 7 – The Accounts
65
SoPS 2.2 - Analysis of Net Capital Outturn by Section
2013-14Estimate Outturn
Gross Income Net Net
Net Total Compared
to Estimate
Net Total Compared to
Estimate Adjusted for
Virements1 Net£000 £000 £000 £000 £000 £000 £000
Spending in Departmental Expenditure Limits (DEL)VotedSupport and develop British farming 83,289 (19) 83,270 72,727 (10,543) 19 60,863 Help to enhance the environment and biodiversity 25,318 (254) 25,064 20,685 (4,379) 254 18,857 Prepare for and manage risk from animal and plant diseases 6,146 (486) 5,660 6,480 820 820 13,264 Prepare for and manage risk from environmental emergencies 11,583 - 11,583 15,000 3,417 3,417 - Departmental operating costs 15,274 (18,024) (2,750) 12,464 15,214 8,341 14,351 Support and develop British farming (ALB)(net) - - - - - - 44 Help to enhance the environment and biodiversity (ALB)(net) 25,829 - 25,829 34,151 8,322 - 38,365 Prepare for and manage risk from environmental emergencies (ALB)(net) 489,355 - 489,355 489,800 445 445 336,586 Total 656,794 (18,783) 638,011 651,307 13,296 13,296 482,330
Annually Managed Expenditure (AME)VotedSupport and develop British farming (ALB)(net) 1,586 - 1,586 3,000 1,414 1,363 (836)Help to enhance the environment and biodiversity (ALB)(net) 51 - 51 - (51) - 93 Total 1,637 - 1,637 3,000 1,363 1,363 (743)
Capital Outturn 658,431 (18,783) 639,648 654,307 14,659 14,659 481,587
Outturn2014-15
1. Virement reallocates underspends on one part of the Estimate to cover overspends on another part of the Estimate.
SoPS 3 - Reconciliation of Outturn to Net Operating Cost and against Administration Budget
SoPS 3.1 - Reconciliation of Net Resource Outturn to Net Operating Cost
2014-15 2013-14Restated
Note Outturn Outturn £000 £000
Total Resource Outturn in SoPS Budget SoPS 2.1 1,984,613 1,856,800 Non Budget SoPS 2.1 5,724 113,281
1,990,337 1,970,081
Add: Capital grants / income 201,069 109,678 Capital works expensed in year 277,509 210,634 Adjustment to IFRIC 12 1,374 1,425 CFER adjustment (9,616) (9,242)Prior Period Adjustments Resource (4,109) (109,591)
Capital 198 - 466,425 202,904
Net Operating Cost 2,456,762 2,172,985
For explanation of the treatment of the reconciling items see SoPS Note 1.2–1.9.
The Non Budget Outturn for 2014–15 includes the Prior Period Adjustments from 2013–14.

Department for Environment, Food and Rural Affairs Annual Report and Accounts 2014–15 Chapter 7 – The Accounts
66
SoPS 3.2 - Outturn against Final Administration Budget and Administration Net Operating Cost
2014-15 2013-14 Restated
£000 £000
Estimate - Administration Costs Limit 569,887 622,856
Outturn - gross administration costs 610,395 646,680 Outturn - gross income relating to administration costs (123,879) (118,025)Outturn - Net Administration Costs 486,516 528,655
Reconciliation to operating costs: Provisions utilised (transfer from programme) (1,454) (3,252) Elimination of intercompany transactions 222,465 228,231 CFER adjustment (9,616) (9,242) Prior Period Adjustment - (668) Other 1,374 1,425 Administration Net Operating Costs 699,285 745,149
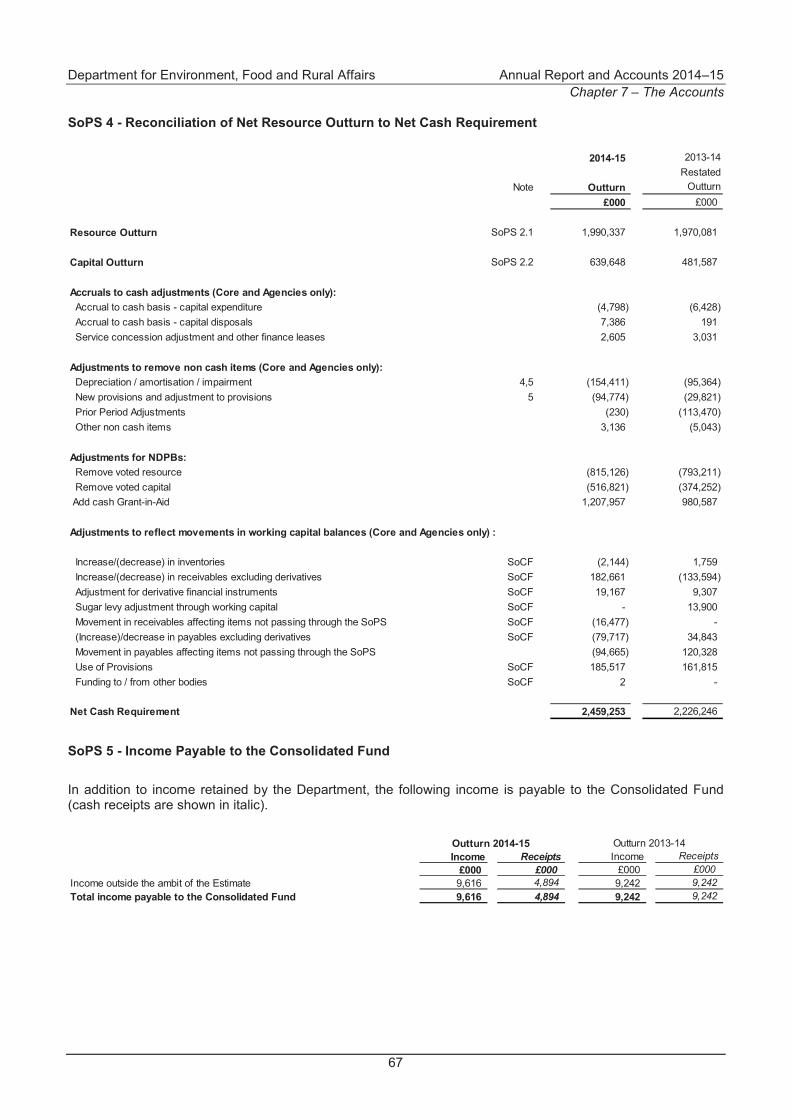
Department for Environment, Food and Rural Affairs Annual Report and Accounts 2014–15 Chapter 7 – The Accounts
67
SoPS 4 - Reconciliation of Net Resource Outturn to Net Cash Requirement
2014-15 2013-14 Restated
Note Outturn Outturn £000 £000
Resource Outturn SoPS 2.1 1,990,337 1,970,081
Capital Outturn SoPS 2.2 639,648 481,587
Accruals to cash adjustments (Core and Agencies only): Accrual to cash basis - capital expenditure (4,798) (6,428) Accrual to cash basis - capital disposals 7,386 191 Service concession adjustment and other finance leases 2,605 3,031
Adjustments to remove non cash items (Core and Agencies only): Depreciation / amortisation / impairment 4,5 (154,411) (95,364) New provisions and adjustment to provisions 5 (94,774) (29,821) Prior Period Adjustments (230) (113,470) Other non cash items 3,136 (5,043)
Adjustments for NDPBs: Remove voted resource (815,126) (793,211) Remove voted capital (516,821) (374,252) Add cash Grant-in-Aid 1,207,957 980,587
Adjustments to reflect movements in working capital balances (Core and Agencies only) :
Increase/(decrease) in inventories SoCF (2,144) 1,759 Increase/(decrease) in receivables excluding derivatives SoCF 182,661 (133,594) Adjustment for derivative financial instruments SoCF 19,167 9,307 Sugar levy adjustment through working capital SoCF - 13,900 Movement in receivables affecting items not passing through the SoPS SoCF (16,477) - (Increase)/decrease in payables excluding derivatives SoCF (79,717) 34,843 Movement in payables affecting items not passing through the SoPS (94,665) 120,328 Use of Provisions SoCF 185,517 161,815 Funding to / from other bodies SoCF 2 -
Net Cash Requirement 2,459,253 2,226,246
SoPS 5 - Income Payable to the Consolidated Fund
In addition to income retained by the Department, the following income is payable to the Consolidated Fund (cash receipts are shown in italic).
Outturn 2014-15 Outturn 2013-14Income Receipts Income Receipts
£000 £000 £000 £000Income outside the ambit of the Estimate 9,616 4,894 9,242 9,242 Total income payable to the Consolidated Fund 9,616 4,894 9,242 9,242

Department for Environment, Food and Rural Affairs Annual Report and Accounts 2014–15 Chapter 7 – The Accounts
68
Consolidated Statement of Comprehensive Net Expenditure for the year ended 31 March 2015
This account summarises the expenditure and income generated and consumed on an accruals basis. It also includes other comprehensive income and expenditure, which include changes to the values of non–current assets and other financial instruments that cannot yet be recognised as income or expenditure.
2014-15 2013-14 Restated Restated Restated
Note Core Department Core Department
and Agencies Departmental
Group Core Department Core Department
and Agencies Departmental
Group £000 £000 £000 £000 £000 £000
Administration costs Staff costs 3 114,635 308,030 384,015 106,644 300,417 407,490 Other costs 4 107,822 322,551 449,338 114,048 341,848 466,175 Income 6 (40,641) (139,701) (134,068) (30,043) (135,031) (128,516)
181,816 490,880 699,285 190,649 507,234 745,149
Programme costs Staff costs 3 4,063 61,910 478,294 7,377 64,483 501,443 Other costs 5 1,440,013 3,951,572 4,989,247 1,285,722 4,038,744 4,878,304 Income 6 (520,353) (3,193,645) (3,710,064) (497,599) (3,426,937) (3,951,911) Grant-in-Aid to NDPBs 5 1,133,657 1,133,657 - 902,487 902,487 -
2,057,380 1,953,494 1,757,477 1,697,987 1,578,777 1,427,836
Net Operating Cost 2,239,196 2,444,374 2,456,762 1,888,636 2,086,011 2,172,985
Total expenditure 3,4,5 2,800,190 5,777,720 6,300,894 2,416,278 5,647,979 6,253,412 Total income 6 (560,994) (3,333,346) (3,844,132) (527,642) (3,561,968) (4,080,427)
Net Operating Cost 2,239,196 2,444,374 2,456,762 1,888,636 2,086,011 2,172,985
Non Operating Activities
(Gain)/loss on transfer to/from Core Department* (10,905) - 758 (93,698) - (33,088)Net Expenditure 2,228,291 2,444,374 2,457,520 1,794,938 2,086,011 2,139,897
Other Comprehensive Expenditure
Items that will not be reclassified to Net Operating Costs Net (gain)/loss on Revaluation of PPE SoCTE 21,404 (52,463) (164,690) 5,320 9,789 (105,241) Charitable funds revaluation SoCTE - - (10,544) - - (8,707) Revaluation of intangibles SoCTE (374) (752) (3,023) (2,097) (2,683) (3,984) Pension actuarial movements SoCTE (11,483) (11,483) 213,389 38,370 38,370 128,087 Revaluation of hedging instruments SoCTE - (256) (256) - (1,827) (1,827)
Items that may be reclassified subsequently to Net Operating CostsNet (gain)/loss on Revaluation of financial assets SoCTE - - - - - (7)
2,237,838 2,379,420 2,492,396 1,836,531 2,129,660 2,148,218 Total Comprehensive Expenditure
EU funding for the Department totalling £3,139m (2013–14, restated £3,372m) is included within the Administration and Programme income totals. Further details can be found in Note 6.1.
Non-operating transactions occur from the transfer of assets/liabilities between government bodies.
*The Core Department shows a gain relating to the net position of the transfer of assets and liabilities from Fera to Defra. On consolidation this nets off with the loss on transfer of function for Fera. The balance, a loss of £758,000 for the group, relates to the transfer of GLA assets and liabilities to the Home Office.
The notes in Chapter 8 form part of these accounts.

Department for Environment, Food and Rural Affairs Annual Report and Accounts 2014–15 Chapter 7 – The Accounts
69
Consolidated Statement of Financial Position as at 31 March 2015
This statement presents the financial position of Defra. It comprises three main components: assets owned or controlled; liabilities owed to other bodies; and equity, the remaining value of the entity.
31 March 2015 31 March 2014Restated Restated Restated
Note Core Department Core Department
and Agencies Departmental
Group Core Department Core Department
and Agencies Departmental
Group £000 £000 £000 £000 £000 £000
Non current assets Property, plant and equipment and investment properties 7.1, 7.2, 7.4 107,630 405,443 3,051,916 199,461 455,900 2,994,183 Heritage assets 7.3 - - 215,619 - - 198,030 Agricultural assets - - 172 - - 165 Intangible assets 8 87,054 136,867 265,872 72,160 142,308 292,370 Investments 12 6,670 6,845 7,161 - 175 491 Net pension assets 17.2 - - 7,600 - - 9,700 Receivables falling due after more than one year 14 11,311 11,467 11,471 11,320 11,560 11,567 Total non current assets 212,665 560,622 3,559,811 282,941 609,943 3,506,506
Current assets Assets classified as held for sale 11,720 11,720 21,399 10,881 10,881 17,960 Inventories 480 4,623 5,188 477 6,767 7,384 Other financial assets 14 - 25,252 25,252 - 2,133 2,133 Trade and other receivables 14 303,448 732,491 841,637 230,164 549,737 665,433 Cash and cash equivalents 13 40,764 177,506 336,805 69,887 278,044 418,172 Total current assets 356,412 951,592 1,230,281 311,409 847,562 1,111,082
Total assets 569,077 1,512,214 4,790,092 594,350 1,457,505 4,617,588
Current liabilities Trade and other payables 15 (812,525) (828,044) (1,163,465) (669,388) (791,275) (1,153,871) Provisions 16.1 (68,371) (88,041) (99,024) (117,414) (122,509) (128,342) Net pension liability 17.2 (73,452) (73,452) (73,467) (76,337) (76,337) (76,357) Other financial liabilities 15 (2,305) (890) (890) (688) (1,191) (1,191)Total current liabilities (956,653) (990,427) (1,336,846) (863,827) (991,312) (1,359,761)
Non current assets plus/less net current assets/liabilities (387,576) 521,787 3,453,246 (269,477) 466,193 3,257,827
Non current liabilities Provisions 16.1 (112,514) (118,266) (121,498) (125,529) (128,591) (133,694) Net pension liability 17.2 (582,615) (582,615) (1,301,801) (647,963) (647,963) (1,110,740) Other payables 15 (18,571) (82,506) (87,680) (19,431) (39,168) (46,005) Other financial liabilities 15 - (3,905) (145,505) - (298) (141,898)Total non current liabilities (713,700) (787,292) (1,656,484) (792,923) (816,020) (1,432,337)
Assets less liabilities (1,101,276) (265,505) 1,796,762 (1,062,400) (349,827) 1,825,490
Taxpayers' equity and other reserves General Fund SoCTE (1,125,520) (409,439) (257,636) (1,108,198) (458,681) (116,612) Revaluation Reserve SoCTE 24,244 143,683 1,899,109 45,798 108,859 1,800,293 Hedging Reserve SoCTE - 251 251 - (5) (5) Charitable Funds - restricted funds SoCTE - - 22,501 - - 16,749 Charitable Funds - unrestricted funds* SoCTE - - 132,537 - - 125,065 Total equity (1,101,276) (265,505) 1,796,762 (1,062,400) (349,827) 1,825,490
*The unrestricted charitable funds figure includes RBG Kew’s revaluation reserve totalling £92.9m (£83.3m 2013–14).
Bronwyn Hill 7 July 2015 Accounting Officer for the Department for Environment, Food and Rural Affairs
The notes in Chapter 8 form part of these accounts.

Department for Environment, Food and Rural Affairs Annual Report and Accounts 2014–15 Chapter 7 – The Accounts
70
Consolidated Statement of Cash Flows for the year ended 31 March 2015
This statement shows the changes in cash and cash equivalents of Defra during the reporting period. It shows how Defra generates and uses cash and cash equivalents by classifying cash flows as operating, investing and financing activities. The amount of net cash flows arising from operating activities is a key indicator of service costs and the extent to which these operations are funded by way of income from the recipients of services provided by Defra. Investing activities represent the extent to which cash inflows and outflows have been made for resources which are intended to contribute to Defra’s future public service delivery. Cash flows arising from financing activities include Parliamentary Supply and other cash flows, including borrowing.
Restated Restated
NoteCore Department
and Agencies Departmental
Group Core Department
and Agencies Departmental
Group £000 £000 £000 £000
Cash flows from operating activities Net Operating Cost SoCNE (2,444,374) (2,456,762) (2,086,011) (2,172,985) Adjustments for non cash transactions 239,379 467,510 130,228 338,409 (Increase) / decrease in trade and other receivables excluding derivatives 14 (182,661) (176,108) 133,594 109,552 less movements in receivables relating to items not passing through the SoCNE 16,477 16,387 - (4,410) Adjustments for derivative financial instruments (19,167) (19,167) (9,307) (9,307) (Increase) / decrease in inventories 2,144 2,196 (1,759) (1,702) Increase / (decrease) in trade payables and other liabilities excluding derivatives 15 79,717 50,879 (34,843) (42,813) less movements in payables relating to items not passing through the SoCNE 89,943 88,177 (120,328) (67,290) Use of provisions/ pension liabilities (185,517) (250,266) (161,815) (221,882)Net cash outflow from operating activities (2,404,059) (2,277,154) (2,150,241) (2,072,428)
Cash flows from investing activities Purchase of PPE, heritage and agricultural assets 7 (13,110) (107,696) (26,795) (128,211) Purchase of intangible assets 8 (44,403) (58,953) (31,358) (51,362) Proceeds of disposal of PPE, heritage and agricultural assets 8,922 10,602 6,991 21,935 Proceeds of disposal of intangible assets - - 26 83 Net cash outflow from investment activities (48,591) (156,047) (51,136) (157,555)
Cash flows from financing activities From Consolidated Fund (Supply): current year 2,362,291 2,362,291 2,337,305 2,337,305 Advances from the Contingencies Fund 2,400,000 2,400,000 2,300,000 2,300,000 Repayments to the Contingencies Fund (2,400,000) (2,400,000) (2,300,000) (2,300,000) Capital element of payments in respect of service concession arrangements and (1,707) (2,375) (1,727) (2,242) finance leases and on-balance sheet PFI contracts RPA settlement of sugar levy claim - - (13,900) (13,900) Transfer to NRW - - - (5,973) Funding to / from other bodies (2) 24 - 25 Net financing 2,360,582 2,359,940 2,321,678 2,315,215
Net increase/(decrease) in cash and cash equivalents in the period (92,068) (73,261) 120,301 85,232 before adjustment for receipts and payments to the Consolidated Fund
Payments of amounts due to the Consolidated Fund (8,470) (8,470) (5,666) (5,666)
Net increase/(decrease) in cash and cash equivalents in the period after adjustment for receipts and payments to the Consolidated Fund 13 (100,538) (81,731) 114,635 79,566
Cash and cash equivalents at the beginning of the period 13 278,044 418,172 163,409 338,606 Cash and cash equivalents at the end of the period 13 177,506 336,441 278,044 418,172
2014-15 2013-14
For the Departmental Group the cash and cash equivalents, and associated movements include an overdraft of £364,000 at 31 March 2015 (included in Note 15).
The notes in Chapter 8 form part of these accounts.

Department for Environment, Food and Rural Affairs Annual Report and Accounts 2014–15 Chapter 7 – The Accounts
71
Consolidated Statement of Changes in Taxpayers’ Equity This Statement shows the movement in the year on the different reserves held by Defra. The General Fund reflects financing and balances from the provision of services, i.e. it reflects the contribution from the Consolidated Fund. The Revaluation Reserve reflects the change in asset values that have not been recognised as income or expenditure. Other specific reserves are shown separately where there are statutory restrictions of their use. The Hedging Reserve recognises the effective portion of changes in the fair value of RPA’s foreign currency derivatives that are designated and qualify as cash flow hedges. Charitable funds represent the fair value of donations, including revaluation, given to Royal Botanic Gardens Kew. Unrestricted reserves are those donations that have no restrictions on their use, or income flow.
for the year ended 31 March 2015
Departmental Group
2014-15
Note General
Fund Revaluation
Reserve Hedging Reserve
Taxpayers' Equity
Charitable Funds -
Restricted/ Endowment
Charitable Funds -
Unrestricted Total
Reserves £000 £000 £000 £000 £000 £000 £000
Balance at 31 March 2014 (60,158) 1,792,076 (5) 1,731,913 16,749 125,065 1,873,727 Prior Year Adjustment 5,606 8,217 - 13,823 - - 13,823 Restatement - Metal Mines provision (62,060) - - (62,060) - - (62,060)Restated balance at 1 April 2014 (116,612) 1,800,293 (5) 1,683,676 16,749 125,065 1,825,490
Net Parliamentary Funding - drawn down SoCF 2,362,291 - - 2,362,291 - - 2,362,291 Net Parliamentary Funding - deemed 274,468 - - 274,468 - - 274,468 Funding to / from other bodies 24 - - 24 - - 24 Supply (payable) adjustment (177,506) - - (177,506) - - (177,506)Payable to the Consolidated Fund SoPS 5 (9,616) - - (9,616) - - (9,616)Net Operating Costs for the year SoCNE (2,459,442) - - (2,459,442) 5,723 (3,043) (2,456,762)
Non cash adjustments Non cash charges - auditors' remuneration 4, 5 1,155 - - 1,155 - - 1,155 Non cash charges - early departure (10) - - (10) - - (10)
Movement in reservesRecognised in Other Comprehensive Expenditure: Revaluation of PPE OCE - 164,690 - 164,690 - - 164,690 Charitable funds revaluation OCE - - - - 29 10,515 10,544 Revaluation of intangibles OCE - 3,023 - 3,023 - - 3,023 Pension actuarial loss OCE (213,389) - - (213,389) - - (213,389) Revaluation/impairments - Hedging Reserve OCE - - 74,654 74,654 - - 74,654 Contributions in respect of unfunded benefits 10,800 - - 10,800 - - 10,800 Release of reserves to SoCNE OCE - - (74,398) (74,398) - - (74,398)
Transfers between reserves 68,897 (68,897) - - - - - Transfer to General Fund - net asset transfer 8 8 - - 8 Gain/(loss) on transfer of function (758) - - (758) - - (758)Non Operating General Fund movements 2,054 - - 2,054 - - 2,054 Balance at 31 March 2015 (257,636) 1,899,109 251 1,641,724 22,501 132,537 1,796,762

Department for Environment, Food and Rural Affairs Annual Report and Accounts 2014–15 Chapter 7 – The Accounts
72
for the year ended 31 March 2014
Departmental Group
2013-14
Note General
Fund Revaluation
Reserve Hedging Reserve
Taxpayers' Equity
Charitable Funds -
Restricted/ Endowment
Charitable Funds -
Unrestricted Total
Reserves £000 £000 £000 £000 £000 £000 £000
Balance at 31 March 2013 (90,899) 1,781,512 (1,832) 1,688,781 12,315 118,015 1,819,111 Restatement - Metal Mines provision (62,060) - - (62,060) - - (62,060)Restated balance at 1 April 2013 (152,959) 1,781,512 (1,832) 1,626,721 12,315 118,015 1,757,051
Net Parliamentary Funding - drawn down SoCF 2,337,305 - - 2,337,305 - - 2,337,305 Net Parliamentary Funding - deemed 163,409 - - 163,409 - - 163,409 Funding to / from other bodies 25 - - 25 - - 25 Supply (payable) adjustment (274,468) - - (274,468) - - (274,468)Payable to the Consolidated Fund (9,242) - - (9,242) - - (9,242)Net Operating Costs for the year SoCNE (2,175,762) - - (2,175,762) 4,427 (1,650) (2,172,985)
Non cash adjustments Non cash charges - auditors' remuneration 4, 5 1,223 - - 1,223 - - 1,223 Non cash charges - other 216 - - 216 - - 216
Movements in reservesRecognised in Other Comprehensive Expenditure: Revaluation of PPE OCE - 105,241 - 105,241 - - 105,241 Charitable funds revaluation OCE - - - - 7 8,700 8,707 Revaluation of intangibles OCE - 3,984 - 3,984 - - 3,984 Revaluation of investments OCE - 7 - 7 - - 7 Pension actuarial loss OCE (128,087) - - (128,087) - - (128,087) Revaluation/impairments - Hedging Reserve OCE - - 27,425 27,425 - - 27,425 Contributions in respect of unfunded benefits 11,000 - - 11,000 - - 11,000 Release of reserves to SoCNE OCE - - (25,598) (25,598) - - (25,598)
Transfers between reserves 90,454 (90,451) - 3 - - 3 Transfer to General Fund - net asset transfer 1,074 - - 1,074 - - 1,074 RPA settlement of sugar levy claim (13,900) - - (13,900) - - (13,900)Transfer to NRW 33,088 - - 33,088 - - 33,088 Non Operating General Fund movements 12 - - 12 - - 12 Restated balance at 31 March 2014 (116,612) 1,800,293 (5) 1,683,676 16,749 125,065 1,825,490

Department for Environment, Food and Rural Affairs Annual Report and Accounts 2014–15 Chapter 7 – The Accounts
73
for the year ended 31 March 2015
Core Department and Agencies
2014-15
Note General
Fund Revaluation
Reserve Hedging Reserve
Taxpayers' Equity
Charitable Funds -
Restricted/ Endowment
Charitable Funds -
Unrestricted Total
Reserves £000 £000 £000 £000 £000 £000 £000
Balance at 31 March 2014 (391,865) 100,722 (5) (291,148) - - (291,148)Prior Year Adjustment (4,756) 8,137 - 3,381 - - 3,381 Restatement - Metal Mines provision (62,060) - - (62,060) - - (62,060)Restated balance at 1 April 2014 (458,681) 108,859 (5) (349,827) - - (349,827)
Net Parliamentary Funding - drawn down SoCF 2,362,291 - - 2,362,291 - - 2,362,291 Net Parliamentary Funding - deemed 274,468 - - 274,468 - - 274,468 Funding to / from other bodies (2) - - (2) - - (2)Supply (payable) adjustment (177,506) - - (177,506) - - (177,506)Payable to the Consolidated Fund SoPS 5 (9,616) - - (9,616) - - (9,616)Net Operating Costs for the year SoCNE (2,444,374) - - (2,444,374) - - (2,444,374)
Non cash adjustments Non cash charges - auditors' remuneration 4, 5 1,155 - - 1,155 - - 1,155 Non cash charges - other (13) - - (13) - - (13)
Movement in reservesRecognised in Other Comprehensive Expenditure: Revaluation of PPE OCE - 52,463 - 52,463 - - 52,463 Revaluation of intangibles OCE - 752 - 752 - - 752 Pension actuarial loss OCE 11,483 - - 11,483 - - 11,483 Revaluation/impairments - Hedging Reserve OCE - - 74,654 74,654 - - 74,654 Contributions in respect of unfunded benefits 10,800 - - 10,800 - - 10,800 Release of reserves to SoCNE OCE - - (74,398) (74,398) - - (74,398)
Transfers between reserves 18,391 (18,391) - - - - - Transfer to General Fund - net asset transfer 1,561 - - 1,561 - - 1,561 Non Operating General Fund movements 604 - - 604 - - 604 Balance at 31 March 2015 (409,439) 143,683 251 (265,505) - - (265,505)

Department for Environment, Food and Rural Affairs Annual Report and Accounts 2014–15 Chapter 7 – The Accounts
74
for the year ended 31 March 2014
Core Department and Agencies
2013-14
Note General
Fund Revaluation
Reserve Hedging Reserve
Taxpayers' Equity
Charitable Funds -
Restricted/ Endowment
Charitable Funds -
Unrestricted Total
Reserves £000 £000 £000 £000 £000 £000 £000
Balance at 31 March 2013 (503,082) 131,711 (1,832) (373,203) - - (373,203)Restatement - Metal Mines provision (62,060) - - (62,060) - - (62,060)Restated balance at 1 April 2013 (565,142) 131,711 (1,832) (435,263) - - (435,263)
Net Parliamentary Funding - drawn down SoCF 2,337,305 - - 2,337,305 - - 2,337,305 Net Parliamentary Funding - deemed 163,409 - - 163,409 - - 163,409 Supply (payable) adjustment (274,468) - - (274,468) - - (274,468)Payable to the Consolidated Fund (9,242) - - (9,242) - - (9,242)Net Operating Costs for the year SoCNE (2,086,011) - - (2,086,011) - - (2,086,011)
Non cash adjustments Non cash charges - auditors' remuneration 4, 5 1,223 - - 1,223 - - 1,223 Non cash charges - other 216 - - 216 - - 216
Movements in reservesRecognised in Other Comprehensive Expenditure: Revaluation of PPE OCE - (9,789) - (9,789) - - (9,789) Revaluation of intangibles OCE - 2,683 - 2,683 - - 2,683 Pension actuarial loss OCE (38,370) - - (38,370) - - (38,370) Revaluation/impairments - Hedging Reserve OCE - - 27,425 27,425 - - 27,425 Contributions in respect of unfunded benefits 11,000 - - 11,000 - - 11,000 Release of reserves to SoCNE OCE - - (25,598) (25,598) - - (25,598)
Transfers between reserves 15,746 (15,746) - - - - - Transfer to General Fund - net asset transfer (447) - - (447) - - (447)RPA settlement of sugar levy claim (13,900) - - (13,900) - - (13,900)Restated balance at 31 March 2014 (458,681) 108,859 (5) (349,827) - - (349,827)

Department for Environment, Food and Rural Affairs Annual Report and Accounts 2014–15 Chapter 7 – The Accounts
75
for the year ended 31 March 2015
Core Department
2014-15
Note General
Fund Revaluation Reserve
Hedging Reserve
Taxpayers' Equity
Charitable Funds -
Restricted/Endowment
Charitable Funds -
Unrestricted Total
Reserves £000 £000 £000 £000 £000 £000 £000
Balance at 31 March 2014 (1,048,940) 45,798 - (1,003,142) - - (1,003,142)Prior Year Adjustment 2,802 - - 2,802 - - 2,802 Restatement - Metal Mines provision (62,060) - - (62,060) - - (62,060)Restated balance at 1 April 2014 (1,108,198) 45,798 - (1,062,400) - - (1,062,400)
Net Parliamentary Funding - drawn down SoCF 2,362,291 - - 2,362,291 - - 2,362,291 Net Parliamentary Funding - deemed 274,468 - - 274,468 - - 274,468 Funding to Agencies and FC (276,903) - - (276,903) - - (276,903)Supply (payable) adjustment (177,506) - - (177,506) - - (177,506)Payable to the Consolidated Fund SoPS 5 (9,616) - - (9,616) - - (9,616)Net Operating Costs for the year SoCNE (2,239,196) - - (2,239,196) - - (2,239,196)
Non cash adjustments Non cash charges - auditors' remuneration 4, 5 420 - - 420 - - 420
Movement in reservesRecognised in Other Comprehensive Expenditure: Revaluation of PPE OCE - (21,404) - (21,404) - - (21,404) Revaluation of intangibles OCE - 374 - 374 - - 374 Pension actuarial loss OCE 11,483 - - 11,483 - - 11,483 Contributions in respect of unfunded benefits 10,800 - 10,800 - - 10,800
Transfers between reserves 6,551 (524) - 6,027 - - 6,027 Transfer to General Fund - net asset transfer 8,981 - - 8,981 - - 8,981 Gain/(loss) on transfer of function 10,905 - - 10,905 - - 10,905 Balance at 31 March 2015 (1,125,520) 24,244 - (1,101,276) - - (1,101,276)

Department for Environment, Food and Rural Affairs Annual Report and Accounts 2014–15 Chapter 7 – The Accounts
76
for the year ended 31 March 2014
Core Department
2013-14
General Fund
Revaluation Reserve
Hedging Reserve
Taxpayers' Equity
Charitable Funds -
Restricted/ Endowment
Charitable Funds -
Unrestricted Total
Reserves Note £000 £000 £000 £000 £000 £000 £000
Balance at 31 March 2013 (1,221,235) 37,453 - (1,183,782) - - (1,183,782)Restatement - Metal Mines provision (62,060) - - (62,060) - - (62,060)Restated balance at 1 April 2013 (1,283,295) 37,453 - (1,245,842) - - (1,245,842)
Net Parliamentary Funding - drawn down SoCF 2,337,305 - - 2,337,305 - - 2,337,305 Net Parliamentary Funding - deemed 163,409 - - 163,409 - - 163,409 Funding to Agencies and FC (208,158) - - (208,158) - - (208,158)Supply (payable) adjustment (274,468) - - (274,468) - - (274,468)Payable to the Consolidated Fund (9,242) - - (9,242) - - (9,242)Net Operating Costs for the year SoCNE (1,888,636) - - (1,888,636) - - (1,888,636)
Non cash adjustments Non cash charges - auditors' remuneration 4, 5 428 - - 428 - - 428
Movements in reservesRecognised in Other Comprehensive Expenditure: Revaluation of PPE OCE - (5,320) - (5,320) - - (5,320) Revaluation of intangibles OCE - 2,097 - 2,097 - - 2,097 Pension actuarial loss OCE (38,370) - - (38,370) - - (38,370) Contributions in respect of unfunded benefits 11,000 - - 11,000 - - 11,000
Transfers between reserves (11,568) 11,568 - - - - - Transfer to General Fund - net asset transfer (301) - - (301) - - (301)Transfer of Sand Hutton from Fera to Defra 93,698 - - 93,698 - - 93,698 Restated balance at 31 March 2014 (1,108,198) 45,798 - (1,062,400) - - (1,062,400)
The notes in Chapter 8 form part of these accounts.

Department for Environment, Food and Rural Affairs Annual Report and Accounts 2014–15 Chapter 8 – Notes to the Departmental Accounts
77
Chapter 8 – Notes to the Departmental Accounts 1 Statement of Accounting Policies
The financial statements have been prepared in accordance with the 2014–15 Government Financial Reporting Manual (FReM) issued by HM Treasury and are in accordance with directions issued by the Secretary of State for the Environment, Food and Rural Affairs.
The accounting policies contained in the FReM apply International Financial Reporting Standards (IFRS), as adapted or interpreted for the public sector context.
Where the FReM permits a choice of accounting policy, a judgement has been made to select the most appropriate policy to suit the particular circumstances of the Department, for the purpose of giving a true and fair view. The Department’s accounting policies have been applied consistently in dealing with items which are considered material in relation to the Accounts.
1.1 Significant Judgments and Estimation Uncertainty
The preparation of financial statements requires management to make judgements, estimates and assumptions that affect the reported amounts of assets and liabilities, disclosures of contingent assets and liabilities and the reported amount of income and expenditure. All estimates are based on knowledge of current facts and circumstances, assumptions concerning past events, and forecasts of future events and actions. Where appropriate, the relevant notes to the Accounts provide further detail on estimation techniques.
Details of significant judgements that management have made in the process of applying the Department’s accounting policies are as follows:
• revenue recognition – Single Payment Scheme (SPS) (see Note 1.5.1) and Rural Development Programme Expenditure (RDPE) (see Note 1.5.2);
• service concession arrangements (see Note 1.6.2);
• Environment Agency (EA) accrued and deferred income (see Note 1.12);
• EA capital works expensed (see Note 1.16);
• foreign exchange (see Note 1.18.3);
• provisions, including those for disallowance (see Note 16.3), abandoned metal mines (see Note 16.5) and foot and mouth disease burial sites (see Note 16.6);
• property plant and equipment valuation (see Note 1.6.1); and
• pension liabilities (see Note 1.20). Independent and qualified actuaries assess the specific factors that influence the pension fund position.
1.2 Accounting Convention
These accounts have been prepared on an accruals basis under the historical cost convention, modified to account for the revaluation of property, plant and equipment, intangible assets and certain financial assets and liabilities.
1.3 Going Concern
In common with other government departments, the future financing of Defra’s liabilities is to be met by future grants of supply and the application of future income approved annually by Parliament. Approval for amounts required for 2015–16 is due to be given before the Parliamentary Recess and there is no reason to believe that

Department for Environment, Food and Rural Affairs Annual Report and Accounts 2014–15 Chapter 8 – Notes to the Departmental Accounts
78
future approvals will not be made. It has accordingly been considered appropriate to adopt a going concern basis for the preparation of these financial statements.
1.4 Basis of Consolidation
These accounts comprise a consolidation of the Core Department, Executive Agencies and those other Network Bodies which fall within the departmental boundary as defined in the FReM and make up the ‘Departmental Group’. A list of those entities within the departmental boundary is given in Note 23. This includes the Forestry Commission (FC), which is included within the results of the Core Department and Executive Agencies. Transactions between entities included in the consolidation have been eliminated.
1.5 Scheme Costs and Grants
1.5.1 RPA Reported Income and Expenditure SPS (Pillar I) expenditure for England is managed by the Rural Payments Agency (RPA) on behalf of Defra. Defra has no Managing Authority status for SPS and consequently SPS expenditure and associated European Commission (EC) income is recognised in RPA’s ARA. Generally expenditure is recognised when RPA has a present obligation as a result of the completion of all substantive processes to validate each claim and the amount payable being reliably measurable and probable.
Where appropriate, SPS expenditure is reported net of Modulation. For further details see RPA’s ARA.
Other UK Paying Agencies make payments to claimants under both the European Agricultural Guarantee Fund and the European Agricultural Fund for Rural Development. The payments made by the other UK Paying Agencies are funded by RPA and subsequently recovered by the Agency from the EC.
Scheme expenditure in relation to funding provided by RPA is recognised when RPA has a present obligation to make payment to the other UK Paying Agencies and the amount payable is considered reliably measurable and probable. These conditions are deemed to be met upon the receipt of a funding request from the other UK Paying Agencies, adjusted for amounts unspent by the paying agencies at period end.
Scheme income in relation to funding provided to the other UK Paying Agencies is recognised by RPA when it is probable that it will receive reimbursement from the EC for scheme expenditure incurred and the amount to be received from the EC is considered reliably measurable. These conditions are deemed to be met at the point that the related scheme expenditure is recognised.
1.5.2 Other Reported Scheme Income and Expenditure Payments under RDPE are made by RPA and FC on behalf of Defra. Defra’s status as Managing Authority for RDPE conveys the risks and rewards associated with budget responsibility and consequently RDPE expenditure and associated EU income is recognised in Core Defra’s ARA. Defra delegates authority to RPA to administer certain elements of RDPE, including validation and payments of eligible claims as authorised by Natural England (NE) and the RPA. FC has delegated authority from RPA to authorise and make its own payments. Generally, the amounts are recognised when Defra has a present obligation as a result of the completion of all substantive processes to validate each claim and the amount payable being reliably measurable and probable. Expenditure for agri-environment scheme revenue agreements is recognised on the anniversary of the agreement start date, when it is deemed that contractual obligations have been met. RDPE EC income is recognised at the same time as the EC element of the expenditure is recognised.
1.6 Property, Plant and Equipment
1.6.1 Recognition and Valuation With the exception of the EA’s Infrastructure Assets (see below), Freehold land and buildings and, where appropriate, Assets under Construction, are subject to professional valuation at no more than five yearly intervals. These are carried out by professionally qualified independent valuers, who adhere to the principles

Department for Environment, Food and Rural Affairs Annual Report and Accounts 2014–15 Chapter 8 – Notes to the Departmental Accounts
79
outlined in the Royal Institution of Chartered Surveyors (RICS) Red Book. The most recent valuation at the Core Department was conducted in December 2014 by Montagu Evans under the guidance of a qualified director in their valuation department. A top up assessment is performed at 31 March 2015 to ensure that the year-end valuation is appropriate. NE and EA commissioned a full quinquennial valuation exercise in March 2011 performed by the Valuation Office Agency and Chartered Surveyors King Sturge, respectively.
Land and buildings are stated at fair value, which in practice is either depreciated replacement cost, open market value or existing use value. In use non–specialised properties are stated at open market for existing use. Between professional valuations, annual desk top revaluations are conducted, which have regard to prevailing local and national conditions.
EA’s infrastructure asset category represents those assets used in their service delivery and are specific in either nature, location or function. It is not possible to effectively revalue these assets using market comparatives or professional valuations. These assets are held at depreciated replacement cost and are indexed annually.
Non-property tangible assets have been stated at fair value.
Minimum levels of capitalisation within the departmental boundary are generally in the ranges of £1,000–£10,000 although, for all land at the EA no de minimis threshold is in force.
1.6.2 Service Concession Arrangements HM Treasury has determined that government bodies shall account for infrastructure schemes where the government body controls the use of the infrastructure and the residual interest in the infrastructure at the end of the arrangement as service concession arrangements. Defra has entered into a contract with IBM for the supply of IT services. The contract is for a term of eight years from February 2010. The contract is disclosed within the Accounts as a service concession arrangement. The substance of the contract is that the Department has a finance lease and payments comprise of two elements – the imputed finance lease charges and service charges. A matching asset has been raised to reflect the benefit that the Department will derive from having access to IBM’s IT infrastructure assets. Depreciation has been applied on a straight line basis consistent with the Department’s depreciation policy. These IT infrastructure assets, which consist of laptops, servers and hardware, are classed as one tangible service concession asset under property, plant and equipment. The services received under the contract are recorded as an operating lease.
1.6.3 Lease Breaks The Estates Strategy states that the default position is that lease breaks are exercised. Defra undertakes a detailed annual review on the material lease exits. This has the implication of recognising the lease commitment (and any depreciation) to the lease break date. If however, the evidence suggests that it is unlikely individual lease breaks will be exercised, the commitment is until the end of the lease.
1.7 Assets Under Construction
Assets under construction are shown at accumulated cost with depreciation commencing when the asset is completed and brought into service.
1.8 Heritage Assets
NE fulfils a stewardship role in respect of National Nature Reserves. National Nature Reserves land is classified as non-operational heritage assets, reported in the Statement of Financial Position (SoFP) at fair value, stated at market value, and is subject to professional valuation every five years. In between valuations, values are updated annually, where material, using a combination of indices issued by RICS and the Department for Business, Innovation and Skills. Any surplus or deficit compared to their historic cost is recognised in the Revaluation Reserve, to the value of the previous upward revaluation, and is reported in the

Department for Environment, Food and Rural Affairs Annual Report and Accounts 2014–15 Chapter 8 – Notes to the Departmental Accounts
80
Statement of Comprehensive Net Expenditure (SoCNE) and Statement of Changes in Taxpayers’ Equity (SoCTE). Royal Botanic Gardens Kew (RBG Kew) also holds heritage assets. RBG Kew has not capitalised heritage buildings acquired before 2001–02, as the cost of obtaining valuations for older collections and buildings is onerous compared to the benefit to the readers of the Accounts.
1.9 Intangible Non Current Assets
Intangible assets are defined as identifiable non–monetary assets without physical substance.
These comprise software licences and internally developed IT software, including construction in progress (CIP).
The Department holds various software licences, which were capitalised at purchase cost where this exceeds capitalisation thresholds. Such assets are revalued only where it is possible to obtain a reliable estimate of their market value.
The Department's expenditure on research activities is written off to the SoCNE as incurred. Capitalisation of development costs is contingent on fulfilment of the criteria noted in IAS 38 (Intangible Assets).
Internally developed computer software includes capitalisation of internal IT staff costs on projects. The Department does not hold any intangible assets with an indefinite useful life. The capitalisation threshold for the Defra Network ranges between £2,000 and £100,000. When fully operational in the business, internally generated computer software is stated at a proxy for fair value, which generally, if it is not income generating, is indexed depreciated replacement cost.
1.10 Depreciation and Amortisation
Depreciation and amortisation are provided using the straight line method over the estimated useful life of the asset.
Land, assets under construction, non–operational heritage assets and assets held for sale are not depreciated or amortised.
Componentisation has been adopted by certain entities within the consolidation boundary. In these instances, each component of an asset with a value deemed material to the total fair value of the asset is capitalised and depreciated separately. Where componentisation is not yet fully in place, proxy values have been estimated using the weighted average useful life method. Estimated useful lives, component values and residual values are appropriately set across the Defra Network and are revised annually.
Assets are depreciated over the following timescales.
• Infrastructure assets (EA) 15 to 100 years
• Freehold and leasehold buildings Up to 60 years or remaining life of lease
• Vehicles, plant, machinery and equipment Up to 30 years
• Intangible assets Up to 25 years

Department for Environment, Food and Rural Affairs Annual Report and Accounts 2014–15 Chapter 8 – Notes to the Departmental Accounts
81
1.11 Impairment
Impairments are recognised when the recoverable amount of non–current assets falls below their carrying amount. An impairment review is carried out on an annual basis.
Any permanent diminution in the value of an asset due to clear consumption of economic benefit or service potential should be recognised in full as an impairment loss in the SoCNE. An amount up to the value of the impairment is transferred to the General Fund for the individual asset concerned.
Downward revaluations, resulting from changes in market value, only result in an impairment where the asset is revalued below its historical cost carrying amount. In these cases the accounting treatment is as for any other impairment, with amounts being firstly set against any accumulated balance in the Revaluation Reserve, and any amount in addition to this being recognised as an impairment and recorded in the SoCNE.
1.12 Income
Operating income relates directly to the operating activities of the Department. Income is recognised on an accruals basis and the amounts are recorded at fair value. The method adopted for measuring the stage of completion is as described in IAS 18.
Accrued and deferred income have been included for EA’s fees and charges balances where there is a surplus or deficit. These balances are only treated as deferred or accrued income where there is an expectation that they will be recovered over a reasonable period of time. The balances are considered when setting future years’ fees and charges, to enable a break even position to be achieved over a reasonable time period, which is currently considered to be three years.
1.13 Cash and Cash Equivalents
Cash and cash equivalents comprise cash in hand and current balances with banks and other financial institutions.
1.14 Grant–in–Aid Funding
Grant–in–Aid from the Core Department to Non–Departmental Public Bodies (NDPBs), both in respect of capital and revenue expenditure, is treated as funding.
1.15 Administration and Programme Expenditure and Income
The classification of expenditure and income as administration or programme follows the definition set by HM Treasury. Administration costs reflect the costs of running the Department, as defined under the administration cost control regime, together with associated operating income. Income is analysed in the notes between that which is allowed to be offset against gross administrative costs and that operating income which is not. Programme costs reflect administration costs of frontline services and all other non–administration costs.
1.16 Capital Works Expensed
Expenditure which is capital in nature, but for which EA does not retain the risks and rewards in the future, or cannot reliably estimate the useful life of the assets, is expensed in year. It also includes assets where it is not possible to check for impairment, so they are written off in year.
1.17 Foreign Currency Transactions
The functional and presentational currency of the Department is sterling.
Department for Environment, Food and Rural Affairs Annual Report and Accounts 2014–15 Chapter 8 – Notes to the Departmental Accounts
82
Transactions in foreign currencies are translated into sterling using the rate at the date of the transactions. Balances held in foreign currencies are translated at the rate of exchange ruling at the date of the SoFP.
Exchange differences are recognised in the SoCNE in the period in which they arise, except for exchange differences on transactions entered into to hedge certain foreign currency risks (RPA only, see Note 1.19).
1.18 Financial Instruments
1.18.1 Financial Assets The Department holds receivables and other financial assets (including derivatives) with a positive fair value in this category. Receivables are non-derivative financial assets with fixed or determinable payments that are not quoted in an active market. 1.18.2 Financial Liabilities These comprise trade and other payables and other financial liabilities (including derivatives). They are initially recognised at fair value and are subsequently measured at amortised cost.
EA holds certain financial instrument liabilities as a result of reservoir operating agreements with a number of water companies entered into at their privatisation. These liabilities are treated as perpetuities and recorded in the SoFP at amortised cost. The annual payments arising from these liabilities increase annually in line with the Retail Price Index.
1.18.3 Derivative Financial Instruments RPA enters into a variety of foreign exchange forward contracts to manage its exposure to foreign exchange rate risk. Derivative financial instruments are initially recognised at fair value at the date a derivative contract is entered into and are subsequently re–measured to their fair value at each SoFP date. The resulting gain or loss is recognised in the SoCNE immediately, unless the derivative is designated and effective as a hedging instrument, in which event the timing of the recognition in the SoCNE depends on the nature of the hedge relationship. RPA designates certain derivatives as hedges of highly probable forecast transactions (cash flow hedges).
A derivative with a positive fair value is recognised as a financial asset, whereas a derivative with a negative fair value is recognised as a financial liability. A derivative is presented as a current asset or current liability if the remaining maturity of the instrument is less than 12 months or is greater than 12 months but is expected to be realised or settled within 12 months.
1.19 Hedge Accounting
In accordance with IAS 39, RPA elected to designate certain foreign currency derivatives as cash flow hedges.
The effective portion of changes in the fair value of derivatives that are designated and qualify as cash flow hedges is recognised in the cash flow hedge reserve within Taxpayers’ Equity. The gain or loss relating to the ineffective portion is recognised immediately in income or expenditure, and is included in the SoCNE.
Amounts previously recognised in the cash flow hedge reserve and accumulated in Taxpayers’ Equity are reclassified to expenditure or income in the periods when the hedged item is recognised in the SoCNE, in the same line as the recognised hedged item.
1.20 Pensions
Generally pension benefits are provided through the civil service pension arrangements, full details of which can be found in the Remuneration Report and in Note 3.

Department for Environment, Food and Rural Affairs Annual Report and Accounts 2014–15 Chapter 8 – Notes to the Departmental Accounts
83
Although the Principal Civil Service Pension Scheme (PCSPS) is an unfunded defined benefit scheme, in accordance with explicit requirements in the FReM, departments, agencies and other bodies account for the scheme as if it were a defined contribution plan. Costs of the elements are recognised on a systematic and rational basis over the period during which it benefits from employees’ services by payment to the PCSPS of amounts calculated on an accruing basis. Liability for payment of future benefits is a charge on PCSPS. The PCSPS pension scheme undergoes a reassessment of the contribution rates by the Government Actuary at four–yearly intervals. In respect of defined contribution schemes, the Department recognises the contributions payable for the year.
Where the Department is responsible for pension schemes from delivery bodies, it has fully adopted IAS 19 Employee Benefits. The Department recognises a liability in respect of any deficit, being the excess of the present value of the scheme’s liabilities over the value of the assets in the scheme, to the extent that the Department has a legal or constructive obligation to make good the deficit in the scheme. Scheme managers/trustees are required to undertake a sensitivity analysis for each significant actuarial assumption, showing how the defined benefit obligation would have been affected by changes in the relevant actuarial assumption that were reasonably possible at that date. Details of this can be found in Note 17.
1.21 Provisions
The Department provides for obligations arising from past events where the Department has a present obligation at the SoFP date, and where it is probable that it will be required to settle the obligation and a reliable estimate can be made. Where material, future costs have been discounted using the rates as directed by HM Treasury. Details of the Department’s policy on disallowance provisions can be found in Note 16.3 and Chapter 3.
1.22 Contingent Liabilities
In addition to contingent liabilities disclosed in accordance with IAS 37, the Department discloses, for Parliamentary reporting and accountability purposes, certain statutory and non–statutory contingent liabilities where the likelihood of a transfer of economic benefit is remote.
Where the time value of money is material, contingent liabilities are stated at discounted amounts and the amount reported to Parliament separately noted. Contingent liabilities that are not required to be disclosed by IAS 37 are stated at the amounts reported to Parliament. Further information is provided in Note 18.
1.23 Carbon Reduction Commitment
Defra is required to purchase and surrender allowances on the basis of carbon dioxide emissions. As carbon dioxide is emitted, a liability and an expense are recognised. The liability will be discharged by surrendering allowances. The liability is measured at the best estimate of the expenditure required to meet the obligation, normally at the current market price of the number of allowances required to meet the liability at the reporting date.
1.24 Impending Application of Newly Issued Accounting Standards Not Yet Effective
IAS 8 requires disclosures in respect of new IFRSs, amendments and interpretations that are, or will be applicable after the reporting period. There are a number of IFRSs, amendments and interpretations that have been issued by the International Accounting Standards Board that are effective for future reporting periods. Defra has not adopted any new IFRS standards early.
IFRS 13 (Fair Value Management) has not been adopted ahead of its implementation date. Defra has reviewed the changes and has determined that there will be no significant impact on the accounts from 2015–16.
No other amendments are anticipated to have an impact on the financial statements.

Department for Environment, Food and Rural Affairs Annual Report and Accounts 2014–15 Chapter 8 – Notes to the Departmental Accounts
84
2 Statement of Operating Costs by Operating Segment
The segmental analysis detailed below covers the key spending areas of the Department and is aligned with the internal reporting to the Defra Board, Network Executive Committee and Finance Panel. Defra reports regularly on this basis and performance is monitored against these areas.
The basis for accounting for any transactions between reportable segments is compliant with the rest of the Annual Report and Accounts and eliminates transactions between Defra's Network Bodies.
In 2014–15 Defra received £3,139m, 82 percent of its funding from the EU (2013–14, restated £3,372m, 83 percent), which falls mainly to the Executive Agencies and Rural Development segments. Of the remaining income Defra does not rely on any one major customer.
ProgrammeGross
ExpenditureGross
IncomeNet
TotalGross
ExpenditureGross
IncomeNet
Total£000 £000 £000 £000 £000 £000
Animal and Plant Health Scanning and Trade Policy Directorate 62,401 (875) 61,526 62,692 (778) 61,914 Animal Health and Welfare: Disease Control Directorate 157,733 (24,071) 133,662 156,591 (25,664) 130,927 Marine and Fisheries 69,772 (21,836) 47,936 75,094 (22,476) 52,618 Operations1 425,914 (74,757) 351,157 241,243 (61,500) 179,743 Climate, Waste and Atmosphere 127,351 (42) 127,309 138,538 (26) 138,512 Rural Development, Sustainable Communities and Crops 614,323 (475,592) 138,731 620,168 (452,730) 167,438 Sustainable Land Management and Livestock Farming2 284,381 (78,354) 206,027 298,742 (72,971) 225,771 Water and Flood Risk Management3 1,410,902 (412,940) 997,962 1,270,458 (428,240) 842,218 Executive Agencies4 3,148,117 (2,755,665) 392,452 3,389,886 (3,016,042) 373,844
Net Operating Cost 6,300,894 (3,844,132) 2,456,762 6,253,412 (4,080,427) 2,172,985
2014-15 2013-14 Restated
1. Operations: provides central support functions and specialist advice to allow the Department to operate effectively and deliver on it's objectives. It also includes CAP Disallowance. 2. The Net Total includes £173,236 for Natural England made up of Gross Expenditure £183,908 and Gross Income £10,672 (Net Total £178,525, Expenditure £187,390, Income £8,865 for 2013–14). 3. The Net Total Includes £934,566 for Environment Agency made up of Gross Expenditure £1,340,638 and Gross Income £406,072 (Net Total £828,129, Expenditure £1,249,901, Income £421,772 for 2013–14). 4. The Net Total Includes £177,297 for RPA made up of Gross Expenditure £2,831,262 and Gross Income £2,653,965 (Net Total £146,059, Expenditure £3,056,178, Income £2,910,119 for 2013–14).

Department for Environment, Food and Rural Affairs Annual Report and Accounts 2014–15 Chapter 8 – Notes to the Departmental Accounts
85
3 Staff Numbers and Related Costs
3.1 Staff Costs
Staff costs comprise:
2014-15 2013-14
Permanent Employed Staff Others Ministers
Special Advisors Total
Total Restated
£000 £000 £000 £000 £000 £000
Salaries and wages 708,579 53,277 218 128 762,202 802,096 Social security costs 57,998 240 22 17 58,277 59,416 Other pension costs 66,355 5,306 1 34 71,696 76,517 Sub total 832,932 58,823 241 179 892,175 938,029
Less: recoveries in respect of outward secondments (3,571) (3,571) (3,357)
Total net costs 829,361 58,823 241 179 888,604 934,672
2014-15 2013-14 Restated
Of which:
Charged to Administration
Budgets
Charged to Programme
Budgets Total
Charged to Administration
Budgets
Charged to Programme
Budgets Total £000 £000 £000 £000 £000 £000
Core Department 114,635 4,063 118,698 106,644 7,377 114,021 Agencies 193,395 57,847 251,242 193,773 57,106 250,879 NDPBs 75,985 416,384 492,369 107,073 436,960 544,033 Net Total SoCNE 384,015 478,294 862,309 407,490 501,443 908,933
Staff costs capital:Core Department 660 693 Agencies - - NDPBs 29,206 28,403 Less: recoveries in respect of outward secondments (3,571) (3,357)Total net costs 888,604 934,672
Senior staff remuneration is included in the Remuneration Report in Chapter 4.
For 2014–15, out of the total, £3.6m (£0.5m Core Department) recoveries in respect of outward secondments have been netted off, £29.9m (£0.7m Core Department) has been charged to capital and the balance of £862.3m (£118.7m Core Department) has been charged in the SoCNE.
For 2013–14, out of the total, £3.4m (restated £0.7m Core Department) recoveries in respect of outward secondments were netted off, £29.1m (£0.7m Core Department) was charged to capital and the restated balance of £908.9m (£114.0m Core Department) was charged in the SoCNE.
Principal Civil Service Pension Scheme (PCSPS)
Pension benefits for most employees of the Department are provided through the PCSPS. The PCSPS is an unfunded multi–employer defined benefit scheme. Defra is unable to identify its share of the underlying assets and liabilities. The last full actuarial valuation was carried out as at 31 March 2012. Details can be found in the Annual Accounts of the Cabinet Office: Civil Superannuation22.
For 2014–15, employer’s contributions of £55.4m (2013–14, £59.7m) were payable to the PCSPS at one of four rates in the range 16.7 percent to 24.3 percent of pensionable pay, based on salary bands. The Scheme
22 http://www.civilservicepensionscheme.org.uk/

Department for Environment, Food and Rural Affairs Annual Report and Accounts 2014–15 Chapter 8 – Notes to the Departmental Accounts
86
Actuary reviews employer contributions usually every four years following a full scheme valuation. The contribution rates are set to meet the cost of the benefits accruing during 2014–15 to be paid when the member retires and not the benefits paid during this period to existing pensioners.
Other Pension Schemes
Employees can opt to open a partnership pension account: a stakeholder pension with an employer contribution. For 2014–15 employer’s contributions of £12.7m (2013–14, £12.4m) were paid to one or more of the panel of three appointed stakeholder pension providers. Employer contributions are age related and range from 3 percent to 12.5 percent of pensionable pay. Employers also match employee contributions up to 3 percent of pensionable pay. In addition, employer contributions of £17,000 for 2014–15 (2013–14, £8,000), 0.8 percent of pensionable pay, were payable to the PCSPS to cover the cost of the future provision of lump sum benefits on death in service or ill health retirement of these employees. Contributions due to the partnership pension providers at the reporting period date were £21,000 (2013–14, £11,000). Contributions prepaid at that date were £Nil (2013–14, £Nil).
In addition to the schemes listed above, some NDPBs also operate small defined contribution schemes. Details of these schemes can be found in the ARAs of the relevant Network Bodies.
There were two individuals in the Core Department (2013–14, Nil) who retired early on ill health grounds. The total additional accrued pension liabilities in the year amounted to £1,000 (2013–14, £Nil).
Loans are made to staff to cover season ticket advances and to relocate. As at 31 March 2015, there were no outstanding balances to Core Department senior officials.
3.2 Average Number of Persons Employed
The average number of whole–time equivalent persons employed within the Departmental Group during the year was as follows:
2013-14 Permanently
Employed Staff Others MinistersSpecial
Advisors TotalRestated
Total Activity Number Number Number Number Number Number
Animal and Plant Health Scanning and Trade Policy Directorate 109 2 - - 111 99 Animal Health and Welfare: Disease Control Directorate 99 1 - - 100 97 Marine and Fisheries 443 3 - - 446 482 Operations1 1,509 186 4 2 1,701 1,866 Climate, Waste and Atmosphere 208 4 - - 212 178 Rural Development, Sustainable Communities and Crops 813 89 - - 902 887 Sustainable Land Management and Livestock Farming2 2,835 268 - - 3,103 3,261 Water and Flood Risk Management3 9,127 411 - - 9,538 10,308 Executive Agencies4 5,363 210 - - 5,573 5,681
Staff engaged on capital projects3 1,083 106 - - 1,189 1,238
Total 21,589 1,280 4 2 22,875 24,097
Of which:Core Department 1,945 240 4 2 2,191 2,184 Agencies 5,918 297 - - 6,215 6,315 NDPBs 13,726 743 - - 14,469 15,598
Total 21,589 1,280 4 2 22,875 24,097
2014-15
1. Operations: provides central support functions and specialist advice to allow the Department to operate effectively and deliver on its objectives. It also includes CAP Disallowance. 2. Includes 2,241 for NE (2,372 for 2013–14). 3. Includes 10,357 for EA (11,199 for 2013–14). 4. Includes 2,116 for RPA (2,138 for 2013–14).

Department for Environment, Food and Rural Affairs Annual Report and Accounts 2014–15 Chapter 8 – Notes to the Departmental Accounts
87
3.3 Reporting of Civil Service and Other Compensation Schemes – Exit Packages
Departmental Group
2014-15 2013-14Restated Restated Restated
Number of Compulsory
Redundancies
Number of Other Departures
Agreed Total Number of
Exit Packages
Number of Compulsory
Redundancies
Number of Other Departures
Agreed Total Number of
Exit Packages Number Number Number Number Number Number
Cost band< £10,000 9 16 25 8 33 41 £10,000 - £25,000 2 54 56 7 166 173 £25,001 - £50,000 2 53 55 - 168 168 £50,001 - £100,000 4 49 53 4 106 110 £100,001 - £150,000 - 10 10 - 19 19 £150,001 - £200,000 - 1 1 - 13 13 £200,001 - £250,000 1 1 2 - 2 2 £250,001 - £300,000 - - - - - - £300,001 - £350,000 - - - 1 - 1 Total number of exit packages by type 18 184 202 20 507 527
Total resource cost (£000) 647 8,063 8,710 713 21,503 22,216
Redundancy and other departure costs have been paid in accordance with the provisions of the Civil Service Compensation Scheme, a statutory scheme made under the Superannuation Act 1972. Exit costs are accounted for in full in the year of departure. Where the Department has agreed early retirements, the additional costs are met by the Department and not by the Civil Service Pension Scheme. Ill–health retirement costs are met by the Pension Scheme and are not included in the Table. There were no exit packages relating to senior staff.

Department for Environment, Food and Rural Affairs Annual Report and Accounts 2014–15 Chapter 8 – Notes to the Departmental Accounts
88
4 Other Administration Costs
2014-15 2013-14Restated Restated
Core Department Core Department
and Agencies Departmental
Group Core Department Core Department
and Agencies Departmental
Group £000 £000 £000 £000 £000 £000
Rentals under operating leases 7,847 10,902 16,598 10,677 13,900 19,266 Interest charges 274 326 326 366 527 527 Off balance sheet PFIs service charges 118 187 1,036 266 266 1,070 Fees and commissions 11,446 11,446 14,551 9,833 9,833 12,623 Official veterinarian costs - 27,841 27,841 - 26,068 26,068 Research and development expenditure - - 1,729 - - 4,207 Travel, subsistence and hospitality 4,210 14,160 22,531 4,388 13,724 19,373 Vessels - 5,348 5,348 - 5,247 5,247 Consumables - 21,574 22,460 - 23,336 24,330 IT service costs 44,563 89,437 125,087 36,426 80,783 115,819 Estate management 14,280 54,047 83,483 14,459 56,884 86,186 Consultancy 6,524 7,550 7,620 6,180 6,559 10,623 Hired and contracted services - - 7,231 - - 6,100 Training 1,568 3,874 7,120 1,057 2,639 6,956 Publicity, marketing and promotion 619 698 973 1,063 1,156 1,559 Stationery and printing 142 1,742 2,073 129 1,151 1,668 Office services 1,710 5,500 6,215 2,130 8,037 8,773 Early retirement 68 1,230 1,521 1 3,118 3,288 NAO auditors' remuneration - - 414 - - 459 Internal audit fees - 357 606 - 252 459 Exchange rate (gains)/losses - realised - 195 195 - (16) (16)Other 3,761 27,842 34,081 4,299 30,672 33,649 Non cash items Depreciation 12,571 26,290 41,829 14,549 29,336 44,007 Amortisation 6,976 19,450 25,283 7,790 22,095 26,558 Profit on the disposal of PPE and financial investments (31,031) (31,014) (31,014) (1,051) (980) (1,011) Loss on the disposal of PPE and financial investments 16,396 17,099 17,731 408 786 1,631 Impairment 5,360 5,360 5,360 650 5,065 5,346 NAO auditors' remuneration 420 1,120 1,120 428 1,194 1,194 Other non cash items - (10) (10) - 216 216 Total 107,822 322,551 449,338 114,048 341,848 466,175

Department for Environment, Food and Rural Affairs Annual Report and Accounts 2014–15 Chapter 8 – Notes to the Departmental Accounts
89
5 Programme Costs
2014-15 2013-14Restated Restated Restated
Core Department Core Department and
Agencies Departmental
Group Core Department Core Department and
Agencies Departmental
Group £000 £000 £000 £000 £000 £000
Rentals under operating leases 28 28 24,466 45 45 26,977 Travel, subsistence and hospitality 209 3,474 18,540 461 3,482 21,975 Off balance sheet PFIs and other service concession arrangement service charges - - 8,500 - - 7,900 Research and development expenditure 71,178 72,023 106,590 91,453 92,304 122,156 Consumables - 63 16,697 - 51 12,774 IT service costs (1,616) 8,823 95,650 30 11,982 100,271 Estate management 17 4,115 17,100 1 4,505 13,874 Consultancy 2,759 2,759 16,729 3,560 3,560 21,482 Hired and contracted services - - 50,943 - - 27,574 Training 22 340 4,270 47 418 5,379 Publicity, marketing and promotion 13 13 14,070 (3) (3) 14,222 Stationery and printing 6 6 1,926 37 37 1,928 Office services 40 40 818 86 86 835 Early retirement 271 391 2,385 (584) 2,164 4,392 Exchange rate (gains)/losses - realised 736 (985) (984) (15) (1,468) (1,454)Exchange rate (gains)/losses - unrealised 2,523 7,405 7,405 (90) (1,756) (1,756)NAO auditors' remuneration - - 172 - - 184 Other audit fees - 2,473 2,473 - 1,253 1,253 Internal audit fees - - 85 - - 70 Flood and coastal defence works - - 272,570 - - 206,745 Operational maintenance - - 18,089 - - 17,263 Fees and commissions 8 8 14,551 19 19 16,226 Reservoir operating agreements - - 21,218 - - 20,322 Transport and plant costs - - 16,906 - - 17,701 Aerial, surface and satellite surveillance - - 2,088 - - 3,633 EU disallowance 53,134 53,134 53,134 (7,446) (7,446) (7,446)Levy collection costs - - 911 - - 872 Forestry Commission subsidy to FEE - 8,800 8,800 - 19,850 19,850 Corporation tax paid by NDPBs - - 17 - - 70 Payments to Defra Executive Agencies 226,511 - - 231,713 - - Bad debt expense - 58 3,703 - 235 1,928 Other 55,830 68,579 89,057 42,263 52,034 49,483
Non cash items Depreciation 4 1,328 70,512 - 1,403 72,156 Amortisation 7,273 19,042 39,637 8,112 21,336 43,700 Profit on the disposal of PPE - - (83) - - (3,266) Loss on the disposal of PPE - 45 577 - 390 535 Impairment 82,217 82,941 97,658 7,122 16,129 30,012 NAO auditors' remuneration - 35 35 - 29 29 Pensions provided for in year/(written back) 30,484 30,484 125,751 29,366 29,366 116,534 Non pension liability provided for in year/(written back)* 43,958 64,245 70,638 (1,289) 416 (4,276) Unwinding of discount on provisions - 45 45 - 39 39
Grants and subsidies: EU Current grants - Single Payment Scheme - 1,545,901 1,545,901 - 1,671,523 1,671,523 Current grants - Rural Development Programme for England 469,566 469,566 469,566 449,118 449,118 449,118 Current grants - payments to other paying agencies - 1,079,046 1,079,046 - 1,203,886 1,203,886 Other EU current grants - 27,602 27,602 66 34,038 44,110 Unrealised (gains)/losses - 4,849 4,849 - (1,811) (1,811) Derivative ineffectiveness - (128) (128) - - -
Grants and subsidies: other Capital grants 72,629 72,629 224,262 49,906 49,906 124,024 Current grants - Grant-in-Aid to NDPBs 1,133,657 1,133,657 - 902,487 902,487 - Current grants - Rural Development Programme for England 68,554 68,554 68,554 94,207 94,207 94,207 Other current grants 253,659 253,841 275,946 287,537 287,417 311,101 Total 2,573,670 5,085,229 4,989,247 2,188,209 4,941,231 4,878,304
*Included in the above is £9m (2013–14, £13m credit) relating to disallowance. The total charge to the SoCNE for disallowance is £62m (2013–14, £18m credit).
Other audit fees do not relate to NAO work undertaken on the audit of the ARA but, primarily, to the Agricultural Funds audit. In 2014–15 the 2014 and 2015 audits ran simultaneously, which explains the increased charge from the previous year.
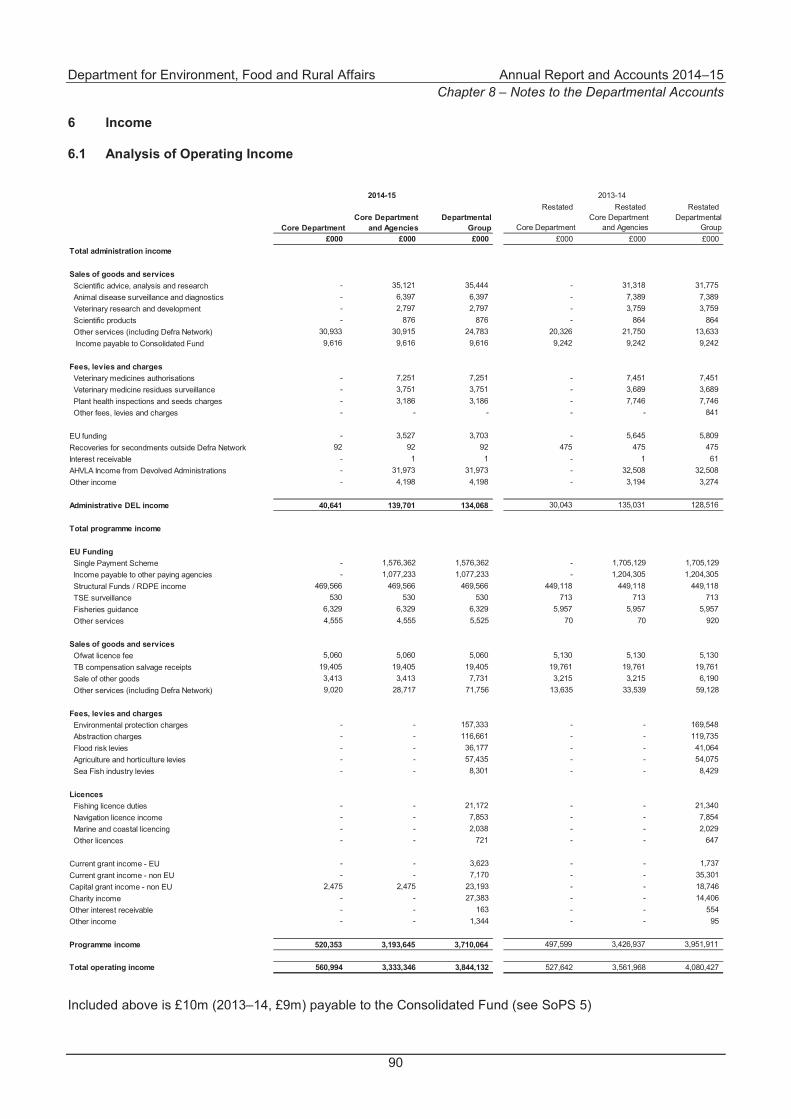
Department for Environment, Food and Rural Affairs Annual Report and Accounts 2014–15 Chapter 8 – Notes to the Departmental Accounts
90
6 Income
6.1 Analysis of Operating Income
2014-15 2013-14Restated Restated Restated
Core Department Core Department
and Agencies Departmental
Group Core Department Core Department
and Agencies Departmental
Group £000 £000 £000 £000 £000 £000
Total administration income
Sales of goods and services Scientific advice, analysis and research - 35,121 35,444 - 31,318 31,775 Animal disease surveillance and diagnostics - 6,397 6,397 - 7,389 7,389 Veterinary research and development - 2,797 2,797 - 3,759 3,759 Scientific products - 876 876 - 864 864 Other services (including Defra Network) 30,933 30,915 24,783 20,326 21,750 13,633 Income payable to Consolidated Fund 9,616 9,616 9,616 9,242 9,242 9,242
Fees, levies and charges Veterinary medicines authorisations - 7,251 7,251 - 7,451 7,451 Veterinary medicine residues surveillance - 3,751 3,751 - 3,689 3,689 Plant health inspections and seeds charges - 3,186 3,186 - 7,746 7,746 Other fees, levies and charges - - - - - 841
EU funding - 3,527 3,703 - 5,645 5,809 Recoveries for secondments outside Defra Network 92 92 92 475 475 475 Interest receivable - 1 1 - 1 61 AHVLA Income from Devolved Administrations - 31,973 31,973 - 32,508 32,508 Other income - 4,198 4,198 - 3,194 3,274
Administrative DEL income 40,641 139,701 134,068 30,043 135,031 128,516
Total programme income
EU Funding Single Payment Scheme - 1,576,362 1,576,362 - 1,705,129 1,705,129 Income payable to other paying agencies - 1,077,233 1,077,233 - 1,204,305 1,204,305 Structural Funds / RDPE income 469,566 469,566 469,566 449,118 449,118 449,118 TSE surveillance 530 530 530 713 713 713 Fisheries guidance 6,329 6,329 6,329 5,957 5,957 5,957 Other services 4,555 4,555 5,525 70 70 920
Sales of goods and services Ofwat licence fee 5,060 5,060 5,060 5,130 5,130 5,130 TB compensation salvage receipts 19,405 19,405 19,405 19,761 19,761 19,761 Sale of other goods 3,413 3,413 7,731 3,215 3,215 6,190 Other services (including Defra Network) 9,020 28,717 71,756 13,635 33,539 59,128
Fees, levies and charges Environmental protection charges - - 157,333 - - 169,548 Abstraction charges - - 116,661 - - 119,735 Flood risk levies - - 36,177 - - 41,064 Agriculture and horticulture levies - - 57,435 - - 54,075 Sea Fish industry levies - - 8,301 - - 8,429
Licences Fishing licence duties - - 21,172 - - 21,340 Navigation licence income - - 7,853 - - 7,854 Marine and coastal licencing - - 2,038 - - 2,029 Other licences - - 721 - - 647
Current grant income - EU - - 3,623 - - 1,737 Current grant income - non EU - - 7,170 - - 35,301 Capital grant income - non EU 2,475 2,475 23,193 - - 18,746 Charity income - - 27,383 - - 14,406 Other interest receivable - - 163 - - 554 Other income - - 1,344 - - 95
Programme income 520,353 3,193,645 3,710,064 497,599 3,426,937 3,951,911
Total operating income 560,994 3,333,346 3,844,132 527,642 3,561,968 4,080,427
Included above is £10m (2013–14, £9m) payable to the Consolidated Fund (see SoPS 5)

Department for Environment, Food and Rural Affairs Annual Report and Accounts 2014–15 Chapter 8 – Notes to the Departmental Accounts
91
6.2 Miscellaneous Core Department Income
In 2014–15 Defra received income of £2.0m in relation to Drinking Water Inspectorate charges. The full cost was £2.7m leaving a deficit of £0.7m.
Income from the Sale of Goods and Services provided by the Executive Agencies and NDPBs can be found in their respective ARAs.

Dep
artm
ent f
or E
nviro
nmen
t, Fo
od a
nd R
ural
Affa
irs
An
nual
Rep
ort a
nd A
ccou
nts
2014
–15
Cha
pter
8 –
Not
es to
the
Dep
artm
enta
l Acc
ount
s
92
7 Pr
oper
ty, P
lant
and
Equ
ipm
ent (
PPE)
7.1
Non
Cur
rent
– D
epar
tmen
tal G
roup
Land
Bui
ldin
gs
Excl
udin
g D
wel
lings
D
wel
lings
Infr
astr
uctu
re
Asse
ts
IT Fu
rnitu
re a
nd
Fitti
ngs
Plan
t and
M
achi
nery
Ve
hicl
es
Asse
ts U
nder
C
onst
ruct
ion
Tota
l £0
00£0
00£0
00£0
00£0
00£0
00£0
00£0
00£0
00£0
00C
ost o
r val
uatio
n A
t 1 A
pril 2
014
(Res
tate
d)82
,077
417,
868
23,8
76
3,
729,
282
77
,173
185,
942
567,
816
41,3
58
16
0,75
9
5,28
6,15
1
Add
ition
s78
5
4,
645
-
-
9,
013
8,
888
14
,331
1,62
5
60,3
04
99,5
91
T
rans
fers
(1,0
96)
(7,7
05)
-
-
5,40
1
(197
)(8
,220
)8
(1
,958
)(1
3,76
7) D
ispo
sals
(204
)(2
,071
)-
(1,1
00)
(11,
604)
(17,
337)
(11,
912)
(1,3
91)
-
(4
5,61
9) I
mpa
irmen
t(8
,466
)(5
5,10
9)-
(400
)-
(2,1
42)
(1,9
68)
-
(5
,660
)(7
3,74
5) R
ecla
ssifi
catio
ns(2
,646
)(6
,542
)-
87,0
00
29
15,2
72
(3
4)34
(1
06,3
14)
(13,
201)
Rec
lass
ified
as
held
for s
ale
542
(677
)(3
97)
(5,9
00)
-
-
-
-
-
(6
,432
) R
eval
uatio
n17
,227
36,4
97
2,
972
15
4,50
0
1,
811
1,
700
13
,338
894
-
22
8,93
9
At
31
Mar
ch 2
015
88,2
19
38
6,90
6
26
,451
3,96
3,38
2
81,8
23
19
2,12
6
57
3,35
1
42
,528
107,
131
5,
461,
917
Dep
reci
atio
n A
t 1 A
pril 2
014
(Res
tate
d)-
64,3
90
2,
481
1,
616,
869
55
,827
109,
050
423,
020
25,9
97
-
2,29
7,63
4
Cha
rges
in y
ear
-
11
,988
769
53,3
92
6,70
5
13,4
60
17
,951
4,63
0
-
10
8,89
5
T
rans
fers
-
(1
,701
)-
-
(1
,704
)(1
84)
(6,3
52)
12
-
(9
,929
) D
ispo
sals
-
(1
,378
)-
(275
)(1
0,27
5)(1
7,08
5)(5
,850
)(1
,139
)-
(36,
002)
Im
pairm
ent
-
(5
79)
-
-
-
(1
23)
(339
)-
-
(1
,041
) R
ecla
ssifi
catio
ns-
-
29
-
-
-
-
-
-
29
R
eval
uatio
n-
(8,7
06)
345
62,9
37
1,13
4
758
10,4
13
66
3
-
67,5
44
At
31
Mar
ch 2
015
-
64
,014
3,62
4
1,73
2,92
3
51,6
87
10
5,87
6
43
8,84
3
30
,163
-
2,
427,
130
Net
Boo
k Va
lue
31 M
arch
201
5 88
,219
322,
892
22,8
27
2,
230,
459
30
,136
86,2
50
13
4,50
8
12
,365
107,
131
3,
034,
787
Ne
t Boo
k Va
lue
31 M
arch
201
4 (R
esta
ted)
82
,077
353,
478
21,3
95
2,
112,
413
21
,346
76,8
92
14
4,79
6
15
,361
160,
759
2,
988,
517
Asse
ts fi
nanc
ing
O
wne
d 88
,219
322,
892
22,8
27
2,
230,
459
30
,136
86,2
50
13
4,05
3
12
,365
107,
131
3,
034,
332
F
inan
ce le
ased
-
-
-
-
-
-
45
5
-
-
45
5
Net
Boo
k Va
lue
31 M
arch
201
5 88
,219
322,
892
22,8
27
2,
230,
459
30
,136
86,2
50
13
4,50
8
12
,365
107,
131
3,
034,
787
Of w
hich
:
Cor
e D
epar
tmen
t
8,72
0
1
9,30
8
-
-
74
51,
762
4,
490
-
8
,447
9
2,80
1 Ag
enci
es
25,
686
2
43,4
32
-
-
2,75
8
56
5
2
0,97
3
24
8
2,9
54
2
96,6
16
NDP
Bs
53,
813
60,
152
22,
827
2
,230
,459
27
,304
33
,923
109
,045
12
,117
95,7
30
2,6
45,3
70
Tota
l 88
,219
322,
892
22,8
27
2,
230,
459
30
,136
86,2
50
13
4,50
8
12
,365
107,
131
3,
034,
787

Dep
artm
ent f
or E
nviro
nmen
t, Fo
od a
nd R
ural
Affa
irs
An
nual
Rep
ort a
nd A
ccou
nts
2014
–15
Cha
pter
8 –
Not
es to
the
Dep
artm
enta
l Acc
ount
s
93
Land
Build
ings
Ex
clud
ing
Dwe
llings
D
wellin
gsIn
frast
ruct
ure
Asse
ts
IT Fu
rnitu
re a
nd
Fitti
ngs
Plan
t and
M
achi
nery
Ve
hicl
es As
sets
Und
er
Con
stru
ctio
n To
tal
£000
£000
£000
£000
£000
£000
£000
£000
£000
£000
Cos
t or
valu
atio
n A
t 1 A
pril
2013
82
,524
52
0,97
8
22
,158
3,
646,
048
95
,693
18
8,21
4
59
1,50
9
45
,062
12
1,47
6
5,
313,
662
A
dditi
ons
310
8,33
7
56
30
,432
7,
056
8,01
9
14
,659
3,
231
52,0
52
124,
152
Tra
nsfe
rs(1
,284
)(6
9,45
3)-
(43,
923)
(13,
355)
(6,1
25)
(17,
875)
(2,5
33)
(6,0
60)
(160
,608
) D
ispo
sals
(3,3
37)
(5,7
47)
(342
)(2
,944
)(5
,134
)(6
,644
)(1
4,13
8)(3
,850
)(6
1)(4
2,19
7) I
mpa
irmen
t(1
82)
(22,
477)
-
(5
3,96
6)(2
,929
)-
(212
)-
(7,2
03)
(86,
969)
Rec
lass
ifica
tions
667
(8,8
82)
51
6,35
8
(1
,153
)2,
016
66
65
555
(257
) R
ecla
ssifi
ed a
s he
ld fo
r sal
e(1
,917
)(3
,025
)(2
,110
)(7
10)
-
-
-
-
-
(7
,762
) R
eval
uatio
n5,
296
(1,8
63)
4,06
3
14
7,98
7
(3
,005
)46
2
(6
,193
)(6
17)
-
14
6,13
0
At
31
Mar
ch 2
014
(Res
tate
d)82
,077
41
7,86
8
23
,876
3,
729,
282
77
,173
18
5,94
2
56
7,81
6
41
,358
16
0,75
9
5,
286,
151
Dep
reci
atio
n A
t 1 A
pril
2013
-
12
4,98
0
1,
533
1,56
3,64
5
63,3
24
102,
831
434,
770
25,7
20
-
2,
316,
803
C
harg
es in
yea
r-
12,4
69
712
52,0
73
6,76
0
15
,411
19
,699
5,
520
-
11
2,64
4
T
rans
fers
-
(6
5,94
4)-
(6,0
79)
(3,7
68)
(3,7
05)
(15,
051)
(1,5
57)
-
(9
6,10
4) D
ispo
sals
-
(6
40)
(19)
(2,0
36)
(5,0
11)
(6,3
56)
(12,
354)
(3,4
07)
-
(2
9,82
3) I
mpa
irmen
t-
(729
)-
(54,
699)
(2,2
34)
-
(1
25)
-
-
(57,
787)
Rec
lass
ifica
tions
-
(4
,730
)11
5,
147
(1,3
01)
767
13
65
-
(2
8) R
eval
uatio
n-
(1,0
16)
244
58,8
18
(1,9
43)
102
(3,9
32)
(344
)-
51,9
29
At 3
1 M
arch
201
4 (R
esta
ted)
-
64
,390
2,
481
1,61
6,86
9
55,8
27
109,
050
423,
020
25,9
97
-
2,
297,
634
Net B
ook
Valu
e 31
Mar
ch 2
014
(Res
tate
d)
82,0
77
353,
478
21,3
95
2,11
2,41
3
21,3
46
76,8
92
144,
796
15,3
61
160,
759
2,98
8,51
7
Net B
ook
Valu
e 31
Mar
ch 2
013
82,5
24
395,
998
20,6
25
2,08
2,40
3
32,3
69
85,3
83
156,
739
19,3
42
121,
476
2,99
6,85
9
Asse
ts fi
nanc
ing
O
wned
82
,077
35
3,47
8
21
,395
2,
112,
413
21
,287
76
,892
14
4,25
8
15
,361
16
0,75
9
2,
987,
920
F
inan
ce le
ased
-
-
-
-
59
-
538
-
-
597
Net B
ook
Valu
e 31
Mar
ch 2
014
82,0
77
353,
478
21,3
95
2,11
2,41
3
21,3
46
76,8
92
144,
796
15,3
61
160,
759
2,98
8,51
7
Of w
hich
:
Cor
e D
epar
tmen
t
1
4,82
6
10
8,38
3
3
80
-
27
44,
753
5
,850
-
22,
621
196,
840
Agen
cies
2
0,69
6
19
5,41
1
-
-
6,0
94
923
3
0,51
4
3
54
923
25
4,91
5 ND
PBs
46,
555
49,
684
21,
015
2
,112
,413
1
5,22
5
3
1,21
6
10
8,43
2
1
5,00
7
13
7,21
5
2,5
36,7
62
Tota
l 82
,077
35
3,47
8
21
,395
2,
112,
413
21
,346
76
,892
14
4,79
6
15
,361
16
0,75
9
2,
988,
517
Pla
nt a
nd m
achi
nery
incl
udes
ves
sels
ow
ned
by C
efas
with
a N
et B
ook
Val
ue o
f £9m
(201
3–14
, £10
m).
Infra
stru
ctur
e as
sets
incl
ude
flood
def
ence
s ow
ned
by E
A, i
nclu
ding
the
Tham
es B
arrie
r with
a
Net
Boo
k V
alue
of £
1,06
1m (2
013–
14, £
1,04
9m).
A
dditi
ons
incl
ude
a no
n–ca
sh e
lem
ent r
epre
sent
ed b
y pa
yabl
es a
nd tr
ansf
ers.

Department for Environment, Food and Rural Affairs Annual Report and Accounts 2014–15 Chapter 8 – Notes to the Departmental Accounts
94
7.2 Right of Use Assets – Service Concession Arrangements
The following assets are included in the SoFP under Property, Plant and Equipment, together with those detailed in Notes 7.1 and 7.4.
Departmental Group
2014-15 2013-14 £000 £000
At 1 April 5,666 8,109 Transfer of Right of Use Asset (29) - Depreciation (1,470) (1,678)Adjustment to the service concession arrangement (268) (765)At 31 March 3,899 5,666
Of which:
Core Department 1,599 2,621 Agencies 1,197 1,524 NDPBs 1,103 1,521 Total 3,899 5,666

Department for Environment, Food and Rural Affairs Annual Report and Accounts 2014–15 Chapter 8 – Notes to the Departmental Accounts
95
7.3 Heritage Assets
A heritage asset is a tangible asset with historical, artistic, scientific, chronological, geophysical or environmental qualities that is held and maintained principally for its contribution to knowledge and culture.
Heritage assets are held by both NE and RBG Kew. Further details can be found in their ARAs.
Departmental Group
2014-15 2013-14
Operational Non
Operational Total Operational Non
Operational Total £000 £000 £000 £000 £000 £000
Valuation At 1 April 156,863 70,006 226,869 145,933 58,400 204,333 Additions 5,145 4,161 9,306 - 717 717 Transfers 2,417 102 2,519 - - - Disposals (508) - (508) - - - Impairment - (5,358) (5,358) - - - Reclassifications - - - - 172 172 Revaluation 13,302 2,757 16,059 10,930 10,717 21,647 At 31 March 177,219 71,668 248,887 156,863 70,006 226,869
Depreciation At 1 April 28,839 - 28,839 25,170 - 25,170 Charged in year 1,976 - 1,976 1,841 - 1,841 Revaluation 2,453 - 2,453 1,828 - 1,828 At 31 March 33,268 - 33,268 28,839 - 28,839
Net Book Value at 31 March 143,951 71,668 215,619 128,024 70,006 198,030 Net Book Value at 1 April 128,024 70,006 198,030 120,763 58,400 179,163
Assets financingOwned 143,951 71,668 215,619 128,024 70,006 198,030 Net Book Value 31 March 143,951 71,668 215,619 128,024 70,006 198,030
7.4 Investment Properties
The following assets are included in the SoFP under Property, Plant and Equipment, together with those detailed in Notes 7.1 and 7.2.
Sand Hutton Site Total
£000 £000
Cost at 1 AprilTransferred from PPE 13,230 13,230
Balance at 31 March 13,230 13,230
2014-15

Department for Environment, Food and Rural Affairs Annual Report and Accounts 2014–15 Chapter 8 – Notes to the Departmental Accounts
96
The Department has freehold ownership of the Sand Hutton site which was previously occupied by Fera. At 31 March 2015 the site was reclassified as an investment property following the closure of Fera.
7.5 Cash Additions
Cash additions (adjusted for capital accruals) for property, plant and equipment, heritage assets and agricultural assets amount to £108m (2013–14, £128m) as per the Consolidated Statement of Cash Flows (SoCF).

Department for Environment, Food and Rural Affairs Annual Report and Accounts 2014–15 Chapter 8 – Notes to the Departmental Accounts
97
8 Intangible Assets
Departmental Group
Internally Generated
Software Purchased
Software IT CIP Total
Internally Generated
Software Purchased
Software IT CIP Total £000 £000 £000 £000 £000 £000 £000 £000
Cost or valuation At 1 April 582,602 57,526 116,654 756,782 590,656 45,857 88,977 725,490 Additions 26,528 370 37,645 64,543 7,954 17,452 30,670 56,076 Disposals (23,233) (4,709) - (27,942) (22,678) (3,197) (367) (26,242) Impairments (23,361) 31 (9,385) (32,715) (6,930) (712) (1,464) (9,106) Transfers (10,019) 2,132 (707) (8,594) 3,637 (958) (1,162) 1,517 Reclassifications 58,547 30,722 (89,269) - - - - - Revaluation 2,980 2,087 - 5,067 9,963 (916) - 9,047 At 31 March 614,044 88,159 54,938 757,141 582,602 57,526 116,654 756,782
Amortisation At 1 April 443,901 20,511 - 464,412 401,204 20,777 - 421,981 Charged in year 55,281 9,639 - 64,920 65,765 4,493 - 70,258 Disposals (22,584) (4,437) - (27,021) (21,998) (3,069) - (25,067) Impairments (11,253) - - (11,253) (2,705) (434) - (3,139) Transfers (3,771) 1,938 - (1,833) (4,044) (583) - (4,627) Reclassifications 86 (86) - - (57) - - (57) Revaluation 1,082 962 - 2,044 5,736 (673) - 5,063 At 31 March 462,742 28,527 - 491,269 443,901 20,511 - 464,412
Net Book Value at 31 March 151,302 59,632 54,938 265,872 138,701 37,015 116,654 292,370 Net Book Value at 1 April 138,701 37,015 116,654 292,370 189,452 25,080 88,977 303,509
Assets financing Owned 151,302 59,632 54,938 265,872 138,701 37,015 116,654 292,370 Net Book Value 31 March 151,302 59,632 54,938 265,872 138,701 37,015 116,654 292,370
Of which:Core Department 68,601 15 18,438 87,054 44,422 18 27,720 72,160 Agencies 32,316 2,034 15,463 49,813 55,860 2,596 11,692 70,148 NDPBs 50,385 57,583 21,037 129,005 38,419 34,401 77,242 150,062 Total 151,302 59,632 54,938 265,872 138,701 37,015 116,654 292,370
2014-15 2013-14 Restated
The Net Book Value for internally generated software includes:
• £20m for the Genesis system held by the Core Department with a remaining amortisation period of 9 years. Genesis is the IT system used by NE to deliver Environmental Stewardship Schemes; and
• £43m for the Common Agricultural Policy Delivery (CAPD) programme held by the Core Department with a remaining amortisation period of 9 years. £16m is also included within Construction in Progress (CIP).
Cash additions (adjusted for capital accruals) shown in the SoCF amount to £59m (2013–14, restated £51m).

Department for Environment, Food and Rural Affairs Annual Report and Accounts 2014–15 Chapter 8 – Notes to the Departmental Accounts
98
9 Impairments
2014-15 2013-14
NoteCore
Department
Core Department and
Agencies Departmental
Group Core
Department
Core Department and
Agencies Departmental
Group £000 £000 £000 £000 £000 £000
PPE 69,683 70,407 81,556 7,350 21,030 29,391 Intangibles 17,894 17,894 21,462 422 164 5,967
Total impairment charge for the year 4, 5 87,577 88,301 103,018 7,772 21,194 35,358
Of which:Amount released from Revaluation Reserve to General Fund - 2 2 - 20,994 20,994
The Core Department includes an impairment on PPE of £54.5m for the Sand Hutton site due to its reclassification as an investment property. There is also an impairment loss of £5.2m in relation to the CAPD Programme included in intangibles. Further details can be found in the Governance Statement in Chapter 7.
10 Financial Commitments
10.1 Capital Commitments
Departmental Group
2014-15 2013-14 £000 £000
Contracted capital commitments at 31 March for which no provision has been made: PPE 77,888 57,924 Intangible assets 1,465 7,082 Total 79,353 65,006
Of which: Core Department 4,767 10,179 Agencies 304 1,011 NDPBs 74,282 53,816 Total 79,353 65,006

Department for Environment, Food and Rural Affairs Annual Report and Accounts 2014–15 Chapter 8 – Notes to the Departmental Accounts
99
10.2 Commitments under Leases
10.2.1 Operating Leases The total future minimum lease payments under operating leases are given in the table below.
Departmental Group
2014-15 2013-14Restated
Core Department Core Department
and Agencies Departmental
Group Core Department Core Department
and Agencies Departmental
Group £000 £000 £000 £000 £000 £000
Land and Buildings Not later than one year 12,594 18,718 31,285 12,915 18,950 30,432 Later than one year and not later than five years 50,233 69,115 106,200 53,256 72,645 106,402 Later than five years 56,412 69,483 103,369 75,607 93,171 131,761 Total 119,239 157,316 240,854 141,778 184,766 268,595
Other Not later than one year - 476 5,131 8 406 11,162 Later than one year and not later than five years - 917 9,601 - 198 16,668 Total - 1,393 14,732 8 604 27,830
The consolidated land and buildings figures within this note show the costs related to properties leased by Defra, net of the proportion occupied by entities outside the Department’s accounting boundary. These arrangements between the occupier and Defra reflect a future commitment to reimburse Defra for the underlying rentals paid to landlords for the provision of leasehold accommodation.
Included within the above figures is a commitment of £29m in respect of 3–8 Whitehall Place for 2014–15 (2013–14, £33m). Although the current legal title is with Defra, in economic reality the Department for Energy and Climate Change (DECC) enjoy complete beneficial occupation. This is further reflected in that the Government Property Unit and the Cabinet Office view the building as DECC property for various property returns. DECC is recharged with the costs of this building lease.
10.2.2 Right of Use Assets – Service Concession Arrangements For details of the Department’s service concession arrangement, regarding the provision of IT services, see Note 1.6.2.
The imputed finance lease charge for the Departmental Group at 31 March 2015 is £10m (2013–14, £10m)
Details of the service charge commitments are disclosed in Note 10.4 Other Financial Commitments.
The total amount charged to the SoCNE, in regard to the service element, is shown in Note 4 and Note 5.
10.3 Commitments under Private Finance Initiative (PFI) Contracts
10.3.1 Off–balance Sheet The majority of PFI contracts associated with Defra are funded by NDPBs and Public Corporations.
An off–balance sheet contract was signed by the Department in February 2001. The scheme involved the grant of a 129 year ground lease to a PFI partner who constructed an office building for Defra, occupied in 2003, subject to a 30 year lease to 31 March 2033. The building is not an asset of the Department and will not revert to Defra at the end of the lease term. The freehold land subject to the ground lease is a Defra asset. Defra occupies 0.4 percent (2013–14, 0.4 percent) of the building and recharges other occupiers for their share of the costs, with NE occupying 16.9 percent (2013–14, 16.9 percent) of the site, APHA occupying 1.5 percent which was previously occupied by Fera (2013–14, 1.5 percent) and RPA occupying 1.3 percent (2013–14, 1.3 percent).

Department for Environment, Food and Rural Affairs Annual Report and Accounts 2014–15 Chapter 8 – Notes to the Departmental Accounts
100
In addition, EA has entered into two Public-Private Partnership contracts, the Broadland Flood Alleviation Project and Pevensey Bay beach maintenance. Contracted future commitments are £13m (2013–14, £19m) and £17m (2013–14, £15m), respectively. Full details of these Public-Private Partnership contracts can be found in EA’s ARA.
10.3.2 Charge to the Statement of Comprehensive Net Expenditure and Future Commitments The total amount charged to the SoCNE, in respect of off–balance sheet (SoFP) transactions is shown in Note 4 and Note 5. The total payments to which the Department is committed are as follows:
Departmental Group
2014-15 2013-14 £000 £000
Not later than one year 4,536 9,137 Later than one year and not later than five years 18,939 18,026 Later than five years 29,764 29,378 Total 53,239 56,541
Number of off-balance sheet PFI contracts 3 3 Total 3 3
Estimated capital value of off-balance sheet PFIs 178,886 179,728
Of which: Core Department 460 469 Agencies 3,384 1,844 NDPBs 49,395 54,228 Total 53,239 56,541
10.4 Other Financial Commitments
The Department has entered into non-cancellable contracts (which are not leases, PFI contracts or other service concession arrangements). The payments to which the Department is committed are as follows:
2014-15 2013-14Restated Restated
Core Department Core Department
and Agencies Departmental
Group Core Department Core Department
and Agencies Departmental
Group £000 £000 £000 £000 £000 £000
Not later than one year 152,723 206,181 298,807 136,559 198,468 295,352 Later than one year and not later than five years 563,547 684,714 793,148 509,591 675,335 878,324 Later than five years 1,443,626 1,514,176 1,520,042 1,217,475 1,313,780 1,321,868
Total 2,159,896 2,405,071 2,611,997 1,863,625 2,187,583 2,495,544
Within the other financial commitments disclosure, £281m (2013–14, £330m) relates to facilities management costs associated with the occupation of buildings that are either owned or leased by Defra or specialised properties held on Executive Agencies’ SoFPs. These commitments are net of the proportion occupied by entities outside the Department’s accounting boundary, where the commitments are consistent with arrangements containing a lease as defined by IFRIC 4.
Also included for the Departmental Group is the commitment of £151m (2013–14, £298m) to pay IBM for IT maintenance as referred to in Note 10.2.2.

Department for Environment, Food and Rural Affairs Annual Report and Accounts 2014–15 Chapter 8 – Notes to the Departmental Accounts
101
The Core Department entered into a 7 year contract with Shared Services Connected Ltd. (SSCL) in November 2013 for the provision of shared services across HR, payroll and finance. The future commitment is £20m (2013–14, £26m).
The Core Department has agreements with local authorities on 25 Waste Infrastructure Grant Projects (formerly Waste PFI projects) that are receiving grant payments. Defra will continue to support these projects while they meet the terms of their agreement with Defra. Future commitments are £1,883m (2013–14, £1,576m).
EA has a commitment of £128m (2013–14, £184m) for an outsourced ICT service contract with Capgemini. Full details regarding the contract can be found in EA’s ARA.
The Core Department is committed to £62m (2013–14, £Nil) with regards to the Fera joint venture 10 year framework agreement for provision of scientific services to Defra and other parts of government. The commitment only relates to the first 5 years of the framework agreement.
11 Financial Instruments
IFRS requires disclosures in the financial statements that enable users to evaluate the significance of financial instruments to the financial position and performance, and the nature and extent of risks arising from financial instruments to which Defra is exposed during the year and at the financial year end, and how those risks are being managed.
As the cash requirements of the Department are met through the Estimates process, financial instruments play a more limited role in creating and managing risk than would apply to a non–public sector body of a similar size. The majority of financial instruments relate to contracts for non-financial items in line with the Department’s expected purchase and usage requirements and the Department is therefore exposed to little credit, liquidity or market risk, except where detailed below.
11.1 Categories of Financial Instruments
Details of financial instruments held by the Department are included in Notes 13, 14 and 15 (non–financial instrument balances relating to taxation, accruals and prepayments are also included in these notes). Further details are given below only where the risks are significant.
11.2 Exposure to Risk
11.2.1 Credit Risk A significant proportion of the Department’s customers and counterparties are other public sector organisations. Minimal credit risk arises from these organisations.
For those customers and counterparties that are not public sector organisations the Department has policies and procedures in place to ensure credit risk is kept to a minimum.
The Department is not exposed to material credit risk.
11.2.2 Liquidity Risk Excluding RPA, there is no significant exposure to liquidity risk, as the Department’s Net Resource Outturn is financed through resources voted annually by Parliament.
RPA has maintained liquidity, wherever possible, through timely submission of funding claims to the European Commission (EC). RPA does not undertake borrowing of funds other than from HM Treasury. Such borrowing, arising from short term in–year fluctuations in expenditure, if required, would be effected by Defra drawing

Department for Environment, Food and Rural Affairs Annual Report and Accounts 2014–15 Chapter 8 – Notes to the Departmental Accounts
102
monies from HM Treasury's Contingencies Fund on behalf of RPA. This facility is the subject of a formal standing arrangement agreed by HM Treasury. Drawings are repayable within the financial year.
11.2.3 Market Risk - Foreign Currency Risk Excluding RPA, there is no significant foreign currency risk.
RPA’s activities expose it to the financial risks of changes in foreign currency exchange rates. RPA enters into forward foreign exchange contracts to manage its exposure to foreign currency risk relating to euro denominated receipts from the EC for SPS and RDPE scheme expenditure (including Scotland, Wales and Northern Ireland, in addition to England).
From January 2003, in accordance with Commission Regulation (EC) No. 1997/2002 (as amended), non–Eurozone member states, such as the UK, are reimbursed by the EC in euros. However, the majority of distributions by RPA are paid in sterling, which creates an exposure to gains or losses from fluctuations in foreign exchange rates between the euro and sterling. RPA has managed its exposure to this risk through the purchase of forward foreign currency contracts. RPA holds derivative assets and liabilities for the purpose of managing foreign currency risk.
For further information on the hedge contracts see Note 1.19 and RPA’s ARA.
The carrying amounts of the RPA’s foreign currency denominated monetary assets and monetary liabilities at the reporting date are as follows:
31 March 2015 31 March 2014 31 March 2015 31 March 2014£000 £000 £000 £000
Euro denominated 141,230 361,969 61,481 110,398
Assets Liabilities
The following table details RPA’s, and therefore the Department’s, sensitivity to a 10 percent increase and decrease in sterling against the euro.
31 March 2015 31 March 2014 31 March 2015 31 March 2014£000 £000 £000 £000
Net Operating Cost * (44,563) (25,092) 44,563 25,092
Derivative instruments:Net Operating Cost ** 41,282 34,235 (39,792) (33,764)Other equity *** 2,661 2,161 (2,661) (2,161)
by 10% by 10%
Impact of Movement in Impact of Movement in Euro/Sterling Rate Euro/Sterling Rate
Sterling Appreciates Sterling Depreciates
*This is attributable to the exposure outstanding on euro receivables and payables at the SoFP date. ** This is the result of the changes in fair value of derivatives instruments held for trading. ***This is the result of the changes in fair value of derivatives instruments designated as cash flow hedges.
11.2.4 Market Risk - Inflation EA is exposed to the risk of changes in the rate of inflation regarding the reservoir operating agreements (see Note 1.18.2). The Retail Prices Index rate has fluctuated significantly over the life of these financial liabilities.

Department for Environment, Food and Rural Affairs Annual Report and Accounts 2014–15 Chapter 8 – Notes to the Departmental Accounts
103
The average rate over the 26 years since 1989 is 3.3 percent, however the range in this period is between 10 percent and -1 percent. This is a macro-economic risk that EA cannot itself manage in any way. However, EA is able to recover the full cost of reservoir operating agreements through its charges on water abstraction.
12 Investments
Stocks and shares Joint VentureOther FSL Total
£000 £000 £000Departmental Group
Balance at 1 April 2013 483 - 483 Disposals 1 - 1 Revaluations 7 - 7 Balance at 31 March 2014 491 - 491
New Shareholding - 6,670 6,670 Balance at 31 March 2015 491 6,670 7,161
Of which:Core-Department - 6,670 6,670 Agencies 175 - 175 NDPBs 316 - 316 Balance at 31 March 2015 491 6,670 7,161
The Department has a 25 percent equity shareholding in Fera Science Limited (FSL). The remaining 75 percent is held by Capita.
13 Cash and Cash Equivalents
2014-15 2013-14Restated
Core Department Core Department
and Agencies Departmental
Group Core Department Core Department
and Agencies Departmental
Group £000 £000 £000 £000 £000 £000
Balance at 1 April 69,887 278,044 418,172 34,103 163,409 338,606 Net change in cash balance (29,123) (100,538) (81,367) 35,784 114,635 79,566 Balance at 31 March 40,764 177,506 336,805 69,887 278,044 418,172
The following balances at 31 March are held at: Government Banking Services 39,640 176,238 293,839 69,378 276,456 375,881 Commercial bank accounts and cash in hand 1,124 1,268 32,577 509 1,588 31,080 Short term investments - - 10,389 - - 11,211 Balance at 31 March 40,764 177,506 336,805 69,887 278,044 418,172

Department for Environment, Food and Rural Affairs Annual Report and Accounts 2014–15 Chapter 8 – Notes to the Departmental Accounts
104
14 Trade Receivables, Financial and Other Assets
31 March 2015 31 March 2014Restated Restated Restated
Core Department Core Department
and Agencies Departmental
Group Core Department Core Department
and Agencies Departmental
Group £000 £000 £000 £000 £000 £000
Amounts falling due within one year Trade receivables 21,626 20,531 51,678 15,016 22,510 70,543 Bad debt impairment (548) (2,487) (10,218) (2) (2,535) (13,884) Deposits and advances 492 508 512 556 569 628 Other receivables 61,782 73,110 76,068 17,009 23,957 29,094 VAT 6,968 9,110 40,511 7,042 9,087 32,584 Prepayments and accrued income 169,661 163,648 213,270 140,856 128,935 178,946 Accrued income relating to EU funding 43,467 468,071 469,816 49,687 367,214 367,522 Trade and other receivables 303,448 732,491 841,637 230,164 549,737 665,433
Current part of derivative financial instrument asset - 25,252 25,252 - 2,133 2,133 Other financial assets - 25,252 25,252 - 2,133 2,133
Amounts falling due after one year Trade receivables 12 12 12 13 13 13 Deposits and advances - - - 7 7 7 Other receivables 11,299 11,406 11,410 11,300 11,423 11,430 Prepayments and accrued income - 49 49 - 117 117 Receivables due after more than one year 11,311 11,467 11,471 11,320 11,560 11,567
Total receivables 314,759 769,210 878,360 241,484 563,430 679,133
Included within receivables is a CFER amount of £4.7m that will be paid to the Consolidated Fund once the debt is collected.
14.1 Intra–Government Balances
Restated Restated31 March 2015 31 March 2014 31 March 2015 31 March 2014
£000 £000 £000 £000
Balances with other central government bodies 110,101 56,675 194 195 Balances with local authorities 10,469 6,661 - - Balances with NHS bodies 32 58 - - Balances with public corporations and trading funds 220 135 - - Subtotal: intra government balances 120,822 63,529 194 195
Balances with bodies external to government 746,067 604,037 11,277 11,372 Total receivables 866,889 667,566 11,471 11,567
Amounts Due Within a Year Amounts Due After a Year

Department for Environment, Food and Rural Affairs Annual Report and Accounts 2014–15 Chapter 8 – Notes to the Departmental Accounts
105
15 Trade Payables and Other Current Liabilities
31 March 2015 31 March 2014Restated Restated Restated
Core Department Core Department
and Agencies Departmental
Group Core Department Core Department
and Agencies Departmental
Group £000 £000 £000 £000 £000 £000
Amounts falling due within one year VAT - 936 2,207 - 1,329 2,382 Other taxation and social security 2,175 5,935 16,522 2,160 7,261 22,344 Trade payables 55,515 10,863 33,190 49,512 19,743 43,940 Other payables: EU - 208 208 - 93,832 93,832 Other 3,365 12,183 85,751 3,359 15,588 81,083 Bank overdraft - - 364 - - - Accruals and deferred income 567,741 612,965 839,234 334,988 373,246 629,245 Current part of finance leases 1,501 2,726 3,761 1,325 2,232 3,001 Amounts issued from the Consolidated Fund for supply but not spent at year end 177,506 177,506 177,506 274,468 274,468 274,468 Consolidated Fund Extra Receipts due to be paid to the Consolidated Fund Received - - - 3,576 3,576 3,576 Receivable 4,722 4,722 4,722 - - - Trade and other payables 812,525 828,044 1,163,465 669,388 791,275 1,153,871
Current part of derivative financial instrument liability 2,305 890 890 298 801 801 Other financial liabilities - - - 390 390 390 Other financial liabilities 2,305 890 890 688 1,191 1,191
Amounts falling due after more than one year Other payables, accruals and deferred income 15,952 77,724 81,092 15,918 33,307 38,105 Finance leases 2,619 4,782 6,588 3,513 5,861 7,900 Other payables 18,571 82,506 87,680 19,431 39,168 46,005
Derivative financial instrument liability - 3,905 3,905 - 298 298 Environment Agency reservoir agreement - - 141,600 - - 141,600 Other financial liabilities - 3,905 145,505 - 298 141,898
Total payables 833,401 915,345 1,397,540 689,507 831,932 1,342,965
15.1 Intra–Government Balances
Restated31 March 2015 31 March 2014 31 March 2015 31 March 2014
£000 £000 £000 £000
Balances with other central government bodies 217,820 332,344 - 2,010 Balances with local authorities 30,566 12,637 - - Balances with public corporations and trading funds 286 332 - - Subtotal: intra government balances 248,672 345,313 - 2,010
Balances with bodies external to government 915,683 809,749 233,185 185,893 Total payables 1,164,355 1,155,062 233,185 187,903
Amounts Due Within a Year Amounts Due After a Year
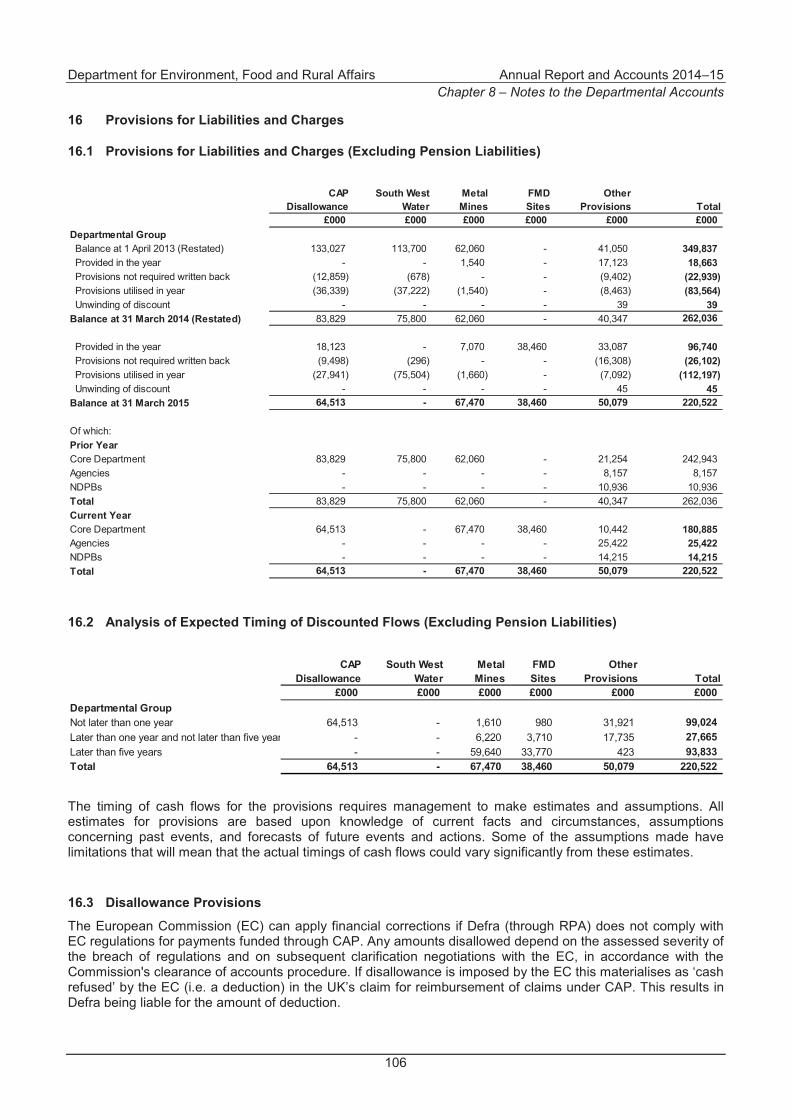
Department for Environment, Food and Rural Affairs Annual Report and Accounts 2014–15 Chapter 8 – Notes to the Departmental Accounts
106
16 Provisions for Liabilities and Charges
16.1 Provisions for Liabilities and Charges (Excluding Pension Liabilities)
CAP Disallowance
South West Water
Metal Mines
FMD Sites
Other Provisions Total
£000 £000 £000 £000 £000 £000Departmental Group Balance at 1 April 2013 (Restated) 133,027 113,700 62,060 - 41,050 349,837 Provided in the year - - 1,540 - 17,123 18,663 Provisions not required written back (12,859) (678) - - (9,402) (22,939) Provisions utilised in year (36,339) (37,222) (1,540) - (8,463) (83,564) Unwinding of discount - - - - 39 39 Balance at 31 March 2014 (Restated) 83,829 75,800 62,060 - 40,347 262,036
Provided in the year 18,123 - 7,070 38,460 33,087 96,740 Provisions not required written back (9,498) (296) - - (16,308) (26,102) Provisions utilised in year (27,941) (75,504) (1,660) - (7,092) (112,197) Unwinding of discount - - - - 45 45 Balance at 31 March 2015 64,513 - 67,470 38,460 50,079 220,522
Of which:Prior YearCore Department 83,829 75,800 62,060 - 21,254 242,943 Agencies - - - - 8,157 8,157 NDPBs - - - - 10,936 10,936 Total 83,829 75,800 62,060 - 40,347 262,036 Current YearCore Department 64,513 - 67,470 38,460 10,442 180,885 Agencies - - - - 25,422 25,422 NDPBs - - - - 14,215 14,215 Total 64,513 - 67,470 38,460 50,079 220,522
16.2 Analysis of Expected Timing of Discounted Flows (Excluding Pension Liabilities)
CAP Disallowance
South West Water
Metal Mines
FMD Sites
Other Provisions Total
£000 £000 £000 £000 £000 £000Departmental GroupNot later than one year 64,513 - 1,610 980 31,921 99,024 Later than one year and not later than five year - - 6,220 3,710 17,735 27,665 Later than five years - - 59,640 33,770 423 93,833 Total 64,513 - 67,470 38,460 50,079 220,522
The timing of cash flows for the provisions requires management to make estimates and assumptions. All estimates for provisions are based upon knowledge of current facts and circumstances, assumptions concerning past events, and forecasts of future events and actions. Some of the assumptions made have limitations that will mean that the actual timings of cash flows could vary significantly from these estimates.
16.3 Disallowance Provisions
The European Commission (EC) can apply financial corrections if Defra (through RPA) does not comply with EC regulations for payments funded through CAP. Any amounts disallowed depend on the assessed severity of the breach of regulations and on subsequent clarification negotiations with the EC, in accordance with the Commission's clearance of accounts procedure. If disallowance is imposed by the EC this materialises as ‘cash refused’ by the EC (i.e. a deduction) in the UK’s claim for reimbursement of claims under CAP. This results in Defra being liable for the amount of deduction.

Department for Environment, Food and Rural Affairs Annual Report and Accounts 2014–15 Chapter 8 – Notes to the Departmental Accounts
107
Liabilities exist for all schemes for which the results of external EC audit have indicated that a financial correction is likely, and have given enough of an indication of the severity of the issues leading to that correction to enable an estimate to be made. The final estimates reflect the best information available at the year end.
Liabilities which are expected to impact in future accounting periods are disclosed as provisions, covering all relevant schemes. Where a cash refusal is expected within the next 12 months, the liability is disclosed as an accrual in resource terms. Finally, the point at which the ‘cash refused’ is physically transacted may come sometime after the accrual point and typically in a later accounting period. Therefore it is important to recognise that liabilities for disallowance can cover a number of scheme years and do not just reflect any disallowance imposed in the financial year covered by any single year's accounts.
There is an assumption that a baseline 2 percent flat rate disallowance for SPS 2014 will continue, but if this was to increase to 5 percent (the next flat rate level) the provision position would increase by £45m. Uncertainty in these assumptions will be resolved upon receipt of an Article 11 letter of notification from the EC, which will detail the level of disallowance. There is an ongoing potential liability in respect of financial corrections, which at present is uncertain and unquantifiable as an EC audit has yet to take place.
For further information on the Disallowance provision, please refer to Chapter 3.
16.4 South West Water Provision
Defra has committed to providing financial assistance to domestic customers of South West Water in the form of a £50 per annum discount to water bills from 1 April 2013. Defra considers that its obligation to South West Water customers currently extends to 31 March 2016, after which any future payments are contingent on the outcome of subsequent Spending Reviews and government policy. The provision movement reflects the payments made in 2014–15 and a transfer of £38m to creditors for the payments due in 2015–16. Defra and South West Water have entered into an agreement that may be terminated by either party subject to one-year’s notice; neither the agreement nor the recognition of a provision is a guarantee of future payments beyond one year.
16.5 Abandoned Metal Mines Provision
Abandoned metal mines are a pollution threat, discharging mine water containing heavy metals and other pollutants into rivers and aquifers, as when the mines are closed, pumps are switched off and the groundwater level subsequently rises until it reaches the surface or discharges into overlying aquifers. As per the Pollution Prevention and Control Act 1999, owners/operators of mines cannot be held responsible for discharges made at abandoned metal mines before 31 December 1999.
The Department funds the ongoing running costs of water treatment schemes built at three abandoned metal mine sites. These schemes clean polluted water which flows out of the abandoned mines and into water bodies, thus helping to meet Defra’s objectives for good water body status under the EU’s Water Framework Directive. The Wheal Jane scheme has been running since 2000, with Force Crag coming into operation in 2014 and Saltburn Gill in 2015.
The Mine Water treatment provision of £67m represents the ongoing future liabilities relating to remediating mine water pollution arising from abandoned metal mines. The provision is calculated over 100 years as conditions for causing pollution are likely to continue, and there is no foreseeable option to dispense with treatment schemes.
Defra is committed to reviewing operations and new technologies, and alternative preventative schemes to reduce this ongoing liability as part of value for money initiatives.
Department for Environment, Food and Rural Affairs Annual Report and Accounts 2014–15 Chapter 8 – Notes to the Departmental Accounts
108
16.6 Foot and Mouth Disease (FMD) Burial Sites Provision
Since the FMD outbreak in 2001, the Department has responsibility for managing several burial sites across the UK. The provision for FMD sites represents the ongoing future liabilities relating to preventing and remediating any leachate pollution arising from burial sites. There are significant uncertainties as to the time period over which conditions for causing pollution will continue at the sites, the provision has therefore been estimated based on 100 years from burial with 86 years remaining, £38m.
The Department is committed to reviewing operations and alternative technologies at FMD sites, to reduce this ongoing liability as part of value for money initiatives.
Defra continues to disclose a remote unquantifiable contingent liability for FMD sites, relating to claims for contamination for onsite farm burials (Note 18.3.2).
16.7 Other Provisions
Included in Other Provisions is £17m scheme related provisions where RPA has a number of cases where customers have challenged its decisions regarding their claim eligibility for scheme payments. This has been reviewed on a case by case basis, with provisions made where the Agency considers payment to be probable and can be measured reliably.
The Core Department, Executive Agencies and NDPBs have a total of £33m relating to smaller provisions, none of which have an individual value greater than £10m.
17 Pension Liabilities
The Department contributes to the PCSPS as reported in Note 3. Although the PCSPS is an unfunded defined benefit scheme, in accordance with explicit requirements in the FReM, departments, agencies and other bodies account for the scheme as if it were a defined contribution plan. Costs of the elements are recognised on a systematic and rational basis over the period during which it benefits from employees’ services by payment to the PCSPS of amounts calculated on an accruing basis. Liability for payment of future benefits is a charge on PCSPS. The PCSPS pension scheme undergoes a reassessment of the contribution rates by the Government Actuary at four-yearly intervals. In respect of defined contribution schemes, the Department recognises the contributions payable for the year.
The following pension schemes are managed by and included within the Core Department’s disclosures (the liabilities for the Core Department and Executive Agencies solely relate to the Core Department).
• EA Pension Liability (Closed Scheme) (funded);
• Nature Conservancy Council Pension (by-analogy);
• Former Countryside Agency Pension Schemes (Rural Community Council and Ex–Chairmen Schemes) (by-analogy); and
• Horticultural Research International Pension Scheme (by-analogy).
The following pension schemes are managed by and included within the NDPB disclosures.
• Home Grown Cereals Authority Pension Scheme (funded);
• EA Active Pension Scheme (funded);
• NE Pension Scheme (by-analogy);

Department for Environment, Food and Rural Affairs Annual Report and Accounts 2014–15 Chapter 8 – Notes to the Departmental Accounts
109
• Sea Fish Industry Authority (funded); and
• Meat and Livestock Commission (MLC) Pension Scheme (funded).
All by-analogy schemes are unfunded schemes.
The details for the material schemes are noted below, full details for the other schemes can be found in the Network Bodies’ ARAs where appropriate.
Net liabilities represent the gap between the money held by the scheme and the total present value of the funded and unfunded obligations. The assumptions underlying the calculation of the net liability are only used for accounting purposes as prescribed under IAS 19. In particular, IAS 19 has no impact on the level of cash contributions paid by the Department and there is no requirement for the net liability to be met as a lump sum or otherwise. Cash contributions will continue to be set by reference to assumptions agreed at each actuarial valuation of the scheme.
17.1.1 EA Pension Liability (Closed Scheme) The EA Closed Fund (the Fund) is vested in EA by Regulation 2(1) of the Local Government Pension Scheme Regulations 1996 and Environment Act 1996 and is maintained for the purposes of Section 7 of the Superannuation Act 1972. The Secretary of State has the function conferred by Section 173 of the Water Act 1989 (the Act) to make such payments into the Fund as may be considered appropriate in respect of the actual and contingent liabilities falling from time to time. This was reaffirmed through the Memorandum of Understanding between the Accounting Officers of Defra and EA, 17 May 2005. These are met out of the Fund to persons who were ex–employees of regional water authorities and other water industry bodies at the time of water privatisation in 1989 (the Closed Fund members).
All calculations have been made by a qualified independent actuary. As required under IAS 19, the projected unit credit method of valuation has been used. The last formal valuation of the Fund was carried out as at 31 March 2013, the results of this valuation have been projected forward to 31 March 2015 using approximate methods.
The estimated sponsor’s contributions for the year to 31 March 2016 will be approximately £81m.
17.1.2 EA Active Pension Scheme The EA operates a defined benefit pension scheme for employees and transferees from the former Defra, National Rivers Authority, Her Majesty’s Inspectorate of Pollution, London Waste Regulation Authority and other local waste regulation authorities. It is a statutory scheme, administered in accordance with the Local Government Pension Scheme (Benefits, Membership and Contributions) Regulations 2007, the Local Government Pension Scheme (Administration) Regulations 2008 and the Local Government Pension Scheme (Transitional Provisions) Regulations 2008. It is contracted out of the State Second Pension.
EA has awarded a contract to SSCL, who participate in the Fund on a risk sharing basis. To reflect the risk sharing agreement between EA and SSCL:
• the value of the assets and liabilities for SSCL have been included in EA’s IAS 19 position;
• contributions paid by SSCL have been included as contributions made by EA to the fund; and
• the SSCL membership statistics have been included with the membership statistics of EA.
All calculations have been made by a qualified independent actuary. As required under IAS 19, the projected unit credit method of valuation has been used. The last formal valuation of the Fund was carried out as at 31 March 2013, the results of this valuation have been projected forward to 31 March 2015 using approximate methods.

Department for Environment, Food and Rural Affairs Annual Report and Accounts 2014–15 Chapter 8 – Notes to the Departmental Accounts
110
The estimated employers’ contributions for the year to 31 March 2016 will be approximately £43m.
17.1.3 MLC Pension Scheme The MLC pension scheme closed to new entrants following the creation of the Agriculture and Horticulture Development Board (AHDB). This scheme is a contributory pension scheme. Contributions to the scheme are charged to AHDB’s SoCNE and are determined by a qualified actuary on the basis of annual valuations using the projected unit method.
The expected contributions for the year to 31 March 2016 is £600,000 (£400,000 employer contributions,£200,000 scheme participants’ contributions).

Dep
artm
ent f
or E
nviro
nmen
t, Fo
od a
nd R
ural
Affa
irs
Annu
al R
epor
t and
Acc
ount
s 20
14–1
5 C
hapt
er 8
–N
otes
to th
e D
epar
tmen
tal A
ccou
nts
111
17.2
C
hang
e in
the
Fair
Valu
e of
Pla
n A
sset
s, D
efin
ed B
enef
it O
blig
atio
n an
d N
et L
iabi
lity
– To
tals
as
at 3
1 M
arch
201
5
Asse
tsLi
abili
ties
Net
(lia
bilit
y)
/ass
etAs
sets
Liab
ilitie
sAd
just
men
tN
et (l
iabi
lity)
/a
sset
Asse
tsLi
abili
ties
Adju
stm
ent
Net
(lia
bilit
y)
/ass
etN
ote
£000
£000
£000
£000
£000
£000
£000
£000
£000
£000
£000
Fair
valu
e of
em
ploy
er a
sset
s16
5,80
0
-
16
5,80
0
2,31
1,63
6
-
-
2,
311,
636
204,
500
-
-
204,
500
Pr
esen
t val
ue o
f fun
ded
liabi
lities
-
(749
,700
)(7
49,7
00)
-
(3
,352
,608
)-
(3
,352
,608
)-
(1
92,5
00)
-
(192
,500
)Pr
esen
t val
ue o
f unf
unde
d lia
bilit
ies
-
(140
,400
)(1
40,4
00)
-
(1
44,7
68)
-
(144
,768
)-
-
-
-
Less
irre
cove
rabl
e su
rplu
s-
-
-
-
-
(1,3
57)
(1,3
57)
-
-
(2
,300
)(2
,300
)O
peni
ng P
ositi
on a
s at
31
Mar
ch 2
014
165,
800
(8
90,1
00)
(724
,300
)2,
311,
636
(3
,497
,376
)(1
,357
)(1
,187
,097
)20
4,50
0
(192
,500
)(2
,300
)9,
700
Serv
ice
cost
- Cur
rent
ser
vice
cost
-
(11)
(11)
-
(6
8,93
7)-
(6
8,93
7)-
(1
,000
)-
(1
,000
)- P
ast s
ervic
e co
st (i
nclu
ding
cur
tailm
ents
)-
-
-
-
(5
,691
)-
(5
,691
)-
-
-
-
- Effe
ct o
f set
tlem
ents
-
-
-
(7
01)
685
-
(1
6)-
-
-
-
- Oth
er e
xpen
ses
(600
)-
(600
)(6
26)
-
-
(6
26)
-
-
-
-
To
tal s
ervi
ce c
ost
(600
)(1
1)(6
11)
(1,3
27)
(73,
943)
-
(75,
270)
-
(1,0
00)
-
(1,0
00)
Net i
nter
est
- Int
eres
t inc
ome
on p
lan
asse
ts7,
200
-
7,20
0
99
,589
-
-
99,5
89
8,
600
-
-
8,60
0
- I
nter
est c
ost o
n de
fined
ben
efit
oblig
atio
n-
(3
7,07
3)(3
7,07
3)-
(149
,570
)-
(1
49,5
70)
-
(8,0
00)
-
(8,0
00)
- Im
pact
of a
sset
cei
ling
on n
et in
tere
st-
-
-
-
-
-
-
-
-
(1
00)
(100
)To
tal n
et in
tere
st7,
200
(3
7,07
3)(2
9,87
3)99
,589
(1
49,5
70)
-
(49,
981)
8,60
0
(8,0
00)
(100
)50
0
Tota
l def
ined
ben
efit
cost
reco
gnis
ed in
pro
fit o
r (lo
ss)
6,60
0
(37,
084)
(30,
484)
98,2
62
(223
,513
)-
(1
25,2
51)
8,60
0
(9,0
00)
(100
)(5
00)
Cas
hflo
ws
- Pla
n pa
rtici
pant
s' c
ontri
butio
ns-
-
-
23,4
06
(23,
406)
-
-
200
(200
)-
-
- E
mpl
oyer
con
tribu
tions
74,3
00
-
74,3
00
13
5,52
0
-
-
135,
520
40
0
-
-
400
- C
ontri
butio
ns in
resp
ect o
f unf
unde
d be
nefit
s10
,800
-
10
,800
10,8
00
-
-
10
,800
-
-
-
-
- B
enef
its p
aid
(72,
500)
74,6
34
2,13
4
(1
48,8
27)
150,
976
-
2,14
9
(1
0,50
0)10
,500
-
-
- U
nfun
ded
bene
fits
paid
(10,
800)
10,8
00
-
(10,
800)
10,8
00
-
-
-
-
-
-
Ex
pect
ed c
losi
ng p
ositi
on17
4,20
0
(841
,750
)(6
67,5
50)
2,41
9,99
7
(3,5
82,5
19)
(1,3
57)
(1,1
63,8
79)
203,
200
(1
91,2
00)
(2,4
00)
9,60
0
R
emea
sure
men
ts- C
hang
e in
fina
ncia
l ass
umpt
ions
-
(34,
540)
(34,
540)
-
(5
05,3
91)
-
(505
,391
)-
(2
0,70
0)-
(2
0,70
0)- O
ther
exp
erie
nce
-
7,20
4
7,20
4
-
22,3
97
-
22,3
97
-
3,
600
-
3,
600
- Ret
urn
on a
sset
s ex
clud
ing
amou
nts
incl
uded
in n
et in
tere
st38
,800
-
38
,800
273,
690
-
-
27
3,69
0
14,6
00
-
-
14,6
00
- T
rans
fers
(in)
/out
-
19
19
-
19
-
19
(4
00)
400
-
-
- Cha
nges
in a
sset
cei
ling
-
-
-
-
-
(2
,104
)(2
,104
)-
-
500
50
0
Tota
l rem
easu
rem
ents
reco
gnis
ed in
Oth
er
C
ompr
ehen
sive
Inco
me
(OC
I)38
,800
(27,
317)
11,4
83
27
3,69
0
(4
82,9
75)
(2,1
04)
(211
,389
)14
,200
(16,
700)
500
(2
,000
)
Fair
valu
e of
em
ploy
er a
sset
s21
3,00
0
-
21
3,00
0
2,69
3,68
7
-
-
2,
693,
687
217,
400
-
-
217,
400
Pr
esen
t val
ue o
f fun
ded
liabi
lities
-
(729
,000
)(7
29,0
00)
-
(3
,920
,856
)-
(3
,920
,856
)-
(2
07,9
00)
-
(207
,900
)Pr
esen
t val
ue o
f unf
unde
d lia
bilit
ies
-
(140
,067
)(1
40,0
67)
-
(1
44,6
38)
-
(144
,638
)-
-
-
-
Less
irre
cove
rabl
e su
rplu
s-
-
-
-
-
(3,4
61)
(3,4
61)
-
-
(1
,900
)(1
,900
)C
losi
ng p
ositi
on a
s at
31
Mar
ch 2
015
213,
000
(8
69,0
67)
(656
,067
)2,
693,
687
(4
,065
,494
)(3
,461
)(1
,375
,268
)21
7,40
0
(207
,900
)(1
,900
)7,
600
Of w
hich
:En
viron
men
t Age
ncy
Clo
sed
Sch
eme
(with
in C
ore
Dep
artm
ent)
17.3
213,
000
(829
,100
)-
(6
16,1
00)
Envir
onm
ent A
genc
y Ac
tive
Sch
eme
(with
in N
DPB
)17
.32,
418,
943
(3
,126
,206
)-
(7
07,2
63)
Oth
er (a
ll ot
her s
chem
es)
17.3
61,7
44
(110
,188
)(3
,461
)(5
1,90
5)2,
693,
687
(4
,065
,494
)(3
,461
)(1
,375
,268
)
Tota
l Cor
e D
epar
tmen
t and
Cor
e an
d Ag
enci
esTo
tal D
epar
tmen
tal G
roup
Pens
ion
Asse
t MLC
Pen
sion
Sch
eme

Dep
artm
ent f
or E
nviro
nmen
t, Fo
od a
nd R
ural
Affa
irs
Annu
al R
epor
t and
Acc
ount
s 20
14–1
5 C
hapt
er 8
–N
otes
to th
e D
epar
tmen
tal A
ccou
nts
112
as a
t 31
Mar
ch 2
014
Asse
tsLi
abili
ties
Net
(lia
bilit
y)
/ass
etAs
sets
Liab
ilitie
sAd
just
men
tN
et (l
iabi
lity)
/a
sset
Asse
tsLi
abili
ties
Adju
stm
ent
Net
(lia
bilit
y)
/ass
etN
ote
£000
£000
£000
£000
£000
£000
£000
£000
£000
£000
£000
Fair
valu
e of
em
ploy
er a
sset
s16
6,80
0
-
16
6,80
0
2,33
7,06
6
-
2,
337,
066
205,
100
-
-
205,
100
Pr
esen
t val
ue o
f fun
ded
liabi
litie
s-
(7
69,6
00)
(769
,600
)-
(3,3
22,0
66)
(3,3
22,0
66)
-
(198
,000
)-
(1
98,0
00)
Pres
ent v
alue
of u
nfun
ded
liabi
litie
s-
(1
44,9
74)
(144
,974
)-
(149
,631
)(1
49,6
31)
-
-
-
-
Le
ss ir
reco
vera
ble
surp
lus
-
-
-
-
-
(1
,218
)(1
,218
)-
-
(5,3
00)
(5,3
00)
Ope
ning
Pos
ition
as
at 3
1 M
arch
201
316
6,80
0
(914
,574
)(7
47,7
74)
2,33
7,06
6
(3,4
71,6
97)
(1,2
18)
(1,1
35,8
49)
205,
100
(1
98,0
00)
(5,3
00)
1,80
0
Se
rvic
e co
st- C
urre
nt s
ervi
ce c
ost
-
-
-
-
(66,
615)
-
(66,
615)
-
(1,2
00)
-
(1,2
00)
- Pas
t ser
vice
cos
t (in
clud
ing
curta
ilmen
ts)
-
-
-
-
(4,3
04)
-
(4,3
04)
-
-
-
-
- E
ffect
of s
ettle
men
ts-
-
-
(203
,870
)25
5,82
8
-
51
,958
-
-
-
-
- O
ther
exp
ense
s(7
00)
-
(7
00)
(729
)-
-
(729
)-
-
-
-
Tota
l ser
vice
cos
t(7
00)
-
(7
00)
(204
,599
)18
4,90
9
-
(1
9,69
0)-
(1
,200
)-
(1
,200
)Ne
t int
eres
t- I
nter
est i
ncom
e on
pla
n as
sets
6,90
0
-
6,
900
95,5
35
-
-
95
,535
8,40
0
-
-
8,
400
- Int
eres
t cos
t on
defin
ed b
enef
it ob
ligat
ion
-
(35,
566)
(35,
566)
-
(1
39,5
21)
-
(139
,521
)-
(8
,100
)-
(8
,100
)To
tal n
et in
tere
st6,
900
(3
5,56
6)(2
8,66
6)95
,535
(1
39,5
21)
-
(43,
986)
8,40
0
(8,1
00)
-
300
Tota
l def
ined
ben
efit
cost
reco
gnis
ed in
pro
fit o
r (lo
ss)
6,20
0
(35,
566)
(29,
366)
(109
,064
)45
,388
-
(6
3,67
6)8,
400
(9
,300
)-
(9
00)
Cas
hflo
ws
- Pla
n pa
rtici
pant
s' c
ontri
butio
ns-
-
-
21,9
56
(21,
959)
-
(3)
200
(200
)-
-
- E
mpl
oyer
con
tribu
tions
78,1
00
-
78,1
00
13
5,80
0
-
-
135,
800
40
0
-
-
400
- C
ontri
butio
ns in
resp
ect o
f unf
unde
d be
nefit
s11
,000
-
11
,000
11,0
00
-
-
11
,000
-
-
-
-
- B
enef
its p
aid
(74,
700)
76,8
10
2,11
0
(1
40,1
05)
142,
223
-
2,11
8
(1
1,10
0)11
,100
-
-
- U
nfun
ded
bene
fits
paid
(11,
000)
11,0
00
-
(11,
000)
11,0
00
-
-
-
-
-
-
Ex
pect
ed c
losi
ng p
ositi
on17
6,40
0
(862
,330
)(6
85,9
30)
2,24
5,65
3
(3,2
95,0
45)
(1,2
18)
(1,0
50,6
10)
203,
000
(1
96,4
00)
(5,3
00)
1,30
0
R
emea
sure
men
ts- C
hang
e in
dem
ogra
phic
ass
umpt
ions
-
(13,
100)
(13,
100)
-
(8
5,11
9)-
(8
5,11
9)-
-
-
-
- Cha
nge
in fi
nanc
ial a
ssum
ptio
ns-
(3
8,93
8)(3
8,93
8)-
(11,
458)
-
(11,
458)
-
2,20
0
-
2,20
0
- O
ther
exp
erie
nce
-
24,1
98
24,1
98
-
(105
,824
)-
(1
05,8
24)
-
1,70
0
-
1,70
0
- R
etur
n on
ass
ets
excl
udin
g am
ount
s in
clud
ed in
net
inte
rest
(10,
600)
-
(1
0,60
0)65
,983
-
-
65,9
83
1,
500
-
-
1,50
0
- T
rans
fers
in-
70
70
-
70
-
70
-
-
-
-
- C
hang
es in
ass
et c
eilin
g-
-
-
-
-
(139
)(1
39)
-
-
3,
000
3,00
0
To
tal r
emea
sure
men
ts re
cogn
ised
in O
ther
Com
preh
ensi
ve In
com
e (O
CI)
(10,
600)
(27,
770)
(38,
370)
65,9
83
(202
,331
)(1
39)
(136
,487
)1,
500
3,
900
3,
000
8,40
0
Fair
valu
e of
em
ploy
er a
sset
s16
5,80
0
-
16
5,80
0
2,31
1,63
6
-
-
2,
311,
636
204,
500
-
-
204,
500
Pr
esen
t val
ue o
f fun
ded
liabi
litie
s-
(7
49,7
00)
(749
,700
)-
(3,3
52,6
08)
-
(3,3
52,6
08)
-
(192
,500
)-
(1
92,5
00)
Pres
ent v
alue
of u
nfun
ded
liabi
litie
s-
(1
40,4
00)
(140
,400
)-
(144
,768
)-
(1
44,7
68)
-
-
-
-
Le
ss ir
reco
vera
ble
surp
lus
-
-
-
-
-
(1
,357
)(1
,357
)-
-
(2,3
00)
(2,3
00)
Clo
sing
pos
ition
as
at 3
1 M
arch
201
416
5,80
0
(890
,100
)(7
24,3
00)
2,31
1,63
6
(3,4
97,3
76)
(1,3
57)
(1,1
87,0
97)
204,
500
(1
92,5
00)
(2,3
00)
9,70
0
Of w
hich
:En
viro
nmen
t Age
ncy
Clo
sed
Sch
eme
(with
in C
ore
Dep
artm
ent)
17.3
165,
800
(852
,600
)-
(6
86,8
00)
Envi
ronm
ent A
genc
y Ac
tive
Sch
eme
(with
in N
DP
B)
17.3
2,09
1,31
8
(2,5
44,0
01)
-
(452
,683
)O
ther
(all o
ther
sch
emes
)17
.354
,518
(1
00,7
75)
(1,3
57)
(47,
614)
2,31
1,63
6
(3,4
97,3
76)
(1,3
57)
(1,1
87,0
97)
Tota
l Cor
e D
epar
tmen
t and
Cor
e an
d Ag
enci
esTo
tal D
epar
tmen
tal G
roup
Pens
ion
Asse
t MLC
Pen
sion
Sch
eme
Res
tate
d

Dep
artm
ent f
or E
nviro
nmen
t, Fo
od a
nd R
ural
Affa
irs
Annu
al R
epor
t and
Acc
ount
s 20
14–1
5 C
hapt
er 8
–N
otes
to th
e D
epar
tmen
tal A
ccou
nts
113
17.3
C
hang
es in
the
Fair
Valu
e of
Pla
n A
sset
s, D
efin
ed B
enef
it O
blig
atio
n an
d N
et L
iabi
lity
– M
ater
ial S
chem
es
as a
t 31
Mar
ch 2
015
Asse
tsLi
abili
ties
Net
(lia
bilit
y)
/ass
etAs
sets
Liab
ilitie
sN
et (l
iabi
lity)
/a
sset
Asse
tsLi
abili
ties
Adju
stm
ent
Net
(lia
bilit
y)
/ass
et£0
00£0
00£0
00£0
00£0
00£0
00£0
00£0
00£0
00£0
00Fa
ir va
lue
of e
mpl
oyer
ass
ets
165,
800
-
16
5,80
0
2,
091,
318
-
2,09
1,31
8
54,5
18
-
-
54
,518
Pre
sent
val
ue o
f fun
ded
liabi
litie
s-
(749
,700
)(7
49,7
00)
-
(2
,544
,001
)(2
,544
,001
)-
(58,
907)
-
(5
8,90
7)P
rese
nt v
alue
of u
nfun
ded
liabi
lities
-
(1
02,9
00)
(102
,900
)-
-
-
-
(4
1,86
8)-
(41,
868)
Less
irre
cove
rabl
e su
rplu
s-
-
-
-
-
-
-
-
(1
,357
)(1
,357
)O
peni
ng P
ositi
on a
s at
31
Mar
ch 2
014
165,
800
(852
,600
)(6
86,8
00)
2,09
1,31
8
(2,5
44,0
01)
(452
,683
)54
,518
(100
,775
)(1
,357
)(4
7,61
4)S
ervi
ce c
ost
- Cur
rent
ser
vice
cos
t-
-
-
-
(6
8,50
6)(6
8,50
6)-
(431
)-
(431
)- P
ast s
ervi
ce c
ost (
incl
udin
g cu
rtailm
ents
)-
-
-
-
(5
,691
)(5
,691
)-
-
-
-
- E
ffect
of s
ettle
men
ts-
-
-
(701
)68
5
(1
6)-
-
-
-
- O
ther
exp
ense
s(6
00)
-
(6
00)
-
-
-
(2
6)-
-
(2
6)To
tal s
ervi
ce c
ost
(600
)-
(600
)(7
01)
(73,
512)
(74,
213)
(26)
(431
)-
(457
)N
et in
tere
st- I
nter
est i
ncom
e on
pla
n as
sets
7,20
0
-
7,
200
90
,119
-
90
,119
2,27
0
-
-
2,27
0
- Int
eres
t cos
t on
defin
ed b
enef
it ob
ligat
ion
-
(3
5,30
0)(3
5,30
0)-
(109
,874
)(1
09,8
74)
-
(4
,396
)-
(4,3
96)
Tota
l net
inte
rest
7,20
0
(35,
300)
(28,
100)
90,1
19
(1
09,8
74)
(19,
755)
2,27
0
(4,3
96)
-
(2
,126
)
Tota
l def
ined
ben
efit
cost
reco
gnis
ed in
pro
fit o
r (lo
ss)
6,60
0
(35,
300)
(28,
700)
89,4
18
(1
83,3
86)
(93,
968)
2,24
4
(4,8
27)
-
(2
,583
)C
ashf
low
s- P
lan
parti
cipa
nts'
con
tribu
tions
-
-
-
23
,266
(23,
266)
-
14
0
(1
40)
-
-
- Em
ploy
er c
ontri
butio
ns74
,300
-
74
,300
60,5
92
-
60,5
92
62
8
-
-
62
8
- C
ontri
butio
ns in
resp
ect o
f unf
unde
d be
nefit
s10
,800
-
10
,800
-
-
-
-
-
-
-
- B
enef
its p
aid
(72,
500)
72,5
00
-
(73,
681)
73,6
81
-
(2,6
46)
4,79
5
-
2,
149
- U
nfun
ded
bene
fits
paid
(10,
800)
10,8
00
-
-
-
-
-
-
-
-
Ex
pect
ed c
losi
ng p
ositi
on17
4,20
0
(8
04,6
00)
(630
,400
)2,
190,
913
(2
,676
,972
)(4
86,0
59)
54,8
84
(1
00,9
47)
(1,3
57)
(47,
420)
Rem
easu
rem
ents
- Cha
nge
in fi
nanc
ial a
ssum
ptio
ns-
(31,
400)
(31,
400)
-
(4
63,9
34)
(463
,934
)-
(10,
057)
-
(1
0,05
7)- O
ther
exp
erie
nce
-
6,
900
6,
900
-
14,7
00
14
,700
-
79
7
-
797
- Ret
urn
on a
sset
s ex
clud
ing
amou
nts
incl
uded
in n
et in
tere
st38
,800
-
38
,800
228,
030
-
22
8,03
0
6,
860
-
-
6,
860
- T
rans
fers
(in)
/out
-
-
-
-
-
-
-
19
-
19
- Cha
nges
in a
sset
cei
ling
-
-
-
-
-
-
-
-
(2,1
04)
(2,1
04)
Tota
l rem
easu
rem
ents
reco
gnis
ed in
Oth
er
C
ompr
ehen
sive
Inco
me
(OC
I)38
,800
(24,
500)
14,3
00
22
8,03
0
(4
49,2
34)
(221
,204
)6,
860
(9
,241
)(2
,104
)(4
,485
)
Fair
valu
e of
em
ploy
er a
sset
s21
3,00
0
-
213,
000
2,41
8,94
3
-
2,
418,
943
61
,744
-
-
61,7
44
P
rese
nt v
alue
of f
unde
d lia
bilit
ies
-
(7
29,0
00)
(729
,000
)-
(3,1
26,2
06)
(3,1
26,2
06)
-
(6
5,65
0)-
(65,
650)
Pre
sent
val
ue o
f unf
unde
d lia
biliti
es-
(100
,100
)(1
00,1
00)
-
-
-
-
(44,
538)
-
(4
4,53
8)Le
ss ir
reco
vera
ble
surp
lus
-
-
-
-
-
-
-
-
(3,4
61)
(3,4
61)
Clo
sing
pos
ition
as
at 3
1 M
arch
201
521
3,00
0
(8
29,1
00)
(616
,100
)2,
418,
943
(3
,126
,206
)(7
07,2
63)
61,7
44
(1
10,1
88)
(3,4
61)
(51,
905)
Envi
ronm
ent A
genc
y Ac
tive
Sche
me
(with
in C
ore
Dep
artm
ent)
(with
in N
DPB
)(a
ll ot
her s
chem
es -
excl
udin
g M
LC)
Envi
ronm
ent A
genc
y C
lose
d Sc
hem
eO
ther

Dep
artm
ent f
or E
nviro
nmen
t, Fo
od a
nd R
ural
Affa
irs
Annu
al R
epor
t and
Acc
ount
s 20
14–1
5 C
hapt
er 8
–N
otes
to th
e D
epar
tmen
tal A
ccou
nts
114
as a
t 31
Mar
ch 2
014
Asse
tsLi
abili
ties
Net
(lia
bilit
y)
/ass
etAs
sets
Liab
ilitie
sN
et (l
iabi
lity)
/a
sset
Asse
tsLi
abili
ties
Adju
stm
ent
Net
(lia
bilit
y)
/ass
et£0
00£0
00£0
00£0
00£0
00£0
00£0
00£0
00£0
00£0
00Fa
ir va
lue
of e
mpl
oyer
ass
ets
166,
800
-
16
6,80
0
2,
114,
191
-
2,11
4,19
1
56,0
75
-
-
56
,075
Pre
sent
val
ue o
f fun
ded
liabi
litie
s-
(769
,600
)(7
69,6
00)
-
(2
,492
,059
)(2
,492
,059
)-
(60,
407)
-
(6
0,40
7)P
rese
nt v
alue
of u
nfun
ded
liabi
litie
s-
(110
,000
)(1
10,0
00)
-
-
-
-
(39,
631)
-
(3
9,63
1)Le
ss ir
reco
vera
ble
surp
lus
-
-
-
-
-
-
-
-
(1,2
18)
(1,2
18)
Ope
ning
Pos
ition
as
at 3
1 M
arch
201
316
6,80
0
(8
79,6
00)
(712
,800
)2,
114,
191
(2
,492
,059
)(3
77,8
68)
56,0
75
(1
00,0
38)
(1,2
18)
(45,
181)
Ser
vice
cos
t- C
urre
nt s
ervi
ce c
ost
-
-
-
-
(66,
103)
(66,
103)
-
(5
12)
-
(5
12)
- Pas
t ser
vice
cos
t (in
clud
ing
curta
ilmen
ts)
-
-
-
-
(4,2
11)
(4,2
11)
-
(9
3)-
(93)
- Effe
ct o
f set
tlem
ents
-
-
-
(2
03,8
70)
255,
828
51,9
58
-
-
-
-
- O
ther
exp
ense
s(7
00)
-
(7
00)
-
-
-
(2
9)-
-
(2
9)To
tal s
ervi
ce c
ost
(700
)-
(700
)(2
03,8
70)
185,
514
(18,
356)
(29)
(605
)-
(634
)N
et in
tere
st- I
nter
est i
ncom
e on
pla
n as
sets
6,90
0
-
6,
900
86
,291
-
86
,291
2,34
4
-
-
2,34
4
- Int
eres
t cos
t on
defin
ed b
enef
it ob
ligat
ion
-
(3
4,30
0)(3
4,30
0)-
(101
,248
)(1
01,2
48)
-
(3
,973
)-
(3,9
73)
Tota
l net
inte
rest
6,90
0
(34,
300)
(27,
400)
86,2
91
(1
01,2
48)
(14,
957)
2,34
4
(3,9
73)
-
(1
,629
)
Tota
l def
ined
ben
efit
cost
reco
gnis
ed in
pro
fit o
r (lo
ss)
6,20
0
(34,
300)
(28,
100)
(117
,579
)84
,266
(33,
313)
2,31
5
(4,5
78)
-
(2
,263
)C
ashf
low
s- P
lan
parti
cipa
nts'
con
tribu
tions
-
-
-
21
,823
(21,
823)
-
13
3
(1
36)
-
(3
)- E
mpl
oyer
con
tribu
tions
78,1
00
-
78,1
00
57
,057
-
57
,057
643
-
-
643
- Con
tribu
tions
in re
spec
t of u
nfun
ded
bene
fits
11,0
00
-
11,0
00
-
-
-
-
-
-
-
- Ben
efits
pai
d(7
4,70
0)74
,700
-
(6
2,66
8)62
,668
-
(2
,737
)4,
855
-
2,11
8
- Unf
unde
d be
nefit
s pa
id(1
1,00
0)11
,000
-
-
-
-
-
-
-
-
Expe
cted
clo
sing
pos
ition
176,
400
(828
,200
)(6
51,8
00)
2,01
2,82
4
(2,3
66,9
48)
(354
,124
)56
,429
(99,
897)
(1,2
18)
(44,
686)
Rem
easu
rem
ents
- Cha
nge
in d
emog
raph
ic a
ssum
ptio
ns-
(13,
100)
(13,
100)
-
(7
1,47
3)(7
1,47
3)-
(546
)-
(546
)- C
hang
e in
fina
ncia
l ass
umpt
ions
-
(3
6,20
0)(3
6,20
0)-
24,7
80
24
,780
-
(3
8)-
(38)
- Oth
er e
xper
ienc
e-
24,9
00
24
,900
-
(1
30,3
60)
(130
,360
)-
(364
)-
(364
)- R
etur
n on
ass
ets
excl
udin
g am
ount
s in
clud
ed in
net
inte
rest
(10,
600)
-
(1
0,60
0)78
,494
-
78
,494
(1,9
11)
-
-
(1,9
11)
- Tra
nsfe
rs in
-
-
-
-
-
-
-
70
-
70
- Cha
nges
in a
sset
cei
ling
-
-
-
-
-
-
-
-
(139
)(1
39)
Tota
l rem
easu
rem
ents
reco
gnis
ed in
Oth
er
C
ompr
ehen
sive
Inco
me
(OC
I)(1
0,60
0)(2
4,40
0)(3
5,00
0)78
,494
(177
,053
)(9
8,55
9)(1
,911
)(8
78)
(139
)(2
,928
)
Fair
valu
e of
em
ploy
er a
sset
s16
5,80
0
-
165,
800
2,09
1,31
8
-
2,
091,
318
54
,518
-
-
54,5
18
P
rese
nt v
alue
of f
unde
d lia
bilit
ies
-
(7
49,7
00)
(749
,700
)-
(2,5
44,0
01)
(2,5
44,0
01)
-
(5
8,90
7)-
(58,
907)
Pre
sent
val
ue o
f unf
unde
d lia
bilit
ies
-
(1
02,9
00)
(102
,900
)-
-
-
-
(4
1,86
8)-
(41,
868)
Less
irre
cove
rabl
e su
rplu
s-
-
-
-
-
-
-
-
(1
,357
)(1
,357
)C
losi
ng p
ositi
on a
s at
31
Mar
ch 2
014
165,
800
(852
,600
)(6
86,8
00)
2,09
1,31
8
(2,5
44,0
01)
(452
,683
)54
,518
(100
,775
)(1
,357
)(4
7,61
4)
(with
in C
ore
Dep
artm
ent)
(with
in N
DPB
)(a
ll ot
her s
chem
es -
excl
udin
g M
LC)
Res
tate
dEn
viro
nmen
t Age
ncy
Clo
sed
Sche
me
Envi
ronm
ent A
genc
y Ac
tive
Sche
me
Oth
er

Dep
artm
ent f
or E
nviro
nmen
t, Fo
od a
nd R
ural
Affa
irs
Annu
al R
epor
t and
Acc
ount
s 20
14–1
5 C
hapt
er 8
–N
otes
to th
e D
epar
tmen
tal A
ccou
nts
115
17.4
H
isto
ry o
f Exp
erie
nce
Gai
ns a
nd L
osse
s
Year
End
ed :
31/0
3/15
31/0
3/14
31/0
3/13
31/0
3/12
31/0
3/11
31/0
3/15
Res
tate
d31
/03/
1431
/03/
1331
/03/
1231
/03/
1131
/03/
1531
/03/
1431
/03/
1331
/03/
1231
/03/
11£0
00£0
00£0
00£0
00£0
00£0
00£0
00£0
00£0
00£0
00£0
00£0
00£0
00£0
00£0
00
Fair
valu
e of
em
ploy
er a
sset
s21
3,00
0
165,
800
16
6,80
0
152,
500
13
3,70
0
2,41
8,94
3
2,09
1,31
8
2,11
4,19
1
1,84
9,11
2
1,74
7,69
6
217,
400
20
4,50
0
205,
100
19
7,90
0
215,
400
Pre
sent
val
ue o
f def
ined
ben
efit
oblig
atio
n(8
29,1
00)
(852
,600
)(8
79,6
00)
(899
,200
)(9
25,6
00)
(3,1
26,2
06)
(2,5
44,0
01)
(2,4
92,0
59)
(2,0
74,0
92)
(1,8
68,4
29)
(207
,900
)(1
92,5
00)
(198
,000
)(1
85,5
00)
(173
,100
)
(Def
icit)
/sur
plus
(616
,100
)(6
86,8
00)
(712
,800
)(7
46,7
00)
(791
,900
)(7
07,2
63)
(452
,683
)(3
77,8
68)
(224
,980
)(1
20,7
33)
9,50
0
12,0
00
7,
100
12
,400
42,3
00
Exp
erie
nce
gain
s/(lo
sses
) on
asse
ts38
,800
(10,
600)
10,9
00
22
,000
(1,5
00)
228,
030
78,4
94
161,
386
(41,
465)
(38,
748)
14,6
00
1,
500
7,
200
(1
9,50
0)2,
000
Exp
erie
nce
gain
s/(lo
sses
) on
liabi
lities
6,90
0
24,9
00
(3
,900
)(2
0,20
0)17
7,70
0
14,7
00
(130
,360
)-
(21,
606)
8,91
3
3,
600
1,
700
(2
,000
)(1
,700
)10
,900
Actu
aria
l gai
ns/(l
osse
s) o
n em
ploy
er a
sset
s38
,800
(10,
600)
10,9
00
22
,000
(1,5
00)
228,
030
78,4
94
161,
386
(41,
465)
(38,
748)
14,6
00
1,
500
7,
200
(1
9,50
0)2,
000
E
ffect
of l
imit
of a
sset
cei
ling
500
3,00
0
5,10
0
30,5
00
(3
3,20
0)
Actu
aria
l gai
ns/(l
osse
s) o
n ob
ligat
ion
(24,
500)
(24,
400)
(31,
200)
(25,
100)
217,
600
(4
49,2
34)
(177
,053
)(3
02,8
10)
(83,
193)
158,
261
(17,
100)
3,90
0
(13,
400)
(11,
600)
15,5
00
Actu
aria
l gai
ns/(l
osse
s) re
cogn
ised
in S
oCTE
14,3
00
(3
5,00
0)(2
0,30
0)(3
,100
)21
6,10
0
(221
,204
)(9
8,55
9)(1
41,4
24)
(124
,658
)11
9,51
3
(2
,000
)8,
400
(1
,100
)(6
00)
(15,
700)
EA C
lose
d Sc
hem
e (fu
nded
)EA
Act
ive
Sche
me
(fund
ed)
MLC
Sch
eme
(fund
ed)

Department for Environment, Food and Rural Affairs Annual Report and Accounts 2014–15 Chapter 8 – Notes to the Departmental Accounts
116
17.5 Fair Value of Assets in the Fund
The assets in the scheme and the expected rate of return were:
EA Closed Scheme EA Active Scheme
Pension Asset MLC Pension
SchemeRestated
as at 31 March 2015 £000 £000 £000Equities - 1,573,387 75,655 Bonds 199,900 701,513 - Property - 97,097 - Cash 13,100 46,946 217 Insurance policy - - 141,528 Total 31 March 2015 213,000 2,418,943 217,400
Percentage of Closing Fair Value % % %Equity - 65 35 Bonds 94 29 - Property - 4 - Cash and insurance policy 6 2 65 Total 100 100 100
as at 31 March 2014 £000 £000 £000Equities - 1,340,967 69,700 Bonds 153,800 623,314 - Property - 80,938 - Cash 12,000 46,099 200 Insurance policy - - 134,600 Total 31 March 2014 (Restated) 165,800 2,091,318 204,500
Percentage of Closing Fair Value % % %Equity - 64 34 Bonds 93 30 - Property - 4 - Cash and insurance policy 7 2 66 Total 100 100 100

Department for Environment, Food and Rural Affairs Annual Report and Accounts 2014–15 Chapter 8 – Notes to the Departmental Accounts
117
17.6 Financial Assumptions
The major financial assumptions used by the actuary when providing the assessment of the accrued liabilities as at the following dates.
EA Closed Scheme EA Active Scheme
Pension Asset MLC Pension
Scheme
% pa % pa % paas at 31 March 2015
Inflation/pension increase rate (CPI) 2.2 2.1 2.0
Salary increase rate - 3.5 3.0
Discount rate 3.6 3.2 3.2
as at 31 March 2014
Inflation/pension increase rate (CPI) 2.5 2.5 2.5
Salary increase rate - 3.8 3.5
Discount rate 4.4 4.3 4.3
17.7 Mortality Assumptions
There is also uncertainty around the life expectation of the UK population. The value of current and future pension benefits will depend on how long they are assumed to be in payment. The mortality assumptions used by the Actuary were:
Male Female Male Female Male Female
Average future life expectancies at age 65
Current pensioners (years) 20.8 22.7 22.6 24.5 23.0 25.5 Future pensioners (years) 21.5 24.4 24.7 27.0 24.7 27.3
EA Closed Scheme EA Active SchemePension Asset MLC
Pension Scheme
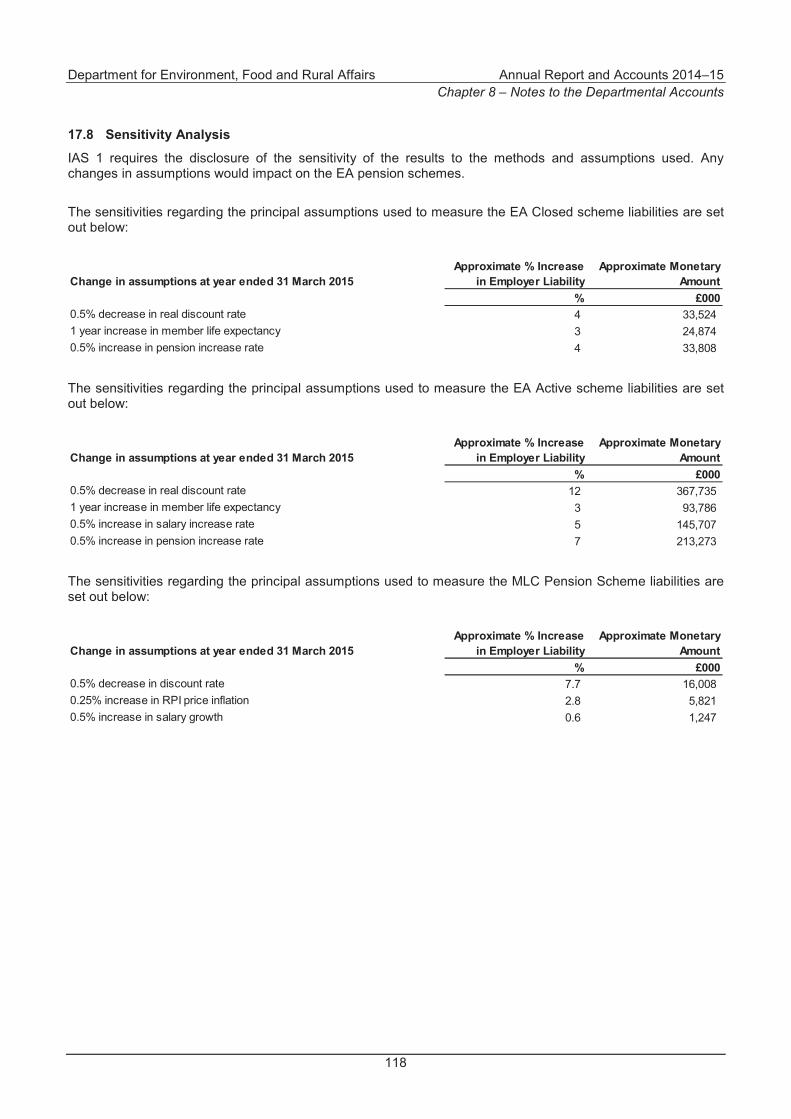
Department for Environment, Food and Rural Affairs Annual Report and Accounts 2014–15 Chapter 8 – Notes to the Departmental Accounts
118
17.8 Sensitivity Analysis
IAS 1 requires the disclosure of the sensitivity of the results to the methods and assumptions used. Any changes in assumptions would impact on the EA pension schemes.
The sensitivities regarding the principal assumptions used to measure the EA Closed scheme liabilities are set out below:
Change in assumptions at year ended 31 March 2015Approximate % Increase
in Employer LiabilityApproximate Monetary
Amount% £000
0.5% decrease in real discount rate 4 33,524 1 year increase in member life expectancy 3 24,874 0.5% increase in pension increase rate 4 33,808
The sensitivities regarding the principal assumptions used to measure the EA Active scheme liabilities are set out below:
Change in assumptions at year ended 31 March 2015Approximate % Increase
in Employer LiabilityApproximate Monetary
Amount% £000
0.5% decrease in real discount rate 12 367,735 1 year increase in member life expectancy 3 93,786 0.5% increase in salary increase rate 5 145,707 0.5% increase in pension increase rate 7 213,273
The sensitivities regarding the principal assumptions used to measure the MLC Pension Scheme liabilities are set out below:
Change in assumptions at year ended 31 March 2015Approximate % Increase
in Employer LiabilityApproximate Monetary
Amount% £000
0.5% decrease in discount rate 7.7 16,008 0.25% increase in RPI price inflation 2.8 5,821 0.5% increase in salary growth 0.6 1,247

Department for Environment, Food and Rural Affairs Annual Report and Accounts 2014–15 Chapter 8 – Notes to the Departmental Accounts
119
18 Contingent Liabilities and Contingent Assets
18.1 Contingent Liabilities
18.1.1 Quantifiable The Department has the following quantifiable contingent liabilities at 31 March 2015.
• Liability for landfill sites that do not reach the standards required by the Environmental Permitting regulations and where the permit holder becomes insolvent, and cases where ongoing management is required and there is no permit holder. Potential liability to the Core Department is estimated at £15–30m (2013–14, £15–30m).
• The Core Department has a potential liability of £21m (2013–14, £20m) in relation to dilapidations for failing to maintain properties in accordance with the terms of their leases.
• Defra has committed to providing financial assistance to domestic customers of South West Water in the form of a £50 per annum discount to water bills from 1 April 2013. Defra has a potential liability estimated at £156m (2013–14, £142m) for payments from 1 April 2016 to 31 March 2020. These commitments are subject to the outcome of any future Spending Reviews and government policy.
• Small potential liabilities against Defra, its Executive Agencies and NDPBs are estimated at no more than £1.4m (2013–14, £4m).
18.1.2 Unquantifiable The Department has the following contingent liabilities which are unquantifiable due to their variable nature.
• Infringements of the Urban Waste Water Treatment Directive could lead to substantial fines for the Core Department from the EU.
• As part of the revised contract with our facilities management providers it has been agreed that under certain conditions arising from the rationalisation of the estate and subsequent reduction in demand, any restructuring costs such as redundancies or early retirement will be recharged to the Core Department.
• The Core Department has liabilities at the year-end relating to certain elements of its Repair and Renew Grant scheme, in circumstances where works funded by this grant occurred by 31 March 2014 but claims had not yet been submitted to the Department. This grant is available to flood-affected property owners affected by the flooding events between 1 April 2013 and 31 March 2014. The total amount of the liability will not be known until all applications have been received and validated.
• There is a potential liability in respect of the CAP where the European Commission (EC) have questioned the debt management procedures. This liability to the Core Department is uncertain at present.
• RPA is currently in receipt of appeals from scheme claimants against the non-payment of claims covering the Single Payment Scheme and trader related schemes. If the appeals are successful they could either result in a liability for EU or Exchequer funded payments.
• An HMRC audit of the Forestry Commission’s treatment of VAT and income tax is underway. An unquantifiable contingent liability is disclosed to recognise the possibility of future non–compliance liabilities arising from the audit.

Department for Environment, Food and Rural Affairs Annual Report and Accounts 2014–15 Chapter 8 – Notes to the Departmental Accounts
120
18.2 Contingent Assets
At 31 March 2015, the main items under this heading were as follows.
• The Core Department is entitled to a future share of enhancement in value on a number of properties and land previously sold. These enhancements generally arise from the planning and development process and are based on a number of trigger points, planning thresholds and increased values (unquantifiable).
• RPA expects to make future additional payments to customers in relation to land claimed under the Single Payment Scheme. It is anticipated that some of this will be reclaimable from the European Commission, but the value of the reimbursement is subject to future events and decisions that are not wholly within the control of RPA. Accordingly, RPA has established a contingent asset of £11m representing the best estimate of the value which will be recovered from the Commission in relation to these claims.
• The Department has other potential small assets, with an estimated value of £2.9m (2013–14, £2m).
18.3 Remote Liabilities Included for Parliamentary Reporting and Accountability Purposes
In addition to contingent liabilities reported within the meaning of IAS 37, the Department also reports liabilities for which the likelihood of a transfer of economic benefit in settlement is too remote to meet the definition of contingent liability.
18.3.1 Quantifiable Defra has entered into the following quantifiable contingent liabilities by offering guarantees, indemnities or by giving letters of comfort.
A transfer of economic benefits is considered to be remote on the following.
• Indemnity signed by Defra, Canal and River Trust and British Waterways pension trustees in relation to the historic public sector pension liability. The potential liability is estimated at £125m (2013–14, £125m).
• Small potential liabilities are estimated at no more than £2.8m (2013–14 £4m).
18.3.2 Unquantifiable Defra has entered into the following contingent liabilities by offering guarantees, indemnities or by giving letters of comfort. Due to the variable nature of these contingent liabilities they are classified as unquantifiable.
• Where Defra has assigned a previously held lease to a third party, Defra remains potentially liable to compensate the landlord where the subsequent lessee defaults and the landlord fails to achieve redress elsewhere.
• Environmental contamination arising from the use, and former use of sites which Defra controls, or formerly controlled, may give rise to a future remediation liability.
• Defra may be liable for a potential penalty following an EC cross compliance audit through the European Court of Justice.
• A lease condition of the agreement with Fera Science Limited (FSL) for Sand Hutton gives that if an insured risk eventuates that makes the premises inaccessible, there is an obligation for full rebuilding (where it is possible to do so and subject to a long-stop date of 2 years) and temporary relocation of the FSL facilities to allow FSL to continue to operate.
• Potential future claims (both civil and criminal) against the Core Department for pollution that may arise from foot and mouth disease farm burial grounds.

Department for Environment, Food and Rural Affairs Annual Report and Accounts 2014–15 Chapter 8 – Notes to the Departmental Accounts
121
19 Losses and Special Payments
19.1 Losses Statement
2014-15 2013-14
Core Department
Core Department and
Agencies Departmental
Group Core Department Core Department
and Agencies Departmental
Group £000 £000 £000 £000 £000 £000
Losses Values Cash losses 24 3,251 7,168 47 2,450 3,264 Stores losses - 29 29 252 246 255 Administrative write-offs - 15 4,049 - 81 1,708 Fruitless payments - - - - - 16 Constructive losses 5,221 5,221 5,221 - - - Claims abandoned 117 352 352 20 (160) (160)Total 5,362 8,868 16,819 319 2,617 5,083
Core Department
Core Department and
Agencies Departmental
Group Core Department Core Department
and Agencies Departmental
Group Number Number Number Number Number Number
Number of Cases Cash losses 5 727 1,336 13 448 904 Stores losses - 27 27 1 1 25 Administrative write-offs - 9 1,749 - 96 1,149 Fruitless payments - - - - - 1 Constructive losses 2 2 2 - - - Claims abandoned 2 1,046 1,046 3 1,000 1,000 Total 9 1,811 4,160 17 1,545 3,079
Details of Cases over £300,000
The Core Department had a loss of £5,179,000 in relation to the impairment of the CAPD Programme. Further details can be found in the Governance Statement in Chapter 7.
The Environment Agency (EA) had the following losses individually valued over £300,000.
• Authorisation and Authentication project: £1,606,000 to write off the capitalised cost from 2011–12 and 2012–13. Since business case approval there is now a new government central public services network being delivered outside the EA. Therefore this solution became obsolete.
• Medmerry Park: £900,000 for full and final settlement for insured losses incurred in June 2012.
• Medmerry Caravan Park: £440,000 for insured losses incurred during the Medmerry Managed Realignment Scheme construction.
RPA had the following losses individually valued over £300,000.
• Surrey Wildlife Trust: £404,000 impairment of a receivable.
• Commoners’ Associations: £311,000 compensation for SPS claims.
• Angus Growers Ltd: £400,000 interest due on Fruit and Vegetable Producer Scheme.

Department for Environment, Food and Rural Affairs Annual Report and Accounts 2014–15 Chapter 8 – Notes to the Departmental Accounts
122
19.2 Special Payments
2014-15 2013-14
Core Department
Core Department and
Agencies Departmental
Group Core Department Core Department
and Agencies Departmental
Group
Value (£000) 383 1,561 1,561 3 (372) (372)Number of cases 140 388 388 1 463 463
There were no cases over £300,000 in 2014–15
20 Related Party Transactions
The Department is the sponsor of the Executive Agencies, NDPBs and Levy Funded Bodies, all of which are within the departmental accounting boundary, shown in Note 23. Public Corporations are outside the accounting boundary, and are shown in Note 24. All the bodies above are regarded as related parties with which the Department has had various material transactions during the year. These bodies also trade with each other and have had material transactions during the year.
In addition, the Department has had a number of transactions with other government departments and the Devolved Administrations.
A number of Defra Board members, or other related parties, claim CAP scheme payments as detailed below. Where this is the case, the standard EU terms and conditions for these schemes apply.
Lord de Mauley (Parliamentary Under-Secretary of State) received £17,404 in respect of grants for SPS, Woodland Grant Scheme, Farm Woodland Premium Scheme and Entry Level Stewardship.
Details for related party transactions for Executive Agencies, NDPBs and Levy Funded Bodies can be found in the notes to their ARAs.
Other than those disclosed above, none of the Defra Board members or other related parties have undertaken any material transactions with the Department during the year.
21 Events After the Reporting Period
Defra’s Financial Statements are laid before the House of Commons by HM Treasury. IAS 10: Events after the reporting period requires Defra to disclose the date on which the Accounts are authorised for issue.
There were no reportable events after the reporting period.
The Annual Report and Accounts were authorised by the Accounting Officer for issue on the date of the Comptroller and Auditor General’s audit certificate.
22 Prior Period Adjustments
The prior year Consolidated Accounts were aligned to reflect the Network Bodies’ final published Annual Report and Accounts, together with some minor adjustments in the Core Department, including an adjustment relating

Department for Environment, Food and Rural Affairs Annual Report and Accounts 2014–15 Chapter 8 – Notes to the Departmental Accounts
123
to the ongoing future liabilities to remediate mine water pollution arising from abandoned metal mines (see Note 16.5 for further information).
22.1 Effect on the Consolidated Statement of Net Expenditure
The adjustments resulted in an overall increase to departmental net expenditure of £4.1m (Core Department and Agencies £0.3m, Core Department £0.2m credit), of which £4.8m (Core Department and Agencies £0.2m credit, Core Department £0.2m credit) was programme expenditure.
Total Comprehensive expenditure reduced by £9.4m (Core Department and Agencies £0.5m, Core Department £0.2m).
22.2 Effect on the Consolidated Statement of Financial Position
Total assets increased by £3.1m (Core Department and Agencies £0.1m, Core Department £1.8m).
Total liabilities increased by £51.4m (Core Department and Agencies £58.8m, Core Department £61.0m).
The resulting changes in the reserves can be seen in the Consolidated Statement of Changes in Taxpayers’ Equity.
23 Entities within the Departmental Boundary
The entities within the departmental boundary during 2014–15 comprise supply financed agencies and those entities listed in the Designation and Amendment Orders presented to Parliament. They are:
Executive Agencies
Animal and Plant Health Agency (from 1 October 2014, formerly known as Animal Health and Veterinary Laboratories Agency) Centre for Environment, Fisheries and Aquaculture Science Food and Environment Research Agency (From 31 March 2015 Fera ceased to be a government agency) Rural Payments Agency Veterinary Medicines Directorate
The Executive Agencies’ ARAs have been prepared under the direction of HM Treasury in accordance with Section 7(2) of the Government Resources and Accounts Act 2000 and are published separately.
Forestry Commission (FC) has been included in Defra’s Estimate. Therefore, FC has been fully consolidated and is included within the results for the Core Department and Executive Agencies.
Executive NDPBs
Consumer Council for Water Environment Agency Food from Britain (abolished 19 July 2014) Gangmasters Licensing Authority (moved to Home Office on 9 April 2014) Joint Nature Conservation Committee Marine Management Organisation National Forest Company Natural England Royal Botanic Gardens, Kew

Department for Environment, Food and Rural Affairs Annual Report and Accounts 2014–15 Chapter 8 – Notes to the Departmental Accounts
124
The Executive NDPBs’ ARAs are published separately.
Advisory NDPBs (Defra Funded)
Advisory Committee on Pesticides (abolished March 2015) Advisory Committee on Releases to the Environment Committee on Agricultural Valuation (abolished 23 April 2014) Independent Agricultural Appeals Panel Science Advisory Council Veterinary Products Committee
Levy Bodies
Agriculture and Horticulture Development Board Sea Fish Industry Authority
The Levy Bodies’ ARAs are published separately.
Tribunal NDPBs (Defra Funded)
Plant Varieties and Seeds Tribunal (dormant)
24 Entities outside the Departmental Boundary
The public sector bodies which have not been consolidated in these Accounts, but for which Defra’s ministers had lead policy responsibility during the year, are as follows:
Public Corporations
Covent Garden Market Authority
Other Bodies
National Parks Authorities (x9) Water Services Regulation Authority (Ofwat) Waste and Resources Action Programme (WRAP) British Wool Marketing Board Broads Authority

Department for Environment, Food and Rural Affairs Annual Report and Accounts 2014–15 Annexes
125
Annexes
These Annexes do not form part of the financial statements and have not been subject to audit.

Department for Environment, Food and Rural Affairs Annual Report and Accounts 2014–15 Annex 1 – Input and Impact Indicators
126
Annex 1: Input and Impact Indicators The Business Plan sets out how Defra will measure progress towards achieving the Department’s priorities and objectives. A set of indicators was developed to monitor progress in key areas. These constitute inputs (use of resources) and impacts. Defra’s input and impact indicators are based on data which is collected and compared across time periods of varying frequency. This variation is determined by a number of factors, including the cost of collecting the data, the process by which the data is collected, and the usefulness of more frequent surveys. By their nature, impact indicators can be affected by many factors, including those outside of Defra’s control, and it can take some time to see Defra’s actions reflected as changes in indicator performance. The set of indicators was not designed to cover the entirety of Defra’s work and so should be considered alongside progress on other Business Plan actions to provide a fuller picture of Defra’s performance.
The table on the following page sets out all input and impact indicators, comparing latest performance with the previous dataset. Further information about the nature of the indicators and the measurement detail is available in the Measurement Annex to Defra’s Quarterly Data Summary (QDS)23. Defra produces a wide range of statistical datasets, all of which are available online24.
23 http://data.gov.uk/dataset/defra-business-plan-quarterly-data-summary 24 https://www.gov.uk/government/organisations/department-for-environment-food-rural-affairs/about/statistics

Dep
artm
ent f
or E
nviro
nmen
t, Fo
od a
nd R
ural
Affa
irs
An
nual
Rep
ort a
nd A
ccou
nts
2014
–15
Ann
ex 1
– In
put a
nd Im
pact
Indi
cato
rs
127
Inpu
t Ind
icat
ors
Tim
e Pe
riods
La
test
D
ata
Prev
ious
D
ata
Com
men
t on
tren
d
Tota
l cos
t to
gove
rnm
ent o
f bo
vine
TB
(bTB
) con
trol
(Eng
land
)
Late
st d
ata:
201
4–15
Pr
evio
us d
ata:
201
3–14
£9
2.39
m
£101
.75m
The
redu
ctio
n in
the
tot
al c
ost
in 2
014–
15 c
ompa
red
to 2
013–
14 i
s a
cons
eque
nce
of a
num
ber
of f
acto
rs,
but
two
in p
artic
ular
are
wor
thy
of
note
. •
The
redu
ctio
n in
th
e ne
t co
st
of
bTB
com
pens
atio
n,
as
a co
nseq
uenc
e of
: ge
nera
lly l
ower
liv
ewei
ght
mar
ket
pric
es f
or c
attle
ov
er t
he y
ear;
few
er a
nim
als
slau
ghte
red;
and
im
prov
ed s
alva
ge
retu
rns
from
a n
ew c
ontra
ct.
• Th
e re
duct
ion
in
APH
A
inpu
t on
bT
B du
ring
the
year
, as
a
cons
eque
nce
of th
e te
mpo
rary
div
ersi
on o
f res
ourc
es to
dea
l with
two
avia
n in
fluen
za o
utbr
eaks
.
Cos
t per
Sin
gle
Paym
ent
Sche
me
(SPS
) cla
im
Late
st d
ata:
201
3–14
Pr
evio
us d
ata:
201
2–13
£6
59
£691
Au
dite
d SP
S C
ost p
er C
laim
dat
a fo
r 20
14–1
5 w
ill n
ot b
e av
aila
ble
until
th
e en
d of
Jul
y 20
15.
Fund
ing
to E
nviro
nmen
t Ag
ency
(EA)
for w
ater
qu
ality
Late
st d
ata:
201
3–14
Pr
evio
us d
ata:
201
2–13
£7
4.5m
£7
8.0m
Th
e am
ount
of
fund
ing
gran
ted
to t
he E
A fo
r w
ater
qua
lity
fell
betw
een
2011
–12
and
2013
–14.
Cos
t of l
ocal
aut
horit
y w
aste
m
anag
emen
t per
hou
seho
ld1
Late
st d
ata:
201
3–14
Pr
evio
us d
ata:
201
2–13
£1
41.0
2 £1
40.4
8 In
nom
inal
ter
ms,
the
cos
t ha
s in
crea
sed
by 0
.4%
with
res
pect
to
the
prev
ious
yea
r but
con
tinue
s to
dec
reas
e in
real
term
s.
Tota
l gov
ernm
ent c
apita
l in
vest
men
t in
flood
and
co
asta
l ero
sion
risk
m
anag
emen
t2
Late
st d
ata:
201
3–14
Pr
evio
us d
ata:
201
2–13
£3
40.0
m
£287
.6m
Dur
ing
2013
–14,
we
spen
t 18%
mor
e th
an th
e pr
evio
us fi
nanc
ial y
ear i
.e.
an
incr
ease
of
£5
2.4m
, w
hich
is
co
nsis
tent
w
ith
the
Gov
ernm
ent’s
co
mm
itmen
t to
red
uce
the
risk
of f
lood
ing
and
coas
tal e
rosi
on in
the
5
year
s to
201
4–15
.
Impa
ct In
dica
tors
Ti
me
Perio
ds
Late
st
Dat
a Pr
evio
us
Dat
a C
omm
ent o
n tr
end
Cat
tle h
erds
that
are
offi
cial
ly
bTB-
free
(Eng
land
) La
test
dat
a: 2
014
Prev
ious
dat
a: 2
013
86.6
%
86.7
%
The
perc
enta
ge o
f ca
ttle
herd
s in
Eng
land
tha
t re
mai
ned
offic
ially
bTB
-fre
e th
roug
hout
the
yea
r de
crea
sed
very
slig
htly
in 2
014
. Fut
ure
trend
s w
ill
be
dete
rmin
ed,
in
part,
by
th
e G
over
nmen
t's
prog
ram
me
of
inte
rven
tions
and
lev
els
of b
TB t
estin
g. E
arlie
r de
tect
ion
of d
isea
se
shou
ld,
all
othe
r th
ings
be
ing
equa
l, ev
entu
ally
fe
ed
thro
ugh
into
im
prov
emen
ts in
thi
s in
dica
tor
over
the
long
er t
erm
. Th
e tre
nd b
etw
een
2013
and
201
4 w
as a
ffect
ed b
y an
APH
A d
ata
clea
nsin
g ex
erci
se w
hich

Dep
artm
ent f
or E
nviro
nmen
t, Fo
od a
nd R
ural
Affa
irs
An
nual
Rep
ort a
nd A
ccou
nts
2014
–15
Ann
ex 1
– In
put a
nd Im
pact
Indi
cato
rs
128
Impa
ct In
dica
tors
Ti
me
Perio
ds
Late
st
Dat
a Pr
evio
us
Dat
a C
omm
ent o
n tr
end
has
led
to a
red
uctio
n of
2,0
00 r
egis
tere
d ca
ttle
herd
s. T
his
has
resu
lted
in a
dec
reas
e in
the
perc
ent o
f her
ds w
hich
are
bTB
-free
. Th
e 20
13 fi
gure
has
bee
n re
vise
d sl
ight
ly s
ince
its
prev
ious
pub
licat
ion
as
mor
e da
ta h
as b
ecom
e av
aila
ble.
Agric
ultu
ral s
oils
nitr
ogen
ba
lanc
e (E
ngla
nd) (
kg N
/ ha
/ y
ear)
1
Late
st d
ata:
201
3 Pr
evio
us d
ata:
201
2 88
.9
90.8
The
mai
n dr
iver
for
thi
s re
duct
ion
is a
sm
all
redu
ctio
n to
inp
uts
from
in
orga
nic
ferti
liser
s, a
lthou
gh th
is w
as p
artia
lly o
ff-se
t by
redu
ctio
ns in
off-
take
from
har
vest
ed c
rops
. Si
nce
2000
, the
re h
as b
een
an o
vera
ll lo
ng-
term
dec
line
in t
he n
itrog
en b
alan
ce p
er h
ecta
re.
A re
duct
ion
in t
he
bala
nce
per h
ecta
re b
road
ly in
dica
tes
a re
duce
d en
viro
nmen
tal r
isk.
Tota
l Fac
tor P
rodu
ctiv
ity o
f U
K Ag
ricul
tura
l Ind
ustry
(b
ase
year
201
0 =
100)
Late
st d
ata:
201
4 (F
irst
estim
ate)
Pr
evio
us d
ata:
201
3 10
5.3
99.3
Fo
llow
ing
two
year
s ad
vers
ely
affe
cted
by
the
wea
ther
, pro
duct
ivity
ros
e by
6.0
% in
201
4. T
his
rise
was
driv
en b
y hi
gh y
ield
ing
crop
s th
at s
aw th
e vo
lum
e of
out
puts
incr
ease
by
6.5%
.
Prop
ortio
n of
Site
s of
Spe
cial
Sc
ient
ific
Inte
rest
(SSS
Is) i
n fa
vour
able
or u
nfav
oura
ble
reco
verin
g co
nditi
on
Late
st d
ata:
at M
arch
20
15
Prev
ious
dat
a: a
t Mar
ch
2014
95.9
8%
96.2
0%
Alth
ough
ther
e ha
s be
en a
slig
ht d
eclin
e in
con
ditio
n, th
e he
adlin
e fig
ure
rem
ains
abo
ve th
e 95
% ta
rget
.
Prop
ortio
n of
Site
s of
Spe
cial
Sc
ient
ific
Inte
rest
(SSS
Is) i
n fa
vour
able
con
ditio
n
Late
st d
ata:
at M
arch
20
15
Prev
ious
dat
a: a
t Mar
ch
2014
37.6
2%
37.6
0%
Whi
lst t
he n
et h
eadl
ine
figur
e re
mai
ns re
lativ
ely
stat
ic, i
t mas
ks th
e gr
oss
chan
ges
in a
nd o
ut o
f fa
vour
able
con
ditio
n th
at h
ave
occu
rred
in 2
014–
15.
It al
so r
efle
cts
Nat
ural
Eng
land
’s f
ocus
in
2014
–15
on f
orw
ard
plan
ning
and
man
agem
ent
of c
asew
ork
risk
to in
crea
se a
chie
vabi
lity
of
the
over
all B
iodi
vers
ity 2
020
targ
et o
f 50%
favo
urab
le c
ondi
tion.
Smoo
thed
Far
mla
nd B
irds
Inde
x (b
ase
year
197
0 =
100)
Late
st a
sses
sed
data
: 20
123 . B
asel
ine
for
asse
ssm
ent p
erio
d:
2007
Pr
evio
us a
sses
sed
data
: 20
11. B
asel
ine
for
asse
ssm
ent p
erio
d:
2006
2012
: 45
2007
: 49
2011
: 47
2006
: 50
The
inde
x sh
ows
a st
atis
tical
ly s
igni
fican
t de
clin
e of
7%
in t
he f
arm
land
bi
rd in
dex
betw
een
2007
and
201
2.

Dep
artm
ent f
or E
nviro
nmen
t, Fo
od a
nd R
ural
Affa
irs
An
nual
Rep
ort a
nd A
ccou
nts
2014
–15
Ann
ex 1
– In
put a
nd Im
pact
Indi
cato
rs
129
Impa
ct In
dica
tors
Ti
me
Perio
ds
Late
st
Dat
a Pr
evio
us
Dat
a C
omm
ent o
n tr
end
Net
impr
ovem
ent i
n w
ater
qu
ality
ele
men
ts (p
erce
ntag
e po
int c
hang
e fro
m p
revi
ous
thre
e-ye
ar a
vera
ge)
Late
st
data
: 20
11–1
3 (2
014
repo
rt)
Prev
ious
dat
a: 2
010–
12
(201
3 re
port)
2.20
%
1.24
%
Whi
le t
he c
hang
es r
emai
n w
ithin
the
bou
nds
of s
tatis
tical
flu
ctua
tion,
th
ere
is a
net
impr
ovem
ent i
n ph
osph
ate
leve
ls in
350
riv
er w
ater
s w
hich
ca
n be
attr
ibut
ed in
par
t to
wat
er in
dust
ry in
vest
men
t in
bette
r tre
atm
ent
of s
ewag
e. S
mal
l ch
ange
s to
agr
icul
tura
l pr
actic
es m
ay a
lso
have
an
influ
ence
, alth
ough
this
is h
arde
r to
stat
e w
ith c
erta
inty
. The
re w
as a
lso
a ne
t im
prov
emen
t in
the
num
ber
of r
iver
wat
er b
odie
s m
eetin
g th
e go
od
stat
us r
equi
rem
ent f
or h
ealth
y fis
h po
pula
tions
. Thi
s ca
n be
attr
ibut
ed to
w
ork
the
EA h
as d
one
with
oth
ers
to re
mov
e ba
rrie
rs to
fish
mig
ratio
n an
d to
impr
ove
the
qual
ity o
f riv
er w
ater
.
Was
te fr
om h
ouse
hold
s re
cycl
ing
rate
La
test
dat
a: 2
0134
Prev
ious
dat
a: 2
012
44.2
%
44.1
%
The
Was
te fr
om h
ouse
hold
s re
cycl
ing
rate
rea
ched
44.
2% in
Eng
land
in
2013
. Thi
s is
mar
gina
lly u
p on
the
44.1
% a
chie
ved
in 2
012.
It is
up
by 3
.0
perc
enta
ge p
oint
s si
nce
2010
, th
e ea
rlies
t ye
ar f
or w
hich
dat
a fo
r th
is
spec
ific
mea
sure
are
ava
ilabl
e. T
he ‘
was
te f
rom
hou
seho
lds’
mea
sure
re
plac
es t
he p
revi
ous
hous
ehol
d w
aste
rec
yclin
g ra
te.
See
stat
istic
al
repo
rt fo
r ful
l det
ails
5 .
Estim
ate
of th
e nu
mbe
r of
hous
ehol
ds w
here
the
risk
of
dam
age
from
floo
ding
and
co
asta
l ero
sion
has
bee
n m
arke
dly
redu
ced
Late
st d
ata:
201
4–15
Pr
evio
us d
ata:
201
3–14
32
,700
40
,500
Dat
a fo
r 20
14–1
5 sh
ows
an a
dditi
onal
32,
700
hous
ehol
ds a
re b
ette
r pr
otec
ted.
Thi
s co
nfirm
s th
at E
A ex
ceed
ed t
he G
over
nmen
t’s t
arge
t to
re
duce
the
risk
of fl
oodi
ng o
r er
osio
n to
at l
east
165
,000
hou
seho
lds
by
Mar
ch 2
015.
The
tota
l hou
seho
lds
with
impr
oved
pro
tect
ion
from
floo
ding
an
d co
asta
l ero
sion
sin
ce A
pril
2011
is n
ow 1
77,3
00.
Num
ber o
f dom
estic
, bu
sine
ss a
nd o
ther
pre
mis
es
in h
ard-
to-r
each
rura
l are
as
that
hav
e th
e po
tent
ial t
o re
ceiv
e su
perfa
st b
road
band
as
a re
sult
of R
ural
C
omm
unity
Bro
adba
nd F
und
(RC
BF) i
nves
tmen
t in
Engl
and
(cum
ulat
ive
pred
icte
d an
d ac
tual
)1,6
Late
st d
ata:
201
4–15
Pr
evio
us d
ata:
201
3–14
3,
377
1,70
3
Late
st d
ata
give
s th
e to
tal n
umbe
r of p
rem
ises
exp
ecte
d to
be
cove
red
by
all f
ive
com
mun
ity p
roje
cts
cont
acte
d un
der
the
Fund
by
31 M
arch
201
5.
This
dat
a co
uld
chan
ge s
light
ly w
hen
all f
ive
proj
ects
com
plet
e de
liver
y (e
xpec
ted
Sep
tem
ber 2
015)
. The
pre
viou
s da
ta fi
gure
rela
tes
to p
rem
ises
co
vere
d by
the
first
two
com
mun
ity p
roje
cts
cont
ract
ed u
nder
the
Fund
by
31 M
arch
201
4.
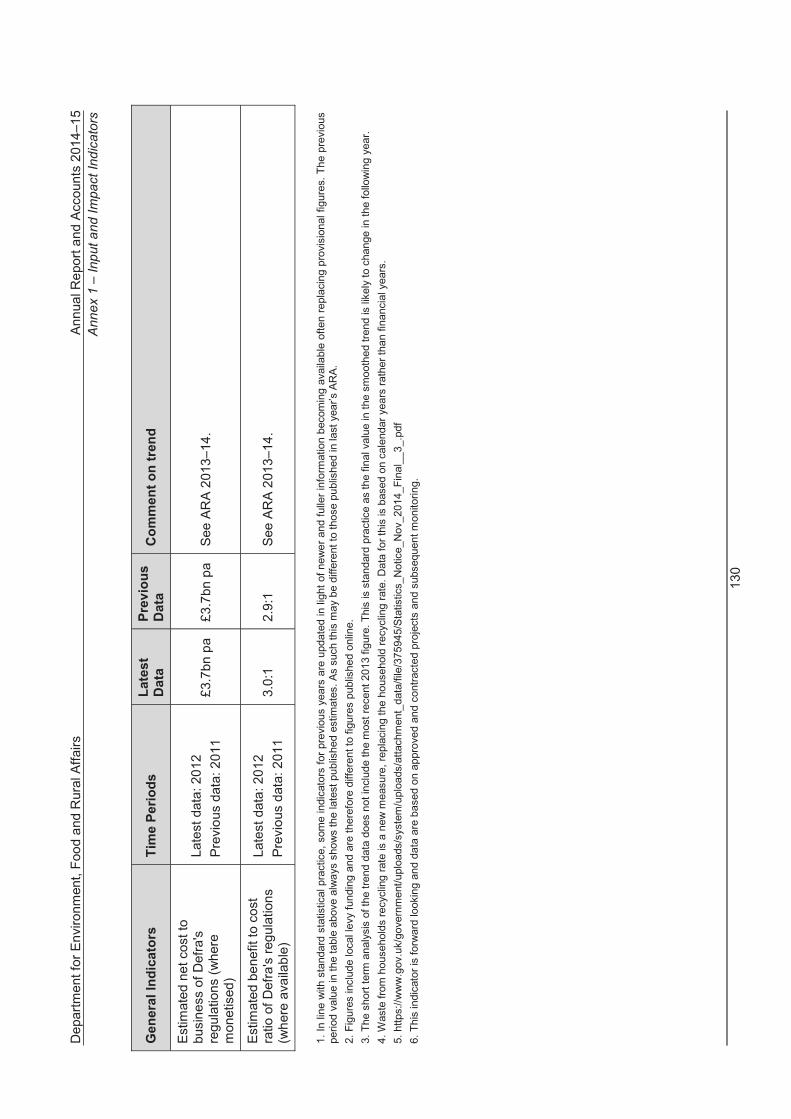
Dep
artm
ent f
or E
nviro
nmen
t, Fo
od a
nd R
ural
Affa
irs
An
nual
Rep
ort a
nd A
ccou
nts
2014
–15
Ann
ex 1
– In
put a
nd Im
pact
Indi
cato
rs
130
Gen
eral
Indi
cato
rs
Tim
e Pe
riods
La
test
D
ata
Prev
ious
D
ata
Com
men
t on
tren
d
Estim
ated
net
cos
t to
busi
ness
of D
efra
's
regu
latio
ns (w
here
m
onet
ised
)
Late
st d
ata:
201
2 Pr
evio
us d
ata:
201
1 £3
.7bn
pa
£3.7
bn p
a Se
e AR
A 20
13–1
4.
Estim
ated
ben
efit
to c
ost
ratio
of D
efra
's re
gula
tions
(w
here
ava
ilabl
e)
Late
st d
ata:
201
2 Pr
evio
us d
ata:
201
1 3.
0:1
2.9:
1 Se
e AR
A 20
13–1
4.
1. In
line
with
sta
ndar
d st
atis
tical
pra
ctic
e, s
ome
indi
cato
rs fo
r pre
viou
s ye
ars
are
upda
ted
in li
ght o
f new
er a
nd fu
ller i
nfor
mat
ion
beco
min
g av
aila
ble
ofte
n re
plac
ing
prov
isio
nal f
igur
es. T
he p
revi
ous
perio
d va
lue
in th
e ta
ble
abov
e al
way
s sh
ows
the
late
st p
ublis
hed
estim
ates
. As
such
this
may
be
diffe
rent
to th
ose
publ
ishe
d in
last
yea
r’s A
RA
. 2.
Fig
ures
incl
ude
loca
l lev
y fu
ndin
g an
d ar
e th
eref
ore
diffe
rent
to fi
gure
s pu
blis
hed
onlin
e.
3. T
he s
hort
term
ana
lysi
s of
the
trend
dat
a do
es n
ot in
clud
e th
e m
ost r
ecen
t 201
3 fig
ure.
Thi
s is
sta
ndar
d pr
actic
e as
the
final
val
ue in
the
smoo
thed
tren
d is
like
ly to
cha
nge
in th
e fo
llow
ing
year
. 4.
Was
te fr
om h
ouse
hold
s re
cycl
ing
rate
is a
new
mea
sure
, rep
laci
ng th
e ho
useh
old
recy
clin
g ra
te. D
ata
for t
his
is b
ased
on
cale
ndar
yea
rs ra
ther
than
fina
ncia
l yea
rs.
5. h
ttps:
//ww
w.g
ov.u
k/go
vern
men
t/upl
oads
/sys
tem
/upl
oads
/atta
chm
ent_
data
/file
/375
945/
Sta
tistic
s_N
otic
e_N
ov_2
014_
Fina
l__3
_.pd
f 6.
Thi
s in
dica
tor i
s fo
rwar
d lo
okin
g an
d da
ta a
re b
ased
on
appr
oved
and
con
tract
ed p
roje
cts
and
subs
eque
nt m
onito
ring.

Department for Environment, Food and Rural Affairs Annual Report and Accounts 2014–15 Annex 1 – Input and Impact Indicators
131
UK agriculture total factor productivity is an indicator for how well inputs are converted into outputs. Over the longer term, total factor productivity for the agricultural industry in the UK has increased by 52 percent between 1973 and 2014. In that time, the volume of final output has increased by 34 percent while the volume of all inputs fell by 12 percent. However, total factor productivity has remained relatively unchanged with no clear trend since 2005.
The joint Defra/Broadband Delivery UK25 £20m Rural Community Broadband Fund (RCBF) allowed communities in hard-to-reach areas to secure funding for projects that would give them the potential to receive superfast broadband. Such communities would otherwise only have the potential to receive standard broadband by 2016 through the Government’s wider superfast rollout programme and may be disadvantaged.
Three projects contracted under the RCBF in 2014–15 have a total of 1,674 predicted and actual premises to be given access to superfast broadband, bringing the cumulative total under the Fund to 3,377 premises (predicted and actual). A further 17 projects, covering around 20,000 premises, resulted from the Fund and are being delivered as extensions to existing local authority contracts under the national rollout programme. These will be reported under the Department for Culture, Media and Sport broadband indicator. More information on the RCBF indicator is contained in the RCBF statistical release26.
The soil nitrogen balance is an indicator of the overall environmental pressure from levels of nitrogen in agricultural soils. It measures the difference between nitrogen applied to soils (largely as fertiliser and manures) and the nitrogen removed from soils by crops and grazing. A high nitrogen balance can impact on air quality through ammonia emissions from fertilisers and manures, on water quality through nitrate levels in rivers and on climate change through nitrous oxide emissions. A reduction in the balance per hectare broadly indicates a reduced environmental risk. The 2 percent decrease between 2012 and 2013 continues a longer term trend.
In 2013–14, funding to EA for water quality was £74.5m (previous year £78m). Due to changes in time recording in the EA, input figures from 2013–14 onwards are derived, in part, from validated estimates. The water quality index is a lagging indicator being reported in the year after the last samples are taken. The indicator is based on the percentage of English water bodies that have improved with respect to a number of chemical and biological quality elements. The index comprises three years of data, so for instance the results from samples collected in 2011, 2012 and 2013 are averaged to produce the 2014 report. The first two years of reporting in 2008 and 2009 showed a positive change of 1.8 percentage points and 0.5 percentage points respectively. In 2011, 2012 and 2013 the index showed a change of -0.7, - 0.2 and +1.24 percentage points respectively. These changes are not statistically significant. Measures put in place under the Water Framework Directive would not yet be expected to influence this index; experts suggest it can take between 6 and 15 years for measures to make a significant impact on these results.
In 2013, the breeding farmland birds index in England was less than half (a decline of 56 percent) of its value in 1970 – the lowest level recorded. The largest declines in farmland bird populations occurred between the late seventies and the early nineties, but there has been a statistically significant decline of 7 percent between 2007 and 2012. This decline has been caused by land management changes and intensification of farming, such as the loss of mixed farming, a move from spring to autumn sowing of arable crops, change in grassland management (e.g. a switch from hay to silage production), increased pesticide and fertiliser use, and the removal of non–cropped features, such as hedgerows. The rate of change, which resulted in the loss of suitable nesting and feeding habitats and a reduction in food, was greatest during the late 1970s and early 1980s and hence many farmland bird populations declined most rapidly during that period.
The England Biodiversity Strategy (Biodiversity 2020) committed to maintain the 95 percent of SSSIs at favourable or unfavourable recovering condition, as achieved in 2010, and extend it further to deliver 50 percent of SSSIs into favourable condition by 2020. This is a contribution towards the 2020 mission of halting overall biodiversity loss, supporting healthy, well-functioning ecosystems and establishing coherent ecological networks, with more and better places for nature for the benefit of wildlife and people.
25 www.gov.uk/broadband-delivery-uk 26 https://www.gov.uk/government/publications/rural-community-broadband-fund-rcbf-output-indicator
Department for Environment, Food and Rural Affairs Annual Report and Accounts 2014–15 Annex 1 – Input and Impact Indicators
132
The favourable condition commitment requires a shift of focus away from putting management mechanisms in place (to achieve recovering condition) to ensuring tangible and sustained improvement as a result of appropriate site management mechanisms. At March 2015, 96 percent of SSSIs were in favourable or unfavourable recovering condition – a very slight decline from last year but already above the final target. 37.6 percent of SSSIs are now in favourable condition compared with 36.6 percent in March 2011. Natural England lead on the delivery of this target, putting management measures in place for SSSIs and tracking their performance.
Local authority waste management cost £141 per household in 2013–14. In nominal terms the cost increased 0.4 percent with respect to the previous year and 6.5 percent with respect to 2008–09. In real terms (i.e. when the increase in costs due to general inflation are taken out), the cost decreased by 1.6 percent in the last year and 4.3 percent over the last four years (or 7.3 percent when landfill tax is excluded). Over the same period, the real cost per tonne of material has increased by 5.3 percent; and when landfill tax is excluded, cost per tonne has increased by 2.0 percent. Real figures have been calculated using GDP deflator.
The Waste from households recycling rate reached 44.2 percent in England in 2013. This is up very slightly on the 44.1 percent achieved for 2012 and on the 43.3 percent in 2011. Though the rate of increase has slowed, the Department is keeping progress under review and remains committed to meeting the 2020 EU target for 50 percent of waste from households being recycled. The ‘waste from households’ measure replaces the previous household waste recycling rate. For details see the statistical report27.
The Department invested £3.2bn on reducing the risk from flooding and coastal erosion in the 5 years to 2014–15, as a result of which it exceeds the target to better protect more than 165,000 households by March 2015. In 2013–14 £340m was invested in capital schemes to manage flood and erosion risk (Department spending plus local levy). 32,700 households were better protected from flooding as a result of schemes completed in 2014–15.
27 https://www.gov.uk/government/uploads/system/uploads/attachment_data/file/375945/Statistics_Notice_Nov_2014_Final__3_.pdf

Department for Environment, Food and Rural Affairs Annual Report and Accounts 2014–15 Annex 2 –Core Tables
133
Annex 2: Core Tables 2014–15 The aim of the published tables is to provide an explanation of what Defra spends money on. The analysis shows departmental expenditure split between resource consumption and capital investment. The tables also show how Defra spends its money by country and region, staff numbers employed by body and capital employed. The format of the tables is dictated by HM Treasury. HM Treasury publishes a glossary in the Public Expenditure Statistical Analyses Report (CM 8902)28 that explains the majority of the terms used in the Core Tables and in the commentary below so these are not all repeated here.
Details of the Parliamentary Main Estimate29 and Parliamentary Supplementary Estimate are published separately30.
Tables 1 and 2 – Defra’s Resource and Capital Budget
Table 1 sets out a summary of the Resource and Capital Budget expenditure for the Department, covering the period from 2010–11 to 2015–16. It shows Departmental Expenditure Limit (DEL) and Annually Managed Expenditure (AME) elements separately for control purposes. Future years’ figures reflect the budgeted figures agreed with HM Treasury for the Department.
Table 2 shows the Administration costs of running the Department in more detail. The Administration Budget includes staff costs, resource expenditure on accommodation, utilities and services etc., where they are not directly associated with front-line service delivery. The commentary on Administration costs is included in the detailed analysis below, but in general terms, the Administration Budget reflects the savings required by the 2010 Spending Review (SR10) and the 2013 Spending Round (SR13).
These tables follow the layout of the Part II Table of the 2014–15 Supplementary Estimate and have been produced from HM Treasury’s Online System for Central Accounting and Reporting (OSCAR) database and are on the same basis as the Statement of Parliamentary Supply.
Resource Budget (Programme and Administration) DEL
Support and develop British farming
The changing profile of spend is primarily due to the profile of Common Agricultural Policy (CAP) disallowance payments. The CAP Disallowance Budget has been transferred between years to match the expected profile of payments. These transfers were agreed with HM Treasury and are in line with the SR10 and SR13 settlements to allow flexibility between years to handle the timing of disallowance costs which are outside the Department’s control, being dependent on the timing of European Commission (EC) decisions.
Help to enhance the environment and biodiversity
The reduction towards the end of the SR10 period is primarily due to the Rural Development Programme England (RDPE). This is because more payments were funded using EU funds rather than the Exchequer, when compared to previous years. RDPE scheme provides a degree of flexibility over the percentage split between Exchequer and EU funded payments across years, as long as the overall total is in line with the scheme rules. There was also a planned decrease in RDPE spend through SR10 as several RDPE schemes came to an end and fewer new agreements are signed. This is reflected in the decreases from 2012–13 onwards. The further decrease in 2015–16 is because in 2013–14 and 2014–15 there was a claim on the Reserve to cover the payment to South West Water to discount by £50 the water bills to household customers. Any claim on the Reserve for 2015–16 payments will be considered in the 2015–16 Supplementary Estimate.
28 https://www.gov.uk/government/statistics/public-expenditure-statistical-analyses-2014 29 https://www.gov.uk/government/collections/hmt-main-estimates 30 https://www.gov.uk/government/collections/hmt-supplementary-estimates

Department for Environment, Food and Rural Affairs Annual Report and Accounts 2014–15 Annex 2 –Core Tables
134
Support a strong and sustainable green economy
The 2011–12 Outturn included one off funding for the International Climate Fund (ICF), which is included within the ‘Support and develop British farming’ Capital DEL for the years 2012–13 onwards.
Prepare for and manage risk from animal and plant diseases
Administration spending decreased in 2011–12 as a result of Animal Health merging with the Veterinary Laboratories Agency to form the Animal Health and Veterinary Laboratories Agency, now the Animal and Plant Health Agency (APHA). The increase from 2013–14 is primarily due to an increase in measures to tackle endemic animal disease.
Prepare for and manage risk from environmental emergencies
The increase from 2012–13 reflects funding of new burdens on local authorities (which commenced in 2011–12) under the Flood and Water Management Act 2010 and the Flood Risk Regulations 2009, with grants being provided directly to Lead Local Flood Authorities. The decrease in 2015–16 reflects a reducing profile as a result of the SR13 allocations, including planned reductions in Local Service Support Grant to Lead Local Flood Authorities and the end of a number of schemes in 2014–15 including the Community Pathfinder Grants and Land Management schemes.
Departmental operating costs
There has been a general decrease due to significant savings made by rationalising the estate and other efficiency measures. The Department has significantly reduced Administration costs in order to protect frontline services. The further one off decrease in Administration costs in 2014–15 relates to the sale of 75 percent of Fera Science Limited to Capita plc following the creation of the new joint venture. The increase in Administration costs in 2015–16 reflects the creation of a centralised Network Corporate Services function, providing services for IT, Estates and procurement. This has reduced overall cost and has resulted in changes to network budgetary allocations due to budgets being held centrally in 2015–16. There is a decrease to the programme budget in 2015–16 reflecting the reduction in Defra’s budget following the announcement by the Chancellor in June 2015. Defra is exploring a number of targeted savings options, with impacts on headline targets and frontline staff numbers kept to a minimum. These include a cross-network ‘gateway’ process to scrutinise and challenge any uncommitted spend. Until these savings have been identified, the budget reduction has been applied to a centrally held budget under departmental operating costs.
Help to enhance the environment and biodiversity (Arm’s Length Body (ALB)(Net))
The downward trend from 2013–14, reflects savings identified by an internal efficiency programme. The decrease in 2015–16 reflects the creation of a centralised Network Corporate Services function, which reduced budget allocations to network bodies as explained above.
Support a strong and sustainable green economy (ALB)(Net)
The decrease in Outturn is due to the closure of the Sustainable Development Commission and the Commission for Rural Communities, as part of the Government’s reform of public bodies.
Prepare for and manage risk from environmental emergencies (ALB)(Net)
The increases in 2014–15 and 2015–16 reflect the additional funding allocated to flood management announced in the 2014 Budget.
Resource Budget AME
Resource AME balances vary greatly over the years due to the volatility of provisions recorded as AME. A debit (a positive) is recorded as provisions are created, and a credit (a negative) recorded when a provision is utilised.

Department for Environment, Food and Rural Affairs Annual Report and Accounts 2014–15 Annex 2 –Core Tables
135
Support and develop British farming
As described in the DEL section earlier, the changing profile of spend in this area is primarily due to the profile of the CAP disallowance provision. Budget has been transferred between years so that the AME credit entries recorded here match the expected profile of the payments recorded under Resource DEL. In addition to this, any revaluations to the CAP disallowance provision are recorded in this section. Debit balances are seen where increases to the provision are higher than payments made in that particular year. As with the timing of disallowance payments, changes in the value of the provision are also reliant on EC decisions.
Help to enhance the environment and biodiversity
The increase in 2012–13 is due to the creation of the provision for South West Water to cover a commitment to provide financial assistance to domestic customers of South West Water. The decreases in 2013–14 and 2014–15 are due to the utilisation of this provision. Any utilisation of this provision for 2015–16 will be processed in the 2015–16 Supplementary Estimate at the same time as the reserve claim is considered, as explained in the DEL section above. Increases from 2014–15 onwards are due to the reallocation of the Environment Agency (EA) closed pension scheme provision AME entries from the Core Department to the EA in line with HM Treasury’s guidance.
Prepare for and manage risk from animal and plant diseases
The increase in Outturn for 2012–13 and 2013–14 relates to dilapidation provisions at the Weybridge site.
Departmental operating costs
The increase in 2014–15 is primarily due to property impairments across the Defra Estate, as a result of the quinquennial property valuation and also the change in classification of the Sand Hutton site to an investment property. In addition to this, a provision has been created for Foot and Mouth Disease (FMD) Burial sites which represents the ongoing future liabilities relating to preventing and remediating any leachate pollution arising from burial sites. The budget for 2015–16 was agreed with HM Treasury as part of the SR13 settlement and reflects budget cover held centrally which may be utilised in year.
Help to enhance the environment and biodiversity (ALB)(Net)
The decrease from 2014–15 onwards is mainly due to the reallocation of the EA closed pension scheme provision AME entries from the Core Department to EA in line with HM Treasury’s guidance. Partially offset by an increase following the reallocation of the EA open pension fund provision between EA Environmental Protection and EA Flood.
Prepare for and manage risk from environmental emergencies (ALB)(Net)
The decrease from 2014–15 onwards is due to the EA Open Pension Fund provision now being allocated between EA Environmental Protection and EA Flood.
Capital Budget DEL
The largest element of the Capital DEL Budget relates to flood management and a ring-fenced budget for the ICF.
Support and develop British farming
The increase from 2012–13 relates to the ring-fenced budget for the ICF. There is a further increase from 2013–14 relating to investment on the CAP delivery programme.
Support a strong and sustainable green economy
The decrease from 2011–12 is due to the end of the Waste Infrastructure Capital Grants to local authorities, a scheme under the Waste Programme.

Department for Environment, Food and Rural Affairs Annual Report and Accounts 2014–15 Annex 2 –Core Tables
136
Prepare for and manage risk from animal and plant diseases
The reduction in spend from 2014–15 is due to various projects completing, including the Veterinary Delivery Partnership project for the delivery of veterinary managed services.
Prepare for and manage risk from environmental emergencies
The 2014–15 Outturn included a claim on the Reserve for the Repair and Renew Grant scheme for households affected by the 2013–14 winter floods.
Departmental operating costs
The reduction in spend from 2014–15 is due to various projects completing within the Defra network estate and an increased level of capital income in 2014–15 following the sale of various properties.
Help to enhance the environment and biodiversity (ALB)(Net)
The decrease in 2015–16 is mainly due to the breakdown of spend between Resource and Capital within EA not yet being determined for 2015–16. At the start of the year there is always uncertainty about the Resource/Capital split of some of EA’s projects. The budget is therefore held in Resource until Capital spend becomes identifiable, at which point it is appropriate to transfer Resource budget to Capital budget. The 2015–16 Capital budget is, therefore, likely to increase in the 2015–16 Supplementary Estimate.
Prepare for and manage risk from environmental emergencies (ALB)(Net)
The increase from 2013–14 reflects additional investment in flood management. This includes additional funding announced in the 2012 Autumn Budget Statement and the 2014 Budget, the majority of which was allocated to 2014–15. The decrease in 2015–16 is mainly due to the breakdown of spend between Resource and Capital within EA not yet being determined for 2015–16, as described above.
Capital Budget AME
Support and develop British farming (ALB)(Net)
The increase in 2014–15 relates to the refurbishment of a building for the Agriculture and Horticulture Development Board following a move to new premises.

Department for Environment, Food and Rural Affairs Annual Report and Accounts 2014–15 Annex 2 –Core Tables
137
Table 1 – Defra’s Resource and Capital Budget
2010-11 2011-12 2012-13 2013-14 2014-15 2015-16Outturn Outturn Outturn Outturn Outturn Plans
£000 £000 £000 £000 £000 £000
Support and develop British farming 473,882 335,795 240,030 240,237 307,279 300,222 Help to enhance the environment and biodiversity 465,561 473,498 467,959 399,937 325,412 314,745 Support a strong and sustainable green economy 138,408 192,429 135,537 131,886 121,359 138,563 Prepare for and manage risk from animal and plant diseases 226,426 189,921 206,481 225,733 231,002 230,281 Prepare for and manage risk from environmental emergencies 16,447 5,798 22,623 23,886 25,883 18,369 Departmental operating costs 216,090 175,154 165,764 139,958 125,517 61,098 Support and develop British farming (ALB) (Net) (2,000) (2,186) (845) (660) - - Help to enhance the environment and biodiversity (ALB) (Net) 489,243 477,799 493,100 479,572 428,729 366,263 Support a strong and sustainable green economy (ALB) (Net) 9,336 628 - - - - Prepare for and manage risk from environmental emergencies (ALB) (Net) 336,278 343,789 318,288 305,524 341,434 342,054
Total Resource DEL 2,369,671 2,192,625 2,048,937 1,946,073 1,906,615 1,771,595
Support and develop British farming (132,028) 26,007 (1,925) (54,362) 1,307 (24,968)Help to enhance the environment and biodiversity (102,548) (36,136) 71,004 (81,806) (42,997) (8,784)Support a strong and sustainable green economy (382) 162 - 1,000 (1,000) - Prepare for and manage risk from animal and plant diseases 1,203 (435) 10,065 10,252 2,579 - Departmental operating costs (2,153) (4,698) (4,864) 6,390 123,245 40,403 Support and develop British farming (ALB) (Net) (14,695) (4,621) (3,060) 2,149 459 (15)Help to enhance the environment and biodiversity (ALB) (Net) (97,472) (15,452) 2,053 (4,387) (18,254) (14,312)Support a strong and sustainable green economy (ALB) (Net) 222 (204) - - - - Prepare for and manage risk from environmental emergencies (ALB) (Net) (89,601) (18,003) 11,310 26,285 12,659 21,284
Total Resource AME (437,454) (53,380) 84,583 (94,479) 77,998 13,608
Total Resource Budget 1,932,217 2,139,245 2,133,520 1,851,594 1,984,613 1,785,203
Depreciation1 225,908 212,927 209,409 218,145 280,279 187,464
Support and develop British farming 11,963 6,232 28,818 60,863 83,270 65,573 Help to enhance the environment and biodiversity 28,501 27,663 21,117 18,857 25,064 20,074 Support a strong and sustainable green economy 53,806 8,343 - - - - Prepare for and manage risk from animal and plant diseases 21,232 9,695 11,888 13,264 5,660 2,870 Prepare for and manage risk from environmental emergencies 4,856 - - - 11,583 - Departmental operating costs 3,794 (995) 12,026 14,351 (2,750) 6,748 Help to enhance the environment and biodiversity (ALB) (Net) 57,126 43,420 50,887 38,365 25,829 14,735 Support a strong and sustainable green economy (ALB) (Net) - (5) - - - - Prepare for and manage risk from environmental emergencies (ALB) (Net) 386,959 290,859 289,489 336,586 489,355 383,000
Total Capital DEL 568,237 385,212 414,225 482,286 638,011 493,000
Support and develop British farming (ALB) (Net) 861 19 (1,502) (836) 1,586 1,000 Help to enhance the environment and biodiversity (ALB) (Net) - 16 228 93 51 -
Total Capital AME 861 35 (1,274) (743) 1,637 1,000
Total Capital Budget 569,098 385,247 412,951 481,543 639,648 494,000
Total departmental spending2 2,275,407 2,311,565 2,337,062 2,114,992 2,343,982 2,091,739
Total DEL 2,737,402 2,367,587 2,274,163 2,231,667 2,352,906 2,077,595 Total AME (461,995) (56,022) 62,899 (116,675) (8,924) 14,144
Resource DEL
Resource AME
Of which:
Capital DEL
Capital AME
Of which:
1. Includes impairments 2. Total departmental spending is the sum of the resource budget and the capital budget less depreciation. Similarly, total DEL is the sum of the resource budget DEL and capital budget DEL less depreciation in DEL, and total AME is the sum of resource budget AME and capital budget AME less depreciation in AME. These tables now reflect the Machinery of Government changes included in the 2014–15 Main and Supplementary Estimates. The figures for 2010–11 to 2013–14 are therefore different to those published in the 2013–14 ARA and the prior period figures in the Accounts section of the 2014–15 ARA. 2015–16 plans figures are based on provisional allocations and are subject to change, following further business planning decisions.

Department for Environment, Food and Rural Affairs Annual Report and Accounts 2014–15 Annex 2 –Core Tables
138
Table 2 – Defra’s Administration Costs
2010-11 2011-12 2012-13 2013-14 2014-15 2015-16Outturn Outturn Outturn Outturn Outturn Plans
£000 £000 £000 £000 £000 £000
Support and develop British farming 146,479 107,088 111,556 111,705 124,002 108,046 Help to enhance the environment and biodiversity 48,737 30,949 40,179 37,632 32,444 34,619 Support a strong and sustainable green economy 15,029 15,104 13,621 13,228 10,702 11,304 Prepare for and manage risk from animal and plant diseases 49,365 (6,781) (118) (4,290) 7,051 12,343 Prepare for and manage risk from environmental emergencies 2,591 1,658 1,903 2,207 2,366 2,184 Departmental operating costs 188,988 166,131 149,194 128,450 101,605 159,747 Support and develop British farming (ALB) (Net) (2,000) (2,186) (845) (836) - - Help to enhance the environment and biodiversity (ALB) (Net) 178,563 174,190 155,010 165,094 138,543 122,278 Support a strong and sustainable green economy (ALB) (Net) 9,336 628 - - - - Prepare for and manage risk from environmental emergencies (ALB) (Net) 102,449 105,145 79,949 73,829 69,803 66,754
739,537 591,926 550,449 527,019 486,516 517,275
Resource DEL
Total Administration Budget
These tables now reflect the Machinery of Government changes included in the 2014–15 Main and Supplementary Estimates. The figures for 2010–11 to 2013–14 are therefore different to those published in the 2013–14 ARA and the prior period figures in the Accounts section of the 2014–15 ARA.
Table 3 – Comparison of Main Estimate to Final Allocations to Outturn
Table 3 details Defra’s Outturn for 2014–15, comparing this to the final allocations published in the 2014–15 Supplementary Estimate and also to the initial allocations published in the 2014–15 Main Estimate. In line with convention it is produced using the same layout as the Parliamentary Estimate, detailing spend on DEL and AME.
Comparing the original 2014–15 Main Estimate to the Outturn in 2014–15 results in a DEL resource under-spend of £86m; a DEL capital over-spend of £80m; an AME resource over-spend of £132m and an AME capital over-spend of £1m . Comparing the 2014–15 Supplementary Estimate to the Outturn in 2014–15 results in a DEL resource under-spend of £12m; a DEL capital under-spend of £13m; an AME resource under-spend of £200m and an AME capital under-spend of £1m . A high level summary of the most significant variances of Outturn to the Supplementary Estimate are provided in Chapter 3.

Department for Environment, Food and Rural Affairs Annual Report and Accounts 2014–15 Annex 2 –Core Tables
139
Table 3 – Comparison of Main Estimate to Final Supplementary Allocations to Outturn
2014-15 Main Estimate
2014-15 Supplementary
Estimate 2014-15 Outturn
ResourceNet Resource
OutturnNet Resource
OutturnNet Resource
Outturn£000 £000 £000
Spending in Departmental Expenditure Limits (DEL)Voted expenditureOf which:
Support and develop British farming 394,782 300,308 307,279 Help to enhance the environment and biodiversity 324,356 332,308 325,412 Support a strong and sustainable green economy 144,379 142,248 121,359 Prepare for and manage risk from animal and plant diseases 238,487 234,076 231,002 Prepare for and manage risk from environmental emergencies 28,115 28,115 25,883 Departmental operating costs 111,871 119,660 125,517 Support and develop British farming (ALB) (Net) 1,146 - - Help to enhance the environment and biodiversity (ALB) (Net) 431,035 430,161 428,729 Prepare for and manage risk from environmental emergencies (ALB) (Net) 318,054 332,054 341,434
Total spending in Resource DEL 1,992,225 1,918,930 1,906,615
Spending in Annually Managed Expenditure (AME)Voted expenditureOf which:
Support and develop British farming (96,968) 115,032 1,307 Help to enhance the environment and biodiversity (434) (1,061) (42,997)Support a strong and sustainable green economy - - (1,000)Prepare for and manage risk from animal and plant diseases 165 54,465 2,579 Prepare for and manage risk from environmental emergencies 118 118 - Departmental operating costs 49,420 116,352 123,245 Support and develop British farming (ALB) (Net) 17 17 459 Help to enhance the environment and biodiversity (ALB) (Net) (48,452) (48,452) (18,254)Prepare for and manage risk from environmental emergencies (ALB) (Net) 41,744 41,744 12,659
Total spending in Resource AME (54,390) 278,215 77,998
Total Resource 1,937,835 2,197,145 1,984,613 Of which:Voted expenditure 1,937,835 2,197,145 1,984,613
2014-15 Main Estimate
2014-15 Supplementary
Estimate 2014-15 Outturn
CapitalNet Resource
OutturnNet Resource
OutturnNet Resource
Outturn£000 £000 £000
Spending in Departmental Expenditure Limits (DEL)Voted expenditureOf which:
Support and develop British farming 72,727 72,727 83,270 Help to enhance the environment and biodiversity 19,000 20,685 25,064 Prepare for and manage risk from animal and plant diseases 4,224 6,480 5,660 Prepare for and manage risk from environmental emergencies - - 11,583 Departmental operating costs - 15,000 (2,750)Support and develop British farming (ALB) (Net) 48,997 12,464 - Help to enhance the environment and biodiversity (ALB) (Net) 9,252 34,151 25,829 Prepare for and manage risk from environmental emergencies (ALB) (Net) 403,800 489,800 489,355
Total spending in Capital DEL 558,000 651,307 638,011
Spending in Annually Managed Expenditure (AME)Voted expenditureOf which:
Support and develop British farming (ALB) (Net) 1,000 3,000 1,586 Help to enhance the environment and biodiversity (ALB) (Net) - - 51
Total spending in Capital AME 1,000 3,000 1,637
Total Capital 559,000 654,307 639,648 Of which:Voted expenditure 559,000 654,307 639,648
Total Resource and Capital 2,496,835 2,851,452 2,624,261 of which:Total DEL 2,550,225 2,570,237 2,544,626
Total AME (53,390) 281,215 79,635

Department for Environment, Food and Rural Affairs Annual Report and Accounts 2014–15 Annex 2 –Core Tables
140
Table 4 – Capital Employed
The figures for the years 2013–14 and earlier are extracted from the audited ARAs for those years, including those of the Non–Departmental Public Bodies (NDPBs).
During the SR10 period (2011–12 to 2014–15) there has been a reduction in land and buildings, through a disposal programme. The reduction in 2014–15 was also attributable to impairment and revaluation.
Current assets reduced by £230m in 2012–13, mainly because of a reduction in bank account balances, reflecting an initiative by HM Treasury and Government Banking Service to hold smaller balances. The increase in 2014–15 is largely attributable to an increase in accrued income (mainly related to EU funding) partly offset by a reduction in cash balances.
Payables reduced in 2011–12 because Consolidated Fund Extra Receipts (CFER) balances were eliminated in that year due to the introduction of Clear Line of Sight, and again in 2012–13 as the Consolidated Fund balance reduced. In 2013–14 the overall balance is largely unchanged, but non-current payables have become current as payment becomes due in 2014–15.
There was an increase in Provisions in 2012–13 due to the creation of a provision for South West Water obligations, offset by a reduction in Defra’s provision for the EA closed pension scheme due to ongoing contributions into the scheme for pensions in payment. The 2013–14 reduction was mainly due to utilisation of the CAP disallowance, South West Water and EA closed pension provisions. The 2014–15 reduction was again mainly due to reductions in South West Water and EA closed pension provisions.
NDPB Net Assets reduced in 2012–13 and in 2014–15 due to an increase in the EA active pension, offset by an increase in EA’s infrastructure assets.

Department for Environment, Food and Rural Affairs Annual Report and Accounts 2014–15 Annex 2 –Core Tables
141
Table 4 – Capital Employed
2010-11 Outturn
2011-12 Outturn
2012-13 Outturn
Restated2013-14 Outturn
2014-15 Outturn
2015-16 Plans
£m £m £m £m £m £mAssets and liabilities on the statement of financial position at end of year:
AssetsNon current assets
Intangible 230 191 148 142 137 140
Property, plant and equipment and investment properties 589 537 501 456 405 400 of which: Land and buildings including investment properties 427 402 384 340 310 310 Fixtures and fittings 61 56 50 46 52 50 Vehicles, plant and machinery 51 44 42 37 26 25 Equipment and IT 35 21 14 10 6 5 Assets under construction 15 14 11 23 11 10
Receivables > 1 year 15 14 14 12 11 10
Investments 5 - - - 7 10
Current Assets 1,136 1,091 861 847 952 950
Liabilities
Payables < 1 year (1,145) (903) (729) (791) (828) (830)Payables > 1 year (159) (143) (136) (39) (83) (85)Provisions/liabilities (991) (961) (1,032) (977) (867) (865)
Capital employed within Core Department and Agencies (320) (174) (373) (350) (266) (270)
NDPB net assets 2,304 2,303 2,192 2,175 2,063 2,065
Total capital employed in the Departmental Group1,984 2,129 1,819 1,825 1,797 1,795

Department for Environment, Food and Rural Affairs Annual Report and Accounts 2014–15 Annex 2 –Core Tables
142
Table 5 – Staff in Post
Table 5 shows the number of payroll and non–payroll staff in Defra, its Executive Agencies and NDPBs as at 31 March 2012, 2013, 2014 and 2015 in full-time equivalents (FTE). The data in this table is taken from the Cabinet Office Monthly Workforce Management Information returns. In order to ensure consistency with other Cabinet Office returns, the Forestry Commission is excluded.
Payroll Staff
The total number of payroll staff at 31 March 2015 was 20,721 FTEs, a reduction of 2,464 (11 percent) against the 23,185 staff at 31 March 2012. Payroll staff numbers decreased by 1,160 FTEs during 2014–15.
On 1 April 2014 the Environment Agency started its move to a national and local business model. Work that was previously done at a regional level has now moved into area and national teams. EA achieved a reduction in staff of 728 FTEs in 2014–15 through recruitment controls, reduction in temporary staff, limited use of voluntary early release scheme and natural turnover. The reduction in staff has followed the reduction in revenue funding, with Flood and Coastal Risk Management posts being largely unaffected, and the biggest reduction due to Environment and Business Grant in Aid reductions.
Natural England (NE) and Fera reduced their staff numbers by 263 FTEs and 232 FTEs respectively during 2014–15, largely as a result of transfers within the Defra Network. APHA, Marine Management Organisation (MMO) and NE transferred 152 staff (146 FTEs) to Defra Network Corporate Services (Estates, Procurement and ICT) on 1 October 2014 and Fera transferred 246 plant and bee health staff (224 FTEs) to APHA on 1 October 2014. NE reduced their staff numbers through a voluntary exit scheme, natural turnover and recruitment controls.
Non–payroll Staff
Non–payroll staff have increased by 11 FTEs (less than 1 percent) between 31 March 2012 and 31 March 2015. There was an increase of 51 non–payroll staff (less than 5 percent) during 2014–15.

Dep
artm
ent f
or E
nviro
nmen
t, Fo
od a
nd R
ural
Affa
irs
An
nual
Rep
ort a
nd A
ccou
nts
2014
–15
Ann
ex 2
–C
ore
Tabl
es
143
Tabl
e 5
– St
aff i
n Po
st
Payr
oll
staf
f
Non
-Pa
yrol
l st
aff
Tota
lPa
yrol
l st
aff
Non
-Pa
yrol
l st
aff
Tota
lPa
yrol
l st
aff
Non
-Pa
yrol
l st
aff
Tota
lPa
yrol
l st
aff
Non
-Pa
yrol
l st
aff
Tota
lN
umbe
rN
umbe
rN
umbe
rN
umbe
rN
umbe
rN
umbe
rN
umbe
rN
umbe
rN
umbe
rN
umbe
rN
umbe
rN
umbe
rD
epar
tmen
t for
Env
ironm
ent F
ood
& R
ural
Affa
irs 1
2,08
5
73
2,
158
2,
091
73
2,16
4
1,98
9
91
2,
080
2,
006
98
2,10
4
Exec
utiv
e Ag
enci
esAn
imal
and
Pla
nt H
ealth
Age
ncy
22,
355
10
4
2,
459
2,
180
93
2,27
3
2,04
9
90
2,
139
2,
197
64
2,26
1
Cen
tre fo
r Env
ironm
ent F
ishe
ries
& A
quac
ultu
re S
cien
ce52
0
7
52
7
54
2
13
555
532
1
533
513
-
513
Food
and
Env
ironm
ent R
esea
rch
Agen
cy86
5
4
86
9
84
8
10
858
773
11
78
4
54
1
25
566
Rur
al P
aym
ents
Age
ncy3
2,34
8
54
2,
402
2,
102
15
0
2,
252
1,
875
20
6
2,
081
2,
018
14
1
2,
159
Ve
terin
ary
Med
icin
es D
irect
orat
e15
0
7
15
7
15
0
14
164
153
10
16
3
15
5
6
16
1
Ex
ecut
ive
Agen
cies
Tot
al6,
238
17
6
6,
414
5,
822
28
0
6,
102
5,
382
31
8
5,
700
5,
424
23
6
5,
660
Exec
utiv
e N
on-D
epar
tmen
tal P
ublic
Bod
ies
Agric
ultu
re a
nd H
ortic
ultu
re D
evel
opm
ent B
oard
446
34
48
0
36
6
18
384
369
38
40
7
38
0
18
398
Com
mis
sion
for R
ural
Com
mun
ities
44
-
4
2
-
2
-
--
-
-
-
Con
sum
er C
ounc
il fo
r Wat
er66
-
66
70
2
72
75
1
76
68
3
71
E
nviro
nmen
t Age
ncy
10,9
84
68
7
11
,671
11,7
65
76
4
12
,529
10,4
66
40
3
10
,869
9,73
8
497
10,2
35
G
angm
aste
rs L
icen
sing
Aut
horit
y566
-
66
65
-
65
64
-
64
-
-
-
Jo
int N
atur
e C
onse
rvat
ion
Com
mitt
ee14
6
-
14
6
16
1
-
16
1
16
7
-
16
7
17
0
-
17
0
M
arin
e M
anag
emen
t Org
anis
atio
n27
6
-
27
6
31
5
-
31
5
29
7
-
29
7
26
3
12
275
Nat
iona
l For
est C
ompa
ny15
-
15
15
-
15
17
-
17
17
-
17
N
atur
al E
ngla
nd2,
158
13
1
2,
289
2,
279
13
5
2,
414
2,
228
18
1
2,
409
1,
965
23
0
2,
195
R
oyal
Bot
anic
Gar
dens
, Kew
629
28
65
7
68
2
48
730
736
36
77
2
61
2
25
637
Sea
Fis
h In
dust
ry A
utho
rity
72
1
73
84
-
84
91
-
91
78
-
78
Exec
utiv
e N
DPB
s To
tal
14,8
62
88
1
15
,743
15,8
04
96
7
16
,771
14,5
10
65
9
15
,169
13,2
91
78
5
14
,076
Tota
l23
,185
1,13
0
24,3
15
23
,717
1,32
0
25,0
37
21
,881
1,06
8
22,9
49
20
,721
1,11
9
21,8
40
Def
ra s
taff
in p
ost a
nd n
on-p
ayro
ll st
aff
(full-
time
equi
vale
nts)
31 M
arch
201
231
Mar
ch 2
013
31 M
arch
201
431
Mar
ch 2
015
1. 1
88 s
taff
trans
ferre
d fro
m D
efra
to
Sha
red
Ser
vice
s C
onne
cted
Lim
ited
on 1
Nov
embe
r 20
13 a
nd 1
52 s
taff
trans
ferre
d fro
m A
PH
A,
MM
O a
nd N
E t
o D
efra
Net
wor
k C
orpo
rate
Ser
vice
s on
1
Oct
ober
201
4.
2. T
he A
nim
al a
nd P
lant
Hea
lth A
genc
y w
as c
reat
ed o
n 1
Oct
ober
201
4 fro
m th
e A
nim
al H
ealth
and
Vet
erin
ary
Labo
rato
ry A
genc
y an
d th
e in
spec
tora
te fu
nctio
ns o
f Fer
a.
3. O
n 31
Mar
ch 2
014
non–
payr
oll i
n R
PA
incl
uded
sta
ff on
the
CAP
D p
roje
ct. C
osts
of t
hese
sta
ff w
ere
incl
uded
with
in th
e C
ore
Dep
artm
ent i
n th
e an
nual
acc
ount
s se
ctio
n. A
t 31
Mar
ch 2
015
thes
e st
aff a
re in
clud
ed in
the
Cor
e D
epar
tmen
t. 4.
The
Com
mis
sion
for R
ural
Com
mun
ities
was
abo
lishe
d on
31
Mar
ch 2
013.
5.
Res
pons
ibilit
y fo
r the
Gan
gmas
ters
Lic
ensi
ng A
utho
rity
mov
ed to
the
Hom
e O
ffice
on
9 A
pril
2014
. In
ord
er to
ens
ure
cons
iste
ncy
with
oth
er C
abin
et O
ffice
retu
rns,
the
Fore
stry
Com
mis
sion
is e
xclu
ded
from
the
abov
e ta
ble.

Department for Environment, Food and Rural Affairs Annual Report and Accounts 2014–15 Annex 2 –Core Tables
144
Tables 6, 7 and 8 – Regional Tables
Tables 6, 7 and 8 show analyses of the Department’s spending by country and region, and by function. The data presented in these tables are consistent with the country and regional analyses published by HM Treasury in the November 2014 release31. The figures were largely taken from OSCAR during the summer of 2014 and the regional distributions were completed by the following autumn (taking on board any revisions to departmental totals).
The analyses are set within the overall framework of Total Expenditure on Services (TES). TES broadly represents the current and capital expenditure of the public sector, with some differences from the national accounts measure Total Managed Expenditure. The tables show the central government and public corporation elements of TES. They include current and capital spending by the Department and its NDPBs, and public corporations’ capital expenditure, but do not include capital finance to public corporations. They do not include payments to local authorities or local authorities own expenditure.
TES is a cash equivalent measure of public spending. The tables do not include depreciation, cost of capital charges, or movements in provisions that are in departmental budgets. They do include pay, procurement, capital expenditure, and grants and subsidies to individuals and private sector enterprises. Further information on TES can be found in Appendix E of Public Expenditure Statistical Analyses 201432.
The data features both identifiable and non-identifiable spending.
• Identifiable expenditure on services – which is capable of being analysed as being for the benefit of individual countries and regions.
• Expenditure that is incurred for the benefit of the UK as a whole and cannot be disseminated by individual country or region is considered to be non-identifiable.
Across government, most expenditure is not planned or allocated on a regional basis. Social security payments, for example, are paid to eligible individuals irrespective of where they live. Expenditure on other programmes is allocated by looking at how all the projects across the Department’s area of responsibility, usually England, compare. So the analyses show the regional outcome of spending decisions that on the whole have not been made primarily on a regional basis.
The functional analyses of spending in Table 8 are based on the United Nations Classification of the Functions of Government (COFOG), the international standard. The presentations of spending by function are consistent with those used in Chapter A of the country and regional analyses November 2014 release. These are not the same as the strategic priorities shown elsewhere in the report.
31 https://www.gov.uk/government/statistics/country-and-regional-analysis-2014 32 https://www.gov.uk/government/statistics/public-expenditure-statistical-analyses-2014

Department for Environment, Food and Rural Affairs Annual Report and Accounts 2014–15 Annex 2 –Core Tables
145
Table 6 – Total Identifiable Expenditure on Services by Country and Region, 2010–11 to 2013–14
2010-11 2011-12 2012-13 2013-14Outturn Outturn Outturn Outturn
£m £m £m £mNorth East 228 285 239 236 North West 439 473 406 391 Yorkshire and the Humber 506 556 468 464 East Midlands 606 521 482 485 West Midlands 438 467 399 403 East 844 678 736 741 London 114 192 225 219 South East 583 600 615 604 South West 742 853 738 736 Total England 4,500 4,625 4,308 4,279
Scotland 1 8 4 5 Wales 4 5 3 2 Northern Ireland - 3 - 5 UK identifiable expenditure 4,505 4,641 4,315 4,291 Outside UK 185 42 9 84 Total identifiable expenditure 4,690 4,683 4,324 4,375 Non-identifiable expenditure - - - - Total expenditure on services 4,690 4,683 4,324 4,375
Table 7 – Total Identifiable Expenditure on Services by Country and Region, per Head 2010–11 to 2013–14
2010-11 2011-12 2012-13 2013-14Outturn Outturn Outturn Outturn
£ per head £ per head £ per head £ per head
North East 88 110 92 91 North West 62 67 57 55 Yorkshire and the Humber 96 105 88 87 East Midlands 135 115 105 105 West Midlands 79 83 71 71 East 145 116 125 124 London 14 23 27 26 South East 68 69 71 69 South West 141 161 138 137
England 86 87 81 79 Scotland - 2 1 1 Wales 1 2 1 1 Northern Ireland - 1 - 3 UK identifiable expenditure 72 73 68 67

Dep
artm
ent f
or E
nviro
nmen
t, Fo
od a
nd R
ural
Affa
irs
An
nual
Rep
ort a
nd A
ccou
nts
2014
–15
Ann
ex 2
–C
ore
Tabl
es
146
Tabl
e 8
– To
tal I
dent
ifiab
le E
xpen
ditu
re o
n Se
rvic
es b
y Fu
nctio
n, C
ount
ry a
nd R
egio
n, fo
r 201
3–14
North East
North West
Yorkshire and The Humber
East Midlands
West Midlands
East
London
South East
South West
England
Scotland
Wales
Northern Ireland
UK Identifiable Expenditure
Outside UK
Total Identifiable Expenditure
Not Identifiable
Totals
£m£m
£m£m
£m£m
£m£m
£m£m
£m£m
£m£m
£m£m
£m£m
Econ
omic
affa
irsAg
ricul
ture
, for
estry
, fis
hing
and
hun
ting
181
287
349
408
322
521
76
474
607
3,22
5
3
2
5
3,23
5
77
3,31
2
-3,
312
of
whi
ch: m
arke
t sup
port
unde
r CA
P10
0
16
1
21
5
25
8
19
3
29
1
19
25
4
37
0
1,
861
1
-
5
1,
867
76
1,
943
-
1,94
3
of w
hich
: oth
er a
gric
ultu
re, f
ood
and
fishe
ries
polic
y81
12
6
13
4
15
0
12
9
23
0
57
22
0
23
7
1,
364
2
2
-
1,36
8
1
1,36
9
-1,
369
To
tal e
cono
mic
affa
irs18
1
28
7
34
9
40
8
32
2
52
1
76
47
4
60
7
3,
225
3
2
5
3,
235
77
3,
312
-
3,31
2
Envi
ronm
ent p
rote
ctio
nW
aste
man
agem
ent
-
1
1
1
1
1
1
1
1
8
1
-
-
9
-
9
-9
Po
llutio
n ab
atem
ent
1
3
2
2
3
3
4
4
2
24
--
-24
-
24
-24
Pr
otec
tion
of b
iodi
vers
ity a
nd la
ndsc
ape
15
27
31
33
23
37
7
35
45
253
2
1
-
25
6
7
26
3
-
263
Envi
ronm
ent p
rote
ctio
n38
72
80
39
53
17
8
12
9
89
79
75
7
-
--
757
-75
7
-
757
Tota
l env
ironm
ent p
rote
ctio
n54
10
3
11
4
75
80
21
9
14
1
12
9
12
7
1,
042
3
1
-
1,04
6
7
1,05
3
-1,
053
Hou
sing
and
com
mun
ity a
men
ities
Wat
er s
uppl
y-
1
1
1
1
1
1
1
1
8
--
-8
-
8
-8
To
tal h
ousi
ng a
nd c
omm
unity
am
eniti
es-
1
1
1
1
1
1
1
1
8
-
-
-
8
-
8
-
8
Tota
l23
5
39
1
46
4
48
4
40
3
74
1
21
8
60
4
73
5
4,
275
6
3
5
4,
289
84
4,
373
-
4,37
3

Department for Environment, Food and Rural Affairs Annual Report and Accounts 2014–15 Annex 3 – Commentary on Sustainable Performance
147
Annex 3: Commentary on Sustainable Performance Departmental Summary: Greening Government Commitments (GGC) Performance
Performance achieved at April 2015
Target (April 2015)
Greenhouse Gas Reduction (GHG) 25% reduction 25% Waste Reduction 31% reduction 25% Water Reduction 23% reduction Reduce from baseline Domestic Flights Reduction 2% increase 20% Paper Reduction 30% reduction 10% (April 2012)
Background
As part of its Sustainable Development Strategy, the Government encourages both companies and public bodies to disclose their sustainability and environmental performance via their Annual Reports and Accounts. The environmental data and associated financial costs presented in the following pages are consistent with the requirements of HM Treasury’s Public Sector Annual Reports: Sustainability Reporting Guidance 2014–15.
The information contained within this Annex has not been subject to audit and does not form part of the auditors’ opinion on the accounts.
Introduction
This annex sets out Defra’s performance against the sustainability objectives of its estate and operations. It is divided into two sections: Section A outlines departmental performance and Section B covers the Core Department only.
This report focuses on the most significant estate and travel impacts identified through the Departmental Network’s Environmental Management Systems measured against the GGC targets. These targets are for reductions in GHG emissions, waste arisings, water use and for increasing procurement of more sustainable goods and services. The targets were scheduled to run until the end of March 2015. This has recently been extended until the end of March 2016.
Other aspects of the Departmental Network’s operations contribute to its environmental impact including the embedded carbon and water of purchased items, supplier transport, waste handling and water supply. These impacts are not captured by this report but some of these are mitigated through sustainability criteria stipulated in procurement and services contracts. Data to report these impacts is not always readily available.
The targets, which are measured from a 2009–10 baseline, are:
• reduce GHG from the whole estate and business related transport by 25 percent;
• reduce the amount of waste generated by 25 percent;
• reduce water consumption and report on office water use against best practice benchmarks;
• reduce the number of domestic flights by 20 percent;
• ensure that more sustainable and efficient products are bought and undertake engagement with suppliers to understand and reduce the impacts of the supply chain; and
• cut paper use by 10 percent (2012 ‘in year’ target).
Performance against these targets is defined using the following terms.

Department for Environment, Food and Rural Affairs Annual Report and Accounts 2014–15 Annex 3 – Commentary on Sustainable Performance
148
• Exceeding target: the target for April 2015 has been exceeded.
• On target: performance has met the April 2015 target.
• Behind target: performance has not reached the required level and therefore needs to improve in order to meet the target in April 2016.
• Increase from baseline: no reduction made and performance in this area has worsened since the baseline year.
• Continues to exceed target: where a target was completed before 2014 and yet performance is still being measured and is exceeding the original target requirement.
Assurance and Data
The data in Sustainability Data - Table 1 presents the GHG, energy consumption, water use and waste arisings figures as reported as part of the GGC and reports performance for 1 April 2014 to 31 March 2015. Cost data is not reported as part of the GGC, therefore all financial data presented in this report is sourced from accounting records for this period.
Energy and water data is primarily taken from supplier invoices. In most cases, the data in these invoices is informed by manual meter readings or half hourly smart meter readings. All consumption and cost data is also subject to validation and verification by Defra’s Utility Bureau. These processes provide a high level of assurance that reported data is accurate and robust. Defra has been awarded ‘Certified Emissions Measurement and Reduction Scheme’ (CEMARS) certification for the quality of the data used for reporting. This meets two International Standards Organisation (ISO) standards for GHG reporting. The Environment Agency, RBG Kew and Forestry Commission have their own data assurance processes and produce their own Annual Report and Accounts.
Waste data is derived from figures provided by the Departmental Network’s waste contractors. Wherever possible actual weights are used but where this is not possible waste data is calculated using a metric based on the number of bins emptied. Audits have been undertaken to validate and improve the accuracy of this data for common waste streams, using a number of key sites to establish the average weights and waste ratios. This estimation methodology will result in a small margin of error. It is not currently cost effective to weigh all waste streams.
Section A: Departmental Network Performance33
This section of the report provides an overview of Departmental Network performance against the GGC targets. For the purposes of GGC reporting the Departmental Network comprises the following network bodies.
• Defra Core Department • Executive Agencies
• Animal Health and Veterinary Laboratories Agency (AHVLA) (to end Sep 2014) • Animal and Plant Health Agency (APHA), formerly AHVLA, (from 1 Oct 2014) • Centre for Environment, Fisheries and Aquaculture Science (Cefas), • Food and Environment Research Agency (Fera), • Rural Payments Agency (RPA),
33 The data contained in section A of this Annex is reported as absolute values. It has not been normalised against metrics such as FTE staff, financial turnover or metre squared floor space. The diverse business delivery across the Estate is influenced by numerous factors such as weather, scientific undertakings and tourism numbers. This makes it difficult to report trends and make comparisons to other organisations.

Department for Environment, Food and Rural Affairs Annual Report and Accounts 2014–15 Annex 3 – Commentary on Sustainable Performance
149
• Veterinary Medicines Directorate (VMD) • Non–Departmental Public Bodies
• Environment Agency (EA) • Marine Management Organisation (MMO) • Natural England (NE) • Royal Botanic Gardens Kew (RBG Kew)
• Forestry Commission • Other Defra Network Bodies and Other Government Departments
Under the ‘major occupier’ rule, Defra reports the environmental impact of other Government Departments which occupy its buildings. Also included are some of Defra’s own Network Bodies which do not meet the threshold for GGC reporting, but are of insufficient materiality to remove from the Departmental dataset.
Governance
The Departmental Network’s sustainable operations strategy is developed and delivered through the Network Corporate Services function. Progress against the GGC targets is reported to Defra’s Network Executive Committee Network Operations and Investment Committee on a quarterly basis.
Quality assurance is managed through the central Estates team who are responsible for producing the Departmental Network sustainability reports. These have been subject to internal audit and found to be compliant with GGC and HM Treasury guidelines.
The Department’s Network Corporate Services Director is the Senior Responsible Officer for Defra’s participation in the Carbon Reduction Commitment Energy Efficiency Scheme (CRC), European Union Emissions Trading System (EU ETS) and is signatory for the Department’s Environmental Policy.
GGC Performance and Future Strategy
The Departmental Network aims to keep sustainability at the heart of its business delivery and operations. This means that it strives to operate in the most sustainable and environmentally responsible manner: improving the way we use our work spaces; reducing energy and water use; reducing the amount of waste generated; making strategic energy and waste savings from IT services; and assessing the products and services that are purchased to support all operational activities.
The Department’s ‘One Business’ programme is developing a business model across the Departmental Network which is more strategic, flexible and resilient and will drive sustainability improvements. One strand of the programme, the creation of a ‘Network Corporate Services’ directorate in October 2014, has given Defra the opportunity to take a network wide approach to the way it delivers its services, embedding sustainability best practice in strategic decision making and service delivery across Estates, Procurement and Information Services functions.
• A key element of ‘One Business’ is making more efficient use of space, reducing the number of buildings where possible, thereby driving performance improvements from its built environment and saving £53m since 2010 from the estate’s costs.
• The ‘Future of Science delivery’ programme is looking at how the Departmental Network can deliver its science from a smaller foot print. Science currently accounts for 33 percent of the Departmental Network’s GHG foot print and minimising this impact will deliver significant efficiency savings.
• A ‘Single Design Policy’ will define a consistent approach to the design of work spaces throughout the estate. This will use environmental best practise as standard.

Department for Environment, Food and Rural Affairs Annual Report and Accounts 2014–15 Annex 3 – Commentary on Sustainable Performance
150
Estates
Business activities in the Departmental Network’s buildings are the most significant contributor to overall environmental impact. The Departmental Network’s portfolio comprises a diverse mix of properties which includes office buildings, storage facilities, pumping stations, forestry facilities, botanic gardens, experimental farms and complex laboratory campus facilities.
The wide range of activities undertaken presents a considerable challenge in delivering savings in energy and water used and waste generated. The following section details performance and also outlines future plans for meeting all of the GGC targets.
GGC GHG Emissions target
GHG Reduction 2014–15 vs. Baseline
Target April 2015 Current Performance
25% reduction 25% reduction On target
The Departmental Network has met the 2014–15 target. Performance against the GHG target has improved during the 2014–15 year. Measures which have contributed to this include:
• a significant reduction in GHG emissions by Environment Agency. More information on their performance can be found in their own Annual Report and Accounts;
• making changes to the way routine asset replacement is undertaken, driving for sustainable options to be considered for all appropriate projects;
• installation of more efficient machinery and equipment at sites across the estate, such as condensing boilers and energy efficient hand dryers;
• a review of biomass boilers to identify opportunities to improve efficiency; and
• continued development of the Energy Bureau service, improving the monitoring and targeting (M&T) of energy and water use on the Core Department and Executive Agencies estate. Using live, half hourly, energy consumption data from properties across the estate, opportunities are frequently identified to drive Defra’s facilities management provider to better manage energy and water use. Since establishing this programme in December 2013 potential savings of £480,000 have been identified and the initiative has also been supported by training for Facilities Management staff.
The winter of 2014–15 brought significant carbon savings at an Environment Agency and APHA joint site from a newly installed wood biomass unit in Exeter. This replaced some inefficient oil boilers and has yielded a reduction of 130 tonnes of GHG and £25,000 savings in energy costs compared to the year before.
Initiatives planned for the 2015–16 year include the following.
• Further improvements to the Departmental Network’s energy M&T system. Benchmarking will enable Defra to compare the performance of its buildings to industry standards and the increased use of sub metering will allow smarter targeting of consumption at a more granular level.
• Continued installation and upgrade of plant and machinery controls across the portfolio to improve building management. This is being rolled out in parallel with contract changes in the Departmental Networks’ Facilities Management contract which makes the FM provider more accountable for building energy use.
• Working with the Re:Fit framework to deliver energy savings through Energy Performance Contracts, where Defra repays the investment over time through the guaranteed energy cost savings delivered through the project.

Department for Environment, Food and Rural Affairs Annual Report and Accounts 2014–15 Annex 3 – Commentary on Sustainable Performance
151
• Continued estate rationalisation to deliver additional energy savings.
• Registration for the renewable heat incentive scheme for a newly re-commissioned biomass boiler.
Waste
Waste Reduction 2014–15 vs. Baseline
Target April 2015 Current Performance
31% reduction 25% reduction Exceeding target
The Departmental Network has exceeded the 2014–15 target. Performance against the waste target has improved significantly during the 2014–15 year. The key contributing factors are as follows.
• Renewal of the Departmental Network’s general waste contract in May 2014 incorporated industry best practice, including a commitment to the Government’s Responsibility Deal. This enabled Defra to re-assess waste management processes and work with the new service provider to identify improvement opportunities, such as less waste to landfill and less incinerated without energy capture.
• A continued reduction in the amount of paper used by the estate. See the section on the paper use target for more detail.
• General reductions in waste arisings across the estate through greater awareness as a result of communications campaigns and standardisation of bin provision.
• Desks, chairs and other items removed from vacated buildings are resized and refurbished by inmates at Kirkham Prison. This innovative partnership enables inmates to gain carpentry, welding and upholstery skills, which are useful in finding employment on release. The benefits to the Departmental Network are financial savings and a reduction in waste arisings. This is a low cost, sustainable solution which the Departmental Network is encouraging other departments to adopt.
• Continued improvement of the quality of data collected for waste reporting.
Initiatives planned for the 2015–16 year and beyond include the following.
• Making further improvements to waste collection services, in particular increasing the recording of data that is derived from actual weights rather than using estimation metrics.
• Monitoring waste arisings at a building level and investigating and where appropriate, challenging excessive waste generation.
Water
Water Reduction 2014–15 vs. Baseline
Target April 2015 Current Performance
23% reduction Reduce from baseline Exceeding target
Water use across the estate is diverse which means consumption can vary significantly across business activities and from year to year. Water use on the horticultural and agricultural estates is very much dependant on weather conditions and consumption by the science estate is driven by research demands.
Activities planned for the next year include the following.
• Improving water monitoring and targeting, incorporating it into the existing M&T system. This will enable smarter targeting of consumption at a building level, enabling quicker response times to rectify spurious or excessive consumption; and

Department for Environment, Food and Rural Affairs Annual Report and Accounts 2014–15 Annex 3 – Commentary on Sustainable Performance
152
• Continued estate rationalisation to deliver additional water savings.
Performance towards this target has improved significantly since last year. The main contributor to 2013–14’s poor performance was a major water leak at Kew Gardens, which has since been repaired.
The Departmental Network currently has an average performance of 5.5m3 of water per Full Time Equivalent (FTE) per annum within the office estate. An average of 6m3 or less per FTE per annum represents a ‘Good practice’ against the GGC benchmark.
There is no target for scope 1 water reduction.
Domestic Flights
Domestic Flights Reduction 2014–15 vs. Baseline
Target April 2015 Current Performance
2% increase 20% reduction Increase from baseline
In most cases, the Departmental Network’s domestic flights are between locations such as London and Scotland, Mainland UK and Belfast and Northeast and Southwest England. Flights are typically for policy and operational priorities. The Department introduced measures to improve its performance for example through increasing management challenge and scrutiny and introducing director level sign off for all flights.
Since the previous year’s report all flight data from each year of the GGC targets has been reviewed for accuracy which has resulted in a new dataset of domestic flights which is presented in this report.
Paper Use
Paper Use Reduction 2014–15 vs. Baseline
Target 2012 Current Performance
30% reduction 10% reduction Exceeding target
Current data confirms the Departmental Network is achieving a 30 percent reduction in the amount of paper purchased, exceeding the 10 percent target. This target expired in April 2012 and the Departmental Network achieved a 23 percent reduction. Monitoring continues in order to demonstrate commitment to this target.
Biodiversity
Defra is committed to making a positive contribution to the natural environment by supporting biodiversity enhancement and natural habitat protection on the network estate.
• Sites at Rhydymwyn, North Wales; Watchtree, Cumbria and Tow Law, County Durham are managed as nature reserves by local Wildlife Trusts. These sites provide an array of habitats and the enhancement of biodiversity forms a key part of their management.
• When undertaking any building and refurbishment work, biodiversity is considered in accordance with current building regulations and, where applicable, Building Research Establishment Environmental Assessment Method (BREEAM) requirements, to ensure that habitats are preserved and enhanced wherever it is appropriate to do so.
• There are a number of grounds maintenance and land management regimes at Defra properties which aim to enhance biodiversity including: reducing the frequency of mowing regimes and leaving grassland patches to grow wild, providing food and shelter for pollinators; and incorporating features such as bird and bat boxes, indigenous planting and maintenance and care of wild flower meadows/areas at our Sand Hutton and Alnwick sites.

Department for Environment, Food and Rural Affairs Annual Report and Accounts 2014–15 Annex 3 – Commentary on Sustainable Performance
153
• NE directly manages and maintains 143 National Nature Reserves (NNR) across England of which approximately 64,000 hectares are directly managed by NE. NE’s own annual report and account contains more information on NNR management.
Environmental Management System
A certified ISO14001:2004 Environmental Management System (EMS) covers the Core Department, APHA, Cefas, Fera, MMO and RPA. The EMS includes 36 sites that carry the most significant environmental risk across the portfolio. Achieving and retaining the standard recognises continuing commitment to reducing environmental impact, implementing sound environmental practice and ensuring environmental policy is taken into account when making decisions and delivering projects across the estate.
Sustainable Procurement
Defra Network Procurement will continue to promote sustainable procurement across its remit.
It engages and seeks to influence procurement practice on a number of key sustainability issues including consideration of the Public Sector Equality Duty (PSED), The Public Services (Social Value) Act and the Small and Medium Enterprise Agenda.
Government committed to an aspiration of awarding 25 percent of central government procurement spend to small and medium sized enterprises (SMEs), directly or via the supply chain, by May 2015. This aspiration was met in the 2013–14 financial year and information was published in February 201534.
Defra’s contribution to this achievement was that 21.7 percent of the Government’s total procurement expenditure was awarded to SMEs (either directly or via the supply chain).
A percentage of Defra’s expenditure is contracted through pan Government frameworks managed by the Crown Commercial Services. Defra works with the Crown Commercial Services to promote the use of sustainable procurement where possible within the constraints of these frameworks.
Green Information and Communications Technology (ICT)
Departmental Network Knowledge and Information Services are committed to the HMG Greening Government ICT Strategy and adopting green ICT best practice35.
In 2013–14, one year early, two key targets were met.
• Achieving Level 3 Green ICT Maturity in its ICT services.
• Achieving 10 of the 14 key target outcomes from deploying best practices in delivering those services.
Data for 2014–15 on these key targets was not available at the time of publication.
Work continues to reduce non-recyclable materials from disposal of ICT assets. IBM seek to reuse ICT across the Department, items that cannot be reused internally are donated to schools and Charities. In 2014–15, 97.9 percent of all unwanted items were reused (excluding EA).
The introduction, in 2013–14, of more efficient ICT equipment has resulted in a significant reduction in energy use for IBM delivered services. This has seen energy consumption per person fall from 1600 kWh in 2012–13 to 500 kWh per annum, in 2013–14.
34 https://www.gov.uk/government/publications/central-government-spend-with-smes-2013-to-2014 35 https://www.gov.uk/government/publications/greening-government-ict-strategy

Department for Environment, Food and Rural Affairs Annual Report and Accounts 2014–15 Annex 3 – Commentary on Sustainable Performance
154
ICT achievements in 2014–15 included the following.
• Reduction in the number of servers on the London estate from 24 to 5, and further rationalisation regionally.
• Installation of 10 portable video-conference units across key sites. A campaign to improve uptake of the service has shown the use double in only two months (January to March 2015).
• IBM were able to achieve a 60 percent reduction in power requirement by rationalising servers.
Early results from a campaign to increase the use of Webinars and Web conference tools now provided on Defra laptops has shown an increase doubling use of internal webinars in only three months (January to April 2015), reducing travel costs and travelling time for staff.
Transparency Reporting
In addition to the high level GGC targets, the Departmental Network also publishes a transparency statement as part of its commitment36. This covers climate change adaptation, biodiversity and natural environment, procurement of food and catering services, sustainable construction and people.
Further information
Quarterly updates on the Departmental Network’s performance towards the GGC can be found online37.
This report should be read in conjunction with the Annual Report and Account Sustainability Reports produced by each of the Departmental Network Bodies.
GGC reporting processes use the Department of Energy and Climate Change (DECC) reporting standards. All energy and carbon reporting in this document use the conversion factors described in this document.
36 https://whitehall-admin.production.alphagov.co.uk/government/uploads/system/uploads/attachment_data/file/139525/defra-ggc-performance.pdf
37 https://www.gov.uk/government/organisations/Department-for-environment-food-rural-affairs/about/our-energy-use

Department for Environment, Food and Rural Affairs Annual Report and Accounts 2014–15 Annex 3 – Commentary on Sustainable Performance
155
Sustainability Data – Table 1
Baseline 2011-12 2012-13 2013-14 2014-15Total energy consumption 292,168,310 243,656,417 264,937,353 263,559,507 231,813,923Total electricity 137,243,716 127,988,561 122,830,212 114,626,912 101,024,730Electricity: standard 32,111,236 15,448,287 14,173,807 11,105,976 11,399,995 Electricity: green 105,006,340 111,537,697 107,656,220 102,726,592 88,717,470 Electricity: Purchased CHP 126,140 1,002,577 1,000,185 794,344 907,265 Gas 115,674,941 83,640,166 93,426,642 104,085,078 106,837,214Oil 23,701,612 19,904,435 30,180,394 35,090,862 15,487,272 Biomass 2,604,841 565,512 3,043,271 1,600,098 2,682,458 CHP 10,727,109 10,472,205 14,336,557 6,566,350 4,580,520 Whitehall district heating system (WDHS)
343,300 - - - -
Self generated renewables 149,084 660,349 590,897 721,749 510,597 LPG 555,812 418,809 529,380 643,462 536,181 Other 1,167,895 6,380 - 224,996 154,951
Financial indicators (£000)
17,202 16,434 18,634 17,896 17,149
Baseline 2011-12 2012-13 2013-14 2014-158,454 6,670 6,807 5,712 5,798 1,063 114 356 116 93 2,947 1,867 2,748 2,292 2,616
n/a n/a n/a n/a n/an/a n/a n/a n/a 48
1,309 1,051 1,858 1,338 1,742 568 775 689 631 459
3,587 1,699 1,512 1,356 844 3,374 3,422 3,750 3,580 4,083
n/a n/a 611 918 892 n/a n/a 789 401 266 n/a n/a 87 70 229 n/a n/a n/a n/a n/an/a n/a 322 249 31
Baseline 2011-12 2012-13 2013-14 2014-15Total scope 2 water consumption 711,610 536,397 597,835 718,367 548,194 Supplied (office estate scope 2) 126,867 119,327 103,769 111,120 99,198 Supplied (non office estate scope 584,743 417,070 494,066 607,246 448,996 Abstracted (scope 1) n/a 37,961,172 15,984,722 21,584,846 n/a
Financial indicators (£000)
1,492 1,561 1,409 1,807 1,502
Baseline 2011-12 2012-13 2013-14 2014-1544,313 36,981 38,288 43,818 36,926 67,855 67,145 59,246 51,064 49,932 21,772 3,375 14,539 14,515 13,506
133,940 107,501 112,073 109,397 100,364 n/a 90,427 80,111 76,262 n/an/a 1,085 961 915 n/a51 10 n/a n/a n/a
23,359 23,660 29,698 30,535 25,328
Baseline 2011-12 2012-13 2013-14 2014-15
3,351 3,351 2,230 3,128 3,412
151,529 117,257 120,947 114,924 106,643
OTHER TARGET AREASNon financial indicators
Number of domestic flights
Paper use (reams)
GREEN HOUSE GAS EMISSIONSNon financial indicators (000 kgs CO2e)
Scope 3: emissions from official business travelTotal emissions
Financial indicators (£000)
Expenditure on accredited offsets (e.g. GCOF)Expenditure on official business travel
Total wasteHazardous waste
Financial indicators (£000)
Hazardous wasteReused, recycled, composted (combined)Incinerated with energy recoveryIncinerated without energy recovery
Scope 2: indirect emissions
Emissions eligible for CRC schemeCarbon Reduction Commitment (CRC)
Non financial indicators (kWh)
Energy consumption
Total energy costs
WASTE
Non financial indicators (000 kgs)
Water supply costs
Scope 1: direct emissions
Non financial indicators (m3)
Water Consumption
Landfill
WATER
RecycledReusedCompostedIncinerated with energy recoveryIncinerated without energy recoveryLandfillTotal disposal cost
ENERGY

Department for Environment, Food and Rural Affairs Annual Report and Accounts 2014–15 Annex 3 – Commentary on Sustainable Performance
156
Notes to Table 1
(i) Under GGC reporting, areas of a building occupied by non government occupants are not included. Where this is the case buildings have been apportioned according to floor space occupancies.
(ii) ‘Scope 3: Emissions from Official Business Travel’ data does not include international travel in accordance with the GGC reporting requirements.
(iii) The abstracted water figure for 2014–15 is not available at the time of publication.
(iv) Gas used in CHP units is not included in the ‘gas’ figure as GGC reporting guidance states that this energy is reported as CHP output.
(v) The first Carbon Reduction Commitment (CRC) payment was made for 2011–12. Payment for 2014–15 is not due to be made until September 2015.
(vi) All consumption data presented in this report reflects reported GGC figures. Cost figures reflect the accounting records for the respective year.
(vii) Data for waste component categories do not always equal the total waste figure. This is due to additional waste streams that are not required to be reported. Additionally, hazardous waste is included in the landfill waste figure as per GGC reporting.
(viii) Historically, a breakdown of waste costs was not available due to the contractual agreement in place at this time.
(ix) No further Government Carbon Offsetting Fund (GCOF) payments were made after 2011–12 due to budget constraints.
(x) Some previous years’ data has been revised from last year’s publication to incorporate any corrections and adjustments including a revision of electricity carbon conversion factors of the last 5 years. For this reason tables and performance may appear differently to previous year’s reports.
(xi) Some baseline data has been revised from previous publications to reflect the data reported for the purposes of GGC. This includes some data from various years where data from 2009–10 was not available. In such instances data from subsequent years was substituted as per the GGC guidance. For this reason performance may appear differently to previous year’s reports.
(xii) RBG Kew do not have a provision for capturing domestic travel data, however the emissions are understood to be not material.
(xiii) Composted and reused waste data was not available across the network as a separate stream to recycled waste prior to 2013–14. From 2013–14 some parts of the network provide separated compost and reused waste figures but these do not cover the entire Departmental Network.
(xiv) Emissions from electricity in 2012–13, 2013–14, 2014–15 and baseline are captured in both scope 2 and 3 as electricity generated and supplied to the national grid and due to losses in transmission and distribution of electricity through the national grid to the consumer, as defined by the GHG Protocol.
(xv) Travel data in 2011–12 was not separated into Scope 1, 2 and 3. All grey fleet transport for this period is therefore included in the Scope 1 total. This has the effect of showing a slight increase in Scope 1 emissions and a significant decrease in Scope 3 emissions compared to the baseline.

Department for Environment, Food and Rural Affairs Annual Report and Accounts 2014–15 Annex 3 – Commentary on Sustainable Performance
157
Section B Core Department Performance
Section B of this report assesses the sustainability performance of the Core Department (as a distinct entity) against its agreed sustainability targets.
The Core Department represents just 5 percent of the total Departmental Network Estate (by floor space).
The reporting scope for the Core Department is buildings, or parts of buildings occupied by Core Departmental staff.
The travel data also relates to only Core Department staff.
Targets
Reduction 2014–15 vs. Baseline
Target April 2015 Current Performance
GHG Reduction 39% reduction 25% Exceeding target Waste Reduction 32% reduction 25% Exceeding target Water Reduction 24% increase Reduce from
baseline Increase from baseline
Domestic Flights Reduction
9% reduction 20% Behind target
Paper Reduction 36% reduction 10% (2012 target) Continues to exceed target
More detail on the carbon figures can be found in Table 2.
Performance against the water target is not as strong as in previous years due to an increase in the occupation density of the Core Department’s main headquarters buildings, Nobel House, London and Kings Pool, York. Also, reducing the number of domestic flights remains a challenge and this is being investigated as part of a Departmental Network wide initiative.
The Departmental Networks’ sustainability strategies, which support its ‘One Business’ model, deliver improvements across all entities within the network. Highest priority is given to those areas where the most significant opportunity exists and benefit can therefore be delivered. The Core Department is a key component within these strategies.

Department for Environment, Food and Rural Affairs Annual Report and Accounts 2014–15 Annex 3 – Commentary on Sustainable Performance
158
Sustainability Data – Table 2
Baseline 2011–12 2012–13 2013–14 2014–15Total energy consumption 11,499,719 7,381,222 7,256,492 6,404,837 5,710,656 Total electricity 5,261,184 4,024,062 3,788,040 3,382,382 3,247,496 Electricity: standard 1,591,249 123,742 160,315 43,734 27 Electricity: green 3,669,921 3,896,609 3,617,245 3,338,539 3,247,468 Electricity: CHP 14 3,711 10,480 109 - Gas 4,899,283 3,026,221 3,370,778 2,850,819 2,417,272 Oil - - - 111,936 - Biomass 32,700 48,539 66,646 42,904 28,767 CHP 1,147,195 264,198 21,816 - - WDHS 132,926 - - - - Self generated renewables 26,431 18,202 9,212 16,796 17,122 LPG - - - - - Other - - - - - Total energy consumption (Normalised by m2)
235 218 207 295 248
815 529 561 582 593
0.017 0.016 0.016 0.027 0.026
Baseline 2011–12 2012–13 2013–14 2014–15338 461 358 239 229
2 3 - 1 0 247 403 300 198 182 69 28 25 27 30 7 1 - - -
13 26 33 13 17 0.007 0.014 0.010 0.011 0.010
Baseline 2011–12 2012–13 2013–14 2014–15Water consumption (Scope 2)
Total water consumption 14,261 22,209 9,254 14,040 18,130
Water consumption (Scope 2)
Total water consumption (Normalised by m2)
0.292 0.657 0.264 0.646 0.788
43 109 42 52 47
0.0009 0.0032 0.0012 0.0024 0.0020
Baseline 2011–12 2012–13 2013–14 2014–151,169 602 623 550 447 2,897 2,111 1,983 1,636 1,746 4,066 2,713 2,606 2,186 2,193 0.083 0.080 0.074 0.101 0.095
- 56 74 55 61 - 829 323 446 404 - 885 397 501 465
Financial indicator (£000)
- 1,541 1,866 2,787 1,858
Baseline 2011–12 2012–13 2013–14 2014–15
391 391 335 492 355
22,069 13,768 16,334 17,514 14,219
Non financial indicators (kWh)
Energy consumption
Total waste (Normalised by m2)
WATER
Water supply costs (Normalised by m2)
ENERGY
Total energy costs
WASTETotal wasteHazardous waste
Non financial
indicators
Number of domestic flights
Paper use (reams)
Water supply costs
GREEN HOUSE GAS EMISSIONS
Scope 2: indirect emissions from buildingsTotal building emissions
Scope 1: direct emissions from business travelTotal building emissions (Normalised by m2)
Financial indicators (£000)
Financial indicators (£000) Total energy costs (Normalised by m2)
Expenditure on official business travel
Reused, recycled, compostedNon financial indicators (000 kgs)
Incinerated with energy recovery
OTHER TARGET AREAS
Scope 3: emissions from official business travelTotal travel emissions
Incinerated without energy recoveryLandfill
Non financial indicators (m3)
Non financial indicators (000kg CO2e)
Scope 1: direct emissions from buildings

Department for Environment, Food and Rural Affairs Annual Report and Accounts 2014–15 Annex 3 – Commentary on Sustainable Performance
159
Notes to Table 2
(i) Occupancy does not include vacant areas of space.
(ii) Core Department’s occupancy is calculated on a floor space apportionment basis.
(iii) Water consumption at Nobel House has been incorrectly billed in 2009–10 and 2010–11. It was subsequently reconciled in 2011–12. This is responsible for most of the increase seen in the 2011–12 figures.
(iv) Travel emissions data for Core Department is not available prior to 2011–12. Travel data does not include international travel in accordance with GGC guidance.
(v) Waste costs for Core Department cannot be extrapolated from the figure for the estate’s single waste contract.
(vi) Paper data for quarter 4 2011–12 was not available and so an estimate has been made using the average Quarters 1, 2 and 3 of 2012–13.
(vii) ‘Normalised by m2’ refers to data that has been divided by the number of metres squared of office space the Core Department occupied during that year. Due to the availability of data differing from site to site this doesn’t always generate meaningful comparisons.
(viii) FTE data for Core Department only is not available at a building level. Due to the shared occupancy of most of our buildings this means normalising data by FTE is not possible.


����������������������������������������������������������